Embed Size (px)
Citation preview

Towards the Clinical Implementation of Online Adaptive Radiation Therapy
for Prostate Cancer
by
Taoran Li
Medical Physics Graduate Program Duke University
Date:_______________________ Approved:
___________________________
Q. Jackie Wu, Supervisor
___________________________ Qiuwen Wu
___________________________
William Robert Lee
___________________________ Timothy G Turkington
Dissertation submitted in partial fulfillment of the requirements for the degree of Doctor of Philosophy
in the Graduate Program in Medical Physics in the Graduate School of Duke University
2013

ABSTRACT
Towards the Clinical Implementation of Online Adaptive Radiation Therapy
for Prostate Cancer
by
Taoran Li
Medical Physics Graduate Program Duke University
Date:_______________________ Approved:
___________________________
Q. Jackie Wu, Supervisor
___________________________ Qiuwen Wu
___________________________
William Robert Lee
___________________________ Timothy G Turkington
An abstract of a dissertation submitted in partial fulfillment of the requirements for the degree of Doctor of Philosophy
in the Graduate Program in Medical Physics in the Graduate School of Duke University
2013

Copyright by Taoran Li
2013

iv
Abstract The online adaptive radiation therapy for prostate cancer based on re-
optimization has been shown to provide better daily target coverage through the
treatment course, especially in treatment sessions with large anatomical deformation.
However, the clinical implementation of such technique is still limited primarily due to
two major challenges: the low efficiency of re-optimization and the lack of online quality
assurance technique to verify delivery accuracy. This project aims at developing new
techniques and understandings to address these two challenges.
The study was based on retrospective study on patient data following IRB-
approved protocol, including both planning Computer Tomography (CT) and daily
Cone-Beam Computer Tomography (CBCT) images. The project is divided in to three
parts. The first two parts address primarily the efficiency challenge; and the third part of
this project aims at validating the deliverability of the online re-optimized plans and
developing an online delivery monitoring system.
I. Overall implementation scheme. In this part, an evidence-based scheme,
named Adaptive Image-Guided Radiation Therapy (AIGRT), was developed to integrate
the re-optimization technique with the current IGRT technique. The AIGRT process first
searches for a best plan for the daily target from a plan pool, which consists the original
CT plan and all previous re-optimized plans. If successful, the selected plan is used for

v
the daily treatment with translational shifts. Otherwise, the AIGRT invokes re-
optimization process of the CT plan for the anatomy-of-the-day, which is added to the
plan pool afterwards as a candidate plan for future fractions. The AIGRT scheme is
evaluated by comparisons with daily re-optimization and online repositioning
techniques based on daily target coverage, Organ-at-Risk (OAR) sparing and
implementation efficiency. Simulated treatment courses for 18 patients with re-
optimization alone, re-positioning alone and AIGRT shows that AIGRT offers reliable
daily target coverage that is highly comparable to re-optimization everyday and
significantly improves compared to re-positioning. AIGRT is also seen to provide
improved organs-at-risk (OARs) sparing compared to re-positioning. Apart from
dosimetric benefits, AIGRT in addition offers an efficient scheme to integrate re-
optimization to current re-positioning-based IGRT workflow.
II. Strategies for automatic re-optimization. This part aims at improving the
efficiency of re-optimization through automation and strategic selections of optimization
parameters. It investigates the strategies for performing fast (~2 min) automatic online
re-optimization with a clinical treatment planning system; and explores the performance
with different input parameters settings: the DVH objective settings, starting stage and
iteration number (in the context of real time planning). Simulated treatments of 10
patients were re-optimized daily for the first week of treatment (5 fractions) using 12
different combinations of optimization strategies. Options for objective settings included

vi
guideline-based RTOG objectives, patient-specific objectives based on anatomy on the
planning CT, and daily-CBCT anatomy-based objectives adapted from planning CT
objectives. Options for starting stages involved starting re-optimization with and
without the original plan’s fluence map. Options for iteration numbers were 50 and 100.
The adapted plans were then analysed by statistical modelling, and compared both in
terms of dosimetry and delivery efficiency. The results show that all fast online re-
optimized plans provide consistent coverage and conformity to the daily target. For
OAR sparing however, different planning parameters led to different optimization
results. The 3 input parameters, i.e. DVH objectives, starting stages and iteration
numbers, contributed to the outcome of optimization nearly independently. Patient-
specific objectives generally provided better OAR sparing compared to guideline-based
objectives. The benefit in high-dose sparing from incorporating daily anatomy into
objective settings was positively correlated with the relative change in OAR volumes
from planning CT to daily CBCT. The use of the original plan fluence map as the starting
stage reduced OAR dose at the mid-dose region, but increased 17% more monitor units.
Only < 2cc differences in OAR V50% / V70Gy / V76Gy were observed between 100 and
50 iterations. Based on these results, it is feasible to perform automatic online re-
optimization in ~2 min using a clinical treatment planning system. Selecting optimal sets
of input parameters is the key to achieving high quality re-optimized plans, and should

vii
be based on the individual patient’s daily anatomy, delivery efficiency and time allowed
for plan adaptation.
III. Delivery accuracy evaluation and monitoring. This part of the project aims
at validating the deliverability of the online re-optimized plans and developing an
online delivery monitoring system. This system is based on input from Dynamic
Machine Information (DMI), which continuously reports actual multi-leaf collimator
(MLC) positions and machine monitor units (MUs) at 50ms intervals. Based on these
DMI inputs, the QA system performed three levels of monitoring/verification on the
plan delivery process: (1) Following each input, actual and expected fluence maps
delivered up to the current MLC position were dynamically updated using
corresponding MLC positions in the DMI. The difference between actual and expected
fluence maps creates a fluence error map (FEM), which is used to assess the delivery
accuracy. (2) At each control point, actual MLC positions were verified against the
treatment plan for potential errors in data transfer between the treatment planning
system (TPS) and the MLC controller. (3) After treatment, delivered dose was
reconstructed in the treatment planning system based on DMI data during delivery, and
compared to planned dose. FEMs from 210 prostate IMRT beams were evaluated for
error magnitude and patterns. In addition, systematic MLC errors of ±0.5 and ±1 mm for
both banks were simulated to understand error patterns in resulted FEMs. Applying
clinical IMRT QA standard to the online re-optimized plans suggests the deliverability

viii
of online re-optimized plans are similar to regular IMRT plans. Applying the proposed
QA system to online re-optimized plans also reveals excellent delivery accuracy: over
99% leaf position differences are < 0.5 mm, and the majority of pixels in FEMs are < 0.5
MU with errors exceeding 0.5 MU primarily located on the edge of the fields. All clinical
FEMs observed in this study have positive errors on the left edges, and negative errors
on the right. Analysis on a typical FEM reveals positive correlation between the
magnitude of fluence errors and the corresponding leaf speed. FEMs of simulated
erroneous delivery exhibit distinct patterns for different MLC error magnitudes and
directions, indicating the proposed QA system is highly specific in detecting the source
of errors. Based on these results, it can be concluded that the proposed online delivery
monitoring system is very sensitive to leaf position errors, highly specific of the error
types, and therefore meets the purpose for online delivery accuracy verification. Post-
treatment dosimetric verification shows minimal difference between planned and actual
delivered DVH, further confirming that the online re-optimized plans can be accurately
delivered.
In summary, this project addressed two most important challenges for clinical
implementation of online ART, efficiency and quality assurance, through innovative
system design, technique development and validation with clinical data. The efficiencies
of the overall treatment scheme and the re-optimization process have been improved

ix
significantly; and the proposed online quality assurance system is found to be effective
in catching and differentiating leaf motion errors.

x
To
My Son Zichen
Who Has Been the Sweetest Distraction During My Writing

xi
Contents
Abstract ......................................................................................................................................... iv
List of Tables ................................................................................................................................ xv
List of Figures .............................................................................................................................xvi
List of Abbreviations ................................................................................................................. xxi
Acknowledgements ................................................................................................................ xxiv
1. Backgrounds .............................................................................................................................. 1
1.1 The Rational Of Adaptive Radiation Therapy ............................................................. 1
1.2 Components of ART ......................................................................................................... 5
1.2.1 Image Guidance ........................................................................................................... 6
1.2.1.1 Daily Image Acquisition ..................................................................................... 6
1.2.1.2 Image Registration Techniques .......................................................................... 7
1.2.1.3 Functional Imaging .............................................................................................. 9
1.2.2 Treatment Adaptation .............................................................................................. 11
1.2.2.1 Online Repositioning ......................................................................................... 11
1.2.2.2 Off-line Re-planning .......................................................................................... 13
1.2.2.3 Online Re-optimization ..................................................................................... 15
1.2.2.4 Hybrid Strategies for plan adaptation ............................................................ 17
1.2.3 Delivery Verification ................................................................................................. 18
1.2.3.1 Daily Dose Verification ..................................................................................... 18
1.2.3.2 Cumulative Dose Analysis ............................................................................... 19

xii
1.3 Current Clinical Applications of ART for Prostate Cancer ...................................... 20
1.4 Challenges and Limitations .......................................................................................... 21
1.4.1 CBCT Image Quality and CT-Number Consistency ............................................ 22
1.4.2 Clinical Resource Management ............................................................................... 22
1.4.3 System Integration .................................................................................................... 23
2. Project focus and the overall structure ................................................................................. 25
3. Developing an overall scheme for online ART system combining re-positioning and re-optimization ............................................................................................................................ 27
3.1 Introduction ..................................................................................................................... 27
3.2 Methods and Materials .................................................................................................. 29
3.2.1 The Original CT plan ................................................................................................ 29
3.2.2 Daily treatment simulation ...................................................................................... 30
3.2.3 Three simulated treatment arms ............................................................................. 31
3.2.4 Treatment plan comparison ..................................................................................... 35
3.3 Results and Discussion .................................................................................................. 37
3.3.1 CTV coverage ............................................................................................................. 37
3.3.2 OAR sparing ............................................................................................................... 43
3.3.3 The efficiency of AIGRT ............................................................................................ 49
3.3.4 Further Discussions ................................................................................................... 52
3.4 Conclusion ....................................................................................................................... 55
4. Strategies for automatic online treatment plan re-optimization using clinical treatment planning system: a planning parameters study ..................................................................... 56
4.1 Introduction ..................................................................................................................... 56
xiii
4.2 Materials and methods .................................................................................................. 60
4.2.1 Materials ..................................................................................................................... 60
4.2.2 Re-optimization strategies........................................................................................ 60
4.2.2.1 Objective setting ................................................................................................. 61
4.2.2.2 Starting stages ..................................................................................................... 63
4.2.2.3 Iteration numbers ............................................................................................... 64
4.2.3 Dosimetric evaluation and statistical analysis ...................................................... 65
4.2.4 Delivery efficiency analysis ..................................................................................... 67
4.3 Results and discussions ................................................................................................. 67
4.3.1 Incorporating daily anatomy information into the Deformed-CT objectives ... 67
4.3.2 Daily target coverage ................................................................................................ 68
4.3.3 Effect of three optimization factors on dosimetric parameters ........................... 69
4.3.4 Optimal dosimetric options per input factor ......................................................... 73
4.3.5 Objective selection based on daily organ volume variations .............................. 76
4.3.6 Delivery efficiency comparison ............................................................................... 82
4.3.7 Discussion ................................................................................................................... 83
5. Validation and delivery verifications of online re-optimized treatment plans .............. 91
5.1 Introduction ..................................................................................................................... 91
5.2 Methods and Materials .................................................................................................. 96
5.2.1 Pre-clinical validation of the overall delivery accuracy of online automatically re-optimized plans. ............................................................................................................ 96
5.2.2 Online delivery monitoring and offline dosimetric verification using Dynamic Machine Information (DMI) ............................................................................................. 97

xiv
5.3 Results and Discussion ................................................................................................ 104
5.3.1 Portal dosimetry results of online adapted, original and regular IMRT plans ............................................................................................................................................. 104
5.3.2 Online fluence error monitoring ........................................................................... 106
5.3.3 Online leaf position error monitoring .................................................................. 109
5.3.4 Off-line dosimetric verification of delivered treatment plans .......................... 112
5.3.5 Monitoring and verification results with manually introduced MLC errors . 116
5.3.6 Understanding the fluence error pattern. ............................................................ 121
5.3.7 Limitations and further discussions ..................................................................... 125
5.4 Conclusion ..................................................................................................................... 128
6. Summary ................................................................................................................................ 130
References .................................................................................................................................. 133
Biography ................................................................................................................................... 146

xv
List of Tables Table 1 Number of plans with D99% < 98% prescription dose of CTV and seminal vesicles (SV). ................................................................................................................................ 41
Table 2: OAR sparing. Mean values and ranges are shown for daily V100%, V65% of bladder and rectum and relative/absolute V70Gy for rectum, for all 180 plans generated by three techniques: Re-Plan, Soft-Plan and AIGRT. Highest values in average and upper range among three techniques are highlighted in bold red. ................................................. 45
Table 3: Global fitting and F-test results for each evaluation variables on the whole 3-way factorial model. ................................................................................................................... 70
Table 4: Effect tests result for all three optimization parameters, including stand-alone and interactions of objective, starting stage and iteration. The cells in the table are progressively shaded according to their statistical significance, i.e. the p-values. From top to bottom: individual factor (main effect), two-way interaction, and three-way interaction. Lighter-than-medium shade corresponds to p<0.05, indicating the effect of a certain term in the 3-way factorial ANOVA model is significant. ....................................... 71
Table 5: Summary of comparison within the three factors of the models (objectives, starting stage and iteration). Numbers shown are the means of each group. Only parameters with a >2%/2cc difference is shown in bold and shaded. Shading corresponds to the ranking of group means: light-to-dark indicating low-to-high in mean values. ................................................................................................................................ 76

xvi
List of Figures Figure 1: Demonstration of intensity-modulated radiation therapy (IMRT). In this example, 7 beams with different shape and non-uniform intensity converges at the target area. The 2D intensity-modulated photon fluence accumulates to provide a conformal dose distribution around the target region, as the color wash indicating the dose range from high to low. ...................................................................................................... 2
Figure 2: Timeline for a typical IMRT treatment. ..................................................................... 3
Figure 3: Snapshots of the pelvic anatomy in 11 days from CT simulation to the first 10 fractions of treatment. CTV, the bladder and the rectum are contoured in black, green and red color, respectively. .......................................................................................................... 4
Figure 4: Components in adaptive radiation therapy system. ............................................... 5
Figure 5: Concept and weakness of online re-positioning. This correction method is very efficient, but may not be able to correct large organ motion/deformations. ...................... 13
Figure 6: General concept of offline re-planning method. It improves over daily re-positioning by generating a new plan based on first several fractions’ target motion. The downside of this method is that the irradiating volume (blue dashed line) are often larger than daily target, which can increase the dose to adjacent OARs. ........................... 15
Figure 7: General concept of online re-optimization. It generates a new plan tailored specifically for the daily anatomy. However, such method requires substantially added cost to the clinical flow. .............................................................................................................. 17
Figure 8: The scheme of the AIGRT technique. ...................................................................... 33
Figure 9: Mean DVHs and standard deviation of CTV (a) and SV (b) of all 180 plans. Red bar, blue bar with arrow and green bar with flat cap show the standard deviation of Soft-Plan, Re-Plan and AIGRT DVHs, respectively. .............................................................. 38
Figure 10: D99% of CTV (a) and SV (b) plotted for 18 patients. Markers show the mean value of D99s of all fractions for each patient; bars show the range of D99% for each individual patient........................................................................................................................ 40
Figure 11: Plan comparison between Soft-Plan, AIGRT and Re-Plan for OARs sparing in an example case where daily CTV is significantly deformed compared to that in Original
xvii
CT plan. Soft-Plan plan is generated by shifting the Original CT plan to match soft tissues in daily CBCT image. AIGRT plan is selected by our algorithm from previous plan library. Re-Plan plan is generated by complete re-optimization based on CBCT image. Isodose lines on Soft-Plan, Re-Plan and AIGRT are calculated for each plan using same CBCT image set. ................................................................................................................ 43
Figure 12: Mean DVHs and standard deviation of the bladder (a) and the rectum (b) of all 180 plans. Red bar, blue bar with arrow and green bar with flat cap show the standard deviation of Soft-Plan, Re-Plan and AIGRT DVHs, respectively. ....................... 44
Figure 13: Histograms of the variations from the most-conformal Re-Plan for (a) Bladder V100%, (b) Rectum V100%, (c) Bladder V65%, (d) Rectum 65%, (e) Rectum V70Gy in absolute volume cc, and (f) Rectum V70Gy in % volume. Green dotted bar: AIGRT; red shaded bar: Soft-Plan. For each labeled value on the horizontal axis, the corresponding bin extends to ±2.5% or ±2.5 cc from that value. ..................................................................... 47
Figure 14: (a) One example case showing false OAR sparing associated with CTV underdose (D99% = 92% Rx) in Soft-Plan. AIGRT and Re-Plan DVHs are close to each other for both CTV and OARs. (b) The representative of majority plans: AIGRT provides CTV coverage very close to Re-Plan, yet still spares bladder and rectum more than Soft-Plan................................................................................................................................................ 49
Figure 15: Frequency reduction on re-planning with AIGRT. Total length of red and blue bars shows the frequency of plan adaptation for each patient. Blue bars show the actual frequency of re-planning in a treatment course, and red bars show the reduction on re-planning frequency due to the re-use of previous daily plans in the AIGRT technique. For patient # 4 and # 9, Original CT plan is capable to provide satisfactory coverage over all fractions, so no plan adaptation is needed. ........................................................................ 51
Figure 16: Percentage of patients treated with same-day re-optimized plan for a particular fraction number from 1 to 10. ................................................................................. 52
Figure 17: Flowchart of how three sets of objectives are generated based on increasing level of customization. ................................................................................................................ 62
Figure 18: Illustration of the daily goal dose generated via deformable registration. Left column shows the original plan dose on planning CT structures. Middle column shows the dose distribution of original plan on the daily anatomy with rigid registration. Right column shows the original dose propagated to the daily anatomy via deformable

xviii
registration. White arrows point out that the deformed dose conforms to the daily target very well. Contours: white-PTV, green-bladder, yellow-rectum. ........................................ 68
Figure 19: Histogram of daily CTV D99% (minimal dose to the hottest 99% of the CTV) of all 600 re-optimized plans created in this study. ............................................................... 69
Figure 20: Comparison of boxplots, mean diamonds and histograms of (a) three objectives for different dosimetric parameters. C: CT objectives, D: Deformed-CT objectives, R: RTOG objectives; (b) two starting stages for different dosimetric parameters. W: starting with original intensity map; WO: starting without original intensity map, from unity fluence; and (c) two iteration numbers, 50 and 100, for different dosimetric parameters Green diamonds indicate one-way ANOVA result: if two diamonds does not overlap vertically, then the two groups are significantly different from each other, and vice versa. ............................................................................... 72
Figure 21: Regression analyses on the volume difference between using objectives C and D and the corresponding daily-to-planning-CT OAR volume change. Horizontal axis shows the OAR volume change in natural log scale. Vertical axis shows the difference between C and D in cc: positive value indicates D is better for a particular plan, and negative indicates C is better. Dashed lines are 95% confidence limit of individual predicted values by the fit. ........................................................................................................ 78
Figure 22 Organ volume variation for all 10 patients and 5 fractions each. Grey “+” shows the corresponding volume in the planning CT. ......................................................... 80
Figure 23 Dose comparison between automatically re-optimized plans using CT objectives (left, square) and Deformed-CT objectives (right, triangle). Deformed-CT objectives carry the information of significantly enlarged rectum to the optimizer, and therefore achieved better rectum sparing compared to the CT objectives. This is evident in both DVH and isodose comparisons (white arrows). ....................................................... 81
Figure 24: Comparison of boxplots, mean diamonds and histograms for delivery efficiency in total MU. ................................................................................................................ 82
Figure 25 Illustration of the trade-offs of using CT objectives on a fraction with significantly shrunk bladder but similar rectum. Black arrows show the direction of DVH changing from CT to Deformed-CT objectives. ............................................................ 88
xix
Figure 26: Illustration of the gamma value at different dose profile points. 3%/3mm specifies the tolerance on DD and DTA, respectively. This tolerance can be manually chosen, but commonly 3%/3mm or 4%/4mm. ........................................................................ 93
Figure 27: Flowchart of the QA system including 3 levels of monitoring/verification. Level 1 and 2 are performed in near real-time every 50ms. .................................................. 98
Figure 28: Graphical Interface of the QA system. All graphs are updated in near real-time. (a) Left: delivered fluence up to current DMI snapshot; (a) Right: fluence error map (FEM) with bi-color-labeled pixels whose fluence error exceeding user-specified threshold (±0.5 MU used here, red indicates at least 0.5 MU hotter, blue indicates at least 0.5 MU colder, compared to expected fluence); (b) magnitude and frequency of fluence errors; (c) magnitude and frequency of leaf position error at control points. .................. 101
Figure 29: Per-beam portal dosimetry passing rates distribution of three types of treatment plans: Adapted plans using automatic online re-optimization, Original CT plans, and Regular IMRT plans aside from the original CT plans..................................... 104
Figure 30: Comparison of IMRT QA pass rates of online adapted plans across 5 patients in this study. Both box-plots and histograms are shown. ................................................... 105
Figure 31: Fluence error maps (FEMs) between expected and actual fluence generated by online fluence monitoring module. ........................................................................................ 107
Figure 32: Histogram showing the distribution of percentage pixel failure rate using per-beam fluence monitoring and a failing threshold of ± 0.5 MU. .......................................... 108
Figure 33: Illustration of the leaf position value signs for both leaf banks. The leading leaf, or Bank A, extends to the left and retracts to the right. The trailing leaf, or Bank B, extends to the right and retracts to the left. For either bank, extending beyond mid-line yields a negative value, and retracting pass mid-line yields a positive value. ................ 110
Figure 34: Boxplot of difference between actual leaf positions and the positions specified by control points in the TPS. Horizontal axis shows the leaf pair number. All 210 treatment fields are included in this plot. .............................................................................. 111
Figure 35: Differences in DVH of primary structures-of-interest between reconstructed dose from Dynalog record and planned dose using Eclipse™. ......................................... 114
Figure 36: Example case showing the typical difference in PTV DVH between planned dose and delivered dose reconstructed based on Dynalog. ............................................... 115

xx
Figure 37: Variation of PTV DVHs caused by introduced errors to the MLC positions during delivery. The DVHs are labeled as: error type: leading bank error in mm, trailing bank error in mm. ..................................................................................................................... 117
Figure 38: Variation of bladder DVH (top) and rectum DVH (bottom) caused by introduced errors to the MLC position. The DVHs are labeled as: error type: leading bank error in mm, trailing bank error in mm. ...................................................................... 118
Figure 39: Fluence error maps generated by online monitoring module for both error-free delivery (center) and deliveries with introduced systematic errors. Red indicates the pixel fluence at least 0.5 MU hotter than expected; and blue indicate at least 0.5 MU colder. The numbers at the lower left corner of each fluence error map show the percentage of pixels with error larger than 0.5 MU. Notice the distinct error patterns and percentage for each error introduced. .................................................................................... 120
Figure 40: Example of a fluence error map generated by the online monitoring module. Notice the typical hotter left edge and colder right edge that is generally observed for most fluence maps tested. ........................................................................................................ 121
Figure 41: Fluence error magnitude at each control point. Negative values indicate the actual leaf position is behind the expected position at the corresponding control point. ..................................................................................................................................................... 123
Figure 42: MLC positions and fluence error maps at selected control points (CPs) for an example case. The fluence error map threshold is set to a low value of 0.1 MU for better illustration. ................................................................................................................................. 124
Figure 43: Leaf speed at each control points calculated from the treatment plan for an example case. ............................................................................................................................. 125

xxi
List of Abbreviations AIGRT Adaptive Image-Guided Radiation Therapy
ANOVA Analysis of Variance
ART Adaptive Radiation Therapy
CBCT Cone-Beam Computed Tomography
CT Computed Tomography
CT-Sim CT Simulation
CTV Clinical Target Volume
CU Calibration Unit
DCE-MRI Dynamic Contrast-Enhanced Magnetic Resonance Imaging
DD Dose Difference
DMI Dynamic Machine Information
DTA Distance-to-Agreement
DVH Dose-Volume Histogram
Dxx% Minimaum dose to the hottest xx% of a structure
EBRT External Beam Radiation Therapy
EPID Electronic Portal Imaging Device
gEUD Generalized Equivalent Uniform Dose
GPU Graphic Processing Unit

xxii
ICRU International Commission on Radiation Units and Measurements
IGRT Image-Guided Radiation Therapy
IMRT Intensity Modulated Radiation Therapy
IRB Institutional Review Board
kV Kilo-voltage
MLC Multi-Leaf Collimator
MU Monitor Unit
MV Mega-voltage
OAR Organ-at-Risk
PET Positron Emission Tomography
PTV Planning Target Volume
QA
RTOG
Quality Assurance
Radiation Therapy Oncology Group
SAM Segment Aperture Morphing
SPECT Single Photon Emission Computed Tomography
SV Seminal Vesicle
SWO Segment Weight Optimization
TPS Treatment Planning System
VMAT Volumetric Modulated Arc Therapy

xxiii
Vxx% Volume that receives at least xx% of the prescription dose

xxiv
Acknowledgements I would like to firstly thank my committee members for their guidance and help
during the project. In particular, I would like to thank my advisor Dr. Jackie Wu, who
has provided me with tremendous amount of mentoring, help and support throughout
this project. Thank you for taking time from your already busy schedule to discuss with
me whenever I have difficulties not only in the project, but also in other aspects of life in
graduate school. I was very fortunate to have had this mentorship, trust and support
from such a brilliant scientist. Dr. Fang-Fang Yin has also been very generous with help
for this project. He has provided with much needed support in department resources
and training opportunities, as well as many insightful discussions and ideas. Dr.
Qiuwen Wu has been very helpful in the design, implementation and analyses phases of
multiple studies in this project. His kindness, wisdom and knowledge helped me to
develop a much clearer vision of both the directions and many details of the project. I
would also like to thank Dr. William Robert Lee for his insightful suggestions and
comments from a Radiation Oncologist’s perspective that greatly helped this project to
better focus on clinical challenges and practicality. I am also very grateful for Dr. Tim
Turkington’s involvement during the progress of this project. He has provided me with
solid training and nuclear medicine theory and practicum for my minor specialty, and
has been very flexible and generous to devoting his time both for this project and to help

xxv
me as the Director of Graduate Studies. My thanks also go to Dr. Danthai Thongphiew,
Dr. Xiaofeng Zhu for their patient help when I first started this project; to You Zhang
and Dr. Lulin Yuan for their kind help in both technical aspects and as a friend; to Irina
Vergalasova for her help in the statistical analysis in the second part of the project; and
to Anna Rodrigues, Dr. Jing Cai and Dr. Lei Ren for their helpful discussions.
Additionally, to Irina, Ross, Anna, You, Susu and Yun. I am fortunate to have
developed so many wonderful friendships here at Duke. Thank you for all the
encouraging, understanding, joking, ranting and sharing that made me want to come to
work every day.
Lastly, I would like to thank my wife Zhen, who has been extremely
understanding and supportive for my work. Thank you for being here with me, cheering
me up whenever I feel down, and being an incredible mother taking care of our baby
during the dissertation writing process. In addition, my Mom and Dad in China have
provided me with endless love and tremendous support. To them I owe my life and all
my achievements.
The research was partially supported by a master research grant from Varian
Medical Systems. Dr. James III Dobbins, Dr. Olga Baranova and Katherine Hand from
the Duke Medical Physics Graduate Programs are also very supportive throughout my
time here as a graduate student.

1
1. Backgrounds
1.1 The Rational Of Adaptive Radiation Therapy
External-Beam Radiation Therapy (EBRT) is among the most commonly used
techniques in cancer radiotherapy. In EBRT the radiation is delivered to the tumor
region, i.e. target volume, from outside the patient’s body by using several radiation
beams from different directions. This configuration is similar to the “cross-firing”
concept as all radiation beams are focused on the target. Thus the radiation dose from all
beams accumulates inside the body to form a three-dimensional dose distribution, with
high dose only covering the entire target volume and reduced dose to the surrounding
normal tissues/organs, i.e. organs-at-risk (OARs). The latest technology, intensity
modulated radiation therapy (IMRT), further improves the OAR sparing via non-
uniform beam delivery. An example of IMRT is shown in Figure 1.

2
Figure 1: Demonstration of intensity-modulated radiation therapy (IMRT). In
this example, 7 beams with different shape and non-uniform intensity converges at the target area. The 2D intensity-modulated photon fluence accumulates to provide a conformal dose distribution around the target region, as the color wash indicating the
dose range from high to low.
Such radiation treatment (RT) design is based on the 3-dimensional volumetric
images such as computer tomography (CT), magnet resonance image (MRI) to capture
the anatomical information about the patient and geometrical relationships of the tumor
and OARs; and the functional and molecular images such as positron emission
tomography (PET) and single photon emission computed tomography (SPECT) to
capture features about the tumor extent and staging. The typical timeline for
conventional IMRT treatment process is illustrated in Figure 2. Once IMRT has been
Beam 4 Beam 5
Beam 1 Beam 2
Beam 6
Beam 7
Beam 3

3
selected to be the treatment technique, a team of radiation oncologist, physicist and
dosimetrist work together to design an individualized treatment plan for each patient.
This treatment plan is designed based on a snapshot of the patient anatomy during
planning CT acquisition, and is then delivered over a course of 30-40 daily treatment
sessions, which are commonly referred as fractions.
Figure 2: Timeline for a typical IMRT treatment.
During the actual daily treatment, the radiation is delivered according to the
treatment plan by assuming the daily anatomy remains the same as in initial planning
stage. In reality, this assumption may not always be valid due to the daily change in the
anatomy, the target shape and position in particular, and therefore may lead to
mismatch between delivered dose distribution and the “anatomy-of-the-day” scenario.
Such mismatch could result in underdosing the target and/or overdosing the healthy

4
tissues/organs, which may translate into compromised tumor control and/or increased
side effects.
Figure 3: Snapshots of the pelvic anatomy in 11 days from CT simulation to the
first 10 fractions of treatment. CTV, the bladder and the rectum are contoured in black, green and red color, respectively.
In general clinical practice, the risk of underdosing daily target is addressed by
adding a margin around the true target during treatment planning (ICRU-50, 1993), and
designing the dose distribution to conform to the expanded target, termed as planning
target volume (PTV). This technique leaves some “headroom” for anatomy variations
and patient setup errors, but at the cost of increasing dose to the surrounding normal
tissue/organs. The IMRT significantly reduces the excessive dose outside the target by
providing more conformal dose distribution to the target. Thus, the concern of
underdosing target due to anatomy change is of greater importance with IMRT, since
higher dose gradient means less tolerance and consequently higher probability of
inadequate daily target coverage.

5
The Adaptive Radiation Therapy (ART) approaches this issue by changing the
fundamental assumption of stationary anatomy in traditional EBRT to variable anatomy,
and integrates this concept through the entire treatment course. The principle of ART is
to capture the anatomical change, to modify the treatment plan accordingly, and to
ensure the optimal target coverage and OAR sparing in both planning and daily
treatment.
1.2 Components of ART
The implementation of the ART principle is built upon technical components in
three main areas: image guidance, dose verification and plan adaptation.
Figure 4: Components in adaptive radiation therapy system.

6
1.2.1 Image Guidance
ART is the advanced stage of image-guided radiation therapy (IGRT). The role of
imaging has become increasingly important in nearly every aspect of radiation therapy,
from staging, structure contouring, treatment planning, treatment delivery verification
to treatment response and assessment (Yoo et al., 2010). In the field of ART, image
guidance provides the input information of daily anatomy, enables the visualization of
the anatomy-of-the-day, and determines how different the anatomy is from the plan.
Image guidance in ART commonly includes two steps: volumetric image acquisition and
image registration.
1.2.1.1 Daily Image Acquisition
Daily image acquisition techniques for adaptive radiation therapy have been
reported by various groups Court et al.(Court et al., 2003; Court and Dong, 2003; Court et
al., 2005b; Court et al., 2006; Kuriyama et al., 2003) reported using CT-on-rails as an in-
room daily image acquisition technique for adaptive radiation therapy. By installing a
diagnostic quality helical CT scanner that shares the couch with the linear accelerator
(linac) on-rails in the treatment room, high quality CT image can be obtained before
treatment while keeping patients in the same relative position to the treatment couch.
Soon after that, the Cone-Beam CT (CBCT) system integrated to the gantry of the
medical linear accelerator (Linac) has also been reported as a component in adaptive
radiation therapy (Wu et al., 2008; Lei and Wu, 2010; de la Zerda et al., 2007; Jaffray et al.,

7
2002). The CBCT for ART enables the patient to be imaged and treated at the same
position, which minimizes the uncertainty associated with imaging procedure.
Integrated CBCT eliminates the need to rotate the patient and move CT scanner between
imaging and treatment, and is therefore more convenient. However, the image quality of
current CBCT is generally inferior to helical CT in soft-tissue contrast, CT number
consistency and artifacts. Alternatively, the megavoltage CT (MVCT) capability of the
Tomotherapy (TomoTherapy, Inc. Madison, WI) treatment unit has also been reported
for daily image acquisition and target localization (Langen et al., 2005). The
Tomotherapy unit uses the same MV x-ray source mounted in a CT-like gantry for
treatment and imaging. It rotates helically around the patient to perform both the
imaging and the therapy process (Ruchala et al., 1999).
1.2.1.2 Image Registration Techniques
Image registration is used to determine the difference between planning
anatomy and the daily anatomy. It can be categorized into two groups: rigid registration
and non-rigid/deformable registration.
Rigid registration matches the daily images to the planning CT via translational
(3D) or translational + rotational (6D) transformation, which can then be used to re-
position the patient for target alignment. Rigid registration technique offers fast and
robust performance in daily-to-planning target alignment, and is therefore widely
adopted currently in the clinical practice of IGRT. However, at the presence of

8
target/organ deformation or tumor shrinkage, rigid registration may not be sufficient to
provide the information on the shape and volume variations (Wu et al., 2008).
Deformable registration techniques, on the other hand, allow the voxel-to-voxel
mapping between the daily and the planning image sets. Yan et al.(Yan et al., 1999)
reported a deformable registration method using biomechanical model of elastic body
and demonstrated a framework to construct the cumulative dose distribution in organs
during the course of radiation therapy. Coselmon et al. (Coselmon et al., 2004) developed
mutual information based CT registration method using thin-plate splines for lung
deformation with alignment accuracies of 1.7, 3.1 and 3.6 mm in right-to-left, anterior-
posterior and inferior-superior directions. Wang et al.’s study on an accelerated “demons”
algorithm showed ~ 1.5 pixels registration error in simulated CT images and in pelvis
phantom cases, and acceptable contour-propagation accuracy in patient study (Wang et
al., 2005). Lu et al. (Lu et al., 2006) demonstrated the feasibility using free-form
deformation method between kV and MV CT images in ART for “automatic re-
contouring, deformable dose accumulation and tumor volume monitoring”. They have
also cautioned that “under circumstances where large topological changes present, the
intensity-based deformable registration technique may fail”. In a multi-institutional
phantom study of several deformable registration algorithms, Kashani et al. (Kashani et
al., 2008) found that large registration errors exist at various phantom regions for
different techniques compared, and suggested that deformable registration techniques

9
should be employed cautiously. They observed that for the same type of registration,
“different implementations, different users, or different parameter settings”, e.g.
imaging modalities, image quality, registration site, can significantly alter the
registration result and its accuracy. Therefore before clinical use, any deformable
registration technique should be carefully validated within the context of the specific
implementation, the clinical environment (modalities, image quality, and sites) and user-
defined parameters.
1.2.1.3 Functional Imaging
As the field of radiation oncology progresses to include more biological and
functional information into the patient care process, functional imaging modalities, e.g.
dynamic contrast-enhanced Magnetic Resonance Imaging (DCE-MRI) and PET, have
attracted increasing interests. Some pilot studies have demonstrated unique perspectives
and promising results of these imaging modalities in guiding radiation therapy. Cao et
al. reported using DCE-MRI to assess factors influencing the clinical outcome of high-
grade gliomas after radiation therapy, and found that both vascularity and tumor
volume influences the time to progression for these patients (Cao et al., 2008).
Craciunescu et al. (Craciunescu et al., 2009) piloted a study using DCE-MRI to predict
the treatment response in patients with breast cancer. Mayr et al. reported a study using
DCE-MRI to correlate the tumor perfusion pattern change (pre-RT, during early RT and
min-RT) and the treatment outcome (Mayr et al., 2010). The results indicated that DCE-

10
MRI can be used in monitoring tumor radio-responsiveness during RT for guiding
adaptive therapy. MRI guidance is also reported by Dimopoulos et al. (Dimopoulos et
al., 2009) for being effective in assessing the tumor volume shrinkage during EBRT and
brachytherapy for cervical cancer. Schuetz et al.(Schuetz et al., 2010) evaluated repetitive
18F-fluoroazomycin-arabinoside (18FAZA) PET scans to map tumor hypoxia during EBRT
and MRI-guided brachytherapy for cervical cancer, and found it feasible but has
questionable clinical value in addition to MRI. Fallone et al.(Fallone et al., 2009) reported
first on-board MR images acquired concurrently with EBRT with in-house developed
MR-linac featuring 0.2 T field strength. The acceptable image quality shows promises of
using MR over CT/CBCT in adaptive radiotherapy for better soft-tissue contrast. Geets
et al. (Geets et al., 2007) used FDG-PET to monitor tumor volume change during RT
treatment, parallel to CT and MRI, and performed adaptive re-planning study based on
target delineated from PET, CT and MRI. They found that GTVs delineated with
functional imaging modality were always smaller compared to using anatomical
imaging; adaptive re-planning, coupled with target delineated from repeated FDG-PET
has resulted a 15-40% reduction on the irradiated volumes (V90, V95 and V100)
compared to pre-treatment CT. For on-line target localization, Roper et al. (Roper et al.,
2009) reported a simulation study exploring the feasibility of an on-board SPECT and
found it valuable in localizing < 2 cm tumors with clinical uptake of Technetium-99m in
4 min scan time.

11
The use of functional imaging modality in adaptive radiation therapy is still in
the early stage with many technical challenges and limited research data. Although the
additional biological information is promising in principle, more systematic studies are
needed to justify the added benefit of functional imaging to current anatomical imaging
modalities, and then to facilitate the clinical implementation of these technologies.
1.2.2 Treatment Adaptation
The treatment adaptation is another major component of ART; it takes the
information from the image-guidance as input and mitigates the discrepancies between
planned and actual anatomy, aiming for optimal target coverage and OAR sparing. With
this goal in mind, many methods and protocols has been developed in research, some of
which have already been implemented clinically. These methods can be categorized into
four groups:
1.2.2.1 Online Repositioning
Online repositioning is the first stage of ART and has been widely implemented
in clinics where IGRT technology is available. The patient position is corrected online
using daily images for possible target position change from the planned anatomy, as
shown in Figure 5. Different landmarks can be employed to drive the re-alignment of the
target volume. Most commercial treatment delivery system offers the online registration
of bony structures for patient positioning correction, which is useful when tumor
location is relatively stable in reference to the body structures, e.g. intracranial tumors,

12
but not sufficient for treatment sites such as lung and abdomen. To improve the target
localization, fiducial markers implanted in the soft tissue has been used as a surrogate
for the target. Chung et al. (Chung et al., 2004) evaluated using fiducial markers to
perform on-line target localization and alignment for prostate cancer treatment, which is
widely implemented in clinical practice. Jaffray (Jaffray et al., 2002) et al. demonstrated
using CBCT with soft-tissue matching to reduce inter-fractional target position
uncertainties. This method is also widely implemented in commercial treatment delivery
systems and used clinically. Barney et al. (Barney et al., 2010) compared CBCT-based
IGRT with fiducial marker-based in prostate cancer treatment and found them to be
similar, although fiducial marker-based technique is preferred for efficiency. Wu et al.
(Wu et al., 2006a) performed geometric and dosimetric evaluations of on-line re-
positioning and demonstrated its effectiveness on reducing the CTV-PTV margin. Shi et
al. (Shi et al., 2011) compared manual fiducial marker alignment with automatic soft-
tissue match and found the later less reliable for daily target alignment.

13
Figure 5: Concept and weakness of online re-positioning. This correction method is very efficient, but may not be able to correct large organ
motion/deformations.
Although efficient and widely implemented, online repositioning alone is not
capable of correcting dosimetric deficits resulted from daily target/organ deformation,
which is commonly seen in prostate and head-and-neck cancer patients. Such changes
require the plan to be modified through re-optimization-based techniques.
1.2.2.2 Off-line Re-planning
Yan et al. (Yan et al., 1997) pioneered the study of ART by introducing off-line re-
optimization based on the bounding target volume constructed from the first several
fractions’ image data, as shown in Figure 6. After the first week’s treatment, the plan can
be re-optimized with the bounding target volume and used for subsequent fractions to
improve the efficacy of the delivery (Yan et al., 2000). Wu et al. (Wu et al., 2006b)

14
demonstrated the feasibility of combining off-line re-optimization and dose
compensation to safely reduce CTV-PTV margin. Similar offline re-optimization has also
been developed and evaluated by other groups of researchers (Birkner et al., 2003;
Rehbinder et al., 2004; Wu et al., 2004; de la Zerda et al., 2007; Nijkamp et al., 2008; Nuver
et al., 2007). Off-line re-optimization for dose compensation has also been applied with
Tomotherapy unit (Mackie et al., 1999; Wu et al., 2002; Welsh et al., 2006). Wu et al.(Wu et
al., 2002) proposed using off-line re-optimization to compensate cold-spots in target
volume in the next fraction and demonstrated its effectiveness with simulated cases.
Welsh et al.(Welsh et al., 2006) demonstrated the clinical implementation concept of
compensating underdosed region in the target using dose comparison and Tomotherapy
treatment technique in subsequent fractions. Woodford et al.(Woodford et al., 2007)
investigated an adaptive radiotherapy planning technique based on daily gross-tumor
volume (GTV) changes acquired in daily MV-CT image and found it beneficial to
perform adaptive planning for the subsequent fractions if GTV decreases by > 30%
during the treatment course. Nijkamp et al.(Nijkamp et al., 2008) at The Netherlands
Cancer Institute (NKI) reported their first clinical results on adaptive prostate
radiotherapy. They performed off-line re-optimization based on averaged PTV derived
from the CBCT data in the first six fractions, and found using this plan for the
subsequent fractions to be effective in reducing high dose regions and the dose to the
rectum. One important notion of the off-line optimization techniques is that the re-
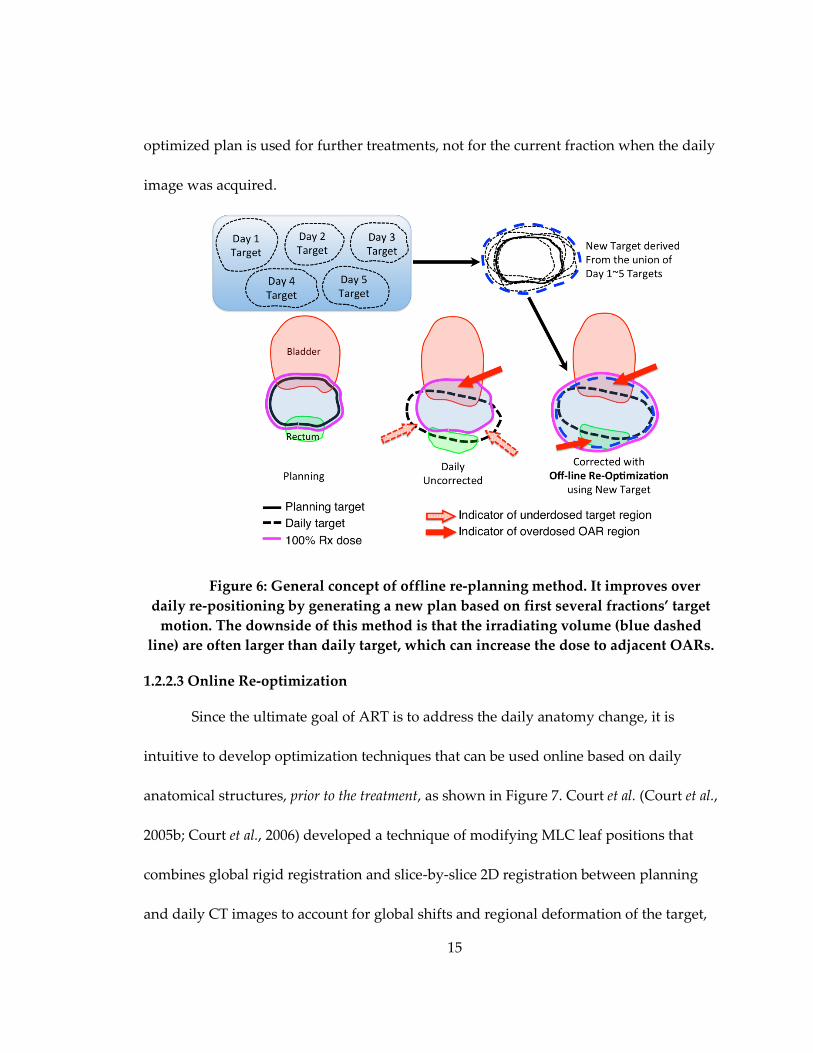
15
optimized plan is used for further treatments, not for the current fraction when the daily
image was acquired.
Figure 6: General concept of offline re-planning method. It improves over daily re-positioning by generating a new plan based on first several fractions’ target
motion. The downside of this method is that the irradiating volume (blue dashed line) are often larger than daily target, which can increase the dose to adjacent OARs.
1.2.2.3 Online Re-optimization
Since the ultimate goal of ART is to address the daily anatomy change, it is
intuitive to develop optimization techniques that can be used online based on daily
anatomical structures, prior to the treatment, as shown in Figure 7. Court et al. (Court et al.,
2005b; Court et al., 2006) developed a technique of modifying MLC leaf positions that
combines global rigid registration and slice-by-slice 2D registration between planning
and daily CT images to account for global shifts and regional deformation of the target,

16
respectively. They found this technique to be effective in improving target dose
uniformity for prostate and head-and-neck cases. Song et al. (Song et al., 2007) also
reported the dosimetric evaluation on online correction method based on “MU-MLC”
modification. Mohan et al. (Mohan et al., 2005) reported online re-optimization by
deforming 2D intensity maps according to the geometric relationship between the
intensity maps and projected anatomy in beams-eye-view (BEV), and found it to be able
to provide good approximation to the fully-fledged re-planning in a rapid manor. Fu et
al. (Fu et al., 2009) developed online MLC leaf position modification techniques based on
BEV anatomical structure projections with dosimetric benefits and faster speed. Feng et
al.(Feng et al., 2006) reported an effective and fast online plan adaptation method using
Direct-Aperture-Deformation that morphs the treatment apertures according to the
planning-to-daily deformable registration. Wu et al. (Wu et al., 2008) developed and
evaluated a full volumetric online re-optimization algorithm using deformed planning
dose distribution and linear programming optimization of the intensity maps, which
significantly improves the target coverage and OAR sparing with < 2 min optimization
time (Thongphiew et al., 2009). Ahunbay et al. (Ahunbay et al., 2010a) utilized a two-step
optimization process called “SAM+SWO”as clinically implementable on-line re-
optimization techniques. In this model, the MLC shape and its relevant MU were
optimized separately which took a total of 5-10 min for plan adaptation. New

17
development in GPU-accelerated computing enables to perform full direct-aperture
optimization within 4s, as demonstrated by Men et al. (Men et al., 2010).
Figure 7: General concept of online re-optimization. It generates a new plan tailored specifically for the daily anatomy. However, such method requires
substantially added cost to the clinical flow.
1.2.2.4 Hybrid Strategies for plan adaptation
Although re-optimization features the optimal target coverage and OAR sparing
for a given daily anatomy, both online and offline implementation of such technique
involves complicated procedures that adds considerable extra resources burden to the
clinic. In the meantime, online repositioning is still the simplest and most widely
implemented correction techniques for daily anatomical variations. For rigid target
variations or small deformation, online repositioning remains a very effective and
efficient method for treatment. However, for cases with significant target deformation,
re-optimization based on the new anatomy is optimal for complete target coverage and
18
ensuring OAR sparing. Therefore to combine on-line repositioning and offline/online re-
optimization will likely to maximize the benefit from both techniques and reduce
redundant re-optimizations. Lei et al. (Lei and Wu, 2010) reported using offline re-
optimization in conjunction with online re-positioning correction is necessary and yields
further margin reductions of 1.4 mm and 2.0 mm for low-risk and intermediate-risk
prostate cancer patients, respectively, while maintains a 99% target volume coverage.
1.2.3 Delivery Verification
Both Yan et al. (Yan et al., 1997; Yan, 2010) and de la Zerda et al. (de la Zerda et al.,
2007) formulated the ART process as a closed-loop system, where dose verification acts
as a feedback chain to provide information on the dosimetric fidelity of the fractionated
treatment process. The dose verification in ART is mainly performed in two fashions:
daily dose verification and cumulative dose analysis.
1.2.3.1 Daily Dose Verification
Daily dose verification calculates the radiation dose of the delivered plan on the
daily image set. This method focuses on the assessing the quality of dose coverage for
each fractionated treatment. The most commonly used method of daily dose verification
is performing dose re-calculation on the daily anatomy with daily delivery information,
acquired during treatment, and compare the daily dose-volume histogram (DVH) to
fractionated planning dose DVH.

19
Lee et al. (Lee et al., 2008a; Lee et al., 2008b) reported daily dose assessment
methods by reconstructing delivered dose with multi-leaf collimator (MLC) Dynalog
files and with leaf sequence measured by electronic portal imaging device (EPID). These
methods take into consideration the actual MLC positions during the treatment and
recalculate the dose in the treatment planning system with the actual measured fluence.
Small differences between delivered and planned fluence maps were reported, as well as
between delivered and planned dose, except for “discernible differences” in high dose
region and maximal dose. Dose reconstructions by Monte Carlo methods have also been
reported by various research groups using Linac MLC Dynalog files (Teke et al., 2010)
and portal beam measurements(van Elmpt et al., 2006).
1.2.3.2 Cumulative Dose Analysis
Contrary to daily dose verification, cumulative dose analysis focuses on the
accumulated dose distribution up to the current fraction. Yan et al. (Yan et al., 1999)
developed a model to construct the cumulative dose in a deforming organ of interest
using deformable registration techniques based on biomechanical model of the elastic
body. Wu et al. (Wu et al., 2006b) utilized this cumulative dose analysis model and
developed a weekly dose compensation scheme for the deficit in actual delivered dose.
By performing volume-element tracking, the discrepancy in doses delivered to each sub-
volume is identified and compensated in future fractions through plan adaptation.
O’Daniel et al. (O'Daniel et al., 2007) evaluated the difference between planned and
20
delivered dose to parotid gland and target using cumulative dose analysis via
deformable image registration. Rosu et al.(Rosu et al., 2005) investigated the impact of
interpolation methods and grid size on the cumulative dose accuracy via deformable
registration. Currently, accurate dose accumulation requires carefully validated
deformable registration techniques and complicated workflow. The increased burden
and uncertainty in accuracy has been a limiting factor for clinical implementation of
cumulative dose analysis, and this needs to be addressed through technology
advancement and system integration(Jaffray et al., 2010).
1.3 Current Clinical Applications of ART for Prostate Cancer
Since the early work of ART by Yan et al. (Yan et al., 1997), the advantage of ART
has been increasingly explored by physicians and clinical physicists, who have
constantly pushed forward the clinical implementation of different ART techniques. The
following is a summary of current ART clinical applications for prostate cancer.
The off-line ART technique has been clinically implemented for prostate cancer
treatment in some institutions. Due to the nature of being adjacent to the bladder and
the rectum, the prostate region can exhibit significant position/volume change inter-
fractionally (Xia et al., 2010), especially when treating both prostate and seminal vesicles,
which is found to move largely independently (Liang et al., 2009). Xia et al.(Xia et al.,
2010) reported one clinical case of concurrent prostate and pelvic lymph nodes treatment
with the multiple adaptive plan (MAP) strategy. The MAP generates plans for a number

21
of potential prostate locations determined using daily image guidance. For each fraction,
the patient was treated with the pre-generated plan that closest matched the daily
prostate position. Dosimetric analysis indicated that the MAP technique is beneficial for
pelvic lymph nodes coverage but is insufficient to provide complete coverage for the
prostate. The offline re-optimization technique (Yan et al., 2001; Yan, 2010; Yan et al.,
2000) has been clinically implemented at William Beaumont Hospitals (Ghilezan et al.,
2010; Yan et al., 2001; Vargas et al., 2005; Harsolia et al., 2007). The outcome analysis on
large number of patients (>1000) demonstrates improved biochemical control (Brabbins
et al., 2008; Ghilezan et al., 2010) and less normal tissue toxicity (Ghilezan et al., 2010,
2008). Netherlands Cancer Institute (NKI) implemented an off-line adaptive strategy
based on planning CT and several repeated CT/CBCT scans but taking into
consideration the average position of rectal walls as well (Hoogeman et al., 2005; Nuver
et al., 2007). In their reported clinical study with 20 patients, ART protocol was able to
reduce PTV volume by avg. 29% and V65Gy for rectum by avg. 19% (Nijkamp et al.,
2008).
Clinical implementation of ART with online re-optimization is currently limited
due to the extra burden of QA and plan approval associated with modified plans.
1.4 Challenges and Limitations
The development in imaging and re-optimization algorithm has made it possible
to personalize radiation therapy and to follow the dynamically changing anatomy

22
throughout the treatment course. However, fully integrating ART into clinical practice
still faces several challenges:
1.4.1 CBCT Image Quality and CT-Number Consistency
For online image guidance, CBCT has been a valuable tool to acquire image with
patient in treatment position. However, due to higher scatter and less mechanical
stability, the image quality of CBCT is still inferior from planning CT. As one of the key
component of many ART systems, deformable registration relies heavily on the quality
of CBCT images to provide accurate result. In prostate cases where low contrast soft-
tissue dominates, high soft-tissue contrast and low artifacts are essential for producing
acceptable deformation accuracy. In addition, the CT number in CBCT images has small
but noticeable difference from planning CT for same materials (Yang et al., 2007; Yoo
and Yin, 2006). This inconsistency could result in differences between dose calculated on
CT and CBCT due to inhomogeneity correction. Although dedicated calibration curve
may reduce the inconsistency to acceptable level (Yang et al., 2007; Yoo and Yin, 2006),
additional effort is required to generate and maintain the calibration curves for each
CBCT unit, especially for centers with multiple CBCTs.
1.4.2 Clinical Resource Management
The main obstacle limiting ART from wide clinical implementation is the time
management challenge. Many components in proposed ART process require
considerably increased cost to time and staff resources compared to current IGRT

23
technique, and are therefore difficult to be integrated into clinical flow for each patient.
These added costs to recourses come from daily structure contouring, re-optimization,
patient-specific quality assurance (QA) and plan evaluation and approval. The key to
address this challenge is through improving computational speed and automation.
Recent development in these components has shown great promises to increase the
efficiency. Automatic contour propagation through deformable registration can be
performed by commercially available tools such as VelocityAI (Velocity Medical
Solutions, Atlanta, GA). GPU accelerated deformable registration engine developed by
Gu et al (Gu et al., 2010) is capable of finishing registration within 7-11s. Fast re-
optimization algorithm with linear programming(Wu et al., 2008), two-step
“SAM+SWO” algorithm (Ahunbay et al., 2010a), and GPU acceleration (Men et al., 2010)
reduces the time of re-optimization to 1-2 min, < 6 min, and 3.8s respectively. Advanced
QA technique employing MLC and Monte Carlo technology has also been reported by
Teke et al.(Teke et al., 2010). It is envisioned that near real-time online ART is possible in
the near future through combination and continuous development of these technologies.
1.4.3 System Integration
For ART to become standard clinical practice in radiation therapy, unified and
seamless integration of all ART components into treatment planning system (TPS) and
clinical record and verify system (R&V) is essential. This requires close collaboration

24
between researchers and vendors. Until then, extreme cautions should be placed in the
clinical deployment of ART techniques, to minimize mistakes and ensure patient safety.

25
2. Project focus and the overall structure This project focuses on proof-of-concept studies facilitating the clinical
implementation of on-line adaptive radiation therapy (ART) for prostate cancer through
innovative sub-system design, and improvement on the integration and efficiency of
multiple sub-systems. The clinical focus of this project is to respond to inter-fractional
anatomical changes and ensure accurate daily dose delivery to the target-of-the-day.
Because of the emphasis on daily dose accuracy, this online ART technique is most likely
to benefit treatment regimes that focus more on daily dose, such as hypofractionated
treatments (Miles and Lee, 2008) and prostate Stereotactic Body Radiation Therapy
(SBRT) (Lee, 2009). Several recent hypofractionated prostate treatment and SBRT
protocol delivers the entire treatment in 5-20 fractions (Madsen et al., 2007; King et al.,
2009; Li et al., 2012a; RTOG, 2012a; Miles and Lee, 2008; Martin et al., 2006; Ritter et al.,
2006; Soete et al., 2006; Tsuji et al., 2005), as opposed to 35-38 fractions in conventional
prostate IMRT. Treatment regimens like these require very accurate daily dose delivery
to achieve tumor control and reduce the risk of elevated toxicity, and therefore would be
more likely benefit from the online re-optimization-based ART techniques developed in
this study.
As mentioned in the background section, on-line ART in general provides
improved daily target coverage and OAR sparing compared to currently IGRT
techniques. It has however not yet been fully implemented in the clinic due to it being

26
time- and staff-resource-expensive, as well as the lack of delivery monitoring technique
that is suitable of online ART application. This project aims at overcoming these
important technical limitations on the efficiency and quality assurance of on-line ART,
and pushing it towards clinical implementation.
The project is divided into three stages. In Chapter 3, an overall system of
integrating online re-positioning and online re-optimization is designed to improve
daily target coverage as well as overall efficiency. In Chapter 4, optimal strategy for fast
online fluence re-optimization using a clinical treatment planning system is explored
based on optimization objective settings, different starting stages and iteration numbers.
In Chapter 5, the delivery accuracy of online automatically re-optimized plan is
validated against that of original plan, and a multi-level quality assurance (QA) system
for on-line adapted treatment is developed to provide online monitoring of the delivery
accuracy and post-treatment dosimetric verifications of daily treatment.

27
3. Developing an overall scheme for online ART system combining re-positioning and re-optimization
3.1 Introduction
In prostate radiation therapy, inter-fractional variations of the target volume and
position due to the change of fillings in nearby organs, i.e. the bladder and the rectum,
make delivering uniform dose to the target challenging on a day-to-day basis. The
technical development and clinical implementation of image-guided radiation therapy
(IGRT) for prostate cancer has enabled on-line reviewing of the daily anatomy, and
consequently has created increasing demands for more conformal target coverage as
well as better organ/tissue sparing of the daily treatment. Many of the current IGRT
techniques focus on target coverage, such as daily match of PTV volumes using on-
board cone beam CT (Olivera et al., 2000; Wu et al., 2006a; Court et al., 2006; Feng et al.,
2006). To further balance the PTV coverage and OAR sparing, adaptive radiation
therapy for prostate cancer treatment was introduced by several groups to re-optimize
initial plan based on daily image sets of the first few fractions in an off-line fashion, (Yan
et al., 1997; Yan et al., 2000; Wu et al., 2002; Birkner et al., 2003; Rehbinder et al., 2004; Wu
et al., 2004; de la Zerda et al., 2007; Ghilezan et al., 2010; Yan, 2010), due to the time
constraints of the re-planning process. On-line re-optimization and adaptation
approaches, recently proposed by several research groups (Court et al., 2005b; Mohan et
al., 2005; Court et al., 2006; Feng et al., 2006; Song et al., 2007; de la Zerda et al., 2007; Wu
et al., 2008; Fu et al., 2009; Mestrovic et al., 2009; Ahunbay et al., 2010b), provide high

28
quality daily treatment by implementing fast re-optimization and/or fast MLC aperture
modification to adapt treatment plans based on daily CT or CBCT image. However,
extra clinical work, such as quality assurance (QA) effort and plan approval are required
for the modified plans, which adds cost of time and machine resources to the clinical
implementation. Therefore in current clinical practice, patient re-positioning based on
soft-tissue matching is still the most widely used technique to account for inter-
fractional patient anatomy variation, due to its high efficiency. Lei and Wu (Lei and Wu,
2010) investigated a hybrid strategy of offline re-planning and online image guidance
using patient geometrical information and analyzed its benefit for margin reduction.
However, the efficiency of an on-line implementation is still of great interest as it
maximizes the benefits of such a hybrid scheme.
The primary goal of performing online plan re-optimization is to maintain
consistent target coverage on a day-to-day basis. However, since the change of patient
anatomy varies on a day to day basis, not all fractions require a plan re-optimization to
ensure target coverage. The decision of whether a re-optimization is necessary should be
based on the evidence that if a previously available plan is inadequate to provide
sufficient target coverage for a particular daily anatomy. Moreover, the previously
available plan should not be confined to the original treatment plan only, but be
expanded to include any on-line re-optimized plan for previous fractions.
29
The hypothesis of this part of the project is that by combining online re-
positioning and re-optimization in an evidence-based way, the necessity of performing
an expensive online re-optimization can be reduced while still maintaining excellent
target coverage, and therefore improving the overall efficiency of the scheme. Since we
focus on the schematic design of the overall system, it is assume that the key
components of the system, including daily re-optimization and quality assurance, are
readily available. Implementations of these components are studied in subsequent
Chapters.
3.2 Methods and Materials
3.2.1 The Original CT plan
Data from 18 prostate cancer patients treated at Duke University Medical Center,
Durham, NC, USA, were retrospectively studied. For each patient, a planning CT image
set was acquired using a CT simulator (Lightspeed; GE Healthcare Technologies,
Waukesha, WI) with 1mm in-plane resolution and 3mm slice thickness. Structures-of-
interest (SOIs) were the clinical target volumes (CTV, including the prostate and the
seminal vesicles) and organs-at-risk (OARs, including the bladder and the rectum).
Femoral heads were also assigned as OARs during original planning but not evaluated
in this study. A uniform 5 mm margin was used to construct the PTV from the CTV.
The initial IMRT plan, “Original CT”, was optimized with the treatment
planning system (Eclipse™, Varian Medical System, Palo Alto, CA), using seven co-

30
planar 15MV beams following the clinical conventions for prostate IMRT treatment
planning at our institution. The beam angles are 25°, 75°, 130°, 180°, 230°, 285° and 335°
for all patients. The primary dose constraints start from the adopted Radiation Therapy
Oncology Group (RTOG) protocols based on 76-Gy target prescription dose (Rx) over 38
fractions (Pollack et al., 2006). For this feasibility study, the same prescription dose was
used for the entire CTV, i.e. prostate and seminal vesicles. These constraints can easily
be met using IMRT planning technique. More stringent secondary dose constraints were
set according to institutional template constraints to achieve as much sparing as
possible. The dosimetric constraints to the bladder and the rectum were: 70 Gy, 62 Gy
and 39 Gy to <20%, 30% and 50% volumes, and 70 Gy, 56 Gy and 39 Gy to <20%, 30%
and 50% volumes, respectively. A priority weight for each constraint was also assigned
to gain a better control in balancing target coverage and OAR sparing. A trial-and-error
scheme was used to manually adjust these constraints and the associated weights during
the optimization process. The plans are normalized so that 100% prescription dose
covers at least 98% of PTV.
3.2.2 Daily treatment simulation
In addition to the original CT data, 10 daily CBCT images for all 18 patients were
acquired using an on-board imaging system (OBI, Varian Medical Systems, Inc., Palo
Alto, CA) with the patient in the treatment position, prior to any IGRT corrections. The
images were acquired every day during the first week and once a week for the rest of

31
the treatment course. These daily images were used to simulate 10 treatment fractions
for all online IGRT techniques. The CBCT images were reconstructed with voxel size of 1
mm in-plane and 2.5 mm slice thickness. The daily SOIs were delineated by one
attending physician, so the contouring was consistent with original IMRT planning. A
previous study (Yan et al., 2000) has shown that for prostate IMRT, sufficient CTV
coverage can be achieved through the entire treatment by setting the target to the
bounding volume constructed based on daily CT images during the first 2 weeks of
treatment, i.e. 10 fractions. This implies that 10 daily CTV shape/positions can represent
most the treatment scenarios through the course of the treatment. Based on this result,
we assume that for subsequent treatment fractions, the CTV coverage is very likely to
follow the results of this study based on the simulated 10-fraction treatment courses.
3.2.3 Three simulated treatment arms
Soft-Tissue-Based IGRT (Online Re-positioning). For each CBCT, the current
clinical IGRT technique based on the soft tissue target alignment was applied and the
delivered plan was named as Soft-Plan plan. For most treatment couches, current clinical
IGRT protocol only performs translational corrections. The matching was performed via
finding the translations that yielded the maximal overlap between the target (PTV) on
CT and the corresponding CTV on the CBCT images, in order to maximize the
likelihood of daily CTV being covered by the dose distribution optimized to conform the

32
PTV on CT. Delivered dose was calculated on the CBCT images within the Eclipse™
treatment planning system.
Re-Optimization-based IGRT. The IMRT re-optimization technique was also
applied to all CBCT images, generating another set of delivered plan (Re-Plan plan). The
Re-Plan plans were generated using daily SOIs contoured on the CBCT images by a
single physician. The 5mm PTV margin was also used in re-optimization process
(Thongphiew et al., 2009). The re-optimization based IGRT technique representing the
most optimal coverage for the daily CBCT anatomy.
Adaptive IGRT (AIGRT). The concept of the AIGRT explores the advantages of
the two IGRT techniques: re-optimization (re-planning) and patient re-positioning, in
order to account for the daily anatomical variations at different levels of complexity and
utilize IGRT to its optimal efficiency. By applying the re-planning technique through the
entire treatment course, the best treatment plan quality is expected since the plan is
customized to maximally match with the daily anatomical structures. On the other hand,
the patient re-positioning technique is the existing IGRT technique that is intuitive and
effective for simple target variations. Therefore in the AIGRT implementation the
selection of the re-positioning vs. re-optimization for each fraction is anatomy-driven.
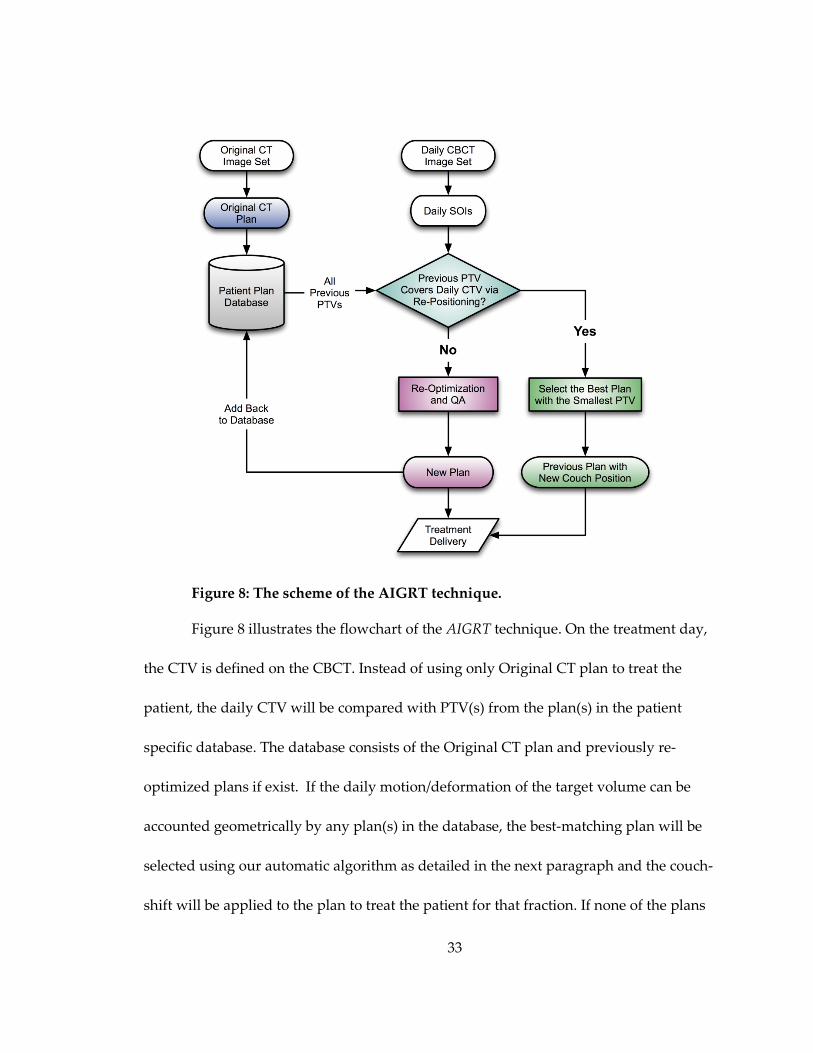
33
Figure 8: The scheme of the AIGRT technique.
Figure 8 illustrates the flowchart of the AIGRT technique. On the treatment day,
the CTV is defined on the CBCT. Instead of using only Original CT plan to treat the
patient, the daily CTV will be compared with PTV(s) from the plan(s) in the patient
specific database. The database consists of the Original CT plan and previously re-
optimized plans if exist. If the daily motion/deformation of the target volume can be
accounted geometrically by any plan(s) in the database, the best-matching plan will be
selected using our automatic algorithm as detailed in the next paragraph and the couch-
shift will be applied to the plan to treat the patient for that fraction. If none of the plans

34
in the database satisfies the coverage criteria, a re-optimized new plan will be created for
that treatment fraction and added to the patient plan database as a candidate for future
fractions.
Selection between re-positioning and re-optimization techniques in the AIGRT is
achieved by an automatic plan selection algorithm based on the patient’s daily
structures-of-interest. Let the plan database contain 𝑁 previous treatment plans
(Original CT and re-optimized plans) 𝑃𝑖, 𝑖 = 1,2, … ,𝑁. Each plan dataset contains the
beam information (e.g. beam angles and fluence maps) and PTV structure 𝑃𝑇𝑉𝑖
according to plan 𝑃𝑖. The daily CTV is aligned with all 𝑃𝑇𝑉𝑖. The plan 𝑃𝑖 that provides
sufficient coverage is the plan such that all voxels 𝑗 in the CTV are in the 𝑃𝑇𝑉𝑖 of the plan
𝑃𝑖.
𝐶𝑇𝑉𝑗 ⊆ 𝑇𝑗�𝑃𝑇𝑉𝑖,𝑗�
where 𝑇𝑗�𝑃𝑇𝑉𝑖,𝑗� represents the transformation (or re-positioning) of the PTV
voxel 𝑗 of the 𝑃𝑇𝑉𝑖. In order to spare the dose to the OARs, the overlapping region of the
𝑃𝑇𝑉𝑖 and the daily OARs needs to be minimized, which can be done by comparing the
PTV-OAR overlapped region. Alternatively, this can be done by selecting the plan 𝑃𝑖∗
with the smallest 𝑃𝑇𝑉𝑖 that provides the complete coverage for the daily CTV.
𝑖∗ = argmin 𝑖 �𝑃𝑇𝑉𝑖𝐶𝑇𝑉
�
The delivered plans, from re-positioning or from re-optimization, are named as
AIGRT plans.

35
3.2.4 Treatment plan comparison
In order to assess the efficacy of our AIGRT concept, delivered plans are
compared based on the IGRT techniques applied: (1) soft-tissue based re-positioning of
all fractions (referred to as Soft-Plan technique); (2) re-optimization of all fractions
(referred to as Re-Plan technique) and; (3) the AIGRT technique. The dose distributions
and DVHs of the daily CTV, bladder, and rectum for these techniques were calculated
and compared.
The target coverage evaluations are based on directly comparing the minimal
dose to the hottest 99% target volume (D99%) among three techniques. Such
comparisons are performed for CTV (prostate and SV) and for seminal vesicles (SV)
alone to assess the performance of these three techniques for different parts of the target.
To evaluate dose delivered to the OARs, volumes that receive 100% prescription dose
(V100%) and 65% prescription dose (V65%) are calculated for the bladder and the
rectum. Deviation from V100%/V65% of the daily re-optimized plan (Re-Plan plan) is
chosen as the evaluation parameter to represent the performance of a plan in achieving
OAR sparing for daily anatomy, against the Re-Plan plans which are the most-conformal
to daily anatomy. Histogram of such deviations was generated for comparison.
Recently published multi-institution study by Michalski et al. has shown that the
volumes of rectum receiving 70 Gy (V70Gy) reported from multiple centers converge at
about 20%, indicating that V70Gy at 20% is the likely threshold for late rectal toxicity
36
(Michalski et al., 2010). Therefore in this paper, the V70Gy of rectum is specifically
compared among three techniques to evaluate the performance as an index of rectal
toxicity. Since our original CT plan was based on a prescription dose of 76 Gy with 2 Gy
per fraction, 70 Gy translates into 92% prescription dose, which is used to calculate
V70Gy in plan DVHs.
The OARs’ V100%/V65%/V70Gy comparison is performed by calculating the
difference between the daily V100%/V65%/V70Gy at evaluation, either from Soft-Plan or
AIGRT, and the gold standard values from the daily Re-Plan for that particular fraction.
The differences of the total 180 cases are then binned into histograms, which are
compared between Soft-Plan and AIGRT. By always setting the reference at the optimal
V100%/V65%/V70Gy for the particular daily anatomy at evaluation, the influence by the
daily variance of OARs’ shapes and position is removed.
For a particular fraction of treatment, if our AIGRT algorithm does not select re-
positioning technique, it suggests that no plan in the patient-specific plan pool is capable
of providing satisfactory coverage for the daily target volume, and plan re-optimization
is needed. The re-optimization produces the most conformal daily plans; however, it
requires additional efforts, e.g. quality assurance and plan approval, to the clinical flow.
On the other hand, re-using previously delivered plans will have minimal impact on the
current clinical flow and is therefore preferred in terms of efficiency. AIGRT improves
the efficiency of plan adaptation by re-using existing plans and reducing the number of

37
fractions that would otherwise require re-optimization to achieve conformal daily
treatment. The effectiveness of AIGRT on improving efficiency is evaluated by
comparing the number of fractions requiring re-optimization to the total number of
fractions requiring adaptation (re-positioning or re-planning). If AIGRT is able to reduce
the frequency of re-optimization in the total number of adapted fractions, implementing
AIGRT is beneficial in terms of efficiency.
3.3 Results and Discussion
3.3.1 CTV coverage
Figure 9 shows the comparison between mean target DVHs of all 180 plans with
standard deviation for three techniques. Only Soft-Plan is observed to have underdosed
CTV and SV region. Quantitative analyses are presented below.

38
Figure 9: Mean DVHs and standard deviation of CTV (a) and SV (b) of all 180 plans. Red bar, blue bar with arrow and green bar with flat cap show the standard
deviation of Soft-Plan, Re-Plan and AIGRT DVHs, respectively.
The mean and range of the daily D99% to the CTV of each patient are plotted in
Figure 10a. The ranges of 18 patients’ mean D99% are: (100.3%-104.1%), (95.2%-104.1%)
and (100.0%-104.1%) for the Re-Plan plans, the Soft-Plan plans and the AIGRT plans,
80
82
84
86
88
90
92
94
96
98
100
60 65 70 75 80 85 90 95 100 105 110
% V
olum
e
% Dose
CTV
Re-PlanAIGRTSoft-Plan
80
82
84
86
88
90
92
94
96
98
100
60 65 70 75 80 85 90 95 100 105 110
% V
olum
e
% Dose
SV
(a)
(b)

39
respectively. For the total 180 plans, the ranges of daily D99% of all patients/fractions
are: (99.6%-105.1%), (57.8%-104.1%) and (98.7%-104.7%) for the Re-Plan plans, the Soft-
Plan plans and the AIGRT plans, respectively. The smaller ranges of daily D99% of
AIGRT plans demonstrate highly uniform CTV coverage throughout the treatment
fractions for all patients. The consistency of uniform CTV coverage of AIGRT plans is
comparable to that of the Re-Plan technique, i.e. the Gold Standard. However, in Soft-
Plan plans, large variations in daily CTV dose, i.e. CTV underdosage, is seen for some
patients.

40
Figure 10: D99% of CTV (a) and SV (b) plotted for 18 patients. Markers show the mean value of D99s of all fractions for each patient; bars show the range of D99%
for each individual patient.
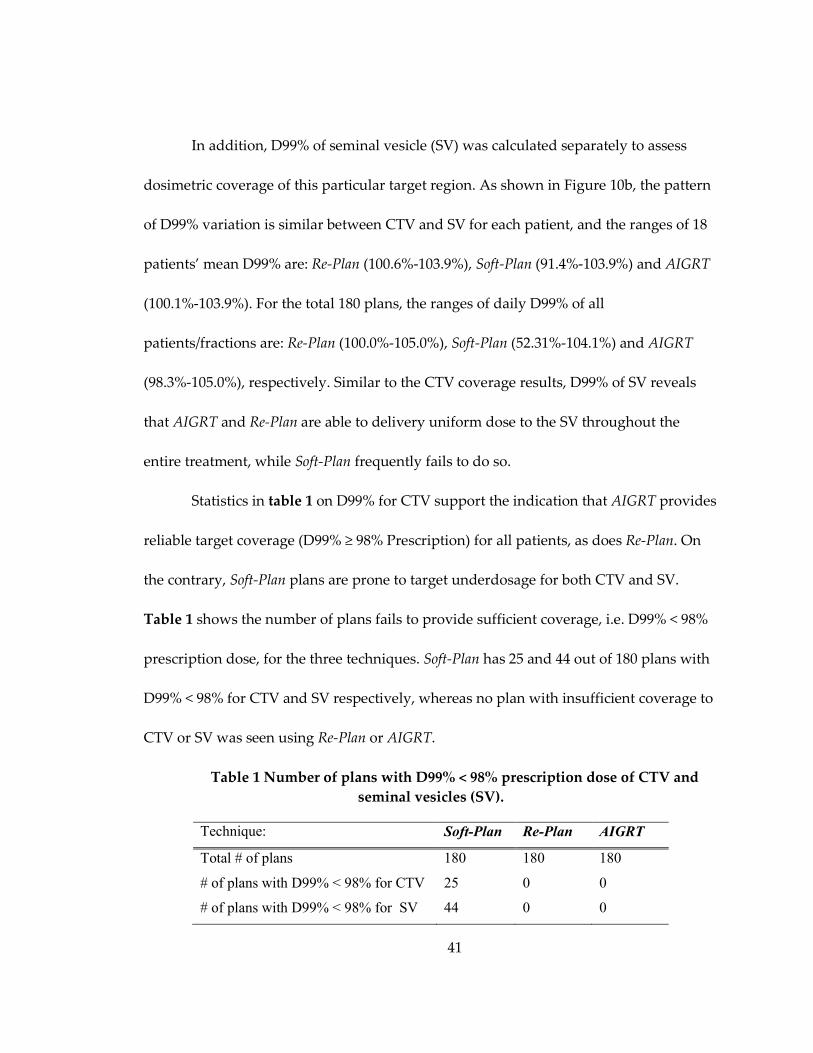
41
In addition, D99% of seminal vesicle (SV) was calculated separately to assess
dosimetric coverage of this particular target region. As shown in Figure 10b, the pattern
of D99% variation is similar between CTV and SV for each patient, and the ranges of 18
patients’ mean D99% are: Re-Plan (100.6%-103.9%), Soft-Plan (91.4%-103.9%) and AIGRT
(100.1%-103.9%). For the total 180 plans, the ranges of daily D99% of all
patients/fractions are: Re-Plan (100.0%-105.0%), Soft-Plan (52.31%-104.1%) and AIGRT
(98.3%-105.0%), respectively. Similar to the CTV coverage results, D99% of SV reveals
that AIGRT and Re-Plan are able to delivery uniform dose to the SV throughout the
entire treatment, while Soft-Plan frequently fails to do so.
Statistics in table 1 on D99% for CTV support the indication that AIGRT provides
reliable target coverage (D99% ≥ 98% Prescription) for all patients, as does Re-Plan. On
the contrary, Soft-Plan plans are prone to target underdosage for both CTV and SV.
Table 1 shows the number of plans fails to provide sufficient coverage, i.e. D99% < 98%
prescription dose, for the three techniques. Soft-Plan has 25 and 44 out of 180 plans with
D99% < 98% for CTV and SV respectively, whereas no plan with insufficient coverage to
CTV or SV was seen using Re-Plan or AIGRT.
Table 1 Number of plans with D99% < 98% prescription dose of CTV and seminal vesicles (SV).
Technique: Soft-Plan Re-Plan AIGRT
Total # of plans 180 180 180
# of plans with D99% < 98% for CTV 25 0 0
# of plans with D99% < 98% for SV 44 0 0

42
For the 18 patients in this study, seminal vesicles are often under-dosed with
current soft-tissue matching technology, due to their displacement caused by bladder
and rectum volume changes. As shown Table 1, 44 out of 180 Soft-Plan plans have D99%
< 98% prescription dose when SV is evaluated separately, compared to 25 out of 180 if
the entire CTV (prostate + SV) is evaluated. This result indicates that the SV part of the
CTV is prone to more frequent under-dosage in Soft-Plan plans. With AIGRT technique,
uniform daily coverage to the prostate and the seminal vesicles are achieved. Figure 11
shows an example of significant CTV shape change due to displaced seminal vesicles.
Soft-Plan fails to provide coverage for the upper part of daily CTV, i.e. seminal vesicles
region, whereas AIGRT selects a previous delivered plan that sufficiently covers the
daily CTV, although its rectum sparing is slightly inferior compared to Re-Plan.

43
Figure 11: Plan comparison between Soft-Plan, AIGRT and Re-Plan for OARs sparing in an example case where daily CTV is significantly deformed compared to
that in Original CT plan. Soft-Plan plan is generated by shifting the Original CT plan to match soft tissues in daily CBCT image. AIGRT plan is selected by our algorithm from previous plan library. Re-Plan plan is generated by complete re-optimization
based on CBCT image. Isodose lines on Soft-Plan, Re-Plan and AIGRT are calculated for each plan using same CBCT image set.
3.3.2 OAR sparing
Figure 12 shows the mean OAR DVHs of all 180 plans for three techniques.
AIGRT has shown to have lower mean DVH and smaller standard deviation compared
to Soft-Plan, for both organs. Quantitative analyses are presented below.
Original CT Soft-Plan
Re-Plan AIGRTIsodose Lines:
PTVCTVBladderRectum
70%
80%
90%
95%
98%
100%
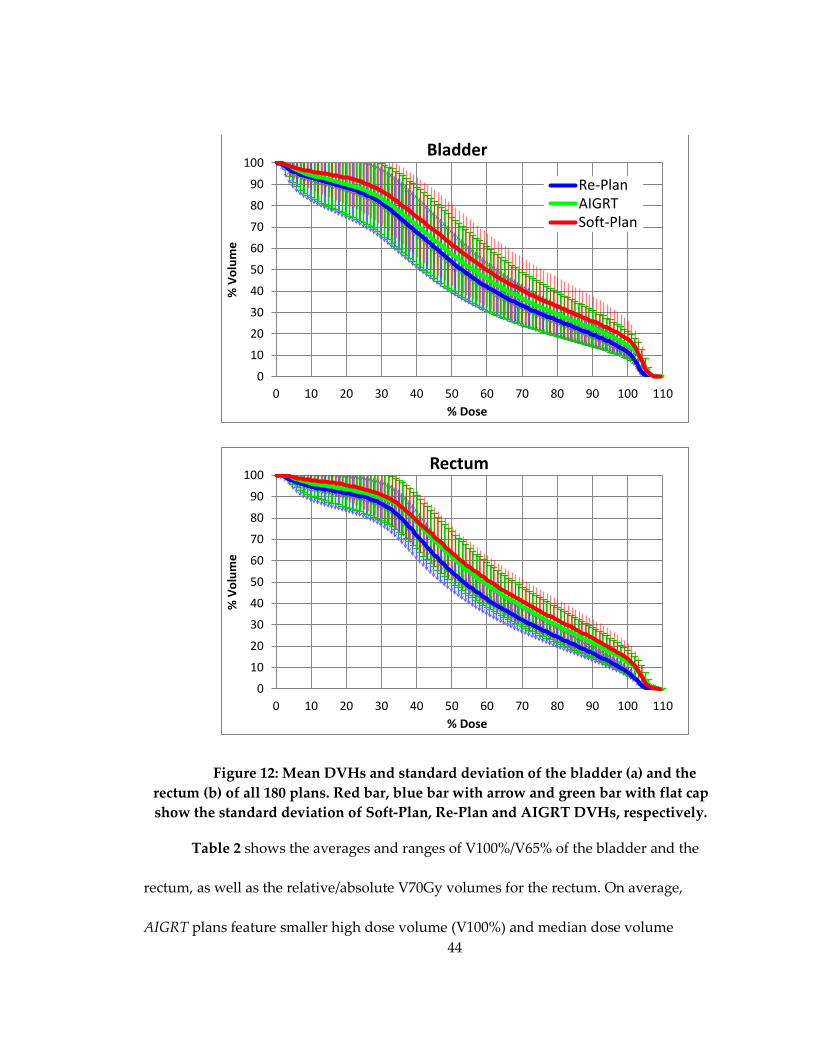
44
Figure 12: Mean DVHs and standard deviation of the bladder (a) and the rectum (b) of all 180 plans. Red bar, blue bar with arrow and green bar with flat cap show the standard deviation of Soft-Plan, Re-Plan and AIGRT DVHs, respectively.
Table 2 shows the averages and ranges of V100%/V65% of the bladder and the
rectum, as well as the relative/absolute V70Gy volumes for the rectum. On average,
AIGRT plans feature smaller high dose volume (V100%) and median dose volume
0
10
20
30
40
50
60
70
80
90
100
0 10 20 30 40 50 60 70 80 90 100 110
% V
olum
e
% Dose
Bladder
Re-PlanAIGRTSoft-Plan
0
10
20
30
40
50
60
70
80
90
100
0 10 20 30 40 50 60 70 80 90 100 110
% V
olum
e
% Dose
Rectum
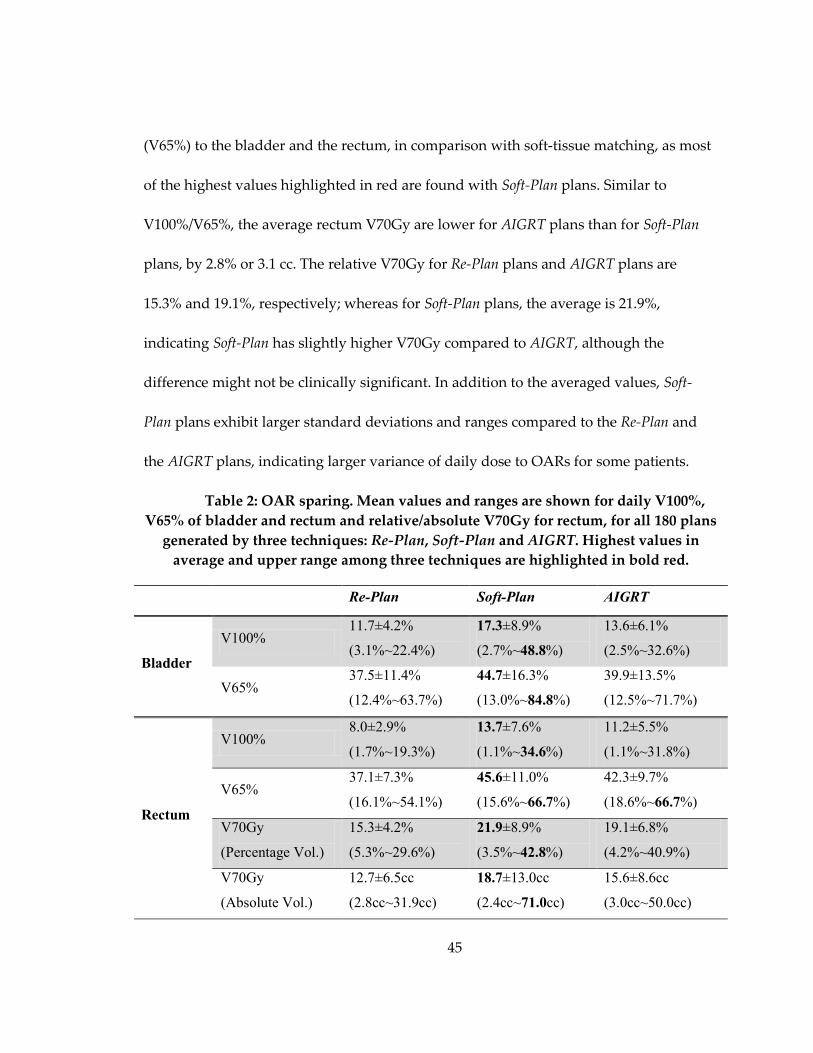
45
(V65%) to the bladder and the rectum, in comparison with soft-tissue matching, as most
of the highest values highlighted in red are found with Soft-Plan plans. Similar to
V100%/V65%, the average rectum V70Gy are lower for AIGRT plans than for Soft-Plan
plans, by 2.8% or 3.1 cc. The relative V70Gy for Re-Plan plans and AIGRT plans are
15.3% and 19.1%, respectively; whereas for Soft-Plan plans, the average is 21.9%,
indicating Soft-Plan has slightly higher V70Gy compared to AIGRT, although the
difference might not be clinically significant. In addition to the averaged values, Soft-
Plan plans exhibit larger standard deviations and ranges compared to the Re-Plan and
the AIGRT plans, indicating larger variance of daily dose to OARs for some patients.
Table 2: OAR sparing. Mean values and ranges are shown for daily V100%, V65% of bladder and rectum and relative/absolute V70Gy for rectum, for all 180 plans
generated by three techniques: Re-Plan, Soft-Plan and AIGRT. Highest values in average and upper range among three techniques are highlighted in bold red.
Re-Plan Soft-Plan AIGRT
Bladder
V100% 11.7±4.2%
(3.1%~22.4%)
17.3±8.9%
(2.7%~48.8%)
13.6±6.1%
(2.5%~32.6%)
V65% 37.5±11.4%
(12.4%~63.7%)
44.7±16.3%
(13.0%~84.8%)
39.9±13.5%
(12.5%~71.7%)
Rectum
V100% 8.0±2.9%
(1.7%~19.3%)
13.7±7.6%
(1.1%~34.6%)
11.2±5.5%
(1.1%~31.8%)
V65% 37.1±7.3%
(16.1%~54.1%)
45.6±11.0%
(15.6%~66.7%)
42.3±9.7%
(18.6%~66.7%)
V70Gy
(Percentage Vol.)
15.3±4.2%
(5.3%~29.6%)
21.9±8.9%
(3.5%~42.8%)
19.1±6.8%
(4.2%~40.9%)
V70Gy
(Absolute Vol.)
12.7±6.5cc
(2.8cc~31.9cc)
18.7±13.0cc
(2.4cc~71.0cc)
15.6±8.6cc
(3.0cc~50.0cc)

46
Figure 13 evaluates the AIGRT technique over soft-tissue matching for OAR
sparing. In this comparison, re-optimized (Re-Plan) plans based on daily anatomy are
used as reference since they are the most conformal plans for the daily structures. If a
plan, either Soft-Plan or AIGRT, provides the same level of OAR sparing, i.e. the same
V100%/V65%/V70Gy as Re-Plan, the deviation would be centered at zero. The deviations
in V100%/V65%/V70Gy may be due to daily variations of OARs’ position, volume,
shape, or the combination of these factors. Negative variations imply lower OAR
volumes receiving V100%/V65%/V70Gy compared to the most-conformal daily Re-Plan,
i.e. better OAR sparing, whereas positive variations imply increased OAR volumes
receiving high V100%/V65%/V70Gy, i.e. worse OAR sparing, relative to daily Re-Plan.
As seen in Figure 13 (a)~(f), the histograms for Soft-Plan are skewed toward the positive
side and have more spread compared to those for AIGRT, indicating higher dose to
OARs in average and larger variations from reference plans. In the meantime, less
positive variations of daily V100%/V65%/V70Gy are seen for AIGRT, compared with
data from Soft-Plan, suggesting that AIGRT technique reduces the frequency and
severity of over-dosing OARs. Overall, our results on OAR dose-volume analysis
indicate that AIGRT generally provides better daily OAR sparing throughout treatment
courses.

47
Figure 13: Histograms of the variations from the most-conformal Re-Plan for (a) Bladder V100%, (b) Rectum V100%, (c) Bladder V65%, (d) Rectum 65%, (e) Rectum V70Gy in absolute volume cc, and (f) Rectum V70Gy in % volume. Green dotted bar: AIGRT; red shaded bar: Soft-Plan. For each labeled value on the horizontal axis, the
corresponding bin extends to ±2.5% or ±2.5 cc from that value.

48
Results shown in Table 2 and Figure 13 indicate that the advantage of AIGRT
over Soft-Plan is not confined in CTV coverage. AIGRT plans achieve better OAR sparing
in comparison with Soft-Plan plans. For the example shown in Figure 11, in the Soft-Plan
plan, due to the changes of the bladder (green contour) and rectum (yellow contour),
large volumes of these two OARs are included in 100% isodose lines. In the Re-Plan plan,
such shift and deformation are fully compensated by complete re-optimization, and
OARs are best spared. In AIGRT plan, although no new plan was generated, OARs
sparing is significantly improved compared to that in the Soft-Plan plan.
In Figure 11, AIGRT and Soft-Plan are compared against most-conformal Re-
Plans. Ideally Re-Plans should represent the best CTV coverage and OAR sparing.
However, frequencies shown on the negative part of the horizontal axis indicate that for
some fractions, Soft-Plan achieves lower V100%/V65%/V70Gy, i.e. better OAR sparing,
than the reference Re-Plan technique. Analysis shows small fraction (~13%) of Soft-Plan
plan achieves lower V100%/V65%/V70Gy than Re-Plan and AIGRT technique. It needs to
be cautioned that such cases are often associated with target (CTV) being underdosed,
i.e. the false sparing of OAR at the cost of compromised CTV coverage, as shown in
Figure 14a. The majority of AIGRT plans feature better CTV coverage, comparable to
Soft-Plan plans (as illustrated in Figure 2), as well as lower high/median dose to bladder
and/or rectum, as shown in Figure 14b.

49
Figure 14: (a) One example case showing false OAR sparing associated with CTV underdose (D99% = 92% Rx) in Soft-Plan. AIGRT and Re-Plan DVHs are close to each other for both CTV and OARs. (b) The representative of majority plans: AIGRT
provides CTV coverage very close to Re-Plan, yet still spares bladder and rectum more than Soft-Plan.
3.3.3 The efficiency of AIGRT
Figure 15 illustrates the efficiency of AIGRT implementation on reducing the
frequency of re-optimization. Total length of red and blue bars shows the percentage of
0
10
20
30
40
50
60
70
80
90
100
0 10 20 30 40 50 60 70 80 90 100 110
%Vo
lum
e
% Dose
CTV Soft-PlanCTV AIGRTCTV Re-PlanBladder Soft-PlanBladder AIGRTBladder Re-PlanRectum Soft-PlanRectum AIGRTRectum Re-Plan
(a)
0
10
20
30
40
50
60
70
80
90
100
0 10 20 30 40 50 60 70 80 90 100 110
%Vo
lum
e
% Dose
CTV Soft-PlanCTV AIGRTCTV Re-PlanBladder Soft-PlanBladder AIGRTBladder Re-PlanRectum Soft-PlanRectum AIGRTRectum Re-Plan
(b)

50
fractions requiring plan adaptation for each patient, either through re-positioning the
previous daily plan or daily re-optimization. For patient #4 and #9, Original CT plan is
capable of providing satisfactory coverage over all fractions, so no plan adaptation is
needed. The blue bar corresponds to the actual frequency of re-optimization (re-
planning) and the red bar corresponds to the opportunity of re-using the previously
daily plans via re-positioning in the AIGRT technique. Therefore, the red bars also
indicate that AIGRT technique significantly lowered the re-planning frequency by
(43±23) % across all patients, which gives AIGRT the advantage in efficiency, as it tries to
remove the redundancy of re-optimization for similar geometry change or deformation
by re-using the plans in the patient-specific plan pool.

51
Figure 15: Frequency reduction on re-planning with AIGRT. Total length of red and blue bars shows the frequency of plan adaptation for each patient. Blue bars
show the actual frequency of re-planning in a treatment course, and red bars show the reduction on re-planning frequency due to the re-use of previous daily plans in the
AIGRT technique. For patient # 4 and # 9, Original CT plan is capable to provide satisfactory coverage over all fractions, so no plan adaptation is needed.
Additionally, the efficiency of implementing AIGRT can be assessed by the
percentage of patients requiring re-optimization for a given fraction. Figure 16 illustrates
the reduction of need to re-plan a patient as fraction number increases. At the end of the
10-fraction, only ~10% patients need re-optimization to ensure complete CTV coverage,
the rest can be treated with existing plans selected by AIGRT algorithm. Similarly, Yan
et al. found that using bounding volume of CTVs over first 10 fractions as planning
volume is sufficient to provide reliable CTV coverage in subsequent fractions (Yan et al.,
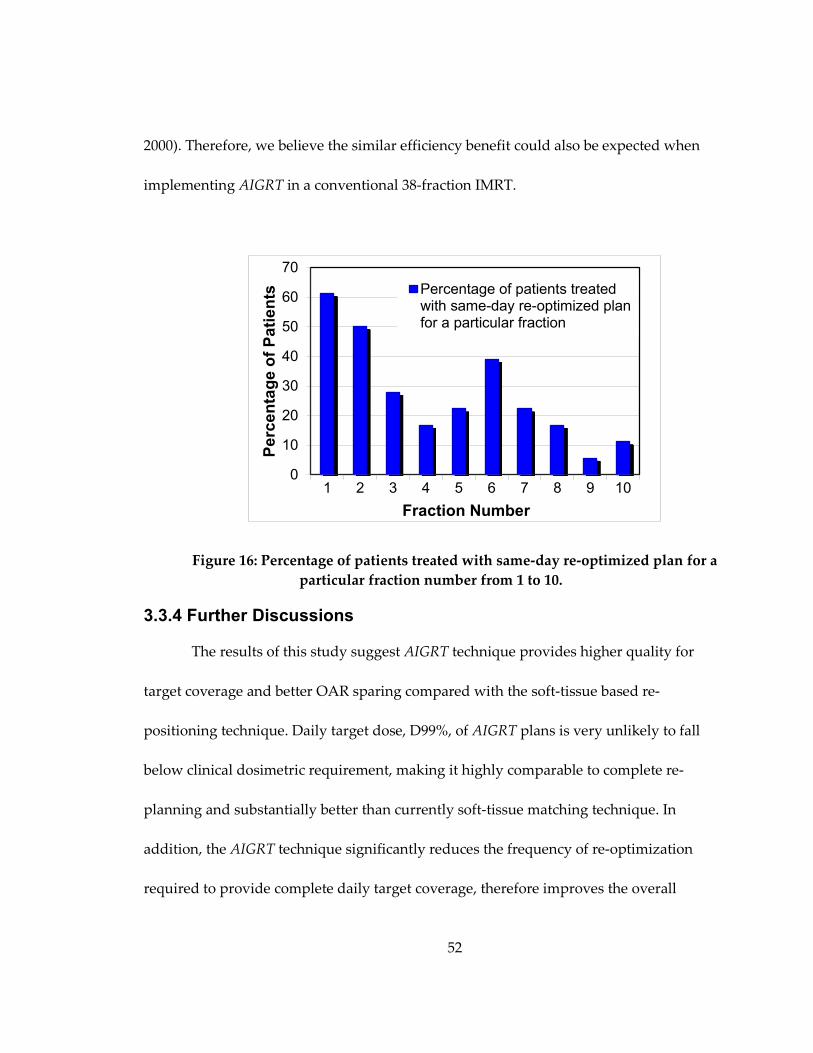
52
2000). Therefore, we believe the similar efficiency benefit could also be expected when
implementing AIGRT in a conventional 38-fraction IMRT.
Figure 16: Percentage of patients treated with same-day re-optimized plan for a particular fraction number from 1 to 10.
3.3.4 Further Discussions
The results of this study suggest AIGRT technique provides higher quality for
target coverage and better OAR sparing compared with the soft-tissue based re-
positioning technique. Daily target dose, D99%, of AIGRT plans is very unlikely to fall
below clinical dosimetric requirement, making it highly comparable to complete re-
planning and substantially better than currently soft-tissue matching technique. In
addition, the AIGRT technique significantly reduces the frequency of re-optimization
required to provide complete daily target coverage, therefore improves the overall
0
10
20
30
40
50
60
70
1 2 3 4 5 6 7 8 9 10
Perc
enta
ge o
f Pat
ient
s
Fraction Number
Percentage of patients treatedwith same-day re-optimized planfor a particular fraction
53
efficiency of plan adaptation. In this study, uniform 5 mm CTV to PTV margin is used
for both original CT plans and Re-Plan plans. If a different margin is used, the frequency
of necessary re-optimization would change, e.g. larger margin would allow more daily
CTV to be encapsulated by previous PTVs at the cost of possibly less OAR sparing, and
vice versa. Future studies would include investigations on possible margin reduction or
non-uniform margin design that may be better suited for this implementation scheme.
The dose calculations for daily plans are based on the corresponding CBCT
images. Due to the difference in the CT numbers between CBCT and CT images(Yoo and
Yin, 2006), dose calculation uncertainty may rise, especially from the inhomogeneity
correction process(Papanikolaou et al., 2004). However, according to a previous study at
our institution, such uncertainty is relatively small: the MU/cGy differences for most
phantom cases were less than 1%, and the isodose lines from calculations on two
modalities agree well (Yoo and Yin, 2006). Yang et al also reported that dose calculated
on CBCT agrees with the planning CT to within 1%, and concluded that CBCT can be
directly used in dose calculation in prostate site (Yang et al., 2007). Therefore in this
study, the uncertainty associated with calculating dose on CBCT image set is assumed to
be small. For dosimetric evaluation, the dose distributions for the three techniques are
calculated on the same image set of each fraction, therefore the uncertainty is consistent
for all techniques and its influence is effectively removed when the DVHs are compared
in parallel. Further, changes in the rectal gas fillings could also affect the dose

54
distribution due to the heterogeneity of electron densities, which currently is only
considered in the daily dose calculation process, not the plan selection process. In future
work attention should be given to dramatic bladder/rectum filling variations during the
plan selection process.
In this feasibility study, the QA process for re-optimized plans in AIGRT scheme
in Figure 8 is only included for the completeness of the proposed clinical flow and not
thoroughly investigated. To suite the clinical implementation of AIGRT, the desired QA
technique would be efficient and automatic, allowing to be performed with patient on
the table.
This study focuses on the overall design of the clinical implementation scheme
that takes advantages of combining re-positioning and re-optimization techniques to
fulfill different clinical needs on daily basis, and shows that the AIGRT scheme can be
beneficial for both the dosimetry and efficiency. In this part of the project, the time
management for each component in AIGRT, i.e. contouring, plan selection, re-
optimization, and QA, is not considered at this proof-of-concept stage; however the full
clinical implementation of AIGRT indeed requires each component in the AIGRT to be
accomplished in a timely manner. The efficiency of re-optimization and development of
QA methods are addressed in the following chapters.
55
3.4 Conclusion
The online ART technique (AIGRT) combining re-positioning and re-
optimization was compared against current soft-tissue matching technique and re-
optimization technique for 18 patients. Results demonstrated that it is beneficial to
implement such a technique clinically. For target coverage, AIGRT achieves highly
uniform CTV coverage comparable to Re-Plan throughout the simulated treatment
course, but requires significantly fewer re-optimization processes. At the meantime,
OAR sparing is improved over Soft-Plan, although not identical to Re-Plan. As a proof-
of-concept, this technique improves the overall efficiency of plan adaptation and has the
potential of being integrated into clinical flow. Thus, AIGRT can be a valuable and
efficient technique for image-guided prostate radiotherapy with precise daily dose
delivery. If the plan selection algorithm is integrated into the commercial treatment
planning system, the AIGRT technique will be easily implementable into the clinical
workflow.

56
4. Strategies for automatic online treatment plan re-optimization using clinical treatment planning system: a planning parameters study
4.1 Introduction
In Chapter 3 a novel scheme for the clinical implementation of online ART for
prostate cancer has been developed and evaluated. It is shown this scheme is capable of
providing reliable target coverage and improved OAR sparing with significantly
reduced re-optimization necessity. However, for those fractions that does require online
re-optimizations, it is essential to perform such a complicated task in a fast, automatic
and robust manner based on daily anatomical structures acquired prior to the treatment.
Several research groups have developed such algorithms that aim for fast online
adaptation/re-optimization. Mohan et al. (Mohan et al., 2005) developed an online
adaptation technique that deforms 2D intensity maps according to the geometric
relationship between the intensity maps and projected anatomy in beams-eye-view
(BEV), and found that it provided adapted plans that approximate well with the fully-
fledged re-planning in a rapid manner. Fu et al. (Fu et al., 2009) also looked at BEV
anatomical structure projections and developed a MLC leaf-position modification
technique with dosimetric benefits and increased speed. Feng et al.(Feng et al., 2006)
reported an online plan adaptation technique (Direct-Aperture-Deformation) that
morphs the treatment apertures based on the deformable registration between planning
and daily images. These techniques adjusted the original fluence map or aperture based

57
on daily anatomy, but did not involve plan re-optimization. Ahunbay et al. (Ahunbay et
al., 2010a) developed a two-step “SAM+SWO” online re-optimization technique that
optimizes the MLC shape and the beams MU separately. This process can be finished
within 5 min but is not applicable to fluence-based optimization and dynamic MLC
delivery. New development in GPU-accelerated computing enables performing full
direct-aperture optimization within 4s, as demonstrated by Men et al. (Men et al., 2010)
We have previously developed and evaluated a proof-of-concept system with full
volumetric online re-optimization algorithm combining deformable registration between
planning and daily images and linear goal programming optimization using CPLEX
(IBM ILOG, Armonk, NY)(Wu et al., 2008), which significantly improved the target
coverage and OAR sparing with less than 2 minutes of optimization time (Thongphiew
et al., 2009). To facilitate clinical implementation of fast online plan re-optimization, the
final adapted plan needs to be re-optimized on an FDA-approved commercial treatment
planning system (TPS). In this study, the Eclipse™ (Varian Medical Systems, Palo Alto,
CA) TPS was used.
A normal IMRT treatment planning process in general includes structure
contouring, beam angle and isocenter selection, iterative fluence map optimization, and
dose calculation. Different from a fully-fledged IMRT planning, the online re-
optimization only redesigns the fluence maps of individual beams, and keeps the rest
beam parameters, e.g. beam angle, energy, the same as the original plan. Therefore in

58
online re-optimization scenarios, the primary planning input parameters are limited to
the DVH objectives for anatomical structures, optimization starting stages, and iteration
numbers, which are the primary focus of this study. Based on these input parameters,
the Eclipse™ TPS will first call the Dose Volume Optimizer™ to iteratively solve for an
optimal set of 2D fluence maps using DVH-based objective functions and a gradient
method(Fogliata et al., 2007; Varian Medical Systems, 2008). The typical iteration number
for this particular optimizer to converge for prostate cases is ~75. This number might
change with improved optimization methods in the future, and will be different in TPS’
by other vendors. Once a satisfactory set of fluence map is reached, the Leaf Motion
Calculator will be called to generate leaf motions that will deliver a certain fluence map
based on the physical properties of the Multi-Leaf Collimator (MLC) used on a specific
treatment machine(Varian Medical Systems, 2008). This leaf motion will then be
executed by the treatment machine to deliver the planned dose.
Currently the efficiency of plan optimization is partially limited by the trial-and-
error process, during which the planner manually adjusts the optimization objectives
back and forth on the fly, to achieve complete target coverage and at the same time spare
critical structures as much as possible. Although manually adjusting optimization
parameters by the planner has the potential to offer good plan quality, this trial-and-
error process is time-consuming: a manual prostate IMRT planning normally takes 15-30
min to finish, which makes the current plan optimization strategy impractical for online

59
re-optimization application. In addition, the plan quality using this manual adjustment
strategy is highly dependent on the experience of the planner, which could vary
between different planners(Nelms et al., 2012).
To achieve online re-optimization with a fluence-map-based TPS, the process
needs to be automated and completed within a reasonably short time. To achieve this,
the DVH objectives and starting stages need to be automatically determined before
entering the optimization. The iteration number should be fixed to ensure convergence
and time efficiency. This also eliminates the time-consuming trial-and-error process
while requiring minimal change to the current clinical flow, by making the initial inputs,
or strategies, for the re-optimization critically important.
The purpose of this study is to investigate the feasibility and strategy for online
plan re-optimization to be automatically executed within ~2 min, while providing
consistently high target conformity and controlled OAR sparing. The study explores
different options for DVH objective settings, starting stage and iteration number in the
context of fast online plan re-optimization and demonstrates how these factors
contribute to the outcome of the online optimization.
The hypotheses are that (1) the full target coverage can be retained with ~2 min
re-optimization; and that (2) objectives containing patient-specific and daily anatomical
information offers benefit to OAR sparing.

60
4.2 Materials and methods
4.2.1 Materials
The data used in this retrospective IRB-approved study was obtained from 10
patients with intermediate-risk prostate cancer. Each patient had one planning CT
volume dataset, taken on the simulation day prior to treatment. In addition, each patient
also had 5 daily cone-beam CT (CBCT) images obtained during the first week of
radiotherapy. Planning target volume (PTV) was defined as CTV plus a 5 mm uniform
margin. The initial IMRT plan, referred to as the Original CT plan, was manually
optimized using seven co-planar 15MV beams. The plans were normalized so that 100%
of the prescription dose covered at least 95% of the planning target volume (PTV).
The 5 CBCT image sets were used to simulate the first week of adaptive
treatment. For each daily CBCT, structures including the CTV, the bladder and the
rectum were contoured by the same attending physician to ensure consistency.
4.2.2 Re-optimization strategies
During the optimization, the optimizer iteratively minimized the objective
function based on 4 key input variables: patient’s anatomical structures-of-interest
(including the PTV, the bladder and the rectum), DVH objectives for these structures,
starting fluence map and iteration number limit. For online ART application, patient
anatomy is a given input, and the iteration number is limited to 50 or 100 iterations,
based on the observation that the global objective function reaches plateau in less than

61
100 iterations. The time required for 100 iterations with our particular setup is ~ 2.5 min,
which fits our expectation on the speed of online re-optimization. The DVH objective
and starting fluence map can be specified by the planner and are therefore key
parameters of this study. The choice of different options for objective settings and
starting stages are built on the idea that these input parameters should be easily
obtainable to achieve high efficiency, but also capable of bringing daily anatomy
information when needed. Based on this idea, the following options for objective
settings and starting stages were obtained, tested and evaluated.
4.2.2.1 Objective setting
On each day of simulated treatment, the plan was re-optimized using the
anatomy-of-the-day. The optimization objective for the target was maintained the same for
all fractions to offer consistent target coverage: at least 99% prescription dose (Rx)
delivered to 95% of PTV; at least 98% Rx delivered to 100% PTV; no more than 3% of
PTV receives > 101% Rx; and PTV hotspot was limited to 102% Rx.
For OARs, three different sets of objectives were explored in this study for re-
optimization, as shown in Figure 17:

62
Figure 17: Flowchart of how three sets of objectives are generated based on increasing level of customization.
RTOG objectives (R), adopted from RTOG protocols(RTOG, 2012b). It is
important to note that the DVH objectives were not iteratively adjusted during the
optimization process in the context of fast online re-optimization, even though that is
what is typically performed during original treatment planning.
CT objectives (C), which were extracted from the Original CT plan DVHs, and
thus took into account the original anatomy of a particular patient that was presented on
the original planning CT. The volume objectives were sampled at 20%, 40%, 60%, 80%,
and 100% of the prescription dose of the Original CT plan DVHs. An additional
constraint at 102% Rx was added to control hotspot.
Deformed-CT objectives (D), which were extracted from the DVH of the goal
dose distribution for a particular fraction. To generate this goal dose distribution,

63
deformable registration was first performed between the structures on the planning-CT
and the daily-CBCT images using VelocityAI software (Velocity Medical Solutions,
Atlanta, GA). This “artificial” dose is referred to as the goal dose in this study, and was
used to generate the Deformed-CT objectives (D)(Wu et al., 2008). Since the deformed
dose took into account the daily anatomy, the anatomy variation from the planning CT
was inherently reflected in this dose distribution. The deformable registration was firstly
evaluated by blended-view comparison methods to ensure reasonable matching between
two structure sets. After registration and dose warping, the goal dose is visually
inspected by an experience physicist to ensure that it mimics clinically achievable dose
distribution, i.e. without unrealistic dose gradient. The goal dose is finally evaluated
quantitatively to ensure satisfactory target coverage (D95% > 100%) is achieved on the
daily anatomy. The goal dose could directly be used in the optimization, which was
implemented using linear programming by Wu et al(Wu et al., 2008). However, to make
this concept work in our clinical TPS, consistently with CT objective settings, the 3D goal
dose needed to be converted to DVH objectives by sampling the % volumes from the
goal DVH at 20%, 40%, 60%, 80%, and 100% of the Rx. Similar to CT objectives, an upper
constraint at 102% is added to control hotspots in OARs.
4.2.2.2 Starting stages
In addition to objectives, the impact of optimization starting stage and iteration
number were also investigated. In this study the starting stage had two options: (i) W,

64
defined as starting from the original fluence maps in the Original CT plan and (ii) WO,
defined as the typical starting point for IMRT planning with unit intensity (open beams)
in the PTV. It may be intuitive to think that starting with original fluence map will
provide a “jump start” for the optimizer and hence better results, but the actual
difference between these two starting stages remains to be investigated.
4.2.2.3 Iteration numbers
The iteration number was also divided into two possibilities (i) 50 iterations and
(ii) 100 iterations. The iteration number is kept low so that the entire optimization
process can be finished within ~2 min for online ART purposes. Using our current TPS
workstation configuration with 2 Intel Xeon® processors and 24 gigabytes of memory,
the optimization time is 1.0 min for 50 iterations, and 2.0 min for 100. Comparison
between these two iteration numbers will quantify how much benefit the additional 50
iterations will add to the online re-optimized plan.
In summary, the overall design of the study involved 12 combinations of three
input factors, creating a total of 600 re-optimized plans for analysis. The input factors
were converted to XML format that can be directly read by the commercial TPS. The re-
optimization process include the following steps: (1) duplicating the original CT plan’s
beam angles on to a new plan based on daily images; (2) starting a new IMRT
optimization with or without original fluence maps; (3) importing DVH objective

65
template that consists of the input factors; and (4) automatic optimization, followed by
dose calculation and plan normalization.
4.2.3 Dosimetric evaluation and statistical analysis
To evaluate the target coverage quality, the RTOG conformity index (CI) was
used. CI is defined as the volume of the target receiving 100% of the prescription dose
divided by the total volume of the target. To evaluate OAR sparing, key DVH
parameters were extracted from the online re-optimized plans. These parameters
included the volume of the bladder receiving at least 50% of the dose (Bladder V50%), the
volume of the rectum receiving at least 50% of the dose (Rectum V50%), the volume of
the bladder receiving 76 Gy (Bladder V76Gy) and the volume of the rectum receiving 70
Gy (Rectum V70Gy)(Michalski et al., 2010). It is important to note that normalized
volumes (%) were used to assess the median dose, whereas absolute volumes (cm3) were
used to assess the high dose regions, such that they will be less influenced by the
volume of the daily OAR fluctuation.
In this study, different sets of plans were created using different combinations of
three factors (planning parameters): objective settings, starting states and iteration
number. In order to understand how these three variables affect the DVH of the online
re-optimized plan (i.e. independently or jointly), a three-way factorial Analysis of
Variance (ANOVA) was performed. This three-way factorial ANOVA helps to
determine the most important contributing factors and their combinations that will

66
result in an optimal and efficient treatment plan re-optimization. In this study there
were three options for objective settings, two options for starting stages and two options
of iteration number, resulting in twelve total combinations. Therefore the factorial
ANOVA model for the purpose of this study was defined as follows:
𝑦𝑖𝑗𝑘𝑙 = 𝜇 + 𝛼𝑖 + 𝛽𝑗 + 𝛾𝑘 + 𝛿𝑖𝑗 + 𝜀𝑗𝑘 + 𝜖𝑖𝑘 + 𝜌𝑖𝑗𝑘 + 𝑒𝑖𝑗𝑘𝑙
where yijkl is an evaluation parameter of the lth patient in the ith objective group, jth
starting fluence group and kth iteration number group, µ represents the underlying
mean of all 12 groups of the re-optimized plans taken together; αi, βj, γk represents the
effect of the three factors (objective settings, starting stages and iteration number) alone,
respectively. δij, εjk and 𝜖𝑖𝑘represent the interaction between any two of the three factors;
ρijk represents the three-way interactions from all three factors, and finally eijkl is an error
term. To determine the significant parameters and interactions, F-tests were performed
for both main and interaction effects with JMP statistical software (SAS Institute Inc.
Cary, NC). A p-value of less than 0.05 indicated significance of a particular
factor/interaction at test.
Upon determining the significant factors in the ANOVA model, the options for
each factor were explored by comparing aforementioned dosimetric parameters among
plans created using each option. In addition to such comparisons, regression analyses
were also performed between OAR volumes in the high dose region (i.e. Bladder V76Gy
and Rectum V70Gy) and the ratio between daily and planning OAR volume. These

67
regression analyses answer the question of whether the Deformed-CT objectives would
perform better than CT objectives for large changes in volume during the course of
treatment. If such a trend does exist, then it would allow us to make different
recommendations according to daily OAR volumes. For simplicity, linear regression was
used in the analysis, also performed with JMP statistical software.
4.2.4 Delivery efficiency analysis
The plan delivery efficiency was evaluated by the total monitor units (MUs) of all
treatment fields for a re-optimized plan under a specific set of optimization option. Since
the same prescription dose and dose rate are maintained, a larger total MU indicates a
more complex fluence map and prolonged treatment time. This may also translate into a
higher probability of intra-fractional patient motion, higher exposure from scatter and
leakage radiation, and slower clinical flow.
4.3 Results and discussions
4.3.1 Incorporating daily anatomy information into the Deformed-CT objectives
An example case of a daily goal dose generated from deformable registration is
shown in Figure 18. In this case, the significant enlargement of daily rectum compared to
the planning rectum has pushed the seminal vesicle region away from planning CT
positions. Both the target and the OAR are significantly changed in shape and position,
which is evident from the disagreement between the planning dose and daily structure
seen in the middle column of Figure 18 with the dose distribution overlaying on the

68
anatomy using rigid target alignment. In the right column, the deformed planning dose
conforms to the changed anatomy because the deformation fields transfer the dose
changes accordingly with the anatomical changes. This example demonstrates the
effectiveness of generating daily goal dose via deformable registration.
Figure 18: Illustration of the daily goal dose generated via deformable registration. Left column shows the original plan dose on planning CT structures. Middle column shows the dose distribution of original plan on the daily anatomy
with rigid registration. Right column shows the original dose propagated to the daily anatomy via deformable registration. White arrows point out that the deformed dose conforms to the daily target very well. Contours: white-PTV, green-bladder, yellow-
rectum.
4.3.2 Daily target coverage
Figure 19 demonstrates the daily target coverage result of all 600 re-optimized
plans in this study. The histogram of daily D99%, i.e. minimal dose to the hottest 99% of
the CTV, shows that all re-optimized plans have D99% within 100% and 105%
prescription dose, suggesting that regardless of optimization strategy, the re-

69
optimization provides excellent target coverage for all fractions/patients. This finding is
in accordance with the consistent target objectives used for all plans, and further
demonstrates the feasibility of restoring daily target coverage within ~2 min fast re-
optimization.
Figure 19: Histogram of daily CTV D99% (minimal dose to the hottest 99% of the CTV) of all 600 re-optimized plans created in this study.
4.3.3 Effect of three optimization factors on dosimetric parameters
Table 3 shows the F-statistics and p-values of the 3-way ANOVA with full
factorial design on the six dosimetric parameters: CI, Global Hotspot, Bladder Mid-Dose,
Rectum Mid-Dose, Bladder High-Dose, Rectum High-Dose, as well as one delivery
efficiency parameter Total MU. The model provides statistically significant fitting effects
(p < 0.05) for all parameters except for the rectum in the high dose region (p = 0.1194).

70
However, because the high dose region of rectum is of primary interest to us, we
continued to include this parameter in our analyses.
Table 3: Global fitting and F-test results for each evaluation variables on the whole 3-way factorial model.
Target Bladder Rectum Global Hotspot
Delivery Efficiency
CI Mid-Dose High-Dose Mid-Dose High-Dose Dmax Total MU
F statistics 7.1121 9.2237 1.8179 67.5175 1.5214 24.9246 52.3345 p-value 0.0001 0.0001 0.048 0.0001 0.1194 0.0001 0.0001
This section presents whether a joint effect of the three main factors should be
considered. Table 4 shows the p-values for the effect of each factor on a particular
dosimetric parameter (i.e. objective, start and iteration alone), as well as the two-way
and three-way interaction of factors. The shade-coding indicates the level of statistical
significance of a particular effect. Generally, main effects, i.e. objective, start and
iteration independently, have significant effects, as illustrated by the majority of cells
having a p-value less than 0.05 (lighter shading). However, two-way and three-way
interaction of factors generally demonstrate insignificant p-values, shown by the dark
shading on the majority of cells, with the exception of the two-way interaction between
objective and starting stage for the rectum median dose volume. Based on these results,
it is reasonable to assume a simplified model consisting of only three isolated factors
and neglecting two-way and three-way interactions. In this way, the plans generated
with different combinations of factors can be separated according to objectives, starting
stages and iteration numbers, and then independently analyzed and compared. The

71
optimal strategy of re-optimization is then simply the combination of the three best
options for each factor.
Table 4: Effect tests result for all three optimization parameters, including stand-alone and interactions of objective, starting stage and iteration. The cells in the
table are progressively shaded according to their statistical significance, i.e. the p-values. From top to bottom: individual factor (main effect), two-way interaction, and three-way interaction. Lighter-than-medium shade corresponds to p<0.05, indicating
the effect of a certain term in the 3-way factorial ANOVA model is significant.
Objective Start Iteration
Main Effects
Target CI 0.1923 0.0002 0.0001 Hotspot Dmax 0.0001 0.3372 0.3109
Bladder Mid-Dose (%) 0.0001 0.0433 0.0982 High-Dose (cc) 0.0250 0.1911 0.1145
Rectum Mid-Dose (%) 0.0001 0.0001 0.0007 High-Dose (cc) 0.0715 0.7706 0.0630
Delivery Eff. Total MU 0.0001 0.0001 0.0001
Obj*Start Obj*Iter Start*Iter
Target CI 0.3757 0.6638 0.2187 2-Way Interactions
Hotspot Dmax 0.2448 0.9689 0.1053 Bladder
Mid-Dose (%) 0.1411 0.7415 0.6533 High-Dose (cc) 0.9716 0.9908 0.6990
Rectum
Mid-Dose (%) 0.0001 0.1106 0.0264 High-Dose (cc) 0.9547 0.9293 0.9890
Delivery Eff. Total MU 0.0001 0.0604 0.0001
Obj*Start*Iter
Target CI 0.9915
3-Way Interaction
Hotspot Dmax 0.9155
Bladder Mid-Dose (%) 0.9988
High-Dose (cc) 0.9943
Rectum Mid-Dose (%) 0.6757
High-Dose (cc) 0.9981 Delivery Eff. Total MU 0.9517
Colorbar p-value < 0.0001 0.05 0.5

72
Figure 20: Comparison of boxplots, mean diamonds and histograms of (a) three objectives for different dosimetric parameters. C: CT objectives, D: Deformed-CT
objectives, R: RTOG objectives; (b) two starting stages for different dosimetric parameters. W: starting with original intensity map; WO: starting without original intensity map, from unity fluence; and (c) two iteration numbers, 50 and 100, for
different dosimetric parameters Green diamonds indicate one-way ANOVA result: if two diamonds does not overlap vertically, then the two groups are significantly
different from each other, and vice versa.

73
4.3.4 Optimal dosimetric options per input factor
Figure 20(a) shows the dosimetric comparisons between plans generated using
the 3 different objective settings: C, D, and R, short for CT, Deformed-CT and RTOG,
respectively. Across all dosimetric parameters it is evident that at least one of the mean
diamonds (green diamonds superimposed with boxplots) of C, D or R does not overlap
with the other two, indicating that the means of C, D, and R plans are significantly
different from each other (p < 0.05). Qualitative comparison can also be made from
boxplots and histogram comparisons. For CI, the three sets of objectives perform
similarly. R has lower global hotspots compared to C and D, which is the result of less
necessary modulation to achieve relatively looser objectives. For the mid-dose region in
both rectum and bladder, R has the highest mean of all three groups, whereas C and D
have means and distributions that are similar to each other. For the high-dose region of
both OARs, R still has the highest mean, but C and D objectives perform differently
between the bladder and the rectum: C results in a lower mean compared to D for
Bladder V76Gy, but results in a higher mean for Rectum V70Gy.
Figure 20(b) next compares the same six dosimetric parameters, but between
plans generated using 2 different starting fluence stages: W (from original plan’s fluence)
and WO (unit fluence). The mean diamonds of W and WO do not overlap across all
parameters, with the exception of rectum V70Gy. This indicates that the mean volumes
for CIs, V50% of both OARs and Bladder V76Gy are not equivalent between plans

74
generated using the two starting stages. The overlapping mean values for Rectum
V70Gy indicates that there is no statistically significant difference between W and WO
for this particular parameter. Qualitative comparisons can again be made from boxplots
and histogram comparisons. Starting with (W) and without (WO) the original fluence
results in similar CI (avg. difference < 0.03) and hotspots (avg. difference < 0.3%). For the
median dose of both OARs, W has a lower mean (5% for the bladder and 15% for the
rectum) compared to WO, as well as a less skewed distribution. For Bladder V76Gy, W
has a slightly higher mean (0.5cc) compared to WO, whereas for Rectum V70Gy, the
difference is not statistically significant.
Similar comparisons were made between the effects of two iteration length (100
and 50) on the mean of CI, hotspot, Bladder V50%, Rectum V50%, Bladder V76Gy and
Rectum V70Gy. Figure 20(c) displays the mean diamonds, box plots and distributions
for the generated plans. The differences between these two groups are statistically
significant for all dosimetric parameters, as indicated by non-overlapping green
diamonds. For all parameters, plans with 100 iterations result in slightly lower means as
compared with 50 iterations. However, the magnitude of differences is very small and
the distribution of data in the two groups is very similar.

75
Table 5 summarizes the results of quantitative comparison between options for
each factor, i.e. determining which option is optimal for objectives, starting stage and
iteration number. The numbers listed in each cell are the means for a group of plans
using a particular option. For dosimetric parameters with difference > 2%/2cc, light-to-
dark shades are assigned corresponding to the low-to-high ranking of group means. Pair
comparisons that have either no statistical significance or < 2%/2cc difference are
assigned with white backgrounds instead of a shaded background. The objectives result
in large difference in terms of OAR sparing: CT objectives shows somewhat better OAR
sparing in mid-dose volume than Deformed-CT with a mean difference <2.5%. However
for the high-dose volumes CT and Deformed-CT objectives perform differently between
the bladder and the rectum: CT results in lower mean compared to Deformed-CT for
Bladder V76Gy but results in a higher mean for Rectum V70Gy. For starting stage
comparison, starting with the Original CT plan fluences (W) demonstrates lower means
compared to starting from open beam (WO), primarily in the mid-dose volume of OARs.
As for iteration number, the difference between 100 and 50 iterations is in general small
across all parameters.
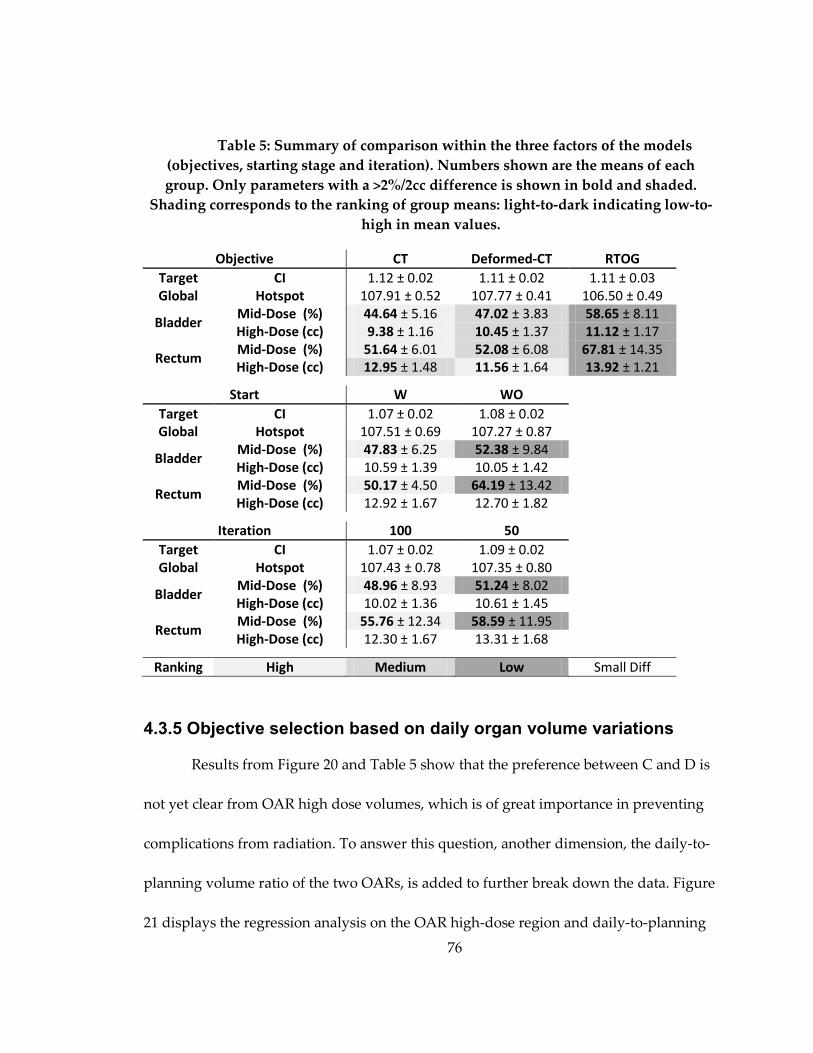
76
Table 5: Summary of comparison within the three factors of the models (objectives, starting stage and iteration). Numbers shown are the means of each group. Only parameters with a >2%/2cc difference is shown in bold and shaded.
Shading corresponds to the ranking of group means: light-to-dark indicating low-to-high in mean values.
Objective CT Deformed-CT RTOG Target CI 1.12 ± 0.02 1.11 ± 0.02 1.11 ± 0.03 Global Hotspot 107.91 ± 0.52 107.77 ± 0.41 106.50 ± 0.49
Bladder Mid-Dose (%) 44.64 ± 5.16 47.02 ± 3.83 58.65 ± 8.11 High-Dose (cc) 9.38 ± 1.16 10.45 ± 1.37 11.12 ± 1.17
Rectum Mid-Dose (%) 51.64 ± 6.01 52.08 ± 6.08 67.81 ± 14.35 High-Dose (cc) 12.95 ± 1.48 11.56 ± 1.64 13.92 ± 1.21
Start W WO Target CI 1.07 ± 0.02 1.08 ± 0.02 Global Hotspot 107.51 ± 0.69 107.27 ± 0.87 Bladder Mid-Dose (%) 47.83 ± 6.25 52.38 ± 9.84 High-Dose (cc) 10.59 ± 1.39 10.05 ± 1.42 Rectum Mid-Dose (%) 50.17 ± 4.50 64.19 ± 13.42 High-Dose (cc) 12.92 ± 1.67 12.70 ± 1.82 Iteration 100 50 Target CI 1.07 ± 0.02 1.09 ± 0.02 Global Hotspot 107.43 ± 0.78 107.35 ± 0.80 Bladder Mid-Dose (%) 48.96 ± 8.93 51.24 ± 8.02 High-Dose (cc) 10.02 ± 1.36 10.61 ± 1.45 Rectum Mid-Dose (%) 55.76 ± 12.34 58.59 ± 11.95
High-Dose (cc) 12.30 ± 1.67 13.31 ± 1.68
Ranking High Medium Low Small Diff
4.3.5 Objective selection based on daily organ volume variations
Results from Figure 20 and Table 5 show that the preference between C and D is
not yet clear from OAR high dose volumes, which is of great importance in preventing
complications from radiation. To answer this question, another dimension, the daily-to-
planning volume ratio of the two OARs, is added to further break down the data. Figure
21 displays the regression analysis on the OAR high-dose region and daily-to-planning

77
OAR volume ratio. The horizontal axis is the natural logarithm of the ratio of the daily
volume (on CBCT) and the corresponding planning CT volume (quantification of the
change in daily OAR volume with respect to the planning CT OAR volume). Natural log
was taken to transform the data and give a better linear fit. The vertical axis is the
difference in rectum V70Gy and bladder V76Gy between plans generated using
objectives C and D per case (quantification of the difference in OAR high-dose volumes
between the two objective settings). Positive values on the vertical axis indicate that C
irradiates a greater volume of the structure with high dose as compared to D, and is
therefore inferior for that particular case. The Pearson’s correlation coefficients (r)
between C-D differences and natural log of volume ratio are 0.7158 and 0.7075,
respectively for bladder V76Gy and rectum V70Gy. ANOVA tests for both regression
models show p-values < 0.0001, indicating both regression models offer statistically
significant predictions on the difference between C and D based on daily volume
variation. Therefore, the choice between using C objectives or D objectives should be
made based on the volume variation of the daily OAR relative to that in the planning CT.
More specifically, for the rectum, the regression plot demonstrates that D becomes more
superior than C when substantial enlargement of the rectum occurs. This is because
when the rectum is significantly enlarged, Deformed-CT objectives are more stringent
than CT objectives due to the less fractional volume occupied by the high dose region
(refer to Figure 18). This daily anatomical feature is then provided to the optimizer via

78
Deformed-CT objectives instructing it to further reduce irradiated volumes of the rectum.
For the bladder, when substantial shrinkage of the bladder occurs, CT objectives are
more stringent than Deformed-CT, resulting in lower V76Gy for plans using CT
objectives compared to those using Deformed-CT objectives. Although beneficial by
looking at the bladder’s V76Gy alone, this extra “push” on the bladder sparing by the
over-stringent objectives might not be realistic for the daily anatomy, and could result in
trade-offs with the sparing of the other OAR, as shown in the discussions.
Figure 21: Regression analyses on the volume difference between using objectives C and D and the corresponding daily-to-planning-CT OAR volume change.
Horizontal axis shows the OAR volume change in natural log scale. Vertical axis shows the difference between C and D in cc: positive value indicates D is better for a particular plan, and negative indicates C is better. Dashed lines are 95% confidence
limit of individual predicted values by the fit.
Another observation from the regression result is that the two OARs exhibit
different trends of volume changes. The rectum volume changes are in general evenly
1
-8-6-4-20246810
C-D
(cc)
-1.5 -1 -0.5 0 0.5 1
ln(Vol Ratio)
1
-8-6-4-20246810
C-D
(cc)
-1.5 -1 -0.5 0 0.5 1
ln(Vol Ratio)
Rectum V70GyBladder V76Gy
R2 = 0.5006R2 = 0.5124

79
spread between enlarging and shrinking, however large relative changes are mostly
enlargement rather than shrinkage, as shown by the higher number of dots located > 1
than < -1 on the horizontal axis. The volume changes of bladder however are mostly
shrinkage, as illustrated by the non-symmetric distribution with respect to 0 on the
horizontal axis. Majority of daily bladders shrink compared to the one on the planning
CT. These trend differences between the two OARs are in accordance with our clinical
management instructions. At our institution, the patients are instructed to be treated
with a full bladder and empty rectum. Patients tend to abide by the instructions better at
CT-simulation. During daily treatment, the bladder is more likely to shrink compared to
the full bladder at CT-Sim because of less control of the bladder filling, either caused by
willingness or physiological difficulties in holding a full bladder, or machine delays
causing voiding before treatment. Since the patient comes to the CT-Sim with an empty
rectum, large subsequent changes in rectum volume are more likely to be toward
enlargement due to filling rather than shrinkage, although small changes do occur in
both directions. Figure 22 shows the organ volume variations in greater details.

80
Figure 22 Organ volume variation for all 10 patients and 5 fractions each. Grey “+” shows the corresponding volume in the planning CT.
An example of the advantage of using Deformed-CT objectives over CT
objectives in the presence of a significantly enlarged daily rectum is shown in Figure 23.
This is the same case shown in Figure 18, where the daily rectum is significantly larger
than the planning rectum. In this case, the CT objectives become excessively loose for the
daily anatomy, and therefore result in inferior OAR sparing compared to the Deformed-
CT objectives.

81
Figure 23 Dose comparison between automatically re-optimized plans using CT objectives (left, square) and Deformed-CT objectives (right, triangle). Deformed-CT objectives carry the information of significantly enlarged rectum to the optimizer, and therefore achieved better rectum sparing compared to the CT objectives. This is
evident in both DVH and isodose comparisons (white arrows).
CT Objectives Deformed-CT Objectives
□ CT∆ Deformed-CT- Bladder- Rectum

82
4.3.6 Delivery efficiency comparison
Figure 24: Comparison of boxplots, mean diamonds and histograms for delivery efficiency in total MU.
Figure 24 shows the comparison of total MU between different options for three
factors. Among different objective settings, RTOG has lower total MU compared to the
other two. This is expected since the RTOG objectives are generally loose and therefore
require less modulation of the fluence maps, which are also associated with inferior
dosimetric performance as seen above. Most worthy of noting is the MU difference
between two starting stages, namely with original fluence map (W) and from unit

83
fluence (WO). It is evident from Figure 24 that re-optimization starting with the original
plan’s fluence map (W) has significantly higher total MU compared with those started
from open beams (WO). Pair-wise comparison shows an increase of 122±65 MU from W
to WO with the rest of the conditions being equal. Although W demonstrated some
dosimetric advantages in the mid-dose region of OARs, as recalled from Figure 20(b)
and Table 5, the increase of MUs is substantial.
4.3.7 Discussion
Previously the development of online ART led by X Allen Li(Ahunbay et al.,
2010a) using SAM+SWO, and by Lei Dong(Court et al., 2005a) using MLC leaf position
shifting both uses segment-based step-and-shoot delivery. This work is developed on a
clinical fluence-based treatment planning system, and therefore is a valuable addition to
the overall knowledge of online plan re-optimization for ART. It provides a systematic
investigation on how input parameters affect the output of online plan re-optimization.
Such understanding is important in that it provides necessary information on choosing
the optimal combination of parameters for online ART application scenario. The work
led by Steve B Jiang utilized GPU-accelerated re-optimization substantially increase the
efficiency of both aperture- and fluence-based plan optimization (Men et al., 2009; Men et
al., 2010), and will offer further benefit if implemented in our current TPS.
The results of this study provide a deeper understanding on how input
parameters affect each dosimetric quantifier separately, so that the clinicians will be

84
aware of the benefit and trade-offs associated with choosing a specific strategy. In a real
clinical situation, the strategy should be determined based on a global picture that
balances all dosimetric parameters. Combining all parameters evaluated in this study,
for most cases using original CT objectives, starting from unit fluence and limiting the
optimization to 50 iterations is in general favored for better balance between quality and
delivery efficiency. For cases with larger organ volume change from CT-Sim, Deformed-
CT offer extra benefit. It is important to note that there is no globally optimal solution
for all cases, and a clinical decision needs to be made on a case-by-case basis, with the
help of knowledge presented in this study.
In this study it is assumed that the daily contours are already available within a
reasonable time after daily imaging, either by automated segmentation, or propagated
via deformable registration. In reality these components takes additional time, and the
research community has been actively working on methods to improve the efficiency
and effectiveness of these important components other than optimization itself. It has
been reported that for prostate cancer online re-planning purposes, delineating prostate,
the rectum and the bladder on the daily image set can be achieved within 2
min(Ahunbay et al., 2008). Improvement on these important components, along with the
optimal strategies for re-optimization, will eventually make the whole process better
suited for clinical workflow.

85
In this study a 5 mm CTV-to-PTV margin was used for both the Original CT plan
and re-optimized plans. .Thongphiew et al.(Thongphiew et al., 2009) reported that for
prostate + seminal vesicle treatment, 5mm CTV-to-PTV margin combined with daily re-
positioning resulted CTV D99 < 98% prescription dose in 14 out of 30 fractions
simulated. We have also shown in a previous study (Li et al., 2011) that without online
re-optimization and relying only on re-positioning based IGRT, the target coverage of
prostate + SV treatment can often be less than adequate, especially for SV. Based on
these results, we proposed the online re-optimization technique to regain target
coverage. Another benefit of online re-optimization is to help reducing treatment
margin, and is currently being investigated. However, it should be noted that even with
fully conformal online re-optimized plan, margin is still needed for intrafractional target
motion. A study by Melancon et al.(Melancon et al., 2007) using pre- and post-treatment
CT-on-rail has shown even with daily re-plan, the margin needed for complete SV
coverage should be larger than 3 mm due to intrafractional motion. Based on this
recommendation and the tolerance for IGRT system intrinsic position errors, a 5 mm
margin for online re-optimization is generous but reasonable. In the meantime, this
study investigates the optimization strategy given a defined target, regardless of the
margin. Therefore the methods used in this study can be applied to cases with margins
other than 5 mm and still help understanding the optimization process. A cumulative
dose analysis over the entire treatment course, suggested by several previous studies

86
(Liang et al., 2009; Liu and Wu, 2011), will further help evaluating the benefit of such re-
optimization technique, and is currently being investigated.
This study focuses on the variation between plans generated by different
strategies instead of comparing DVH endpoints of each plan itself against clinical
standard. However all DVH endpoints values are reported and their distribution
presented for the readers. The evaluation on the CTV D99% shows excellent target
coverage in all re-optimized plans, which is the primary goal of performing online plan
re-optimization. A more detailed evaluation on the plan quality is necessary before
applying the re-optimized plans clinically, and physician’s case-by-case evaluation and
approval is required before delivery the re-optimized plans. We have proposed a tool to
assist this plan quality evaluation process by predicting the achievable DVH using
patient anatomical information and machine learning(Zhu et al., 2011), and will continue
to evaluate the quality of re-optimized plans both subjectively and objectively.
In this study, the one-fits-all objective was adopted from RTOG guidelines: 15%,
25%, 35%, and 50% of the bladder must receive less than 80 Gy, 75 Gy, 70 Gy, 65 Gy,
respectively; and 15%, 25%, 35%, and 50% of the rectum receive less than 75 Gy, 70 Gy,
65 Gy and 60 Gy, respectively. It should be noted that this objective choice was used to
provide an institution-independent baseline, instead of representing actual planning
objective templates used in the clinic. At our institution the original plans were
optimized starting with a more stringent secondary DVH objective set followed by

87
iterative adjustments to reduce the dose to OARs as much as possible. Since the
guideline specifies the minimal OAR sparing required for a plan to qualify for RTOG
clinical trials, it represents the minimally acceptable OAR sparing in the clinic. In actual
re-optimizations, the RTOG objectives are almost always exceeded due to the existence
of other penalty terms in the objective function, e.g. normal tissue objectives. This is in
accordance with our dosimetry findings in that (a) all of our plans meet the minimal
clinical requirement in terms of target coverage and OAR sparing, and (b) the guideline-
based objectives contribute little to the outcome of the optimization. A possible
alternative to using RTOG objectives is using the average of all CT objectives as a
population based objective. Given a large sample size, such an objective can indeed
represent the average quality of plan of a certain institution. However in our case, the
number of patients was limited, and the target DVHs in the original CT plans of all
patients have quite a large variation, and thus an average of all CT plans would provide
limited information on the population-based reference DVH. Increasing the patient
sample size is likely to provide a better estimate for the population DVH, but is outside
the scope of the current study. Other options for objective settings and starting stages
may also be possible, and their pros and cons can also be evaluated using analyses
methods presented in this study.
The goal dose distribution generated in this study using deformable registration
technique incorporates the daily anatomy information. However, generating daily-

88
anatomy-based objectives is not limited to this particular method, and can be performed
with other techniques that estimate the daily dose distribution/DVH based on
anatomical information. For example, Zhu et al. (Zhu et al., 2011) developed a
knowledge-based system to estimate the achievable DVH for a fraction based on
modeling the correlation between DVH and anatomical features using a database of
previous expert plans. Such an estimated DVH could also be used to provide daily
objectives.
Figure 25 Illustration of the trade-offs of using CT objectives on a fraction with significantly shrunk bladder but similar rectum. Black arrows show the
direction of DVH changing from CT to Deformed-CT objectives.
0
10
20
30
40
50
60
70
80
90
100
90 91 92 93 94 95 96 97 98 99 100 101 102 103 104 105 106 107 108 109 110 111 112
Volu
me
(%)
Dose (% of Rx)
PTV: CTPTV: Deformed-CTBladder: CTBladder: Deformed-CTRectum: CTRectum: Deformed-CTPTV ObjectiveCT Objective: BladderDeformed-Ct Objective: BladderCT Objective: RectumDeformed-CT Objective: Rectum

89
It should be noted that although the regression analyses show that when the
bladder significantly shrinks, CT objectives achieve somewhat better bladder sparing as
compared to CT, caution should be taken when using CT objectives due to other
potential trade-offs that may arise as a result of the over-stringent CT objective. Figure
25 shows such a case with the daily bladder being 71% smaller than the planning
bladder, while the daily rectum is only 4% larger than the planning rectum. In this case
the CT objectives for the bladder become over-stringent due to the significantly reduced
bladder volume. DVH indicates that although the bladder DVH is reduced using CT
objectives compared to Deformed-CT, this gain comes with costs to other dosimetric
parameters: the hotspot was increased; and larger fraction of rectum received high dose.
In this example, the optimizer under CT objectives somewhat sacrificed target hotspot
and sparing of rectum while trying to meet the overly stringent bladder objectives,
which is not optimally balanced for the given daily anatomy. To the contrary,
Deformed-CT objectives take into account that a higher percentage of volume of the
bladder will be in the bladder-PTV overlap region when the daily bladder is
significantly smaller than on the planning CT, and adjusts the objectives accordingly.
Therefore, Deformed-CT objectives offer a better balance between sparing of different
OARs and global hotspot.
To deliver the online re-optimized treatment plan, a novel quality assurance
(QA) system is required to perform the plan delivery monitoring and verification with
90
patient in the treatment position. Currently a commercial online ART system, Real-ART
(Prowess Inc., Concord, CA) utilizes a four-step QA to validate the delivery accuracy of
this ART system(Peng et al., 2011). Other groups have proposed in vivo QA using EPID
dosimetry(Mans et al., 2010) and transmission detector arrays(Poppe et al., 2010; Boggula
et al., 2011). We have also proposed a method using dynamic machine information to
verify fluence and leaf accuracy during delivery, as well as dosimetric accuracy after
delivery(Li et al., 2012b), and will be described in greater details in the next chapter.
The daily dose of the re-optimized plans in this study was calculated on the
CBCT image sets. The known inconsistency between the CT numbers in daily CBCT and
planning CT could result in small but noticeable difference in the calculated dose from
the two modalities due to the inhomogeneity correction in the dose calculation
algorithm (Yang et al., 2007; Yoo and Yin, 2006). In this study however, all compared
plans were calculated on CBCT, and so such a dose difference was consistent for all
plans and had little impact on the relative comparison results. In practice, this dose
difference can be corrected by cross-calibrating CT-number between each CBCT unit
and planning CT (Yang et al., 2007; Yoo and Yin, 2006).
Finally, the results in this study were based on our clinical TPS only. However,
the concept of study design and the framework of analyses is platform independent, and
can therefore be generalized to other TPS to enhance understanding of how the input
factors affect the optimization output for that particular system.
91
5. Validation and delivery verifications of online re-optimized treatment plans
5.1 Introduction
The first 2 parts of this project demonstrated that the online re-optimization can
be executed in a timely manner, and can be efficiently integrated with current IGRT
process using the AIGRT scheme. To clinically implement this technique, it is also
important to develop a feasible quality assurance (QA) program for the delivery of on-
line re-optimized plans. Such a QA system should be able to validate the automatically
re-optimized plan, catch delivery errors, and respond in real-time to large deviations
that may impact the quality of the treatment. It should also provide a way to conduct
thorough dosimetric evaluation after the treatment using actual delivery parameters.
For regular (non-adaptive) IMRT treatment, a pre-treatment QA is required at
most institutions before the 1st treatment begins. Such QA is performed by delivering
the actual patient treatment to a detector that is capable of tracking the dose. Several QA
devices are available. One popular way to perform pre-treatment QA is using portal
dosimetry. Before QA, the treatment planning system calculates what dose should be
detected by Electronic Portal Imaging Device (EPID) in calibration units (CU) using the
planned parameters and EPID specification. This simulated delivery provides an
estimated dose map as the reference. This reference dose map is then compared to the
actual dose acquired by EPID during QA delivery. During pre-treatment QA, each beam
is delivered to the portal dosimeter (EPID) placed perpendicular to the beam central axis

92
at 105 cm source-to-surface-distance (SSD). The QA delivery is performed using the
same setting as simulated in treatment planning system. The difference between these
two dose maps is characterized by 2D gamma map (Low et al., 1998). Gamma map
combines both point dose difference (DD) and distance-to-agreement (DTA) into one
single parameter. The former quantifies the dose magnitude difference at a certain point,
and the latter quantifies the shifts of the dose profile. At low gradient region, distance to
agreement dominates the gamma value, whereas at high gradient region, dose
difference will be more pronounced, as shown in Figure 26. Using the equation in Figure
26, it can be easily seen that if the DD and DTA of a certain point is within the tolerance
of 3% / 3 mm, the gamma value would be less than 1. Otherwise, if gamma value is
higher than 1, it indicates at least one of DD and DTA tolerance is exceeded. The passing
criteria of portal dosimetry QA of an IMRT beam is then specified as % of pixels that has
gamma value no higher than 1. Currently in our clinic, the commonly used passing
criterion at 3% / 3 mm is 90%.

93
Figure 26: Illustration of the gamma value at different dose profile points. 3%/3mm specifies the tolerance on DD and DTA, respectively. This tolerance can be
manually chosen, but commonly 3%/3mm or 4%/4mm.
Although EPID QA using gamma map analysis method is widely accepted, it is
not suitable for the application of online adaptive radiation therapy application. Online
ART requires the patient to be in the treatment position from the acquisition of daily
image sets to the end of treatment; and traditional pre-treatment QA cannot be delivered
with patient on the couch. This challenge calls for a novel method for the plan
validation, monitoring and verification that is tailored specifically for online ART
application.
Peng et al. (Peng et al., 2011) reported a validation method for their online
adaptive radiotherapy system. They first validated the accuracy and deliverability of 22
adapted plans by comparing the pre-treatment QA results on these plans to those of
non-adapted plans, and found that the passing rates of adapted and original plans are
94
nearly the same (99.7±0.4% vs. 99.7±0.6%, respectively.) They also compared the MU
from their RealART treatment planning system and from a secondary MU calculation
tool called RadCalc™, and found the agreements of original plans and adapted plans
does not differ significantly (p = 0.41) and are both within 10%. For actual online
adaptive patient treatment, a four-step QA procedure for online replanning was
proposed in their study, including:
(i) off-line phantom measurement of the original plan before the replanning
process,
(ii) online secondary MU calculation check for adapted plans,
(iii) online verification of plan transfer integrity using in-house software, and
(iv) Offline validation of delivery parameters.
However, machine delivery information in step (iii), including MLC positions
and delivered fluence, is not checked or monitored at the machine before or during
treatment. Also, the ART system proposed by Peng et al is based on aperture conformal
and step-and-shoot delivery. In a step-and-shoot delivery, MLC leaves are static during
each beam-on; whereas during our dynamic (sliding window) delivery, the leaves are
constantly moving. To ensure accuracy and safety in dynamic IMRT delivery, the
positions of MLC leaves therefore need to be continuously monitored. The need to
provide such online monitoring of delivery accuracy and added challenge unique to

95
dynamic MLC-based online ART requires the design of a novel QA system for the online
delivery monitoring and dosimetric verification.
Previous work has been done on online MLC position monitoring using MV
imaging (Cho et al., 2009) for dynamic target tracking purpose. Similar method could be
implemented for online ART QA, however the latency associated with image acquisition
and processing (avg. > 272 ms) (Poulsen et al., 2010) makes this method unsuitable for
real-time delivery monitoring. Currently, Dynamic Machine Information (DMI) has been
used as a potential QA candidate by other research groups (Agnew et al., 2012; Teke et
al., 2010; Dinesh Kumar et al., 2006). It provides sub-millimeter accuracy in actual MLC
positions at 50ms temporal resolution, which makes it an excellent input source for
delivery monitoring/verification. The average interval between control points of MLC
movements are 140~250ms, which is 3~5 times the DMI sampling rate. Therefore the
50ms temporal resolution is sufficient for online monitoring purposes.
The motivation of this specific aim is to design and evaluate a QA system
including (1) pre-clinical validation of automatically adapted plans, (2) online delivery
monitoring, and (3) offline dose reconstruction and verification based on DMI.
The hypothesis is that (1) automatically re-optimized plans have similar
deliverability under current QA standard, and (2) the proposed online and offline
delivery verification system are capable of catching potential errors in MLC motion and
their dosimetric consequences.

96
5.2 Methods and Materials
In this section the methods and materials used in developing and evaluating the
online delivery monitoring/verification system is described in details. The materials
include patient data specifications and machine information. The methods for
developing and evaluating the system are presented in each subsection according to
their order in the development timeline. Each section focuses on a specific component
corresponding to a step in the QA system. At the end additional analysis methods for
the delivery monitoring data are also presented.
5.2.1 Pre-clinical validation of the overall delivery accuracy of online automatically re-optimized plans.
The first step of this QA system is a general pre-clinical validation of the online
adapted treatment plans’ deliverability compared to original plans and regular IMRT
plans. The deliverability is assessed using traditional portal dosimetry method so that
the results are interpretable with current clinical standard. The hypothesis is that
automatically online re-optimized plans in general have the similar level of delivery
accuracy as original IMRT plans based on current clinical evaluation method and pass
criteria.
5 patients with intermediate-risk prostate cancer are randomly selected under the
IRB protocols from the 18-patients pool in Chapter 3 and used as the sample in this
study. 5 CBCT image sets for each patient are used to simulate a 5-fraction treatment.
For each patient, 5 adapted plans are created based on the re-optimization strategies

97
determined from Chapter 4. These adapted plans will be verified using portal dosimetry
and analyzed using gamma map method with 3%/3mm passing criteria. Aside from
adapted plans, the original treatment plans for these 5 patients are also subjected to the
same portal dosimetry QA process. In addition, the portal dosimetry QA results from 27
regular IMRT plans outside this 5-patient pool are also collected for comparison.
The pixel passing rate of adapted plans is analyzed in three ways:
(a) The histogram of pixel passing rates from all adapted plans is evaluated and
compared to the distribution of pixel passing rates from original plans. This examines
the similarity in distribution and provides a global perspective of the
similarity/difference between the delivery accuracy of original plans and online adapted
daily plans.
(b) The passing rate of online adapted plans is compared to another set of regular
prostate IMRT treatment plans randomly selected from the clinic, to further rule out the
possible sampling bias of original plans from the patient population at our institute;
(c) In addition, the pass rate is also analyzed for each patient to illustrate possible
inter-patient differences.
5.2.2 Online delivery monitoring and offline dosimetric verification using Dynamic Machine Information (DMI)
For online ART workflow, a real-time delivery monitoring system should be able
to check delivery process, signaling beam-hold in case of catastrophic errors, and record
possible errors of MLC movement for future analysis. As discussed in Section 4.1, DMI

98
is an excellent source for real-time delivery parameters, and is therefore used in this
project to perform online delivery monitoring.
The flowchart of this sub-system is show in Figure 27. It performs three levels of
monitoring/verification on the delivery process.
Figure 27: Flowchart of the QA system including 3 levels of monitoring/verification. Level 1 and 2 are performed in near real-time every 50ms.
Level 1: Real-time fluence map check. Upon receiving each DMI input, the
system updates the actual and expected fluence maps and calculates the pixel-to-pixel
difference between these two (Figure 27), producing a fluence error map (FEM). The
fluence map are calculated by the following method: Firstly, the MLC leaf positions are
projected to the isocenter plane, from which a binary mask is generated indicating which
pixel at the isocenter plane is not blocked by the MLC leaves, i.e. exposed to the
radiation field; the incremental MU from one MLC mask to the next is also obtained

99
from the two corresponding DMI input, and is used to create an incremental MU map.
The pixels that are exposed in two consecutive MLC masks receive the full increment
MU that is delivered between two DMIs, whereas if pixels are exposes in only one of the
two consecutive MLC masks, they receive half of the incremental MU in a first order
approximation. The cumulative MU up to the most recent DMI is then a 2D sum of all
previous incremental MU maps. In this way the cumulative fluence map can be rapidly
calculated and still provide necessary information about the leaf motions effects on
fluence to the first order approximation.
Both actual fluence delivered up to the last DMI input (Figure 28a Left) and
fluence error maps (Figure 28a Right) are dynamically displayed in a graphic interface
(Figure 28). In addition, the pixel differences are plotted as a histogram view (Figure 28b)
to better visualize the magnitude and frequency of those differences. Both magnitude
and frequency could be selected as thresholds to signal warnings with preset thresholds.
Level 2: Independent MLC control point check. The first level of fluence check
monitors execution of MLC controller’s command with high temporal resolution (50 ms).
However, since the expected and actual MLC positions are both from DMI, i.e. the MLC
control unit, the first level check cannot identify errors occurred during the data transfer
between the treatment planning system (TPS) and the MLC controller. Therefore in
Level 2, another independent MLC control point check is implemented to catch potential
data transfer errors (Figure 27). At this level, the difference between actual leaf position

100
and that in TPS (acquired from TPS right before treatment) could also be used to signal
warning signs, and is as well visualized by a histogram for both leaf banks (Figure 28c).
Both Level 1 and 2 are designed to be used as online delivery monitoring tool,
which can signal warning with a user-specified error tolerance. In addition to warning,
the envisioned system is also expected to signal beam-hold in the event of large errors
that exceed the tolerance specified by the treatment plan. This mechanism is to prevent
damages caused by the failure of MLC position interlock, or by the errors occurred
during plan transfer between treatment planning system and treatment console.
Level 3: Off-line dosimetric verification. This part of the QA system provides a
dosimetric verification following the delivery of the treatment plan. Delivered dose is
reconstructed in the treatment planning system by replacing planned MLC control
points with actual control point leaf positions in DMI, and recalculating dose using the
same algorithm and image set as the treatment plan. A similar method has been
reported by Qian et al for VMAT QA (Qian et al., 2010). By controlling the MLC position
as the only variable, the dosimetric impact from MLC movement alone can be isolated
and evaluated. Evaluation criteria includes both DVH and isodose lines comparison.

101
Figure 28: Graphical Interface of the QA system. All graphs are updated in near real-time. (a) Left: delivered fluence up to current DMI snapshot; (a) Right:
fluence error map (FEM) with bi-color-labeled pixels whose fluence error exceeding user-specified threshold (±0.5 MU used here, red indicates at least 0.5 MU hotter, blue
indicates at least 0.5 MU colder, compared to expected fluence); (b) magnitude and frequency of fluence errors; (c) magnitude and frequency of leaf position error at
control points.
In its current configuration, although DMI is fed to the treatment console
workstation in real time, the information is not yet readily available for real-time output
to third-party software. However, the content of DMI is stored in Dynamic Log
(Dynalog) files of the MLC movement and is available after each treatment. Therefore
Real-time Fluence
(a)
(b)
(c)
Pixel Error > ThresholdBlue-Colder, Red-Hotter
Fluence Error Histogram
Leaf Position Error Histogram
Fluence Error Map

102
DMI and Dynalog files contain identical information, except that the former is real-time
and the latter is available post-treatment. In this study, the Dynalog file is played back to
simulate a continuous stream of DMI inputs during beam-on. Such inputs include
expected/actual leaf positions, the fraction of total MU delivered, the current control
point number, beam-on status, and etc. In future, DMI can be available on-line at 50 ms
temporal resolution, and this system would readily be used for online monitoring.
The online monitoring and offline dose verification is performed for the same
sample of patients and plans used in the pre-clinical validation, i.e. five patients with 1
original CT plan and 5 adapted plans each. The fluence errors, control points position
errors and dosimetric errors are recorded and analyzed to:
(1) Better understand the magnitude of errors so that an action threshold can be
suggested;
(2) Assess the overall dosimetric inaccuracies associated with the test cases; and
(3) Further understand the cause of fluence errors patterns manifested in the
results.
In additional to testing the proposed monitoring system on clinical plan
deliveries, MLC position errors were manually introduced to the Dynalog files and used
to test the system’s effectiveness in catching errors. Rangel et al. concluded in their
simulated study that for prostate plan, the tolerances on MLC leaf position error are 0.5
mm for systematic error and 2 mm for random error. Such tolerances keep the target

103
gEUD within 2% deviation from planned. The simulation was performed on Varian
Millennium 120 MLC and Eclipse™ treatment planning system, as used in this
study.(Rangel and Dunscombe, 2009)
Based on their result, similar types of error is introduced to the DMI stream of
one adapted plan before online monitoring and dosimetric verification in order to
illustrate how this system performs with larger errors. In this study, two types of errors
are introduced: systematic and random. The methods and magnitudes of generating
errors follow the study by Rangel et al. For systematic error, both positive and negative
errors with magnitudes of 0.5 mm and 1 mm are separately introduced to the leading
leaf bank and trailing leaf bank. Gaussian random errors are generated by a pseudo
random number generator with standard deviation of 1 mm and 2 mm, and introduced
to each leaf separately. The leaf positions with error are then used to reconstruct
delivered DVH, as described in section 4.2.2.
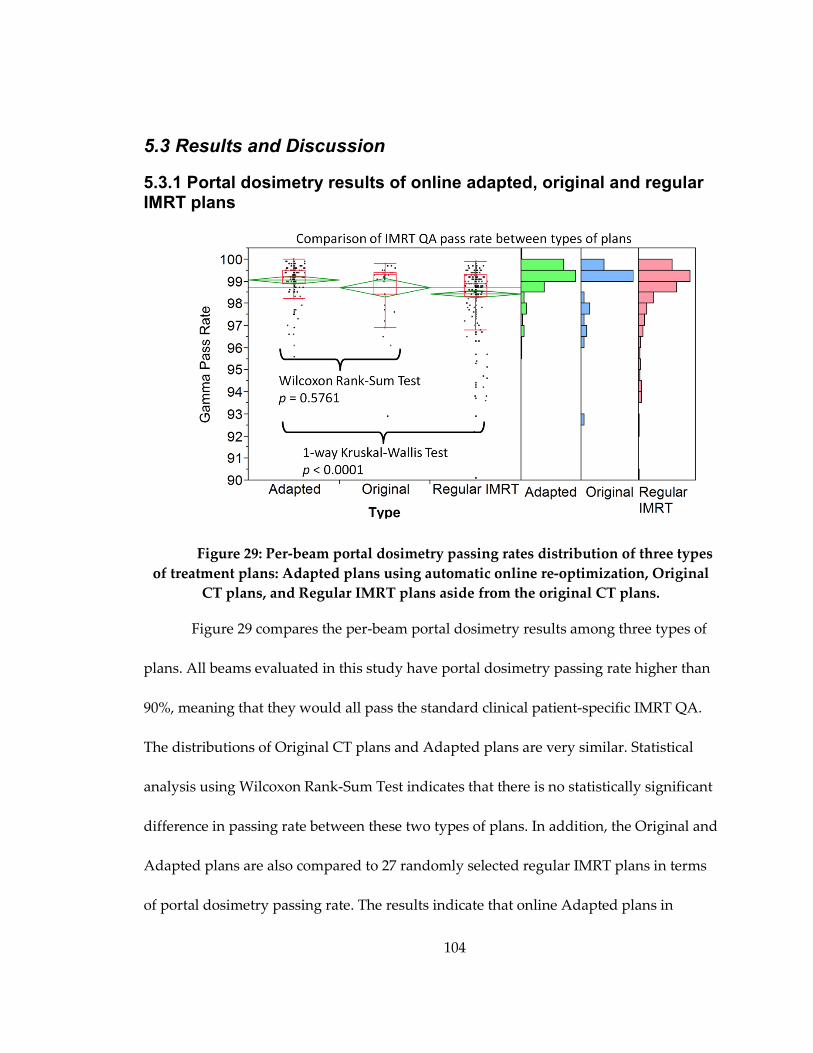
104
5.3 Results and Discussion
5.3.1 Portal dosimetry results of online adapted, original and regular IMRT plans
Figure 29: Per-beam portal dosimetry passing rates distribution of three types of treatment plans: Adapted plans using automatic online re-optimization, Original
CT plans, and Regular IMRT plans aside from the original CT plans.
Figure 29 compares the per-beam portal dosimetry results among three types of
plans. All beams evaluated in this study have portal dosimetry passing rate higher than
90%, meaning that they would all pass the standard clinical patient-specific IMRT QA.
The distributions of Original CT plans and Adapted plans are very similar. Statistical
analysis using Wilcoxon Rank-Sum Test indicates that there is no statistically significant
difference in passing rate between these two types of plans. In addition, the Original and
Adapted plans are also compared to 27 randomly selected regular IMRT plans in terms
of portal dosimetry passing rate. The results indicate that online Adapted plans in
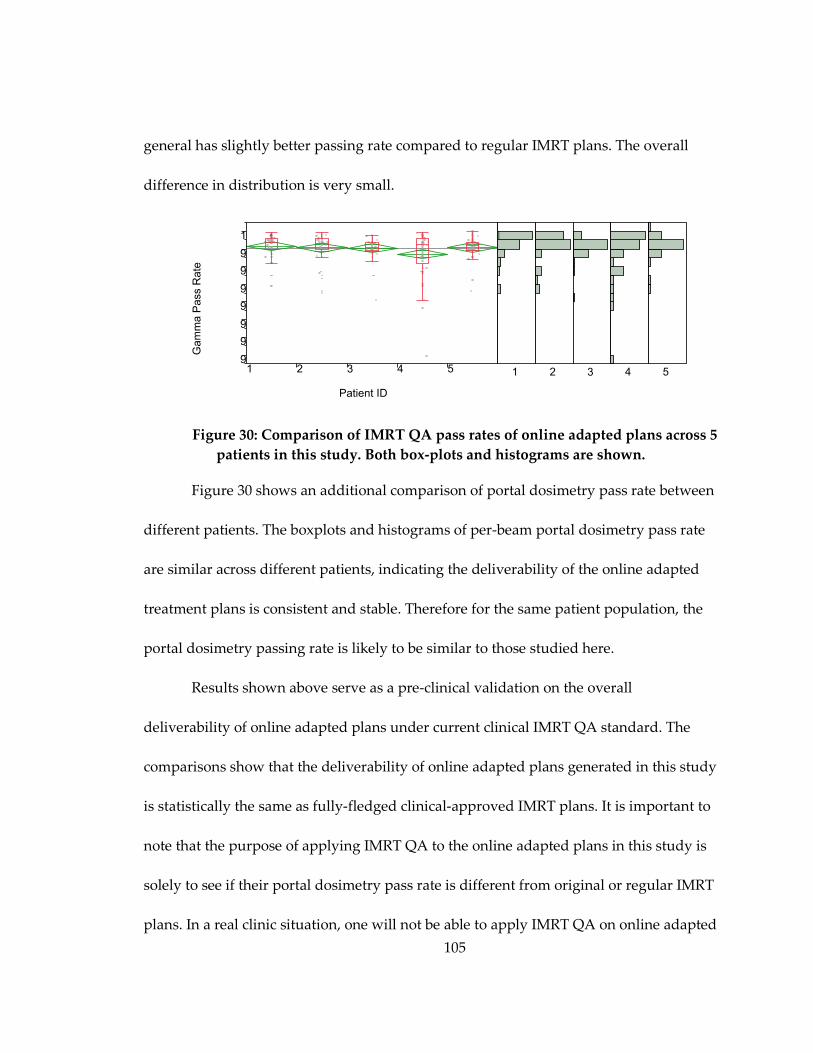
105
general has slightly better passing rate compared to regular IMRT plans. The overall
difference in distribution is very small.
Figure 30: Comparison of IMRT QA pass rates of online adapted plans across 5 patients in this study. Both box-plots and histograms are shown.
Figure 30 shows an additional comparison of portal dosimetry pass rate between
different patients. The boxplots and histograms of per-beam portal dosimetry pass rate
are similar across different patients, indicating the deliverability of the online adapted
treatment plans is consistent and stable. Therefore for the same patient population, the
portal dosimetry passing rate is likely to be similar to those studied here.
Results shown above serve as a pre-clinical validation on the overall
deliverability of online adapted plans under current clinical IMRT QA standard. The
comparisons show that the deliverability of online adapted plans generated in this study
is statistically the same as fully-fledged clinical-approved IMRT plans. It is important to
note that the purpose of applying IMRT QA to the online adapted plans in this study is
solely to see if their portal dosimetry pass rate is different from original or regular IMRT
plans. In a real clinic situation, one will not be able to apply IMRT QA on online adapted
9394959697989910
Gam
ma
Pas
s R
ate
1 2 3 4 5
Patient ID
1 2 3 4 5

106
plans because patient is in treatment position while the plan is being generated. This
challenge leads to the next part of the project.
5.3.2 Online fluence error monitoring
The online fluence monitoring module reconstructs in real time the expected and
actual fluence maps from DMI inputs. The difference between this pair of fluence maps
are caused by deviations of the actual MLC leaf positions from expected positions.
Figure 31 shows the fluence error maps at the end of delivery for all fields tested in this
study. Because previous results show that the deliverability of online adapted plans are
similar to original CT plans, both adapted and original plans are included in the fluence
error analysis to increase the sample size. In general, fluence errors are more prominent
at edges of fields rather than center. Majority of the errors are within ± 0.5 MU. Another
observation is that for the cohort of deliveries test, nearly all error maps exhibit hotter
edges on the left and colder edges on the right. This phenomenon will be discussed in
detail later in this chapter.

107
Figure 31: Fluence error maps (FEMs) between expected and actual fluence generated by online fluence monitoring module.
Figure 31 shows a good variation of pixels fluence difference using a ± 0.5 MU
scale. Since most pixels have errors within this range, it is intuitive to set 0.5 MU as a
cut-off to define pixels that has a relative large error. It should be noted that this cut-off
value can be set to other values as well; when set to other values, the following results
may be different, but the analysis methods still hold.

108
Figure 32: Histogram showing the distribution of percentage pixel failure rate using per-beam fluence monitoring and a failing threshold of ± 0.5 MU.
Figure 32 shows the distribution of per-beam online fluence monitoring results.
The horizontal axis corresponds to the percentage of pixels that fails to stay within ± 0.5
MU cut-off for a particular beam evaluated. The vertical axis indicates the percentage
frequency of beams with certain pixel-wise failing percentage. It is evident that majority
of beams has less than 5% pixels with fluence errors exceeding 0.5 MU. The 95 percentile
ranking corresponds to 6.3% of pixels exceeding 0.5 MU, which means 95% of the beams
evaluated have less than 7% pixels with errors exceeding the threshold. Therefore by
setting the warning action threshold at 7%, the online fluence monitoring module is then
capable of responding to a beam that is among or larger than the most erroneous 5%

109
based on our test sample, and alert the user to perform further evaluation on the
delivery accuracy of the particular beam.
5.3.3 Online leaf position error monitoring
In addition to fluence errors, the proposed online delivery monitoring system
also monitors the leaf position errors. There are two levels of position error monitoring
in this system, the 1st level is a part of the fluence monitoring and checks actual leaf
positions against expected leaf position recorded at each DMI sample. Because such
information is already used in reconstructing real-time fluence, monitoring the leaf
position inaccuracies at each DMI is not explicitly monitored in the design of the QA
system.
The 2nd level of leaf position monitoring compares the actual leaf positions at
each control point to those specified by the treatment plan in the TPS. Because the
machine delivers the treatment plan following the instructions in the control points, this
monitoring serves as an end-to-end check of both the plan transfer integrity between the
TPS and the Linac, as well as the accuracy of delivery. Therefore, the monitoring results
from level 2 check – the leaf position monitoring at control points – is analyzed in great
details.
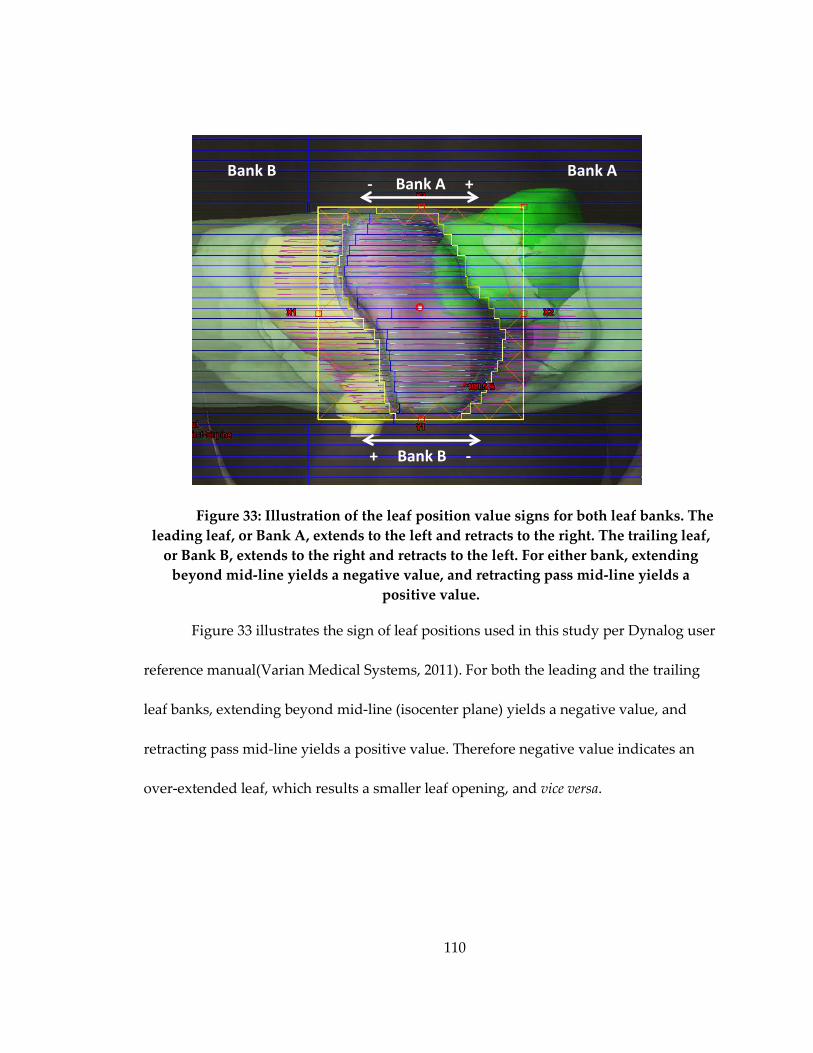
110
Figure 33: Illustration of the leaf position value signs for both leaf banks. The leading leaf, or Bank A, extends to the left and retracts to the right. The trailing leaf,
or Bank B, extends to the right and retracts to the left. For either bank, extending beyond mid-line yields a negative value, and retracting pass mid-line yields a
positive value.
Figure 33 illustrates the sign of leaf positions used in this study per Dynalog user
reference manual(Varian Medical Systems, 2011). For both the leading and the trailing
leaf banks, extending beyond mid-line (isocenter plane) yields a negative value, and
retracting pass mid-line yields a positive value. Therefore negative value indicates an
over-extended leaf, which results a smaller leaf opening, and vice versa.
- Bank A +
+ Bank B -
Bank ABank B
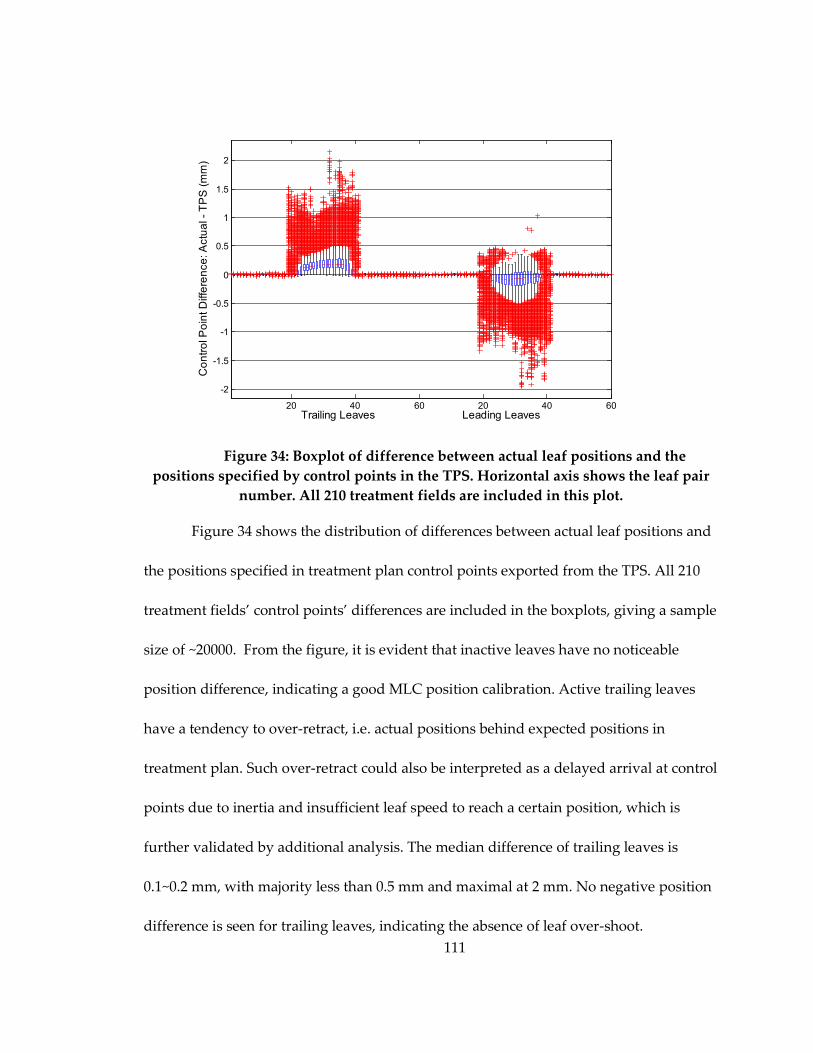
111
Figure 34: Boxplot of difference between actual leaf positions and the positions specified by control points in the TPS. Horizontal axis shows the leaf pair
number. All 210 treatment fields are included in this plot.
Figure 34 shows the distribution of differences between actual leaf positions and
the positions specified in treatment plan control points exported from the TPS. All 210
treatment fields’ control points’ differences are included in the boxplots, giving a sample
size of ~20000. From the figure, it is evident that inactive leaves have no noticeable
position difference, indicating a good MLC position calibration. Active trailing leaves
have a tendency to over-retract, i.e. actual positions behind expected positions in
treatment plan. Such over-retract could also be interpreted as a delayed arrival at control
points due to inertia and insufficient leaf speed to reach a certain position, which is
further validated by additional analysis. The median difference of trailing leaves is
0.1~0.2 mm, with majority less than 0.5 mm and maximal at 2 mm. No negative position
difference is seen for trailing leaves, indicating the absence of leaf over-shoot.
20 40 60 20 40 60
-2
-1.5
-1
-0.5
0
0.5
1
1.5
2
Trailing Leaves Leading Leaves
Con
trol P
oint
Diff
eren
ce: A
ctua
l - T
PS
(mm
)

112
For the leading leaves, both positive and negative differences are found, with
approx. -0.1 mm median differences for all active leaves. The distributions of differences
are also skewed to the negative side. Using the sign definition in Figure 33, negative
difference for leading leaves indicate over-extending, which could also result from
delayed arrival at a particular control points. Compared to trailing leaf results, the
leading leafs exhibit slightly smaller median inaccuracies and occasional over-shoot, but
generally similar pattern of delayed arrival. Since individual leaf position errors has
limited implication on the fluence and dose inaccuracy, the empirical error magnitude is
not used as a warning threshold at this stage. The information from Level 2 check is
used to supplement the fluence map monitoring to provide magnitudes and
distributions of errors.
5.3.4 Off-line dosimetric verification of delivered treatment plans
The off-line dosimetric verification utilized the online Dynalog records of actual
leaf positions to reconstruct delivered dose incorporating any leaf motion inaccuracies
during delivery. Figure 35 shows the difference in DVH between reconstructed dose
using Dynalog and planned dose. For a particular point at DVH, if the actual delivered
DVH is lower than the planned, a negative value will be observed, and vice versa. The
figure contains all DVH from 25 online adapted treatment plans.
For PTV, the difference in dose coverage is minimal, as indicated by the absence
of negative values in the 1-100% prescription dose region. There is an increase in the

113
hotspot volume, especially around 105%. The increase is smaller for higher dose, < 1% in
V110%. The magnitude of hotspot, i.e. the toe of the DVH, shows very small increase, as
only 4 outliers is found beyond 110% dose, with volume less than 0.5% of PTV.
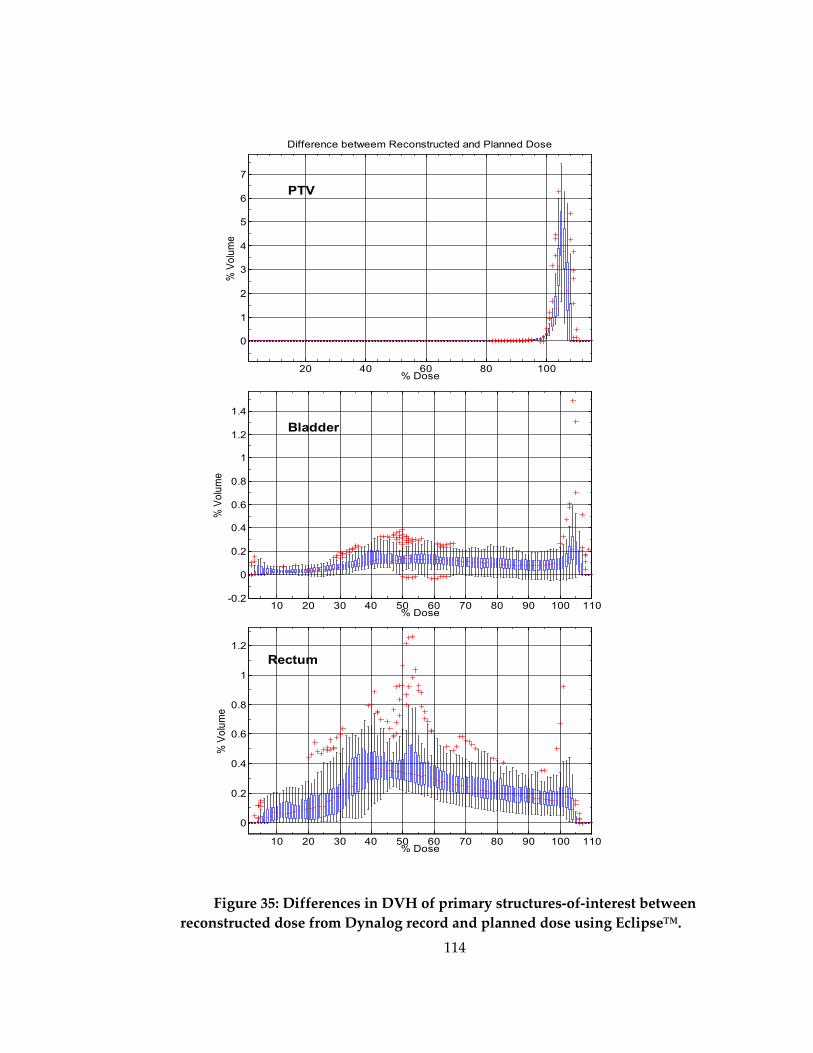
114
Figure 35: Differences in DVH of primary structures-of-interest between reconstructed dose from Dynalog record and planned dose using Eclipse™.
20 40 60 80 100
0
1
2
3
4
5
6
7
Difference betweem Reconstructed and Planned Dose
% Dose
% V
olum
e
PTV
10 20 30 40 50 60 70 80 90 100 110-0.2
0
0.2
0.4
0.6
0.8
1
1.2
1.4
% Dose
% V
olum
e
e e ce et ee eco st ucted a d a ed ose
Bladder
10 20 30 40 50 60 70 80 90 100 110
0
0.2
0.4
0.6
0.8
1
1.2
% Dose
% V
olum
e
Rectum

115
The difference of PTV DVH exhibits a global shift towards the higher end by <1%
prescription dose. An example case is shown in Figure 36. Such shift might be resulted
from the hotter regions seen in Figure 31. Because hotter region is in general larger and
higher in magnitude, it surpasses the effects from the colder region when summing
multiple beams from different angels, and therefore dominates the influence on the
delivered dose.
Figure 36: Example case showing the typical difference in PTV DVH between planned dose and delivered dose reconstructed based on Dynalog.
DVH differences of the bladder and the rectum between planned and delivered
dose is also shown in Figure 35. In general the differences are very small, with nearly all
points less than 1% of the organ volume. The rectum exhibits slightly larger difference
compared to the bladder, especially in mid-dose region. This might be due to the fact
116
that the rectum volume is on average smaller than the bladder volume, causing a larger
relative difference in the rectum by the same absolute dose differences.
Overall the dosimetric verification of the 25 online adapted treatment plans
revealed excellent delivery accuracy. The change to DVHs due to leave motion
inaccuracies presented in this set of plan delivery information is very minimal. This
result, combined with previous results on online fluence monitoring and leaf position
monitoring, confirms the deliverability of automatic online adapted plans to be
acceptable.
5.3.5 Monitoring and verification results with manually introduced MLC errors
Figure 37 shows the impact from MLC position errors on the PTV DVH. The
introduced errors changed PTV DVH significantly only when the errors to both leaf
banks were systematic and of the same sign, e.g. Systematic: 0.5, 0.5. As illustrated in
Figure 33, positive shift of the leaf indicates over-retraction, and negative means over-
extension. If both banks have positive errors, the leaf opening is then larger than
planned, causing the DVH to shift towards higher dose, as seen in Systematic: 0.5, 0.5
and 1, 1; on the contrary, if both leaf banks have negative errors, leaf opening becomes
smaller, and therefore DVH shifts towards the lower dose end, as seen in Systematic: -
0.5, -0.5 and -1, -1. The deviations of DVH with errors are positively correlated with the
magnitude of error introduced: DVH corresponding to 1 mm error is shifted by nearly
twice the amount of the DVH with 0.5 mm error. In cases of only random error present,

117
even with 2 mm standard deviation, the difference in DVH is nearly invisible. These
observations are consistent with previous findings reported in Rangel’s paper. In
addition, if two leaf banks have opposite sign of errors, the associated DVH change to
the PTV is very small and nearly unidentifiable. This can be seen by the overlapping
DVHs with the DVH of original plan.
Figure 37: Variation of PTV DVHs caused by introduced errors to the MLC positions during delivery. The DVHs are labeled as: error type: leading bank error in
mm, trailing bank error in mm.
Similar observation can be made for DVHs of the bladder and the rectum. Only
systematic errors with the same sign for both trailing and leading banks can be
identified as different from the original DVH, and with deviation magnitude
proportional to the error magnitude. Deliveries with opposite-sign errors and random
errors alone are found to have nearly identical DVHs as the original error-free plan.
0
20
40
60
80
100
85 90 95 100 105 110 115
% V
olum
e
% Dose
OriginalSystematic: 0.5, 0.5Systematic: -0.5, -0.5Systematic: 1, 1Systematic: -1, -1Systematic: 0.5, - 0.5Systematic: -0.5, 0.5Systematic: 1, -1Systematic: -1, 1Random: 1Random: 2

118
Figure 38: Variation of bladder DVH (top) and rectum DVH (bottom) caused by introduced errors to the MLC position. The DVHs are labeled as: error type:
leading bank error in mm, trailing bank error in mm.
Figure 39 shows the fluence error maps generated by the online monitoring
module, as introduced in Figure 28, for various erroneous deliveries of the same beam.
0
20
40
60
80
100
0 20 40 60 80 100
% V
olum
e
% Dose
OriginalSystematic: 0.5, 0.5Systematic: -0.5, -0.5Systematic: 1, 1Systematic: -1, -1Systematic: 0.5, - 0.5Systematic: -0.5, 0.5Systematic: 1, -1Systematic: -1, 1Random: 1Random: 2
0
20
40
60
80
100
0 20 40 60 80 100
% V
olum
e
% Dose
OriginalSystematic: 0.5, 0.5Systematic: -0.5, -0.5Systematic: 1, 1Systematic: -1, -1Systematic: 0.5, - 0.5Systematic: -0.5, 0.5Systematic: 1, -1Systematic: -1, 1Random: 1Random: 2
Rectum
Bladder

119
The center image corresponds to error-free delivery, and the outer images correspond to
deliveries with manually introduced systematic errors of different magnitude and signs,
as shown by dashed lines on the axes. In this case, 0.5 MU is selected as the error display
threshold: pixels are labeled red if their fluences are at least 0.5 MU hotter than expected
and blue if at least 0.5 MU colder. The numbers in the lower left corner of each fluence
error map indicate the percentage of pixels with absolute error larger than 0.5 MU. For
cases with same-sign errors for both leaf banks, only one color is seen in the error map:
all red if both errors are positive, i.e. both banks are over-retracted, or all blue if both
errors are negative, i.e. both banks are over-extended. If both banks are over-retracted,
the leaf-opening will be consistently larger than expected at each segment, causing
globally hotter fluence map; and if both banks are over-extended, consistently smaller
leaf openings will cause globally colder fluence. These findings are also consistent with
dosimetric verification results shown in Figure 37.
For cases with opposite-sign errors, their fluence error maps show distinct
feature corresponding to the sign of each leaf bank. If leading leaf bank has positive
error and trailing bank has negative error, the fluence error map is colder on the left and
hotter on the right; if leading bank has negative errors and trailing bank positive, the
fluence error map exhibit the opposite pattern: hotter pixels on the left and colder on the
right. In addition, percentage of failed pixels is positively correlated with the error
amount, even with opposite-sign errors.

120
Figure 39: Fluence error maps generated by online monitoring module for both error-free delivery (center) and deliveries with introduced systematic errors. Red
indicates the pixel fluence at least 0.5 MU hotter than expected; and blue indicate at least 0.5 MU colder. The numbers at the lower left corner of each fluence error map
show the percentage of pixels with error larger than 0.5 MU. Notice the distinct error patterns and percentage for each error introduced.
The distinct features that online fluence monitoring results exhibit when
processing delivery record with different errors indicates its excellent specificity in
differentiating leaf error directions and magnitude. As shown above, such feature is
generally not available in regular IMRT QA and retrospective dose reconstruction with
DMI record. The unique information provided by the online monitoring module will
offer additional and valuable guidance to MLC performance evaluation and fault
diagnosis. Although leaf position error histogram can also indicate the general
0.5 1 mm
Leading Bank Error
-0.5-1
0.5
1
-0.5
-1
Trailing Bank Errormm
95.5
99.3
68.9
77.5
67.7
77.5
95.1
98.8

121
distribution of errors, it does not provide information for individual leaf or as intuitive
as fluence error map in terms of the actual impact from leaf position errors.
5.3.6 Understanding the fluence error pattern.
This section discusses how the fluence error maps shown in Figure 31 are
resulted from leaf position errors in Figure 34. As discussed in the previous section, both
leaf banks exhibits slight delays in arriving at expected positions at control points. Such
delay is the main source of leaf position errors, and therefore is hypothesized to have
strong connection with the fluence errors that are seen in Figure 31.
Figure 40: Example of a fluence error map generated by the online monitoring module. Notice the typical hotter left edge and colder right edge that is generally
observed for most fluence maps tested.
Figure 40 is an example case of the typical fluence error map. As seen in Figure
31, majority of the fluence maps have hotter edge on the left and colder edge on the
right. The corresponding leaf lag for this particular field is visualized in Figure 41. As
-0.1
0
0.1
0.2
0.3
0.4
0.5
0.6
MU

122
expected, majority of leaf position errors are negative, as seen by blue color. The leading
leaf exhibits in general less error, with relatively large errors concentrated around
control point #40. Majority of the rest of control points have negative errors around 0.1
mm. When a leading leaf experience negative position errors, or delays, it blocks pixels
for a longer time, and therefore effectively reduces the MU a certain pixel receives. The
trailing leaf exhibits generally higher delays compared to the leading leaf. During the
first 60 control points, trailing leaf is constantly behind expected position by 0.1~0.4 mm,
and starting from the 70th control points, the magnitude of trailing leaf delay increases to
0.3~0.5 mm. Delayed movements of trailing leaf causes pixels to be exposed in the
radiation field for a longer time, and therefore increases the MU that pixels receive.
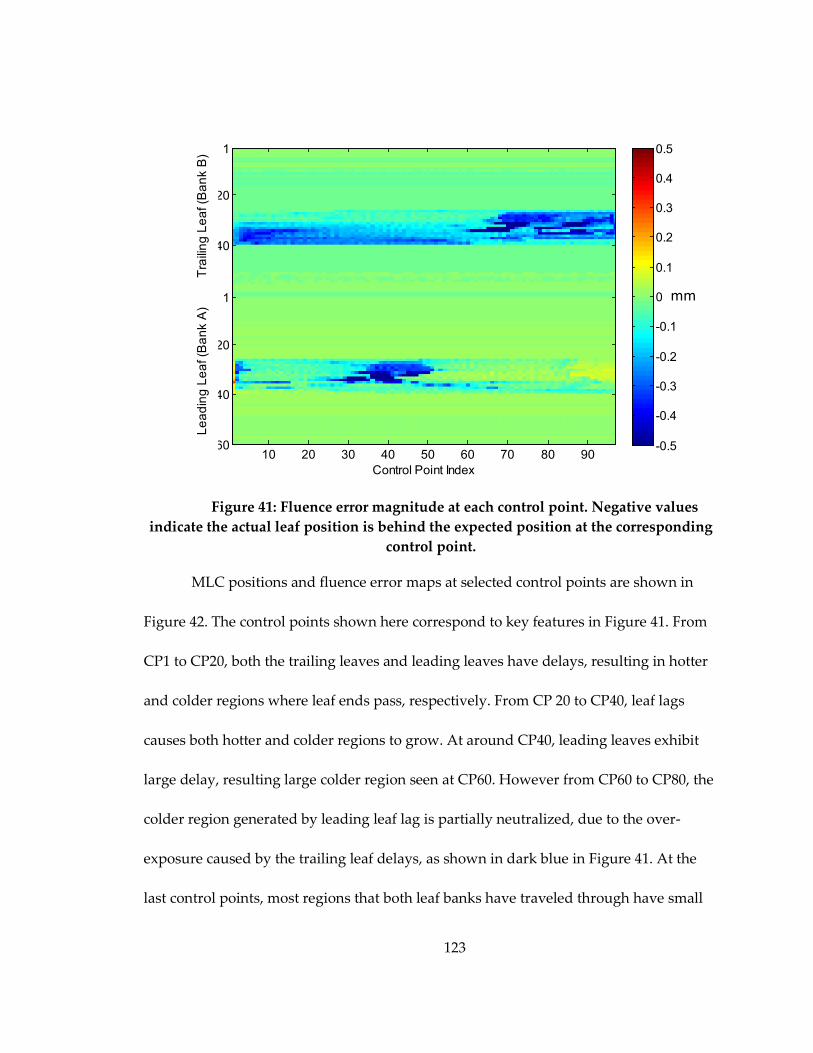
123
Figure 41: Fluence error magnitude at each control point. Negative values indicate the actual leaf position is behind the expected position at the corresponding
control point.
MLC positions and fluence error maps at selected control points are shown in
Figure 42. The control points shown here correspond to key features in Figure 41. From
CP1 to CP20, both the trailing leaves and leading leaves have delays, resulting in hotter
and colder regions where leaf ends pass, respectively. From CP 20 to CP40, leaf lags
causes both hotter and colder regions to grow. At around CP40, leading leaves exhibit
large delay, resulting large colder region seen at CP60. However from CP60 to CP80, the
colder region generated by leading leaf lag is partially neutralized, due to the over-
exposure caused by the trailing leaf delays, as shown in dark blue in Figure 41. At the
last control points, most regions that both leaf banks have traveled through have small
mm
Control Point Index
10 20 30 40 50 60 70 80 90
1
20
40
1
20
40
60 -0.5
-0.4
-0.3
-0.2
-0.1
0
0.1
0.2
0.3
0.4
0.5
Lead
ing
Leaf
(Ban
k A
)
T
railin
g Le
af (B
ank
B)

124
scattered random errors, whereas regions that are only affected by one leaf bank exhibit
predominantly one side error: regions affected only by leading leaves are colder, and
those affected only by trailing leaves are hotter. The common pattern seen in Figure 31,
hotter on the left and colder on the right, is therefore caused by delays of both leaf
banks; the low-error middle ground results from error-cancellation from two leaf banks.
Figure 42: MLC positions and fluence error maps at selected control points (CPs) for an example case. The fluence error map threshold is set to a low value of 0.1
MU for better illustration.
Another observation that can be made from Figure 41 is the non-uniform error
magnitude: larger error occurred at CP60 – CP97 for trailing leaf bank, and CP30 – CP50
for leading leaf bank. The increased magnitude of error is caused by higher leaf speed
CP #1 CP #20 CP #40
CP #60 CP #80 CP #97
Segment
Fluence Error Map

125
requirement at those control points range. Figure 43 shows the leaf speed map of the
same beam in Figure 41. The leaf speed is calculated from the control point positions and
MUs in the treatment plan, and can therefore be considered as the leaf speed
requirement that the treatment plan has for the machine. It can be clearly seen that
Figure 41 is highly correlated to Figure 43: CP ranges that have larger errors coincide
with higher leaf speed. In other words, in regions where higher speed is required, it is
more difficult for leaves to meet the requirement; and consequently larger delays occur.
Figure 43: Leaf speed at each control points calculated from the treatment plan for an example case.
5.3.7 Limitations and further discussions
The current implementation of online monitoring relies on the input of DMI.
Therefore the accuracy of the monitoring system is directly dependent on the accuracy
Control Point Index
Lead
ing
Leaf
(Ban
k A
)
T
railin
g Le
af (B
ank
B)
10 20 30 40 50 60 70 80 90
20
40
60
20
40
60
0.2
0.4
0.6
0.8
1
1.2
1.4
1.6
cm/s

126
of parameters in DMI, most importantly leaf position measurement. The leaf position in
DMI is measured by the MLC controller using motor counts, which is then converted to
millimeter per MLC specifications. The motor counts are zeroed at the time of MLC
initialization with the leaf fully retracted(2011). Therefore accurate leaf initialization and
alignment is the key to the accuracy of DMI, and subsequently the monitoring system. If
the reported MLC position is deviated from the actual position due to initialization
inaccuracies, the accuracy of the monitoring system is affected.
In this proof of concept study, the real-time fluence map calculation does not
consider leaf transmission, leaf leakage or the leaf-end penumbra, but uses a simple ray-
tracing-like algorithm. This method is chosen to reduce the calculation time, so that the
fluence map can be updated before the arrival of the next DMI snapshot. Since both the
expected and actual fluence maps are calculated using the same algorithm, i.e. with the
same level of simplification, the inaccuracy associated with omitting these parameters
exits in both the expected and actual fluence, minimizing its impact on the fluence error
map. In addition, because the additional physical parameters act as blurring kernels to
the calculated fluence map, omitting them exaggerates the effects of leaf position errors,
making the error detection and analysis more sensitive. In future with faster
implementation of the system, these physical parameters could be added into the
calculation algorithm, and generate more realistic fluence maps. But such work is
beyond the scope of this dissertation.

127
Currently the computation time for generating updated fluence map is less than
2 ms. However, more time is needed to update the graphical display in MATLAB. Up to
70 ms latency is observed for the graphics to update after the new fluence map is
calculated. Considering the interval between DMI samples being 50 ms, in order to
achieve a true real-time monitoring, the system needs to finish data pre-processing,
fluence calculation and graphic updating within 50 ms, before the arrival of the next
DMI input. Therefore at the current implementation, the quantitative monitoring is
executed in real-time, but visualization is performed at reduced temporal resolution. A
faster, more optimized implementation can further improve the efficiency of the system,
but is beyond the scope of this study.
The action levels in the current stage of implementation utilize the distribution of
the errors observed in a set of good clinical plans, and are set to signal when an error
larger than 95% of the test cases occurs. This methods is effective in catching large errors,
but is based on limited test case samples. In addition, since the threshold is derived from
the fully delivered fluence map, and fluence error occurred earlier in the process of
delivery can be washed out later, the system may signal warning during delivery but the
final fluence map error may drops to be within the threshold. In such case a false
positive occurs. This behavior of the system lowers its specificity, but ensures a high
sensitivity in detecting large errors and warning the user. To develop better action levels,
a systematic ROC analysis on the fluence map error magnitude/percentage and its

128
dosimetric impact is required with larger patient sample. It also needs to take into
consideration the clinical flow. The proposed system allows user to manually set
threshold for both the magnitude and percentage threshold for the warning action, and
is therefore flexible to accommodate different needs.
The results presented here are based on Varian Linear Accelerator, MLC and
Eclipse™ treatment planning system. However the concept can be applied to other
vendors’ hardware and software platforms as well. Tyagi et al. reported a real time dose
monitoring and reconstruction tool using Elekta platform(Tyagi et al., 2012),
demonstrating the possibility of using DMI-based fluence monitoring on online adapted
IMRT plans on Elekta machines.
5.4 Conclusion
Pre-clinical validation indicates that the patient specific QA pass rate of online
automatically re-optimized plans is similar to that of the original plans, and is in general
high among regular IMRT plans. The online fluence and leaf position monitoring tool
show very small discrepancies between planned and actually delivered parameters. Off-
line dosimetric verification on online adapted plans indicates excellent agreement
between planned dose and reconstructed actual dose. Utilizing online monitoring tools
on deliveries with manually introduced errors shows that the system is capable of
identifying MLC error types that is not discoverable in dosimetric analysis. Overall,
combining pre-clinical validation, online monitoring and off-line verification, the

129
proposed system is an excellent candidate for treatment QA of online automatically re-
optimized plans, where pre-treatment patient specific QA is not practical.

130
6. Summary This project focused on pushing the online adaptive radiation therapy technique
for prostate cancer towards the clinical implementation by addressing two most
important challenges: efficiency and quality assurance. The first two steps of this project
addressed the efficiency challenge, and the third step focused on quality assurance (QA).
The first step answers the questions of how often should online re-optimization
be used. The hypothesis was that with novel methods of combining re-optimization with
re-positioning, the necessary re-optimization frequency could be reduced while
maintaining similar target coverage as if re-optimization were performed for every
fraction. To achieve this goal, an evidence-based decision making scheme, named
AIGRT, was developed to determine if daily re-optimization is necessary, and the
concept of re-using previously available plans was implemented using a patient plan
database. The results show that under this scheme, consistent and complete daily target
coverage and reduced dose to adjacent healthy organs can be achieved at the same time
with significantly reduced re-optimization frequency. Therefore the proposed scheme is
an excellent candidate to manage the integration of online re-optimization with current
IGRT technique.
The second step addressed how the re-optimizations should be performed in an
efficient way. The hypotheses were that the daily target coverage can be retained with ~2
min automatic re-optimization on the daily structure set, and that objectives with
131
patient-specific and daily anatomy information provide better guidance for the
optimizer. To verify these hypotheses, a systematic planning study was performed with
varying planning input parameters in terms of DVH objectives, starting stages and
iteration number. The findings indicate that the online re-optimizations provide reliable
target coverage. Using original CT’s DVH as objective provides good guidance for most
of the plans, but for cases with significantly changed OAR volume, objectives
incorporating the anatomy-of-the-day offer extra benefit. Staring the re-optimization
with original fluence offers some saving in the mid-dose region of OARs, but
substantially decreases the plan delivery efficiency. The difference between running the
automatic re-optimization for 50 and 100 iterations is generally small. Based on these
findings, the clinical team can then make informed decision on which optimization
parameter sets to use for online re-optimization on the case-by-case basis.
Another important challenge for the clinical implementation of online ART is the
quality assurance of re-optimized plans, which is addressed in the third step of this
project. For this part, the hypotheses were (1) the deliverability of online automatically
re-optimized plans are similar to regular IMRT plans using current quality assurance
standard; and (2) the delivery process can be effectively monitored by utilizing dynamic
machine information. To verify the 1st hypothesis, the online automatically re-optimized
plans were subject to the same QA standard used currently for clinical IMRT plans, and
were found to have similar QA pass rates to the original CT plans and regular IMRT

132
plans. To provide online QA on delivery accuracy for online re-optimized plans, a three-
level delivery monitoring system was developed to take dynamic machine information
as inputs, and perform real-time fluence monitoring, leaf position monitoring and post-
treatment dosimetric verification. Applying this QA system to the online re-optimized
plans demonstrated excellent delivery accuracy, and provided the baseline action
threshold. Applying this QA system to plans with manually introduced errors showed
that the system has good sensitivity in detecting MLC motion errors, and excellent
specificity in determining the underlying error types.
The three steps together provide substantial contribution to addressing the two
most important challenges for clinical implementation of online ART – efficiency and
QA. The concepts and techniques developed in this project, as well as understandings
gained from the results, add valuable knowledge to the online ART research and helpful
guidance towards the clinical implementation of online adaptive radiation therapy for
prostate cancer.
133
References 2011 Millennium MLC System and Maintenance Guide. (Palo Alto, CA: Varian Medical
Systems, Inc.)
Agnew C E, King R B, Hounsell A R and McGarry C K 2012 Implementation of phantom-less IMRT delivery verification using Varian DynaLog files and R/V output Phys Med Biol 57 6761-77
Ahunbay E E, Peng C, Chen G P, Narayanan S, Yu C, Lawton C and Li X A 2008 An on-line replanning scheme for interfractional variations Med Phys 35 3607-15
Ahunbay E E, Peng C, Holmes S, Godley A, Lawton C and Li X A 2010a Online Adaptive Replanning Method for Prostate Radiotherapy International journal of radiation oncology, biology, physics
Ahunbay E E, Peng C, Holmes S, Godley A, Lawton C and Li X A 2010b Online Adaptive Replanning Method for Prostate Radiotherapy Int J Radiat Oncol Biol Phys 77 1561-72
Barney B M, Lee R J, Handrahan D, Welsh K T, Cook J T and Sause W T 2010 Image-Guided Radiotherapy (IGRT) for Prostate Cancer Comparing kV Imaging of Fiducial Markers With Cone Beam Computed Tomography (CBCT) International journal of radiation oncology, biology, physics
Birkner M, Yan D, Alber M, Liang J and Nusslin F 2003 Adapting inverse planning to patient and organ geometrical variation: algorithm and implementation Med Phys 30 2822-31
Boggula R, Jahnke L, Wertz H, Lohr F and Wenz F 2011 Patient-specific 3D pretreatment and potential 3D online dose verification of Monte Carlo-calculated IMRT prostate treatment plans International journal of radiation oncology, biology, physics 81 1168-75
134
Brabbins D S, Kestin L, Yan D, McGrath S, Vicini F, Gustafson G, Chen P, Wong J W, Edmundson G and Martinez A 2008 Improvement in Clinical Outcomes with Prostate Radiotherapy at a Single Institution in the PSA Era International Journal of Radiation Oncology*Biology*Physics 72 S318-S9
Cao Y, Popovtzer A, Li D, Chepeha D B, Moyer J S, Prince M E, Worden F, Teknos T, Bradford C, Mukherji S K and Eisbruch A 2008 Early prediction of outcome in advanced head-and-neck cancer based on tumor blood volume alterations during therapy: a prospective study International journal of radiation oncology, biology, physics 72 1287-90
Cho B, Poulsen P R, Sloutsky A, Sawant A and Keall P J 2009 First demonstration of combined kV/MV image-guided real-time dynamic multileaf-collimator target tracking International journal of radiation oncology, biology, physics 74 859-67
Chung P W, Haycocks T, Brown T, Cambridge Z, Kelly V, Alasti H, Jaffray D A and Catton C N 2004 On-line aSi portal imaging of implanted fiducial markers for the reduction of interfraction error during conformal radiotherapy of prostate carcinoma International journal of radiation oncology, biology, physics 60 329-34
Coselmon M M, Balter J M, McShan D L and Kessler M L 2004 Mutual information based CT registration of the lung at exhale and inhale breathing states using thin-plate splines Med Phys 31 2942-8
Court L, Rosen I, Mohan R and Dong L 2003 Evaluation of mechanical precision and alignment uncertainties for an integrated CT/LINAC system Med Phys 30 1198-210
Court L E and Dong L 2003 Automatic registration of the prostate for computed-tomography-guided radiotherapy Med Phys 30 2750-7
Court L E, Dong L, Lee A K, Cheung R, Bonnen M D, O'Daniel J, Wang H, Mohan R and Kuban D 2005a An automatic CT-guided adaptive radiation therapy technique by online modification of multileaf collimator leaf positions for prostate cancer International journal of radiation oncology, biology, physics 62 154-63

135
Court L E, Dong L, Lee A K, Cheung R, Bonnen M D, O'Daniel J, Wang H, Mohan R and Kuban D 2005b An automatic CT-guided adaptive radiation therapy technique by online modification of multileaf collimator leaf positions for prostate cancer Int J Radiat Oncol Biol Phys 62 154-63
Court L E, Tishler R B, Petit J, Cormack R and Chin L 2006 Automatic online adaptive radiation therapy techniques for targets with significant shape change: a feasibility study Phys Med Biol 51 2493-501
Craciunescu O I, Blackwell K L, Jones E L, Macfall J R, Yu D, Vujaskovic Z, Wong T Z, Liotcheva V, Rosen E L, Prosnitz L R, Samulski T V and Dewhirst M W 2009 DCE-MRI parameters have potential to predict response of locally advanced breast cancer patients to neoadjuvant chemotherapy and hyperthermia: a pilot study Int J Hyperthermia 25 405-15
de la Zerda A, Armbruster B and Xing L 2007 Formulating adaptive radiation therapy (ART) treatment planning into a closed-loop control framework Phys Med Biol 52 4137-53
Dimopoulos J C, Schirl G, Baldinger A, Helbich T H and Potter R 2009 MRI assessment of cervical cancer for adaptive radiotherapy Strahlenther Onkol 185 282-7
Dinesh Kumar M, Thirumavalavan N, Venugopal Krishna D and Babaiah M 2006 QA of intensity-modulated beams using dynamic MLC log files Journal of medical physics / Association of Medical Physicists of India 31 36-41
Fallone B G, Murray B, Rathee S, Stanescu T, Steciw S, Vidakovic S, Blosser E and Tymofichuk D 2009 First MR images obtained during megavoltage photon irradiation from a prototype integrated linac-MR system Med Phys 36 2084-8
Feng Y, Castro-Pareja C, Shekhar R and Yu C 2006 Direct aperture deformation: an interfraction image guidance strategy Med Phys 33 4490-8
Fogliata A, Nicolini G, Alber M, Asell M, Clivio A, Dobler B, Larsson M, Lohr F, Lorenz F, Muzik J, Polednik M, Vanetti E, Wolff D, Wyttenbach R and Cozzi L 2007 On

136
the performances of different IMRT Treatment Planning Systems for selected paediatric cases Radiat Oncol 2 7
Fu W, Yang Y, Yue N J, Heron D E and Huq M S 2009 A cone beam CT-guided online plan modification technique to correct interfractional anatomic changes for prostate cancer IMRT treatment Phys Med Biol 54 1691-703
Geets X, Tomsej M, Lee J A, Duprez T, Coche E, Cosnard G, Lonneux M and Gregoire V 2007 Adaptive biological image-guided IMRT with anatomic and functional imaging in pharyngo-laryngeal tumors: impact on target volume delineation and dose distribution using helical tomotherapy Radiother Oncol 85 105-15
Ghilezan M, Yan D and Martinez A 2008 Image-guided Radiation Therapy of Prostate Cancer, ed R K Valicenti, et al. (New York, NY: Information Healthcare)
Ghilezan M, Yan D and Martinez A 2010 Adaptive radiation therapy for prostate cancer Semin Radiat Oncol 20 130-7
Gu X, Pan H, Liang Y, Castillo R, Yang D, Choi D, Castillo E, Majumdar A, Guerrero T and Jiang S B 2010 Implementation and evaluation of various demons deformable image registration algorithms on a GPU Phys Med Biol 55 207-19
Harsolia A, Vargas C, Yan D, Brabbins D, Lockman D, Liang J, Gustafson G, Vicini F, Martinez A and Kestin L L 2007 Predictors for chronic urinary toxicity after the treatment of prostate cancer with adaptive three-dimensional conformal radiotherapy: dose-volume analysis of a phase II dose-escalation study International journal of radiation oncology, biology, physics 69 1100-9
Hoogeman M S, van Herk M, de Bois J and Lebesque J V 2005 Strategies to reduce the systematic error due to tumor and rectum motion in radiotherapy of prostate cancer Radiother Oncol 74 177-85
ICRU-50 1993 Prescribing, recording and reporting photon beam therapy. (Bethesda, MD, USA: International Commission on Radiation Units and Measurements)
137
Jaffray D A, Lindsay P E, Brock K K, Deasy J O and Tome W A 2010 Accurate accumulation of dose for improved understanding of radiation effects in normal tissue International journal of radiation oncology, biology, physics 76 S135-9
Jaffray D A, Siewerdsen J H, Wong J W and Martinez A A 2002 Flat-panel cone-beam computed tomography for image-guided radiation therapy International journal of radiation oncology, biology, physics 53 1337-49
Kashani R, Hub M, Balter J M, Kessler M L, Dong L, Zhang L, Xing L, Xie Y, Hawkes D, Schnabel J A, McClelland J, Joshi S, Chen Q and Lu W 2008 Objective assessment of deformable image registration in radiotherapy: a multi-institution study Med Phys 35 5944-53
King C R, Brooks J D, Gill H, Pawlicki T, Cotrutz C and Presti J C, Jr. 2009 Stereotactic body radiotherapy for localized prostate cancer: interim results of a prospective phase II clinical trial International journal of radiation oncology, biology, physics 73 1043-8
Kuriyama K, Onishi H, Sano N, Komiyama T, Aikawa Y, Tateda Y, Araki T and Uematsu M 2003 A new irradiation unit constructed of self-moving gantry-CT and linac International journal of radiation oncology, biology, physics 55 428-35
Langen K M, Zhang Y, Andrews R D, Hurley M E, Meeks S L, Poole D O, Willoughby T R and Kupelian P A 2005 Initial experience with megavoltage (MV) CT guidance for daily prostate alignments International journal of radiation oncology, biology, physics 62 1517-24
Lee L, Le Q T and Xing L 2008a Retrospective IMRT dose reconstruction based on cone-beam CT and MLC log-file International journal of radiation oncology, biology, physics 70 634-44
Lee L, Mao W and Xing L 2008b The use of EPID-measured leaf sequence files for IMRT dose reconstruction in adaptive radiation therapy Med Phys 35 5019-29
138
Lee W R 2009 Extreme hypofractionation for prostate cancer Expert Rev Anticancer Ther 9 61-5
Lei Y and Wu Q 2010 A hybrid strategy of offline adaptive planning and online image guidance for prostate cancer radiotherapy Phys Med Biol 55 2221-34
Li T, Thongphiew D, Zhu X, Lee W R, Vujaskovic Z, Yin F F and Wu Q J 2011 Adaptive prostate IGRT combining online re-optimization and re-positioning: a feasibility study Phys Med Biol 56 1243-58
Li T, Wu Q, Yuan L, Yin F and Lee W 2012a Prostate SBRT in 5 Fractions: Initial Report on Dosimetric Results and IGRT Experiences International journal of radiation oncology, biology, physics 84 S815
Li T, Yuan L, Wu Q, Yin F and Wu Q J 2012b MO-D-BRB-09: Treatment Delivery QA for Online Adaptive Radiation Therapy Based on Dynamic Machine Information (DMI): A Feasibility Study. AAPM) pp 3867-8
Liang J, Wu Q and Yan D 2009 The role of seminal vesicle motion in target margin assessment for online image-guided radiotherapy for prostate cancer International journal of radiation oncology, biology, physics 73 935-43
Liu H and Wu Q 2011 Dosimetric and geometric evaluation of a hybrid strategy of offline adaptive planning and online image guidance for prostate cancer radiotherapy Phys Med Biol 56 5045-62
Low D A, Harms W B, Mutic S and Purdy J A 1998 A technique for the quantitative evaluation of dose distributions Medical physics 25 656-61
Lu W, Olivera G H, Chen Q, Ruchala K J, Haimerl J, Meeks S L, Langen K M and Kupelian P A 2006 Deformable registration of the planning image (kVCT) and the daily images (MVCT) for adaptive radiation therapy Phys Med Biol 51 4357-74
Mackie T R, Balog J, Ruchala K, Shepard D, Aldridge S, Fitchard E, Reckwerdt P, Olivera G, McNutt T and Mehta M 1999 Tomotherapy Semin Radiat Oncol 9 108-17

139
Madsen B L, Hsi R A, Pham H T, Fowler J F, Esagui L and Corman J 2007 Stereotactic hypofractionated accurate radiotherapy of the prostate (SHARP), 33.5 Gy in five fractions for localized disease: first clinical trial results International journal of radiation oncology, biology, physics 67 1099-105
Mans A, Wendling M, McDermott L N, Sonke J J, Tielenburg R, Vijlbrief R, Mijnheer B, van Herk M and Stroom J C 2010 Catching errors with in vivo EPID dosimetry Medical physics 37 2638-44
Martin J M, Bayley A, Bristow R, Chung P, Crook J, Gospodarowicz M, Milosevic M, McLean M, Warde P and Catton C 2006 A Prospective Study of Hypofractionated Radiotherapy for Localized Prostate Cancer International Journal of Radiation Oncology*Biology*Physics 66 S35-S6
Mayr N A, Wang J Z, Zhang D, Grecula J C, Lo S S, Jaroura D, Montebello J, Zhang H, Li K, Lu L, Huang Z, Fowler J M, Wu D H, Knopp M V and Yuh W T 2010 Longitudinal changes in tumor perfusion pattern during the radiation therapy course and its clinical impact in cervical cancer International journal of radiation oncology, biology, physics 77 502-8
Melancon A D, O'Daniel J C, Zhang L, Kudchadker R J, Kuban D A, Lee A K, Cheung R M, de Crevoisier R, Tucker S L, Newhauser W D, Mohan R and Dong L 2007 Is a 3-mm intrafractional margin sufficient for daily image-guided intensity-modulated radiation therapy of prostate cancer? Radiother Oncol 85 251-9
Men C, Gu X, Choi D, Majumdar A, Zheng Z, Mueller K and Jiang S B 2009 GPU-based ultrafast IMRT plan optimization Phys Med Biol 54 6565-73
Men C, Jia X and Jiang S B 2010 GPU-based ultra-fast direct aperture optimization for online adaptive radiation therapy Phys Med Biol 55 4309-19
Mestrovic A, Nichol A, Clark B G and Otto K 2009 Integration of on-line imaging, plan adaptation and radiation delivery: proof of concept using digital tomosynthesis Phys Med Biol 54 3803-19

140
Michalski J M, Gay H, Jackson A, Tucker S L and Deasy J O 2010 Radiation dose-volume effects in radiation-induced rectal injury International journal of radiation oncology, biology, physics 76 S123-9
Miles E F and Lee W R 2008 Hypofractionation for prostate cancer: a critical review Semin Radiat Oncol 18 41-7
Mohan R, Zhang X, Wang H, Kang Y, Wang X, Liu H, Ang K K, Kuban D and Dong L 2005 Use of deformed intensity distributions for on-line modification of image-guided IMRT to account for interfractional anatomic changes International journal of radiation oncology, biology, physics 61 1258-66
Nelms B E, Robinson G, Markham J, Velasco K, Boyd S, Narayan S, Wheeler J and Sobczak M L 2012 Variation in external beam treatment plan quality: An inter-institutional study of planners and planning systems Practical Radiation Oncology 2 296-305
Nijkamp J, Pos F J, Nuver T T, de Jong R, Remeijer P, Sonke J J and Lebesque J V 2008 Adaptive radiotherapy for prostate cancer using kilovoltage cone-beam computed tomography: first clinical results International journal of radiation oncology, biology, physics 70 75-82
Nuver T T, Hoogeman M S, Remeijer P, van Herk M and Lebesque J V 2007 An adaptive off-line procedure for radiotherapy of prostate cancer International journal of radiation oncology, biology, physics 67 1559-67
O'Daniel J C, Garden A S, Schwartz D L, Wang H, Ang K K, Ahamad A, Rosenthal D I, Morrison W H, Asper J A, Zhang L, Tung S M, Mohan R and Dong L 2007 Parotid gland dose in intensity-modulated radiotherapy for head and neck cancer: is what you plan what you get? International journal of radiation oncology, biology, physics 69 1290-6
Olivera G H, Fitchard E E, Reckwerdt P J, Ruchala K J and Mackie T R 2000 The Use of Computers in Radiation Therapy, ed W Schlegel and T Bortfeld (Heidelberg, Germany: Springer) pp 297-9

141
Papanikolaou N, Battista J J, Boyer A L, Kappas C, Klein E E, Mackie T R, Sharpe M and Dyk J V 2004 Tissue inhomogeneity corrections for megavoltage photon beams. (Madison, WI: AAPM Task Group No. 65 Radiation Therapy Commitee)
Peng C, Chen G, Ahunbay E, Wang D, Lawton C and Li X A 2011 Validation of an online replanning technique for prostate adaptive radiotherapy Physics in medicine and biology 56 3659-68
Pollack A, Hanlon A L, Horwitz E M, Feigenberg S J, Konski A A, Movsas B, Greenberg R E, Uzzo R G, Ma C M, McNeeley S W, Buyyounouski M K and Price R A, Jr. 2006 Dosimetry and preliminary acute toxicity in the first 100 men treated for prostate cancer on a randomized hypofractionation dose escalation trial International journal of radiation oncology, biology, physics 64 518-26
Poppe B, Looe H K, Chofor N, Ruhmann A, Harder D and Willborn K C 2010 Clinical performance of a transmission detector array for the permanent supervision of IMRT deliveries Radiotherapy and oncology : journal of the European Society for Therapeutic Radiology and Oncology 95 158-65
Poulsen P R, Cho B, Sawant A, Ruan D and Keall P J 2010 Detailed analysis of latencies in image-based dynamic MLC tracking Med Phys 37 4998-5005
Qian J, Lee L, Liu W, Chu K, Mok E, Luxton G, Le Q T and Xing L 2010 Dose reconstruction for volumetric modulated arc therapy (VMAT) using cone-beam CT and dynamic log files Physics in medicine and biology 55 3597-610
Rangel A and Dunscombe P 2009 Tolerances on MLC leaf position accuracy for IMRT delivery with a dynamic MLC Med Phys 36 3304-9
Rehbinder H, Forsgren C and Lof J 2004 Adaptive radiation therapy for compensation of errors in patient setup and treatment delivery Med Phys 31 3363-71
Ritter M A, Forman J D, Petereit D G, Kupelian P A, Wang D, Walker W, Fowler J F, Chappell R J and TÃ m W A 2006 Dose-per-Fraction Escalation for Localized

142
Prostate Cancer - A Multi-Institutional Phase I/II Trial International Journal of Radiation Oncology*Biology*Physics 66 S11
Roper J, Bowsher J and Yin F F 2009 On-board SPECT for localizing functional targets: a simulation study Med Phys 36 1727-35
Rosu M, Chetty I J, Balter J M, Kessler M L, McShan D L and Ten Haken R K 2005 Dose reconstruction in deforming lung anatomy: dose grid size effects and clinical implications Med Phys 32 2487-95
RTOG 2012a 0938: A Randomized Phase II Trial Of Hypofractionated Radiotherapy For Favorable Risk Prostate Cancer-RTOG CCOP Study.
RTOG 2012b A Phase III Prospective Randomized Trial of Dose-Escalated Radiotherapy with or without Short-Term Androgen Deprivation Therapy for Patients with Intermediate-Risk Prostate Cancer
Ruchala K J, Olivera G H, Schloesser E A and Mackie T R 1999 Megavoltage CT on a tomotherapy system Phys Med Biol 44 2597-621
Schuetz M, Schmid M P, Potter R, Kommata S, Georg D, Lukic D, Dudczak R, Kletter K, Dimopoulos J, Karanikas G and Bachtiary B 2010 Evaluating repetitive 18F-fluoroazomycin-arabinoside (18FAZA) PET in the setting of MRI guided adaptive radiotherapy in cervical cancer Acta Oncol 49 941-7
Shi W, Li J G, Zlotecki R A, Yeung A, Newlin H, Palta J, Liu C, Chvetsov A V and Olivier K 2011 Evaluation of kV Cone-Beam CT Performance for Prostate IGRT: A Comparison of Automatic Grey-Value Alignment to Implanted Fiducial-Marker Alignment Am J Clin Oncol 34 16-21
Soete G, Arcangeli S, De Meerleer G, Landoni V, Fonteyne V, Arcangeli G, De Neve W and Storme G 2006 Phase II study of a four-week hypofractionated external beam radiotherapy regimen for prostate cancer: report on acute toxicity Radiother Oncol 80 78-81

143
Song W Y, Wong E, Bauman G S, Battista J J and Van Dyk J 2007 Dosimetric evaluation of daily rigid and nonrigid geometric correction strategies during on-line image-guided radiation therapy (IGRT) of prostate cancer Med Phys 34 352-65
Teke T, Bergman A M, Kwa W, Gill B, Duzenli C and Popescu I A 2010 Monte Carlo based, patient-specific RapidArc QA using Linac log files Med Phys 37 116-23
Thongphiew D, Wu Q J, Lee W R, Chankong V, Yoo S, McMahon R and Yin F F 2009 Comparison of online IGRT techniques for prostate IMRT treatment: adaptive vs repositioning correction Med Phys 36 1651-62
Tsuji H, Yanagi T, Ishikawa H, Kamada T, Mizoe J E, Kanai T, Morita S and Tsujii H 2005 Hypofractionated radiotherapy with carbon ion beams for prostate cancer International journal of radiation oncology, biology, physics 63 1153-60
Tyagi N, Yang K, Gersten D and Yan D 2012 A real time dose monitoring and dose reconstruction tool for patient specific VMAT QA and delivery Med Phys 39 7194-204
van Elmpt W J, Nijsten S M, Schiffeleers R F, Dekker A L, Mijnheer B J, Lambin P and Minken A W 2006 A Monte Carlo based three-dimensional dose reconstruction method derived from portal dose images Med Phys 33 2426-34
Vargas C, Yan D, Kestin L L, Krauss D, Lockman D M, Brabbins D S and Martinez A A 2005 Phase II dose escalation study of image-guided adaptive radiotherapy for prostate cancer: use of dose-volume constraints to achieve rectal isotoxicity International journal of radiation oncology, biology, physics 63 141-9
Varian Medical Systems 2008 External Beam Planning Reference Guide
Varian Medical Systems 2011 DynaLog File Viewer Reference Guide
Wang H, Dong L, O'Daniel J, Mohan R, Garden A S, Ang K K, Kuban D A, Bonnen M, Chang J Y and Cheung R 2005 Validation of an accelerated 'demons' algorithm for deformable image registration in radiation therapy Phys Med Biol 50 2887-905

144
Welsh J S, Lock M, Harari P M, Tome W A, Fowler J, Mackie T R, Ritter M, Kapatoes J, Forrest L, Chappell R, Paliwal B and Mehta M P 2006 Clinical implementation of adaptive helical tomotherapy: a unique approach to image-guided intensity modulated radiotherapy Technol Cancer Res Treat 5 465-79
Woodford C, Yartsev S, Dar A R, Bauman G and Van Dyk J 2007 Adaptive radiotherapy planning on decreasing gross tumor volumes as seen on megavoltage computed tomography images International journal of radiation oncology, biology, physics 69 1316-22
Wu C, Jeraj R, Lu W and Mackie T R 2004 Fast treatment plan modification with an over-relaxed Cimmino algorithm Med Phys 31 191-200
Wu C, Jeraj R, Olivera G H and Mackie T R 2002 Re-optimization in adaptive radiotherapy Phys Med Biol 47 3181-95
Wu Q, Ivaldi G, Liang J, Lockman D, Yan D and Martinez A 2006a Geometric and dosimetric evaluations of an online image-guidance strategy for 3D-CRT of prostate cancer International journal of radiation oncology, biology, physics 64 1596-609
Wu Q, Liang J and Yan D 2006b Application of dose compensation in image-guided radiotherapy of prostate cancer Phys Med Biol 51 1405-19
Wu Q J, Thongphiew D, Wang Z, Mathayomchan B, Chankong V, Yoo S, Lee W R and Yin F F 2008 On-line re-optimization of prostate IMRT plans for adaptive radiation therapy Phys Med Biol 53 673-91
Xia P, Qi P, Hwang A, Kinsey E, Pouliot J and Roach M, 3rd 2010 Comparison of three strategies in management of independent movement of the prostate and pelvic lymph nodes Med Phys 37 5006-13
Yan D 2010 Adaptive radiotherapy: merging principle into clinical practice Semin Radiat Oncol 20 79-83

145
Yan D, Birkner M, Nuesslin F, Wong J and Martinez A 2001 Improvement in dose escalation using off-line & on-line image feedback in the intensity modulated beam design for prostate cancer treatment International Journal of Radiation Oncology*Biology*Physics 51 91-2
Yan D, Jaffray D A and Wong J W 1999 A model to accumulate fractionated dose in a deforming organ International journal of radiation oncology, biology, physics 44 665-75
Yan D, Lockman D, Brabbins D, Tyburski L and Martinez A 2000 An off-line strategy for constructing a patient-specific planning target volume in adaptive treatment process for prostate cancer Int J Radiat Oncol Biol Phys 48 289-302
Yan D, Vicini F, Wong J and Martinez A 1997 Adaptive radiation therapy Phys Med Biol 42 123-32
Yang Y, Schreibmann E, Li T, Wang C and Xing L 2007 Evaluation of on-board kV cone beam CT (CBCT)-based dose calculation Phys Med Biol 52 685-705
Yoo D S, Wong T Z and Brizel D M 2010 The role of adaptive and functional imaging modalities in radiation therapy: approach and application from a radiation oncology perspective Semin Ultrasound CT MR 31 444-61
Yoo S and Yin F F 2006 Dosimetric feasibility of cone-beam CT-based treatment planning compared to CT-based treatment planning International journal of radiation oncology, biology, physics 66 1553-61
Zhu X, Ge Y, Li T, Thongphiew D, Yin F F and Wu Q J 2011 A planning quality evaluation tool for prostate adaptive IMRT based on machine learning Med Phys 38 719-26

146
Biography EDUCATION Duke University Medical Center Durham, NC, U.S.A Ph.D. in Medical Physics Expected 05/2013 Nanjing University, Kuang Yaming Honors School Nanjing, China B.S. in Physics 06/2008 Department of Physics, Hong Kong University of Science and Technology Hong Kong Academic Exchange 09/2007 – 12/2007
HONORS AND AWARDS
• Roberts Prize Shortlist for the best paper published in 2011 (7 papers selected internationally), Phys. Med. Biol. 56 1243 08/2012
• Physics in Medicine and Biology Highlights of 2011 (25 papers awarded internationally):T Li, D Thongphiew, X Zhu, WR Lee, Z Vujaskovic, FF Yin, and QJ Wu, Adaptive prostate IGRT combining online re-optimization and re-positioning: a feasibility study 02/2012
• Annual Award for Excellence in Research (one per year), Duke University Medical Physics Program 05/2012
• Outstanding poster presentation award 2nd place for posted titled “37Gy/5-fraction Prostate SBRT: Initial Report on IMRT/IGRT Results” by T Li, QJ Wu, L Yuan, FF Yin and W R Lee. 5th Annual North Carolina IMRT/IGRT Symposium, Durham, NC. 05/2012
• Featured Article, Physics in Medicine and Biology, T Li, D Thongphiew, X Zhu, WR Lee, Z Vujaskovic, FF Yin, and QJ Wu, Adaptive prostate IGRT combining online re-optimization and re-positioning: a feasibility study 02/2011
• North American Chinese Medical Physicists Association Traveling Award, The Great Wall 2010 International Congress on Medical Physics, 08/2010
• Citizens Advisory Council Outstanding Poster Award, Duke Comprehensive Cancer Center Annual Meeting, 10/2009
• Magna Cum Laude, Nanjing University 06/2008 • 1st Class National Scholarship, Ministry of Education of China, 10/2007 • Scholarship of National Personnel Training Foundation in Fundamental Sciences,
Nanjing Univ. 06/2006

147
PUBLICATIONS AND MANUSCRIPTS
Taoran Li, Qiuwen Wu, You Zhang, Irina Vergalasova, W Robert Lee, Fang-Fang Yin and Q. Jackie Wu, Strategies for Automatic Online Treatment Plan Re-Optimization Using Clinical Treatment Planning System, under review for Medical Physics (2012).
Q. Jackie Wu, Taoran Li, Lulin Yuan, Fang-Fang Yin and W. Robert Lee, Prostate SBRT in Five Fractions: 2-Year Clinical Trial Protocol Review and Analysis on Dosimetry and IGRT, under review for Radiotherapy & Oncology (2012).
Q. Jackie Wu, Taoran Li, Qiuwen Wu and Fang-Fang Yin, Adaptive radiation therapy: technical components and clinical applications, Cancer J 17 182-9 (2011)
Taoran Li, Danthai Thongphiew, Xiaofeng Zhu, W. Robert Lee, Zeljko Vujaskovic, Fang-Fang Yin, and Q. Jackie Wu, Adaptive prostate IGRT combining online re-optimization and re-positioning: a feasibility study, Phys. Med. Biol. 56 1243 (2011) (PMB 25 Highlights of 2011, Featured Article)
Xiaofeng Zhu, Yaorong Ge, Taoran Li, Danthai Thongphiew, Fang-Fang Yin, and Q. Jackie Wu, A planning quality evaluation tool for prostate adaptive IMRT based on machine learning, Med. Phys. 38, 719 (2011)
Taoran Li, Xiaofeng Zhu, Danthai Thongphiew, W. Robert Lee, Zeljko Vujaskovic, Qiuwen Wu, Fang-Fang Yin, and Q. Jackie Wu, On-line Adaptive Radiation Therapy (ART): Feasibility And Clinical Study, Journal of Oncology, vol. 2011
Xiaofeng Zhu, Danthai Thongphiew, Ryan McMahon, Taoran Li, Vira Chankong, Fang-Fang Yin, Q. Jackie Wu, Arc-modulated radiation therapy based on linear models, Phys Med Biol. 2010 Jul 7;55(13):3873-83.
CONFERENCE PRESENTATIONS (* indicates oral presentation) Taoran Li, Q. Jackie Wu, Lulin Yuan, Fang-Fang Yin and W. Robert Lee, Prostate
SBRT in Five Fractions: Initial Report on Dosimetric Results and IGRT Experiences, ASTRO Annual Meeting 2012, Boston, MA
Taoran Li*, Lulin Yuan, Qiuwen Wu, Fang-Fang Yin and Q. Jackie Wu, Treatment Delivery QA for Online Adaptive Radiation Therapy Based on Dynamic Machine Information (DMI): A Feasibility Study, AAPM Annual Meeting 2012, Charlotte, NC.

148
Taoran Li, Lulin Yuan, W. Robert Lee, Fang-Fang Yin and Q. Jackie Wu, Online Image-Guidance for Prostate SBRT: Dosimetric Benefits and Margin Analysis. AAPM Annual Meeting 2012, Charlotte, NC.
Lulin Yuan*, Yaorong Ge, Taoran Li, Fang-Fang Yin, Q Jackie Wu, Modeling Inter-Patient Variation of Organ-At-Risk Sparing in IMRT Plans: An Evidence-Based Plan Quality Evaluation. AAPM Annual Meeting 2012, Charlotte, NC.
Lulin Yuan, Yaorong Ge, Taoran Li, Fang-Fang Yin, Q Jackie Wu, Individualized Trade-Off of Dose Coverage and Sparing in IMRT Planning. AAPM Annual Meeting 2012, Charlotte, NC.
Taoran Li, Q. Jackie Wu, Lulin Yuan, Fang-Fang Yin and W. Robert Lee, 37Gy/5-fraction Prostate SBRT: Initial Report on IMRT/IGRT Results, 5th Annual North Carolina IMRT/IGRT Symposium, Durham, NC, 2012
Taoran Li*, You Zhang, Qiuwen Wu, Lulin Yuan, Fang-Fang Yin, Q. Jackie Wu, Strategies for Online Plan Re-optimization: Objective Settings and Starting Stage, Oral Presentation, AAPM Annual Meeting 2011, Vancouver, BC, Canada
Lulin Yuan*, Yaorong Ge, Taoran Li, Xiaofeng, , Fang-Fang Yin, Q. Jackie Wu, Modeling the Correlation between OAR Dose Sparing and Patient's Anatomy in Head and Neck IMRT, AAPM Annual Meeting 2011, Vancouver, BC, Canada
Taoran Li*, Danthai Thongphiew, Xiaofeng Zhu, Fang-Fang Yin, Q. Jackie Wu, Online Adaptive Image-Guided Radiation Therapy (AIGRT): Feasibility, Dosimetric Benefits and Efficiency, The Great Wall 2010 International Congress on Medical Physics, 08/2010.
Taoran Li*, Danthai Thongphiew, Xiaofeng Zhu, Fang-Fang Yin, Q. Jackie Wu, Adaptive Image-Guided Radiation Therapy (AIGRT) for Hypo-Fractionated Prostate Cancer Treatment, Oral Presentation, AAPM Annual Meeting 2010, Philadelphia, PA
Xiaofeng Zhu*, Taoran Li, Danthai Thongphiew, Yaorong Ge, Fang-Fang Yin, Q. Jackie Wu, A Planning Quality Evaluation Tool for Adaptive IMRT Treatment Based On Machine Learning, AAPM Annual Meeting 2010, Philadelphia, PA
Xiaofeng Zhu*, Danthai Thongphiew, Ryan McMahon, Taoran Li, Vira Chankong, Fang-Fang Yin, Q. Jackie Wu, Arc Modulated Radiation Therapy Based On Linear Models, AAPM Annual Meeting 2010, Philadelphia, PA
Taoran Li, Danthai Thongphiew, Xiaofeng Zhu, Fang-Fang Yin, Q. Jackie Wu, Adaptive Radiation Therapy for Prostate Cancer, Duke Comprehensive Cancer Center Annual Meeting 2009, Durham, NC