Embed Size (px)
Citation preview

Annual Report | September 30, 2021
Vanguard PRIMECAP Core Fund

Contents
Your Fund’s Performance at a Glance . . . . . . . . . . . . . . . . .1
Advisor’s Report . . . . . . . . . . . . . . . . . . . . . . . . . . . . . . . . . . . . . .2
About Your Fund’s Expenses . . . . . . . . . . . . . . . . . . . . . . . . . .5
Performance Summary . . . . . . . . . . . . . . . . . . . . . . . . . . . . . . .7
Financial Statements . . . . . . . . . . . . . . . . . . . . . . . . . . . . . . . . .9
Please note: The opinions expressed in this report are just that—informed opinions. They should not be considered promisesor advice. Also, please keep in mind that the information and opinions cover the period through the date on the front of thisreport. Of course, the risks of investing in your fund are spelled out in the prospectus.
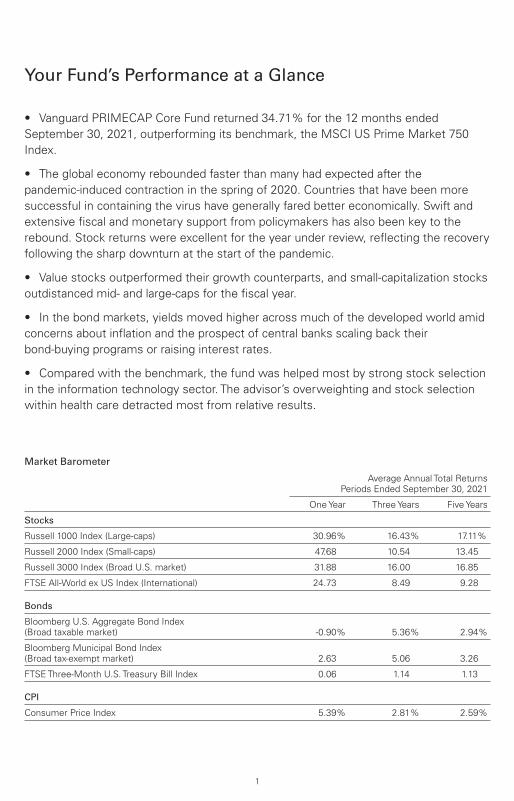
• Vanguard PRIMECAP Core Fund returned 34.71% for the 12 months endedSeptember 30, 2021, outperforming its benchmark, the MSCI US Prime Market 750Index.
• The global economy rebounded faster than many had expected after thepandemic-induced contraction in the spring of 2020. Countries that have been moresuccessful in containing the virus have generally fared better economically. Swift andextensive fiscal and monetary support from policymakers has also been key to therebound. Stock returns were excellent for the year under review, reflecting the recoveryfollowing the sharp downturn at the start of the pandemic.
• Value stocks outperformed their growth counterparts, and small-capitalization stocksoutdistanced mid- and large-caps for the fiscal year.
• In the bond markets, yields moved higher across much of the developed world amidconcerns about inflation and the prospect of central banks scaling back theirbond-buying programs or raising interest rates.
• Compared with the benchmark, the fund was helped most by strong stock selectionin the information technology sector. The advisor’s overweighting and stock selectionwithin health care detracted most from relative results.
Market Barometer
Average Annual Total ReturnsPeriods Ended September 30, 2021
One Year Three Years Five Years
Stocks
Russell 1000 Index (Large-caps) 30.96% 16.43% 17.11%
Russell 2000 Index (Small-caps) 47.68 10.54 13.45
Russell 3000 Index (Broad U.S. market) 31.88 16.00 16.85
FTSE All-World ex US Index (International) 24.73 8.49 9.28
Bonds
Bloomberg U.S. Aggregate Bond Index(Broad taxable market) -0.90% 5.36% 2.94%
Bloomberg Municipal Bond Index(Broad tax-exempt market) 2.63 5.06 3.26
FTSE Three-Month U.S. Treasury Bill Index 0.06 1.14 1.13
CPI
Consumer Price Index 5.39% 2.81% 2.59%
Your Fund’s Performance at a Glance
1

For the 12 months ended September 30,2021, Vanguard PRIMECAP Core Fundreturned 34.71%, ahead of the 30.74%return of its benchmark, the MSCI USPrime Market 750 Index. The fund’s returnwas also ahead of the 30.00% total returnof the Standard & Poor’s 500 Index, whichserves as a proxy for the broad market inthe attribution discussion that follows.Relative to the S&P 500 Index, favorablestock selection more than offsetunfavorable sector allocation during theperiod.
Investment environment
The fiscal year ended September 30,2021, featured a steady rise in the equitymarkets alongside an uneven economicrecovery. U.S. indexes continued theiraggressive upswing—the S&P 500 Indexdoubled from its March 2020 low to itsearly September 2021 peak—as lastyear’s initial bounce, powered primarily byBig Tech and other pandemicbeneficiaries, yielded to broader cyclicalstrength. Oil prices and interest ratesrebounded during the fiscal year, pushingthe energy (+83%) and financial (+59%)sectors sharply higher, while COVID-19“ground zero” industries such as airlinesand cruise lines also outperformed. Moredefensive sectors, such as consumerstaples (+11%) and utilities (+11%),lagged the market but still registeredgains.
The improvement in underlying economicactivity was less uniform. Following lastwinter’s alarming scourge, when thecountry largely retrenched amid severalthousand daily COVID-19-related deaths,
our springtime reopening signaled arobust economic renewal. More than150 million Americans achieved “fullyvaccinated” status by midyear, and dailydeaths plummeted more than 90 percent.The Federal Reserve in June forecasted7% real GDP growth for 2021, an annualgrowth rate not seen since 1984.
But the euphoria was short-lived. Thehighly transmissible Delta variantsurfaced, creating yet another wave ofinfection. Meanwhile, abundant monetaryand fiscal stimulus collided with fragilesupply chains, inducing worrisomeinflation. The recovery’s momentum thusstalled somewhat—the Fed nowestimates less than 6% real GDP growthfor 2021—and the equity marketeventually ceded ground, sliding 5% inSeptember.
Outlook for U.S. equities
Our view on U.S. equities overall remainsconflicted. We continue to view them asrelatively attractive compared withconventional alternatives. However, westill assess inflation as anunderappreciated risk. Treasury yieldsdoubled during the period (the 10-yearTreasury yield increased from 0.7% to1.5%) but remain historically low. The10-year breakeven inflation rate, amarket-based gauge of inflationexpectations, finished the period higherthan a year ago (2.4%, compared with1.6%), but a mid-2% reading is hardly adistress signal. The market’s apparentcomplacency reflects the Fed’scharacterization of inflation as a“temporary” phenomenon.
Advisor’s Report
2
The market has thus managed to maintainits elevated valuation; the S&P 500 Indextrades at 19.7 times price/earningsvaluation on 2022 estimated earnings. Thisvaluation metric has stabilized of late, notworsened, with index advances largelymirroring upward revisions to estimatedearnings. But absolute valuation levels arehistorically expensive. Coupled withstubbornly high inflation readings, thisdynamic necessarily tempers our outlook.
Portfolio update
The portfolio maintained its substantialoverweight positions in health care andindustrial stocks; these sectors made up41% of average assets, compared withtheir 22% combined weighting in the S&P500 Index. The portfolio was roughlyequally weighted in consumerdiscretionary (12% of average assets and12% for the S&P 500 Index) andunderweighted in information technology(26% versus 27%), financials (9% versus11%), and communication services (6%versus 11%). The fund maintained limitedexposure to all other sectors—consumerstaples, energy, materials, real estate, andutilities.
Sector allocation was unfavorable duringthe period. The fund’s overweight positionin health care (+23% index return) andunderweight positions in energy (+83%)and financials (+59%) detracted fromrelative results.
Stock selection was broadly favorable.Within information technology,outperformance from several sizableholdings—Applied Materials (+118%),
NetApp (+111%), ASML (+103%), andKLA (+75%) complemented limitedexposure to heavyweight Apple (+23%),which lagged the market after more thandoubling last year. Within financials,Charles Schwab (+100%), Wells Fargo(+100%), and JPMorgan (+75%) soaredas beneficiaries of both cyclical strengthand higher interest rates. Withinconsumer discretionary, ownership ofTesla (+81%, most of which pre-dated itsDecember inclusion in the S&P 500 Index)plus limited exposure to Amazon (+1%)more than offset a dramatic decline inAlibaba (–50%), which suffered underincreased Chinese regulatory scrutiny.Health care was the lone weak spot, withstrength from pharmaceutical giant EliLilly (+59%) unable to offsetunderperformance from Amgen (–15%),Novartis (–4%), Biogen (flat), andAstraZeneca (+13%).
As of September 30, 2021, the fund’s top10 holdings accounted for 29% of assets.
Advisor perspectives
Health care is our second-largest sectorweighting and, by a wide margin, ourlargest overweight position, with thefund’s exposure eclipsing the benchmark’saverage weighting (13%) by 12percentage points. This positioning proveddetrimental during the period, as thesector was unable to keep pace with themarket’s vigorous ascent. But we remainconfident in our holdings’ long-termopportunities.
When the pandemic unfolded, the U.S.government response was to dig
3
proverbial trenches and, from its foxhole,blindly launch a monetary and fiscalbazooka. This lockdown-heavy reactionsurprised us, but perhaps should nothave—the same self-preservation instinctunderlies the inherent value in bettermedical outcomes. It also informs ourattraction to the biopharmaceuticalindustry, where innovative drugs andtherapies can create immense value.Indeed, in our opinion this commonCOVID-19 response strategy was destinedto fail absent the biopharmaceuticalindustry (and modern medicine moregenerally) providing a viable exit path.
We thus hoped the pandemic wouldhighlight the health care sector’s unsungsignificance—in sharp contrast to its usualposition in political and regulatorycrosshairs. But even miraculous vaccinesand ongoing therapy breakthroughs havebeen unable to salvage health care’sreputation. The sector is among the leastexpensive, trading at a quite reasonable16.4 times 2022 price/earnings atperiod-end—a nearly 20% discount to themarket (19.7 times) and well below itsdefensive peers, consumer staples (19.4times) and utilities (18.4 times).
Within this less favorable context, ourown health care portfolio sufferednumerous stock-specific setbacks, mostnotably Biogen’s relapse. One of ourlargest holdings, Biogen’s stock spiked38% on June 7 when the FDA grantedAduhelm accelerated approval for thetreatment of Alzheimer’s disease. Byperiod-end, Biogen had squandered its
gain, a function of the drug’s disastrouslaunch amid intense market skepticism.
As with Biogen, we continue to owncompanies, in health care and elsewhere,that are controversial or unloved. Thesestocks often feature outsized risks(including binary clinical trial outcomes),unusually opaque futures, and well-wornWall Street opposition. We do not pursuevolatility or opacity or hostility per se;rather, we seek mismatches betweencurrent share prices and our assessmentsof long-term value, and we tend to findthese dislocations in such fraughtenvironments.
Conclusion
COVID’s unwelcome impact has beenmore devastating and lasting than we firstcontemplated. And yet the core of ouroriginal conviction has been sustained:Normalcy will ultimately return. Thecontours of society have no doubt forevershifted, but society’s underlying structureand purpose—our collectivehumanity—endures. As COVID-19transitions from pandemic to endemic, webelieve that collective humanity, brieflyobscured by both virus and fiat, willflourish once more. Our portfoliocontinues to be positioned for thiseventuality.
PRIMECAP Management Company
October 15, 2021
4
As a shareholder of the fund, you incur ongoing costs, which include costs for portfolio
management, administrative services, and shareholder reports (like this one), among others.
Operating expenses, which are deducted from a fund’s gross income, directly reduce the
investment return of the fund.
A fund’s expenses are expressed as a percentage of its average net assets. This figure is known
as the expense ratio. The following examples are intended to help you understand the ongoing
costs (in dollars) of investing in your fund and to compare these costs with those of other mutual
funds. The examples are based on an investment of $1,000 made at the beginning of the period
shown and held for the entire period.
The accompanying table illustrates your fund’s costs in two ways:
• Based on actual fund return. This section helps you to estimate the actual expenses that you
paid over the period. The ”Ending Account Value“ shown is derived from the fund‘s actual return,
and the third column shows the dollar amount that would have been paid by an investor who
started with $1,000 in the fund. You may use the information here, together with the amount you
invested, to estimate the expenses that you paid over the period.
To do so, simply divide your account value by $1,000 (for example, an $8,600 account value
divided by $1,000 = 8.6), then multiply the result by the number given for your fund under the
heading ”Expenses Paid During Period.“
• Based on hypothetical 5% yearly return. This section is intended to help you compare your
fund‘s costs with those of other mutual funds. It assumes that the fund had a yearly return of 5%
before expenses, but that the expense ratio is unchanged. In this case—because the return used
is not the fund’s actual return—the results do not apply to your investment. The example is useful
in making comparisons because the Securities and Exchange Commission requires all mutual
funds to calculate expenses based on a 5% return. You can assess your fund’s costs by comparing
this hypothetical example with the hypothetical examples that appear in shareholder reports of
other funds.
Note that the expenses shown in the table are meant to highlight and help you compare ongoingcosts only and do not reflect transaction costs incurred by the fund for buying and selling
securities. Further, the expenses do not include any purchase, redemption, or account service fees
described in the fund prospectus. If such fees were applied to your account, your costs would be
higher. Your fund does not carry a “sales load.”
The calculations assume no shares were bought or sold during the period. Your actual costs may
have been higher or lower, depending on the amount of your investment and the timing of any
purchases or redemptions.
You can find more information about the fund’s expenses, including annual expense ratios, in the
Financial Statements section of this report. For additional information on operating expenses and
other shareholder costs, please refer to your fund’s current prospectus.
About Your Fund’s Expenses
5

Six Months Ended September 30, 2021
PRIMECAP Core Fund
BeginningAccount Value
3/31/2021
EndingAccount Value
9/30/2021
ExpensesPaid During
Period
Based on Actual Fund Return $1,000.00 $1,037.50 $2.35
Based on Hypothetical 5% Yearly Return 1,000.00 1,022.76 2.33
The calculations are based on expenses incurred in the most recent six-month period. The fund’s annualized six-month expense ratio forthat period is 0.46%. The dollar amounts shown as “Expenses Paid” are equal to the annualized expense ratio multiplied by the averageaccount value over the period, multiplied by the number of days in the most recent six-month period, then divided by the number of days inthe most recent 12-month period (183/365).
6

All of the returns in this report represent past performance, which is not a guarantee of
future results that may be achieved by the fund. (Current performance may be lower or
higher than the performance data cited. For performance data current to the most recent
month-end, visit our website at vanguard.com/performance.) Note, too, that both
investment returns and principal value can fluctuate widely, so an investor’s shares, when
sold, could be worth more or less than their original cost. The returns shown do not reflect
taxes that a shareholder would pay on fund distributions or on the sale of fund shares.
Cumulative Performance: September 30, 2011, Through September 30, 2021Initial Investment of $10,000
$55,000
3,000
46,635
2021202020192018201720162015201420132012
Average Annual Total ReturnsPeriods Ended September 30, 2021
OneYear
FiveYears
TenYears
Final Valueof a $10,000Investment
PRIMECAP Core Fund 34.71% 15.74% 16.65% $46,635 MSCI US Prime Market 750 Index 30.74 17.28 16.84 47,414
Dow Jones U.S. Total Stock Market Float
Adjusted Index 32.13 16.82 16.56 46,280
PRIMECAP Core Fund
Performance Summary
See Financial Highlights for dividend and capital gains information.
7
Communication Services 6.7%
Consumer Discretionary 12.0
Consumer Staples 0.6
Energy 1.9
Financials 10.5
Health Care 24.5
Industrials 16.0
Information Technology 26.0
Materials 1.7
Real Estate 0.1
The table reflects the fund’s investments, except for short-terminvestments. Sector categories are based on the Global IndustryClassification Standard (“GICS”), except for the “Other” category(if applicable), which includes securities that have not beenprovided a GICS classification as of the effective reporting period.
Global Industry Classification Standard (“GICS”) was developed by and is the exclusive property and a service mark ofMSCI Inc. (“MSCI”) and Standard and Poor’s, a division of McGraw-Hill Companies, Inc. (“S&P”), and is licensed for useby Vanguard. Neither MSCI, S&P nor any third party involved in making or compiling the GICS or any GICS classificationmakes any express or implied warranties or representations with respect to such standard or classification (or the resultsto be obtained by the use thereof), and all such parties hereby expressly disclaim all warranties of originality, accuracy,completeness, merchantability or fitness for a particular purpose with respect to any such standard or classification.Without limiting any of the foregoing, in no event shall MSCI, S&P, any of its affiliates or any third party involved inmaking or compiling the GICS or any GICS classification have any liability for any direct, indirect, special, punitive,consequential or any other damages (including lost profits) even if notified of the possibility of such damages.
PRIMECAP Core Fund
Fund AllocationAs of September 30, 2021
8

The fund files its complete schedule of portfolio holdings with the Securities and Exchange
Commission (SEC) for the first and third quarters of each fiscal year as an exhibit to its reports on
Form N-PORT. The fund’s Form N-PORT reports are available on the SEC’s website at
www.sec.gov.
Shares
MarketValue•
($000)
Common Stocks (96.1%)
Communication Services (6.5%)* Alphabet Inc. Class A 96,100 256,925* Alphabet Inc. Class C 75,387 200,930* Walt Disney Co. 391,735 66,270* T-Mobile U.S. Inc. 507,427 64,829 Activision Blizzard Inc. 635,600 49,189* Facebook Inc. Class A 137,600 46,700* Charter Communications
Inc. Class A 41,470 30,172 Electronic Arts Inc. 136,650 19,439 Nintendo Co. Ltd. 38,850 18,566 Comcast Corp. Class A 319,738 17,883* Altice USA Inc. Class A 227,000 4,703* Audacy Inc. Class A 924,300 3,401
779,007Consumer Discretionary (11.6%) Sony Group Corp. ADR 1,934,900 213,961* CarMax Inc. 1,351,350 172,919 Whirlpool Corp. 744,724 151,820* Alibaba Group Holding
Ltd. ADR 823,900 121,978 Ross Stores Inc. 1,040,920 113,304* Mattel Inc. 5,929,941 110,060 TJX Cos. Inc. 1,644,700 108,517* Tesla Inc. 89,800 69,638* Amazon.com Inc. 12,475 40,981 Newell Brands Inc. 1,785,100 39,522 Bath & Body Works Inc. 605,800 38,184* Carnival Corp. 1,432,100 35,817* Royal Caribbean Cruises
Ltd. 378,800 33,694* Marriott International Inc.
Class A 195,390 28,935* Dollar Tree Inc. 252,000 24,122* Capri Holdings Ltd. 471,100 22,806* Victoria's Secret & Co. 326,433 18,039* Burlington Stores Inc. 49,000 13,895 Restaurant Brands
International Inc. 140,500 8,597 Lowe's Cos. Inc. 35,000 7,100 McDonald's Corp. 24,700 5,955 MGM Resorts
International 95,000 4,099* Las Vegas Sands Corp. 79,600 2,913* O'Reilly Automotive Inc. 4,300 2,628* Norwegian Cruise Line
Holdings Ltd. 68,440 1,828
Shares
MarketValue•
($000)* Hilton Worldwide
Holdings Inc. 13,800 1,823* AutoZone Inc. 1,055 1,791 VF Corp. 25,000 1,675
1,396,601Consumer Staples (0.5%) Sysco Corp. 221,500 17,388* BJ's Wholesale Club
Holdings Inc. 306,700 16,844 Tyson Foods Inc. Class A 190,000 14,999 Altria Group Inc. 250,424 11,399 Mowi ASA 100,000 2,537 Philip Morris International
Inc. 15,500 1,469 Constellation Brands Inc.
Class A 3,000 632
65,268Energy (1.8%) Pioneer Natural
Resources Co. 619,323 103,123 EOG Resources Inc. 343,921 27,606 Cabot Oil & Gas Corp. 1,095,350 23,835 Valero Energy Corp. 311,500 21,983 Cameco Corp. 752,600 16,354* Southwestern Energy Co. 1,983,300 10,987 Hess Corp. 95,990 7,498* Transocean Ltd. 1,237,200 4,689* TechnipFMC plc 184,100 1,386 Schlumberger NV 42,100 1,248* Technip Energies NV 7,820 123
218,832Financials (10.1%) JPMorgan Chase & Co. 1,557,266 254,909 Wells Fargo & Co. 4,057,300 188,299 Charles Schwab Corp. 2,026,464 147,608 Goldman Sachs Group
Inc. 330,300 124,863 Raymond James Financial
Inc. 1,349,925 124,571 Northern Trust Corp. 988,580 106,579 Bank of America Corp. 1,793,959 76,154 Discover Financial
Services 547,281 67,234 Marsh & McLennan Cos.
Inc. 347,712 52,654 U.S. Bancorp 633,300 37,643 Morgan Stanley 165,000 16,056 Progressive Corp. 142,800 12,908
PRIMECAP Core Fund
Financial Statements
Schedule of InvestmentsAs of September 30, 2021
9
Shares
MarketValue•
($000)
CME Group Inc. 55,250 10,684
1,220,162Health Care (23.5%) Eli Lilly & Co. 2,482,172 573,506 AstraZeneca plc ADR 5,673,090 340,726* Biogen Inc. 1,145,447 324,150 Amgen Inc. 1,456,100 309,640 Thermo Fisher Scientific
Inc. 433,840 247,866 Novartis AG ADR 1,825,040 149,252* Elanco Animal Health Inc.
(XNYS) 4,250,291 135,542* Boston Scientific Corp. 3,011,030 130,649 Bristol-Myers Squibb Co. 1,741,750 103,059 Roche Holding AG 246,237 89,869 CVS Health Corp. 706,180 59,926* LivaNova plc 702,840 55,658 Zimmer Biomet Holdings
Inc. 372,000 54,446 Abbott Laboratories 418,090 49,389 Agilent Technologies Inc. 267,670 42,166* Illumina Inc. 102,730 41,6681 Siemens Healthineers AG 519,491 33,692* BioMarin Pharmaceutical
Inc. 288,770 22,319* IQVIA Holdings Inc. 84,222 20,174 Stryker Corp. 47,400 12,500 Alcon Inc. 126,760 10,200 Medtronic plc 60,000 7,521 Humana Inc. 18,544 7,216 Sanofi ADR 135,420 6,529 Danaher Corp. 17,707 5,391 UnitedHealth Group Inc. 8,489 3,317* Waters Corp. 7,137 2,550 Cerner Corp. 10,000 705
2,839,626Industrials (15.4%)* Southwest Airlines Co. 6,936,369 356,737 Siemens AG (Registered) 1,626,019 265,937 FedEx Corp. 840,300 184,269* AECOM 2,858,900 180,540 Jacobs Engineering
Group Inc. 972,785 128,923 United Parcel Service Inc.
Class B 585,900 106,692* Airbus SE 697,495 92,471* United Airlines Holdings
Inc. 1,483,700 70,580 Caterpillar Inc. 309,970 59,505* TransDigm Group Inc. 85,150 53,182* Delta Air Lines Inc. 1,124,310 47,907* American Airlines Group
Inc. 2,231,000 45,780 Textron Inc. 648,400 45,265 Union Pacific Corp. 176,200 34,537 General Dynamics Corp. 170,000 33,325 Carrier Global Corp. 436,100 22,573* XPO Logistics Inc. 241,100 19,187* GXO Logistics Inc. 241,100 18,912 AMETEK Inc. 143,090 17,745 Deere & Co. 52,620 17,631 Otis Worldwide Corp. 178,700 14,703 CSX Corp. 339,000 10,082 Rockwell Automation Inc. 26,200 7,704 L3Harris Technologies Inc. 34,000 7,488 Science Applications
International Corp. 80,000 6,845
Shares
MarketValue•
($000)
Pentair plc 87,310 6,341 Old Dominion Freight Line
Inc. 4,500 1,287
1,856,148Information Technology (25.0%) Microsoft Corp. 1,418,860 400,005 Texas Instruments Inc. 1,665,080 320,045 KLA Corp. 730,370 244,316 Intel Corp. 4,178,800 222,646 Applied Materials Inc. 1,217,700 156,755* Flex Ltd. 8,381,560 148,186 Micron Technology Inc. 1,756,120 124,649 Asml Holding NV GDR
(Registered) 166,075 123,744 Telefonaktiebolaget LM
Ericsson ADR 9,991,945 111,910 Intuit Inc. 202,300 109,143 NetApp Inc. 1,075,500 96,537* Adobe Inc. 166,900 96,088 Hewlett Packard
Enterprise Co. 6,612,198 94,224 QUALCOMM Inc. 710,860 91,687 Analog Devices Inc. 481,600 80,658 HP Inc. 2,826,123 77,323* PayPal Holdings Inc. 278,150 72,377 Cisco Systems Inc. 1,104,600 60,123 Visa Inc. Class A 264,400 58,895 Oracle Corp. 636,000 55,415 Apple Inc. 375,000 53,062 Corning Inc. 1,092,900 39,880* Keysight Technologies Inc. 211,400 34,731* WEX Inc. 151,480 26,682 NVIDIA Corp. 114,520 23,724 Fidelity National
Information ServicesInc. 180,000 21,902
Teradyne Inc. 144,800 15,808* Western Digital Corp. 263,600 14,878*,2 BlackBerry Ltd. 1,328,700 12,928 Mastercard Inc. Class A 29,000 10,083 Jabil Inc. 115,000 6,713* Ciena Corp. 55,000 2,824* Nokia OYJ ADR 360,000 1,962
3,009,903Materials (1.6%) Albemarle Corp. 461,265 101,003 Glencore plc 6,551,523 30,819 DuPont de Nemours Inc. 354,933 24,132 Dow Inc. 285,300 16,422 Corteva Inc. 292,893 12,325 Freeport-McMoRan Inc. 290,000 9,434 Greif Inc. Class B 30,000 1,944
196,079Real Estate (0.1%) American Homes 4 Rent
Class A 224,000 8,539
Total Common Stocks(Cost $4,782,539) 11,590,165
PRIMECAP Core Fund
10
Shares
MarketValue•
($000)
Temporary Cash Investments (3.9%)
Money Market Fund (3.9%)3,4 Vanguard Market Liquidity
Fund, 0.068%(Cost $468,943) 4,690,382 469,038
Total Investments (100.0%)(Cost $5,251,482) 12,059,203
Other Assets andLiabilities—Net (0.0%) (3,651)
Net Assets (100%) 12,055,552
Cost is in $000. • See Note A in Notes to Financial Statements.* Non-income-producing security.1 Security exempt from registration under Rule 144A of the
Securities Act of 1933. Such securities may be sold intransactions exempt from registration, normally to qualifiedinstitutional buyers. At September 30, 2021, the aggregatevalue was $33,692,000, representing 0.3% of net assets.
2 Includes partial security positions on loan to broker-dealers. Thetotal value of securities on loan is $10,905,000.
3 Affiliated money market fund available only to Vanguard fundsand certain trusts and accounts managed by Vanguard. Rateshown is the 7-day yield.
4 Collateral of $11,207,000 was received for securities on loan.ADR—American Depositary Receipt.GDR—Global Depositary Receipt.
See accompanying Notes, which are an integral part of the Financial Statements.
PRIMECAP Core Fund
11
($000s, except shares and per-share amounts) Amount
Assets
Investments in Securities, at Value
Unaffiliated Issuers (Cost $4,782,539) 11,590,165
Affiliated Issuers (Cost $468,943) 469,038
Total Investments in Securities 12,059,203
Investment in Vanguard 415
Cash 140
Receivables for Accrued Income 10,887
Receivables for Capital Shares Issued 17,009
Total Assets 12,087,654
Liabilities
Payables for Investment Securities Purchased 4,344
Collateral for Securities on Loan 11,207
Payables to Investment Advisor 9,401
Payables for Capital Shares Redeemed 6,389
Payables to Vanguard 761
Total Liabilities 32,102
Net Assets 12,055,552
At September 30, 2021, net assets consisted of:
Paid-in Capital 4,467,648
Total Distributable Earnings (Loss) 7,587,904
Net Assets 12,055,552
Net Assets
Applicable to 356,874,204 outstanding $.001 par value shares ofbeneficial interest (unlimited authorization) 12,055,552
Net Asset Value Per Share $33.78
See accompanying Notes, which are an integral part of the Financial Statements.
PRIMECAP Core Fund
Statement of Assets and LiabilitiesAs of September 30, 2021
12
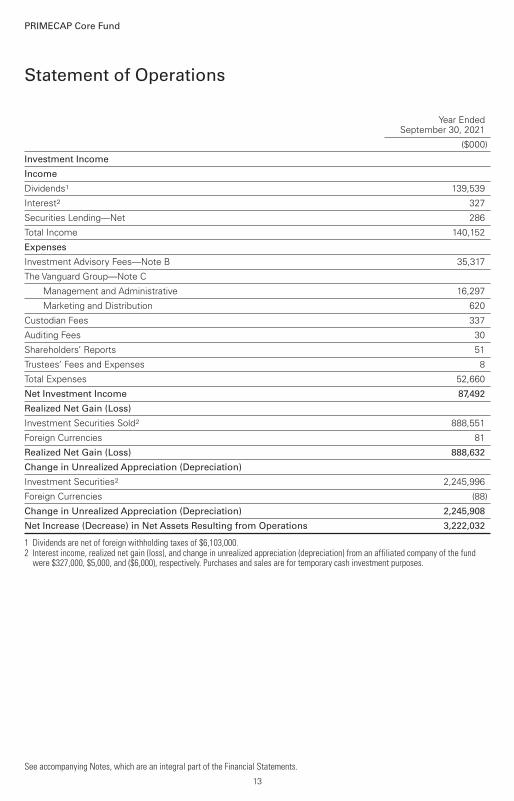
Year EndedSeptember 30, 2021
($000)
Investment Income
Income
Dividends1 139,539
Interest2 327
Securities Lending—Net 286
Total Income 140,152
Expenses
Investment Advisory Fees—Note B 35,317
The Vanguard Group—Note C
Management and Administrative 16,297
Marketing and Distribution 620
Custodian Fees 337
Auditing Fees 30
Shareholders’ Reports 51
Trustees’ Fees and Expenses 8
Total Expenses 52,660
Net Investment Income 87,492
Realized Net Gain (Loss)
Investment Securities Sold2 888,551
Foreign Currencies 81
Realized Net Gain (Loss) 888,632
Change in Unrealized Appreciation (Depreciation)
Investment Securities2 2,245,996
Foreign Currencies (88)
Change in Unrealized Appreciation (Depreciation) 2,245,908
Net Increase (Decrease) in Net Assets Resulting from Operations 3,222,032
1 Dividends are net of foreign withholding taxes of $6,103,000.2 Interest income, realized net gain (loss), and change in unrealized appreciation (depreciation) from an affiliated company of the fund
were $327,000, $5,000, and ($6,000), respectively. Purchases and sales are for temporary cash investment purposes.
See accompanying Notes, which are an integral part of the Financial Statements.
PRIMECAP Core Fund
Statement of Operations
13
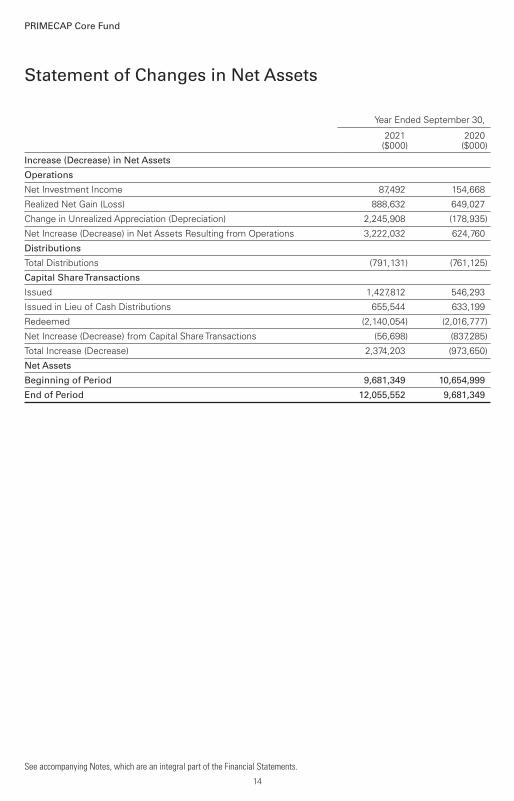
Year Ended September 30,
2021($000)
2020($000)
Increase (Decrease) in Net Assets
Operations
Net Investment Income 87,492 154,668
Realized Net Gain (Loss) 888,632 649,027
Change in Unrealized Appreciation (Depreciation) 2,245,908 (178,935)
Net Increase (Decrease) in Net Assets Resulting from Operations 3,222,032 624,760
Distributions
Total Distributions (791,131) (761,125)
Capital Share Transactions
Issued 1,427,812 546,293
Issued in Lieu of Cash Distributions 655,544 633,199
Redeemed (2,140,054) (2,016,777)
Net Increase (Decrease) from Capital Share Transactions (56,698) (837,285)
Total Increase (Decrease) 2,374,203 (973,650)
Net Assets
Beginning of Period 9,681,349 10,654,999
End of Period 12,055,552 9,681,349
See accompanying Notes, which are an integral part of the Financial Statements.
PRIMECAP Core Fund
Statement of Changes in Net Assets
14
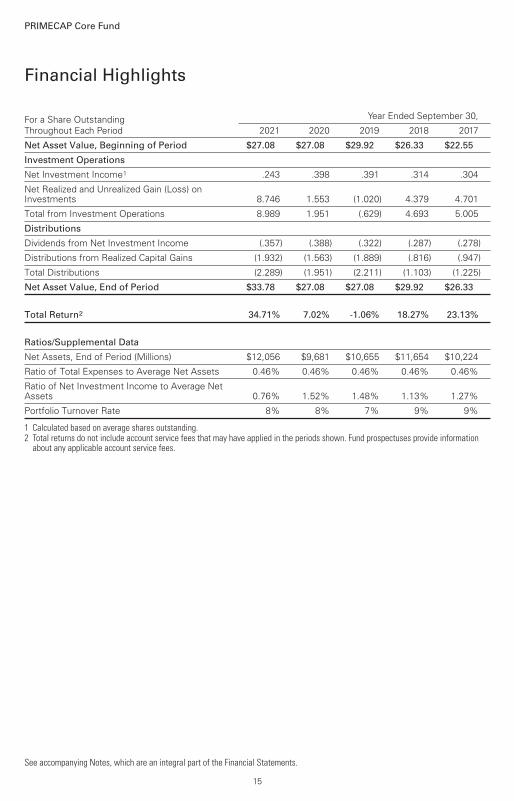
For a Share OutstandingThroughout Each Period
Year Ended September 30,
2021 2020 2019 2018 2017
Net Asset Value, Beginning of Period $27.08 $27.08 $29.92 $26.33 $22.55
Investment Operations
Net Investment Income1 .243 .398 .391 .314 .304
Net Realized and Unrealized Gain (Loss) onInvestments 8.746 1.553 (1.020) 4.379 4.701
Total from Investment Operations 8.989 1.951 (.629) 4.693 5.005
Distributions
Dividends from Net Investment Income (.357) (.388) (.322) (.287) (.278)
Distributions from Realized Capital Gains (1.932) (1.563) (1.889) (.816) (.947)
Total Distributions (2.289) (1.951) (2.211) (1.103) (1.225)
Net Asset Value, End of Period $33.78 $27.08 $27.08 $29.92 $26.33
Total Return2 34.71% 7.02% -1.06% 18.27% 23.13%
Ratios/Supplemental Data
Net Assets, End of Period (Millions) $12,056 $9,681 $10,655 $11,654 $10,224
Ratio of Total Expenses to Average Net Assets 0.46% 0.46% 0.46% 0.46% 0.46%
Ratio of Net Investment Income to Average NetAssets 0.76% 1.52% 1.48% 1.13% 1.27%
Portfolio Turnover Rate 8% 8% 7% 9% 9%
1 Calculated based on average shares outstanding.2 Total returns do not include account service fees that may have applied in the periods shown. Fund prospectuses provide information
about any applicable account service fees.
See accompanying Notes, which are an integral part of the Financial Statements.
PRIMECAP Core Fund
Financial Highlights
15
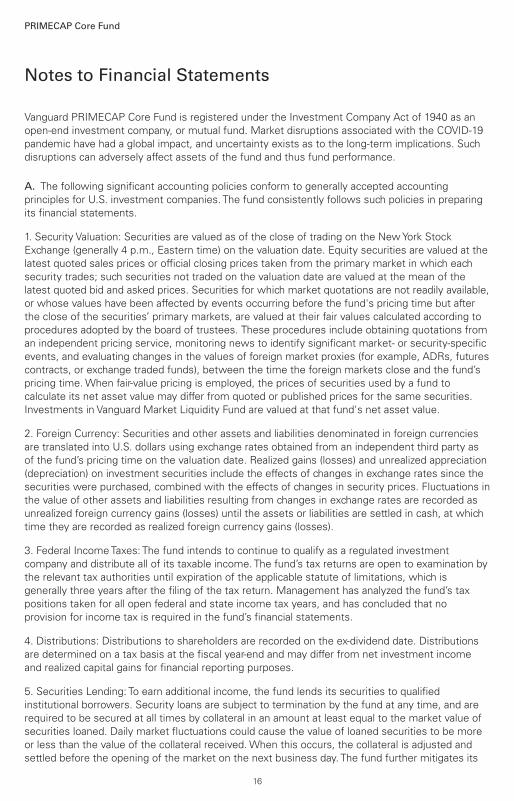
Vanguard PRIMECAP Core Fund is registered under the Investment Company Act of 1940 as anopen-end investment company, or mutual fund. Market disruptions associated with the COVID-19pandemic have had a global impact, and uncertainty exists as to the long-term implications. Suchdisruptions can adversely affect assets of the fund and thus fund performance.
A. The following significant accounting policies conform to generally accepted accountingprinciples for U.S. investment companies. The fund consistently follows such policies in preparingits financial statements.
1. Security Valuation: Securities are valued as of the close of trading on the New York StockExchange (generally 4 p.m., Eastern time) on the valuation date. Equity securities are valued at thelatest quoted sales prices or official closing prices taken from the primary market in which eachsecurity trades; such securities not traded on the valuation date are valued at the mean of thelatest quoted bid and asked prices. Securities for which market quotations are not readily available,or whose values have been affected by events occurring before the fund's pricing time but afterthe close of the securities’ primary markets, are valued at their fair values calculated according toprocedures adopted by the board of trustees. These procedures include obtaining quotations froman independent pricing service, monitoring news to identify significant market- or security-specificevents, and evaluating changes in the values of foreign market proxies (for example, ADRs, futurescontracts, or exchange traded funds), between the time the foreign markets close and the fund’spricing time. When fair-value pricing is employed, the prices of securities used by a fund tocalculate its net asset value may differ from quoted or published prices for the same securities.Investments in Vanguard Market Liquidity Fund are valued at that fund's net asset value.
2. Foreign Currency: Securities and other assets and liabilities denominated in foreign currenciesare translated into U.S. dollars using exchange rates obtained from an independent third party asof the fund’s pricing time on the valuation date. Realized gains (losses) and unrealized appreciation(depreciation) on investment securities include the effects of changes in exchange rates since thesecurities were purchased, combined with the effects of changes in security prices. Fluctuations inthe value of other assets and liabilities resulting from changes in exchange rates are recorded asunrealized foreign currency gains (losses) until the assets or liabilities are settled in cash, at whichtime they are recorded as realized foreign currency gains (losses).
3. Federal Income Taxes: The fund intends to continue to qualify as a regulated investmentcompany and distribute all of its taxable income. The fund’s tax returns are open to examination bythe relevant tax authorities until expiration of the applicable statute of limitations, which isgenerally three years after the filing of the tax return. Management has analyzed the fund’s taxpositions taken for all open federal and state income tax years, and has concluded that noprovision for income tax is required in the fund’s financial statements.
4. Distributions: Distributions to shareholders are recorded on the ex-dividend date. Distributionsare determined on a tax basis at the fiscal year-end and may differ from net investment incomeand realized capital gains for financial reporting purposes.
5. Securities Lending: To earn additional income, the fund lends its securities to qualifiedinstitutional borrowers. Security loans are subject to termination by the fund at any time, and arerequired to be secured at all times by collateral in an amount at least equal to the market value ofsecurities loaned. Daily market fluctuations could cause the value of loaned securities to be moreor less than the value of the collateral received. When this occurs, the collateral is adjusted andsettled before the opening of the market on the next business day. The fund further mitigates its
PRIMECAP Core Fund
Notes to Financial Statements
16
counterparty risk by entering into securities lending transactions only with a diverse group ofprequalified counterparties, monitoring their financial strength, and entering into master securitieslending agreements with its counterparties. The master securities lending agreements providethat, in the event of a counterparty’s default (including bankruptcy), the fund may terminate anyloans with that borrower, determine the net amount owed, and sell or retain the collateral up tothe net amount owed to the fund; however, such actions may be subject to legal proceedings.While collateral mitigates counterparty risk, in the event of a default, the fund may experiencedelays and costs in recovering the securities loaned. The fund invests cash collateral received inVanguard Market Liquidity Fund, and records a liability in the Statement of Assets and Liabilitiesfor the return of the collateral, during the period the securities are on loan. Collateral investmentsin Vanguard Market Liquidity Fund are subject to market appreciation or depreciation. Securitieslending income represents fees charged to borrowers plus income earned on invested cashcollateral, less expenses associated with the loan. During the term of the loan, the fund is entitledto all distributions made on or in respect of the loaned securities.
6. Credit Facilities and Interfund Lending Program: The fund and certain other funds managed byThe Vanguard Group ("Vanguard") participate in a $4.3 billion committed credit facility provided by asyndicate of lenders pursuant to a credit agreement and an uncommitted credit facility provided byVanguard. Both facilities may be renewed annually. Each fund is individually liable for itsborrowings, if any, under the credit facilities. Borrowings may be utilized for temporary oremergency purposes, subject to the fund’s regulatory and contractual borrowing restrictions. Withrespect to the committed credit facility, the participating funds are charged administrative fees andan annual commitment fee of 0.10% of the undrawn committed amount of the facility; these feesare allocated to the funds based on a method approved by the fund’s board of trustees andincluded in Management and Administrative expenses on the fund’s Statement of Operations. Anyborrowings under either facility bear interest at a rate based upon the higher of the one-monthLondon Interbank Offered Rate (or an acceptable alternate rate, if necessary), federal fundseffective rate, or overnight bank funding rate plus an agreed-upon spread, except that borrowingsunder the uncommitted credit facility may bear interest based upon an alternate rate agreed to bythe fund and Vanguard.
In accordance with an exemptive order (the “Order”) from the SEC, the fund may participate in ajoint lending and borrowing program that allows registered open-end Vanguard funds to borrowmoney from and lend money to each other for temporary or emergency purposes (the “InterfundLending Program”), subject to compliance with the terms and conditions of the Order, and to theextent permitted by the fund’s investment objective and investment policies. Interfund loans andborrowings normally extend overnight, but can have a maximum duration of seven days. Loansmay be called on one business day’s notice. The interest rate to be charged is governed by theconditions of the Order and internal procedures adopted by the board of trustees. The board oftrustees is responsible for overseeing the Interfund Lending Program.
For the year ended September 30, 2021, the fund did not utilize the credit facilities or the InterfundLending Program.
7. Other: Dividend income is recorded on the ex-dividend date. Non-cash dividends included inincome, if any, are recorded at the fair value of the securities received. Interest income includesincome distributions received from Vanguard Market Liquidity Fund and is accrued daily. Securitytransactions are accounted for on the date securities are bought or sold. Costs used to determinerealized gains (losses) on the sale of investment securities are those of the specific securities sold.
PRIMECAP Core Fund
17

B. PRIMECAP Management Company provides investment advisory services to the fund for a feecalculated at an annual percentage rate of average net assets. For the year ended September 30,2021, the investment advisory fee represented an effective annual basic rate of 0.31% of thefund’s average net assets.
C. In accordance with the terms of a Funds' Service Agreement (the “FSA”) between Vanguardand the fund, Vanguard furnishes to the fund corporate management, administrative, marketing,and distribution services at Vanguard’s cost of operations (as defined by the FSA). These costs ofoperations are allocated to the fund based on methods and guidelines approved by the board oftrustees and are generally settled twice a month.
Upon the request of Vanguard, the fund may invest up to 0.40% of its net assets as capital inVanguard. At September 30, 2021, the fund had contributed to Vanguard capital in the amount of$415,000, representing less than 0.01% of the fund’s net assets and 0.17% of Vanguard’s capitalreceived pursuant to the FSA. The fund’s trustees and officers are also directors and employees,respectively, of Vanguard.
D. Various inputs may be used to determine the value of the fund’s investments. These inputs aresummarized in three broad levels for financial statement purposes. The inputs or methodologiesused to value securities are not necessarily an indication of the risk associated with investing inthose securities.
Level 1—Quoted prices in active markets for identical securities.
Level 2—Other significant observable inputs (including quoted prices for similar securities, interestrates, prepayment speeds, credit risk, etc.).
Level 3—Significant unobservable inputs (including the fund’s own assumptions used todetermine the fair value of investments). Any investments valued with significant unobservableinputs are noted on the Schedule of Investments.
The following table summarizes the market value of the fund’s investments as of September 30,2021, based on the inputs used to value them:
Level 1($000)
Level 2($000)
Level 3($000)
Total($000)
Investments
Assets
Common Stocks 11,051,462 538,703 — 11,590,165
Temporary Cash Investments 469,038 — — 469,038
Total 11,520,500 538,703 — 12,059,203
E. Permanent differences between book-basis and tax-basis components of net assets arereclassified among capital accounts in the financial statements to reflect their tax character. Thesereclassifications have no effect on net assets or net asset value per share. As of period end,
PRIMECAP Core Fund
18
permanent differences primarily attributable to the accounting for foreign currency transactionsand distributions in connection with fund share redemptions were reclassified between thefollowing accounts:
Amount($000)
Paid-in Capital 72,595
Total Distributable Earnings (Loss) (72,595)
Temporary differences between book-basis and tax-basis components of total distributableearnings (loss) arise when certain items of income, gain, or loss are recognized in different periodsfor financial statement and tax purposes; these differences will reverse at some time in the future.The differences are primarily related to the deferral of losses from wash sales. As of period end,the tax-basis components of total distributable earnings (loss) are detailed in the table as follows:
Amount($000)
Undistributed Ordinary Income 86,227
Undistributed Long-Term Gains 693,971
Capital Loss Carryforwards —
Qualified Late-Year Losses —
Net Unrealized Gains (Losses) 6,807,706
The tax character of distributions paid was as follows:
Year Ended September 30,
2021Amount
($000)
2020Amount
($000)
Ordinary Income* 124,588 177,564
Long-Term Capital Gains 666,543 583,561
Total 791,131 761,125 * Includes short-term capital gains, if any.
As of September 30, 2021, gross unrealized appreciation and depreciation for investments basedon cost for U.S. federal income tax purposes were as follows:
Amount($000)
Tax Cost 5,251,623
Gross Unrealized Appreciation 7,045,661
Gross Unrealized Depreciation (238,082)
Net Unrealized Appreciation (Depreciation) 6,807,579
F. During the year ended September 30, 2021, the fund purchased $891,030,000 of investmentsecurities and sold $1,807,418,000 of investment securities, other than temporary cashinvestments.
PRIMECAP Core Fund
19

G. Capital shares issued and redeemed were:
Year Ended September 30,
2021Shares
(000)
2020Shares
(000)
Issued 43,207 21,308
Issued in Lieu of Cash Distributions 22,897 22,793
Redeemed (66,768) (80,073)
Net Increase (Decrease) in Shares Outstanding (664) (35,972)
H. Management has determined that no events or transactions occurred subsequent toSeptember 30, 2021, that would require recognition or disclosure in these financial statements.
PRIMECAP Core Fund
20
To the Board of Trustees of Vanguard Fenway Funds and Shareholders of Vanguard PRIMECAPCore Fund
Opinion on the Financial StatementsWe have audited the accompanying statement of assets and liabilities, including the schedule ofinvestments, of Vanguard PRIMECAP Core Fund (one of the funds constituting Vanguard FenwayFunds, referred to hereafter as the "Fund") as of September 30, 2021, the related statement ofoperations for the year ended September 30, 2021, the statement of changes in net assets foreach of the two years in the period ended September 30, 2021, including the related notes, andthe financial highlights for each of the five years in the period ended September 30, 2021(collectively referred to as the "financial statements"). In our opinion, the financial statementspresent fairly, in all material respects, the financial position of the Fund as of September 30, 2021,the results of its operations for the year then ended, the changes in its net assets for each of thetwo years in the period ended September 30, 2021 and the financial highlights for each of the fiveyears in the period ended September 30, 2021 in conformity with accounting principles generallyaccepted in the United States of America.
Basis for OpinionThese financial statements are the responsibility of the Fund’s management. Our responsibility isto express an opinion on the Fund’s financial statements based on our audits. We are a publicaccounting firm registered with the Public Company Accounting Oversight Board (United States)("PCAOB") and are required to be independent with respect to the Fund in accordance with theU.S. federal securities laws and the applicable rules and regulations of the Securities and ExchangeCommission and the PCAOB.
We conducted our audits of these financial statements in accordance with the standards of thePCAOB. Those standards require that we plan and perform the audit to obtain reasonableassurance about whether the financial statements are free of material misstatement, whether dueto error or fraud.
Our audits included performing procedures to assess the risks of material misstatement of thefinancial statements, whether due to error or fraud, and performing procedures that respond tothose risks. Such procedures included examining, on a test basis, evidence regarding the amountsand disclosures in the financial statements. Our audits also included evaluating the accountingprinciples used and significant estimates made by management, as well as evaluating the overallpresentation of the financial statements. Our procedures included confirmation of securitiesowned as of September 30, 2021 by correspondence with the custodian, transfer agent andbrokers; when replies were not received from the transfer agent or brokers, we performed otherauditing procedures. We believe that our audits provide a reasonable basis for our opinion.
/s/PricewaterhouseCoopers LLPPhiladelphia, PennsylvaniaNovember 19, 2021
We have served as the auditor of one or more investment companies in The Vanguard Group ofFunds since 1975.
Report of Independent RegisteredPublic Accounting Firm
21
Special 2021 tax information (unaudited) for Vanguard PRIMECAP Core Fund
This information for the fiscal year ended September 30, 2021, is included pursuant to provisionsof the Internal Revenue Code.
The fund distributed $730,704,000 as capital gain dividends (20% rate gain distributions) toshareholders during the fiscal year.
For nonresident alien shareholders, 100% of short-term capital gain dividends distributed by thefund are qualified short-term capital gains.
The fund distributed $124,588,000 of qualified dividend income to shareholders during the fiscalyear.
For corporate shareholders, 99.6% of investment income (dividend income plus short-term gains,if any) qualifies for the dividends-received deduction.
22
The trustees of your mutual fund are there to see that the fund is operated and managed in yourbest interests since, as a shareholder, you are a part owner of the fund. Your fund’s trustees alsoserve on the board of directors of The Vanguard Group, Inc., which is owned by the Vanguard fundsand provides services to them.
A majority of Vanguard’s board members are independent, meaning that they have no affiliationwith Vanguard or the funds they oversee, apart from the sizable personal investments they havemade as private individuals. The independent board members have distinguished backgrounds inbusiness, academia, and public service. Each of the trustees and executive officers oversees 212Vanguard funds.
Information for each trustee and executive officer of the fund appears below. That information, aswell as the Vanguard fund count, is as of the date on the cover of this fund report. The mailingaddress of the trustees and officers is P.O. Box 876, Valley Forge, PA 19482. More informationabout the trustees is in the Statement of Additional Information, which can be obtained, withoutcharge, by contacting Vanguard at 800-662-7447, or online at vanguard.com.
Interested Trustee1
Mortimer J. BuckleyBorn in 1969. Trustee since January 2018. Principaloccupation(s) during the past five years and otherexperience: chairman of the board (2019–present) ofVanguard and of each of the investment companiesserved by Vanguard; chief executive officer(2018–present) of Vanguard; chief executive officer,president, and trustee (2018–present) of each of theinvestment companies served by Vanguard; presidentand director (2017–present) of Vanguard; andpresident (2018–present) of Vanguard MarketingCorporation. Chief investment officer (2013–2017),managing director (2002–2017), head of the RetailInvestor Group (2006–2012), and chief informationofficer (2001–2006) of Vanguard. Chairman of theboard (2011–2017) and trustee (2009–2017) of theChildren’s Hospital of Philadelphia; and trustee(2018–present) and vice chair (2019–present) of TheShipley School.
Independent Trustees
Emerson U. FullwoodBorn in 1948. Trustee since January 2008. Principaloccupation(s) during the past five years and otherexperience: executive chief staff and marketingofficer for North America and corporate vice president(retired 2008) of Xerox Corporation (documentmanagement products and services). Formerpresident of the Worldwide Channels Group, Latin
America, and Worldwide Customer Service andexecutive chief staff officer of Developing Markets ofXerox. Executive in residence and 2009–2010Distinguished Minett Professor at the RochesterInstitute of Technology. Director of SPX FLOW, Inc.(multi-industry manufacturing). Director of theUniversity of Rochester Medical Center, the MonroeCommunity College Foundation, the United Way ofRochester, North Carolina A&T University, andRoberts Wesleyan College. Trustee of the Universityof Rochester.
Amy GutmannBorn in 1949. Trustee since June 2006. Principaloccupation(s) during the past five years and otherexperience: president (2004–present) of theUniversity of Pennsylvania. Christopher H. BrowneDistinguished Professor of Political Science, School ofArts and Sciences, and professor of communication,Annenberg School for Communication, withsecondary faculty appointments in the Department ofPhilosophy, School of Arts and Sciences, and at theGraduate School of Education, University ofPennsylvania.
F. Joseph LoughreyBorn in 1949. Trustee since October 2009. Principaloccupation(s) during the past five years and otherexperience: president and chief operating officer(retired 2009) and vice chairman of the board(2008–2009) of Cummins Inc. (industrial machinery).Chairman of the board of Hillenbrand, Inc. (specializedconsumer services). Director of the V Foundation.
1 Mr. Buckley is considered an “interested person,” as defined in the Investment Company Act of 1940, because he is an officer of the
Vanguard funds.
The People Who Govern Your Fund

Member of the advisory council for the College ofArts and Letters and chair of the advisory board to theKellogg Institute for International Studies, both at theUniversity of Notre Dame. Chairman of the board ofSaint Anselm College.
Mark LoughridgeBorn in 1953. Trustee since March 2012. Principaloccupation(s) during the past five years and otherexperience: senior vice president and chief financialofficer (retired 2013) of IBM (information technologyservices). Fiduciary member of IBM’s RetirementPlan Committee (2004–2013), senior vice presidentand general manager (2002–2004) of IBM GlobalFinancing, vice president and controller (1998–2002)of IBM, and a variety of other prior management rolesat IBM. Member of the Council on Chicago Booth.
Scott C. MalpassBorn in 1962. Trustee since March 2012. Principaloccupation(s) during the past five years and otherexperience: chief investment officer (retired June2020) and vice president (retired June 2020) of theUniversity of Notre Dame. Assistant professor (retiredJune 2020) of finance at the Mendoza College ofBusiness, University of Notre Dame, and member ofthe Notre Dame 403(b) Investment Committee.Member of the board of Catholic InvestmentServices, Inc. (investment advisors) and the board ofsuperintendence of the Institute for the Works ofReligion.
Deanna MulliganBorn in 1963. Trustee since January 2018. Principaloccupation(s) during the past five years and otherexperience: board chair (2020), chief executive officer(2011–2020), and president (2010–2019) of TheGuardian Life Insurance Company of America. Chiefoperating officer (2010–2011) and executive vicepresident (2008–2010) of Individual Life and Disabilityof the Guardian Life Insurance Company of America.Member of the board of the Economic Club of NewYork. Trustee of the Partnership for New York City(business leadership), Chief Executives for CorporatePurpose, NewYork-Presbyterian Hospital, and theBruce Museum (arts and science). Member of theAdvisory Council for the Stanford Graduate School ofBusiness.
André F. PeroldBorn in 1952. Trustee since December 2004. Principaloccupation(s) during the past five years and otherexperience: George Gund Professor of Finance andBanking, Emeritus at the Harvard Business School(retired 2011). Chief investment officer andco-managing partner of HighVista Strategies (privateinvestment firm). Member of the board
(2018–present) of RIT Capital Partners (investmentfirm). Member of the investment committee ofPartners Health Care System.
Sarah Bloom RaskinBorn in 1961. Trustee since January 2018. Principaloccupation(s) during the past five years and otherexperience: deputy secretary (2014–2017) of theUnited States Department of the Treasury. Governor(2010–2014) of the Federal Reserve Board.Commissioner (2007–2010) of financial regulation forthe State of Maryland. Professor (2020–present),Distinguished Fellow of the Global Financial MarketsCenter (2020–present), and Rubenstein Fellow(2017–2020) at Duke University. Trustee(2017–present) of Amherst College and member ofAmherst College Investment Committee(2019–present). Member of the Regenerative CrisisResponse Committee (2020–present).
David A. ThomasBorn in 1956. Trustee since July 2021. Principaloccupation(s) during the past five years and otherexperience: president of Morehouse College(2018–present). Professor of business administration,emeritus at Harvard University (2017–2018). Dean(2011–2016) and professor of management(2016–2017) at the Georgetown UniversityMcDonough School of Business. Director of DTEEnergy Company (2013–present). Trustee of CommonFund (2019–present).
Peter F. VolanakisBorn in 1955. Trustee since July 2009. Principaloccupation(s) during the past five years and otherexperience: president and chief operating officer(retired 2010) of Corning Incorporated(communications equipment) and director of CorningIncorporated (2000–2010) and Dow Corning(2001–2010). Director (2012) of SPX Corporation(multi-industry manufacturing). Overseer of the AmosTuck School of Business Administration, DartmouthCollege (2001–2013). Chairman of the board oftrustees of Colby-Sawyer College. Member of theBMW Group Mobility Council.

Executive Officers
John BendlBorn in 1970. Principal occupation(s) during the pastfive years and other experience: principal ofVanguard. Chief financial officer (2019–present) ofeach of the investment companies served byVanguard. Chief accounting officer, treasurer, andcontroller of Vanguard (2017–present). Partner(2003–2016) at KPMG (audit, tax, and advisoryservices).
Christine M. BuchananBorn in 1970. Principal occupation(s) during the pastfive years and other experience: principal ofVanguard. Treasurer (2017–present) of each of theinvestment companies served by Vanguard. Partner(2005–2017) at KPMG (audit, tax, and advisoryservices).
David CermakBorn in 1960. Principal occupation(s) during the pastfive years and other experience: principal ofVanguard. Finance director (2019–present) of each ofthe investment companies served by Vanguard.Managing director and head (2017–present) ofVanguard Investments Singapore. Managing directorand head (2017–2019) of Vanguard Investments HongKong. Representative director and head (2014–2017)of Vanguard Investments Japan.
John GallowayBorn in 1973. Principal occupation(s) during the pastfive years and other experience: principal ofVanguard. Investment stewardship officer (September2020–present) of each of the investment companiesserved by Vanguard. Head of Investor Advocacy(February 2020–present) and head of MarketingStrategy and Planning (2017–2020) at Vanguard.Deputy assistant to the President of theUnited States (2015).
Peter MahoneyBorn in 1974. Principal occupation(s) during the pastfive years and other experience: principal ofVanguard. Controller (2015–present) of each of theinvestment companies served by Vanguard. Head ofInternational Fund Services (2008–2014) at Vanguard.
Anne E. RobinsonBorn in 1970. Principal occupation(s) during the pastfive years and other experience: general counsel(2016–present) of Vanguard. Secretary (2016–present)of Vanguard and of each of the investmentcompanies served by Vanguard. Managing director(2016–present) of Vanguard. Managing director andgeneral counsel of Global Cards and ConsumerServices (2014–2016) at Citigroup. Counsel(2003–2014) at American Express.
Michael RollingsBorn in 1963. Principal occupation(s) during the pastfive years and other experience: finance director(2017–present) and treasurer (2017) of each of theinvestment companies served by Vanguard.Managing director (2016–present) of Vanguard. Chieffinancial officer (2016–present) of Vanguard. Director(2016–present) of Vanguard Marketing Corporation.Executive vice president and chief financial officer(2006–2016) of MassMutual Financial Group.
John E. SchadlBorn in 1972. Principal occupation(s) during the pastfive years and other experience: principal ofVanguard. Chief compliance officer (2019–present) ofVanguard and of each of the investment companiesserved by Vanguard. Assistant vice president(2019–present) of Vanguard Marketing Corporation.
Vanguard Senior Management Team Matthew Benchener Thomas M. RampullaJoseph Brennan Karin A. RisiMortimer J. Buckley Anne E. RobinsonGregory Davis Michael RollingsJohn James Nitin TandonJohn T. Marcante Lauren ValenteChris D. Mclsaac
Connect with Vanguard® > vanguard.com
Fund Information > 800-662-7447
Direct Investor Account Services > 800-662-2739
Institutional Investor Services > 800-523-1036
Text Telephone for People Who Are Deaf or Hardof Hearing > 800-749-7273
This material may be used in conjunctionwith the offering of shares of any Vanguardfund only if preceded or accompanied bythe fund’s current prospectus.
All comparative mutual fund data are from Morningstar,Inc., unless otherwise noted.
You can obtain a free copy of Vanguard’s proxy votingguidelines by visiting vanguard.com/proxyreporting or bycalling Vanguard at 800-662-2739. The guidelines arealso available from the SEC’s website, www.sec.gov. Inaddition, you may obtain a free report on how your fundvoted the proxies for securities it owned during the 12months ended June 30. To get the report, visit eithervanguard.com/proxyreporting or www.sec.gov.
You can review information about your fund on the SEC’swebsite, and you can receive copies of this information,for a fee, by sending a request via email addressed [email protected].
Source for Bloomberg indexes: Bloomberg IndexServices Limited. Copyright 2021, Bloomberg. All rightsreserved.
© 2021 The Vanguard Group, Inc.All rights reserved.Vanguard Marketing Corporation, Distributor.
Q12200 112021