Embed Size (px)
Citation preview
Vanguard Emerging Markets
Government Bond Index Fund
Semiannual Report | April 30, 2018
Contents
Please note: The opinions expressed in this report are just that—informed opinions. They should not be considered promisesor advice. Also, please keep in mind that the information and opinions cover the period through the date on the front of thisreport. Of course, the risks of investing in your fund are spelled out in the prospectus.
See the Glossary for definitions of investment terms used in this report.About the cover: Nautical images have been part of Vanguard’s rich heritage since its start in 1975. For anincoming ship, a lighthouse offers a beacon and safe path to shore. You can similarly depend on Vanguard to putyou first––and light the way––as you strive to meet your financial goals. Our client focus and low costs,stemming from our unique ownership structure, assure that your interests are paramount.
Vanguard’s Principles for Investing Success
We want to give you the best chance of investment success. Theseprinciples, grounded in Vanguard’s research and experience, can put you onthe right path.
Goals. Create clear, appropriate investment goals.
Balance. Develop a suitable asset allocation using broadly diversified funds.
Cost. Minimize cost.
Discipline. Maintain perspective and long-term discipline.
A single theme unites these principles: Focus on the things you can control.We believe there is no wiser course for any investor.
Your Fund’s Performance at a Glance. . . . . . . . . . . . . . . . . . 1
CEO’s Perspective. . . . . . . . . . . . . . . . . . . . . . . . . . . . . . . . . 3
Results of Proxy Voting. . . . . . . . . . . . . . . . . . . . . . . . . . . . . 5
Fund Profile. . . . . . . . . . . . . . . . . . . . . . . . . . . . . . . . . . . . . . .7
Performance Summary. . . . . . . . . . . . . . . . . . . . . . . . . . . . . .9
Financial Statements. . . . . . . . . . . . . . . . . . . . . . . . . . . . . . 10
About Your Fund’s Expenses. . . . . . . . . . . . . . . . . . . . . . . . 49
Trustees Approve Advisory Arrangement. . . . . . . . . . . . . . 51
Glossary. . . . . . . . . . . . . . . . . . . . . . . . . . . . . . . . . . . . . . . . 53
Your Fund’s Performance at a Glance
1
Total Returns: Six Months Ended April 30, 2018
30-Day SECYield
IncomeReturns
CapitalReturns
TotalReturns
Vanguard Emerging Markets Government Bond Index Fund
Investor Shares 4.37% 1.95% -4.64% -2.69%
ETF Shares 4.54
Market Price -2.76
Net Asset Value -2.59
Admiral™ Shares 4.54 2.04 -4.64 -2.60
Institutional Shares 4.57 2.06 -4.62 -2.56
Bloomberg Barclays USD Emerging Markets GovernmentRIC Capped Index -2.46
Emerging Markets Hard Currency Debt Funds Average -1.04
Emerging Markets Hard Currency Debt Funds Average: Derived from data provided by Lipper, a Thomson Reuters Company.
Admiral Shares carry lower expenses and are available to investors who meet certain account-balance requirements. The Vanguard ETF®Shares shown are traded on the Nasdaq exchange and are available only through brokers. The table provides ETF returns based on boththe Nasdaq market price and the net asset value for a share. U.S. Pat. Nos. 6,879,964; 7,337,138; 7,720,749; 7,925,573; 8,090,646; and8,417,623.
For the ETF Shares, the market price is determined by the midpoint of the bid-offer spread as of the closing time of the New York Stock Exchange (generally 4 p.m., Eastern time). The net asset value is also determined as of the NYSE closing time. For more information about how the ETF Shares' market prices have compared with their net asset value, visit vanguard.com, select your ETF, and then select the Price and Performance tab. The ETF premium/discount analysis there shows the percentages of days on which the ETF Shares' market price was above or below the NAV.
• For the six months ended April 30, 2018, Vanguard Emerging Markets Government
Bond Index Fund returned –2.69% for Investor Shares. That was in line with the
performance of its benchmark (–2.46%) after taking the cost of running the fund
into account. The fund’s peer group had an average return of –1.04%.
• The period was marked by rising interest rates and an upswing in volatility, which
seemed to result from an accumulation of concerns. Among them were the prospect
of an upturn in inflation, a more aggressive pace of monetary tightening, and a flare-up
in global trade tensions. Emerging-market bonds repriced significantly in February, and
yield spreads with U.S. Treasuries ended the fiscal half year a little wider.
• Among the larger constituents in the index, South Africa outperformed significantly
as reform momentum accelerated. So did Brazil, which pulled out of recession. Laggards
included Indonesia, Argentina, Saudi Arabia, and Venezuela.

2
Expense RatiosYour Fund Compared With Its Peer Group
Investor
Shares
ETF
Shares
Admiral
Shares
Institutional
Shares
Peer Group
Average
Emerging Markets Government Bond Index
Fund 0.49% 0.32% 0.32% 0.29% 1.13%
The fund expense ratios shown are from the prospectus dated February 22, 2018, and represent estimated costs for the current fiscal year.For the six months ended April 30, 2018, the fund’s annualized expense ratios were 0.49% for Investor Shares, 0.32% for ETF Shares,0.32% for Admiral Shares, and 0.29% for Institutional Shares. The peer-group expense ratio is derived from data provided by Lipper, aThomson Reuters Company, and captures information through year-end 2017.
Peer group: Emerging Markets Hard Currency Debt Funds.

Dear Shareholder,
I feel extremely fortunate to have the
chance to lead a company filled with
people who come to work every day
passionate about Vanguard’s core
purpose: to take a stand for all investors,
to treat them fairly, and to give them the
best chance for investment success.
When I joined Vanguard in 1991,
I found a mission-driven team focused
on improving lives—helping people retire
more comfortably, put their children
through college, and achieve financial
security. I also found a company with
purpose in an industry ripe for
improvement.
It was clear, even early in my career,
that the cards were stacked against most
investors. Hidden fees, performance-
chasing, and poor advice were relentlessly
eroding investors’ dreams.
We knew Vanguard could be different
and, as a result, could make a real
difference. We have lowered the costs
of investing for our shareholders
significantly. And we’re proud of the
performance of our funds.
Vanguard is built for Vanguard
investors—we focus solely on you,
our fund shareholders. Everything we
do is designed to give our clients the
best chance for investment success.
In my role as CEO, I’ll keep this priority
CEO’s Perspective
Tim Buckley
President and Chief Executive Officer
3
front and center. We’re proud of what
we’ve achieved, but we’re even more
excited about what’s to come.
Steady, time-tested guidance
Our guidance for investors, as always, is
to stay the course, tune out the hyperbolic
headlines, and focus on your goals and
what you can control, such as costs and
how much you save. This time-tested
advice has served our clients well over
the decades.
Regardless of how the markets perform
in the short term, I’m incredibly optimistic
about the future for our investors. We
have a dedicated team serving you,
and we will never stop striving to make
Vanguard the best place for you to
invest through our high-quality funds
and services, advice and guidance
to help you meet your financial goals,
and an experience that makes you
feel good about entrusting us with
your hard-earned savings.
Thank you for your continued loyalty.
Sincerely,
Mortimer J. Buckley
President and Chief Executive Officer
May 16, 2018
Market Barometer
Total Returns
Periods Ended April 30, 2018
Six One Five Years
Months Year (Annualized)
Stocks
Russell 1000 Index (Large-caps) 3.83% 13.17% 12.84%
Russell 2000 Index (Small-caps) 3.27 11.54 11.74
Russell 3000 Index (Broad U.S. market) 3.79 13.05 12.75
FTSE All-World ex US Index (International) 3.72 15.84 5.85
Bonds
Bloomberg Barclays U.S. Aggregate Bond Index
(Broad taxable market) -1.87% -0.32% 1.47%
Bloomberg Barclays Municipal Bond Index
(Broad tax-exempt market) -0.97 1.56 2.44
Citigroup Three-Month U.S. Treasury Bill Index 0.67 1.16 0.32
CPI
Consumer Price Index 1.57% 2.46% 1.50%
4
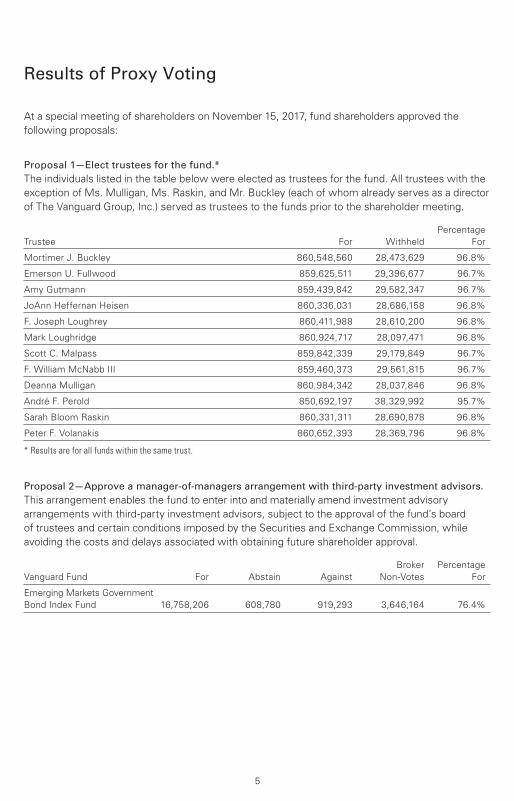
Results of Proxy Voting
At a special meeting of shareholders on November 15, 2017, fund shareholders approved the
following proposals:
Proposal 1—Elect trustees for the fund.*
The individuals listed in the table below were elected as trustees for the fund. All trustees with the
exception of Ms. Mulligan, Ms. Raskin, and Mr. Buckley (each of whom already serves as a director
of The Vanguard Group, Inc.) served as trustees to the funds prior to the shareholder meeting.
Percentage
Trustee For Withheld For
Mortimer J. Buckley 860,548,560 28,473,629 96.8%
Emerson U. Fullwood 859,625,511 29,396,677 96.7%
Amy Gutmann 859,439,842 29,582,347 96.7%
JoAnn Heffernan Heisen 860,336,031 28,686,158 96.8%
F. Joseph Loughrey 860,411,988 28,610,200 96.8%
Mark Loughridge 860,924,717 28,097,471 96.8%
Scott C. Malpass 859,842,339 29,179,849 96.7%
F. William McNabb III 859,460,373 29,561,815 96.7%
Deanna Mulligan 860,984,342 28,037,846 96.8%
André F. Perold 850,692,197 38,329,992 95.7%
Sarah Bloom Raskin 860,331,311 28,690,878 96.8%
Peter F. Volanakis 860,652,393 28,369,796 96.8%
* Results are for all funds within the same trust.
Proposal 2—Approve a manager-of-managers arrangement with third-party investment advisors.
This arrangement enables the fund to enter into and materially amend investment advisory
arrangements with third-party investment advisors, subject to the approval of the fund’s board
of trustees and certain conditions imposed by the Securities and Exchange Commission, while
avoiding the costs and delays associated with obtaining future shareholder approval.
Broker Percentage
Vanguard Fund For Abstain Against Non-Votes For
Emerging Markets Government
Bond Index Fund 16,758,206 608,780 919,293 3,646,164 76.4%
5
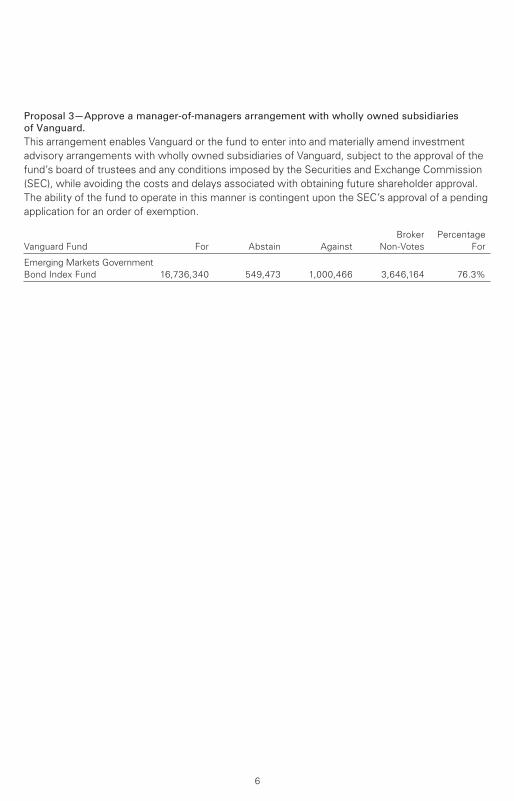
Proposal 3—Approve a manager-of-managers arrangement with wholly owned subsidiaries
of Vanguard.
This arrangement enables Vanguard or the fund to enter into and materially amend investment
advisory arrangements with wholly owned subsidiaries of Vanguard, subject to the approval of the
fund’s board of trustees and any conditions imposed by the Securities and Exchange Commission
(SEC), while avoiding the costs and delays associated with obtaining future shareholder approval.
The ability of the fund to operate in this manner is contingent upon the SEC’s approval of a pending
application for an order of exemption.
Broker Percentage
Vanguard Fund For Abstain Against Non-Votes For
Emerging Markets Government
Bond Index Fund 16,736,340 549,473 1,000,466 3,646,164 76.3%
6
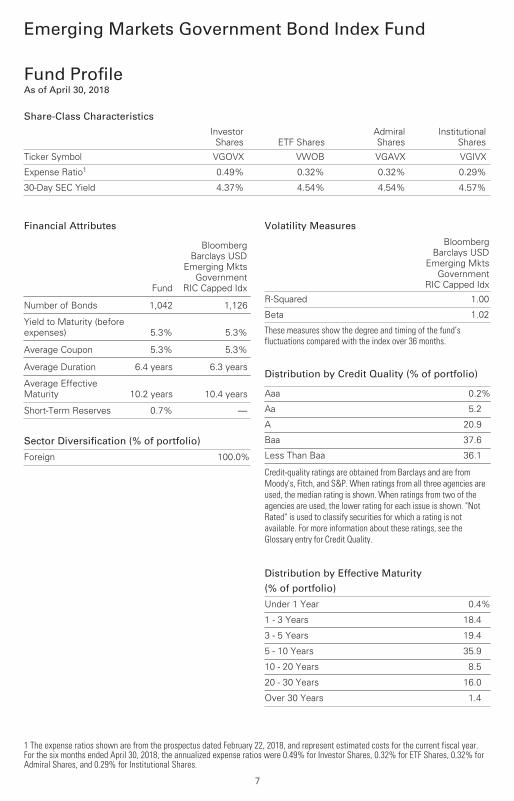
Emerging Markets Government Bond Index Fund
Fund ProfileAs of April 30, 2018
1 The expense ratios shown are from the prospectus dated February 22, 2018, and represent estimated costs for the current fiscal year.For the six months ended April 30, 2018, the annualized expense ratios were 0.49% for Investor Shares, 0.32% for ETF Shares, 0.32% forAdmiral Shares, and 0.29% for Institutional Shares.
7
Financial Attributes
Fund
Bloomberg
Barclays USD
Emerging Mkts
Government
RIC Capped Idx
Number of Bonds 1,042 1,126
Yield to Maturity (before
expenses) 5.3% 5.3%
Average Coupon 5.3% 5.3%
Average Duration 6.4 years 6.3 years
Average Effective
Maturity 10.2 years 10.4 years
Short-Term Reserves 0.7% —
Distribution by Credit Quality (% of portfolio)
Aaa 0.2%
Aa 5.2
A 20.9
Baa 37.6
Less Than Baa 36.1
Credit-quality ratings are obtained from Barclays and are from Moody's, Fitch, and S&P. When ratings from all three agencies are used, the median rating is shown. When ratings from two of the agencies are used, the lower rating for each issue is shown. "Not Rated" is used to classify securities for which a rating is not available. For more information about these ratings, see the Glossary entry for Credit Quality.
Sector Diversification (% of portfolio)
Foreign 100.0%
Distribution by Effective Maturity
(% of portfolio)
Under 1 Year 0.4%
1 - 3 Years 18.4
3 - 5 Years 19.4
5 - 10 Years 35.9
10 - 20 Years 8.5
20 - 30 Years 16.0
Over 30 Years 1.4
Volatility Measures
Bloomberg
Barclays USD
Emerging Mkts
Government
RIC Capped Idx
R-Squared 1.00
Beta 1.02
These measures show the degree and timing of the fund’s fluctuations compared with the index over 36 months.
Share-Class Characteristics
Investor
Shares ETF Shares
Admiral
Shares
Institutional
Shares
Ticker Symbol VGOVX VWOB VGAVX VGIVX
Expense Ratio1 0.49% 0.32% 0.32% 0.29%
30-Day SEC Yield 4.37% 4.54% 4.54% 4.57%
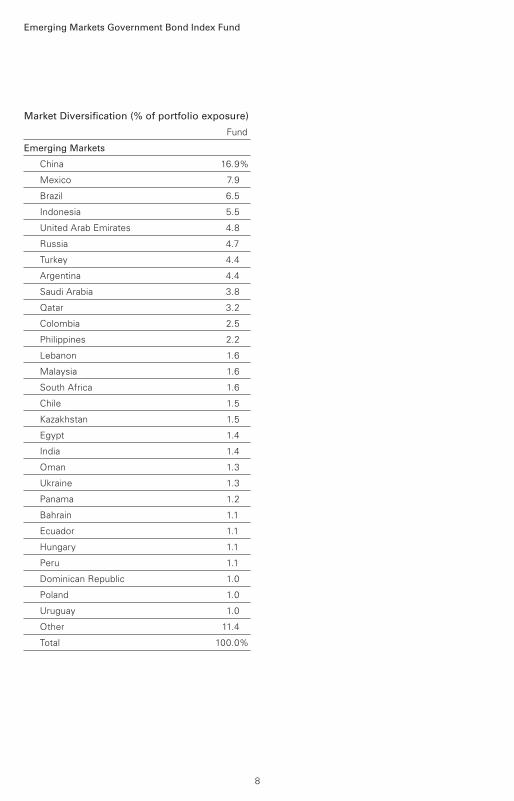
Emerging Markets Government Bond Index Fund
8
Market Diversification (% of portfolio exposure)
Fund
Emerging Markets
China 16.9%
Mexico 7.9
Brazil 6.5
Indonesia 5.5
United Arab Emirates 4.8
Russia 4.7
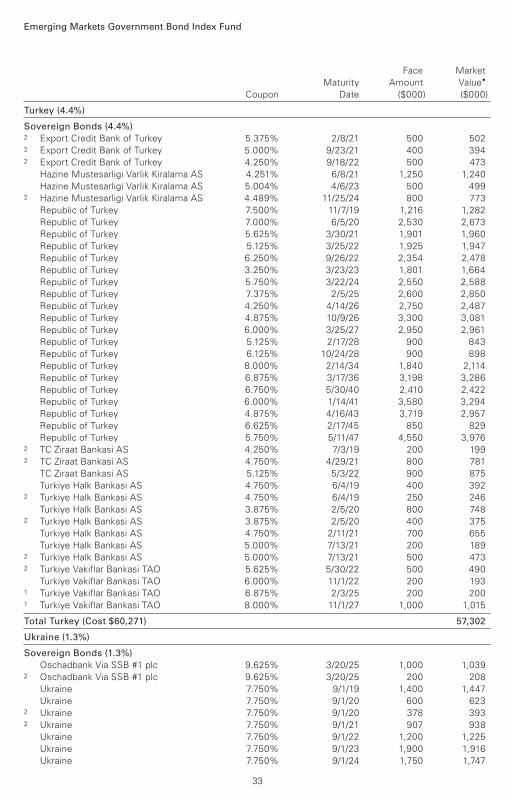
Turkey 4.4
Argentina 4.4
Saudi Arabia 3.8
Qatar 3.2
Colombia 2.5
Philippines 2.2
Lebanon 1.6
Malaysia 1.6
South Africa 1.6
Chile 1.5
Kazakhstan 1.5
Egypt 1.4
India 1.4
Oman 1.3
Ukraine 1.3
Panama 1.2
Bahrain 1.1
Ecuador 1.1
Hungary 1.1
Peru 1.1
Dominican Republic 1.0
Poland 1.0
Uruguay 1.0
Other 11.4
Total 100.0%
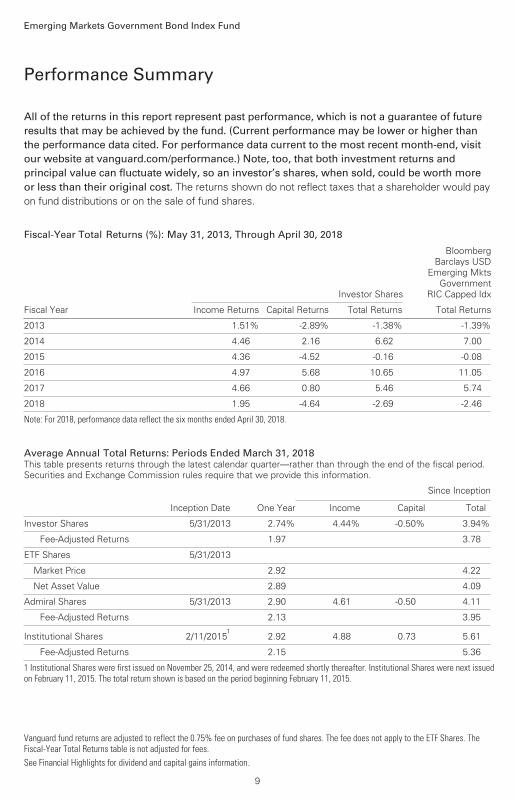
All of the returns in this report represent past performance, which is not a guarantee of future results that may be achieved by the fund. (Current performance may be lower or higher thanthe performance data cited. For performance data current to the most recent month-end, visitour website at vanguard.com/performance.) Note, too, that both investment returns and principal value can fluctuate widely, so an investor’s shares, when sold, could be worth more or less than their original cost. The returns shown do not reflect taxes that a shareholder would pay
on fund distributions or on the sale of fund shares.
Emerging Markets Government Bond Index Fund
Performance Summary
Vanguard fund returns are adjusted to reflect the 0.75% fee on purchases of fund shares. The fee does not apply to the ETF Shares. TheFiscal-Year Total Returns table is not adjusted for fees.See Financial Highlights for dividend and capital gains information.
9
Fiscal-Year Total Returns (%): May 31, 2013, Through April 30, 2018
Investor Shares
BloombergBarclays USD
Emerging MktsGovernment
RIC Capped Idx
Fiscal Year Income Returns Capital Returns Total Returns Total Returns
2013 1.51% -2.89% -1.38% -1.39%
2014 4.46 2.16 6.62 7.00
2015 4.36 -4.52 -0.16 -0.08
2016 4.97 5.68 10.65 11.05
2017 4.66 0.80 5.46 5.74
2018 1.95 -4.64 -2.69 -2.46
Note: For 2018, performance data reflect the six months ended April 30, 2018.
Average Annual Total Returns: Periods Ended March 31, 2018 This table presents returns through the latest calendar quarter—rather than through the end of the fiscal period.
Securities and Exchange Commission rules require that we provide this information.
Since Inception
Inception Date One Year Income Capital Total
Investor Shares 5/31/2013 2.74% 4.44% -0.50% 3.94%
Fee-Adjusted Returns 1.97 3.78
ETF Shares 5/31/2013
Market Price 2.92 4.22
Net Asset Value 2.89 4.09
Admiral Shares 5/31/2013 2.90 4.61 -0.50 4.11
Fee-Adjusted Returns 2.13 3.95
Institutional Shares 2/11/20151
2.92 4.88 0.73 5.61
Fee-Adjusted Returns 2.15 5.36
1 Institutional Shares were first issued on November 25, 2014, and were redeemed shortly thereafter. Institutional Shares were next issued on February 11, 2015. The total return shown is based on the period beginning February 11, 2015.
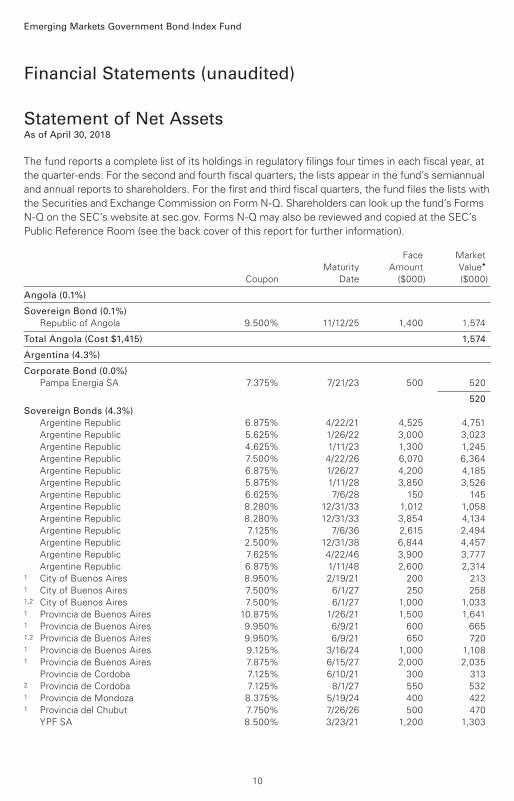
Emerging Markets Government Bond Index Fund
Financial Statements (unaudited)
Statement of Net AssetsAs of April 30, 2018
Angola (0.1%)
Sovereign Bond (0.1%)
Republic of Angola 9.500% 11/12/25 1,400 1,574
Total Angola (Cost $1,415) 1,574
Argentina (4.3%)
Corporate Bond (0.0%)
Pampa Energia SA 7.375% 7/21/23 500 520
520
Sovereign Bonds (4.3%)
Argentine Republic 6.875% 4/22/21 4,525 4,751
Argentine Republic 5.625% 1/26/22 3,000 3,023
Argentine Republic 4.625% 1/11/23 1,300 1,245
Argentine Republic 7.500% 4/22/26 6,070 6,364
Argentine Republic 6.875% 1/26/27 4,200 4,185
Argentine Republic 5.875% 1/11/28 3,850 3,526
Argentine Republic 6.625% 7/6/28 150 145
Argentine Republic 8.280% 12/31/33 1,012 1,058
Argentine Republic 8.280% 12/31/33 3,854 4,134
Argentine Republic 7.125% 7/6/36 2,615 2,494
Argentine Republic 2.500% 12/31/38 6,844 4,457
Argentine Republic 7.625% 4/22/46 3,900 3,777
Argentine Republic 6.875% 1/11/48 2,600 2,3141 City of Buenos Aires 8.950% 2/19/21 200 2131 City of Buenos Aires 7.500% 6/1/27 250 2581,2 City of Buenos Aires 7.500% 6/1/27 1,000 1,0331 Provincia de Buenos Aires 10.875% 1/26/21 1,500 1,6411 Provincia de Buenos Aires 9.950% 6/9/21 600 6651,2 Provincia de Buenos Aires 9.950% 6/9/21 650 7201 Provincia de Buenos Aires 9.125% 3/16/24 1,000 1,1081 Provincia de Buenos Aires 7.875% 6/15/27 2,000 2,035
Provincia de Cordoba 7.125% 6/10/21 300 3132 Provincia de Cordoba 7.125% 8/1/27 550 5321 Provincia de Mondoza 8.375% 5/19/24 400 4221 Provincia del Chubut 7.750% 7/26/26 500 470
YPF SA 8.500% 3/23/21 1,200 1,303
Face Market
Maturity Amount Value•
Coupon Date ($000) ($000)
The fund reports a complete list of its holdings in regulatory filings four times in each fiscal year, at
the quarter-ends. For the second and fourth fiscal quarters, the lists appear in the fund’s semiannual
and annual reports to shareholders. For the first and third fiscal quarters, the fund files the lists with
the Securities and Exchange Commission on Form N-Q. Shareholders can look up the fund’s Forms
N-Q on the SEC’s website at sec.gov. Forms N-Q may also be reviewed and copied at the SEC’s
Public Reference Room (see the back cover of this report for further information).
10
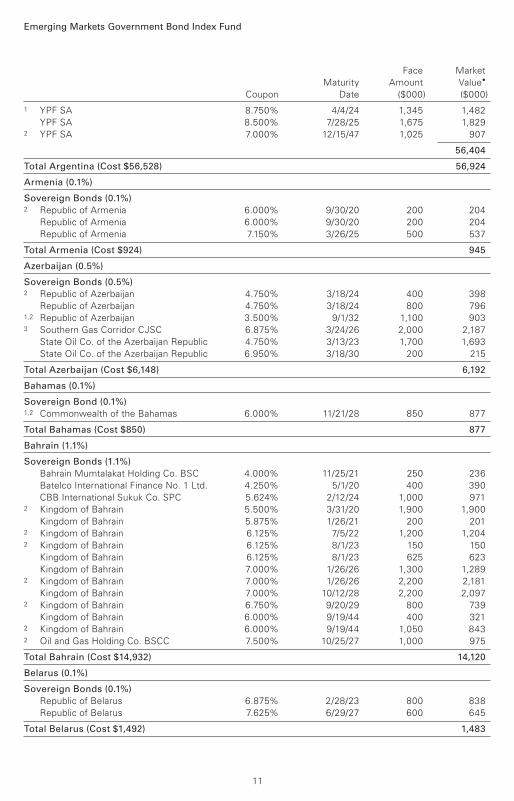
Emerging Markets Government Bond Index Fund
1 YPF SA 8.750% 4/4/24 1,345 1,482
YPF SA 8.500% 7/28/25 1,675 1,8292 YPF SA 7.000% 12/15/47 1,025 907
56,404
Total Argentina (Cost $56,528) 56,924
Armenia (0.1%)
Sovereign Bonds (0.1%) 2 Republic of Armenia 6.000% 9/30/20 200 204
Republic of Armenia 6.000% 9/30/20 200 204
Republic of Armenia 7.150% 3/26/25 500 537
Total Armenia (Cost $924) 945
Azerbaijan (0.5%)
Sovereign Bonds (0.5%) 2 Republic of Azerbaijan 4.750% 3/18/24 400 398
Republic of Azerbaijan 4.750% 3/18/24 800 7961,2 Republic of Azerbaijan 3.500% 9/1/32 1,100 9033 Southern Gas Corridor CJSC 6.875% 3/24/26 2,000 2,187
State Oil Co. of the Azerbaijan Republic 4.750% 3/13/23 1,700 1,693
State Oil Co. of the Azerbaijan Republic 6.950% 3/18/30 200 215
Total Azerbaijan (Cost $6,148) 6,192
Bahamas (0.1%)
Sovereign Bond (0.1%) 1,2 Commonwealth of the Bahamas 6.000% 11/21/28 850 877
Total Bahamas (Cost $850) 877
Bahrain (1.1%)
Sovereign Bonds (1.1%)
Bahrain Mumtalakat Holding Co. BSC 4.000% 11/25/21 250 236
Batelco International Finance No. 1 Ltd. 4.250% 5/1/20 400 390
CBB International Sukuk Co. SPC 5.624% 2/12/24 1,000 9712 Kingdom of Bahrain 5.500% 3/31/20 1,900 1,900
Kingdom of Bahrain 5.875% 1/26/21 200 2012 Kingdom of Bahrain 6.125% 7/5/22 1,200 1,2042 Kingdom of Bahrain 6.125% 8/1/23 150 150
Kingdom of Bahrain 6.125% 8/1/23 625 623
Kingdom of Bahrain 7.000% 1/26/26 1,300 1,2892 Kingdom of Bahrain 7.000% 1/26/26 2,200 2,181
Kingdom of Bahrain 7.000% 10/12/28 2,200 2,0972 Kingdom of Bahrain 6.750% 9/20/29 800 739
Kingdom of Bahrain 6.000% 9/19/44 400 3212 Kingdom of Bahrain 6.000% 9/19/44 1,050 8432 Oil and Gas Holding Co. BSCC 7.500% 10/25/27 1,000 975
Total Bahrain (Cost $14,932) 14,120
Belarus (0.1%)
Sovereign Bonds (0.1%)
Republic of Belarus 6.875% 2/28/23 800 838
Republic of Belarus 7.625% 6/29/27 600 645
Total Belarus (Cost $1,492) 1,483
Face Market
Maturity Amount Value•
Coupon Date ($000) ($000)
11
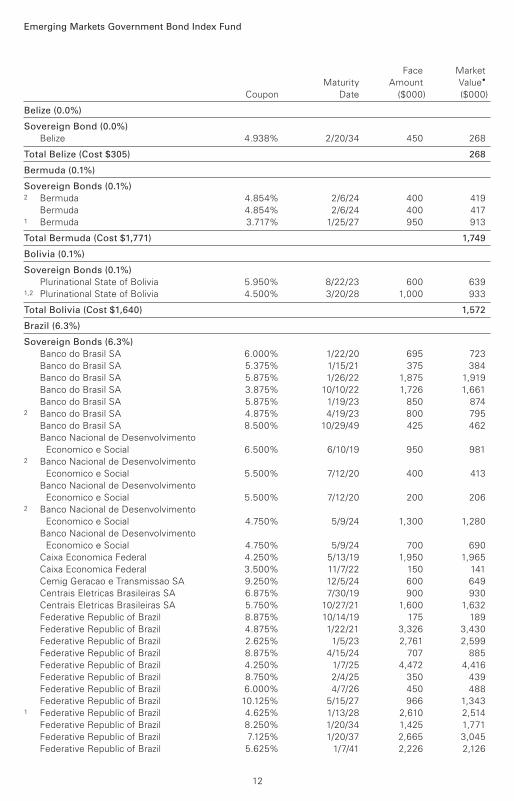
Emerging Markets Government Bond Index Fund
Belize (0.0%)
Sovereign Bond (0.0%)
Belize 4.938% 2/20/34 450 268
Total Belize (Cost $305) 268
Bermuda (0.1%)
Sovereign Bonds (0.1%) 2 Bermuda 4.854% 2/6/24 400 419
Bermuda 4.854% 2/6/24 400 4171 Bermuda 3.717% 1/25/27 950 913
Total Bermuda (Cost $1,771) 1,749
Bolivia (0.1%)
Sovereign Bonds (0.1%)
Plurinational State of Bolivia 5.950% 8/22/23 600 6391,2 Plurinational State of Bolivia 4.500% 3/20/28 1,000 933
Total Bolivia (Cost $1,640) 1,572
Brazil (6.3%)
Sovereign Bonds (6.3%)
Banco do Brasil SA 6.000% 1/22/20 695 723
Banco do Brasil SA 5.375% 1/15/21 375 384
Banco do Brasil SA 5.875% 1/26/22 1,875 1,919
Banco do Brasil SA 3.875% 10/10/22 1,726 1,661
Banco do Brasil SA 5.875% 1/19/23 850 8742 Banco do Brasil SA 4.875% 4/19/23 800 795
Banco do Brasil SA 8.500% 10/29/49 425 462
Banco Nacional de Desenvolvimento
Economico e Social 6.500% 6/10/19 950 9812 Banco Nacional de Desenvolvimento
Economico e Social 5.500% 7/12/20 400 413
Banco Nacional de Desenvolvimento
Economico e Social 5.500% 7/12/20 200 2062 Banco Nacional de Desenvolvimento
Economico e Social 4.750% 5/9/24 1,300 1,280
Banco Nacional de Desenvolvimento
Economico e Social 4.750% 5/9/24 700 690
Caixa Economica Federal 4.250% 5/13/19 1,950 1,965
Caixa Economica Federal 3.500% 11/7/22 150 141
Cemig Geracao e Transmissao SA 9.250% 12/5/24 600 649
Centrais Eletricas Brasileiras SA 6.875% 7/30/19 900 930
Centrais Eletricas Brasileiras SA 5.750% 10/27/21 1,600 1,632
Federative Republic of Brazil 8.875% 10/14/19 175 189
Federative Republic of Brazil 4.875% 1/22/21 3,326 3,430
Federative Republic of Brazil 2.625% 1/5/23 2,761 2,599
Federative Republic of Brazil 8.875% 4/15/24 707 885
Federative Republic of Brazil 4.250% 1/7/25 4,472 4,416
Federative Republic of Brazil 8.750% 2/4/25 350 439
Federative Republic of Brazil 6.000% 4/7/26 450 488
Federative Republic of Brazil 10.125% 5/15/27 966 1,3431 Federative Republic of Brazil 4.625% 1/13/28 2,610 2,514
Federative Republic of Brazil 8.250% 1/20/34 1,425 1,771
Federative Republic of Brazil 7.125% 1/20/37 2,665 3,045
Federative Republic of Brazil 5.625% 1/7/41 2,226 2,126
Face Market
Maturity Amount Value•
Coupon Date ($000) ($000)
12
Emerging Markets Government Bond Index Fund
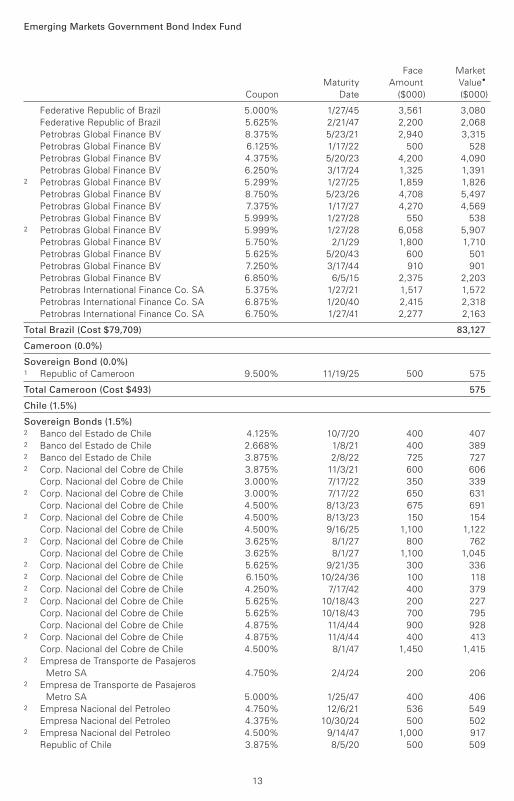
Federative Republic of Brazil 5.000% 1/27/45 3,561 3,080
Federative Republic of Brazil 5.625% 2/21/47 2,200 2,068
Petrobras Global Finance BV 8.375% 5/23/21 2,940 3,315
Petrobras Global Finance BV 6.125% 1/17/22 500 528
Petrobras Global Finance BV 4.375% 5/20/23 4,200 4,090
Petrobras Global Finance BV 6.250% 3/17/24 1,325 1,3912 Petrobras Global Finance BV 5.299% 1/27/25 1,859 1,826
Petrobras Global Finance BV 8.750% 5/23/26 4,708 5,497
Petrobras Global Finance BV 7.375% 1/17/27 4,270 4,569
Petrobras Global Finance BV 5.999% 1/27/28 550 5382 Petrobras Global Finance BV 5.999% 1/27/28 6,058 5,907
Petrobras Global Finance BV 5.750% 2/1/29 1,800 1,710
Petrobras Global Finance BV 5.625% 5/20/43 600 501
Petrobras Global Finance BV 7.250% 3/17/44 910 901
Petrobras Global Finance BV 6.850% 6/5/15 2,375 2,203
Petrobras International Finance Co. SA 5.375% 1/27/21 1,517 1,572
Petrobras International Finance Co. SA 6.875% 1/20/40 2,415 2,318
Petrobras International Finance Co. SA 6.750% 1/27/41 2,277 2,163
Total Brazil (Cost $79,709) 83,127
Cameroon (0.0%)
Sovereign Bond (0.0%) 1 Republic of Cameroon 9.500% 11/19/25 500 575
Total Cameroon (Cost $493) 575
Chile (1.5%)
Sovereign Bonds (1.5%) 2 Banco del Estado de Chile 4.125% 10/7/20 400 4072 Banco del Estado de Chile 2.668% 1/8/21 400 3892 Banco del Estado de Chile 3.875% 2/8/22 725 7272 Corp. Nacional del Cobre de Chile 3.875% 11/3/21 600 606
Corp. Nacional del Cobre de Chile 3.000% 7/17/22 350 3392 Corp. Nacional del Cobre de Chile 3.000% 7/17/22 650 631
Corp. Nacional del Cobre de Chile 4.500% 8/13/23 675 6912 Corp. Nacional del Cobre de Chile 4.500% 8/13/23 150 154
Corp. Nacional del Cobre de Chile 4.500% 9/16/25 1,100 1,1222 Corp. Nacional del Cobre de Chile 3.625% 8/1/27 800 762
Corp. Nacional del Cobre de Chile 3.625% 8/1/27 1,100 1,0452 Corp. Nacional del Cobre de Chile 5.625% 9/21/35 300 3362 Corp. Nacional del Cobre de Chile 6.150% 10/24/36 100 1182 Corp. Nacional del Cobre de Chile 4.250% 7/17/42 400 3792 Corp. Nacional del Cobre de Chile 5.625% 10/18/43 200 227
Corp. Nacional del Cobre de Chile 5.625% 10/18/43 700 795
Corp. Nacional del Cobre de Chile 4.875% 11/4/44 900 9282 Corp. Nacional del Cobre de Chile 4.875% 11/4/44 400 413
Corp. Nacional del Cobre de Chile 4.500% 8/1/47 1,450 1,4152 Empresa de Transporte de Pasajeros
Metro SA 4.750% 2/4/24 200 2062 Empresa de Transporte de Pasajeros
Metro SA 5.000% 1/25/47 400 4062 Empresa Nacional del Petroleo 4.750% 12/6/21 536 549
Empresa Nacional del Petroleo 4.375% 10/30/24 500 5022 Empresa Nacional del Petroleo 4.500% 9/14/47 1,000 917
Republic of Chile 3.875% 8/5/20 500 509
Face Market
Maturity Amount Value•
Coupon Date ($000) ($000)
13
Emerging Markets Government Bond Index Fund
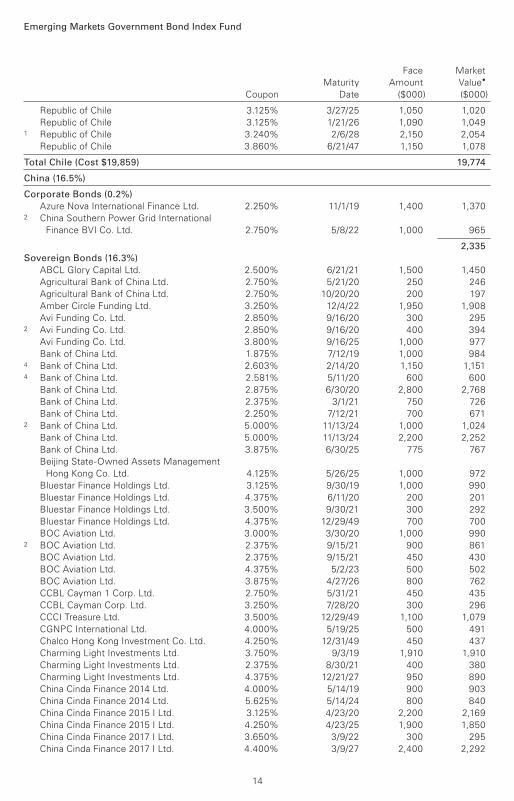
Republic of Chile 3.125% 3/27/25 1,050 1,020
Republic of Chile 3.125% 1/21/26 1,090 1,0491 Republic of Chile 3.240% 2/6/28 2,150 2,054
Republic of Chile 3.860% 6/21/47 1,150 1,078
Total Chile (Cost $19,859) 19,774
China (16.5%)
Corporate Bonds (0.2%)
Azure Nova International Finance Ltd. 2.250% 11/1/19 1,400 1,3702 China Southern Power Grid International
Finance BVI Co. Ltd. 2.750% 5/8/22 1,000 965
2,335
Sovereign Bonds (16.3%)
ABCL Glory Capital Ltd. 2.500% 6/21/21 1,500 1,450
Agricultural Bank of China Ltd. 2.750% 5/21/20 250 246
Agricultural Bank of China Ltd. 2.750% 10/20/20 200 197
Amber Circle Funding Ltd. 3.250% 12/4/22 1,950 1,908
Avi Funding Co. Ltd. 2.850% 9/16/20 300 2952 Avi Funding Co. Ltd. 2.850% 9/16/20 400 394
Avi Funding Co. Ltd. 3.800% 9/16/25 1,000 977
Bank of China Ltd. 1.875% 7/12/19 1,000 9844 Bank of China Ltd. 2.603% 2/14/20 1,150 1,1514 Bank of China Ltd. 2.581% 5/11/20 600 600
Bank of China Ltd. 2.875% 6/30/20 2,800 2,768
Bank of China Ltd. 2.375% 3/1/21 750 726
Bank of China Ltd. 2.250% 7/12/21 700 6712 Bank of China Ltd. 5.000% 11/13/24 1,000 1,024
Bank of China Ltd. 5.000% 11/13/24 2,200 2,252
Bank of China Ltd. 3.875% 6/30/25 775 767
Beijing State-Owned Assets Management
Hong Kong Co. Ltd. 4.125% 5/26/25 1,000 972
Bluestar Finance Holdings Ltd. 3.125% 9/30/19 1,000 990
Bluestar Finance Holdings Ltd. 4.375% 6/11/20 200 201
Bluestar Finance Holdings Ltd. 3.500% 9/30/21 300 292
Bluestar Finance Holdings Ltd. 4.375% 12/29/49 700 700
BOC Aviation Ltd. 3.000% 3/30/20 1,000 9902 BOC Aviation Ltd. 2.375% 9/15/21 900 861
BOC Aviation Ltd. 2.375% 9/15/21 450 430
BOC Aviation Ltd. 4.375% 5/2/23 500 502
BOC Aviation Ltd. 3.875% 4/27/26 800 762
CCBL Cayman 1 Corp. Ltd. 2.750% 5/31/21 450 435
CCBL Cayman Corp. Ltd. 3.250% 7/28/20 300 296
CCCI Treasure Ltd. 3.500% 12/29/49 1,100 1,079
CGNPC International Ltd. 4.000% 5/19/25 500 491
Chalco Hong Kong Investment Co. Ltd. 4.250% 12/31/49 450 437
Charming Light Investments Ltd. 3.750% 9/3/19 1,910 1,910
Charming Light Investments Ltd. 2.375% 8/30/21 400 380
Charming Light Investments Ltd. 4.375% 12/21/27 950 890
China Cinda Finance 2014 Ltd. 4.000% 5/14/19 900 903
China Cinda Finance 2014 Ltd. 5.625% 5/14/24 800 840
China Cinda Finance 2015 I Ltd. 3.125% 4/23/20 2,200 2,169
China Cinda Finance 2015 I Ltd. 4.250% 4/23/25 1,900 1,850
China Cinda Finance 2017 I Ltd. 3.650% 3/9/22 300 295
China Cinda Finance 2017 I Ltd. 4.400% 3/9/27 2,400 2,292
Face Market
Maturity Amount Value•
Coupon Date ($000) ($000)
14
Emerging Markets Government Bond Index Fund
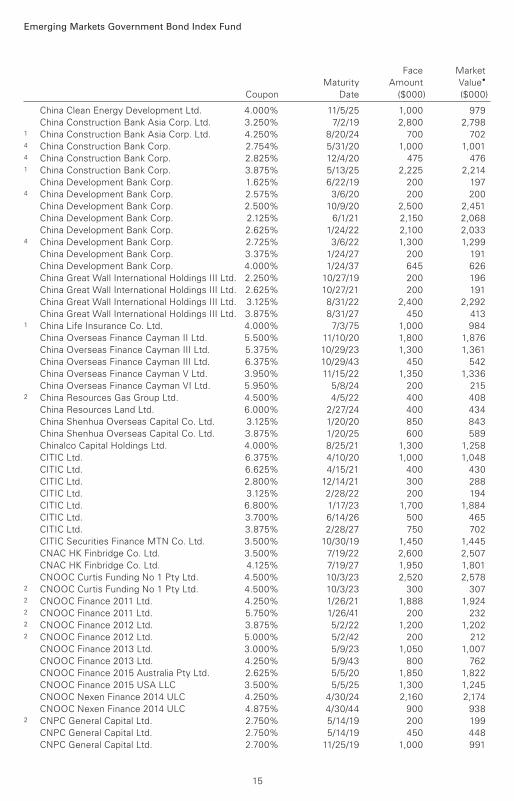
China Clean Energy Development Ltd. 4.000% 11/5/25 1,000 979
China Construction Bank Asia Corp. Ltd. 3.250% 7/2/19 2,800 2,7981 China Construction Bank Asia Corp. Ltd. 4.250% 8/20/24 700 7024 China Construction Bank Corp. 2.754% 5/31/20 1,000 1,0014 China Construction Bank Corp. 2.825% 12/4/20 475 4761 China Construction Bank Corp. 3.875% 5/13/25 2,225 2,214
China Development Bank Corp. 1.625% 6/22/19 200 1974 China Development Bank Corp. 2.575% 3/6/20 200 200
China Development Bank Corp. 2.500% 10/9/20 2,500 2,451
China Development Bank Corp. 2.125% 6/1/21 2,150 2,068
China Development Bank Corp. 2.625% 1/24/22 2,100 2,0334 China Development Bank Corp. 2.725% 3/6/22 1,300 1,299
China Development Bank Corp. 3.375% 1/24/27 200 191
China Development Bank Corp. 4.000% 1/24/37 645 626
China Great Wall International Holdings III Ltd. 2.250% 10/27/19 200 196
China Great Wall International Holdings III Ltd. 2.625% 10/27/21 200 191
China Great Wall International Holdings III Ltd. 3.125% 8/31/22 2,400 2,292
China Great Wall International Holdings III Ltd. 3.875% 8/31/27 450 4131 China Life Insurance Co. Ltd. 4.000% 7/3/75 1,000 984
China Overseas Finance Cayman II Ltd. 5.500% 11/10/20 1,800 1,876
China Overseas Finance Cayman III Ltd. 5.375% 10/29/23 1,300 1,361
China Overseas Finance Cayman III Ltd. 6.375% 10/29/43 450 542
China Overseas Finance Cayman V Ltd. 3.950% 11/15/22 1,350 1,336
China Overseas Finance Cayman VI Ltd. 5.950% 5/8/24 200 2152 China Resources Gas Group Ltd. 4.500% 4/5/22 400 408
China Resources Land Ltd. 6.000% 2/27/24 400 434
China Shenhua Overseas Capital Co. Ltd. 3.125% 1/20/20 850 843
China Shenhua Overseas Capital Co. Ltd. 3.875% 1/20/25 600 589
Chinalco Capital Holdings Ltd. 4.000% 8/25/21 1,300 1,258
CITIC Ltd. 6.375% 4/10/20 1,000 1,048
CITIC Ltd. 6.625% 4/15/21 400 430
CITIC Ltd. 2.800% 12/14/21 300 288
CITIC Ltd. 3.125% 2/28/22 200 194
CITIC Ltd. 6.800% 1/17/23 1,700 1,884
CITIC Ltd. 3.700% 6/14/26 500 465
CITIC Ltd. 3.875% 2/28/27 750 702
CITIC Securities Finance MTN Co. Ltd. 3.500% 10/30/19 1,450 1,445
CNAC HK Finbridge Co. Ltd. 3.500% 7/19/22 2,600 2,507
CNAC HK Finbridge Co. Ltd. 4.125% 7/19/27 1,950 1,801
CNOOC Curtis Funding No 1 Pty Ltd. 4.500% 10/3/23 2,520 2,5782 CNOOC Curtis Funding No 1 Pty Ltd. 4.500% 10/3/23 300 3072 CNOOC Finance 2011 Ltd. 4.250% 1/26/21 1,888 1,9242 CNOOC Finance 2011 Ltd. 5.750% 1/26/41 200 2322 CNOOC Finance 2012 Ltd. 3.875% 5/2/22 1,200 1,2022 CNOOC Finance 2012 Ltd. 5.000% 5/2/42 200 212
CNOOC Finance 2013 Ltd. 3.000% 5/9/23 1,050 1,007
CNOOC Finance 2013 Ltd. 4.250% 5/9/43 800 762
CNOOC Finance 2015 Australia Pty Ltd. 2.625% 5/5/20 1,850 1,822
CNOOC Finance 2015 USA LLC 3.500% 5/5/25 1,300 1,245
CNOOC Nexen Finance 2014 ULC 4.250% 4/30/24 2,160 2,174
CNOOC Nexen Finance 2014 ULC 4.875% 4/30/44 900 9382 CNPC General Capital Ltd. 2.750% 5/14/19 200 199
CNPC General Capital Ltd. 2.750% 5/14/19 450 448
CNPC General Capital Ltd. 2.700% 11/25/19 1,000 991
Face Market
Maturity Amount Value•
Coupon Date ($000) ($000)
15
16
Emerging Markets Government Bond Index Fund
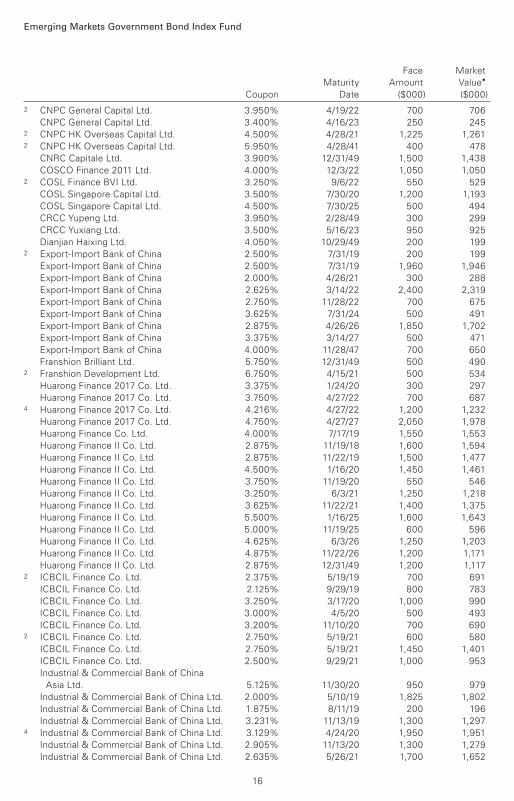
2 CNPC General Capital Ltd. 3.950% 4/19/22 700 706
CNPC General Capital Ltd. 3.400% 4/16/23 250 2452 CNPC HK Overseas Capital Ltd. 4.500% 4/28/21 1,225 1,2612 CNPC HK Overseas Capital Ltd. 5.950% 4/28/41 400 478
CNRC Capitale Ltd. 3.900% 12/31/49 1,500 1,438
COSCO Finance 2011 Ltd. 4.000% 12/3/22 1,050 1,0502 COSL Finance BVI Ltd. 3.250% 9/6/22 550 529
COSL Singapore Capital Ltd. 3.500% 7/30/20 1,200 1,193
COSL Singapore Capital Ltd. 4.500% 7/30/25 500 494
CRCC Yupeng Ltd. 3.950% 2/28/49 300 299
CRCC Yuxiang Ltd. 3.500% 5/16/23 950 925
Dianjian Haixing Ltd. 4.050% 10/29/49 200 1992 Export-Import Bank of China 2.500% 7/31/19 200 199
Export-Import Bank of China 2.500% 7/31/19 1,960 1,946
Export-Import Bank of China 2.000% 4/26/21 300 288
Export-Import Bank of China 2.625% 3/14/22 2,400 2,319
Export-Import Bank of China 2.750% 11/28/22 700 675
Export-Import Bank of China 3.625% 7/31/24 500 491
Export-Import Bank of China 2.875% 4/26/26 1,850 1,702
Export-Import Bank of China 3.375% 3/14/27 500 471
Export-Import Bank of China 4.000% 11/28/47 700 650
Franshion Brilliant Ltd. 5.750% 12/31/49 500 4902 Franshion Development Ltd. 6.750% 4/15/21 500 534
Huarong Finance 2017 Co. Ltd. 3.375% 1/24/20 300 297
Huarong Finance 2017 Co. Ltd. 3.750% 4/27/22 700 6874 Huarong Finance 2017 Co. Ltd. 4.216% 4/27/22 1,200 1,232
Huarong Finance 2017 Co. Ltd. 4.750% 4/27/27 2,050 1,978
Huarong Finance Co. Ltd. 4.000% 7/17/19 1,550 1,553
Huarong Finance II Co. Ltd. 2.875% 11/19/18 1,600 1,594
Huarong Finance II Co. Ltd. 2.875% 11/22/19 1,500 1,477
Huarong Finance II Co. Ltd. 4.500% 1/16/20 1,450 1,461
Huarong Finance II Co. Ltd. 3.750% 11/19/20 550 546
Huarong Finance II Co. Ltd. 3.250% 6/3/21 1,250 1,218
Huarong Finance II Co. Ltd. 3.625% 11/22/21 1,400 1,375
Huarong Finance II Co. Ltd. 5.500% 1/16/25 1,600 1,643
Huarong Finance II Co. Ltd. 5.000% 11/19/25 600 596
Huarong Finance II Co. Ltd. 4.625% 6/3/26 1,250 1,203
Huarong Finance II Co. Ltd. 4.875% 11/22/26 1,200 1,171
Huarong Finance II Co. Ltd. 2.875% 12/31/49 1,200 1,1172 ICBCIL Finance Co. Ltd. 2.375% 5/19/19 700 691
ICBCIL Finance Co. Ltd. 2.125% 9/29/19 800 783
ICBCIL Finance Co. Ltd. 3.250% 3/17/20 1,000 990
ICBCIL Finance Co. Ltd. 3.000% 4/5/20 500 493
ICBCIL Finance Co. Ltd. 3.200% 11/10/20 700 6902 ICBCIL Finance Co. Ltd. 2.750% 5/19/21 600 580
ICBCIL Finance Co. Ltd. 2.750% 5/19/21 1,450 1,401
ICBCIL Finance Co. Ltd. 2.500% 9/29/21 1,000 953
Industrial & Commercial Bank of China
Asia Ltd. 5.125% 11/30/20 950 979
Industrial & Commercial Bank of China Ltd. 2.000% 5/10/19 1,825 1,802
Industrial & Commercial Bank of China Ltd. 1.875% 8/11/19 200 196
Industrial & Commercial Bank of China Ltd. 3.231% 11/13/19 1,300 1,2974 Industrial & Commercial Bank of China Ltd. 3.129% 4/24/20 1,950 1,951
Industrial & Commercial Bank of China Ltd. 2.905% 11/13/20 1,300 1,279
Industrial & Commercial Bank of China Ltd. 2.635% 5/26/21 1,700 1,652
Face Market
Maturity Amount Value•
Coupon Date ($000) ($000)
Emerging Markets Government Bond Index Fund
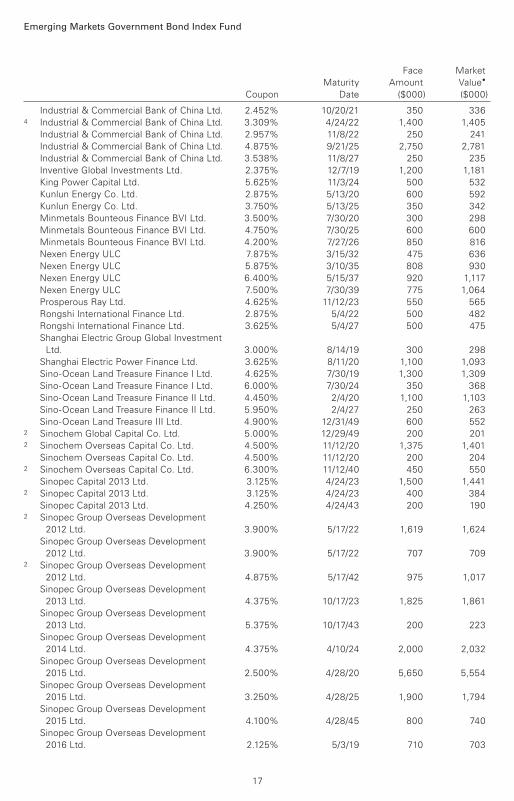
Industrial & Commercial Bank of China Ltd. 2.452% 10/20/21 350 3364 Industrial & Commercial Bank of China Ltd. 3.309% 4/24/22 1,400 1,405
Industrial & Commercial Bank of China Ltd. 2.957% 11/8/22 250 241
Industrial & Commercial Bank of China Ltd. 4.875% 9/21/25 2,750 2,781
Industrial & Commercial Bank of China Ltd. 3.538% 11/8/27 250 235
Inventive Global Investments Ltd. 2.375% 12/7/19 1,200 1,181
King Power Capital Ltd. 5.625% 11/3/24 500 532
Kunlun Energy Co. Ltd. 2.875% 5/13/20 600 592
Kunlun Energy Co. Ltd. 3.750% 5/13/25 350 342
Minmetals Bounteous Finance BVI Ltd. 3.500% 7/30/20 300 298
Minmetals Bounteous Finance BVI Ltd. 4.750% 7/30/25 600 600
Minmetals Bounteous Finance BVI Ltd. 4.200% 7/27/26 850 816
Nexen Energy ULC 7.875% 3/15/32 475 636
Nexen Energy ULC 5.875% 3/10/35 808 930
Nexen Energy ULC 6.400% 5/15/37 920 1,117
Nexen Energy ULC 7.500% 7/30/39 775 1,064
Prosperous Ray Ltd. 4.625% 11/12/23 550 565
Rongshi International Finance Ltd. 2.875% 5/4/22 500 482
Rongshi International Finance Ltd. 3.625% 5/4/27 500 475
Shanghai Electric Group Global Investment
Ltd. 3.000% 8/14/19 300 298
Shanghai Electric Power Finance Ltd. 3.625% 8/11/20 1,100 1,093
Sino-Ocean Land Treasure Finance I Ltd. 4.625% 7/30/19 1,300 1,309
Sino-Ocean Land Treasure Finance I Ltd. 6.000% 7/30/24 350 368
Sino-Ocean Land Treasure Finance II Ltd. 4.450% 2/4/20 1,100 1,103
Sino-Ocean Land Treasure Finance II Ltd. 5.950% 2/4/27 250 263
Sino-Ocean Land Treasure III Ltd. 4.900% 12/31/49 600 5522 Sinochem Global Capital Co. Ltd. 5.000% 12/29/49 200 2012 Sinochem Overseas Capital Co. Ltd. 4.500% 11/12/20 1,375 1,401
Sinochem Overseas Capital Co. Ltd. 4.500% 11/12/20 200 2042 Sinochem Overseas Capital Co. Ltd. 6.300% 11/12/40 450 550
Sinopec Capital 2013 Ltd. 3.125% 4/24/23 1,500 1,4412 Sinopec Capital 2013 Ltd. 3.125% 4/24/23 400 384
Sinopec Capital 2013 Ltd. 4.250% 4/24/43 200 1902 Sinopec Group Overseas Development
2012 Ltd. 3.900% 5/17/22 1,619 1,624
Sinopec Group Overseas Development
2012 Ltd. 3.900% 5/17/22 707 7092 Sinopec Group Overseas Development
2012 Ltd. 4.875% 5/17/42 975 1,017
Sinopec Group Overseas Development
2013 Ltd. 4.375% 10/17/23 1,825 1,861
Sinopec Group Overseas Development
2013 Ltd. 5.375% 10/17/43 200 223
Sinopec Group Overseas Development
2014 Ltd. 4.375% 4/10/24 2,000 2,032
Sinopec Group Overseas Development
2015 Ltd. 2.500% 4/28/20 5,650 5,554
Sinopec Group Overseas Development
2015 Ltd. 3.250% 4/28/25 1,900 1,794
Sinopec Group Overseas Development
2015 Ltd. 4.100% 4/28/45 800 740
Sinopec Group Overseas Development
2016 Ltd. 2.125% 5/3/19 710 703
Face Market
Maturity Amount Value•
Coupon Date ($000) ($000)
17
Emerging Markets Government Bond Index Fund
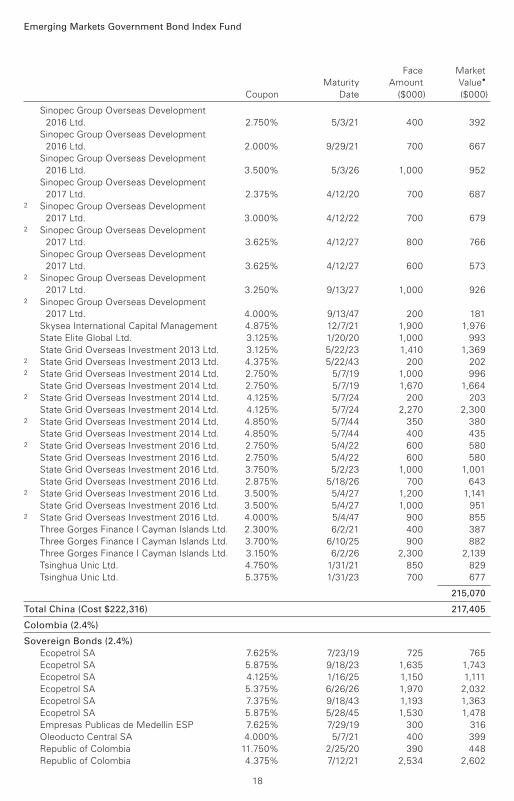
Sinopec Group Overseas Development
2016 Ltd. 2.750% 5/3/21 400 392
Sinopec Group Overseas Development
2016 Ltd. 2.000% 9/29/21 700 667
Sinopec Group Overseas Development
2016 Ltd. 3.500% 5/3/26 1,000 952
Sinopec Group Overseas Development
2017 Ltd. 2.375% 4/12/20 700 6872 Sinopec Group Overseas Development
2017 Ltd. 3.000% 4/12/22 700 6792 Sinopec Group Overseas Development
2017 Ltd. 3.625% 4/12/27 800 766
Sinopec Group Overseas Development
2017 Ltd. 3.625% 4/12/27 600 5732 Sinopec Group Overseas Development
2017 Ltd. 3.250% 9/13/27 1,000 9262 Sinopec Group Overseas Development
2017 Ltd. 4.000% 9/13/47 200 181
Skysea International Capital Management 4.875% 12/7/21 1,900 1,976
State Elite Global Ltd. 3.125% 1/20/20 1,000 993
State Grid Overseas Investment 2013 Ltd. 3.125% 5/22/23 1,410 1,3692 State Grid Overseas Investment 2013 Ltd. 4.375% 5/22/43 200 2022 State Grid Overseas Investment 2014 Ltd. 2.750% 5/7/19 1,000 996
State Grid Overseas Investment 2014 Ltd. 2.750% 5/7/19 1,670 1,6642 State Grid Overseas Investment 2014 Ltd. 4.125% 5/7/24 200 203
State Grid Overseas Investment 2014 Ltd. 4.125% 5/7/24 2,270 2,3002 State Grid Overseas Investment 2014 Ltd. 4.850% 5/7/44 350 380
State Grid Overseas Investment 2014 Ltd. 4.850% 5/7/44 400 4352 State Grid Overseas Investment 2016 Ltd. 2.750% 5/4/22 600 580
State Grid Overseas Investment 2016 Ltd. 2.750% 5/4/22 600 580
State Grid Overseas Investment 2016 Ltd. 3.750% 5/2/23 1,000 1,001
State Grid Overseas Investment 2016 Ltd. 2.875% 5/18/26 700 6432 State Grid Overseas Investment 2016 Ltd. 3.500% 5/4/27 1,200 1,141
State Grid Overseas Investment 2016 Ltd. 3.500% 5/4/27 1,000 9512 State Grid Overseas Investment 2016 Ltd. 4.000% 5/4/47 900 855
Three Gorges Finance I Cayman Islands Ltd. 2.300% 6/2/21 400 387
Three Gorges Finance I Cayman Islands Ltd. 3.700% 6/10/25 900 882
Three Gorges Finance I Cayman Islands Ltd. 3.150% 6/2/26 2,300 2,139
Tsinghua Unic Ltd. 4.750% 1/31/21 850 829
Tsinghua Unic Ltd. 5.375% 1/31/23 700 677
215,070
Total China (Cost $222,316) 217,405
Colombia (2.4%)
Sovereign Bonds (2.4%)
Ecopetrol SA 7.625% 7/23/19 725 765
Ecopetrol SA 5.875% 9/18/23 1,635 1,743
Ecopetrol SA 4.125% 1/16/25 1,150 1,111
Ecopetrol SA 5.375% 6/26/26 1,970 2,032
Ecopetrol SA 7.375% 9/18/43 1,193 1,363
Ecopetrol SA 5.875% 5/28/45 1,530 1,478
Empresas Publicas de Medellin ESP 7.625% 7/29/19 300 316
Oleoducto Central SA 4.000% 5/7/21 400 399
Republic of Colombia 11.750% 2/25/20 390 448
Republic of Colombia 4.375% 7/12/21 2,534 2,602
Face Market
Maturity Amount Value•
Coupon Date ($000) ($000)
18
Emerging Markets Government Bond Index Fund
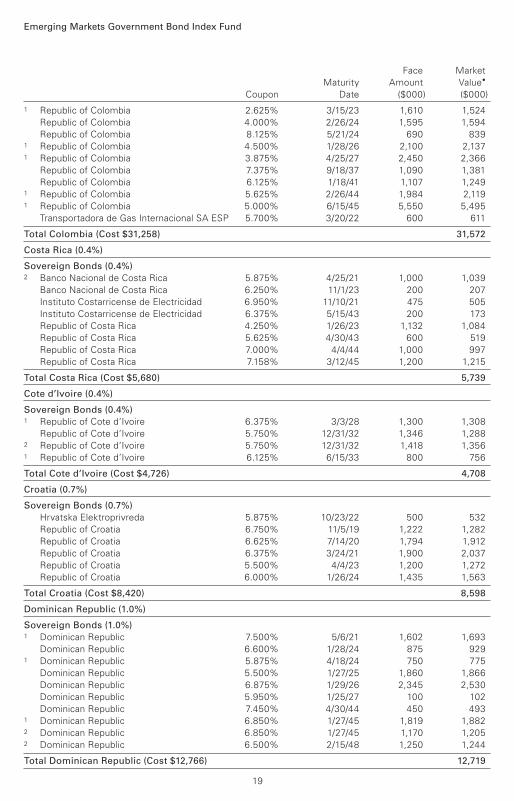
1 Republic of Colombia 2.625% 3/15/23 1,610 1,524
Republic of Colombia 4.000% 2/26/24 1,595 1,594
Republic of Colombia 8.125% 5/21/24 690 8391 Republic of Colombia 4.500% 1/28/26 2,100 2,1371 Republic of Colombia 3.875% 4/25/27 2,450 2,366
Republic of Colombia 7.375% 9/18/37 1,090 1,381
Republic of Colombia 6.125% 1/18/41 1,107 1,2491 Republic of Colombia 5.625% 2/26/44 1,984 2,1191 Republic of Colombia 5.000% 6/15/45 5,550 5,495
Transportadora de Gas Internacional SA ESP 5.700% 3/20/22 600 611
Total Colombia (Cost $31,258) 31,572
Costa Rica (0.4%)
Sovereign Bonds (0.4%) 2 Banco Nacional de Costa Rica 5.875% 4/25/21 1,000 1,039
Banco Nacional de Costa Rica 6.250% 11/1/23 200 207
Instituto Costarricense de Electricidad 6.950% 11/10/21 475 505
Instituto Costarricense de Electricidad 6.375% 5/15/43 200 173
Republic of Costa Rica 4.250% 1/26/23 1,132 1,084
Republic of Costa Rica 5.625% 4/30/43 600 519
Republic of Costa Rica 7.000% 4/4/44 1,000 997
Republic of Costa Rica 7.158% 3/12/45 1,200 1,215
Total Costa Rica (Cost $5,680) 5,739
Cote d’Ivoire (0.4%)
Sovereign Bonds (0.4%) 1 Republic of Cote d’Ivoire 6.375% 3/3/28 1,300 1,308
Republic of Cote d’Ivoire 5.750% 12/31/32 1,346 1,2882 Republic of Cote d’Ivoire 5.750% 12/31/32 1,418 1,3561 Republic of Cote d’Ivoire 6.125% 6/15/33 800 756
Total Cote d’Ivoire (Cost $4,726) 4,708
Croatia (0.7%)
Sovereign Bonds (0.7%)
Hrvatska Elektroprivreda 5.875% 10/23/22 500 532
Republic of Croatia 6.750% 11/5/19 1,222 1,282
Republic of Croatia 6.625% 7/14/20 1,794 1,912
Republic of Croatia 6.375% 3/24/21 1,900 2,037
Republic of Croatia 5.500% 4/4/23 1,200 1,272
Republic of Croatia 6.000% 1/26/24 1,435 1,563
Total Croatia (Cost $8,420) 8,598
Dominican Republic (1.0%)
Sovereign Bonds (1.0%) 1 Dominican Republic 7.500% 5/6/21 1,602 1,693
Dominican Republic 6.600% 1/28/24 875 9291 Dominican Republic 5.875% 4/18/24 750 775
Dominican Republic 5.500% 1/27/25 1,860 1,866
Dominican Republic 6.875% 1/29/26 2,345 2,530
Dominican Republic 5.950% 1/25/27 100 102
Dominican Republic 7.450% 4/30/44 450 4931 Dominican Republic 6.850% 1/27/45 1,819 1,8822 Dominican Republic 6.850% 1/27/45 1,170 1,2052 Dominican Republic 6.500% 2/15/48 1,250 1,244
Total Dominican Republic (Cost $12,766) 12,719
Face Market
Maturity Amount Value•
Coupon Date ($000) ($000)
19
Emerging Markets Government Bond Index Fund
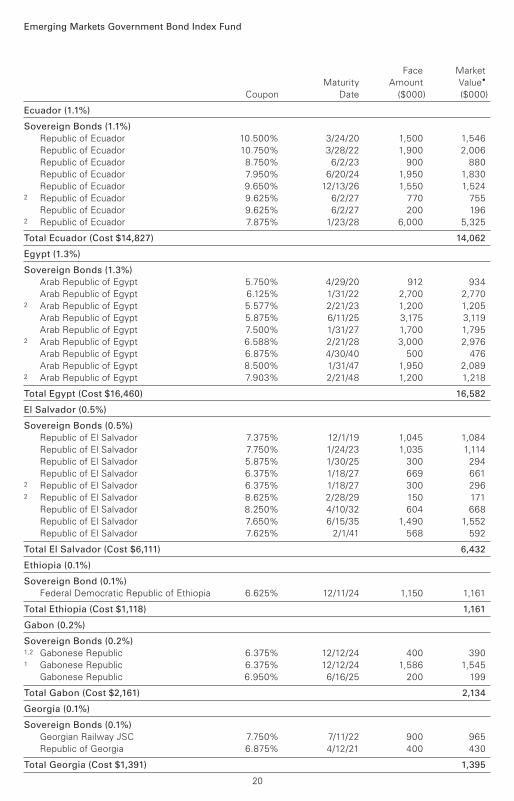
Ecuador (1.1%)
Sovereign Bonds (1.1%)
Republic of Ecuador 10.500% 3/24/20 1,500 1,546
Republic of Ecuador 10.750% 3/28/22 1,900 2,006
Republic of Ecuador 8.750% 6/2/23 900 880
Republic of Ecuador 7.950% 6/20/24 1,950 1,830
Republic of Ecuador 9.650% 12/13/26 1,550 1,5242 Republic of Ecuador 9.625% 6/2/27 770 755
Republic of Ecuador 9.625% 6/2/27 200 1962 Republic of Ecuador 7.875% 1/23/28 6,000 5,325
Total Ecuador (Cost $14,827) 14,062
Egypt (1.3%)
Sovereign Bonds (1.3%)
Arab Republic of Egypt 5.750% 4/29/20 912 934
Arab Republic of Egypt 6.125% 1/31/22 2,700 2,7702 Arab Republic of Egypt 5.577% 2/21/23 1,200 1,205
Arab Republic of Egypt 5.875% 6/11/25 3,175 3,119
Arab Republic of Egypt 7.500% 1/31/27 1,700 1,7952 Arab Republic of Egypt 6.588% 2/21/28 3,000 2,976
Arab Republic of Egypt 6.875% 4/30/40 500 476
Arab Republic of Egypt 8.500% 1/31/47 1,950 2,0892 Arab Republic of Egypt 7.903% 2/21/48 1,200 1,218
Total Egypt (Cost $16,460) 16,582
El Salvador (0.5%)
Sovereign Bonds (0.5%)
Republic of El Salvador 7.375% 12/1/19 1,045 1,084
Republic of El Salvador 7.750% 1/24/23 1,035 1,114
Republic of El Salvador 5.875% 1/30/25 300 294
Republic of El Salvador 6.375% 1/18/27 669 6612 Republic of El Salvador 6.375% 1/18/27 300 2962 Republic of El Salvador 8.625% 2/28/29 150 171
Republic of El Salvador 8.250% 4/10/32 604 668
Republic of El Salvador 7.650% 6/15/35 1,490 1,552
Republic of El Salvador 7.625% 2/1/41 568 592
Total El Salvador (Cost $6,111) 6,432
Ethiopia (0.1%)
Sovereign Bond (0.1%)
Federal Democratic Republic of Ethiopia 6.625% 12/11/24 1,150 1,161
Total Ethiopia (Cost $1,118) 1,161
Gabon (0.2%)
Sovereign Bonds (0.2%) 1,2 Gabonese Republic 6.375% 12/12/24 400 3901 Gabonese Republic 6.375% 12/12/24 1,586 1,545
Gabonese Republic 6.950% 6/16/25 200 199
Total Gabon (Cost $2,161) 2,134
Georgia (0.1%)
Sovereign Bonds (0.1%)
Georgian Railway JSC 7.750% 7/11/22 900 965
Republic of Georgia 6.875% 4/12/21 400 430
Total Georgia (Cost $1,391) 1,395
Face Market
Maturity Amount Value•
Coupon Date ($000) ($000)
20
Emerging Markets Government Bond Index Fund
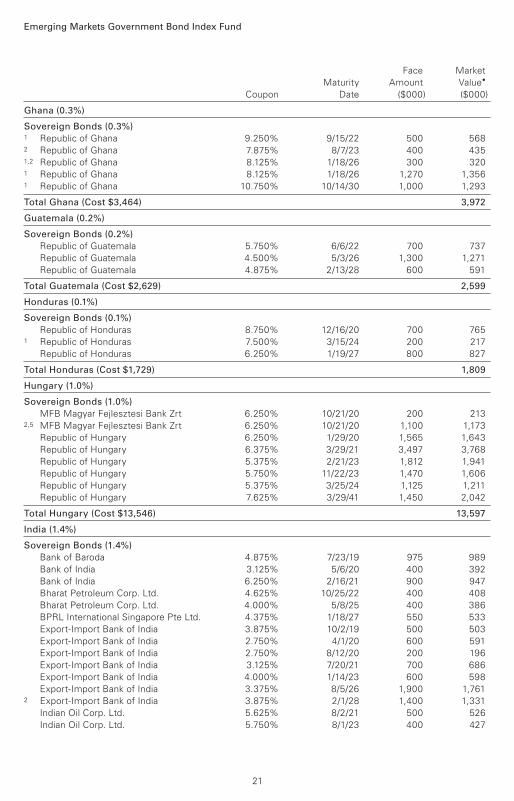
Ghana (0.3%)
Sovereign Bonds (0.3%) 1 Republic of Ghana 9.250% 9/15/22 500 5682 Republic of Ghana 7.875% 8/7/23 400 4351,2 Republic of Ghana 8.125% 1/18/26 300 3201 Republic of Ghana 8.125% 1/18/26 1,270 1,3561 Republic of Ghana 10.750% 10/14/30 1,000 1,293
Total Ghana (Cost $3,464) 3,972
Guatemala (0.2%)
Sovereign Bonds (0.2%)
Republic of Guatemala 5.750% 6/6/22 700 737
Republic of Guatemala 4.500% 5/3/26 1,300 1,271
Republic of Guatemala 4.875% 2/13/28 600 591
Total Guatemala (Cost $2,629) 2,599
Honduras (0.1%)
Sovereign Bonds (0.1%)
Republic of Honduras 8.750% 12/16/20 700 7651 Republic of Honduras 7.500% 3/15/24 200 217
Republic of Honduras 6.250% 1/19/27 800 827
Total Honduras (Cost $1,729) 1,809
Hungary (1.0%)
Sovereign Bonds (1.0%)
MFB Magyar Fejlesztesi Bank Zrt 6.250% 10/21/20 200 2132,5 MFB Magyar Fejlesztesi Bank Zrt 6.250% 10/21/20 1,100 1,173
Republic of Hungary 6.250% 1/29/20 1,565 1,643
Republic of Hungary 6.375% 3/29/21 3,497 3,768
Republic of Hungary 5.375% 2/21/23 1,812 1,941
Republic of Hungary 5.750% 11/22/23 1,470 1,606
Republic of Hungary 5.375% 3/25/24 1,125 1,211
Republic of Hungary 7.625% 3/29/41 1,450 2,042
Total Hungary (Cost $13,546) 13,597
India (1.4%)
Sovereign Bonds (1.4%)
Bank of Baroda 4.875% 7/23/19 975 989
Bank of India 3.125% 5/6/20 400 392
Bank of India 6.250% 2/16/21 900 947
Bharat Petroleum Corp. Ltd. 4.625% 10/25/22 400 408
Bharat Petroleum Corp. Ltd. 4.000% 5/8/25 400 386
BPRL International Singapore Pte Ltd. 4.375% 1/18/27 550 533
Export-Import Bank of India 3.875% 10/2/19 500 503
Export-Import Bank of India 2.750% 4/1/20 600 591
Export-Import Bank of India 2.750% 8/12/20 200 196
Export-Import Bank of India 3.125% 7/20/21 700 686
Export-Import Bank of India 4.000% 1/14/23 600 598
Export-Import Bank of India 3.375% 8/5/26 1,900 1,7612 Export-Import Bank of India 3.875% 2/1/28 1,400 1,331
Indian Oil Corp. Ltd. 5.625% 8/2/21 500 526
Indian Oil Corp. Ltd. 5.750% 8/1/23 400 427
Face Market
Maturity Amount Value•
Coupon Date ($000) ($000)
21
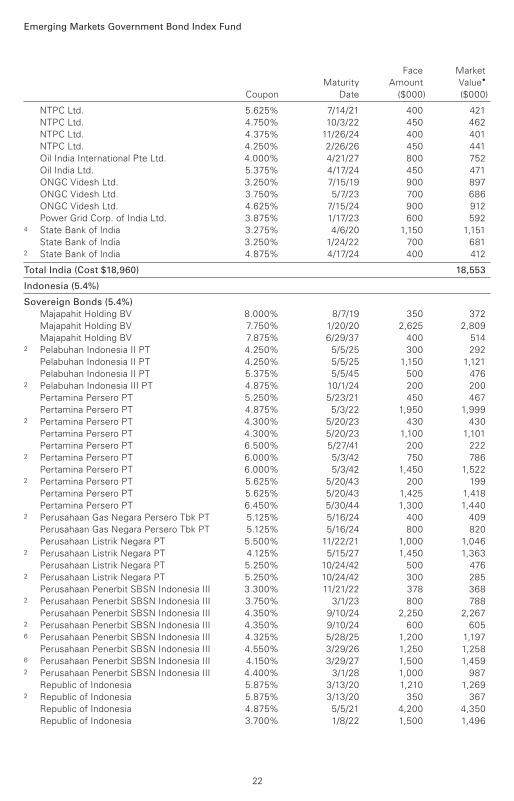
Emerging Markets Government Bond Index Fund
NTPC Ltd. 5.625% 7/14/21 400 421
NTPC Ltd. 4.750% 10/3/22 450 462
NTPC Ltd. 4.375% 11/26/24 400 401
NTPC Ltd. 4.250% 2/26/26 450 441
Oil India International Pte Ltd. 4.000% 4/21/27 800 752
Oil India Ltd. 5.375% 4/17/24 450 471
ONGC Videsh Ltd. 3.250% 7/15/19 900 897
ONGC Videsh Ltd. 3.750% 5/7/23 700 686
ONGC Videsh Ltd. 4.625% 7/15/24 900 912
Power Grid Corp. of India Ltd. 3.875% 1/17/23 600 5924 State Bank of India 3.275% 4/6/20 1,150 1,151
State Bank of India 3.250% 1/24/22 700 6812 State Bank of India 4.875% 4/17/24 400 412
Total India (Cost $18,960) 18,553
Indonesia (5.4%)
Sovereign Bonds (5.4%)
Majapahit Holding BV 8.000% 8/7/19 350 372
Majapahit Holding BV 7.750% 1/20/20 2,625 2,809
Majapahit Holding BV 7.875% 6/29/37 400 5142 Pelabuhan Indonesia II PT 4.250% 5/5/25 300 292
Pelabuhan Indonesia II PT 4.250% 5/5/25 1,150 1,121
Pelabuhan Indonesia II PT 5.375% 5/5/45 500 4762 Pelabuhan Indonesia III PT 4.875% 10/1/24 200 200
Pertamina Persero PT 5.250% 5/23/21 450 467
Pertamina Persero PT 4.875% 5/3/22 1,950 1,9992 Pertamina Persero PT 4.300% 5/20/23 430 430
Pertamina Persero PT 4.300% 5/20/23 1,100 1,101
Pertamina Persero PT 6.500% 5/27/41 200 2222 Pertamina Persero PT 6.000% 5/3/42 750 786
Pertamina Persero PT 6.000% 5/3/42 1,450 1,5222 Pertamina Persero PT 5.625% 5/20/43 200 199
Pertamina Persero PT 5.625% 5/20/43 1,425 1,418
Pertamina Persero PT 6.450% 5/30/44 1,300 1,4402 Perusahaan Gas Negara Persero Tbk PT 5.125% 5/16/24 400 409
Perusahaan Gas Negara Persero Tbk PT 5.125% 5/16/24 800 820
Perusahaan Listrik Negara PT 5.500% 11/22/21 1,000 1,0462 Perusahaan Listrik Negara PT 4.125% 5/15/27 1,450 1,363
Perusahaan Listrik Negara PT 5.250% 10/24/42 500 4762 Perusahaan Listrik Negara PT 5.250% 10/24/42 300 285
Perusahaan Penerbit SBSN Indonesia III 3.300% 11/21/22 378 3682 Perusahaan Penerbit SBSN Indonesia III 3.750% 3/1/23 800 788
Perusahaan Penerbit SBSN Indonesia III 4.350% 9/10/24 2,250 2,2672 Perusahaan Penerbit SBSN Indonesia III 4.350% 9/10/24 600 6056 Perusahaan Penerbit SBSN Indonesia III 4.325% 5/28/25 1,200 1,197
Perusahaan Penerbit SBSN Indonesia III 4.550% 3/29/26 1,250 1,2586 Perusahaan Penerbit SBSN Indonesia III 4.150% 3/29/27 1,500 1,4592 Perusahaan Penerbit SBSN Indonesia III 4.400% 3/1/28 1,000 987
Republic of Indonesia 5.875% 3/13/20 1,210 1,2692 Republic of Indonesia 5.875% 3/13/20 350 367
Republic of Indonesia 4.875% 5/5/21 4,200 4,350
Republic of Indonesia 3.700% 1/8/22 1,500 1,496
Face Market
Maturity Amount Value•
Coupon Date ($000) ($000)
22
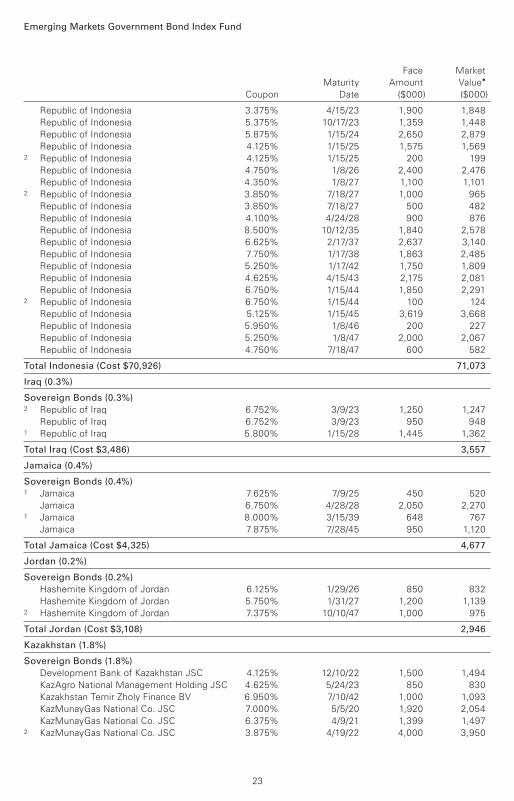
Emerging Markets Government Bond Index Fund
Republic of Indonesia 3.375% 4/15/23 1,900 1,848
Republic of Indonesia 5.375% 10/17/23 1,359 1,448
Republic of Indonesia 5.875% 1/15/24 2,650 2,879
Republic of Indonesia 4.125% 1/15/25 1,575 1,5692 Republic of Indonesia 4.125% 1/15/25 200 199
Republic of Indonesia 4.750% 1/8/26 2,400 2,476
Republic of Indonesia 4.350% 1/8/27 1,100 1,1012 Republic of Indonesia 3.850% 7/18/27 1,000 965
Republic of Indonesia 3.850% 7/18/27 500 482
Republic of Indonesia 4.100% 4/24/28 900 876
Republic of Indonesia 8.500% 10/12/35 1,840 2,578
Republic of Indonesia 6.625% 2/17/37 2,637 3,140
Republic of Indonesia 7.750% 1/17/38 1,863 2,485
Republic of Indonesia 5.250% 1/17/42 1,750 1,809
Republic of Indonesia 4.625% 4/15/43 2,175 2,081
Republic of Indonesia 6.750% 1/15/44 1,850 2,2912 Republic of Indonesia 6.750% 1/15/44 100 124
Republic of Indonesia 5.125% 1/15/45 3,619 3,668
Republic of Indonesia 5.950% 1/8/46 200 227
Republic of Indonesia 5.250% 1/8/47 2,000 2,067
Republic of Indonesia 4.750% 7/18/47 600 582
Total Indonesia (Cost $70,926) 71,073
Iraq (0.3%)
Sovereign Bonds (0.3%) 2 Republic of Iraq 6.752% 3/9/23 1,250 1,247
Republic of Iraq 6.752% 3/9/23 950 9481 Republic of Iraq 5.800% 1/15/28 1,445 1,362
Total Iraq (Cost $3,486) 3,557
Jamaica (0.4%)
Sovereign Bonds (0.4%) 1 Jamaica 7.625% 7/9/25 450 520
Jamaica 6.750% 4/28/28 2,050 2,2701 Jamaica 8.000% 3/15/39 648 767
Jamaica 7.875% 7/28/45 950 1,120
Total Jamaica (Cost $4,325) 4,677
Jordan (0.2%)
Sovereign Bonds (0.2%)
Hashemite Kingdom of Jordan 6.125% 1/29/26 850 832
Hashemite Kingdom of Jordan 5.750% 1/31/27 1,200 1,1392 Hashemite Kingdom of Jordan 7.375% 10/10/47 1,000 975
Total Jordan (Cost $3,108) 2,946
Kazakhstan (1.8%)
Sovereign Bonds (1.8%)
Development Bank of Kazakhstan JSC 4.125% 12/10/22 1,500 1,494
KazAgro National Management Holding JSC 4.625% 5/24/23 850 830
Kazakhstan Temir Zholy Finance BV 6.950% 7/10/42 1,000 1,093
KazMunayGas National Co. JSC 7.000% 5/5/20 1,920 2,054
KazMunayGas National Co. JSC 6.375% 4/9/21 1,399 1,4972 KazMunayGas National Co. JSC 3.875% 4/19/22 4,000 3,950
Face Market
Maturity Amount Value•
Coupon Date ($000) ($000)
23
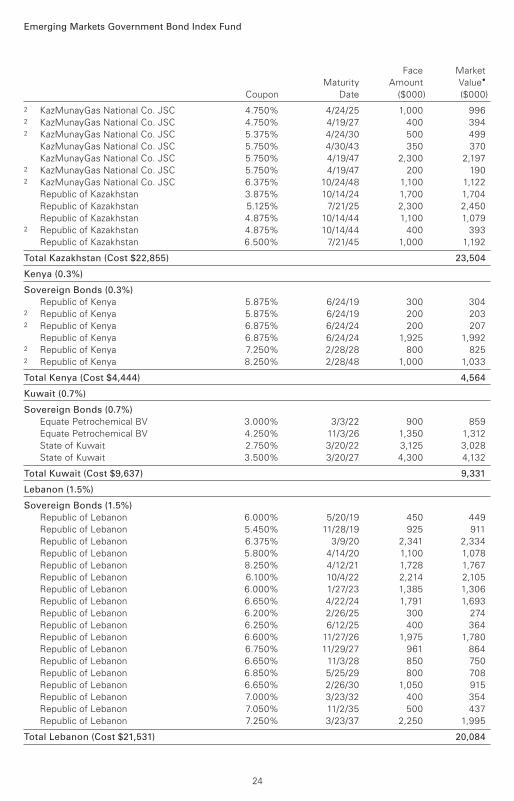
Emerging Markets Government Bond Index Fund
2 KazMunayGas National Co. JSC 4.750% 4/24/25 1,000 9962 KazMunayGas National Co. JSC 4.750% 4/19/27 400 3942 KazMunayGas National Co. JSC 5.375% 4/24/30 500 499
KazMunayGas National Co. JSC 5.750% 4/30/43 350 370
KazMunayGas National Co. JSC 5.750% 4/19/47 2,300 2,1972 KazMunayGas National Co. JSC 5.750% 4/19/47 200 1902 KazMunayGas National Co. JSC 6.375% 10/24/48 1,100 1,122
Republic of Kazakhstan 3.875% 10/14/24 1,700 1,704
Republic of Kazakhstan 5.125% 7/21/25 2,300 2,450
Republic of Kazakhstan 4.875% 10/14/44 1,100 1,0792 Republic of Kazakhstan 4.875% 10/14/44 400 393
Republic of Kazakhstan 6.500% 7/21/45 1,000 1,192
Total Kazakhstan (Cost $22,855) 23,504
Kenya (0.3%)
Sovereign Bonds (0.3%)
Republic of Kenya 5.875% 6/24/19 300 3042 Republic of Kenya 5.875% 6/24/19 200 2032 Republic of Kenya 6.875% 6/24/24 200 207
Republic of Kenya 6.875% 6/24/24 1,925 1,9922 Republic of Kenya 7.250% 2/28/28 800 8252 Republic of Kenya 8.250% 2/28/48 1,000 1,033
Total Kenya (Cost $4,444) 4,564
Kuwait (0.7%)
Sovereign Bonds (0.7%)
Equate Petrochemical BV 3.000% 3/3/22 900 859
Equate Petrochemical BV 4.250% 11/3/26 1,350 1,312
State of Kuwait 2.750% 3/20/22 3,125 3,028
State of Kuwait 3.500% 3/20/27 4,300 4,132
Total Kuwait (Cost $9,637) 9,331
Lebanon (1.5%)
Sovereign Bonds (1.5%)
Republic of Lebanon 6.000% 5/20/19 450 449
Republic of Lebanon 5.450% 11/28/19 925 911
Republic of Lebanon 6.375% 3/9/20 2,341 2,334
Republic of Lebanon 5.800% 4/14/20 1,100 1,078
Republic of Lebanon 8.250% 4/12/21 1,728 1,767
Republic of Lebanon 6.100% 10/4/22 2,214 2,105
Republic of Lebanon 6.000% 1/27/23 1,385 1,306
Republic of Lebanon 6.650% 4/22/24 1,791 1,693
Republic of Lebanon 6.200% 2/26/25 300 274
Republic of Lebanon 6.250% 6/12/25 400 364
Republic of Lebanon 6.600% 11/27/26 1,975 1,780
Republic of Lebanon 6.750% 11/29/27 961 864
Republic of Lebanon 6.650% 11/3/28 850 750
Republic of Lebanon 6.850% 5/25/29 800 708
Republic of Lebanon 6.650% 2/26/30 1,050 915
Republic of Lebanon 7.000% 3/23/32 400 354
Republic of Lebanon 7.050% 11/2/35 500 437
Republic of Lebanon 7.250% 3/23/37 2,250 1,995
Total Lebanon (Cost $21,531) 20,084
Face Market
Maturity Amount Value•
Coupon Date ($000) ($000)
24
Emerging Markets Government Bond Index Fund
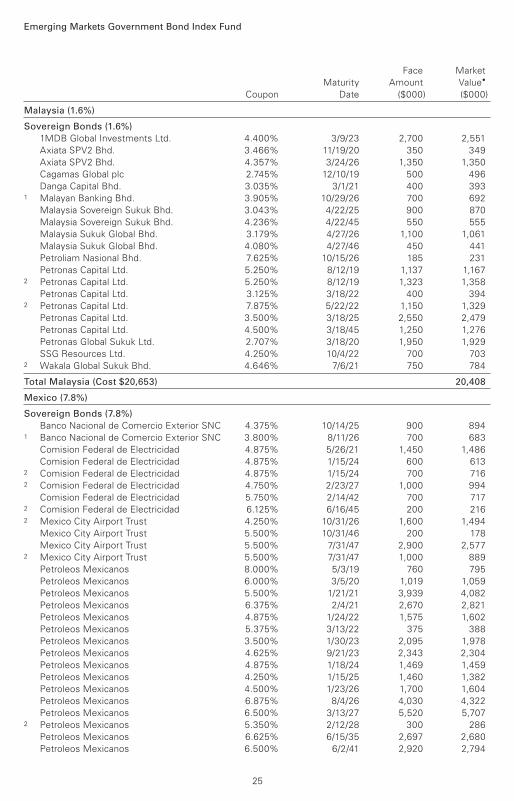
Malaysia (1.6%)
Sovereign Bonds (1.6%)
1MDB Global Investments Ltd. 4.400% 3/9/23 2,700 2,551
Axiata SPV2 Bhd. 3.466% 11/19/20 350 349
Axiata SPV2 Bhd. 4.357% 3/24/26 1,350 1,350
Cagamas Global plc 2.745% 12/10/19 500 496
Danga Capital Bhd. 3.035% 3/1/21 400 3931 Malayan Banking Bhd. 3.905% 10/29/26 700 692
Malaysia Sovereign Sukuk Bhd. 3.043% 4/22/25 900 870
Malaysia Sovereign Sukuk Bhd. 4.236% 4/22/45 550 555
Malaysia Sukuk Global Bhd. 3.179% 4/27/26 1,100 1,061
Malaysia Sukuk Global Bhd. 4.080% 4/27/46 450 441
Petroliam Nasional Bhd. 7.625% 10/15/26 185 231
Petronas Capital Ltd. 5.250% 8/12/19 1,137 1,1672 Petronas Capital Ltd. 5.250% 8/12/19 1,323 1,358
Petronas Capital Ltd. 3.125% 3/18/22 400 3942 Petronas Capital Ltd. 7.875% 5/22/22 1,150 1,329
Petronas Capital Ltd. 3.500% 3/18/25 2,550 2,479
Petronas Capital Ltd. 4.500% 3/18/45 1,250 1,276
Petronas Global Sukuk Ltd. 2.707% 3/18/20 1,950 1,929
SSG Resources Ltd. 4.250% 10/4/22 700 7032 Wakala Global Sukuk Bhd. 4.646% 7/6/21 750 784
Total Malaysia (Cost $20,653) 20,408
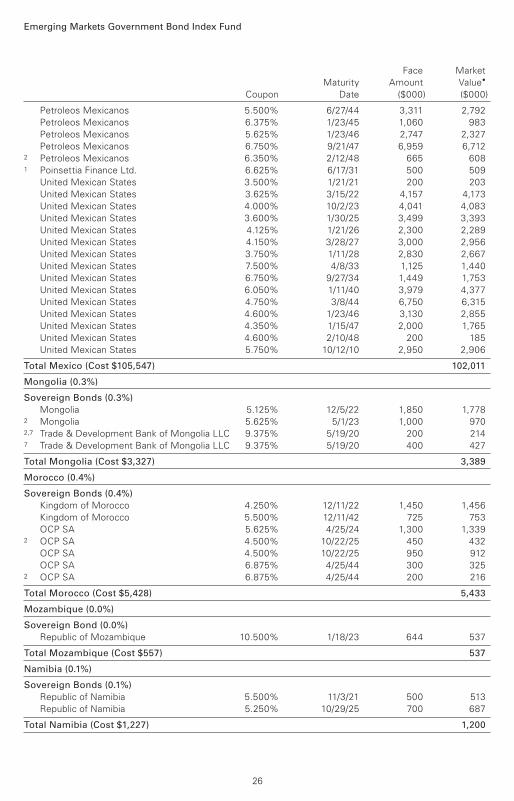
Mexico (7.8%)
Sovereign Bonds (7.8%)
Banco Nacional de Comercio Exterior SNC 4.375% 10/14/25 900 8941 Banco Nacional de Comercio Exterior SNC 3.800% 8/11/26 700 683
Comision Federal de Electricidad 4.875% 5/26/21 1,450 1,486
Comision Federal de Electricidad 4.875% 1/15/24 600 6132 Comision Federal de Electricidad 4.875% 1/15/24 700 7162 Comision Federal de Electricidad 4.750% 2/23/27 1,000 994
Comision Federal de Electricidad 5.750% 2/14/42 700 7172 Comision Federal de Electricidad 6.125% 6/16/45 200 2162 Mexico City Airport Trust 4.250% 10/31/26 1,600 1,494
Mexico City Airport Trust 5.500% 10/31/46 200 178
Mexico City Airport Trust 5.500% 7/31/47 2,900 2,5772 Mexico City Airport Trust 5.500% 7/31/47 1,000 889
Petroleos Mexicanos 8.000% 5/3/19 760 795
Petroleos Mexicanos 6.000% 3/5/20 1,019 1,059
Petroleos Mexicanos 5.500% 1/21/21 3,939 4,082
Petroleos Mexicanos 6.375% 2/4/21 2,670 2,821
Petroleos Mexicanos 4.875% 1/24/22 1,575 1,602
Petroleos Mexicanos 5.375% 3/13/22 375 388
Petroleos Mexicanos 3.500% 1/30/23 2,095 1,978
Petroleos Mexicanos 4.625% 9/21/23 2,343 2,304
Petroleos Mexicanos 4.875% 1/18/24 1,469 1,459
Petroleos Mexicanos 4.250% 1/15/25 1,460 1,382
Petroleos Mexicanos 4.500% 1/23/26 1,700 1,604
Petroleos Mexicanos 6.875% 8/4/26 4,030 4,322
Petroleos Mexicanos 6.500% 3/13/27 5,520 5,7072 Petroleos Mexicanos 5.350% 2/12/28 300 286
Petroleos Mexicanos 6.625% 6/15/35 2,697 2,680
Petroleos Mexicanos 6.500% 6/2/41 2,920 2,794
Face Market
Maturity Amount Value•
Coupon Date ($000) ($000)
25
Emerging Markets Government Bond Index Fund
Petroleos Mexicanos 5.500% 6/27/44 3,311 2,792
Petroleos Mexicanos 6.375% 1/23/45 1,060 983
Petroleos Mexicanos 5.625% 1/23/46 2,747 2,327
Petroleos Mexicanos 6.750% 9/21/47 6,959 6,7122 Petroleos Mexicanos 6.350% 2/12/48 665 6081 Poinsettia Finance Ltd. 6.625% 6/17/31 500 509
United Mexican States 3.500% 1/21/21 200 203
United Mexican States 3.625% 3/15/22 4,157 4,173
United Mexican States 4.000% 10/2/23 4,041 4,083
United Mexican States 3.600% 1/30/25 3,499 3,393
United Mexican States 4.125% 1/21/26 2,300 2,289
United Mexican States 4.150% 3/28/27 3,000 2,956
United Mexican States 3.750% 1/11/28 2,830 2,667
United Mexican States 7.500% 4/8/33 1,125 1,440
United Mexican States 6.750% 9/27/34 1,449 1,753
United Mexican States 6.050% 1/11/40 3,979 4,377
United Mexican States 4.750% 3/8/44 6,750 6,315
United Mexican States 4.600% 1/23/46 3,130 2,855
United Mexican States 4.350% 1/15/47 2,000 1,765
United Mexican States 4.600% 2/10/48 200 185
United Mexican States 5.750% 10/12/10 2,950 2,906
Total Mexico (Cost $105,547) 102,011
Mongolia (0.3%)
Sovereign Bonds (0.3%)
Mongolia 5.125% 12/5/22 1,850 1,7782 Mongolia 5.625% 5/1/23 1,000 9702,7 Trade & Development Bank of Mongolia LLC 9.375% 5/19/20 200 2147 Trade & Development Bank of Mongolia LLC 9.375% 5/19/20 400 427
Total Mongolia (Cost $3,327) 3,389
Morocco (0.4%)
Sovereign Bonds (0.4%)
Kingdom of Morocco 4.250% 12/11/22 1,450 1,456
Kingdom of Morocco 5.500% 12/11/42 725 753
OCP SA 5.625% 4/25/24 1,300 1,3392 OCP SA 4.500% 10/22/25 450 432
OCP SA 4.500% 10/22/25 950 912
OCP SA 6.875% 4/25/44 300 3252 OCP SA 6.875% 4/25/44 200 216
Total Morocco (Cost $5,428) 5,433
Mozambique (0.0%)
Sovereign Bond (0.0%)
Republic of Mozambique 10.500% 1/18/23 644 537
Total Mozambique (Cost $557) 537
Namibia (0.1%)
Sovereign Bonds (0.1%)
Republic of Namibia 5.500% 11/3/21 500 513
Republic of Namibia 5.250% 10/29/25 700 687
Total Namibia (Cost $1,227) 1,200
Face Market
Maturity Amount Value•
Coupon Date ($000) ($000)
26
Emerging Markets Government Bond Index Fund
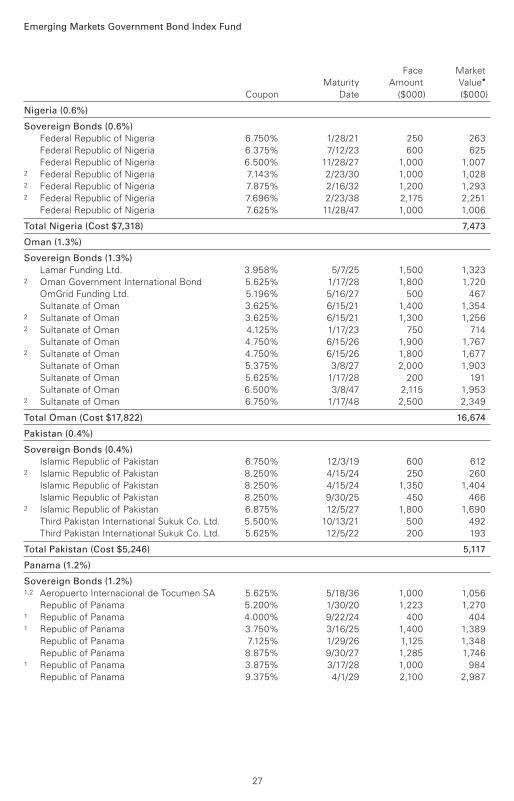
Nigeria (0.6%)
Sovereign Bonds (0.6%)
Federal Republic of Nigeria 6.750% 1/28/21 250 263
Federal Republic of Nigeria 6.375% 7/12/23 600 625
Federal Republic of Nigeria 6.500% 11/28/27 1,000 1,0072 Federal Republic of Nigeria 7.143% 2/23/30 1,000 1,0282 Federal Republic of Nigeria 7.875% 2/16/32 1,200 1,2932 Federal Republic of Nigeria 7.696% 2/23/38 2,175 2,251
Federal Republic of Nigeria 7.625% 11/28/47 1,000 1,006
Total Nigeria (Cost $7,318) 7,473
Oman (1.3%)
Sovereign Bonds (1.3%)
Lamar Funding Ltd. 3.958% 5/7/25 1,500 1,3232 Oman Government International Bond 5.625% 1/17/28 1,800 1,720
OmGrid Funding Ltd. 5.196% 5/16/27 500 467
Sultanate of Oman 3.625% 6/15/21 1,400 1,3542 Sultanate of Oman 3.625% 6/15/21 1,300 1,2562 Sultanate of Oman 4.125% 1/17/23 750 714
Sultanate of Oman 4.750% 6/15/26 1,900 1,7672 Sultanate of Oman 4.750% 6/15/26 1,800 1,677
Sultanate of Oman 5.375% 3/8/27 2,000 1,903
Sultanate of Oman 5.625% 1/17/28 200 191
Sultanate of Oman 6.500% 3/8/47 2,115 1,9532 Sultanate of Oman 6.750% 1/17/48 2,500 2,349
Total Oman (Cost $17,822) 16,674
Pakistan (0.4%)
Sovereign Bonds (0.4%)
Islamic Republic of Pakistan 6.750% 12/3/19 600 6122 Islamic Republic of Pakistan 8.250% 4/15/24 250 260
Islamic Republic of Pakistan 8.250% 4/15/24 1,350 1,404
Islamic Republic of Pakistan 8.250% 9/30/25 450 4662 Islamic Republic of Pakistan 6.875% 12/5/27 1,800 1,690
Third Pakistan International Sukuk Co. Ltd. 5.500% 10/13/21 500 492
Third Pakistan International Sukuk Co. Ltd. 5.625% 12/5/22 200 193
Total Pakistan (Cost $5,246) 5,117
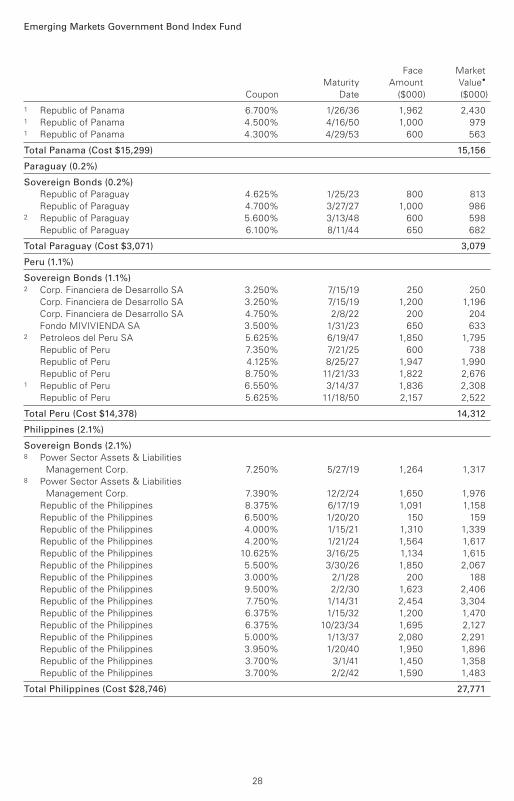
Panama (1.2%)
Sovereign Bonds (1.2%) 1,2 Aeropuerto Internacional de Tocumen SA 5.625% 5/18/36 1,000 1,056
Republic of Panama 5.200% 1/30/20 1,223 1,2701 Republic of Panama 4.000% 9/22/24 400 4041 Republic of Panama 3.750% 3/16/25 1,400 1,389
Republic of Panama 7.125% 1/29/26 1,125 1,348
Republic of Panama 8.875% 9/30/27 1,285 1,7461 Republic of Panama 3.875% 3/17/28 1,000 984
Republic of Panama 9.375% 4/1/29 2,100 2,987
Face Market
Maturity Amount Value•
Coupon Date ($000) ($000)
27
Emerging Markets Government Bond Index Fund
1 Republic of Panama 6.700% 1/26/36 1,962 2,4301 Republic of Panama 4.500% 4/16/50 1,000 9791 Republic of Panama 4.300% 4/29/53 600 563
Total Panama (Cost $15,299) 15,156
Paraguay (0.2%)
Sovereign Bonds (0.2%)
Republic of Paraguay 4.625% 1/25/23 800 813
Republic of Paraguay 4.700% 3/27/27 1,000 9862 Republic of Paraguay 5.600% 3/13/48 600 598
Republic of Paraguay 6.100% 8/11/44 650 682
Total Paraguay (Cost $3,071) 3,079
Peru (1.1%)
Sovereign Bonds (1.1%) 2 Corp. Financiera de Desarrollo SA 3.250% 7/15/19 250 250
Corp. Financiera de Desarrollo SA 3.250% 7/15/19 1,200 1,196
Corp. Financiera de Desarrollo SA 4.750% 2/8/22 200 204
Fondo MIVIVIENDA SA 3.500% 1/31/23 650 6332 Petroleos del Peru SA 5.625% 6/19/47 1,850 1,795
Republic of Peru 7.350% 7/21/25 600 738
Republic of Peru 4.125% 8/25/27 1,947 1,990
Republic of Peru 8.750% 11/21/33 1,822 2,6761 Republic of Peru 6.550% 3/14/37 1,836 2,308
Republic of Peru 5.625% 11/18/50 2,157 2,522
Total Peru (Cost $14,378) 14,312
Philippines (2.1%)
Sovereign Bonds (2.1%) 8 Power Sector Assets & Liabilities
Management Corp. 7.250% 5/27/19 1,264 1,3178 Power Sector Assets & Liabilities
Management Corp. 7.390% 12/2/24 1,650 1,976
Republic of the Philippines 8.375% 6/17/19 1,091 1,158
Republic of the Philippines 6.500% 1/20/20 150 159
Republic of the Philippines 4.000% 1/15/21 1,310 1,339
Republic of the Philippines 4.200% 1/21/24 1,564 1,617
Republic of the Philippines 10.625% 3/16/25 1,134 1,615
Republic of the Philippines 5.500% 3/30/26 1,850 2,067
Republic of the Philippines 3.000% 2/1/28 200 188
Republic of the Philippines 9.500% 2/2/30 1,623 2,406
Republic of the Philippines 7.750% 1/14/31 2,454 3,304
Republic of the Philippines 6.375% 1/15/32 1,200 1,470
Republic of the Philippines 6.375% 10/23/34 1,695 2,127
Republic of the Philippines 5.000% 1/13/37 2,080 2,291
Republic of the Philippines 3.950% 1/20/40 1,950 1,896
Republic of the Philippines 3.700% 3/1/41 1,450 1,358
Republic of the Philippines 3.700% 2/2/42 1,590 1,483
Total Philippines (Cost $28,746) 27,771
Face Market
Maturity Amount Value•
Coupon Date ($000) ($000)
28
Emerging Markets Government Bond Index Fund
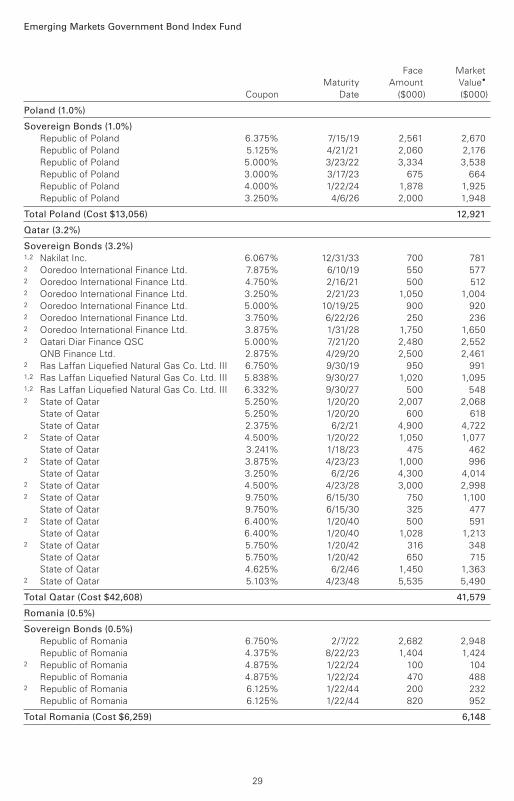
Poland (1.0%)
Sovereign Bonds (1.0%)
Republic of Poland 6.375% 7/15/19 2,561 2,670
Republic of Poland 5.125% 4/21/21 2,060 2,176
Republic of Poland 5.000% 3/23/22 3,334 3,538
Republic of Poland 3.000% 3/17/23 675 664
Republic of Poland 4.000% 1/22/24 1,878 1,925
Republic of Poland 3.250% 4/6/26 2,000 1,948
Total Poland (Cost $13,056) 12,921
Qatar (3.2%)
Sovereign Bonds (3.2%) 1,2 Nakilat Inc. 6.067% 12/31/33 700 7812 Ooredoo International Finance Ltd. 7.875% 6/10/19 550 5772 Ooredoo International Finance Ltd. 4.750% 2/16/21 500 5122 Ooredoo International Finance Ltd. 3.250% 2/21/23 1,050 1,0042 Ooredoo International Finance Ltd. 5.000% 10/19/25 900 9202 Ooredoo International Finance Ltd. 3.750% 6/22/26 250 2362 Ooredoo International Finance Ltd. 3.875% 1/31/28 1,750 1,6502 Qatari Diar Finance QSC 5.000% 7/21/20 2,480 2,552
QNB Finance Ltd. 2.875% 4/29/20 2,500 2,4612 Ras Laffan Liquefied Natural Gas Co. Ltd. III 6.750% 9/30/19 950 9911,2 Ras Laffan Liquefied Natural Gas Co. Ltd. III 5.838% 9/30/27 1,020 1,0951,2 Ras Laffan Liquefied Natural Gas Co. Ltd. III 6.332% 9/30/27 500 5482 State of Qatar 5.250% 1/20/20 2,007 2,068
State of Qatar 5.250% 1/20/20 600 618
State of Qatar 2.375% 6/2/21 4,900 4,7222 State of Qatar 4.500% 1/20/22 1,050 1,077
State of Qatar 3.241% 1/18/23 475 4622 State of Qatar 3.875% 4/23/23 1,000 996
State of Qatar 3.250% 6/2/26 4,300 4,0142 State of Qatar 4.500% 4/23/28 3,000 2,9982 State of Qatar 9.750% 6/15/30 750 1,100
State of Qatar 9.750% 6/15/30 325 4772 State of Qatar 6.400% 1/20/40 500 591
State of Qatar 6.400% 1/20/40 1,028 1,2132 State of Qatar 5.750% 1/20/42 316 348
State of Qatar 5.750% 1/20/42 650 715
State of Qatar 4.625% 6/2/46 1,450 1,3632 State of Qatar 5.103% 4/23/48 5,535 5,490
Total Qatar (Cost $42,608) 41,579
Romania (0.5%)
Sovereign Bonds (0.5%)
Republic of Romania 6.750% 2/7/22 2,682 2,948
Republic of Romania 4.375% 8/22/23 1,404 1,4242 Republic of Romania 4.875% 1/22/24 100 104
Republic of Romania 4.875% 1/22/24 470 4882 Republic of Romania 6.125% 1/22/44 200 232
Republic of Romania 6.125% 1/22/44 820 952
Total Romania (Cost $6,259) 6,148
Face Market
Maturity Amount Value•
Coupon Date ($000) ($000)
29
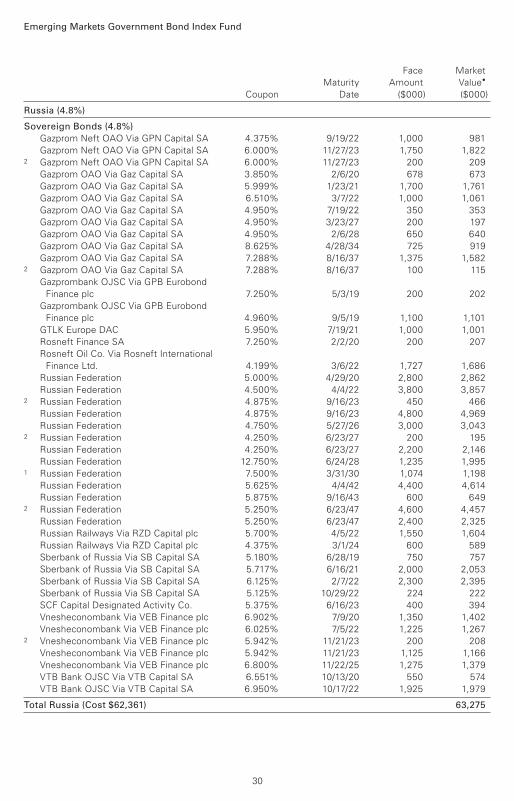
Emerging Markets Government Bond Index Fund
Russia (4.8%)
Sovereign Bonds (4.8%)
Gazprom Neft OAO Via GPN Capital SA 4.375% 9/19/22 1,000 981
Gazprom Neft OAO Via GPN Capital SA 6.000% 11/27/23 1,750 1,8222 Gazprom Neft OAO Via GPN Capital SA 6.000% 11/27/23 200 209
Gazprom OAO Via Gaz Capital SA 3.850% 2/6/20 678 673
Gazprom OAO Via Gaz Capital SA 5.999% 1/23/21 1,700 1,761
Gazprom OAO Via Gaz Capital SA 6.510% 3/7/22 1,000 1,061
Gazprom OAO Via Gaz Capital SA 4.950% 7/19/22 350 353
Gazprom OAO Via Gaz Capital SA 4.950% 3/23/27 200 197
Gazprom OAO Via Gaz Capital SA 4.950% 2/6/28 650 640
Gazprom OAO Via Gaz Capital SA 8.625% 4/28/34 725 919
Gazprom OAO Via Gaz Capital SA 7.288% 8/16/37 1,375 1,5822 Gazprom OAO Via Gaz Capital SA 7.288% 8/16/37 100 115
Gazprombank OJSC Via GPB Eurobond
Finance plc 7.250% 5/3/19 200 202
Gazprombank OJSC Via GPB Eurobond
Finance plc 4.960% 9/5/19 1,100 1,101
GTLK Europe DAC 5.950% 7/19/21 1,000 1,001
Rosneft Finance SA 7.250% 2/2/20 200 207
Rosneft Oil Co. Via Rosneft International
Finance Ltd. 4.199% 3/6/22 1,727 1,686
Russian Federation 5.000% 4/29/20 2,800 2,862
Russian Federation 4.500% 4/4/22 3,800 3,8572 Russian Federation 4.875% 9/16/23 450 466
Russian Federation 4.875% 9/16/23 4,800 4,969
Russian Federation 4.750% 5/27/26 3,000 3,0432 Russian Federation 4.250% 6/23/27 200 195
Russian Federation 4.250% 6/23/27 2,200 2,146
Russian Federation 12.750% 6/24/28 1,235 1,9951 Russian Federation 7.500% 3/31/30 1,074 1,198
Russian Federation 5.625% 4/4/42 4,400 4,614
Russian Federation 5.875% 9/16/43 600 6492 Russian Federation 5.250% 6/23/47 4,600 4,457
Russian Federation 5.250% 6/23/47 2,400 2,325
Russian Railways Via RZD Capital plc 5.700% 4/5/22 1,550 1,604
Russian Railways Via RZD Capital plc 4.375% 3/1/24 600 589
Sberbank of Russia Via SB Capital SA 5.180% 6/28/19 750 757
Sberbank of Russia Via SB Capital SA 5.717% 6/16/21 2,000 2,053
Sberbank of Russia Via SB Capital SA 6.125% 2/7/22 2,300 2,395
Sberbank of Russia Via SB Capital SA 5.125% 10/29/22 224 222
SCF Capital Designated Activity Co. 5.375% 6/16/23 400 394
Vnesheconombank Via VEB Finance plc 6.902% 7/9/20 1,350 1,402
Vnesheconombank Via VEB Finance plc 6.025% 7/5/22 1,225 1,2672 Vnesheconombank Via VEB Finance plc 5.942% 11/21/23 200 208
Vnesheconombank Via VEB Finance plc 5.942% 11/21/23 1,125 1,166
Vnesheconombank Via VEB Finance plc 6.800% 11/22/25 1,275 1,379
VTB Bank OJSC Via VTB Capital SA 6.551% 10/13/20 550 574
VTB Bank OJSC Via VTB Capital SA 6.950% 10/17/22 1,925 1,979
Total Russia (Cost $62,361) 63,275
Face Market
Maturity Amount Value•
Coupon Date ($000) ($000)
30
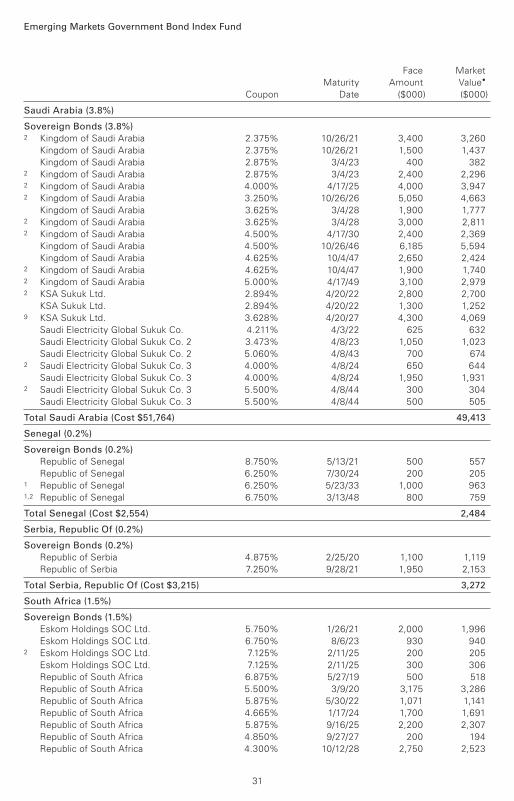
Emerging Markets Government Bond Index Fund
Saudi Arabia (3.8%)
Sovereign Bonds (3.8%) 2 Kingdom of Saudi Arabia 2.375% 10/26/21 3,400 3,260
Kingdom of Saudi Arabia 2.375% 10/26/21 1,500 1,437
Kingdom of Saudi Arabia 2.875% 3/4/23 400 3822 Kingdom of Saudi Arabia 2.875% 3/4/23 2,400 2,2962 Kingdom of Saudi Arabia 4.000% 4/17/25 4,000 3,9472 Kingdom of Saudi Arabia 3.250% 10/26/26 5,050 4,663
Kingdom of Saudi Arabia 3.625% 3/4/28 1,900 1,7772 Kingdom of Saudi Arabia 3.625% 3/4/28 3,000 2,8112 Kingdom of Saudi Arabia 4.500% 4/17/30 2,400 2,369
Kingdom of Saudi Arabia 4.500% 10/26/46 6,185 5,594
Kingdom of Saudi Arabia 4.625% 10/4/47 2,650 2,4242 Kingdom of Saudi Arabia 4.625% 10/4/47 1,900 1,7402 Kingdom of Saudi Arabia 5.000% 4/17/49 3,100 2,9792 KSA Sukuk Ltd. 2.894% 4/20/22 2,800 2,700
KSA Sukuk Ltd. 2.894% 4/20/22 1,300 1,2529 KSA Sukuk Ltd. 3.628% 4/20/27 4,300 4,069
Saudi Electricity Global Sukuk Co. 4.211% 4/3/22 625 632
Saudi Electricity Global Sukuk Co. 2 3.473% 4/8/23 1,050 1,023
Saudi Electricity Global Sukuk Co. 2 5.060% 4/8/43 700 6742 Saudi Electricity Global Sukuk Co. 3 4.000% 4/8/24 650 644
Saudi Electricity Global Sukuk Co. 3 4.000% 4/8/24 1,950 1,9312 Saudi Electricity Global Sukuk Co. 3 5.500% 4/8/44 300 304
Saudi Electricity Global Sukuk Co. 3 5.500% 4/8/44 500 505
Total Saudi Arabia (Cost $51,764) 49,413
Senegal (0.2%)
Sovereign Bonds (0.2%)
Republic of Senegal 8.750% 5/13/21 500 557
Republic of Senegal 6.250% 7/30/24 200 2051 Republic of Senegal 6.250% 5/23/33 1,000 9631,2 Republic of Senegal 6.750% 3/13/48 800 759
Total Senegal (Cost $2,554) 2,484
Serbia, Republic Of (0.2%)
Sovereign Bonds (0.2%)
Republic of Serbia 4.875% 2/25/20 1,100 1,119
Republic of Serbia 7.250% 9/28/21 1,950 2,153
Total Serbia, Republic Of (Cost $3,215) 3,272
South Africa (1.5%)
Sovereign Bonds (1.5%)
Eskom Holdings SOC Ltd. 5.750% 1/26/21 2,000 1,996
Eskom Holdings SOC Ltd. 6.750% 8/6/23 930 9402 Eskom Holdings SOC Ltd. 7.125% 2/11/25 200 205
Eskom Holdings SOC Ltd. 7.125% 2/11/25 300 306
Republic of South Africa 6.875% 5/27/19 500 518
Republic of South Africa 5.500% 3/9/20 3,175 3,286
Republic of South Africa 5.875% 5/30/22 1,071 1,141
Republic of South Africa 4.665% 1/17/24 1,700 1,691
Republic of South Africa 5.875% 9/16/25 2,200 2,307
Republic of South Africa 4.850% 9/27/27 200 194
Republic of South Africa 4.300% 10/12/28 2,750 2,523
Face Market
Maturity Amount Value•
Coupon Date ($000) ($000)
31
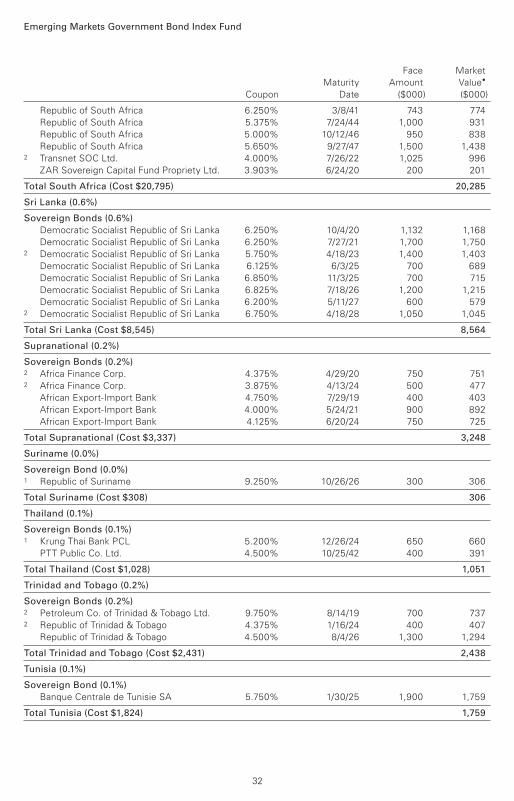
Emerging Markets Government Bond Index Fund
Republic of South Africa 6.250% 3/8/41 743 774
Republic of South Africa 5.375% 7/24/44 1,000 931
Republic of South Africa 5.000% 10/12/46 950 838
Republic of South Africa 5.650% 9/27/47 1,500 1,4382 Transnet SOC Ltd. 4.000% 7/26/22 1,025 996
ZAR Sovereign Capital Fund Propriety Ltd. 3.903% 6/24/20 200 201
Total South Africa (Cost $20,795) 20,285
Sri Lanka (0.6%)
Sovereign Bonds (0.6%)
Democratic Socialist Republic of Sri Lanka 6.250% 10/4/20 1,132 1,168
Democratic Socialist Republic of Sri Lanka 6.250% 7/27/21 1,700 1,7502 Democratic Socialist Republic of Sri Lanka 5.750% 4/18/23 1,400 1,403
Democratic Socialist Republic of Sri Lanka 6.125% 6/3/25 700 689
Democratic Socialist Republic of Sri Lanka 6.850% 11/3/25 700 715
Democratic Socialist Republic of Sri Lanka 6.825% 7/18/26 1,200 1,215
Democratic Socialist Republic of Sri Lanka 6.200% 5/11/27 600 5792 Democratic Socialist Republic of Sri Lanka 6.750% 4/18/28 1,050 1,045
Total Sri Lanka (Cost $8,545) 8,564
Supranational (0.2%)
Sovereign Bonds (0.2%) 2 Africa Finance Corp. 4.375% 4/29/20 750 7512 Africa Finance Corp. 3.875% 4/13/24 500 477
African Export-Import Bank 4.750% 7/29/19 400 403
African Export-Import Bank 4.000% 5/24/21 900 892
African Export-Import Bank 4.125% 6/20/24 750 725
Total Supranational (Cost $3,337) 3,248
Suriname (0.0%)
Sovereign Bond (0.0%) 1 Republic of Suriname 9.250% 10/26/26 300 306
Total Suriname (Cost $308) 306
Thailand (0.1%)
Sovereign Bonds (0.1%) 1 Krung Thai Bank PCL 5.200% 12/26/24 650 660
PTT Public Co. Ltd. 4.500% 10/25/42 400 391
Total Thailand (Cost $1,028) 1,051
Trinidad and Tobago (0.2%)
Sovereign Bonds (0.2%) 2 Petroleum Co. of Trinidad & Tobago Ltd. 9.750% 8/14/19 700 7372 Republic of Trinidad & Tobago 4.375% 1/16/24 400 407
Republic of Trinidad & Tobago 4.500% 8/4/26 1,300 1,294
Total Trinidad and Tobago (Cost $2,431) 2,438
Tunisia (0.1%)
Sovereign Bond (0.1%)
Banque Centrale de Tunisie SA 5.750% 1/30/25 1,900 1,759
Total Tunisia (Cost $1,824) 1,759
Face Market
Maturity Amount Value•
Coupon Date ($000) ($000)
32
Emerging Markets Government Bond Index Fund
Turkey (4.4%)
Sovereign Bonds (4.4%) 2 Export Credit Bank of Turkey 5.375% 2/8/21 500 5022 Export Credit Bank of Turkey 5.000% 9/23/21 400 3942 Export Credit Bank of Turkey 4.250% 9/18/22 500 473
Hazine Mustesarligi Varlik Kiralama AS 4.251% 6/8/21 1,250 1,240
Hazine Mustesarligi Varlik Kiralama AS 5.004% 4/6/23 500 4992 Hazine Mustesarligi Varlik Kiralama AS 4.489% 11/25/24 800 773
Republic of Turkey 7.500% 11/7/19 1,216 1,282
Republic of Turkey 7.000% 6/5/20 2,530 2,673
Republic of Turkey 5.625% 3/30/21 1,901 1,960
Republic of Turkey 5.125% 3/25/22 1,925 1,947
Republic of Turkey 6.250% 9/26/22 2,354 2,478
Republic of Turkey 3.250% 3/23/23 1,801 1,664
Republic of Turkey 5.750% 3/22/24 2,550 2,588
Republic of Turkey 7.375% 2/5/25 2,600 2,850
Republic of Turkey 4.250% 4/14/26 2,750 2,487
Republic of Turkey 4.875% 10/9/26 3,300 3,081
Republic of Turkey 6.000% 3/25/27 2,950 2,961
Republic of Turkey 5.125% 2/17/28 900 843
Republic of Turkey 6.125% 10/24/28 900 898
Republic of Turkey 8.000% 2/14/34 1,840 2,114
Republic of Turkey 6.875% 3/17/36 3,198 3,286
Republic of Turkey 6.750% 5/30/40 2,410 2,422
Republic of Turkey 6.000% 1/14/41 3,580 3,294
Republic of Turkey 4.875% 4/16/43 3,719 2,957
Republic of Turkey 6.625% 2/17/45 850 829
Republic of Turkey 5.750% 5/11/47 4,550 3,9762 TC Ziraat Bankasi AS 4.250% 7/3/19 200 1992 TC Ziraat Bankasi AS 4.750% 4/29/21 800 781
TC Ziraat Bankasi AS 5.125% 5/3/22 900 875
Turkiye Halk Bankasi AS 4.750% 6/4/19 400 3922 Turkiye Halk Bankasi AS 4.750% 6/4/19 250 246
Turkiye Halk Bankasi AS 3.875% 2/5/20 800 7482 Turkiye Halk Bankasi AS 3.875% 2/5/20 400 375
Turkiye Halk Bankasi AS 4.750% 2/11/21 700 655
Turkiye Halk Bankasi AS 5.000% 7/13/21 200 1892 Turkiye Halk Bankasi AS 5.000% 7/13/21 500 4732 Turkiye Vakiflar Bankasi TAO 5.625% 5/30/22 500 490
Turkiye Vakiflar Bankasi TAO 6.000% 11/1/22 200 1931 Turkiye Vakiflar Bankasi TAO 6.875% 2/3/25 200 2001 Turkiye Vakiflar Bankasi TAO 8.000% 11/1/27 1,000 1,015
Total Turkey (Cost $60,271) 57,302
Ukraine (1.3%)
Sovereign Bonds (1.3%)
Oschadbank Via SSB #1 plc 9.625% 3/20/25 1,000 1,0392 Oschadbank Via SSB #1 plc 9.625% 3/20/25 200 208
Ukraine 7.750% 9/1/19 1,400 1,447
Ukraine 7.750% 9/1/20 600 6232 Ukraine 7.750% 9/1/20 378 3932 Ukraine 7.750% 9/1/21 907 938
Ukraine 7.750% 9/1/22 1,200 1,225
Ukraine 7.750% 9/1/23 1,900 1,916
Ukraine 7.750% 9/1/24 1,750 1,747
Face Market
Maturity Amount Value•
Coupon Date ($000) ($000)
33
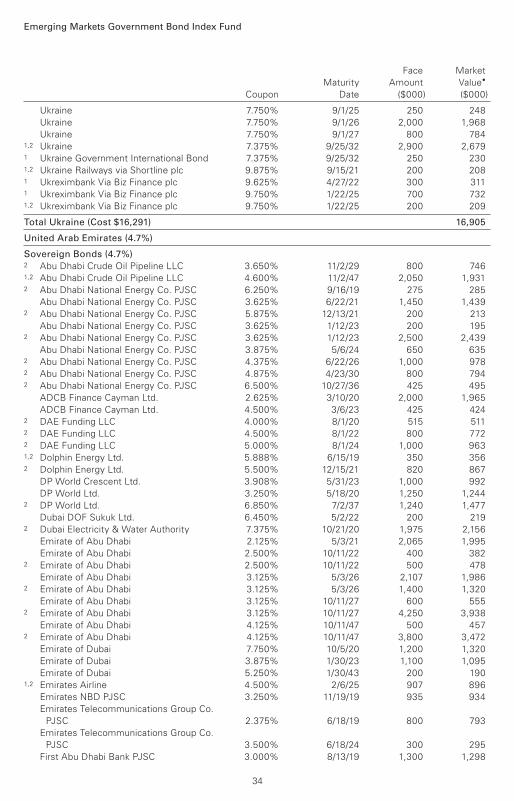
34
Emerging Markets Government Bond Index Fund
Ukraine 7.750% 9/1/25 250 248
Ukraine 7.750% 9/1/26 2,000 1,968
Ukraine 7.750% 9/1/27 800 7841,2 Ukraine 7.375% 9/25/32 2,900 2,6791 Ukraine Government International Bond 7.375% 9/25/32 250 2301,2 Ukraine Railways via Shortline plc 9.875% 9/15/21 200 2081 Ukreximbank Via Biz Finance plc 9.625% 4/27/22 300 3111 Ukreximbank Via Biz Finance plc 9.750% 1/22/25 700 7321,2 Ukreximbank Via Biz Finance plc 9.750% 1/22/25 200 209
Total Ukraine (Cost $16,291) 16,905
United Arab Emirates (4.7%)
Sovereign Bonds (4.7%) 2 Abu Dhabi Crude Oil Pipeline LLC 3.650% 11/2/29 800 7461,2 Abu Dhabi Crude Oil Pipeline LLC 4.600% 11/2/47 2,050 1,9312 Abu Dhabi National Energy Co. PJSC 6.250% 9/16/19 275 285
Abu Dhabi National Energy Co. PJSC 3.625% 6/22/21 1,450 1,4392 Abu Dhabi National Energy Co. PJSC 5.875% 12/13/21 200 213
Abu Dhabi National Energy Co. PJSC 3.625% 1/12/23 200 1952 Abu Dhabi National Energy Co. PJSC 3.625% 1/12/23 2,500 2,439
Abu Dhabi National Energy Co. PJSC 3.875% 5/6/24 650 6352 Abu Dhabi National Energy Co. PJSC 4.375% 6/22/26 1,000 9782 Abu Dhabi National Energy Co. PJSC 4.875% 4/23/30 800 7942 Abu Dhabi National Energy Co. PJSC 6.500% 10/27/36 425 495
ADCB Finance Cayman Ltd. 2.625% 3/10/20 2,000 1,965
ADCB Finance Cayman Ltd. 4.500% 3/6/23 425 4242 DAE Funding LLC 4.000% 8/1/20 515 5112 DAE Funding LLC 4.500% 8/1/22 800 7722 DAE Funding LLC 5.000% 8/1/24 1,000 9631,2 Dolphin Energy Ltd. 5.888% 6/15/19 350 3562 Dolphin Energy Ltd. 5.500% 12/15/21 820 867
DP World Crescent Ltd. 3.908% 5/31/23 1,000 992
DP World Ltd. 3.250% 5/18/20 1,250 1,2442 DP World Ltd. 6.850% 7/2/37 1,240 1,477
Dubai DOF Sukuk Ltd. 6.450% 5/2/22 200 2192 Dubai Electricity & Water Authority 7.375% 10/21/20 1,975 2,156
Emirate of Abu Dhabi 2.125% 5/3/21 2,065 1,995
Emirate of Abu Dhabi 2.500% 10/11/22 400 3822 Emirate of Abu Dhabi 2.500% 10/11/22 500 478
Emirate of Abu Dhabi 3.125% 5/3/26 2,107 1,9862 Emirate of Abu Dhabi 3.125% 5/3/26 1,400 1,320
Emirate of Abu Dhabi 3.125% 10/11/27 600 5552 Emirate of Abu Dhabi 3.125% 10/11/27 4,250 3,938
Emirate of Abu Dhabi 4.125% 10/11/47 500 4572 Emirate of Abu Dhabi 4.125% 10/11/47 3,800 3,472
Emirate of Dubai 7.750% 10/5/20 1,200 1,320
Emirate of Dubai 3.875% 1/30/23 1,100 1,095
Emirate of Dubai 5.250% 1/30/43 200 1901,2 Emirates Airline 4.500% 2/6/25 907 896
Emirates NBD PJSC 3.250% 11/19/19 935 934
Emirates Telecommunications Group Co.
PJSC 2.375% 6/18/19 800 793
Emirates Telecommunications Group Co.
PJSC 3.500% 6/18/24 300 295
First Abu Dhabi Bank PJSC 3.000% 8/13/19 1,300 1,298
Face Market
Maturity Amount Value•
Coupon Date ($000) ($000)
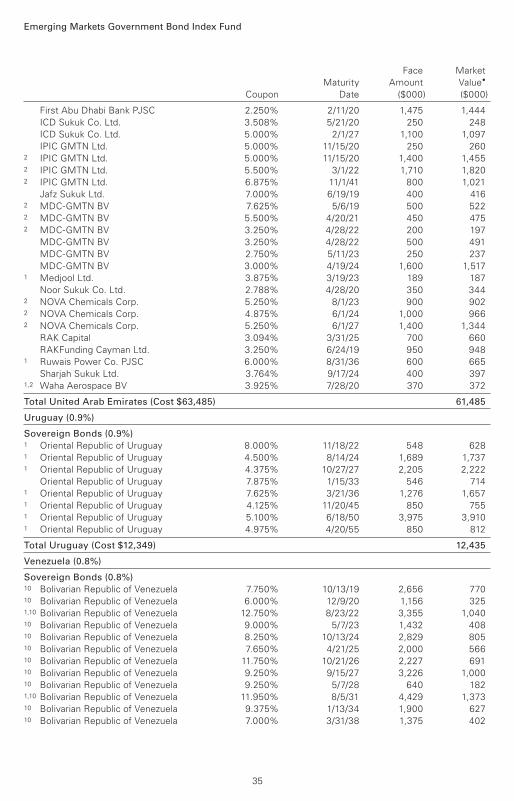
35
Emerging Markets Government Bond Index Fund
First Abu Dhabi Bank PJSC 2.250% 2/11/20 1,475 1,444
ICD Sukuk Co. Ltd. 3.508% 5/21/20 250 248
ICD Sukuk Co. Ltd. 5.000% 2/1/27 1,100 1,097
IPIC GMTN Ltd. 5.000% 11/15/20 250 2602 IPIC GMTN Ltd. 5.000% 11/15/20 1,400 1,4552 IPIC GMTN Ltd. 5.500% 3/1/22 1,710 1,8202 IPIC GMTN Ltd. 6.875% 11/1/41 800 1,021
Jafz Sukuk Ltd. 7.000% 6/19/19 400 4162 MDC-GMTN BV 7.625% 5/6/19 500 5222 MDC-GMTN BV 5.500% 4/20/21 450 4752 MDC-GMTN BV 3.250% 4/28/22 200 197
MDC-GMTN BV 3.250% 4/28/22 500 491
MDC-GMTN BV 2.750% 5/11/23 250 237
MDC-GMTN BV 3.000% 4/19/24 1,600 1,5171 Medjool Ltd. 3.875% 3/19/23 189 187
Noor Sukuk Co. Ltd. 2.788% 4/28/20 350 3442 NOVA Chemicals Corp. 5.250% 8/1/23 900 9022 NOVA Chemicals Corp. 4.875% 6/1/24 1,000 9662 NOVA Chemicals Corp. 5.250% 6/1/27 1,400 1,344
RAK Capital 3.094% 3/31/25 700 660
RAKFunding Cayman Ltd. 3.250% 6/24/19 950 9481 Ruwais Power Co. PJSC 6.000% 8/31/36 600 665
Sharjah Sukuk Ltd. 3.764% 9/17/24 400 3971,2 Waha Aerospace BV 3.925% 7/28/20 370 372
Total United Arab Emirates (Cost $63,485) 61,485
Uruguay (0.9%)
Sovereign Bonds (0.9%) 1 Oriental Republic of Uruguay 8.000% 11/18/22 548 6281 Oriental Republic of Uruguay 4.500% 8/14/24 1,689 1,7371 Oriental Republic of Uruguay 4.375% 10/27/27 2,205 2,222
Oriental Republic of Uruguay 7.875% 1/15/33 546 7141 Oriental Republic of Uruguay 7.625% 3/21/36 1,276 1,6571 Oriental Republic of Uruguay 4.125% 11/20/45 850 7551 Oriental Republic of Uruguay 5.100% 6/18/50 3,975 3,9101 Oriental Republic of Uruguay 4.975% 4/20/55 850 812
Total Uruguay (Cost $12,349) 12,435
Venezuela (0.8%)
Sovereign Bonds (0.8%) 10 Bolivarian Republic of Venezuela 7.750% 10/13/19 2,656 77010 Bolivarian Republic of Venezuela 6.000% 12/9/20 1,156 3251,10 Bolivarian Republic of Venezuela 12.750% 8/23/22 3,355 1,04010 Bolivarian Republic of Venezuela 9.000% 5/7/23 1,432 40810 Bolivarian Republic of Venezuela 8.250% 10/13/24 2,829 80510 Bolivarian Republic of Venezuela 7.650% 4/21/25 2,000 56610 Bolivarian Republic of Venezuela 11.750% 10/21/26 2,227 69110 Bolivarian Republic of Venezuela 9.250% 9/15/27 3,226 1,00010 Bolivarian Republic of Venezuela 9.250% 5/7/28 640 1821,10 Bolivarian Republic of Venezuela 11.950% 8/5/31 4,429 1,37310 Bolivarian Republic of Venezuela 9.375% 1/13/34 1,900 62710 Bolivarian Republic of Venezuela 7.000% 3/31/38 1,375 402
Face Market
Maturity Amount Value•
Coupon Date ($000) ($000)
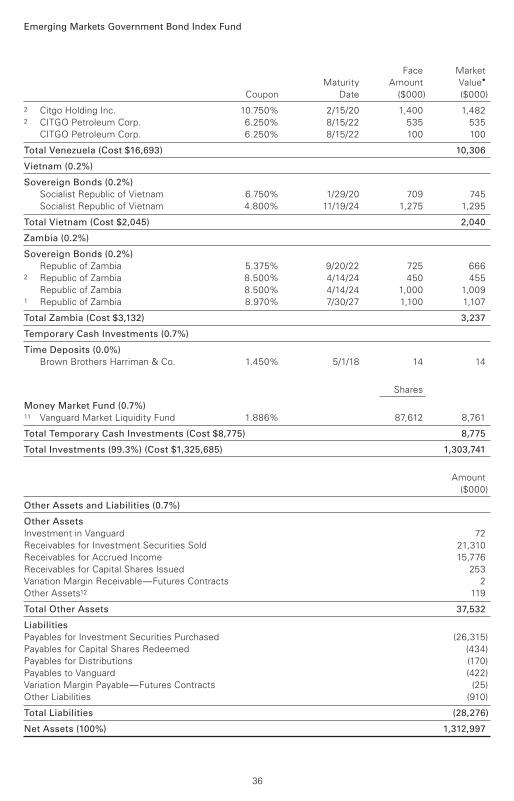
36
Emerging Markets Government Bond Index Fund
2 Citgo Holding Inc. 10.750% 2/15/20 1,400 1,4822 CITGO Petroleum Corp. 6.250% 8/15/22 535 535
CITGO Petroleum Corp. 6.250% 8/15/22 100 100
Total Venezuela (Cost $16,693) 10,306
Vietnam (0.2%)
Sovereign Bonds (0.2%)
Socialist Republic of Vietnam 6.750% 1/29/20 709 745
Socialist Republic of Vietnam 4.800% 11/19/24 1,275 1,295
Total Vietnam (Cost $2,045) 2,040
Zambia (0.2%)
Sovereign Bonds (0.2%)
Republic of Zambia 5.375% 9/20/22 725 6662 Republic of Zambia 8.500% 4/14/24 450 455
Republic of Zambia 8.500% 4/14/24 1,000 1,0091 Republic of Zambia 8.970% 7/30/27 1,100 1,107
Total Zambia (Cost $3,132) 3,237
Temporary Cash Investments (0.7%)
Time Deposits (0.0%)
Brown Brothers Harriman & Co. 1.450% 5/1/18 14 14
Shares
Money Market Fund (0.7%) 11 Vanguard Market Liquidity Fund 1.886% 87,612 8,761
Total Temporary Cash Investments (Cost $8,775) 8,775
Total Investments (99.3%) (Cost $1,325,685) 1,303,741
Amount
($000)
Other Assets and Liabilities (0.7%)
Other Assets
Investment in Vanguard 72
Receivables for Investment Securities Sold 21,310
Receivables for Accrued Income 15,776
Receivables for Capital Shares Issued 253
Variation Margin Receivable—Futures Contracts 2
Other Assets12 119
Total Other Assets 37,532
Liabilities
Payables for Investment Securities Purchased (26,315)
Payables for Capital Shares Redeemed (434)
Payables for Distributions (170)
Payables to Vanguard (422)
Variation Margin Payable—Futures Contracts (25)
Other Liabilities (910)
Total Liabilities (28,276)
Net Assets (100%) 1,312,997
Face Market
Maturity Amount Value•
Coupon Date ($000) ($000)
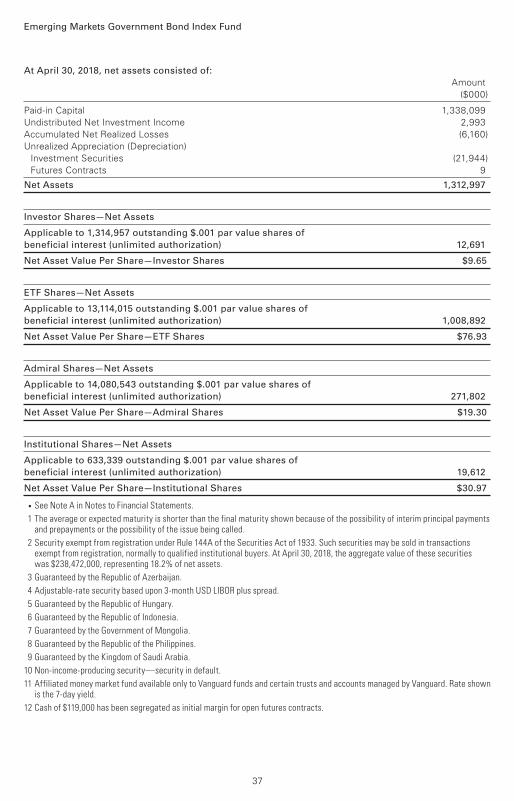
Emerging Markets Government Bond Index Fund
Paid-in Capital 1,338,099
Undistributed Net Investment Income 2,993
Accumulated Net Realized Losses (6,160)
Unrealized Appreciation (Depreciation)
Investment Securities (21,944)
Futures Contracts 9
Net Assets 1,312,997
Investor Shares—Net Assets
Applicable to 1,314,957 outstanding $.001 par value shares of
beneficial interest (unlimited authorization) 12,691
Net Asset Value Per Share—Investor Shares $9.65
ETF Shares—Net Assets
Applicable to 13,114,015 outstanding $.001 par value shares of
beneficial interest (unlimited authorization) 1,008,892
Net Asset Value Per Share—ETF Shares $76.93
Admiral Shares—Net Assets
Applicable to 14,080,543 outstanding $.001 par value shares of
beneficial interest (unlimited authorization) 271,802
Net Asset Value Per Share—Admiral Shares $19.30
Institutional Shares—Net Assets
Applicable to 633,339 outstanding $.001 par value shares of
beneficial interest (unlimited authorization) 19,612
Net Asset Value Per Share—Institutional Shares $30.97
• See Note A in Notes to Financial Statements.
1 The average or expected maturity is shorter than the final maturity shown because of the possibility of interim principal payments and prepayments or the possibility of the issue being called.
2 Security exempt from registration under Rule 144A of the Securities Act of 1933. Such securities may be sold in transactions exempt from registration, normally to qualified institutional buyers. At April 30, 2018, the aggregate value of these securities was $238,472,000, representing 18.2% of net assets.
3 Guaranteed by the Republic of Azerbaijan.
4 Adjustable-rate security based upon 3-month USD LIBOR plus spread.
5 Guaranteed by the Republic of Hungary.
6 Guaranteed by the Republic of Indonesia.
7 Guaranteed by the Government of Mongolia.
8 Guaranteed by the Republic of the Philippines.
9 Guaranteed by the Kingdom of Saudi Arabia.
10 Non-income-producing security—security in default.
11 Affiliated money market fund available only to Vanguard funds and certain trusts and accounts managed by Vanguard. Rate shown is the 7-day yield.
12 Cash of $119,000 has been segregated as initial margin for open futures contracts.
At April 30, 2018, net assets consisted of:
Amount
($000)
37
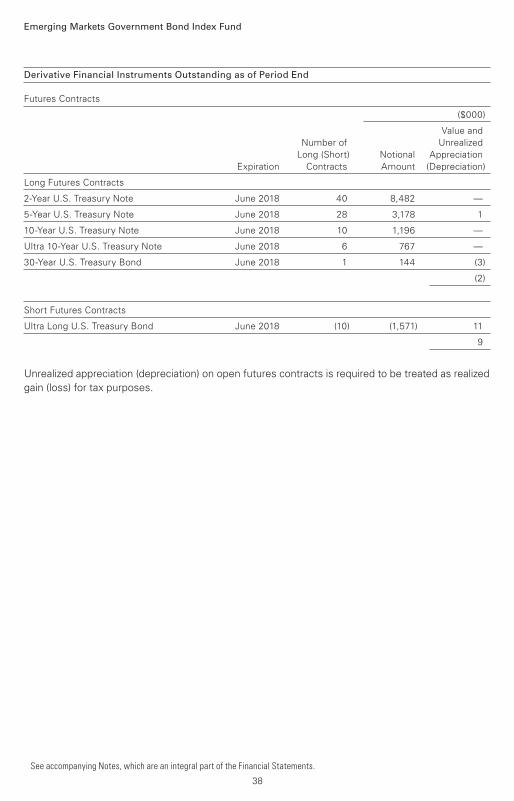
Emerging Markets Government Bond Index Fund
Derivative Financial Instruments Outstanding as of Period End
Futures Contracts
($000)
Value and
Number of Unrealized
Long (Short) Notional Appreciation
Expiration Contracts Amount (Depreciation)
Long Futures Contracts
2-Year U.S. Treasury Note June 2018 40 8,482 —
5-Year U.S. Treasury Note June 2018 28 3,178 1
10-Year U.S. Treasury Note June 2018 10 1,196 —
Ultra 10-Year U.S. Treasury Note June 2018 6 767 —
30-Year U.S. Treasury Bond June 2018 1 144 (3)
(2)
Short Futures Contracts
Ultra Long U.S. Treasury Bond June 2018 (10) (1,571) 11
9
Unrealized appreciation (depreciation) on open futures contracts is required to be treated as realized
gain (loss) for tax purposes.
See accompanying Notes, which are an integral part of the Financial Statements.
38
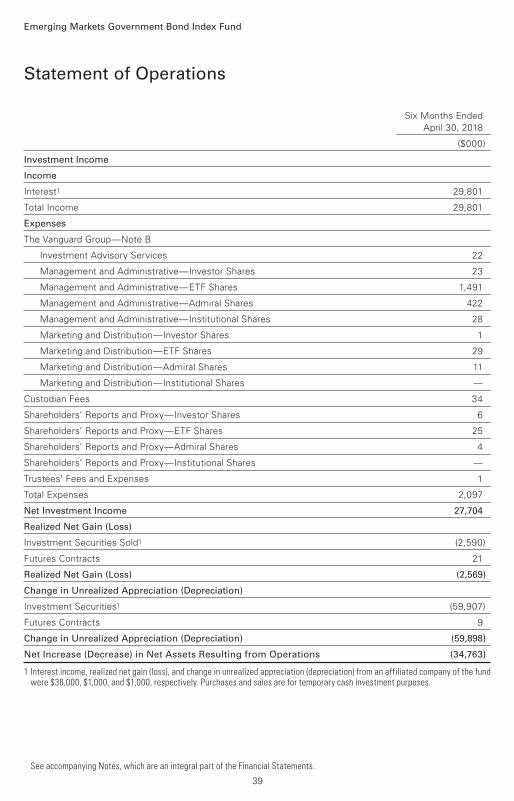
Six Months Ended
April 30, 2018
($000)
Investment Income
Income
Interest1 29,801
Total Income 29,801
Expenses
The Vanguard Group—Note B
Investment Advisory Services 22
Management and Administrative—Investor Shares 23
Management and Administrative—ETF Shares 1,491
Management and Administrative—Admiral Shares 422
Management and Administrative—Institutional Shares 28
Marketing and Distribution—Investor Shares 1
Marketing and Distribution—ETF Shares 29
Marketing and Distribution—Admiral Shares 11
Marketing and Distribution—Institutional Shares —
Custodian Fees 34
Shareholders’ Reports and Proxy—Investor Shares 6
Shareholders’ Reports and Proxy—ETF Shares 25
Shareholders’ Reports and Proxy—Admiral Shares 4
Shareholders’ Reports and Proxy—Institutional Shares —
Trustees’ Fees and Expenses 1
Total Expenses 2,097
Net Investment Income 27,704
Realized Net Gain (Loss)
Investment Securities Sold1 (2,590)
Futures Contracts 21
Realized Net Gain (Loss) (2,569)
Change in Unrealized Appreciation (Depreciation)
Investment Securities1 (59,907)
Futures Contracts 9
Change in Unrealized Appreciation (Depreciation) (59,898)
Net Increase (Decrease) in Net Assets Resulting from Operations (34,763)
1 Interest income, realized net gain (loss), and change in unrealized appreciation (depreciation) from an affiliated company of the fund were $38,000, $1,000, and $1,000, respectively. Purchases and sales are for temporary cash investment purposes.
Statement of Operations
Emerging Markets Government Bond Index Fund
See accompanying Notes, which are an integral part of the Financial Statements.
39
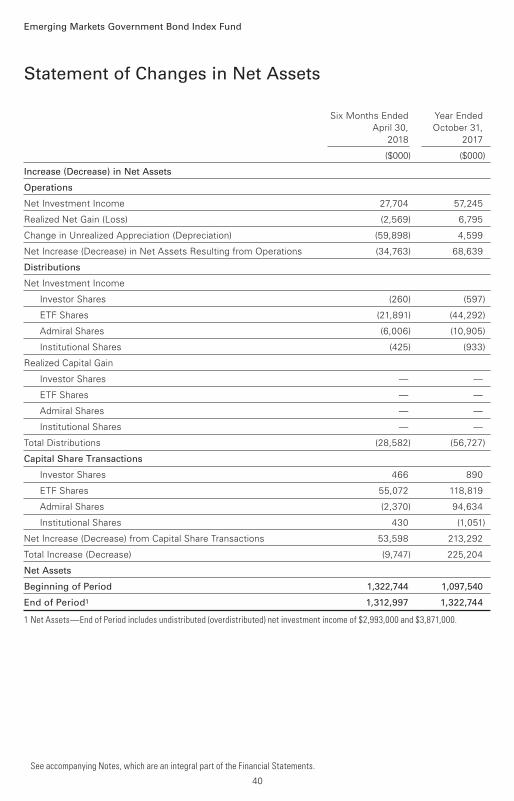
Statement of Changes in Net Assets
Emerging Markets Government Bond Index Fund
See accompanying Notes, which are an integral part of the Financial Statements.
Six Months Ended Year Ended
April 30, October 31,
2018 2017
($000) ($000)
Increase (Decrease) in Net Assets
Operations
Net Investment Income 27,704 57,245
Realized Net Gain (Loss) (2,569) 6,795
Change in Unrealized Appreciation (Depreciation) (59,898) 4,599
Net Increase (Decrease) in Net Assets Resulting from Operations (34,763) 68,639
Distributions
Net Investment Income
Investor Shares (260) (597)
ETF Shares (21,891) (44,292)
Admiral Shares (6,006) (10,905)
Institutional Shares (425) (933)
Realized Capital Gain
Investor Shares — —
ETF Shares — —
Admiral Shares — —
Institutional Shares — —
Total Distributions (28,582) (56,727)
Capital Share Transactions
Investor Shares 466 890
ETF Shares 55,072 118,819
Admiral Shares (2,370) 94,634
Institutional Shares 430 (1,051)
Net Increase (Decrease) from Capital Share Transactions 53,598 213,292
Total Increase (Decrease) (9,747) 225,204
Net Assets
Beginning of Period 1,322,744 1,097,540
End of Period1 1,312,997 1,322,744
1 Net Assets—End of Period includes undistributed (overdistributed) net investment income of $2,993,000 and $3,871,000.
40
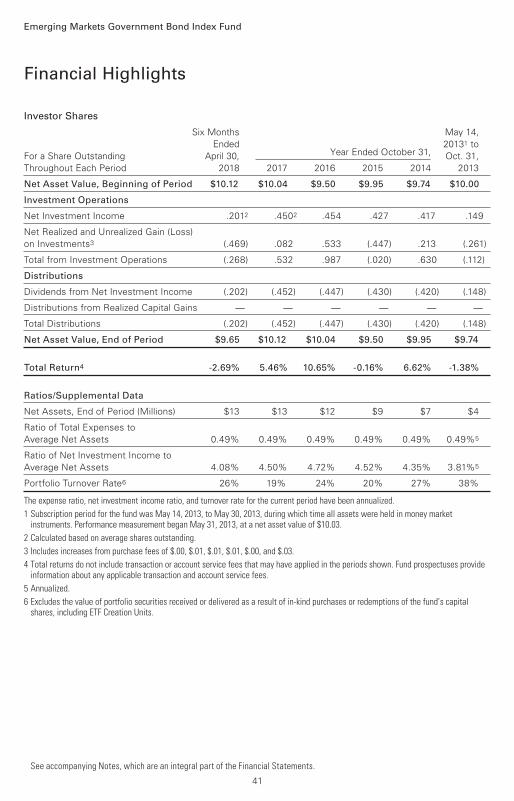
Investor Shares
Six Months May 14,
Ended 20131 to
For a Share Outstanding April 30, Year Ended October 31, Oct. 31,
Throughout Each Period 2018 2017 2016 2015 2014 2013
Net Asset Value, Beginning of Period $10.12 $10.04 $9.50 $9.95 $9.74 $10.00
Investment Operations
Net Investment Income .2012 .4502 .454 .427 .417 .149
Net Realized and Unrealized Gain (Loss)
on Investments3 (.469) .082 .533 (.447) .213 (.261)
Total from Investment Operations (.268) .532 .987 (.020) .630 (.112)
Distributions
Dividends from Net Investment Income (.202) (.452) (.447) (.430) (.420) (.148)
Distributions from Realized Capital Gains — — — — — —
Total Distributions (.202) (.452) (.447) (.430) (.420) (.148)
Net Asset Value, End of Period $9.65 $10.12 $10.04 $9.50 $9.95 $9.74
Total Return4 -2.69% 5.46% 10.65% -0.16% 6.62% -1.38%
Ratios/Supplemental Data
Net Assets, End of Period (Millions) $13 $13 $12 $9 $7 $4
Ratio of Total Expenses to
Average Net Assets 0.49% 0.49% 0.49% 0.49% 0.49% 0.49%5
Ratio of Net Investment Income to
Average Net Assets 4.08% 4.50% 4.72% 4.52% 4.35% 3.81%5
Portfolio Turnover Rate6 26% 19% 24% 20% 27% 38%
The expense ratio, net investment income ratio, and turnover rate for the current period have been annualized.
1 Subscription period for the fund was May 14, 2013, to May 30, 2013, during which time all assets were held in money market instruments. Performance measurement began May 31, 2013, at a net asset value of $10.03.
2 Calculated based on average shares outstanding.
3 Includes increases from purchase fees of $.00, $.01, $.01, $.01, $.00, and $.03.
4 Total returns do not include transaction or account service fees that may have applied in the periods shown. Fund prospectuses provide information about any applicable transaction and account service fees.
5 Annualized.
6 Excludes the value of portfolio securities received or delivered as a result of in-kind purchases or redemptions of the fund’s capital shares, including ETF Creation Units.
Financial Highlights
See accompanying Notes, which are an integral part of the Financial Statements.
Emerging Markets Government Bond Index Fund
41
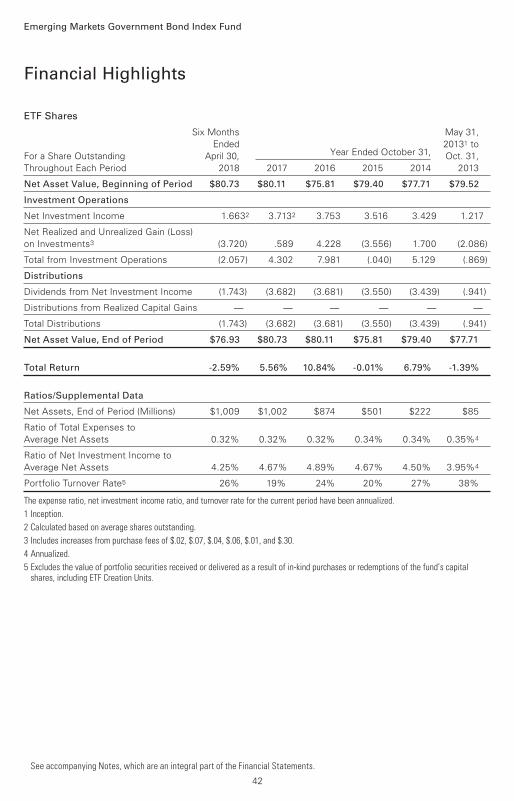
ETF Shares
Six Months May 31,
Ended 20131 to
For a Share Outstanding April 30, Year Ended October 31, Oct. 31,
Throughout Each Period 2018 2017 2016 2015 2014 2013
Net Asset Value, Beginning of Period $80.73 $80.11 $75.81 $79.40 $77.71 $79.52
Investment Operations
Net Investment Income 1.6632 3.7132 3.753 3.516 3.429 1.217
Net Realized and Unrealized Gain (Loss)
on Investments3 (3.720) .589 4.228 (3.556) 1.700 (2.086)
Total from Investment Operations (2.057) 4.302 7.981 (.040) 5.129 (.869)
Distributions
Dividends from Net Investment Income (1.743) (3.682) (3.681) (3.550) (3.439) (.941)
Distributions from Realized Capital Gains — — — — — —
Total Distributions (1.743) (3.682) (3.681) (3.550) (3.439) (.941)
Net Asset Value, End of Period $76.93 $80.73 $80.11 $75.81 $79.40 $77.71
Total Return -2.59% 5.56% 10.84% -0.01% 6.79% -1.39%
Ratios/Supplemental Data
Net Assets, End of Period (Millions) $1,009 $1,002 $874 $501 $222 $85
Ratio of Total Expenses to
Average Net Assets 0.32% 0.32% 0.32% 0.34% 0.34% 0.35%4
Ratio of Net Investment Income to
Average Net Assets 4.25% 4.67% 4.89% 4.67% 4.50% 3.95%4
Portfolio Turnover Rate5 26% 19% 24% 20% 27% 38%
The expense ratio, net investment income ratio, and turnover rate for the current period have been annualized.
1 Inception.
2 Calculated based on average shares outstanding.
3 Includes increases from purchase fees of $.02, $.07, $.04, $.06, $.01, and $.30.
4 Annualized.
5 Excludes the value of portfolio securities received or delivered as a result of in-kind purchases or redemptions of the fund’s capital shares, including ETF Creation Units.
Financial Highlights
See accompanying Notes, which are an integral part of the Financial Statements.
Emerging Markets Government Bond Index Fund
42
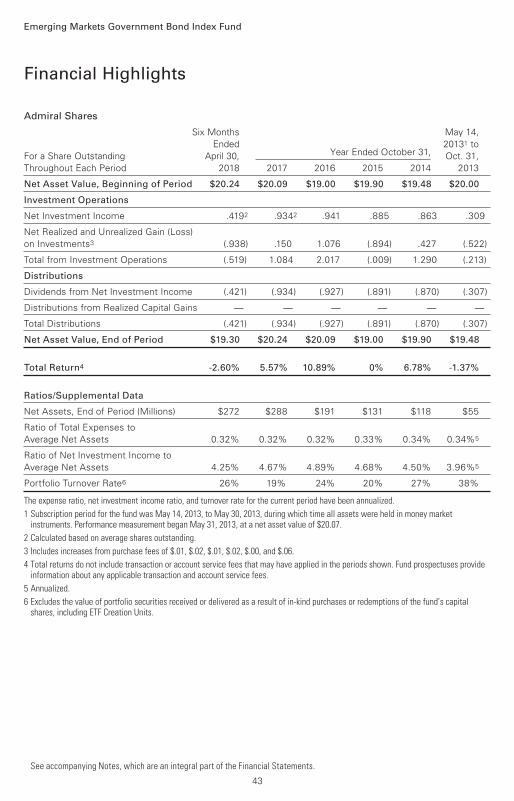
Admiral Shares
Six Months May 14,
Ended 20131 to
For a Share Outstanding April 30, Year Ended October 31, Oct. 31,
Throughout Each Period 2018 2017 2016 2015 2014 2013
Net Asset Value, Beginning of Period $20.24 $20.09 $19.00 $19.90 $19.48 $20.00
Investment Operations
Net Investment Income .4192 .9342 .941 .885 .863 .309
Net Realized and Unrealized Gain (Loss)
on Investments3 (.938) .150 1.076 (.894) .427 (.522)
Total from Investment Operations (.519) 1.084 2.017 (.009) 1.290 (.213)
Distributions
Dividends from Net Investment Income (.421) (.934) (.927) (.891) (.870) (.307)
Distributions from Realized Capital Gains — — — — — —
Total Distributions (.421) (.934) (.927) (.891) (.870) (.307)
Net Asset Value, End of Period $19.30 $20.24 $20.09 $19.00 $19.90 $19.48
Total Return4 -2.60% 5.57% 10.89% 0% 6.78% -1.37%
Ratios/Supplemental Data
Net Assets, End of Period (Millions) $272 $288 $191 $131 $118 $55
Ratio of Total Expenses to
Average Net Assets 0.32% 0.32% 0.32% 0.33% 0.34% 0.34%5
Ratio of Net Investment Income to
Average Net Assets 4.25% 4.67% 4.89% 4.68% 4.50% 3.96%5
Portfolio Turnover Rate6 26% 19% 24% 20% 27% 38%
The expense ratio, net investment income ratio, and turnover rate for the current period have been annualized.
1 Subscription period for the fund was May 14, 2013, to May 30, 2013, during which time all assets were held in money market instruments. Performance measurement began May 31, 2013, at a net asset value of $20.07.
2 Calculated based on average shares outstanding.
3 Includes increases from purchase fees of $.01, $.02, $.01, $.02, $.00, and $.06.
4 Total returns do not include transaction or account service fees that may have applied in the periods shown. Fund prospectuses provide information about any applicable transaction and account service fees.
5 Annualized.
6 Excludes the value of portfolio securities received or delivered as a result of in-kind purchases or redemptions of the fund’s capital shares, including ETF Creation Units.
Financial Highlights
See accompanying Notes, which are an integral part of the Financial Statements.
Emerging Markets Government Bond Index Fund
43

Institutional Shares
Six Months Feb. 11, Nov. 25,
Ended Year Ended 20151 to 20141 to
For a Share Outstanding April 30, October 31, Oct. 31, Dec. 18,
Throughout Each Period 2018 2017 2016 2015 2014
Net Asset Value, Beginning of Period $32.47 $32.24 $30.50 $30.72 $31.53
Investment Operations
Net Investment Income .6762 1.5082 1.521 1.019 .108
Net Realized and Unrealized Gain (Loss)
on Investments3 (1.497) .238 1.715 (.159) (1.240)
Total from Investment Operations (.821) 1.746 3.236 .860 (1.132)
Distributions
Dividends from Net Investment Income (.679) (1.516) (1.496) (1.080) (.108)
Distributions from Realized Capital Gains — — — — —
Total Distributions (.679) (1.516) (1.496) (1.080) (.108)
Net Asset Value, End of Period $30.97 $32.47 $32.24 $30.50 $30.29
Total Return4 -2.56% 5.59% 10.89% 2.82% -3.60%
Ratios/Supplemental Data
Net Assets, End of Period (Millions) $20 $20 $21 $10 $0
Ratio of Total Expenses to Average Net Assets 0.29% 0.29% 0.29% 0.29% 0.30%
Ratio of Net Investment Income to
Average Net Assets 4.28% 4.70% 4.92% 4.75% 4.72%
Portfolio Turnover Rate5 26% 19% 24% 20%6 20%6
The expense ratio, net investment income ratio, and turnover rate for the current period have been annualized.
1 The class commenced operations on November 25, 2014. On December 18, 2014, all outstanding shares were redeemed and the net asset value represents the per share amount at which such shares were redeemed. On February 11, 2015, the class recommenced operations. The expense ratio and net income ratio for the periods shown have been annualized.
2 Calculated based on average shares outstanding.
3 Includes increases from purchase fees of $.01 for 2018, $.03 for 2017, $.02 for 2016, and $.04 in aggregate for periods prior to November 1, 2015.
4 Total returns do not include transaction fees that may have applied in the periods shown. Fund prospectuses provide information about any applicable transaction fees.
5 Excludes the value of portfolio securities received or delivered as a result of in-kind purchases or redemptions of the fund’s capital shares, including ETF Creation Units.
6 Reflects the fund’s portfolio turnover for the fiscal year ended October 31, 2015.
Financial Highlights
See accompanying Notes, which are an integral part of the Financial Statements.
Emerging Markets Government Bond Index Fund
44
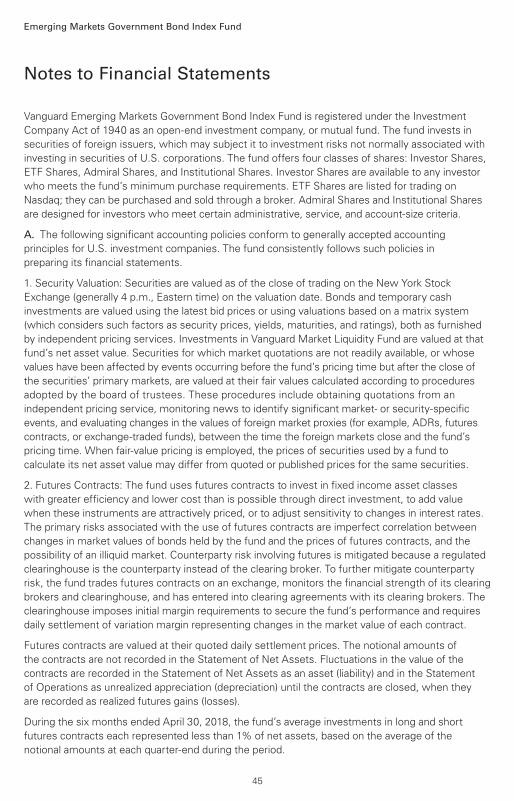
Notes to Financial Statements
Emerging Markets Government Bond Index Fund
Vanguard Emerging Markets Government Bond Index Fund is registered under the Investment
Company Act of 1940 as an open-end investment company, or mutual fund. The fund invests in
securities of foreign issuers, which may subject it to investment risks not normally associated with
investing in securities of U.S. corporations. The fund offers four classes of shares: Investor Shares,
ETF Shares, Admiral Shares, and Institutional Shares. Investor Shares are available to any investor
who meets the fund’s minimum purchase requirements. ETF Shares are listed for trading on
Nasdaq; they can be purchased and sold through a broker. Admiral Shares and Institutional Shares
are designed for investors who meet certain administrative, service, and account-size criteria.
A. The following significant accounting policies conform to generally accepted accounting
principles for U.S. investment companies. The fund consistently follows such policies in
preparing its financial statements.
1. Security Valuation: Securities are valued as of the close of trading on the New York Stock
Exchange (generally 4 p.m., Eastern time) on the valuation date. Bonds and temporary cash
investments are valued using the latest bid prices or using valuations based on a matrix system
(which considers such factors as security prices, yields, maturities, and ratings), both as furnished
by independent pricing services. Investments in Vanguard Market Liquidity Fund are valued at that
fund’s net asset value. Securities for which market quotations are not readily available, or whose
values have been affected by events occurring before the fund’s pricing time but after the close of
the securities’ primary markets, are valued at their fair values calculated according to procedures
adopted by the board of trustees. These procedures include obtaining quotations from an
independent pricing service, monitoring news to identify significant market- or security-specific
events, and evaluating changes in the values of foreign market proxies (for example, ADRs, futures
contracts, or exchange-traded funds), between the time the foreign markets close and the fund’s
pricing time. When fair-value pricing is employed, the prices of securities used by a fund to
calculate its net asset value may differ from quoted or published prices for the same securities.
2. Futures Contracts: The fund uses futures contracts to invest in fixed income asset classes
with greater efficiency and lower cost than is possible through direct investment, to add value
when these instruments are attractively priced, or to adjust sensitivity to changes in interest rates.
The primary risks associated with the use of futures contracts are imperfect correlation between
changes in market values of bonds held by the fund and the prices of futures contracts, and the
possibility of an illiquid market. Counterparty risk involving futures is mitigated because a regulated
clearinghouse is the counterparty instead of the clearing broker. To further mitigate counterparty
risk, the fund trades futures contracts on an exchange, monitors the financial strength of its clearing
brokers and clearinghouse, and has entered into clearing agreements with its clearing brokers. The
clearinghouse imposes initial margin requirements to secure the fund’s performance and requires
daily settlement of variation margin representing changes in the market value of each contract.
Futures contracts are valued at their quoted daily settlement prices. The notional amounts of
the contracts are not recorded in the Statement of Net Assets. Fluctuations in the value of the
contracts are recorded in the Statement of Net Assets as an asset (liability) and in the Statement
of Operations as unrealized appreciation (depreciation) until the contracts are closed, when they
are recorded as realized futures gains (losses).
During the six months ended April 30, 2018, the fund’s average investments in long and short
futures contracts each represented less than 1% of net assets, based on the average of the
notional amounts at each quarter-end during the period.
45
Emerging Markets Government Bond Index Fund
3. Federal Income Taxes: The fund intends to continue to qualify as a regulated investment
company and distribute all of its taxable income. Management has analyzed the fund’s tax positions
taken for all open federal income tax years (October 31, 2014–2017), and for the period ended
April 30, 2018, and has concluded that no provision for federal income tax is required in the fund’s
financial statements.
4. Distributions: Distributions to shareholders are recorded on the ex-dividend date.
5. Credit Facility: The fund and certain other funds managed by The Vanguard Group (“Vanguard”)
participate in a $3.1 billion committed credit facility provided by a syndicate of lenders pursuant to
a credit agreement that may be renewed annually; each fund is individually liable for its borrowings,
if any, under the credit facility. Borrowings may be utilized for temporary and emergency purposes,
and are subject to the fund’s regulatory and contractual borrowing restrictions. The participating
funds are charged administrative fees and an annual commitment fee of 0.10% of the undrawn
amount of the facility; these fees are allocated to the funds based on a method approved by the
fund’s board of trustees and included in Management and Administrative expenses on the fund’s
Statement of Operations. Any borrowings under this facility bear interest at a rate based upon the
higher of the one-month London Interbank Offered Rate, federal funds effective rate, or overnight
bank funding rate plus an agreed-upon spread.
The fund had no borrowings outstanding at April 30, 2018, or at any time during the period
then ended.
6. Other: Interest income includes income distributions received from Vanguard Market Liquidity
Fund and is accrued daily. Premiums and discounts on debt securities purchased are amortized
and accreted, respectively, to interest income over the lives of the respective securities. Security
transactions are accounted for on the date securities are bought or sold. Costs used to determine
realized gains (losses) on the sale of investment securities are those of the specific securities sold.
Fees assessed on capital share transactions are credited to paid-in capital.
Each class of shares has equal rights as to assets and earnings, except that each class separately
bears certain class-specific expenses related to maintenance of shareholder accounts (included in
Management and Administrative expenses), shareholder reporting, and the proxy. Marketing and
distribution expenses are allocated to each class of shares based on a method approved by the
board of trustees. Income, other non-class-specific expenses, and gains and losses on investments
are allocated to each class of shares based on its relative net assets.
B. In accordance with the terms of a Funds’ Service Agreement (the “FSA”) between Vanguard
and the fund, Vanguard furnishes to the fund investment advisory, corporate management,
administrative, marketing, and distribution services at Vanguard’s cost of operations (as defined
by the FSA). These costs of operations are allocated to the fund based on methods and guidelines
approved by the board of trustees. Vanguard does not require reimbursement in the current period
for certain costs of operations (such as deferred compensation/benefits and risk/insurance costs);
the fund’s liability for these costs of operations is included in Payables to Vanguard on the
Statement of Net Assets. All other costs of operations payable to Vanguard are generally
settled twice a month.
Upon the request of Vanguard, the fund may invest up to 0.40% of its net assets as capital in
Vanguard. At April 30, 2018, the fund had contributed to Vanguard capital in the amount of $72,000,
representing 0.01% of the fund’s net assets and 0.03% of Vanguard’s capitalization. The fund’s
trustees and officers are also directors and employees, respectively, of Vanguard.
46
Emerging Markets Government Bond Index Fund
C. Various inputs may be used to determine the value of the fund’s investments. These inputs are
summarized in three broad levels for financial statement purposes. The inputs or methodologies
used to value securities are not necessarily an indication of the risk associated with investing in
those securities.
Level 1—Quoted prices in active markets for identical securities.
Level 2—Other significant observable inputs (including quoted prices for similar securities, interest
rates, prepayment speeds, credit risk, etc.).
Level 3—Significant unobservable inputs (including the fund’s own assumptions used to determine
the fair value of investments). Any investments valued with significant unobservable inputs are
noted on the Statement of Net Assets.
The following table summarizes the market value of the fund’s investments as of April 30, 2018,
based on the inputs used to value them:
Level 1 Level 2 Level 3
Investments ($000) ($000) ($000)
Corporate Bonds — 2,855 —
Sovereign Bonds — 1,292,111 —
Temporary Cash Investments 8,761 14 —
Futures Contracts—Assets1 2 — —
Futures Contracts—Liabilities1 (25) — —
Total 8,738 1,294,980 —
1 Represents variation margin on the last day of the reporting period.
D. Distributions are determined on a tax basis and may differ from net investment income and
realized capital gains for financial reporting purposes. Differences may be permanent or temporary.
Permanent differences are reclassified among capital accounts in the financial statements to reflect
their tax character. Temporary differences arise when certain items of income, expense, gain, or
loss are recognized in different periods for financial statement and tax purposes. These differences
will reverse at some time in the future. Differences in classification may also result from the
treatment of short-term gains as ordinary income for tax purposes.
During the six months ended April 30, 2018, the fund realized $1,157,000 of net capital gains
resulting from in-kind redemptions—in which shareholders exchanged fund shares for securities
held by the fund rather than for cash. Because such gains are not taxable to the fund, and are not
distributed to shareholders, they have been reclassified from accumulated net realized losses to
paid-in capital.
The fund’s tax-basis capital gains and losses are determined only at the end of each fiscal year. For
tax purposes, at October 31, 2017, the fund had available capital losses totaling $2,355,000 that
may be carried forward indefinitely to offset future net capital gains. The fund will use these capital
losses to offset net taxable capital gains, if any, realized during the year ending October 31, 2018;
should the fund realize net capital losses for the year, the losses will be added to the loss
carryforward balance above.
47
Emerging Markets Government Bond Index Fund
At April 30, 2018, the cost of investment securities for tax purposes was $1,325,763,000. Net
unrealized depreciation of investment securities for tax purposes was $22,022,000, consisting
of unrealized gains of $15,550,000 on securities that had risen in value since their purchase and
$37,572,000 in unrealized losses on securities that had fallen in value since their purchase.
E. During the six months ended April 30, 2018, the fund purchased $217,747,000 of investment
securities and sold $165,906,000 of investment securities, other than U.S. government securities
and temporary cash investments. Purchases and sales of U.S. government securities were
$26,587,000 and $26,559,000, respectively. Total purchases and sales include $64,172,000 and
$23,559,000, respectively, in connection with in-kind purchases and redemptions of the fund’s
capital shares.
F. Capital share transactions for each class of shares were:
Six Months Ended Year Ended
April 30, 2018 October 31, 2017
Amount Shares Amount Shares
($000) (000) ($000) (000)
Investor Shares
Issued1 3,618 363 8,929 892
Issued in Lieu of Cash Distributions 211 21 502 50
Redeemed (3,363) (337) (8,541) (850)
Net Increase (Decrease)—Investor Shares 466 47 890 92
ETF Shares
Issued1 79,101 1,000 206,684 2,608
Issued in Lieu of Cash Distributions — — — —
Redeemed (24,029) (300) (87,865) (1,100)
Net Increase (Decrease)—ETF Shares 55,072 700 118,819 1,508
Admiral Shares
Issued1 43,172 2,158 130,192 6,486
Issued in Lieu of Cash Distributions 5,017 253 9,143 457
Redeemed (50,559) (2,536) (44,701) (2,245)
Net Increase (Decrease)—Admiral Shares (2,370) (125) 94,634 4,698
Institutional Shares
Issued1 — — — —
Issued in Lieu of Cash Distributions 430 13 949 29
Redeemed — — (2,000) (64)
Net Increase (Decrease)—Institutional Shares 430 13 (1,051) (35)
1 Includes purchase fees for fiscal 2018 and 2017 of $339,000 and $1,024,000, respectively (fund totals).
G. Management has determined that no material events or transactions occurred subsequent to
April 30, 2018, that would require recognition or disclosure in these financial statements.
48
About Your Fund’s Expenses
49
As a shareholder of the fund, you incur ongoing costs, which include costs for portfolio management,
administrative services, and shareholder reports (like this one), among others. Operating expenses,
which are deducted from a fund’s gross income, directly reduce the investment return of the fund.
A fund’s expenses are expressed as a percentage of its average net assets. This figure is known as
the expense ratio. The following examples are intended to help you understand the ongoing costs (in
dollars) of investing in your fund and to compare these costs with those of other mutual funds. The
examples are based on an investment of $1,000 made at the beginning of the period shown and held
for the entire period.
The accompanying table illustrates your fund’s costs in two ways:
• Based on actual fund return. This section helps you to estimate the actual expenses that you
paid over the period. The ”Ending Account Value“ shown is derived from the fund‘s actual return,
and the third column shows the dollar amount that would have been paid by an investor who started
with $1,000 in the fund. You may use the information here, together with the amount you invested,
to estimate the expenses that you paid over the period.
To do so, simply divide your account value by $1,000 (for example, an $8,600 account value divided
by $1,000 = 8.6), then multiply the result by the number given for your fund under the heading
”Expenses Paid During Period.“
• Based on hypothetical 5% yearly return. This section is intended to help you compare your
fund‘s costs with those of other mutual funds. It assumes that the fund had a yearly return of 5%
before expenses, but that the expense ratio is unchanged. In this case—because the return used is
not the fund’s actual return—the results do not apply to your investment. The example is useful in
making comparisons because the Securities and Exchange Commission requires all mutual funds to
calculate expenses based on a 5% return. You can assess your fund’s costs by comparing this
hypothetical example with the hypothetical examples that appear in shareholder reports of other
funds.
Note that the expenses shown in the table are meant to highlight and help you compare ongoingcosts only and do not reflect transaction costs incurred by the fund for buying and sellingsecurities. Further, the expenses do not include any purchase, redemption, or account servicefees described in the fund prospectus. If such fees were applied to your account, your costswould be higher. Your fund does not carry a “sales load.”
The calculations assume no shares were bought or sold during the period. Your actual costs may
have been higher or lower, depending on the amount of your investment and the timing of any
purchases or redemptions.
You can find more information about the fund’s expenses, including annual expense ratios, in the
Financial Statements section of this report. For additional information on operating expenses and
other shareholder costs, please refer to your fund’s current prospectus.
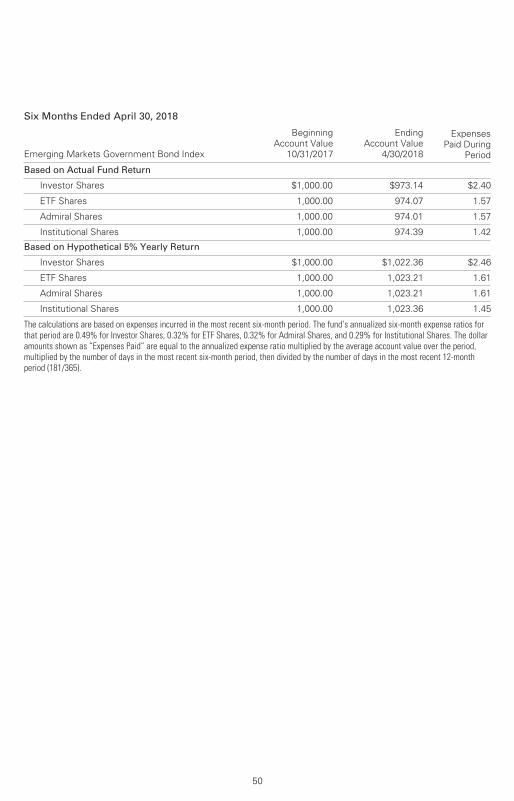
50
Six Months Ended April 30, 2018
Emerging Markets Government Bond Index
Beginning
Account Value
10/31/2017
Ending
Account Value
4/30/2018
Expenses
Paid During
Period
Based on Actual Fund Return
Investor Shares $1,000.00 $973.14 $2.40
ETF Shares 1,000.00 974.07 1.57
Admiral Shares 1,000.00 974.01 1.57
Institutional Shares 1,000.00 974.39 1.42
Based on Hypothetical 5% Yearly Return
Investor Shares $1,000.00 $1,022.36 $2.46
ETF Shares 1,000.00 1,023.21 1.61
Admiral Shares 1,000.00 1,023.21 1.61
Institutional Shares 1,000.00 1,023.36 1.45
The calculations are based on expenses incurred in the most recent six-month period. The fund’s annualized six-month expense ratios forthat period are 0.49% for Investor Shares, 0.32% for ETF Shares, 0.32% for Admiral Shares, and 0.29% for Institutional Shares. The dollaramounts shown as “Expenses Paid” are equal to the annualized expense ratio multiplied by the average account value over the period,multiplied by the number of days in the most recent six-month period, then divided by the number of days in the most recent 12-monthperiod (181/365).
The board of trustees of Vanguard Emerging Markets Government Bond Index Fund has renewed
the fund’s investment advisory arrangement with The Vanguard Group, Inc. (Vanguard), through
its Fixed Income Group. The board determined that continuing the fund’s internalized management
structure was in the best interests of the fund and its shareholders.
The board based its decision upon an evaluation of the advisor’s investment staff, portfolio
management process, and performance. This evaluation included information provided to the
board by Vanguard’s Portfolio Review Department, which is responsible for fund and advisor
oversight and product management. The Portfolio Review Department met regularly with the
advisor and made monthly presentations to the board during the fiscal year that directed the
board’s focus to relevant information and topics.
The board, or an investment committee made up of board members, also received information
throughout the year during advisor presentations. For each advisor presentation, the board was
provided with letters and reports that included information about, among other things, the advisory
firm and the advisor’s assessment of the investment environment, portfolio performance, and
portfolio characteristics.
In addition, the board received monthly reports, which included a Market and Economic Report,
a Fund Dashboard Monthly Summary, and a Fund Performance Report.
Prior to their meeting, the trustees were provided with a memo and materials that summarized the
information they received over the course of the year. They also considered the factors discussed
below, among others. However, no single factor determined whether the board approved the
arrangement. Rather, it was the totality of the circumstances that drove the board’s decision.
Nature, extent, and quality of services
The board reviewed the quality of the investment management services provided to the fund since
its inception in 2013, and took into account the organizational depth and stability of the advisor. The
board considered that Vanguard has been managing investments for more than three decades. The
Fixed Income Group adheres to a sound, disciplined investment management process; the team
has considerable experience, stability, and depth.
The board concluded that Vanguard’s experience, stability, depth, and performance, among other
factors, warranted continuation of the advisory arrangement.
Investment performance
The board considered the performance of the fund since its inception, including any periods
of outperformance or underperformance compared with its target index and peer group. The
board concluded that the performance was such that the advisory arrangement should continue.
Information about the fund’s performance can be found in the Performance Summary section
of this report.
Trustees Approve Advisory Arrangement
51
Cost
The board concluded that the fund’s expense ratio was well below the average expense ratio
charged by funds in its peer group and that the fund’s advisory expenses were also below the
peer-group average. Information about the fund’s expenses appears in the About Your Fund’s
Expenses section of this report as well as in the Financial Statements section.
The board does not conduct a profitability analysis of Vanguard because of Vanguard’s unique
“at-cost” structure. Unlike most other mutual fund management companies, Vanguard is owned
by the funds it oversees and produces “profits” only in the form of reduced expenses for fund
shareholders.
The benefit of economies of scale
The board concluded that the fund’s at-cost arrangement with Vanguard ensures that the
fund will realize economies of scale as it grows, with the cost to shareholders declining as
fund assets increase.
The board will consider whether to renew the advisory arrangement again after a one-year period.
52
Glossary
53
30-Day SEC Yield. A fund’s 30-day SEC yield is derived using a formula specified by the U.S.
Securities and Exchange Commission. Under the formula, data related to the fund’s security
holdings in the previous 30 days are used to calculate the fund’s hypothetical net income for that
period, which is then annualized and divided by the fund’s estimated average net assets over the
calculation period. For the purposes of this calculation, a security’s income is based on its current
market yield to maturity (for bonds), its actual income (for asset-backed securities), or its
projected dividend yield (for stocks). Because the SEC yield represents hypothetical annualized
income, it will differ—at times significantly—from the fund’s actual experience. As a result, the
fund’s income distributions may be higher or lower than implied by the SEC yield.
Average Coupon. The average interest rate paid on the fixed income securities held by a fund. It
is expressed as a percentage of face value.
Average Duration. An estimate of how much the value of the bonds held by a fund will fluctuate
in response to a change in interest rates. To see how the value could change, multiply the
average duration by the change in rates. If interest rates rise by 1 percentage point, the value of
the bonds in a fund with an average duration of five years would decline by about 5%. If rates
decrease by a percentage point, the value would rise by 5%.
Average Effective Maturity. The average length of time until fixed income securities held by a
fund reach maturity and are repaid, taking into consideration the possibility that the issuer may call
the bond before its maturity date. The figure reflects the proportion of fund assets represented by
each security; it also reflects any futures contracts held. In general, the longer the average
effective maturity, the more a fund’s share price will fluctuate in response to changes in market
interest rates.
Beta. A measure of the magnitude of a fund’s past share-price fluctuations in relation to the ups
and downs of a given market index. The index is assigned a beta of 1.00. Compared with a given
index, a fund with a beta of 1.20 typically would have seen its share price rise or fall by 12%
when the index rose or fell by 10%. For this report, beta is based on returns over the past 36
months for both the fund and the index. Note that a fund’s beta should be reviewed in conjunction
with its R-squared (see definition). The lower the R-squared, the less correlation there is between
the fund and the index, and the less reliable beta is as an indicator of volatility.
Credit Quality. Credit-quality ratings are measured on a scale that generally ranges from AAA
(highest) to D (lowest). U.S. Treasury, U.S. Agency, and U.S. Agency mortgage-backed securities
appear under “U.S. Government.” Credit-quality ratings are obtained from Barclays and are from
Moody’s, Fitch, and S&P. When ratings from all three agencies are used, the median rating is
shown. When ratings from two of the agencies are used, the lower rating for each issue is
shown. “Not Rated” is used to classify securities for which a rating is not available.
Expense Ratio. A fund’s total annual operating expenses expressed as a percentage of the fund’s
average net assets. The expense ratio includes management and administrative expenses, but
does not include the transaction costs of buying and selling portfolio securities.
Inception Date. The date on which the assets of a fund (or one of its share classes) are first
invested in accordance with the fund’s investment objective. For funds with a subscription period,
the inception date is the day after that period ends. Investment performance is measured from
the inception date.
54
R-Squared. A measure of how much of a fund’s past returns can be explained by the returns
from the market in general, as measured by a given index. If a fund’s total returns were precisely
synchronized with an index’s returns, its R-squared would be 1.00. If the fund’s returns bore no
relationship to the index’s returns, its R-squared would be 0. For this report, R-squared is based
on returns over the past 36 months for both the fund and the index.
Short-Term Reserves. The percentage of a fund invested in highly liquid, short-term securities
that can be readily converted to cash.
Yield to Maturity. The rate of return an investor would receive if the fixed income securities held
by a fund were held to their maturity dates.
BLOOMBERG is a trademark and service mark of Bloomberg Finance L.P. BARCLAYS is a trademark and service mark
of Barclays Bank Plc, used under license. Bloomberg Finance L.P. and its affiliates, including Bloomberg Index Services
Limited (BISL) (collectively, Bloomberg), or Bloomberg’s licensors, own all proprietary rights in the Bloomberg Barclays
USD Emerging Markets Government RIC Capped Index (Index or Bloomberg Barclays Index).
Neither Barclays Bank Plc, Barclays Capital Inc., or any affiliate (collectively Barclays) or Bloomberg is the issuer or
producer of the Emerging Markets Government Bond Index Fund and neither Bloomberg nor Barclays has any
responsibilities, obligations or duties to investors in the Emerging Markets Government Bond Index Fund. The Index is
licensed for use by The Vanguard Group, Inc. (Vanguard) as the sponsor of the Emerging Markets Government Bond Index
Fund. Bloomberg and Barclays’ only relationship with Vanguard in respect of the Index is the licensing of the Index, which
is determined, composed and calculated by BISL, or any successor thereto, without regard to the Issuer or the Emerging
Markets Government Bond Index Fund or the owners of the Emerging Markets Government Bond Index Fund.
Additionally, Vanguard may for itself execute transaction(s) with Barclays in or relating to the Index in connection with
the Emerging Markets Government Bond Index Fund. Investors acquire the Emerging Markets Government Bond Index
Fund from Vanguard and investors neither acquire any interest in the Index nor enter into any relationship of any kind
whatsoever with Bloomberg or Barclays upon making an investment in the Emerging Markets Government Bond Index
Fund. The Emerging Markets Government Bond Index Fund is not sponsored, endorsed, sold or promoted by Bloomberg
or Barclays. Neither Bloomberg nor Barclays makes any representation or warranty, express or implied regarding the
advisability of investing in the Emerging Markets Government Bond Index Fund or the advisability of investing in securities
generally or the ability of the Index to track corresponding or relative market performance. Neither Bloomberg nor Barclays
has passed on the legality or suitability of the Emerging Markets Government Bond Index Fund with respect to any person
or entity. Neither Bloomberg nor Barclays is responsible for and has not participated in the determination of the timing
of, prices at, or quantities of the Emerging Markets Government Bond Index Fund to be issued. Neither Bloomberg nor
Barclays has any obligation to take the needs of the Issuer or the owners of the Emerging Markets Government Bond Index
Fund or any other third party into consideration in determining, composing or calculating the Index. Neither Bloomberg nor
Barclays has any obligation or liability in connection with administration, marketing or trading of the Emerging Markets
Government Bond Index Fund.
55
The licensing agreement between Bloomberg and Barclays is solely for the benefit of Bloomberg and Barclays and not
for the benefit of the owners of the Emerging Markets Government Bond Index Fund, investors or other third parties.
In addition, the licensing agreement between Vanguard and Bloomberg is solely for the benefit of Vanguard and
Bloomberg and not for the benefit of the owners of the Emerging Markets Government Bond Index Fund, investors
or other third parties.
NEITHER BLOOMBERG NOR BARCLAYS SHALL HAVE ANY LIABILITY TO THE ISSUER, INVESTORS OR TO OTHER THIRD
PARTIES FOR THE QUALITY, ACCURACY AND/OR COMPLETENESS OF THE BLOOMBERG BARCLAYS INDEX OR ANY
DATA INCLUDED THEREIN OR FOR INTERRUPTIONS IN THE DELIVERY OF THE BLOOMBERG BARCLAYS INDEX. NEITHER
BLOOMBERG NOR BARCLAYS MAKES ANY WARRANTY, EXPRESS OR IMPLIED, AS TO RESULTS TO BE OBTAINED BY
THE ISSUER, THE INVESTORS OR ANY OTHER PERSON OR ENTITY FROM THE USE OF THE BLOOMBERG BARCLAYS
INDEX OR ANY DATA INCLUDED THEREIN. NEITHER BLOOMBERG NOR BARCLAYS MAKES ANY EXPRESS OR IMPLIED
WARRANTIES, AND EACH HEREBY EXPRESSLY DISCLAIMS ALL WARRANTIES OF MERCHANTABILITY OR FITNESS FOR
A PARTICULAR PURPOSE OR USE WITH RESPECT TO THE BLOOMBERG BARCLAYS INDEX OR ANY DATA INCLUDED
THEREIN. BLOOMBERG RESERVES THE RIGHT TO CHANGE THE METHODS OF CALCULATION OR PUBLICATION, OR
TO CEASE THE CALCULATION OR PUBLICATION OF THE BLOOMBERG BARCLAYS INDEX, AND NEITHER BLOOMBERG
NOR BARCLAYS SHALL BE LIABLE FOR ANY MISCALCULATION OF OR ANY INCORRECT, DELAYED OR INTERRUPTED
PUBLICATION WITH RESPECT TO THE BLOOMBERG BARCLAYS INDEX. NEITHER BLOOMBERG NOR BARCLAYS SHALL
BE LIABLE FOR ANY DAMAGES, INCLUDING, WITHOUT LIMITATION, ANY SPECIAL, INDIRECT OR CONSEQUENTIAL
DAMAGES, OR ANY LOST PROFITS AND EVEN IF ADVISED OF THE POSSIBILITY OF SUCH, RESULTING FROM THE USE
OF THE BLOOMBERG BARCLAYS INDEX OR ANY DATA INCLUDED THEREIN OR WITH RESPECT TO THE EMERGING
MARKETS GOVERNMENT BOND INDEX FUND.
None of the information supplied by Bloomberg or Barclays and used in this publication may be reproduced in any manner
without the prior written permission of both Bloomberg and Barclays Capital, the investment banking division of Barclays
Bank Plc. Barclays Bank Plc is registered in England No. 1026167. Registered office 1 Churchill Place London E14 5HP.
© 2018 Bloomberg. Used with Permission.
Source: Bloomberg Index Services Limited. Copyright 2018, Bloomberg. All rights reserved.
56
The People Who Govern Your Fund
The trustees of your mutual fund are there to see that the fund is operated and managed in your
best interests since, as a shareholder, you are a part owner of the fund. Your fund’s trustees also
serve on the board of directors of The Vanguard Group, Inc., which is owned by the Vanguard
funds and provides services to them on an at-cost basis.
A majority of Vanguard’s board members are independent, meaning that they have no affiliation
with Vanguard or the funds they oversee, apart from the sizable personal investments they have
made as private individuals. The independent board members have distinguished backgrounds
in business, academia, and public service. Each of the trustees and executive officers oversees
208 Vanguard funds.
Information for each trustee and executive officer of the fund appears below. The mailing address
of the trustees and officers is P.O. Box 876, Valley Forge, PA 19482. More information about the
trustees is in the Statement of Additional Information, which can be obtained, without charge,
by contacting Vanguard at 800-662-7447, or online at vanguard.com.
Interested Trustees1
F. William McNabb III
Born in 1957. Trustee since July 2009. Principal
occupation(s) during the past five years and
other experience: chairman of the board
(January 2010–present) of Vanguard and of each
of the investment companies served by Vanguard,
trustee (2009–present) of each of the investment
companies served by Vanguard, and director
(2008–present) of Vanguard. Chief executive officer
and president (2008–2017) of Vanguard and each
of the investment companies served by Vanguard,
managing director (1995–2008) of Vanguard,
and director (1997–2018) of Vanguard Marketing
Corporation. Director (2018–present) of
UnitedHealth Group.
Mortimer J. Buckley
Born in 1969. Trustee since January 2018. Principal
occupation(s) during the past five years and
other experience: chief executive officer
(January 2018–present) of Vanguard; chief executive
officer, president, and trustee (January 2018–present)
of each of the investment companies served by
Vanguard; president and director (2017–present) of
Vanguard; and president (February 2018–present) of
Vanguard Marketing Corporation. Chief investment
officer (2013–2017), managing director (2002–2017),
head of the Retail Investor Group (2006–2012), and
chief information officer (2001–2006) of Vanguard.
Chairman of the board (2011–2017) of the Children’s
Hospital of Philadelphia.
Independent Trustees
Emerson U. Fullwood
Born in 1948. Trustee since January 2008. Principal
occupation(s) during the past five years and other
experience: executive chief staff and marketing officer
for North America and corporate vice president (retired
2008) of Xerox Corporation (document management
products and services). Former president of the
Worldwide Channels Group, Latin America, and
Worldwide Customer Service and executive chief
staff officer of Developing Markets of Xerox. Executive
in residence and 2009–2010 Distinguished Minett
Professor at the Rochester Institute of Technology.
Lead director of SPX FLOW, Inc. (multi-industry
manufacturing). Director of the University of Rochester
Medical Center, the Monroe Community College
Foundation, the United Way of Rochester, North
Carolina A&T University, and Roberts Wesleyan
College. Trustee of the University of Rochester.
Amy Gutmann
Born in 1949. Trustee since June 2006. Principal
occupation(s) during the past five years and other
experience: president (2004–present) of the University
of Pennsylvania. Christopher H. Browne Distinguished
Professor of Political Science, School of Arts and
Sciences, and professor of communication, Annenberg
School for Communication, with secondary faculty
appointments in the Department of Philosophy, School
of Arts and Sciences, and at the Graduate School of
Education, University of Pennsylvania. Trustee of the
National Constitution Center.
1 Mr. McNabb and Mr. Buckley are considered “interested persons,” as defined in the Investment Company Act of 1940, because they are officers of the Vanguard funds.
JoAnn Heffernan Heisen
Born in 1950. Trustee since July 1998. Principal
occupation(s) during the past five years and other
experience: corporate vice president of Johnson &
Johnson (pharmaceuticals/medical devices/consumer
products) and member of its executive committee
(1997–2008). Chief global diversity officer (retired
2008), vice president and chief information officer
(1997–2006), controller (1995–1997), treasurer
(1991–1995), and assistant treasurer (1989–1991)
of Johnson & Johnson. Director of Skytop Lodge
Corporation (hotels) and the Robert Wood Johnson
Foundation. Member of the advisory board of the
Institute for Women’s Leadership at Rutgers University.
F. Joseph Loughrey
Born in 1949. Trustee since October 2009. Principal
occupation(s) during the past five years and other
experience: president and chief operating officer
(retired 2009) and vice chairman of the board
(2008–2009) of Cummins Inc. (industrial machinery).
Chairman of the board of Hillenbrand, Inc. (specialized
consumer services), Oxfam America, and the Lumina
Foundation for Education. Director of the V Foundation
for Cancer Research. Member of the advisory council
for the College of Arts and Letters and chair of the
advisory board to the Kellogg Institute for International
Studies, both at the University of Notre Dame.
Mark Loughridge
Born in 1953. Trustee since March 2012. Principal
occupation(s) during the past five years and other
experience: senior vice president and chief financial
officer (retired 2013) of IBM (information technology
services). Fiduciary member of IBM’s Retirement
Plan Committee (2004–2013), senior vice president
and general manager (2002–2004) of IBM Global
Financing, vice president and controller (1998–2002)
of IBM, and a variety of other prior management roles
at IBM. Member of the Council on Chicago Booth.
Scott C. Malpass
Born in 1962. Trustee since March 2012. Principal
occupation(s) during the past five years and other
experience: chief investment officer (1989–present)
and vice president (1996–present) of the University
of Notre Dame. Assistant professor of finance at the
Mendoza College of Business, University of Notre
Dame, and member of the Notre Dame 403(b)
Investment Committee. Chairman of the board of
TIFF Advisory Services, Inc. Member of the board
of Catholic Investment Services, Inc. (investment
advisors), the board of advisors for Spruceview
Capital Partners, and the board of superintendence
of the Institute for the Works of Religion.
Deanna Mulligan
Born in 1963. Trustee since January 2018. Principal
occupation(s) during the past five years and other
experience: president (2010–present) and chief
executive officer (2011–present) of The Guardian
Life Insurance Company of America. Chief operating
officer (2010–2011) and executive vice president
(2008–2010) of Individual Life and Disability of
The Guardian Life Insurance Company of America.
Member of the board of The Guardian Life Insurance
Company of America, the American Council of Life
Insurers, the Partnership for New York City (business
leadership), and the Committee Encouraging Corporate
Philanthropy. Trustee of the Economic Club of New
York and the Bruce Museum (arts and science).
Member of the Advisory Council for the Stanford
Graduate School of Business.
André F. Perold
Born in 1952. Trustee since December 2004. Principal
occupation(s) during the past five years and other
experience: George Gund Professor of Finance and
Banking, Emeritus at the Harvard Business School
(retired 2011). Chief investment officer and co-
managing partner of HighVista Strategies LLC
(private investment firm). Overseer of the Museum
of Fine Arts Boston.
Sarah Bloom Raskin
Born in 1961. Trustee since January 2018. Principal
occupation(s) during the past five years and other
experience: deputy secretary (2014–2017) of
the United States Department of the Treasury.
Governor (2010–2014) of the Federal Reserve Board.
Commissioner (2007–2010) of financial regulation
for the State of Maryland. Member of the board of
directors (2012–2014) of Neighborhood Reinvestment
Corporation. Director of i(x) Investments, LLC.
Peter F. Volanakis
Born in 1955. Trustee since July 2009. Principal
occupation(s) during the past five years and other
experience: president and chief operating officer
(retired 2010) of Corning Incorporated (communications
equipment) and director of Corning Incorporated
(2000–2010) and Dow Corning (2001–2010).
Director (2012) of SPX Corporation (multi-industry
manufacturing). Overseer of the Amos Tuck School
of Business Administration, Dartmouth College
(2001–2013). Chairman of the board of trustees of
Colby-Sawyer College. Member of the Board of
Hypertherm Inc. (industrial cutting systems, software,
and consumables).
Executive Officers
Glenn Booraem
Born in 1967. Principal occupation(s) during the past
five years and other experience: principal of Vanguard.
Investment stewardship officer (2017–present),
treasurer (2015–2017), controller (2010–2015),
and assistant controller (2001–2010) of each of
the investment companies served by Vanguard.
Christine M. Buchanan
Born in 1970. Principal occupation(s) during the past
five years and other experience: principal of Vanguard
and global head of Fund Administration at Vanguard.
Treasurer (2017–present) of each of the investment
companies served by Vanguard. Partner (2005–2017)
at KPMG LLP (audit, tax, and advisory services).
Brian Dvorak
Born in 1973. Principal occupation(s) during the past
five years and other experience: principal of Vanguard.
Chief compliance officer (2017–present) of Vanguard
and each of the investment companies served by
Vanguard. Assistant vice president (2017–present) of
Vanguard Marketing Corporation. Vice president and
director of Enterprise Risk Management (2011–2013)
at Oppenheimer Funds, Inc.
Thomas J. Higgins
Born in 1957. Principal occupation(s) during the past
five years and other experience: principal of Vanguard.
Chief financial officer (2008–present) and treasurer
(1998–2008) of each of the investment companies
served by Vanguard.
Peter Mahoney
Born in 1974. Principal occupation(s) during the past
five years and other experience: principal of Vanguard.
Controller (2015–present) of each of the investment
companies served by Vanguard. Head of International
Fund Services (2008–2014) at Vanguard.
Anne E. Robinson
Born in 1970. Principal occupation(s) during the
past five years and other experience: general
counsel (2016–present) of Vanguard. Secretary
(2016–present) of Vanguard and of each of the
investment companies served by Vanguard.
Managing director (2016–present) of Vanguard.
Director and senior vice president (2016–2018)
of Vanguard Marketing Corporation. Managing
director and general counsel of Global Cards and
Consumer Services (2014–2016) at Citigroup.
Counsel (2003–2014) at American Express.
Michael Rollings
Born in 1963. Principal occupation(s) during the
past five years and other experience: finance
director (2017–present) and treasurer (2017) of each
of the investment companies served by Vanguard.
Managing director (2016–present) of Vanguard. Chief
financial officer (2016–present) of Vanguard. Director
(2016–present) of Vanguard Marketing Corporation.
Executive vice president and chief financial officer
(2006–2016) of MassMutual Financial Group.
Vanguard Senior Management Team
Mortimer J. Buckley James M. Norris
Gregory Davis Thomas M. Rampulla
John James Karin A. Risi
Martha G. King Anne E. Robinson
John T. Marcante Michael Rollings
Chris D. McIsaac
Chairman Emeritus and Senior Advisor
John J. Brennan
Chairman, 1996–2009
Chief Executive Officer and President, 1996–2008
Founder
John C. Bogle
Chairman and Chief Executive Officer, 1974–1996
P.O. Box 2600
Valley Forge, PA 19482-2600
Connect with Vanguard® > vanguard.com
Fund Information > 800-662-7447
Direct Investor Account Services > 800-662-2739
Institutional Investor Services > 800-523-1036
Text Telephone for PeopleWho Are Deaf or Hard of Hearing > 800-749-7273
This material may be used in conjunctionwith the offering of shares of any Vanguardfund only if preceded or accompanied bythe fund’s current prospectus.
All comparative mutual fund data are from Lipper, aThomson Reuters Company, or Morningstar, Inc., unlessotherwise noted.
You can obtain a free copy of Vanguard’s proxy votingguidelines by visiting vanguard.com/proxyreporting or bycalling Vanguard at 800-662-2739. The guidelines arealso available from the SEC’s website, sec.gov. Inaddition, you may obtain a free report on how your fundvoted the proxies for securities it owned during the 12months ended June 30. To get the report, visit eithervanguard.com/proxyreporting or sec.gov.
You can review and copy information about your fund atthe SEC’s Public Reference Room in Washington, D.C. Tofind out more about this public service, call the SEC at202-551-8090. Information about your fund is alsoavailable on the SEC’s website, and you can receivecopies of this information, for a fee, by sending arequest in either of two ways: via email addressed [email protected] or via regular mail addressed to thePublic Reference Section, Securities and ExchangeCommission, Washington, DC 20549-1520.
© 2018 The Vanguard Group, Inc.All rights reserved.Vanguard Marketing Corporation, Distributor.
Q11202 062018