Embed Size (px)
Citation preview

www.mercercapital.com
VALUE FOCUS
FinTech Industry
Second Quarter 2018
Broader markets in second quarter 2018 were up slightly
despite the uptick in volatility related to trade war concerns.
Broadly speaking, earnings came in relatively strong with
the inclusion of a full quarter of the lower tax rates for 1Q18.
Related to FinTech specifically, all three FinTech niches that
we track outperformed the S&P 500 by a relatively wide
margin in the last twelve months. The Payments, Solutions,
and Technology niches were up 43%, 25%, and 30%, respec-
tively, compared to 14% for the S&P 500. A significant por-
tion of this outperformance occurred in the second quarter
of 2018 with the niches up 14-22% compared to a 3% return
for the S&P 500. Additionally, the FinTech IPO drought that
started in 2016 finally ended with three new IPOs (EVO Pay-
ments, GreenSky, and i3 Verticals) in the second quarter of
2018. Merger and acquisition activity declined in the first
half of 2018, but there was a notable increase in larger deals
with 7 transactions having deal values greater than $1 billion
(compared to only one in the first half of 2017).
While interest in the FinTech sector remains high, the outlook
remains uncertain as competitive pressures, continuing tech-
nological change, and regulatory/policy uncertainty remain.
The strong 2017 and first half of 2018 in the publicly traded
FinTechs are driving a pick-up in larger exit/IPO FinTech
activity. This outperformance of the publicly traded FinTechs
combined with a notable increase in larger exit activity (both
IPOs and deals) should bode well for venture and growth
funding trends for the remainder of 2018 and 2019 as gains
harvested by investors can be redeployed in more early stage
and high growth private FinTech companies.
Contact Us
BUSINESS VALUATION & FINANCIAL ADVISORY SERVICESFinTech Industry Services
Mercer Capital provides financial technology companies with valuation, financial
advisory, and consulting services.
Services Provided
• Valuation of financial technology companies
• Financial advisory/valuations for acquisitions and divestitures
• Valuations for purchase accounting and impairment testing
• Fairness and solvency opinions
• Litigation support for economic damages and valuation and shareholder disputes
• Consulting and board presentations for corporate and strategic planning
Jay D. Wilson, CFA, ASA, CBA
901.322.9725
Jeff K. Davis, CFA
615.345.0350
Rohan Bose
214.206.3796
Daniel P. McLeod
901.322.9716
Learn More about Mercer Capital &
our FinTech Services at
http://mer.cr/FinTech
Copyright © 2018 Mercer Capital Management, Inc. All rights reserved. It is illegal under Federal law to reproduce this publication or any portion of its contents without the
publisher’s permission. Media quotations with source attribution are encouraged. Reporters requesting additional information or editorial comment should contact Barbara
Walters Price at 901.685.2120. Mercer Capital’s Industry Focus is published quarterly and does not constitute legal or financial consulting advice. It is offered as an informa-
tion service to our clients and friends. Those interested in specific guidance for legal or accounting matters should seek competent professional advice. Inquiries to discuss
specific valuation matters are welcomed. To add your name to our mailing list to receive this complimentary publication, visit our web site at www.mercercapital.com.
In This Issue
Follow Mercer Capital@MercerFinTech @MercerCapital Mercer Capital
FinTech Industry Overview
Public Market Indicators 1
Valuation Multiples 2
FinTech M&A 3
FinTech IPOs 4
FinTech
Case Study: WePay 5
Publicly Traded FinTech Companies
Payments 8
Solutions 10
Technology 12
© 2018 Mercer Capital // www.mercercapital.com 1
Mercer Capital’s Value Focus: FinTech IndustrySecond Quarter 2018
@MercerFinTech
80
90
100
110
120
130
140
150
160
June
30,
201
7 =
100
S&P 500 FinTech - SolutionsFinTech - Payments FinTech - Technology
Source: S&P Global Market Intelligence
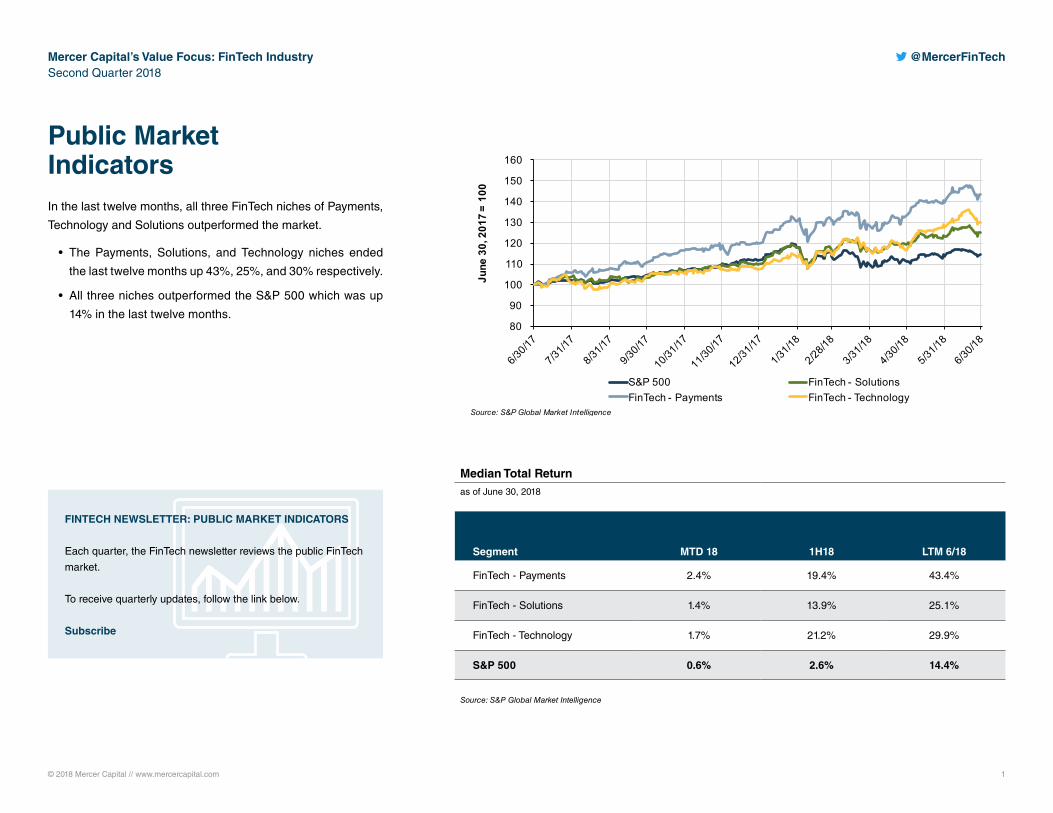
Public Market IndicatorsIn the last twelve months, all three FinTech niches of Payments,
Technology and Solutions outperformed the market.
• The Payments, Solutions, and Technology niches ended
the last twelve months up 43%, 25%, and 30% respectively.
• All three niches outperformed the S&P 500 which was up
14% in the last twelve months.
FINTECH NEWSLETTER: PUBLIC MARKET INDICATORS
Each quarter, the FinTech newsletter reviews the public FinTech
market.
To receive quarterly updates, follow the link below.
Subscribe
Median Total Returnas of June 30, 2018
Segment MTD 18 1H18 LTM 6/18
FinTech - Payments 2.4% 19.4% 43.4%
FinTech - Solutions 1.4% 13.9% 25.1%
FinTech - Technology 1.7% 21.2% 29.9%
S&P 500 0.6% 2.6% 14.4%
Source: S&P Global Market Intelligence
© 2018 Mercer Capital // www.mercercapital.com 2
Mercer Capital’s Value Focus: FinTech IndustrySecond Quarter 2018
@MercerFinTech
Valuation Multiples
as of June 30, 2018
Segment
Price /
LTM EPS
Price /
2018 (E) EPS
Price /
2019 (E) EPS
Ent'p Value /
LTM EBITDA
Ent'p Value /
FY18 (E) EBITDA
Ent'p Value /
FY19 (E) EBITDA
Ent’p Value /
LTM Revenue
FinTech - Payments 29.2 21.8 19.0 16.9 14.2 11.5 4.1
FinTech - Solutions 31.3 23.7 21.1 19.0 13.8 12.3 4.5
FinTech - Technology 42.8 30.3 27.0 21.5 18.7 15.7 4.0
Source: S&P Global Market Intelligence
Consistent with recent historical growth patterns and near-term outlook, FinTech companies remain priced at a premium to the broader markets with the S&P 500 priced at
~16x estimated forward earnings at end of 2Q18 (per FactSet).
Despite the heightened returns during the last year, the Payments niche reported lower valuation multiples than the Solutions and Technology niches.
Investors continue to weigh market potential and growth for the sector against recent FinTech performance and profitability while traditional financial incumbents are weighing
whether to develop FinTech partnerships, develop their own in-house solutions or acquire FinTech companies.
The Technology niche reported the highest P/E and EV/EBITDA multiples compared to the other two niches, primary reflecting their lower margins as price-to-revenue multiples
were lower than other niches.
FinTech MarginsEBITDA Margin (LTM)
FinTech Revenue MultiplesEV / Revenue (LTM)
FinTech EBITDA MultiplesEV / EBITDA (LTM)
0.00 6.00
12.00 18.00 24.00 30.00 36.00
0.00 2.00 4.00 6.00 8.00
10.00
0.0% 10.0% 20.0% 30.0% 40.0%
Source: S&P Global Market Intelligence Source: S&P Global Market Intelligence Source: S&P Global Market Intelligence
Payments Technology Solutions Payments Technology Solutions Payments Technology Solutions
© 2018 Mercer Capital // www.mercercapital.com // Source: S&P Global Market Intelligence 3
Mercer Capital’s Value Focus: FinTech IndustrySecond Quarter 2018
@MercerFinTech
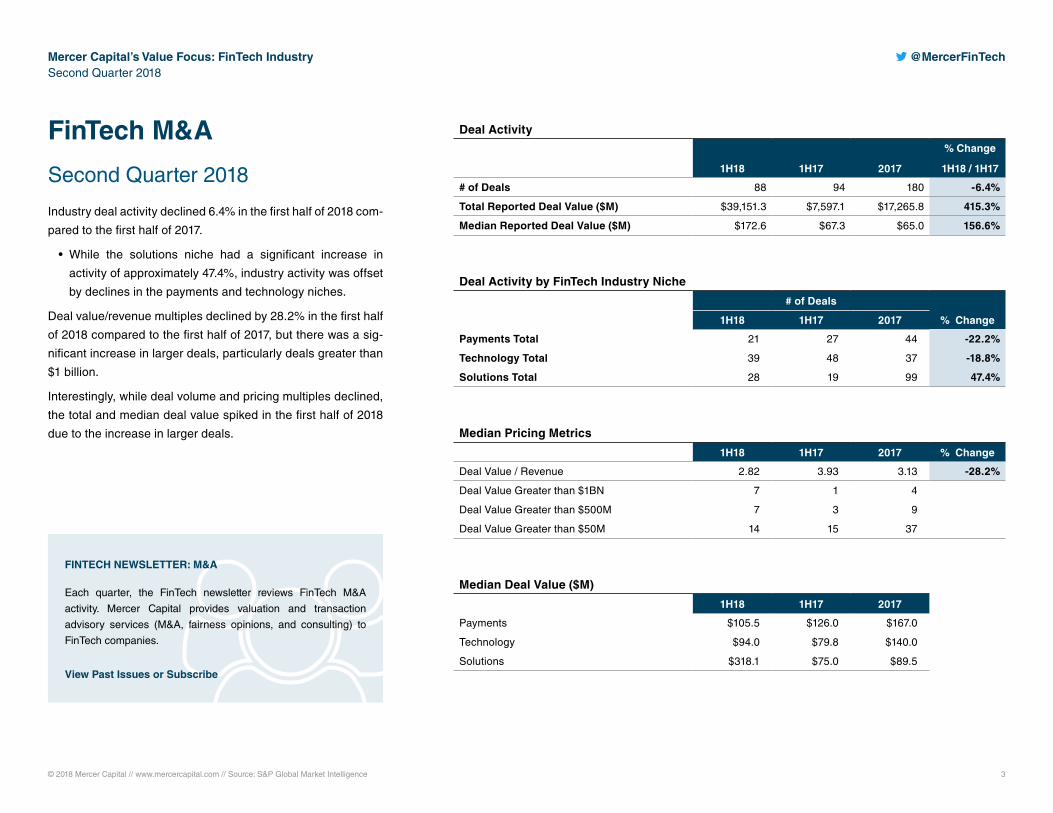
FinTech M&A
Second Quarter 2018
Industry deal activity declined 6.4% in the first half of 2018 com-
pared to the first half of 2017.
• While the solutions niche had a significant increase in
activity of approximately 47.4%, industry activity was offset
by declines in the payments and technology niches.
Deal value/revenue multiples declined by 28.2% in the first half
of 2018 compared to the first half of 2017, but there was a sig-
nificant increase in larger deals, particularly deals greater than
$1 billion.
Interestingly, while deal volume and pricing multiples declined,
the total and median deal value spiked in the first half of 2018
due to the increase in larger deals.
Deal Activity
1H18 1H17 2017
% Change
1H18 / 1H17
# of Deals 88 94 180 -6.4%
Total Reported Deal Value ($M) $39,151.3 $7,597.1 $17,265.8 415.3%
Median Reported Deal Value ($M) $172.6 $67.3 $65.0 156.6%
Deal Activity by FinTech Industry Niche
# of Deals
% Change1H18 1H17 2017
Payments Total 21 27 44 -22.2%
Technology Total 39 48 37 -18.8%
Solutions Total 28 19 99 47.4%
Median Pricing Metrics
1H18 1H17 2017 % Change
Deal Value / Revenue 2.82 3.93 3.13 -28.2%
Deal Value Greater than $1BN 7 1 4
Deal Value Greater than $500M 7 3 9
Deal Value Greater than $50M 14 15 37
Median Deal Value ($M)
1H18 1H17 2017
Payments $105.5 $126.0 $167.0
Technology $94.0 $79.8 $140.0
Solutions $318.1 $75.0 $89.5
FINTECH NEWSLETTER: M&A
Each quarter, the FinTech newsletter reviews FinTech M&A
activity. Mercer Capital provides valuation and transaction
advisory services (M&A, fairness opinions, and consulting) to
FinTech companies.
View Past Issues or Subscribe
© 2018 Mercer Capital // www.mercercapital.com // Source: S&P Global Market Intelligence 4
Mercer Capital’s Value Focus: FinTech IndustrySecond Quarter 2018
@MercerFinTech
FinTech IPOs
Second Quarter 2018
The FinTech IPO drought that started in 2016 finally ended with three new IPOs in the second quarter of
2018. Despite the IPOs in 2Q18, strategic mergers and acquisitions continue to dominate exit activity in
the FinTech industry as companies look beyond IPO plans.
EVO Payments IPO
EVO Payments International operates as a payments services provider for in-person and ecommerce
transactions. IPO price of $16, priced at the upper-end of its projected range and will issue 14 million
shares of common stock.
GreenSky IPO
The company provides loan technology to banks and merchants in order to enhance the overall digital
lending process. It also IPO’d on the high end of the expected price valuation at $23 per share.
i3 Verticals IPO
i3 is a small cap payment processing and software company that provides solutions to small and medium
sized companies. The Nashville-based company priced initially at $13 per share and completed an
$80 million IPO in June 2018.
© 2018 Mercer Capital // www.mercercapital.com 5
Mercer Capital’s Value Focus: FinTech IndustrySecond Quarter 2018
@MercerFinTech
FinTechCase Study
“We see exponential growth ahead of us as we combine
our FinTech products and culture with the global brand,
scale, proficiencies, and distribution of Chase.”
– Bill Clerico
CEO of WePay
“With WePay, Chase is taking the work out of payments
for both our business clients and the software providers
who serve them.”
– Matt Kane
CEO Chase Merchant Services
© 2018 Mercer Capital // www.mercercapital.com 6
Mercer Capital’s Value Focus: FinTech IndustrySecond Quarter 2018
@MercerFinTech
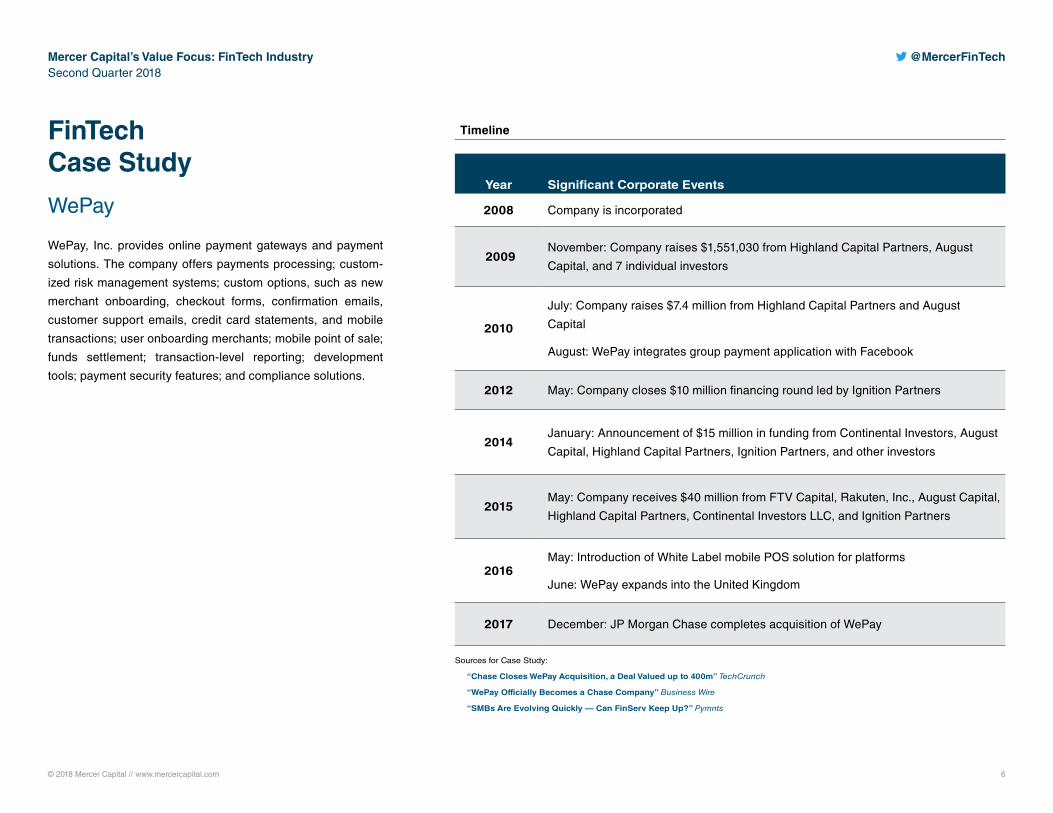
FinTech Case Study
WePay
WePay, Inc. provides online payment gateways and payment
solutions. The company offers payments processing; custom-
ized risk management systems; custom options, such as new
merchant onboarding, checkout forms, confirmation emails,
customer support emails, credit card statements, and mobile
transactions; user onboarding merchants; mobile point of sale;
funds settlement; transaction-level reporting; development
tools; payment security features; and compliance solutions.
Year Significant Corporate Events
2008 Company is incorporated
2009November: Company raises $1,551,030 from Highland Capital Partners, August
Capital, and 7 individual investors
2010
July: Company raises $7.4 million from Highland Capital Partners and August
Capital
August: WePay integrates group payment application with Facebook
2012 May: Company closes $10 million financing round led by Ignition Partners
2014January: Announcement of $15 million in funding from Continental Investors, August
Capital, Highland Capital Partners, Ignition Partners, and other investors
2015May: Company receives $40 million from FTV Capital, Rakuten, Inc., August Capital,
Highland Capital Partners, Continental Investors LLC, and Ignition Partners
2016May: Introduction of White Label mobile POS solution for platforms
June: WePay expands into the United Kingdom
2017 December: JP Morgan Chase completes acquisition of WePay
Timeline
Sources for Case Study:
“Chase Closes WePay Acquisition, a Deal Valued up to 400m” TechCrunch
“WePay Officially Becomes a Chase Company” Business Wire
“SMBs Are Evolving Quickly — Can FinServ Keep Up?” Pymnts
© 2018 Mercer Capital // www.mercercapital.com 7
Mercer Capital’s Value Focus: FinTech IndustrySecond Quarter 2018
@MercerFinTech
FinTech Case Study
WePay
Key Takeaways
1. Financial institutions are expressing a growing interest in FinTech acquisitions.
Big banks are looking to become nimbler and offer greater convenience to their customers. In
addition, banks are looking to harvest more tech talent located in Silicon Valley and similar areas.
2. Payment services companies are looking to serve their customers better.
The transaction allows WePay to leverage Chase’s existing customer base of 4 million small and medium
businesses. The Company is looking to not only provide payments services for the businesses where
needed but also offer a wider suite of business services that already integrate with WePay. The com-
panies are looking to reduce payment settlement times for small businesses. More than 1,000 software
companies have adopted payments as a service from WePay and expanding that business will be a
priority for both Chase and WePay.
3. Small businesses are frustrated by big banks.
A survey in July 2017 conducted by FIS (Performance Against Customer Expectations (PACE)
Report), interviewed nearly 500 small and medium businesses in the U.S. 14% of small firms that use
a large global bank switched banks in the last year and more were considering switching this year.
Nearly half said they might switch banks because their current provider doesn’t have the products and
services they need.
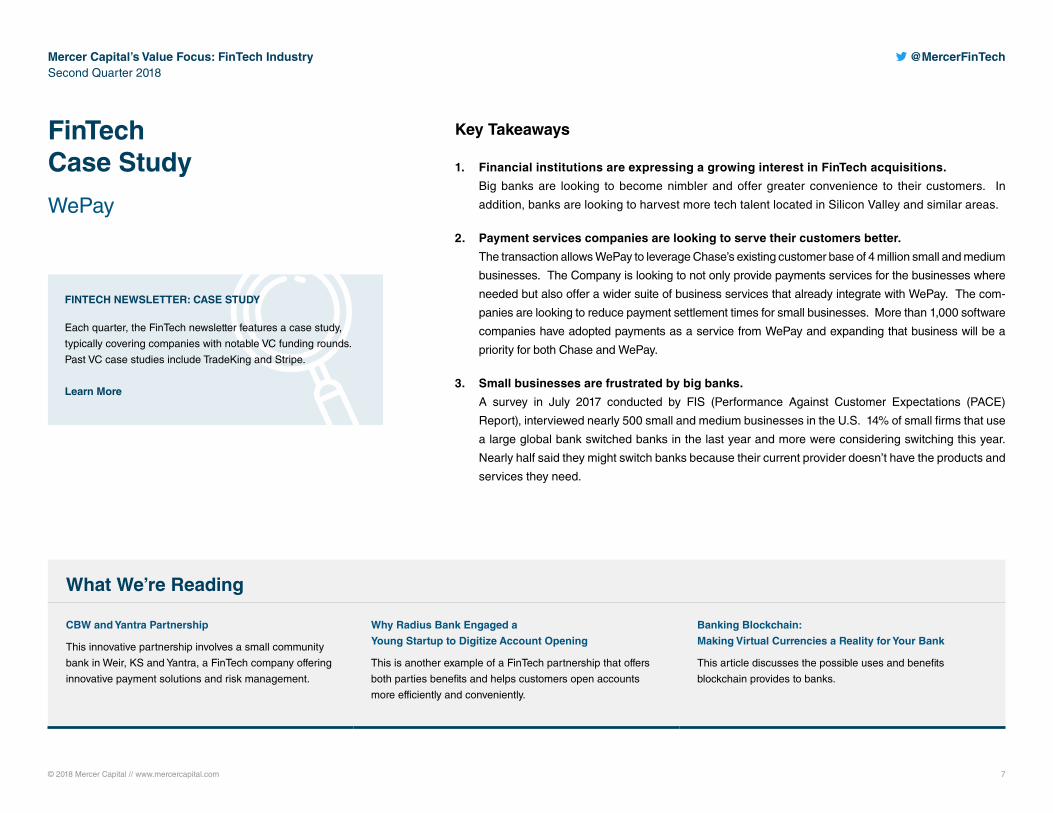
FINTECH NEWSLETTER: CASE STUDY
Each quarter, the FinTech newsletter features a case study,
typically covering companies with notable VC funding rounds.
Past VC case studies include TradeKing and Stripe.
Learn More
What We’re Reading
CBW and Yantra Partnership
This innovative partnership involves a small community
bank in Weir, KS and Yantra, a FinTech company offering
innovative payment solutions and risk management.
Why Radius Bank Engaged a
Young Startup to Digitize Account Opening
This is another example of a FinTech partnership that offers
both parties benefits and helps customers open accounts
more efficiently and conveniently.
Banking Blockchain:
Making Virtual Currencies a Reality for Your Bank
This article discusses the possible uses and benefits
blockchain provides to banks.

© 2018 Mercer Capital // www.mercercapital.com // Source: S&P Global Market Intelligence 8
Mercer Capital’s Value Focus: FinTech IndustrySecond Quarter 2018
@MercerFinTech
Publicly Traded Payments Companies
Ticker Name6/30/18 Price
Market Cap ($M)
Ent’p Val ($M)
Price / Earnings Ent’p Value / EBITDA EV / LTM LTM Total LTM Margins
LTM FY18E FY19E LTM FY18E FY19E RevenueRevenue
($M)EBITDA
($M) EBITDA Net Inc.
Payment Processors
ADS Alliance Data Systems Corporation 233.20 12,919 34,065 16.1 10.3 9.1 19.6 15.6 14.0 4.4 7,725 1,734 22% 10%
CATM Cardtronics plc 24.18 1,110 1,976 NM 15.2 14.0 6.0 7.5 7.2 1.3 1,486 330 22% -10%
PMTS CPI Card Group Inc. 2.00 22 310 NM NM NM 17.7 14.3 10.4 1.2 258 17 7% -10%
DLX Deluxe Corporation 66.21 3,168 3,843 13.6 11.6 11.0 7.9 7.3 6.8 2.0 1,970 487 25% 12%
EEFT Euronet Worldwide, Inc. 83.77 4,296 4,047 29.6 15.8 13.8 10.0 8.5 7.3 1.7 2,330 404 17% 7%
EVRI Everi Holdings Inc. 7.20 497 1,523 NM 73.8 52.4 7.3 6.6 6.2 1.8 848 209 25% -5%
EVTC EVERTEC, Inc. 21.85 1,527 2,077 28.8 13.2 12.1 14.5 10.8 10.1 5.0 416 143 34% 13%
FDC First Data Corporation 20.93 19,444 40,795 12.9 14.4 12.8 13.0 12.2 11.5 4.9 8,331 2,929 35% 18%
FLT FleetCor Technologies, Inc. 210.65 18,882 22,392 24.8 20.2 17.6 18.8 16.4 14.5 9.7 2,315 1,192 52% 34%
GPN Global Payments Inc. 111.49 17,788 21,699 34.3 21.8 18.8 18.7 15.6 14.0 5.6 3,850 1,161 30% 13%
GDOT Green Dot Corporation 73.39 3,811 2,602 34.3 24.4 21.5 16.8 10.7 9.5 2.7 952 155 16% 12%
MA Mastercard Incorporated 196.52 205,161 203,461 48.5 31.1 26.8 26.4 23.0 20.1 15.2 13,343 7,697 58% 32%
MGI MoneyGram International, Inc. 6.69 372 1,079 NM 10.3 8.0 5.1 4.3 3.9 0.7 1,596 212 13% -2%
SQ Square, Inc. 61.64 24,699 24,123 NM 135.1 77.1 NM 94.6 53.4 10.0 2,421 (30) -1% -3%
TSS Total System Services, Inc. 84.52 15,409 19,183 25.1 19.5 17.7 18.2 14.4 13.4 4.1 4,730 1,015 21% 13%
JTPY JetPay Corporation 1.95 30 102 NM NM NM 27.7 14.2 11.1 1.3 77 4 5% -5%
PAY VeriFone Systems, Inc. 22.82 2,527 3,250 NM 14.5 12.4 14.8 10.7 - 1.8 1,819 222 12% -4%
V Visa Inc. 132.45 296,661 307,042 33.5 28.3 24.3 23.3 20.6 18.1 15.9 19,355 13,193 68% 48%
WU The Western Union Company 20.33 9,367 11,574 NM 10.9 10.5 8.8 8.2 8.0 2.1 5,611 1,314 23% -9%
WEX WEX Inc. 190.48 8,206 10,276 45.8 23.6 20.7 22.4 16.5 14.9 7.8 1,314 459 35% 14%
Median 4,296 4,047 29.2 15.8 14.0 15.8 12.2 10.4 3.2 1,970 404 23% 10%
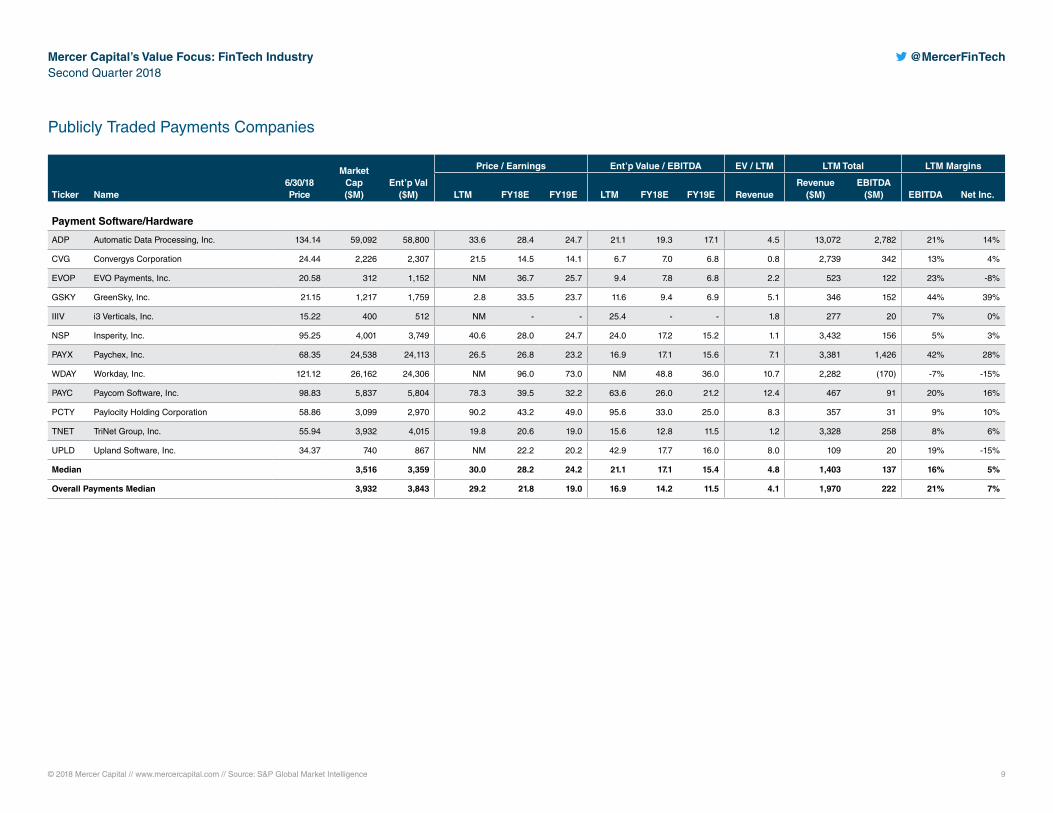
© 2018 Mercer Capital // www.mercercapital.com // Source: S&P Global Market Intelligence 9
Mercer Capital’s Value Focus: FinTech IndustrySecond Quarter 2018
@MercerFinTech
Publicly Traded Payments Companies
Ticker Name6/30/18 Price
Market Cap ($M)
Ent’p Val ($M)
Price / Earnings Ent’p Value / EBITDA EV / LTM LTM Total LTM Margins
LTM FY18E FY19E LTM FY18E FY19E RevenueRevenue
($M)EBITDA
($M) EBITDA Net Inc.
Payment Software/Hardware
ADP Automatic Data Processing, Inc. 134.14 59,092 58,800 33.6 28.4 24.7 21.1 19.3 17.1 4.5 13,072 2,782 21% 14%
CVG Convergys Corporation 24.44 2,226 2,307 21.5 14.5 14.1 6.7 7.0 6.8 0.8 2,739 342 13% 4%
EVOP EVO Payments, Inc. 20.58 312 1,152 NM 36.7 25.7 9.4 7.8 6.8 2.2 523 122 23% -8%
GSKY GreenSky, Inc. 21.15 1,217 1,759 2.8 33.5 23.7 11.6 9.4 6.9 5.1 346 152 44% 39%
IIIV i3 Verticals, Inc. 15.22 400 512 NM - - 25.4 - - 1.8 277 20 7% 0%
NSP Insperity, Inc. 95.25 4,001 3,749 40.6 28.0 24.7 24.0 17.2 15.2 1.1 3,432 156 5% 3%
PAYX Paychex, Inc. 68.35 24,538 24,113 26.5 26.8 23.2 16.9 17.1 15.6 7.1 3,381 1,426 42% 28%
WDAY Workday, Inc. 121.12 26,162 24,306 NM 96.0 73.0 NM 48.8 36.0 10.7 2,282 (170) -7% -15%
PAYC Paycom Software, Inc. 98.83 5,837 5,804 78.3 39.5 32.2 63.6 26.0 21.2 12.4 467 91 20% 16%
PCTY Paylocity Holding Corporation 58.86 3,099 2,970 90.2 43.2 49.0 95.6 33.0 25.0 8.3 357 31 9% 10%
TNET TriNet Group, Inc. 55.94 3,932 4,015 19.8 20.6 19.0 15.6 12.8 11.5 1.2 3,328 258 8% 6%
UPLD Upland Software, Inc. 34.37 740 867 NM 22.2 20.2 42.9 17.7 16.0 8.0 109 20 19% -15%
Median 3,516 3,359 30.0 28.2 24.2 21.1 17.1 15.4 4.8 1,403 137 16% 5%
Overall Payments Median 3,932 3,843 29.2 21.8 19.0 16.9 14.2 11.5 4.1 1,970 222 21% 7%
© 2018 Mercer Capital // www.mercercapital.com // Source: S&P Global Market Intelligence 10
Mercer Capital’s Value Focus: FinTech IndustrySecond Quarter 2018
@MercerFinTech
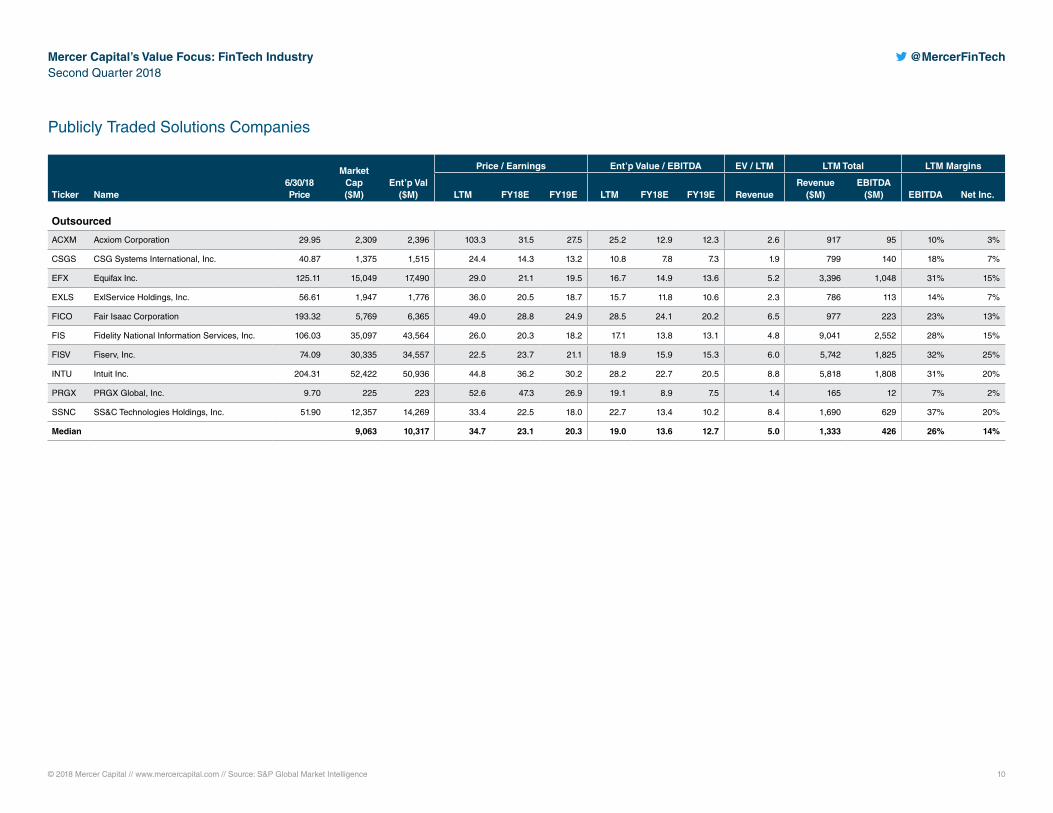
Publicly Traded Solutions Companies
Ticker Name6/30/18 Price
Market Cap ($M)
Ent’p Val ($M)
Price / Earnings Ent’p Value / EBITDA EV / LTM LTM Total LTM Margins
LTM FY18E FY19E LTM FY18E FY19E RevenueRevenue
($M)EBITDA
($M) EBITDA Net Inc.
Outsourced
ACXM Acxiom Corporation 29.95 2,309 2,396 103.3 31.5 27.5 25.2 12.9 12.3 2.6 917 95 10% 3%
CSGS CSG Systems International, Inc. 40.87 1,375 1,515 24.4 14.3 13.2 10.8 7.8 7.3 1.9 799 140 18% 7%
EFX Equifax Inc. 125.11 15,049 17,490 29.0 21.1 19.5 16.7 14.9 13.6 5.2 3,396 1,048 31% 15%
EXLS ExlService Holdings, Inc. 56.61 1,947 1,776 36.0 20.5 18.7 15.7 11.8 10.6 2.3 786 113 14% 7%
FICO Fair Isaac Corporation 193.32 5,769 6,365 49.0 28.8 24.9 28.5 24.1 20.2 6.5 977 223 23% 13%
FIS Fidelity National Information Services, Inc. 106.03 35,097 43,564 26.0 20.3 18.2 17.1 13.8 13.1 4.8 9,041 2,552 28% 15%
FISV Fiserv, Inc. 74.09 30,335 34,557 22.5 23.7 21.1 18.9 15.9 15.3 6.0 5,742 1,825 32% 25%
INTU Intuit Inc. 204.31 52,422 50,936 44.8 36.2 30.2 28.2 22.7 20.5 8.8 5,818 1,808 31% 20%
PRGX PRGX Global, Inc. 9.70 225 223 52.6 47.3 26.9 19.1 8.9 7.5 1.4 165 12 7% 2%
SSNC SS&C Technologies Holdings, Inc. 51.90 12,357 14,269 33.4 22.5 18.0 22.7 13.4 10.2 8.4 1,690 629 37% 20%
Median 9,063 10,317 34.7 23.1 20.3 19.0 13.6 12.7 5.0 1,333 426 26% 14%
© 2018 Mercer Capital // www.mercercapital.com // Source: S&P Global Market Intelligence 11
Mercer Capital’s Value Focus: FinTech IndustrySecond Quarter 2018
@MercerFinTech
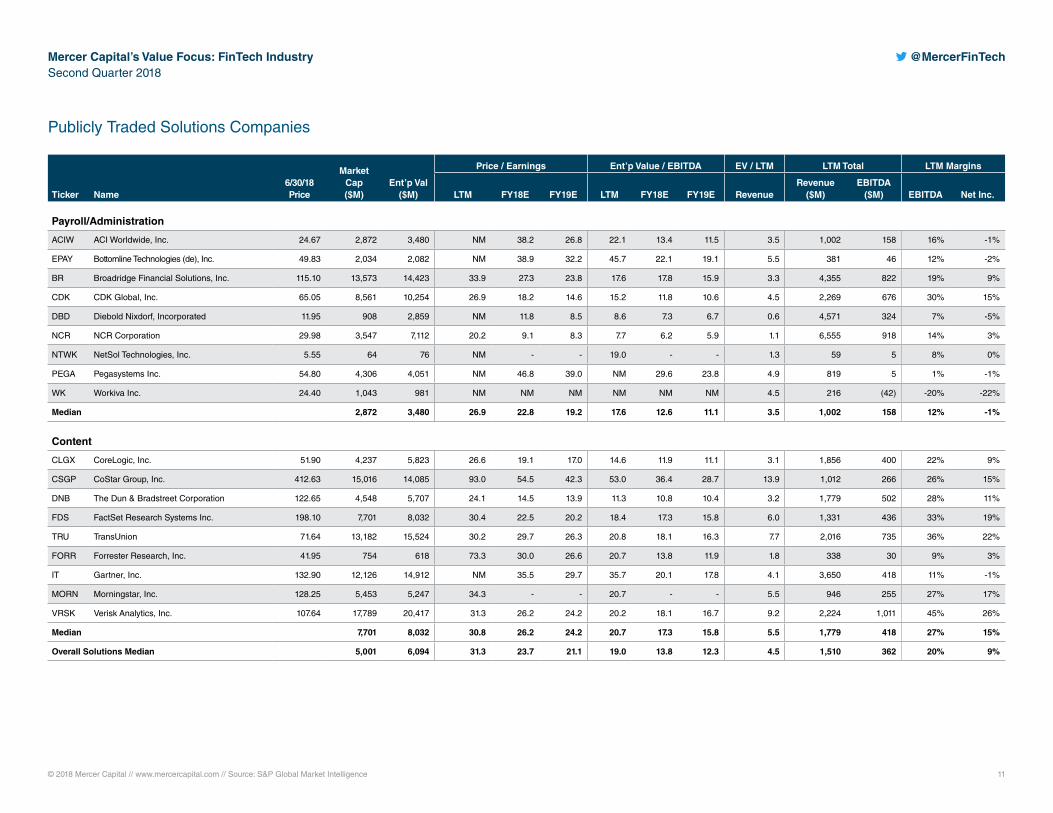
Publicly Traded Solutions Companies
Ticker Name6/30/18 Price
Market Cap ($M)
Ent’p Val ($M)
Price / Earnings Ent’p Value / EBITDA EV / LTM LTM Total LTM Margins
LTM FY18E FY19E LTM FY18E FY19E RevenueRevenue
($M)EBITDA
($M) EBITDA Net Inc.
Payroll/Administration
ACIW ACI Worldwide, Inc. 24.67 2,872 3,480 NM 38.2 26.8 22.1 13.4 11.5 3.5 1,002 158 16% -1%
EPAY Bottomline Technologies (de), Inc. 49.83 2,034 2,082 NM 38.9 32.2 45.7 22.1 19.1 5.5 381 46 12% -2%
BR Broadridge Financial Solutions, Inc. 115.10 13,573 14,423 33.9 27.3 23.8 17.6 17.8 15.9 3.3 4,355 822 19% 9%
CDK CDK Global, Inc. 65.05 8,561 10,254 26.9 18.2 14.6 15.2 11.8 10.6 4.5 2,269 676 30% 15%
DBD Diebold Nixdorf, Incorporated 11.95 908 2,859 NM 11.8 8.5 8.6 7.3 6.7 0.6 4,571 324 7% -5%
NCR NCR Corporation 29.98 3,547 7,112 20.2 9.1 8.3 7.7 6.2 5.9 1.1 6,555 918 14% 3%
NTWK NetSol Technologies, Inc. 5.55 64 76 NM - - 19.0 - - 1.3 59 5 8% 0%
PEGA Pegasystems Inc. 54.80 4,306 4,051 NM 46.8 39.0 NM 29.6 23.8 4.9 819 5 1% -1%
WK Workiva Inc. 24.40 1,043 981 NM NM NM NM NM NM 4.5 216 (42) -20% -22%
Median 2,872 3,480 26.9 22.8 19.2 17.6 12.6 11.1 3.5 1,002 158 12% -1%
Content
CLGX CoreLogic, Inc. 51.90 4,237 5,823 26.6 19.1 17.0 14.6 11.9 11.1 3.1 1,856 400 22% 9%
CSGP CoStar Group, Inc. 412.63 15,016 14,085 93.0 54.5 42.3 53.0 36.4 28.7 13.9 1,012 266 26% 15%
DNB The Dun & Bradstreet Corporation 122.65 4,548 5,707 24.1 14.5 13.9 11.3 10.8 10.4 3.2 1,779 502 28% 11%
FDS FactSet Research Systems Inc. 198.10 7,701 8,032 30.4 22.5 20.2 18.4 17.3 15.8 6.0 1,331 436 33% 19%
TRU TransUnion 71.64 13,182 15,524 30.2 29.7 26.3 20.8 18.1 16.3 7.7 2,016 735 36% 22%
FORR Forrester Research, Inc. 41.95 754 618 73.3 30.0 26.6 20.7 13.8 11.9 1.8 338 30 9% 3%
IT Gartner, Inc. 132.90 12,126 14,912 NM 35.5 29.7 35.7 20.1 17.8 4.1 3,650 418 11% -1%
MORN Morningstar, Inc. 128.25 5,453 5,247 34.3 - - 20.7 - - 5.5 946 255 27% 17%
VRSK Verisk Analytics, Inc. 107.64 17,789 20,417 31.3 26.2 24.2 20.2 18.1 16.7 9.2 2,224 1,011 45% 26%
Median 7,701 8,032 30.8 26.2 24.2 20.7 17.3 15.8 5.5 1,779 418 27% 15%
Overall Solutions Median 5,001 6,094 31.3 23.7 21.1 19.0 13.8 12.3 4.5 1,510 362 20% 9%
© 2018 Mercer Capital // www.mercercapital.com // Source: S&P Global Market Intelligence 12
Mercer Capital’s Value Focus: FinTech IndustrySecond Quarter 2018
@MercerFinTech
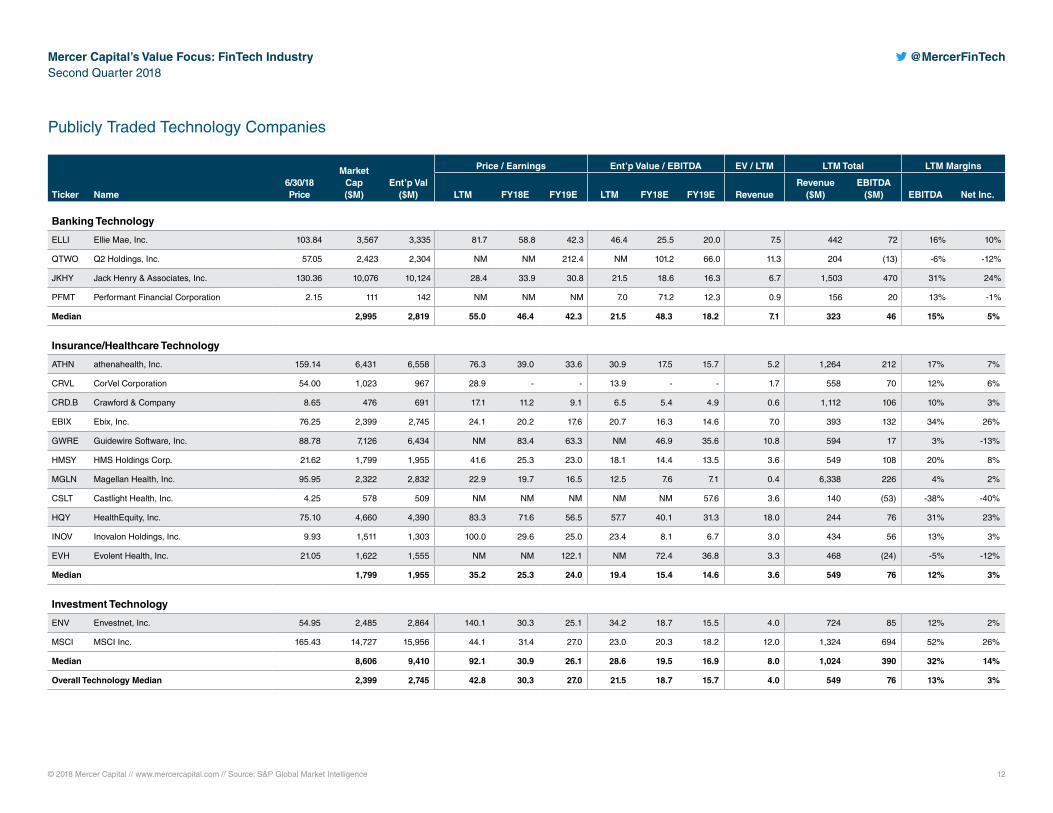
Publicly Traded Technology Companies
Ticker Name6/30/18 Price
Market Cap ($M)
Ent’p Val ($M)
Price / Earnings Ent’p Value / EBITDA EV / LTM LTM Total LTM Margins
LTM FY18E FY19E LTM FY18E FY19E RevenueRevenue
($M)EBITDA
($M) EBITDA Net Inc.
Banking Technology
ELLI Ellie Mae, Inc. 103.84 3,567 3,335 81.7 58.8 42.3 46.4 25.5 20.0 7.5 442 72 16% 10%
QTWO Q2 Holdings, Inc. 57.05 2,423 2,304 NM NM 212.4 NM 101.2 66.0 11.3 204 (13) -6% -12%
JKHY Jack Henry & Associates, Inc. 130.36 10,076 10,124 28.4 33.9 30.8 21.5 18.6 16.3 6.7 1,503 470 31% 24%
PFMT Performant Financial Corporation 2.15 111 142 NM NM NM 7.0 71.2 12.3 0.9 156 20 13% -1%
Median 2,995 2,819 55.0 46.4 42.3 21.5 48.3 18.2 7.1 323 46 15% 5%
Insurance/Healthcare Technology
ATHN athenahealth, Inc. 159.14 6,431 6,558 76.3 39.0 33.6 30.9 17.5 15.7 5.2 1,264 212 17% 7%
CRVL CorVel Corporation 54.00 1,023 967 28.9 - - 13.9 - - 1.7 558 70 12% 6%
CRD.B Crawford & Company 8.65 476 691 17.1 11.2 9.1 6.5 5.4 4.9 0.6 1,112 106 10% 3%
EBIX Ebix, Inc. 76.25 2,399 2,745 24.1 20.2 17.6 20.7 16.3 14.6 7.0 393 132 34% 26%
GWRE Guidewire Software, Inc. 88.78 7,126 6,434 NM 83.4 63.3 NM 46.9 35.6 10.8 594 17 3% -13%
HMSY HMS Holdings Corp. 21.62 1,799 1,955 41.6 25.3 23.0 18.1 14.4 13.5 3.6 549 108 20% 8%
MGLN Magellan Health, Inc. 95.95 2,322 2,832 22.9 19.7 16.5 12.5 7.6 7.1 0.4 6,338 226 4% 2%
CSLT Castlight Health, Inc. 4.25 578 509 NM NM NM NM NM 57.6 3.6 140 (53) -38% -40%
HQY HealthEquity, Inc. 75.10 4,660 4,390 83.3 71.6 56.5 57.7 40.1 31.3 18.0 244 76 31% 23%
INOV Inovalon Holdings, Inc. 9.93 1,511 1,303 100.0 29.6 25.0 23.4 8.1 6.7 3.0 434 56 13% 3%
EVH Evolent Health, Inc. 21.05 1,622 1,555 NM NM 122.1 NM 72.4 36.8 3.3 468 (24) -5% -12%
Median 1,799 1,955 35.2 25.3 24.0 19.4 15.4 14.6 3.6 549 76 12% 3%
Investment Technology
ENV Envestnet, Inc. 54.95 2,485 2,864 140.1 30.3 25.1 34.2 18.7 15.5 4.0 724 85 12% 2%
MSCI MSCI Inc. 165.43 14,727 15,956 44.1 31.4 27.0 23.0 20.3 18.2 12.0 1,324 694 52% 26%
Median 8,606 9,410 92.1 30.9 26.1 28.6 19.5 16.9 8.0 1,024 390 32% 14%
Overall Technology Median 2,399 2,745 42.8 30.3 27.0 21.5 18.7 15.7 4.0 549 76 13% 3%
BUSINESS VALUATION & FINANCIAL ADVISORY SERVICES
Memphis
5100 Poplar Avenue, Suite 2600Memphis, Tennessee 38137
901.685.2120
Dallas
12201 Merit Drive, Suite 480Dallas, Texas 75251
214.468.8400
Nashville
102 Woodmont Blvd., Suite 231Nashville, Tennessee 37205
615.345.0350
www.mercercapital.com