Embed Size (px)
Citation preview

VALUE FOCUSInsurance Industry
www.mercercapital.com
Sector Overview & Commentary Property & Casualty 1Reinsurance 2Life & Health 2Managed Care 3Brokers 3InsurTech, Claims & Services 4
Insurance M&A Highlights Insurance Underwriters 5Insurance Brokers 6
Publicly Traded Insurance Companies Reinsurance 10Multiline 10Life & Health 11Managed Care 12Brokers 13InsurTech, Claims & Services 13
About Mercer Capital 14
Fourth Quarter 2015

© 2015 Mercer Capital // www.mercercapital.com 1
Mercer Capital’s Value Focus: Insurance Industry Fourth Quarter 2015
Sector Overview & CommentaryProperty & Casualty
• P&C stocks gained 4.9% for the quarter and have risen 8.5%
over the last twelve months, led by strong quarters from both
the commercial and personal lines segments. For reference,
the S&P 500 returned a 6.5% for the quarter, but -0.7% Y/Y.
• Per MarketScout, aggregate commercial lines renewal pricing
dropped significantly in Q4, falling 2% in October, 3% in November
and 4% in December. For personal lines, rates renewal pricing
also tumbled, remaining flat in October but dropping by 1% in
both November and December. The shift in price level movement
from positive to negative over the most recent quarters is a
confirmation that the market is indeed softening.
• In a December report, Fitch Ratings maintained their stable rating
of the U.S P&C sector due to strong capitalization from lighter-
than-average catastrophe events. On the whole, underwriting
profitability improved for the quarter with the industry’s median
combined ratio falling to 93.8% from 95.6% in Q3.
• However, looking forward to 2016, Fitch views declining
investment yields as a considerable operating challenge for
U.S P&C insurers. Total investment returns are not likely to be
boosted in the short term by interest rate hikes because such
movement reduces the values of their fixed-income holdings.
The Federal Reserve’s recent increase of the Fed funds target
rate is promising, but expectations of further rate increases in
2016 need be fulfilled for the long term outlook on investment
yields to increase.
Sector Pricing and Valuation Summary
Share Price Δ Price / Earnings Price / Book
LTM Return
on EquitySegment %YoY %4Q15 LTM FY15E FY16E P/B P/TB
Property & Casualty (all) 8.5% 4.9% 13.7x 14.8x 14.1x 1.30x 1.42x 9.9%
P&C - Commercial Lines 14.0% 9.0% 12.7x 13.3x 12.7x 1.22x 1.30x 10.0%
P&C - Personal Lines 0.0% 4.1% 12.6x 14.8x 11.5x 1.62x 1.57x 11.7%
P&C - Specialty 6.9% 2.8% 17.5x 16.2x 15.5x 1.17x 1.24x 7.1%
P&C - Workers' Comp 9.5% -1.1% 15.1x 14.7x 14.3x 1.98x 1.98x 13.9%
Reinsurance 10.2% 4.3% 9.5x 10.2x 10.1x 1.04x 1.06x 10.7%
Multi-line 3.2% 1.9% 12.2x 11.6x 11.5x 0.98x 1.12x 7.1%
Life & Health -6.4% 3.0% 11.0x 10.2x 9.5x 0.90x 0.91x 8.1%
Managed Care 14.4% 0.6% 18.7x 19.6x 16.9x 2.30x 3.06x 12.8%
Source: S&P Global Market Intelligence, Mercer Capital analysis. Median measures shown for segments.
Share Price Δ Enterprise Value / EBITDAEV /
LTM RevLTM Rev GrowthSegment %YoY %4Q15 LTM FY15E FY16E
Insurance Brokers -2.8% 4.1% 12.9x 11.3x 10.3x 2.64x 2.6%
Claims, Tech, & Services 14.4% 1.9% 15.6x 5.1x 3.9x 1.65x 15.7%
Source: S&P Global Market Intelligence, Mercer Capital analysis. Median measures shown for segments.

© 2015 Mercer Capital // www.mercercapital.com 2
Mercer Capital’s Value Focus: Insurance Industry Fourth Quarter 2015
Sector Overview & Commentary
Reinsurance
• Reinsurance stock performance was strong in Q4, with a median increase of
4.3%. The sector has experienced similarly positive results over the last twelve
months, growing 10.2%.
• Price/book for the SNL Reinsurance Index was 1.04x, in line with the previous
quarter. The ratio had been trending downwards over recent quarters and was
threatening to dip below 1.0x for the first time since 2012.
• Aon Securities Inc.’s CEO Paul Schultz stated that he expects U.S. property
peak peril risks, such as Florida hurricane and California earthquake threats, to
continue to dominate both the catastrophe bond and global reinsurance market in
2016. With renewal season approaching, Aon revised its expectations of property
cat reinsurance rates to a decline of just 2.5-7.5%, up from earlier warnings of
decreases of up to 10%.
• Residual market sponsors such as government-affiliated pools and trusts have
increased their participation in alternative market risk transfer mechanisms, like
cat bonds. These risk solutions are gaining in popularity and are placing compet-
itive pricing pressures on the reinsurance sector.
Life & Health
• Life and health stocks bucked their negative trend over recent quarters with a
median increase of 3.0% in Q4. Still, the sector’s overall median return stands at
-6.4% over the past year.
• It is no coincidence that a positive quarter for L&H stocks coincided with the target
Fed funds rate be raised. Yet, the effect of the policy shift is likely to be negligible
in the near term.
• Though most emphasis is placed on interest rate movements, life insurers’ per-
formance in 2016 is also going to be largely affected by strengthening U.S. dollar
headwinds, possible regulatory changes, increasingly favorable demographics,
and the potential for an acceleration in deal making in the space.
• Median price/book for the L&H sector remained challenged at 0.90x for the second
consecutive quarter, which could spur M&A opportunities for certain players.

© 2015 Mercer Capital // www.mercercapital.com 3
Mercer Capital’s Value Focus: Insurance Industry Fourth Quarter 2015
Sector Overview & Commentary
Managed Care
• Managed care stocks rose a meager 0.6% on the quarter, though the sector’s
returns over the last twelve months are significantly more impressive at 14.4%.
• A weak flu season has muted cost trends providing a cushion for the managed
care space against losses related to the public exchanges business. Industry
analysts believe that limited exposure to the volatility associated with ACA regu-
lations is also likely to aid managed care companies’ performance going forward.
• According to research conducted by Mizuho Securities analysts, health care
stocks have historically performed better than the broader market in periods
preceding and following federal elections, provided there is a balance of power
between the White House and at least one chamber of Congress, as is the case
heading into the 2016 election.
• Another matter of importance in the managed care sector moving into 2016 is
the outcome of the extended government review of 2015’s announced mega-
deals between Aetna/Humana and Anthem/Cigna. The opinion of certain UBS
analysts is that the stocks of all managed care companies are being penalized
by the lengthy inspections and positive results could produce favorable returns
in the aftermath.
Brokers
• Broker stocks’ returns were positive for the quarter at 4.1%, though the sector’s
Y/Y returns remain negative, down -2.8%.
• According to The Council of Insurance Agents & Brokers, a moderate decline
in commercial P&C rates across all account sizes and most lines continued
through the quarter. The trend has persisted since the start of 2013 and con-
tinues to pressure brokers’ bottom lines. Large accounts once again suffered
the biggest decline at 3.7%, with the average decrease across all account sizes
a more modest 2.8%. The largest decreases were in commercial property and
general liability lines.
• The soft pricing market is already problematic for brokers, but looking forward
into 2016, there are several other issues worth monitoring. Chief among them are
increasing industry consolidation, carrier innovation in modeling, and underwriting
and the threat of technology-driven distribution channels.
• The robust M&A activity in the sector is due to heightened interest by private
equity firms who view the agency model as a business that can be highly levered.
Two of the most active acquirers of U.S.-based brokers over the past year were
private equity-backed companies: AssuredPartners (backed by Apax Partners)
and Hub International (backed by Hellman & Friedman).
• Among brokers, EV/EBITDA multiples seem to have plateaued after having
jumped to historic highs in 2013. Since then, multiples have been between 12.0x
and 12.9x, remaining steady during the last half of 2015 at approximately 12.5x.

© 2015 Mercer Capital // www.mercercapital.com 4
Mercer Capital’s Value Focus: Insurance Industry Fourth Quarter 2015
Sector Overview & Commentary
InsurTech, Claims & Services
• Ancillary service providers, such as TPAs and insurance software/technology
firms, reported extremely mixed performance in the fourth quarter. The median
return for the sector was 4.1% on the quarter, with returns ranging from positive
36.0% (CorVel) to negative 57.6% (Patriot National).
• CorVel’s (CRVL) impressive performance could be attributed to several factors:
its November share repurchase announcement, its profitable Q3 earnings report,
and its amplified interest in the stock on the part of hedge funds which prompted
investor intrigue. CorVel is a provider of healthcare management services and
solutions for workers’ compensation, auto & liability, group health and disability
insurance markets.
• Patriot National (PN) was challenged by a three day period in which its stock
fell over 50% when the firm announced a sale of shares in a private placement to
certain institutional investors that threatened to have a dilutive effect on existing
shareholders. Patriot National is a national provider of comprehensive technology
and outsourcing solutions within the P&C marketplace.
• As buzz over insurance technology “InsurTech” companies builds, developments
in this sector seem increasingly likely to have a significant impact on the insurance
industry as a whole. The nature and extent of the impact will largely hinge on whether
or not incumbent insurance players are willing and able to leverage the innovations
to their benefit, rather than allowing them to disrupt their existing business dynamics.
© 2015 Mercer Capital // www.mercercapital.com // Source: S&P Global Market Intelligence 5
Mercer Capital’s Value Focus: Insurance Industry Fourth Quarter 2015
Insurance M&A Highlights
Insurance Underwriters
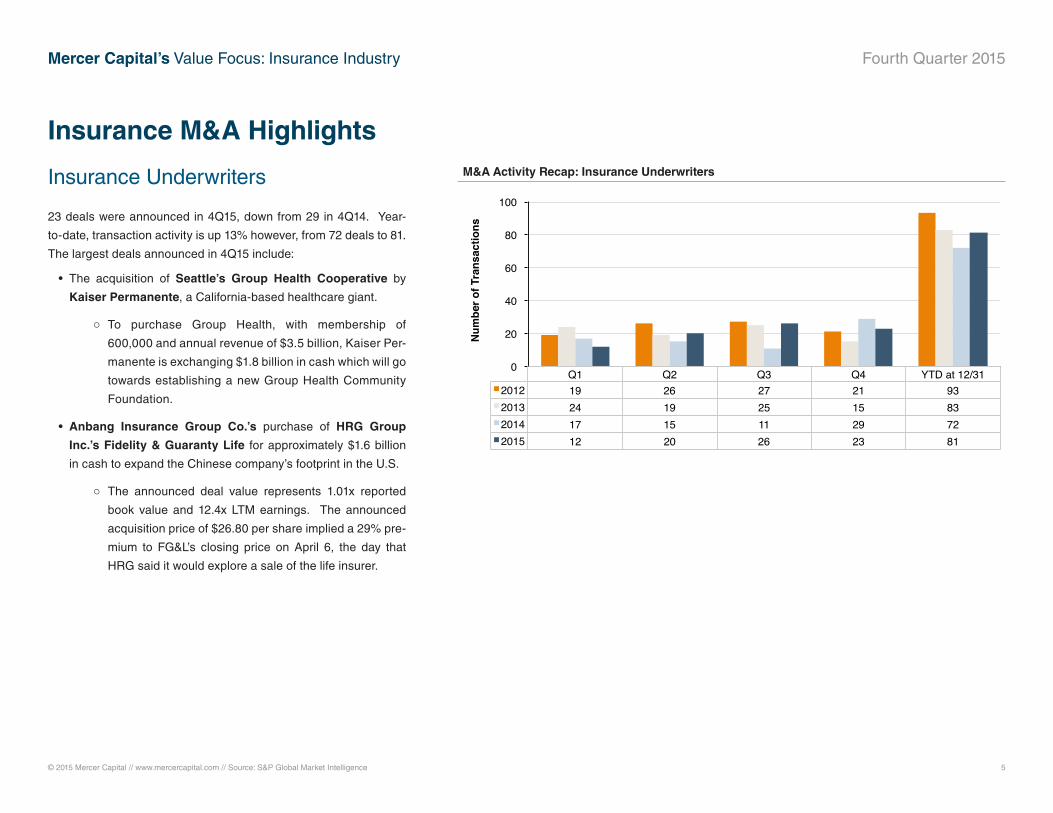
23 deals were announced in 4Q15, down from 29 in 4Q14. Year-
to-date, transaction activity is up 13% however, from 72 deals to 81.
The largest deals announced in 4Q15 include:
• The acquisition of Seattle’s Group Health Cooperative by
Kaiser Permanente, a California-based healthcare giant.
○ To purchase Group Health, with membership of
600,000 and annual revenue of $3.5 billion, Kaiser Per-
manente is exchanging $1.8 billion in cash which will go
towards establishing a new Group Health Community
Foundation.
• Anbang Insurance Group Co.’s purchase of HRG Group
Inc.’s Fidelity & Guaranty Life for approximately $1.6 billion
in cash to expand the Chinese company’s footprint in the U.S.
○ The announced deal value represents 1.01x reported
book value and 12.4x LTM earnings. The announced
acquisition price of $26.80 per share implied a 29% pre-
mium to FG&L’s closing price on April 6, the day that
HRG said it would explore a sale of the life insurer.
Q1! Q2! Q3! Q4! YTD at 12/31!2012! 19 ! 26 ! 27 ! 21 ! 93 !2013! 24 ! 19 ! 25 ! 15 ! 83 !2014! 17 ! 15 ! 11 ! 29 ! 72 !2015! 12 ! 20 ! 26 ! 23 ! 81 !
0 !
20 !
40 !
60 !
80 !
100 !
Num
ber o
f Tra
nsac
tions!
M&A Activity Recap: Insurance Underwriters

© 2015 Mercer Capital // www.mercercapital.com // Source: S&P Global Market Intelligence 6
Mercer Capital’s Value Focus: Insurance Industry Fourth Quarter 2015
Insurance M&A Highlights
Insurance Brokers
107 broker transactions were announced in 4Q15, up from 91 the
year prior. Year-to-date, deal activity is up 39%. Key deal happenings
of 4Q15 include:
• Zurich Insurance Group AG agreed to buy Rural Community
Insurance Services (RCIS), a Wells Fargo & Co. crop-
insurance business.
○ Zurich will pay Wells Fargo $675 million plus the amount
of excess capital in the unit pushing the total deal value to
$1.05 billion. The acquisition is intended to increase the
risk diversity of Zurich’s general insurance business by
leveraging the crop exposure.
• Towers Watson & Co. won approval from its shareholders
for its $8.9 billion merger with insurance broker Willis Group
Holdings Plc.
○ Under terms of the agreement, Towers Watson investors
will receive 2.6 Willis shares for each Towers Watson share
they own, plus a one-time cash dividend of $10 per share.
Towers Watson stock closed 2015 at $128.46, compared
to $137.98 the day before the deal was announced in June.
Willis stock narrowly rose from $45.40 to $46.42 over the
same period.
M&A Activity Recap: Insurance Brokers
Q1! Q2! Q3! Q4! YTD at 12/31!2012! 61 ! 72 ! 64 ! 141 ! 338 !2013! 45 ! 42 ! 57 ! 79 ! 223 !2014! 81 ! 66 ! 93 ! 91 ! 331 !2015! 121 ! 122 ! 109 ! 107 ! 459 !
0 !50 !
100 !150 !200 !250 !300 !350 !400 !450 !500 !
Num
ber o
f Tra
nsac
tions!

© 2015 Mercer Capital // www.mercercapital.com // Source: S&P Global Market Intelligence 7
Mercer Capital’s Value Focus: Insurance Industry Fourth Quarter 2015
Publicly Traded Companies
Property & Casualty
12/31/15Price
Market Cap ($M)
Share Price %YOY
Share Price %Qtr
Price / Earnings Price / Book
Div. Yield
Underwriting Ratios
Invest Yield
LTM ROETicker Name LTM FY15E FY16E P/B P/TB Loss Expense Comb.
Commercial Lines
AIG American International Group, Inc. 61.97 77,264 10.6% 9.1% 18.3x 14.4x 12.0x 0.78x NA 1.97% 67.4% 35.0% 102.4% 4.52% 4.4%
CB Chubb Limited 116.85 37,867 1.7% 13.0% 14.3x 12.1x 12.2x 1.30x 1.62x 2.55% 58.9% 29.0% 87.9% 2.98% 9.1%
TRV Travelers Companies, Inc. 112.86 34,332 6.6% 13.4% 10.1x 10.7x 11.5x 1.43x 1.70x 2.45% 56.1% 31.8% 88.0% 3.47% 14.7%
CINF Cincinnati Financial Corporation 59.17 9,692 14.2% 10.0% 15.2x 17.7x 21.5x 1.53x 1.53x 3.42% 61.2% 30.8% 92.0% 4.70% 9.9%
CNA CNA Financial Corporation 35.15 9,500 -9.2% 0.6% 12.7x 11.5x 10.4x 0.77x 0.78x 2.86% 60.2% 33.5% 93.6% 4.07% 6.0%
AFG American Financial Group, Inc. 72.08 6,295 18.7% 4.6% 18.5x 13.3x 12.7x 1.33x 1.41x 1.63% 64.4% 30.8% 95.1% 4.32% 7.2%
ORI Old Republic International Corporation 18.63 4,871 27.3% 19.1% 13.4x 14.9x 15.3x 1.26x NA 4.73% 48.9% 47.9% 96.8% 4.14% 10.0%
THG Hanover Insurance Group, Inc. 81.34 3,514 14.0% 4.7% 10.6x 13.7x 12.9x 1.22x 1.30x 2.11% 61.2% 34.4% 95.6% 3.84% 12.0%
SIGI Selective Insurance Group, Inc. 33.58 1,920 23.6% 8.1% 12.0x 13.0x 12.9x 1.41x 1.42x 1.80% 58.2% 34.7% 92.9% 2.83% 12.4%
UFCS United Fire Group, Inc. 38.31 960 28.9% 9.3% 10.4x 13.3x 16.3x 1.14x 1.17x 2.51% 61.0% 30.4% 91.4% 3.26% 11.2%
EIG Employers Holdings, Inc. 27.30 876 16.1% 22.5% 9.1x 14.0x 14.5x 1.21x 1.29x 1.08% 63.7% 31.1% 94.8% 3.06% 13.8%
EMCI EMC Insurance Group Inc. 25.30 524 7.0% 9.0% 9.2x 12.0x 14.1x 1.01x 1.01x 2.93% 64.6% 31.4% 95.9% 4.21% 11.0%
DGICA Donegal Group Inc. 14.08 395 -11.9% 0.1% 16.7x 13.4x 9.4x 0.89x 0.91x 3.84% 67.0% 32.6% 99.6% 2.62% 5.5%
AFH Atlas Financial Holdings, Inc. 19.90 238 21.9% 7.6% 12.7x 16.7x 11.1x 2.01x 2.12x 0.00% 59.2% 28.0% 87.2% 2.03% 17.0%
HALL Hallmark Financial Services, Inc. 11.69 224 -3.3% 1.7% 10.2x 10.9x 11.7x 0.86x 1.12x 0.00% 65.2% 28.8% 94.0% 2.59% 8.6%
Median 3,514 14.0% 9.0% 12.7x 13.3x 12.7x 1.22x 1.30x 2.45% 61.2% 31.4% 94.0% 3.47% 10.0%

© 2015 Mercer Capital // www.mercercapital.com // Source: S&P Global Market Intelligence 8
Mercer Capital’s Value Focus: Insurance Industry Fourth Quarter 2015
Publicly Traded Companies
Property & Casualty
12/31/15Price
Market Cap ($M)
Share Price %YOY
Share Price %Qtr
Price / Earnings Price / Book
Div. Yield
Underwriting Ratios
Invest Yield
LTM ROETicker Name LTM FY15E FY16E P/B P/TB Loss Expense Comb.
Personal Lines
ALL Allstate Corporation 62.09 24,215 -11.6% 6.6% 10.9x 12.5x 11.3x 1.29x 1.39x 2.06% 68.3% 26.1% 94.4% 4.46% 11.5%
PGR Progressive Corporation 31.80 18,589 17.8% 3.8% 14.3x 16.2x 16.1x 2.49x 2.86x 2.24% 72.0% 20.2% 92.2% 2.69% 18.2%
MCY Mercury General Corporation 46.57 2,569 -17.8% -7.8% 86.2x 20.3x 17.5x 1.40x 1.46x 4.89% 72.7% 27.8% 100.5% 0.79% 1.6%
NGHC National General Holdings Corporation 21.86 2,305 17.5% 13.3% 17.1x 14.5x 11.5x 1.77x 2.53x 0.41% 62.9% 30.3% 93.2% 3.06% 11.2%
HMN Horace Mann Educators Corporation 33.18 1,352 0.0% -0.1% 13.7x 15.5x 13.8x 1.03x 1.07x 3.01% 68.7% 26.6% 95.4% 4.56% 7.7%
IPCCInfinity Property and Casualty Corpo-
ration82.23 929 6.4% 2.1% 15.3x 17.9x 16.5x 1.33x 1.49x 2.14% 75.7% 18.7% 94.4% 2.40% 8.8%
UVE Universal Insurance Holdings, Inc. 23.18 826 13.3% -21.5% 8.5x 8.1x 7.7x 2.92x NA 1.62% 36.1% NA NA 0.76% 42.1%
SAFT Safety Insurance Group, Inc. 56.38 851 -11.9% 4.1% NM NM 14.6x 1.32x 1.32x 5.17% 83.4% 29.2% 112.6% 3.41% -2.0%
STFC State Auto Financial Corporation 20.59 846 -7.3% -9.7% 7.5x 15.0x 13.2x 0.97x 0.97x 1.75% 69.9% 33.1% 103.0% 3.84% 12.9%
HRTG Heritage Insurance Holdings, Inc. 21.82 661 12.3% 10.6% 7.1x 7.3x 6.8x 1.99x 1.99x 0.00% 36.1% 28.0% 64.1% 1.72% 32.3%
SNC State National Companies, Inc. 9.81 436 -18.1% 4.9% 11.5x 10.8x 9.8x 1.62x 1.66x 2.57% NA NA NA 2.32% 15.0%
FNHC Federated National Holding Company 29.56 407 22.4% 23.1% 9.9x 10.5x 10.5x 1.82x 1.82x 0.83% 48.7% NA NA 2.61% 20.5%
UIHC United Insurance Holdings Corp. 17.10 368 -22.1% 30.0% 14.4x 17.1x 10.4x 1.62x 1.65x 1.52% 53.7% 40.2% 93.8% 1.81% 11.7%
Median 851 0.0% 4.1% 12.6x 14.8x 11.5x 1.62x 1.57x 2.06% 68.5% 27.9% 94.4% 2.61% 11.7%

© 2015 Mercer Capital // www.mercercapital.com // Source: S&P Global Market Intelligence 9
Mercer Capital’s Value Focus: Insurance Industry Fourth Quarter 2015
Publicly Traded Companies
Property & Casualty
12/31/15Price
Market Cap ($M)
Share Price %YOY
Share Price %Qtr
Price / Earnings Price / Book
Div. Yield
Underwriting Ratios
Invest Yield
LTM ROETicker Name LTM FY15E FY16E P/B P/TB Loss Expense Comb.
Specialty Lines
MKL Markel Corporation 883.35 12,323 29.4% 10.2% 24.8x 25.5x 34.1x 1.60x 2.05x 0.00% 50.7% 38.4% 89.2% 2.04% 6.6%
ACGL Arch Capital Group Ltd. 69.75 8,540 18.0% -5.1% 13.3x 16.1x 17.0x 1.46x 1.49x 0.00% 55.0% 34.3% 89.3% 1.88% 11.3%
WRB W. R. Berkley Corporation 54.75 6,749 6.8% 0.7% 14.2x 16.3x 15.6x 1.47x 1.52x 0.88% 60.9% 33.0% 93.9% 3.77% 11.0%
ENH Endurance Specialty Holdings Ltd. 63.99 4,262 6.9% 4.9% 10.1x 9.4x 9.7x 0.98x 1.12x 2.28% 49.0% 35.9% 85.0% 2.08% 9.6%
WTM White Mountains Insurance Group, Ltd. 726.81 4,176 15.3% -2.7% 44.2x 76.3x 92.0x 1.11x 1.24x 0.13% 69.1% 34.3% 103.4% 0.04% 2.5%
AWHAllied World Assurance Company Hold-
ings, AG37.19 3,381 -1.9% -2.6% 17.5x 15.7x 15.0x 0.95x 1.10x 2.54% 59.2% 31.7% 90.9% 0.89% 5.7%
ESGR Enstar Group Limited 150.04 2,889 -1.9% 0.0% 13.4x 13.6x 12.0x 1.19x 1.29x 0.00% NA NA NA 1.86% 9.2%
RLI RLI Corp. 61.75 2,679 25.0% 15.4% 19.3x 23.7x 26.6x 3.03x 3.30x 1.42% 42.1% 41.7% 83.8% 5.08% 16.2%
AGII Argo Group International Holdings, Ltd. 54.40 1,668 18.7% 5.7% 9.4x 16.1x 15.6x 1.02x 1.18x 1.35% 55.8% 39.6% 95.4% 3.88% 11.0%
NAVG Navigators Group, Inc. 85.79 1,237 17.0% 10.0% 15.3x 15.6x 15.4x 1.15x 1.16x 0.00% 57.3% 35.8% 93.1% 2.67% 7.9%
OB OneBeacon Insurance Group, Ltd. 12.41 1,182 -23.4% -11.6% NM 22.2x 14.9x 1.18x NA 5.98% 68.9% 34.1% 103.0% 1.09% -2.2%
JRVR James River Group Holdings, Ltd. 33.54 965 47.4% 24.7% 19.7x 16.1x 14.9x 1.36x 1.99x 1.79% 60.2% 33.3% 93.5% 3.18% 7.2%
GBLI Global Indemnity plc 29.02 747 2.3% 10.9% 29.6x 26.3x 24.2x 0.81x 0.84x 0.00% 56.0% 39.9% 95.9% 1.22% 2.7%
NATL National Interstate Corporation 26.70 531 -10.4% 0.1% 22.3x 18.9x 16.3x 1.45x 1.48x 1.95% 80.0% 20.0% 99.9% 2.52% 6.5%
BWINB Baldwin & Lyons, Inc. 24.03 361 -6.8% 10.7% 12.9x 12.3x 14.2x 0.92x 0.93x 4.61% 58.3% 31.9% 90.1% 1.86% 7.0%
CNFR Conifer Holdings, Inc. 9.27 71 NA -4.9% 29.0x 18.9x 8.6x 0.88x 0.90x 0.00% 57.3% 41.5% 98.8% NA 4.8%
Median 2,173 6.9% 2.8% 17.5x 16.2x 15.5x 1.17x 1.24x 1.12% 57.3% 34.3% 93.5% 2.04% 7.1%
Workers’ Compensation Focus
AFSI AmTrust Financial Services, Inc. 30.79 5,105 9.5% -2.2% 10.7x 10.3x 10.1x 2.39x 4.00x 1.91% 65.8% 24.9% 90.8% 3.42% 21.9%
PRA ProAssurance Corporation 48.53 2,579 7.5% -1.1% 18.8x 18.3x 18.9x 1.29x 1.52x 2.53% 55.9% 29.8% 85.7% 2.22% 6.9%
AMSF AMERISAFE, Inc. 50.90 972 20.2% 2.4% 15.1x 14.7x 14.3x 1.98x 1.98x 1.21% 59.7% 23.1% 82.8% 2.29% 13.9%
Median 2,579 9.5% -1.1% 15.1x 14.7x 14.3x 1.98x 1.98x 1.91% 59.7% 24.9% 85.7% 2.29% 13.9%
Median All Sub-Groups 1,668 8.5% 4.9% 13.7x 14.8x 14.1x 1.30x 1.42x 1.91% 60.2% 31.8% 93.8% 2.68% 9.9%

© 2015 Mercer Capital // www.mercercapital.com // Source: S&P Global Market Intelligence 10
Mercer Capital’s Value Focus: Insurance Industry Fourth Quarter 2015
Publicly Traded Companies
Reinsurance
12/31/15Price
Market Cap ($M)
Share Price %YOY
Share Price %Qtr
Price / Earnings Price / Book
Div. Yield
Underwriting Ratios
Invest Yield
LTM ROETicker Name LTM FY15E FY16E P/B P/TB Loss Expense Comb.
XL XL Group Ltd 39.18 11,727 14.0% 7.9% 10.1x 15.9x 11.5x 0.98x 1.21x 1.87% 57.3% 33.1% 90.4% 2.81% 10.3%
RE Everest Re Group, Ltd. 183.09 7,888 7.5% 5.6% 8.6x 8.4x 10.0x 1.05x 1.06x 2.19% 57.5% 27.0% 84.4% 1.67% 12.7%
AXS AXIS Capital Holdings Limited 56.22 5,400 10.0% 4.7% 9.0x 14.5x 12.6x 1.04x 1.06x 2.16% 58.5% 36.2% 94.6% 1.28% 11.4%
RNR RenaissanceRe Holdings Ltd. 113.19 4,994 16.4% 6.5% 9.6x 10.9x 12.1x 1.16x 1.24x 1.12% 25.7% 33.5% 59.2% 1.84% 11.5%
VR Validus Holdings, Ltd. 46.29 3,796 11.4% 2.7% 9.5x 9.7x 10.1x 1.04x 1.14x 2.80% 43.6% 35.3% 78.9% 1.78% 11.8%
AHL Aspen Insurance Holdings Limited 48.30 2,936 10.3% 3.9% 13.1x 10.7x 10.8x 1.05x 1.05x 1.76% 55.9% 36.6% 92.5% 1.86% 7.9%
TPRE Third Point Reinsurance Ltd. 13.41 1,414 -7.5% -0.3% NM NM 6.3x 1.06x 1.06x 0.00% 69.1% 33.9% 103.0% -3.80% -9.8%
MHLD Maiden Holdings, Ltd. 14.91 1,099 16.6% 7.4% 11.1x 9.7x 7.5x 1.21x 1.34x 3.75% 66.2% 32.7% 99.0% 3.20% 10.3%
GLRE Greenlight Capital Re, Ltd. 18.71 693 -42.7% -16.0% NM NM 4.5x 0.80x 0.80x 0.00% 81.2% 35.6% 116.8% -5.67% -20.3%
BCRH Blue Capital Reinsurance Holdings Ltd. 17.15 150 -3.4% -0.4% 7.6x 7.7x 9.4x 0.82x NA 6.97% 14.9% 35.8% 50.7% 0.00% 11.1%
Median 3,366 10.2% 4.3% 9.5x 10.2x 10.1x 1.04x 1.06x 2.02% 57.4% 34.6% 91.5% 1.72% 10.7%
Multiline
12/31/15Price
Market Cap ($M)
Share Price %YOY
Share Price %Qtr
Price / Earnings Price / Book
Div. Yield
Underwriting Ratios
Invest Yield
LTM ROETicker Name LTM FY15E FY16E P/B P/TB Loss Expense Comb.
AMP Ameriprise Financial, Inc. 106.42 18,626 -19.5% -2.5% 12.2x 11.6x 10.3x 2.44x 3.30x 2.46% 96.9% 15.5% 112.4% 3.39% 20.3%
HIG Hartford Financial Services Group, Inc. 43.46 17,876 4.2% -5.1% 11.4x 11.5x 10.9x 0.98x 1.01x 1.83% 66.7% 30.6% 97.3% 4.00% 8.8%
AIZ Assurant, Inc. 80.54 5,376 17.7% 1.9% 45.5x 11.6x 12.1x 1.15x 1.52x 2.53% NA NA NA 4.36% 2.5%
ANAT American National Insurance Company 102.27 2,750 -10.5% 4.7% 11.1x NA NA 0.62x 0.62x 3.28% 67.7% 31.2% 98.9% 4.45% 5.6%
KMPR Kemper Corporation 37.25 1,912 3.2% 5.3% 13.3x 20.0x 16.7x 0.94x 1.12x 2.71% 72.4% 26.7% 99.0% 5.52% 7.1%
Median 5,376 3.2% 1.9% 12.2x 11.6x 11.5x 0.98x 1.12x 2.53% 70.0% 28.7% 99.0% 4.36% 7.1%

© 2015 Mercer Capital // www.mercercapital.com // Source: S&P Global Market Intelligence 11
Mercer Capital’s Value Focus: Insurance Industry Fourth Quarter 2015
Publicly Traded Companies
Life & Health
12/31/15Price
Market Cap ($M)
Share Price %YOY
Share Price %Qtr
Price / Earnings Price / Book
Div.YieldInvest. Yield
ROE
Ticker Name LTM FY15E FY16E P/B P/TB LTM FY15E FY16E
MET MetLife, Inc. 48.21 53,743 -10.9% 2.2% 9.4x 9.6x 8.2x 0.79x 0.91x 3.18% 4.64% 8.4% 9.9% 8.0%
PRU Prudential Financial, Inc. 81.41 36,589 -10.0% 6.8% 11.0x 7.8x 8.0x 0.86x 0.87x 3.04% 4.39% 8.1% 15.7% 10.7%
AFL Aflac Incorporated 59.90 25,611 -1.9% 3.0% 10.5x 9.9x 9.5x 1.48x NA 2.68% 3.18% 14.0% 16.7% 15.2%
PFG Principal Financial Group, Inc. 44.98 13,202 -13.4% -5.0% 10.9x 10.5x 10.3x 1.37x 1.83x 3.21% 4.60% 12.5% 13.6% 12.7%
LNC Lincoln National Corporation 50.26 12,438 -12.8% 5.9% 10.7x 9.2x 7.7x 0.86x 1.03x 1.69% 4.61% 7.9% 10.8% 9.7%
UNM Unum Group 33.29 8,104 -4.6% 3.8% 23.0x 9.2x 8.7x 0.94x 0.97x 2.31% 4.77% 4.1% 10.7% 10.5%
VOYA Voya Financial, Inc. 36.91 7,948 -12.9% -4.8% 4.7x 13.0x 11.0x 0.56x 0.57x 0.10% 4.48% 12.3% 6.2% 7.7%
TMK Torchmark Corporation 57.16 7,072 5.5% 1.3% 13.5x 13.5x 12.9x 1.65x 1.84x 0.96% 5.18% 11.8% 12.7% 12.5%
RGA Reinsurance Group of America, Inc. 85.55 5,625 -2.4% -5.6% 11.0x 10.6x 9.5x 0.90x 0.90x 1.63% 5.01% 7.8% 10.4% 10.6%
CNO CNO Financial Group, Inc. 19.09 3,565 10.9% 1.5% 17.5x 15.0x 12.6x 0.85x 0.85x 1.49% 5.49% 4.8% 7.7% 7.7%
PRI Primerica, Inc. 47.23 2,294 -13.0% 4.8% 13.2x 12.8x 11.3x 2.00x 2.11x 1.42% 4.00% 15.3% 16.3% 17.7%
AELAmerican Equity Investment Life Holding
Company24.03 1,951 -17.7% 3.1% 8.9x 9.7x 8.9x 0.91x 0.91x 0.86% 4.40% 10.3% 10.7% 8.8%
GNW Genworth Financial, Inc. 3.73 1,856 -56.1% -19.3% NM 4.2x 3.8x 0.14x 0.14x 0.00% 4.13% -7.4% 3.8% 3.2%
FFG FBL Financial Group, Inc. 63.64 1,577 9.7% 3.4% 14.4x 15.1x 14.3x 1.35x 1.37x 2.60% 5.13% 9.1% NA NA
FGL Fidelity & Guaranty Life 25.37 1,494 4.5% 3.4% 12.6x NA 11.5x 0.99x NA 1.06% 5.08% 7.2% 6.4% 9.6%
NWLI National Western Life Group, Inc. 251.94 916 -6.4% 13.1% 9.3x NA NA 0.57x 0.57x 0.16% 5.04% 6.0% NA NA
KCLI Kansas City Life Insurance Company 38.29 406 -20.3% -18.5% 13.3x NA NA 0.56x 0.56x 2.30% 4.59% 4.1% NA NA
CIA Citizens, Inc. 7.43 372 -2.2% 0.1% NM NA NA 1.49x 1.61x 0.00% 3.89% -4.9% NA NA
IHC Independence Holding Company 13.85 239 -0.7% 6.9% 8.3x NA NA 0.76x 0.98x 0.69% 4.44% 9.8% NA NA
Median 3,565 -6.4% 3.0% 11.0x 10.2x 9.5x 0.90x 0.91x 1.49% 4.60% 8.1% 10.7% 10.1%

© 2015 Mercer Capital // www.mercercapital.com // Source: S&P Global Market Intelligence 12
Mercer Capital’s Value Focus: Insurance Industry Fourth Quarter 2015
Publicly Traded Companies
Managed Care
12/31/15Price
Market Cap ($M)
Share Price %YOY
Share Price %Qtr
Price / Earnings Price / Book
Div.YieldInvest. Yield
ROE
Ticker Name LTM FY15E FY16E P/B P/TB LTM FY15E FY16E
UNH UnitedHealth Group Incorporated 117.64 112,111 16.4% 1.4% 18.7x 19.6x 16.4x 3.39x NA 1.72% 2.59% 18.8% 17.8% 17.7%
AET Aetna Inc. 108.12 37,701 21.7% -1.2% 16.6x 14.3x 13.4x 2.38x NA 0.91% 3.81% 15.3% 16.4% 14.2%
CI Cigna Corporation 146.33 37,693 42.2% 8.4% 17.9x 17.1x 15.7x 3.20x 6.57x 0.03% 5.22% 19.2% 18.4% 14.4%
ANTM Anthem, Inc. 139.44 36,398 11.0% -0.4% 13.3x 13.7x 12.8x 1.57x NA 1.79% 3.47% 12.1% 11.0% 11.5%
HUM Humana Inc. 178.51 26,459 24.3% -0.3% 20.5x 23.0x 20.2x 2.56x 3.94x 0.65% 3.25% 13.2% 13.4% 11.6%
CNC Centene Corporation 65.81 7,845 26.7% 21.4% 22.9x 22.7x 17.6x 3.82x 7.54x 0.00% 1.12% 19.1% 16.9% 11.4%
WCG WellCare Health Plans, Inc. 78.21 3,449 -4.7% -9.2% 30.6x 22.8x 17.2x 2.02x 2.53x 0.00% 1.97% 6.9% 24.3% NA
MOH Molina Healthcare, Inc. 60.13 3,372 12.3% -12.7% 21.9x 22.3x 16.5x 2.22x 3.06x 0.00% 0.40% 12.4% 11.4% 8.3%
GTS Triple-S Management Corporation 23.91 606 0.0% 34.3% 9.8x 18.1x 17.3x 0.73x 0.75x 0.00% 4.95% 7.6% NA NA
UAM Universal American Corp. 7.00 588 -24.6% 2.3% NM NM 34.7x 0.96x 1.10x 0.00% 1.79% -2.4% NA NA
Median 17,152 14.4% 0.6% 18.7x 19.6x 16.9x 2.30x 3.06x 0.01% 2.92% 12.8% 16.7% 11.6%

© 2015 Mercer Capital // www.mercercapital.com // Source: S&P Global Market Intelligence 13
Mercer Capital’s Value Focus: Insurance Industry Fourth Quarter 2015
Publicly Traded Companies
Brokers
12/31/15Price
Market Cap ($M)
Share Price %YOY
Share Price %Qtr
EV ($M)
EV / EBITDA
EV / LTM Rev. Div.Yield
LTM EBITDA Margin
LTM Rev.
Growth
Organic Rev Growth
Ticker Name LTM FY15E FY16E 15Q3 15Q2
MMC Marsh & McLennan Companies, Inc. 55.45 28,962 -3.1% 6.2% 32,116 11.9x 11.3x 10.5x 2.5x 2.37% 20.9% -0.3% 2.0% 3.0%
AON Aon plc 92.21 25,256 -2.8% 4.1% 30,984 12.9x 11.9x 11.1x 2.6x 1.24% 20.4% -2.2% 2.0% 3.0%
WLTWWillis Towers Watson Public Limited
Company128.66 8,740 8.4% 18.6% 10,845 14.1x 12.7x 10.3x 2.8x 3.00% 19.9% 2.6% 3.3% 1.6%
AJG Arthur J. Gallagher & Co. 40.94 7,234 -13.0% -0.8% 9,257 13.0x 10.9x 9.7x 2.3x 3.59% 17.9% 18.8% 4.1% 5.8%
BRO Brown & Brown, Inc. 32.10 4,525 -2.5% 3.6% 5,236 10.6x 9.5x 9.0x 3.2x 1.42% 30.0% 8.1% 1.6% 2.1%
Median 8,740 -2.8% 4.1% 10,845 12.9x 11.3x 10.3x 2.6x 2.37% 20.4% 2.6% 2.0% 3.0%
InsurTech, Claims & Services
To12/31/15
Price
Market Cap ($M)
Share Price %YOY
Share Price %Qtr
Total EV ($M)
EV / EBITDA
EV / LTM Rev. Div.Yield
LTM EBITDA Margin
LTM Rev. Growth
LTM Rev. ($M)Ticker Name LTM FY15E FY16E
GWRE Guidewire Software, Inc. 60.16 4,272 18.8% 1.9% 4,059 184.7x NA 54.6x 10.7x 0.00% 5.8% 8.6% 381
EBIX Ebix, Inc. 32.79 1,108 93.0% 31.4% 1,262 13.1x NA NA 4.9x 1.20% 37.7% 25.1% 256
BNFT Benefitfocus, Inc. 36.39 1,055 10.8% 16.4% 1,063 NM NM NM 6.2x 0.00% -26.3% 34.1% 171
CRVL CorVel Corporation 43.92 869 18.0% 36.0% 819 13.0x NA NA 1.7x 0.00% 12.8% 1.3% 496
CRD.B Crawford & Company 5.31 292 -48.3% -5.3% 493 5.9x 4.9x 3.9x 0.4x 3.57% 6.7% 2.3% 1,247
PN Patriot National, Inc. 6.71 182 NA -57.6% 288 18.1x 5.3x 3.6x 1.5x 0.00% 13.6% 108.0% 189
CNXR Connecture, Inc. 3.61 79 -59.9% -20.8% 121 28.9x NA NA 1.3x 0.00% 4.4% 15.7% 95
Median 869 14.4% 1.9% 819 15.6x 5.1x 3.9x 1.7x 0.00% 6.7% 15.7% 256

Mercer CapitalInsurance Industry Services
Contact Us
Copyright © 2015 Mercer Capital Management, Inc. All rights reserved. It is illegal under Federal law to reproduce this publication or any portion of its contents without the publisher’s permission. Media quotations with source attribution are encouraged. Reporters
requesting additional information or editorial comment should contact Barbara Walters Price at 901.685.2120. Mercer Capital’s Industry Focus is published quarterly and does not constitute legal or financial consulting advice. It is offered as an information service to
our clients and friends. Those interested in specific guidance for legal or accounting matters should seek competent professional advice. Inquiries to discuss specific valuation matters are welcomed. To add your name to our mailing list to receive this complimentary
publication, visit our web site at www.mercercapital.com.
Mercer Capital provides the insurance industry with corporate valuation, financial reporting, transaction advisory, and related services.
Industry Segments
Mercer Capital serves the following industry segments:
Agencies
• Independent insurance brokers and agents
• Bank-owned agencies
• Retail, wholesale, and MGAs
Ancillary
• Third-party administrators
• Claims adjusters and other service providers
Mercer Capital Experience
• Nationwide client base
• Agency clients range from single office agencies to top-10 public brokers
• Underwriter clients range from monoline privates to publicly traded multi-line carriers
Contact a Mercer Capital professional to discuss your needs in confidence.
Lucas M. Parris, CFA, [email protected]
Don Erickson, ASA [email protected]
Bryce Erickson, ASA, [email protected]
Travis W. Harms, CFA, CPA/[email protected]
MERCER CAPITAL
Memphis5100 Poplar Avenue, Suite 2600Memphis, Tennessee 38137901.685.2120
Dallas12201 Merit Drive, Suite 480Dallas, Texas 75251214.468.8400
Nashville102 Woodmont Blvd., Suite 231Nashville, Tennessee 37205615.345.0350
www.mercercapital.com
Underwriters
• P&C, life & health, and managed care
• Reinsurance
• Captives and risk retention groups