Embed Size (px)
Citation preview

VALUE FOCUSFOOD AND BEVERAGE
Q1: Non-Alcoholic BeveragesQ2: Alcoholic BeveragesQ3: Food ProcessingQ4: Fast Food & Casual Restaurants
2014
© 2014 Mercer Capital 1 www.mercercapital.com
Segment Focus
2014 Second Quarter
Alcoholic Beverages
BUSINESS VALUATION & FINANCIAL ADVISORY SERVICES
The alcoholic beverage landscape has evolved drastically in the wake of the recession. Traditionally, the beer segment has benefited from
consumers opting for beer over more expensive alcoholic beverage choices, but the recent success of wine and spirits has significantly
increased competition.1 Within the beer segment, light beer has struggled the most, with volume declining 8% since 2008.2 In the spirits
segment, consumers have continually proven that they are willing to buy at both ends of the market. The growing popularity of cocktails
necessitated demand for lower quality products to be used in bars while consumers tend to purchase premium spirits at liquor stores for
at-home consumption.3 The wine segment has consistently increased market share as wine consumption grows in the United States. In the
midst of consolidation within the wine segment, large producers have prospered through bulk production while small wineries have generally
struggled.4
While year-over-year performance was
generally positive, second quarter 2014
brought mixed results for publicly traded
alcoholic beverage companies.
Despite the growth of craft beers, Craft
Brew Alliance shares ended the second
quarter down 28% from the prior quarter
after reporting weak first quarter results.
The company reported improved
earnings in the second quarter driven by
a 9% increase in depletions (cases sold
to retailers) and a successful launch of
its variety pack.5 Molson Coors Brewing
and Anheuser-Busch InBev were both
up quarter over quarter in part due to
expectations for continued acquisition
opportunities for the companies. Diageo,
Constellation Brands, and Brown-Forman
were all up quarter-over-quartering,
benefiting from positive sales trends.
Public Company Performance
-100% 0%
100% 200% 300% 400% 500% 600% 700% 800% 900%
6/30/09 12/31/09 6/30/10 12/31/10 6/30/11 12/31/11 6/30/12 12/31/12 6/30/13 12/31/13 6/30/14
Anheuser-Busch InBev NV Constellation Brands Inc. The Boston Beer Co Inc. Brown-Forman Corp. Craft Brew Alliance Inc. Diageo PLC Molson Coors Brewing Co.
5 Year Change in Stock Prices for Publicly Traded Alcoholic Beverage Companies

Mercer Capital’s Value Focus: Food and Beverage Industry Second Quarter 2014
© 2014 Mercer Capital 2 www.mercercapital.com
According to Bloomberg, the alcoholic beverage industry had 44
pending or completed deals with an average value of $566 million
between June 30, 2013 and 2014. Deal volume is up 15.8%from the
previous twelve months when the industry had 38 deals with an aver-
age value of $131 million. Two major deals involving AB InBev and
Suntory Holdings Ltd. were completed during the second quarter.
Other significant deals occurred in the craft beer segment as major
breweries continually try to acquire successful crafts. On Febru-
ary 5, 2014 AB InBev acquired Blue Point Brewery for a reported
$24 million and on October 18, 2013 Duvel Moortgat successfully
acquired Kansas City-based Boulevard Brewing Co.
Merger and Acquisitions
Acquirer Target Date Consideration Price/
RevenuePrice/
EBITDA
Suntory Holdings Ltd. Beam Suntory Inc. 5/1/14 $15.9 billion 6.23x 20.1x
AB InBev Oriental Brewing Co. 4/1/14 $5.8billion na na
Source: Bloomberg
Alcoholic Beverage Transactions

Mercer Capital’s Value Focus: Food and Beverage Industry Second Quarter 2014
© 2014 Mercer Capital // Chart Data Source: Beverage World, The Brewers Association
3 www.mercercapital.com
Beer
While year-over-year performance was gen-
erally positive, second quarter 2014 brought
mixed results for publicly traded alcoholic
beverage companies.
Despite the growth of craft beers, Craft Brew
Alliance shares ended the second quarter
down 28% from the prior quarter after report-
ing weak first quarter results. The company
reported improved earnings in the second
quarter driven by a 9% increase in deple-
tions (cases sold to retailers) and a success-
ful launch of its variety pack.5 Molson Coors
Brewing and Anheuser-Busch InBev were
both up quarter over quarter in part due to
expectations for continued acquisition oppor-
tunities for the companies.
Diageo, Constellation Brands, and
Brown-Forman were all up quarter-over-quar-
tering, benefiting from positive sales trends.
Total U.S. beer volume remained at flat at
approximately 200 million barrels in 2013.6
As previously discussed, declines in the
popularity of light beer mean the stability of
the segment is largely being supported by
craft beer, which posted another double digit
annual growth rate.
Significant legislative issues continue to
affect the beer segment, particularly beer
wholesalers. According to the National Beer
Wholesalers Association, the biggest areas
of legislative concern center on the Food
Safety Modernization Act and its effects on
the frequency of registration requirements,
the Tax Reform Act of 2014, and state based
alcohol regulation trends.7
With the success of craft beer, there is a
risk of saturation with over 500 new brands
coming to market in any given year.8 A
slowdown of new businesses entering the
industry is expected to benefit the segment’s
bottom line. Even with slowing growth, craft
and premium beer segments are expected
to positively contribute to industry revenue
over the next five years.9
190
192
194
196
198
200
202
204
206
208
210
Volume (millions of barrels)
Total U.S. Beer Volume (Millions of Barrels)
0
2
4
6
8
10
12
14
16
18
2008 2009 2010 2011 2012 2013 (Est.)
Volume (millions of barrels)
Total U.S. Craft Beer Volume (Millions of Barrels)

Mercer Capital’s Value Focus: Food and Beverage Industry Second Quarter 2014
© 2014 Mercer Capital 4 www.mercercapital.com
Beer
Beer Global Market Share (%)
Company 2013 2012 2011 2010 2009 2008
Anheuser-Busch InBev NV 19.68 18.14 18.22 18.55 18.73 20.11
SABMiller PLC 9.60 9.60 9.73 9.23 8.89 9.18
Heineken NV 9.24 9.26 8.81 8.67 6.68 6.92
China Resources Enterprise Ltd 6.17 5.44 5.33 4.95 4.53 3.96
Carlsberg A/S 6.18 5.59 5.62 5.82 5.87 5.87
Tsingtao Brewery Co Ltd 4.42 4.05 3.72 3.38 3.19 2.92
Molson Coors Brewing Co 3.22 3.27 2.64 2.73 2.68 2.66
Beijing Yanjing Brewery-A 2.87 2.75 2.87 2.68 2.53 2.30
Kirin Holdings Co Ltd 2.45 2.58 2.62 1.67 1.76 1.27
Asahi Group Holdings Ltd 1.17 1.29 1.36 na na na
Others 35.01 38.04 39.09 42.33 45.14 44.80
Source: Bloomberg
Top 10 U.S. Beer Brands Top 10 U.S. Craft Beer Brands
Top 10 U.S. Beer Brands2012 Sales
(in Millions)
Bud Light $5,979.0
Coors Light $2,290.1
Budweiser $2,164.7
Miller Light $1,928.9
Natural Light $1,200.5
Corona Extra $1,140.0
Busch Light $827.7
Busch Light $705.8
Michelob Ultra $702.7
Heineken $672.4
Source: Beverage World, SymphonyIRI Group
Top 10 U.S. Craft Beer Brands2012 Sales
(in Millions)
Boston Beer Co. 2.70
Sierra Nevada Brewing Co. 0.97
New Belgium Brewing Co. 0.76
The Gambrinus Co. 0.59
Deschutes Brewery 0.25
Lagunitas Brewing Co. 0.24
Bell's Brewery 0.22
Matt Brewing Co. 0.20
Harpoon Brewery 0.19
Stone Brewing 0.18
Source: Beverage World, The Brewers Association
Mercer Capital’s Value Focus: Food and Beverage Industry Second Quarter 2014
© 2014 Mercer Capital // Chart Data Source: Beverage World via Distilled Spirits Council
5 www.mercercapital.com
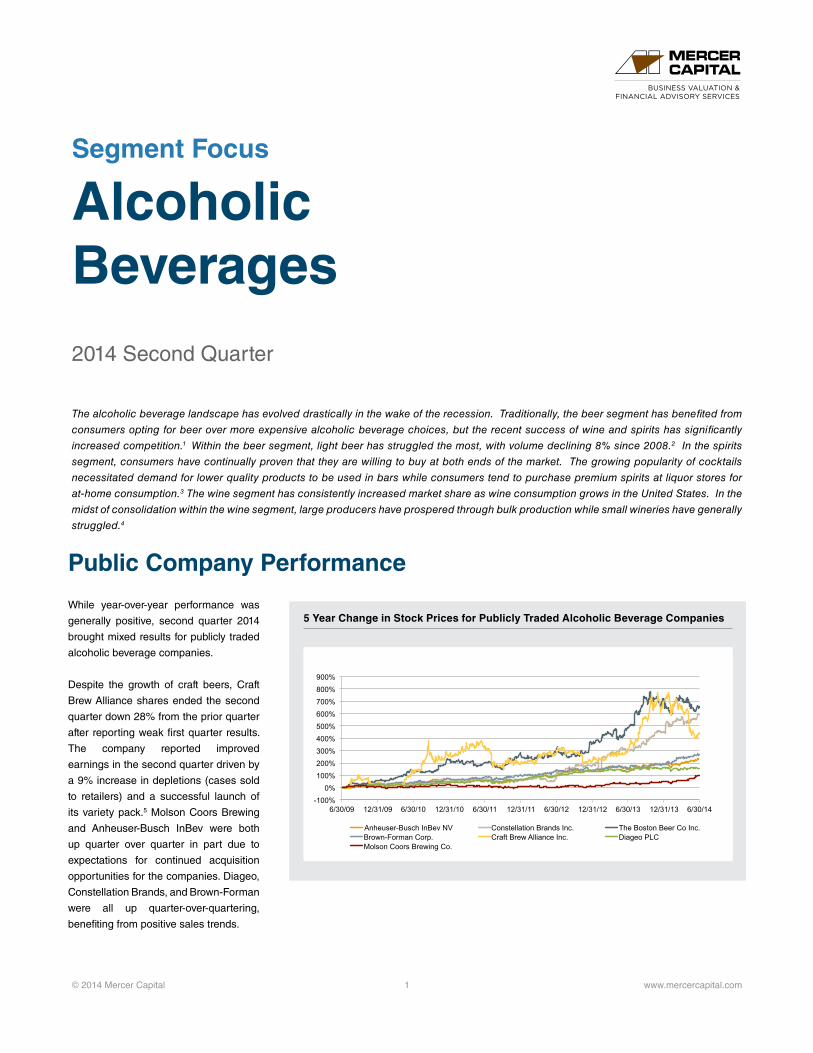
Spirits
Spirits continue to perform well in the
U.S. as revenue and volume are up
3-5%. Growth is being driven across
price points as value, premium, high end,
and super premium spirits all had volume
growth.
Growth has been driven by a number
of factors including the premiumization
trend, constant innovation,and the emer-
gence of craft distilleries.10 The premi-
umization trend is largely a result of the
recession as consumers substituted top
shelf spirits in liquor stores for home
consumption rather than drinking at bars
or restaurants.11 Much of the innovation
in the segment is in the form of flavored
spirits which are beginning to garner
serious market share.12 Whiskey also
increased in popularity during 2013 with
annual dollar sales up over 10%.
Much like the beer segment, serious
legislative issues continue to affect spirit
distributors. According to the Wine and
Spirits Wholesalers of America, the ma-
jor legislative issues impacting the in-
dustry are flow through entity taxation,
LIFO repeal, and TTB reorganization.
The proposed legislation concerning
flow through entity taxation is of serious
interest to wholesalers as it could dras-
tically increase taxes for these types of
entities.13
$0
$5
$10
$15
$20
$25
2005 2006 2007 2008 2009 2010 2011 2012 2013 (Est.)
Revenue (billions of dollars)
U.S. Spirits Revenue
38.10% (76.8m cases)
36% (72.8m cases)
18% (36.3m cases)
7.90% (15.9m cases)
Value Premium High End Super Premium
U.S. Spirits Total Volume Share
19.20% ($4.1B)
34.30% ($7.3B)
28.20% ($6B)
18.30% ($3.9B)
Value Premium High End Super Premium
U.S. Spirits Total Revenue Share
Mercer Capital’s Value Focus: Food and Beverage Industry Second Quarter 2014
© 2014 Mercer Capital 6 www.mercercapital.com
Spirits (continued)
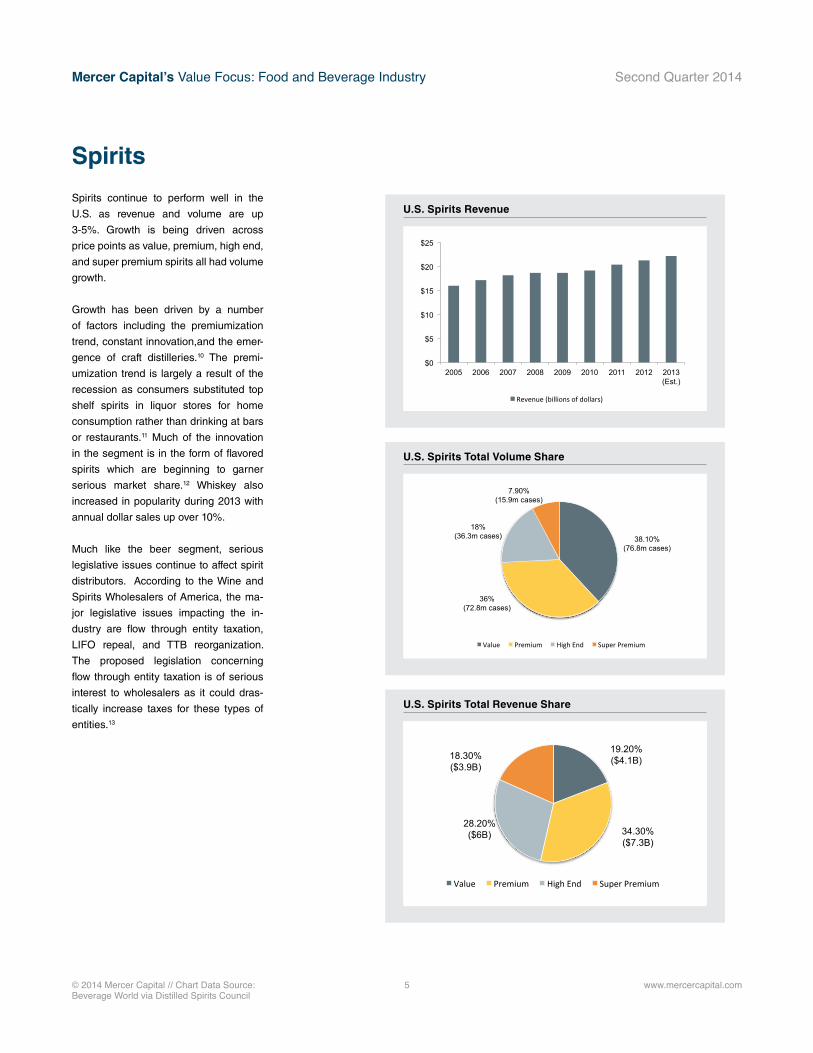
Spirits Global Market Share (%)
Company 2013 2012 2011 2010 2009 2008
Diageo PLC 4.86 4.91 4.57 4.34 4.37 4.40
Pernod-Ricard SA 4.50 4.50 4.49 4.50 4.38 4.53
UB Group 4.30 4.60 4.68 4.51 4.10 3.60
Hite Jinro Co Ltd 3.03 2.82 na na na na
Thai Beverage PCL 2.77 2.69 2.58 2.54 2.45 2.24
Bacardi Corp 1.71 1.74 1.77 1.79 1.80 1.81
Alliance Global Group Inc 1.54 1.58 1.14 0.69 0.51 0.54
Beam Inc 1.37 1.42 1.30 na na na
Lotte Chilsung Beverage Co Ltd 1.10 1.13 1.20 1.18 1.15 na
Russian Standard Corp 1.09 0.09 0.08 0.07 0.07 0.06
Others 73.74 74.53 78.20 80.38 81.18 82.83
Source: Bloomberg
Mercer Capital’s Value Focus: Food and Beverage Industry Second Quarter 2014
© 2014 Mercer Capital // Chart Data Source: The Wine Institute
7 www.mercercapital.com
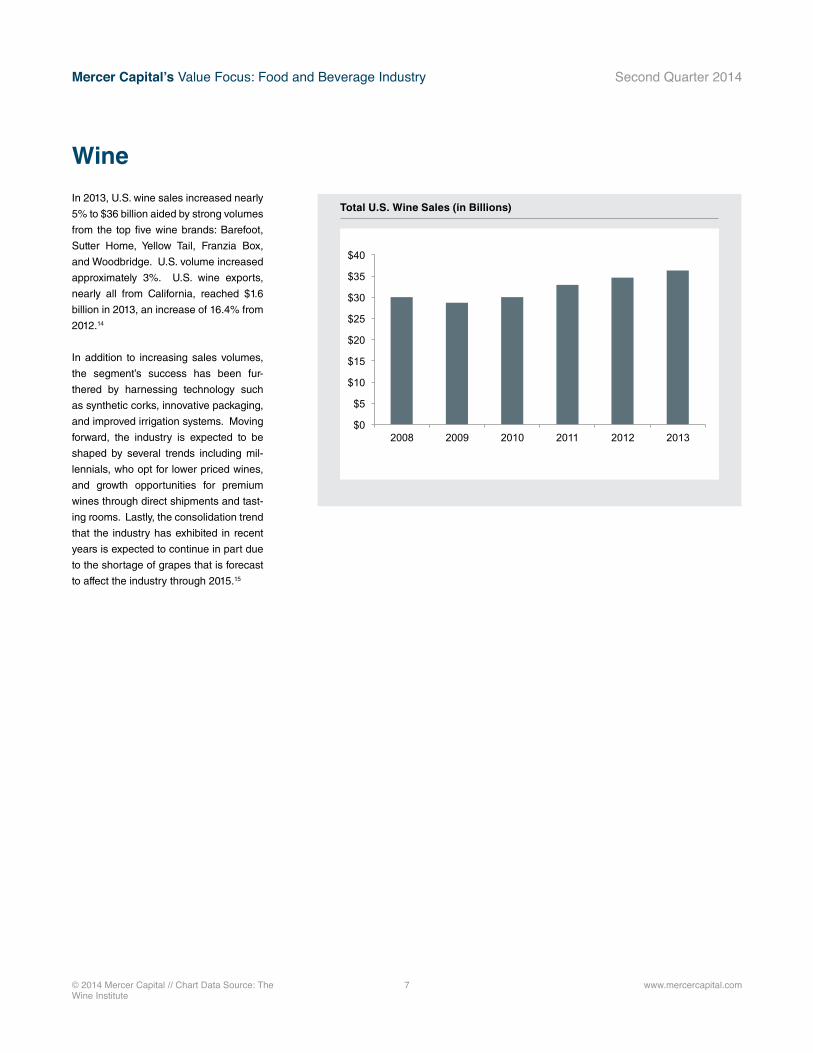
Wine
In 2013, U.S. wine sales increased nearly
5% to $36 billion aided by strong volumes
from the top five wine brands: Barefoot,
Sutter Home, Yellow Tail, Franzia Box,
and Woodbridge. U.S. volume increased
approximately 3%. U.S. wine exports,
nearly all from California, reached $1.6
billion in 2013, an increase of 16.4% from
2012.14
In addition to increasing sales volumes,
the segment’s success has been fur-
thered by harnessing technology such
as synthetic corks, innovative packaging,
and improved irrigation systems. Moving
forward, the industry is expected to be
shaped by several trends including mil-
lennials, who opt for lower priced wines,
and growth opportunities for premium
wines through direct shipments and tast-
ing rooms. Lastly, the consolidation trend
that the industry has exhibited in recent
years is expected to continue in part due
to the shortage of grapes that is forecast
to affect the industry through 2015.15
$0
$5
$10
$15
$20
$25
$30
$35
$40
2008 2009 2010 2011 2012 2013
Revenue (in billions)
Total U.S. Wine Sales (in Billions)

Mercer Capital’s Value Focus: Food and Beverage Industry Second Quarter 2014
© 2014 Mercer Capital 8 www.mercercapital.com
Wine (continued)
Wine Global Market Share (%)
Company 2013 2012 2011 2010 2009 2008
E&J Gallo Winery 2.74 2.63 2.58 2.52 2.48 2.53
Constellation Brands Inc 2.08 2.01 1.90 2.78 2.79 3.17
Wine Group Inc/The 1.61 1.71 1.66 1.62 1.65 1.64
Vina Concha y Toro SA 0.99 0.99 0.98 0.91 0.89 0.85
Grupo Penaflor SA 0.98 0.79 0.77 0.77 0.81 0.76
Pernod-Ricard SA 0.88 0.88 0.88 0.88 0.98 1.06
Treasury Wine Estates Ltd 0.96 0.96 1.01 na na na
Castel Group/The 0.96 0.94 0.93 0.93 0.95 0.95
Accolade Wines Ltd 0.95 0.97 1.02 na na na
Caviro Distillerie Srl 0.60 0.60 0.61 0.62 0.63 0.64
Others 87.24 87.51 87.67 88.97 88.81 88.40
Source: Bloomberg

Mercer Capital’s Value Focus: Food and Beverage Industry Second Quarter 2014
© 2014 Mercer Capital 9 www.mercercapital.com
As measured by the Bloomberg Global Food Index, food companies
outperformed the market in the Q2, up 5.9% for the quarter compared
to 4.7% for the S&P 500. Performance for beverage companies con-
tinued to be soft, with the Bloomberg Beverage Index up only 3.7%
for the quarter.
The second quarter brought plenty of deal activity as companies
sought to continue consolidation and expand into growing trends.
Subsequent to the close of the second quarter, Tyson Foods for-
mally announced its acquisition of Hillshire Brands for $7.7 billion
winning a months-long bidding war against Pilgrim’s Pride which
ultimately ended in an auction. The deal represents approximately
1.97x Hillshire’s 2013 revenues.16 Meanwhile, Coca-Cola announced
an increase of its ownership of Keurig Green Mountain from 10% to
16%. Keurig Green Mountain also announced a partnership with The
J.M. Smucker Company (owner of several coffee brands including
Folger’s).17
Restaurants reported weak performance in Q2. Same-stores sales
increased just 1.4% from the prior quarter in part due to declining traf-
fic. Slow dinner and weekend performance and fewer sales of alco-
holic beverages contributed to lackluster sales growth. Moderate
sales growth for quick-service and fine dining restaurants appeared
to come at the cost of casual restaurants, where same-store sales
declined 0.1%. An increase in the Consumer Confidence Index as
well as continued U.S. job growth are expected to improve sales
during the back half of the year.18
General Food & Beverage Overview
1 “Breweries in the US,” IBISWorld, June 2014. 2 “Impact Databank: Light Beer Heads Toward 10-Year Low As
Other Categories Steal Share,” Shanken News Daily,
Online, Available http://www.shankennewsdaily.com/index.
php/2014/07/03/9821/impact-databank-light-beer-heads-toward-
10-year-low-as-other-categories-steal-share/.3 “Distilleries in the US, IBISWorld, February 2014.4 “Wineries in the US,” IBISWorld, May 2014. 5 “Craft Brew Alliance Announces Second Quarter 2014 Results,”
Business Wire. 6 “Revealing Beer Statistics,” All About Beer Magazine, Volume 35,
Issue 2.7 “Federal Issues,” NBWA, Online, Available http://nbwa.org/feder
al-issues, Accessed July 25, 2014. 8 “State of the Beverage Market 2013,” Beverage World, May 2013. 9 “Breweries in the US,” IBISWorld, June 2014.10 “State of the Beverage Market 2013,” Beverage World, May 2013. 11 “Distilleries in the US, IBISWorld, February 2014.12 “New Amsterdam Spirits Adds to its Flavored Vodka Portfolio,”
BEVNET, Online, Available http://www.bevnet.com/news/spir
its/2014/new-amsterdam-spirits-adds-to-its-flavored-vodka-portfo
lio/, Accessed July 30, 2014.
13 “Government Affairs,” WSWA, Online, Available http://www.wswa.
org/government-affairs/federal-issues, Accessed July 28, 2014. 14 “California Wine Sales Grow 3% by Volume and 5% by Value
in the U.S. in 2013,” Wine Institute, Online, Available http://www.
wineinstitute.org/resources/pressroom/04242014.15 “Wineries in the US,” IBIS World, May 2014.16 “Restaurant sales, traffic rebound in March,” Nation’s Restaurant
News, Online, Available http://nrn.com/rpi/nra-restaurant-sales-
traffic-rebound-march.17 “Can Consumer Staples Rebound?” Zacks, Online, Available
http://www.zacks.com/commentary/32930/can-consumer-sta
ples-rebound.18 “Report: Restaurant sakes fare poorly in June,” Nation’s Restau
rant News, Online, Available http://nrn.com/millerpulse/report-
restaurant-sales-fare-poorly-june.
References and Data Sources

Mercer Capital’s Value Focus: Food and Beverage Industry Second Quarter 2014
© 2014 Mercer Capital // Data Source: Bloomberg 10 www.mercercapital.com
-20%
0%
20%
40%
60%
80%
100%
9/30/09 3/31/10 9/30/10 3/31/11 9/30/11 3/31/12 9/30/12 3/31/13 9/30/13 3/31/14
Bloomberg Food Index S&P 500
9.99
7.31 7.69 8.3 9.3 9.69
12.44 12.1 12.74
2007 2008 2009 2010 2011 2012 2013 Q1 2014 Q2 2014
Change in Bloomberg Global Food Index vs. S&P 500
Historical EV/EBITDA Multiple for Global Food Index
Examples of companies in Bloomberg’s Global Food Index include Grupo Bimbo, Kikkoman, ConAgra Foods, Hillshire Brands, Tyson Foods,
General Mills, Diamond Foods, Sanderson Farms, Kellogg, Nestle, and Hormel Food Corp.

Mercer Capital’s Value Focus: Food and Beverage Industry Second Quarter 2014
© 2014 Mercer Capital // Data Source: Bloomberg 11 www.mercercapital.com
Examples of companies in Bloomberg’s Global Food Index include Grupo Bimbo, Kikkoman, ConAgra Foods, Hillshire Brands, Tyson Foods,
General Mills, Diamond Foods, Sanderson Farms, Kellogg, Nestle, and Hormel Food Corp.
-20%
0%
20%
40%
60%
80%
100%
120%
140%
9/30/09 3/31/10 9/30/10 3/31/11 9/30/11 3/31/12 9/30/12 3/31/13 9/30/13 3/31/14
Bloomberg Beverage Index S&P 500
Historical EV / EBITDA MultipleBloomberg Beverage Index
8.51 9.57
10.96 10.29 10.81 11.44 11.85 11.48
2008 2009 2010 2011 2012 2013 Q1 2014 Q2 2014
Change in Bloomberg Beverage Index vs. S&P 500
Historical EV/EBITDA Multiple for Beverage Index

© 2014 Mercer Capital // www.mercercapital.com 12
Mercer Capital’s Value Focus: Food and Beverage Industry Second Quarter 2014
Appendix A: Public Company Performance & Pricing
Food Processors
Food Processors TickerPrice at 6/30/14
High Price
6/30/14
% of High
6/30/14EV/
RevenueEV/
EBITDA Enterprise
Value LTM
RevenueLTM
EBITDA
Forward Revenue YE 2014
Forward EBITDA YE 2014
Revenue Growth
(from LTM)
EBITDA Growth
(from LTM)
PepsiCo Inc PEP $89.34 $90.10 99.2% 2.5 13.4 167,881.7 66,544.0 12,521.0 67,133.1 12,968.7 0.9% 3.6%
ConAgra Foods Inc CAG $29.68 $37.23 79.7% 1.2 13.8 21,516.0 17,742.2 1,561.2 17,719.8 2,348.5 -0.1% 50.4%
Grupo Bimbo SAB de CV GRBMF $38.07 $45.80 83.1% 1.3 14.7 239,627.3 179,151.4 16,310.6 190,010.6 19,786.1 6.1% 21.3%
Tyson Foods Inc TSN $37.54 $44.01 85.3% 0.4 7.3 15,039.1 36,369.0 2,054.0 37,340.1 2,162.0 2.7% 5.3%
Hormel Foods Corp HRL $49.35 $49.76 99.2% 1.5 13.4 13,274.9 8,970.3 990.2 9,279.6 1,045.4 3.4% 5.6%
Sanderson Farms Inc SAFM $97.20 $97.30 99.9% 0.8 6.1 2,272.3 2,711.6 369.8 2,781.3 448.0 2.6% 21.1%
Darden Restaurants Inc DRI $46.27 $54.47 84.9% 1.1 10.9 8,877.5 8,091.6 811.3 8,780.2 945.8 8.5% 16.6%
Unilever NV UN $43.76 $44.31 98.8% 2.8 15.1 137,714.4 48,395.0 9,096.0 50,224.6 8,365.6 3.8% -8.0%
Nestle SA NESN $68.70 $71.50 96.1% 2.7 14.2 244,921.8 90,166.0 17,307.0 92,233.9 17,495.0 2.3% 1.1%
Average $55.55 $59.39 91.8% 1.6 12.1 94,569.5 50,904.6 6,780.1 52,833.7 7,285.0 3.3% 13.0%
Median $46.27 $49.76 96.1% 1.3 13.4 21,516.0 36,369.0 2,054.0 37,340.1 2,348.5 2.7% 5.6%
Source: Bloomberg

© 2014 Mercer Capital // www.mercercapital.com 13
Mercer Capital’s Value Focus: Food and Beverage Industry Second Quarter 2014
Appendix A: Public Company Performance & Pricing
Restaurants
Restaurants TickerPrice at 6/30/14
High Price
6/30/14
% of High
6/30/14EV/
RevenueEV/
EBITDA Enterprise
Value LTM
RevenueLTM
EBITDA
Forward Revenue YE 2014
Forward EBITDA YE 2014
Revenue Growth
(from LTM)
EBITDA Growth
(from LTM)
Frisch's Restaurants Inc FRS $23.60 $26.44 89.3% 0.6 6.0 135.3 209.2 22.4 206.0 na -1.5% nm
Ruby Tuesday Inc RT $7.59 $9.90 76.7% 0.6 34.6 725.2 1,168.7 21.0 1,165.3 39.8 -0.3% 89.6%
Darden Restaurants Inc DRI $46.27 $55.25 83.7% 1.1 10.9 8,877.5 8,091.6 811.3 8,780.2 945.8 8.5% 16.6%
Denny's Corp DENN $6.52 $7.51 86.8% 1.6 10.7 739.3 458.1 69.1 464.8 81.7 1.5% 18.2%
Bob Evans Farms Inc/DE BOBE $50.05 $60.22 83.1% 1.2 13.1 1,634.1 1,328.6 125.0 1,334.5 142.7 0.4% 14.2%
DineEquity Inc DIN $79.49 $85.74 92.7% 4.5 11.3 2,880.4 646.9 254.0 644.0 270.3 -0.4% 6.4%
Red Robin Gourmet Burgers Inc RRGB $71.20 $86.83 82.0% 1.1 10.2 1,104.7 1,051.4 108.1 1,148.8 118.9 9.3% 10.0%
Cracker Barrel Old Country Store Inc CBRL $99.57 $118.63 83.9% 1.0 10.2 2,771.8 2,665.0 270.7 2,679.6 283.8 0.5% 4.8%
Average $48.04 $56.31 84.8% 1.5 13.4 2,358.5 1,952.4 210.2 2,052.9 269.0 2.2% 22.8%
Median $48.16 $57.73 83.8% 1.1 10.8 1,369.4 1,110.1 116.5 1,157.0 142.7 0.5% 14.2%
Source: Bloomberg

© 2014 Mercer Capital // www.mercercapital.com 14
Mercer Capital’s Value Focus: Food and Beverage Industry Second Quarter 2014
Non-Alcoholic Beverages
Non-Alcoholic Beverages TickerPrice at 6/30/14
High Price
6/30/14
% of High
6/30/14EV/
RevenueEV/
EBITDA Enterprise
Value LTM
RevenueLTM
EBITDA
Forward Revenue YE 2014
Forward EBITDA YE 2014
Revenue Growth
(from LTM)
EBITDA Growth
(from LTM)
PepsiCo Inc PEP $89.34 $90.10 99.2% 2.5 13.4 167,881.7 66,544.0 12,521.0 67,133.1 12,968.7 0.9% 3.6%
Dr Pepper Snapple Group Inc DPS $58.58 $60.22 97.3% 2.3 10.0 14,063.1 6,035.0 1,408.0 6,038.3 1,396.6 0.1% -0.8%
National Beverage Corp FIZZ $18.92 $21.47 88.1% 1.4 11.9 903.8 641.1 76.1 na na nm nm
Coca-Cola Co/The KO $42.36 $43.43 97.5% 4.9 18.6 225,991.6 46,220.0 12,120.0 46,655.7 13,173.9 0.9% 8.7%
Monster Beverage Corp MNST $71.03 $74.79 95.0% 5.0 17.6 11,874.2 2,354.6 676.3 2,454.2 725.7 4.2% 7.3%
Starbucks Corp SBUX $77.38 $82.50 93.8% 3.7 18.0 60,160.5 16,062.1 3,340.3 16,500.0 3,771.2 2.7% 12.9%
Average $59.60 $62.09 95.1% 3.3 14.9 80,145.8 22,976.1 5,023.6 27,756.3 6,407.2 1.8% 6.3%
Median $64.81 $67.51 96.1% 3.1 15.5 37,111.8 11,048.6 2,374.2 16,500.0 3,771.2 0.9% 7.3%
Source: Bloomberg
Appendix A: Public Company Performance & Pricing
© 2014 Mercer Capital // www.mercercapital.com 15
Mercer Capital’s Value Focus: Food and Beverage Industry Second Quarter 2014
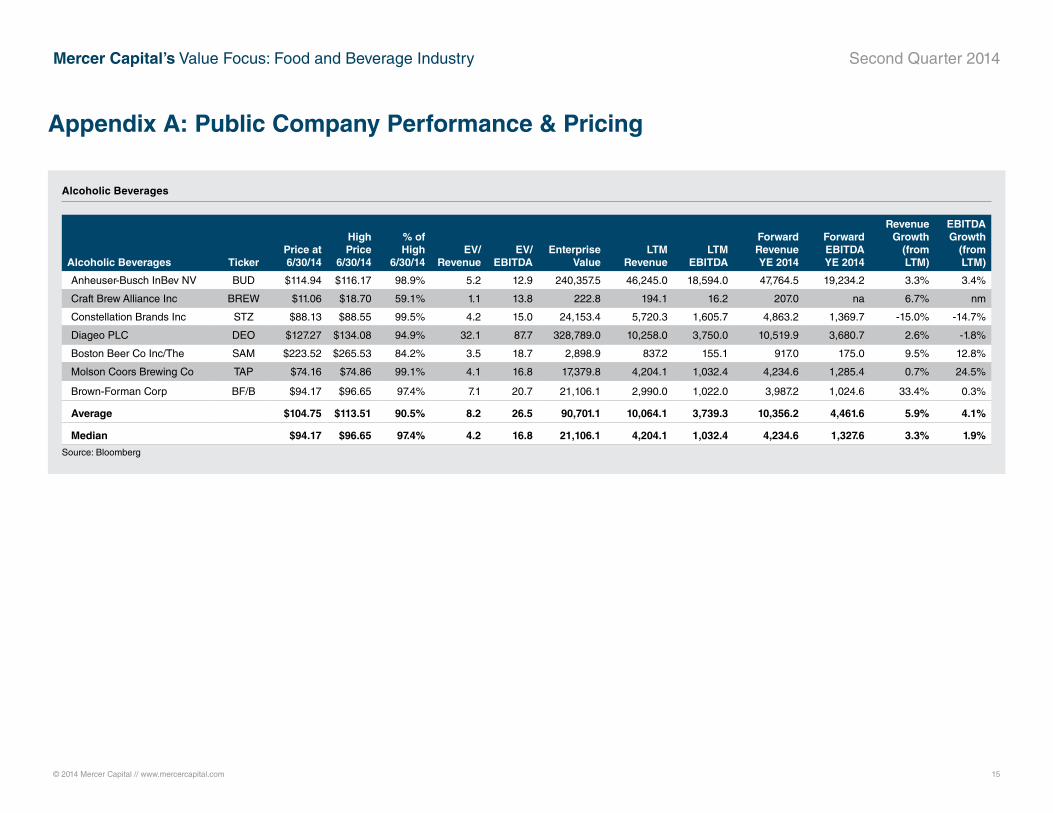
Alcoholic Beverages
Alcoholic Beverages TickerPrice at 6/30/14
High Price
6/30/14
% of High
6/30/14EV/
RevenueEV/
EBITDA Enterprise
Value LTM
RevenueLTM
EBITDA
Forward Revenue YE 2014
Forward EBITDA YE 2014
Revenue Growth
(from LTM)
EBITDA Growth
(from LTM)
Anheuser-Busch InBev NV BUD $114.94 $116.17 98.9% 5.2 12.9 240,357.5 46,245.0 18,594.0 47,764.5 19,234.2 3.3% 3.4%
Craft Brew Alliance Inc BREW $11.06 $18.70 59.1% 1.1 13.8 222.8 194.1 16.2 207.0 na 6.7% nm
Constellation Brands Inc STZ $88.13 $88.55 99.5% 4.2 15.0 24,153.4 5,720.3 1,605.7 4,863.2 1,369.7 -15.0% -14.7%
Diageo PLC DEO $127.27 $134.08 94.9% 32.1 87.7 328,789.0 10,258.0 3,750.0 10,519.9 3,680.7 2.6% -1.8%
Boston Beer Co Inc/The SAM $223.52 $265.53 84.2% 3.5 18.7 2,898.9 837.2 155.1 917.0 175.0 9.5% 12.8%
Molson Coors Brewing Co TAP $74.16 $74.86 99.1% 4.1 16.8 17,379.8 4,204.1 1,032.4 4,234.6 1,285.4 0.7% 24.5%
Brown-Forman Corp BF/B $94.17 $96.65 97.4% 7.1 20.7 21,106.1 2,990.0 1,022.0 3,987.2 1,024.6 33.4% 0.3%
Average $104.75 $113.51 90.5% 8.2 26.5 90,701.1 10,064.1 3,739.3 10,356.2 4,461.6 5.9% 4.1%
Median $94.17 $96.65 97.4% 4.2 16.8 21,106.1 4,204.1 1,032.4 4,234.6 1,327.6 3.3% 1.9%
Source: Bloomberg
Appendix A: Public Company Performance & Pricing

Mercer CapitalFood & Beverage Industry Services
Contact Us
Copyright © 2014 Mercer Capital Management, Inc. All rights reserved. It is illegal under Federal law to reproduce this publication or any portion of its contents without the publisher’s permission. Media
quotations with source attribution are encouraged. Reporters requesting additional information or editorial comment should contact Barbara Walters Price at 901.685.2120. Mercer Capital’s Industry
Focus is published quarterly and does not constitute legal or financial consulting advice. It is offered as an information service to our clients and friends. Those interested in specific guidance for legal or
accounting matters should seek competent professional advice. Inquiries to discuss specific valuation matters are welcomed. To add your name to our mailing list to receive this complimentary publication,
visit our web site at www.mercercapital.com.
Mercer Capital has expertise providing business valuation and financial advisory services to companies in the food and beverage industry.
Industry Segments
Mercer Capital serves the following industry segments:
• Food processing
• Restaurants
• Nonalcoholic Beverages
• Malt, Wine, and Spirits
Services Provided
• Valuation of food and beverage industry companies
• Transaction advisory for acquisitions and divestitures
• Valuations for purchase accounting and impairment testing
• Fairness and solvency opinions
• Litigation support for economic damages and valuation and shareholder disputes
Contact a Mercer Capital professional to discuss your needs in confidence.
Matthew R. Crow, CFA, [email protected]
Timothy R. Lee, [email protected]
Nicholas J. Heinz, [email protected]
Travis W. Harms, CFA, CPA/[email protected]
Mercer Capital5100 Poplar Avenue, Suite 2600Memphis, Tennessee 38137901.685.2120 (P)
www.mercercapital.com
BUSINESS VALUATION & FINANCIAL ADVISORY SERVICES