Embed Size (px)
Citation preview
VALUE FOCUS
Healthcare Facilities
Mid-Year 2016
Overview 1
Industry Perspectives 2
Macroeconomic Trends 3
Valuation Trends 6
Mergers & Acquisitions 8
Trends 8
Transactions Summary 9
Public Company Pricing 13
About Mercer Capital 19
www.mercercapital.com
Mercer Capital’s Value Focus: Healthcare Facilities Industry Mid-Year 2016
© 2016 Mercer Capital 1 www.mercercapital.com
Healthcare facilities sector performance generally declined
compared to the broader markets through the trailing twelve
month period ended June 30, 2016, though performance
improved in certain sectors. For example, the current
emphasis on admitting patients into lower acuity settings has
benefited the homecare and hospice subsector, which has
capitalized on providing limited but specialized services at
profitable operating levels. This shift to lower acuity, how-
ever, has weighed on traditional healthcare facility sectors
that incur considerable overhead expense.
Potential political headwinds have also weighed on
healthcare facilities, brought on by broad-based calls to
reign in drug prices and healthcare costs. Healthcare
facilities continue to adapt to new payment models seeking
to emphasize results rather than (the number of) procedures.
International Statistical Classification of Diseases (ICD-10)
implementation will require compliance with the new coding
and data collection guidelines at additional costs to healthcare
providers. Other factors that pose risks to the sector include
a decreasing supply of doctors and healthcare professionals
and cuts to Federal Medicare and Medicaid outlays.
Despite these risks, current valuation trends and expecta-
tions are positive for healthcare facilities. A stable, growing
economy and favorable industry dynamics will likely continue
to benefit the sector over the longer term.
Overview
Mercer Capital’s Value Focus: Healthcare Facilities Industry Mid-Year 2016
© 2016 Mercer Capital 2 www.mercercapital.com
Industry Perspectives
Reimbursement Raises
“…[W]e start negotiating and discussing with the state the
fact that if they are going to raise the minimum wage then
we need to have a corresponding increase to our reimburse-
ment. We will continue… where we have this pressure to visit
with the reimbursement source and try to make sure that we
are able to obtain revenue increases to take care of this. But
on the other hand… one of the things we are trying to do as
a company through use of technology in our operations, is to
become more efficient as it relates to serving our consumers.”
Dirk Allison
President and CEO
Addus HomeCare Corporation (NASDAQ: ADUS)
on potential minimum wage increases and
increasing efficiencies 1
Value-Based Payments
“…[A]s expected CMS issued a new bundled payment
program for heart attacks and bypass surgery. This pro-
gram defers from the existing CJR bundle and that these
patients have chronic conditions with high post discharge
readmissions. These are exactly the types of patients that
we have the ability to positively impact... We believe there
are opportunities to reduce readmissions to the hospitals and
also shift patients out of nursing homes in to Home Health…
Additionally, CMS has also added hip and femur fractures
to the CJR program that took effect in April. Overall, we are
excited about these developments which we believe present
a large opportunity for Home Health.”
Paul Kusserow
President and CEO
AMEDISYS, Inc. (NASDAQ: AMED)
on opportunities regarding push towards
lower-acuity admittance 2
Horizontal Integration?
“[HCA] has a strategy to enhance the clinical complexion
of our facilities. And by that, I mean advancing into deeper
capabilities. In many markets, we are adding the service
lines I’ll call horizontally where we bring on new capabilities
in cardiovascular care, oncology, pediatrics… [V]ertically,
we’re deepening those capabilities inside of existing service
lines. All intended on being able to keep a patient some-
where in the HCA system if they need deeper care or more
complex care.”
Milton Johnson
Chairman and CEO, HCA Holdings, Inc. (NYSE: HCA)
on company strategy to increase care offerings 3
Regulators: Sit and Watch
“I remain very concerned about the rapid rate of consolida-
tion among healthcare providers… Most provider mergers
are not anticompetitive, but the few that are could cause sig-
nificant competitive harm.”
Edith Ramirez
Federal Trade Commission Chairman
in keynote address at The Antitrust in
Healthcare Conference 4
Mercer Capital’s Value Focus: Healthcare Facilities Industry Mid-Year 2016
© 2016 Mercer Capital 3 www.mercercapital.com
Macroeconomic Trends
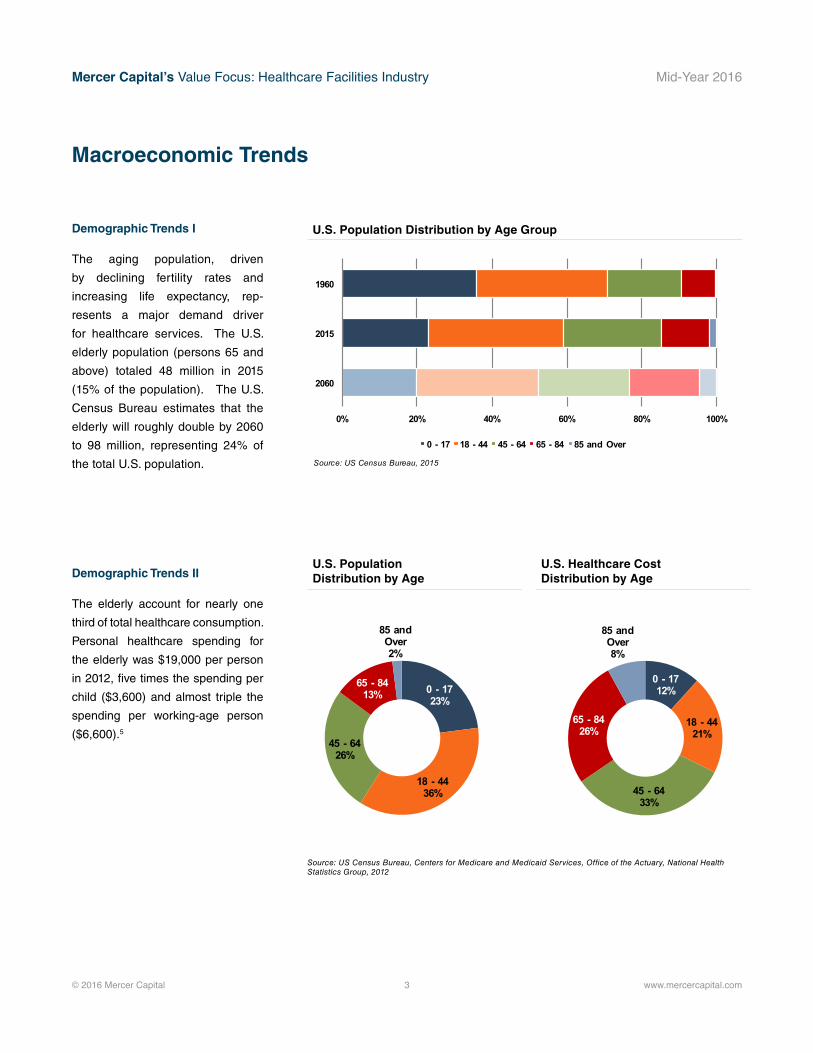
U.S. Population Distribution by Age
U.S. Healthcare Cost Distribution by Age
0 - 1723%
18 - 4436%
45 - 6426%
65 - 8413%
85 and Over2%
0 - 1712%
18 - 4421%
45 - 6433%
65 - 8426%
85 and Over8%
Demographic Trends II
The elderly account for nearly one
third of total healthcare consumption.
Personal healthcare spending for
the elderly was $19,000 per person
in 2012, five times the spending per
child ($3,600) and almost triple the
spending per working-age person
($6,600).5
U.S. Population Distribution by Age Group
0% 20% 40% 60% 80% 100%
2060
2015
1960
0 - 17 18 - 44 45 - 64 65 - 84 85 and Over
Source: US Census Bureau, 2015
Demographic Trends I
The aging population, driven
by declining fertility rates and
increasing life expectancy, rep-
resents a major demand driver
for healthcare services. The U.S.
elderly population (persons 65 and
above) totaled 48 million in 2015
(15% of the population). The U.S.
Census Bureau estimates that the
elderly will roughly double by 2060
to 98 million, representing 24% of
the total U.S. population.
Source: US Census Bureau, Centers for Medicare and Medicaid Services, Office of the Actuary, National Health Statistics Group, 2012
Mercer Capital’s Value Focus: Healthcare Facilities Industry Mid-Year 2016
© 2016 Mercer Capital 4 www.mercercapital.com
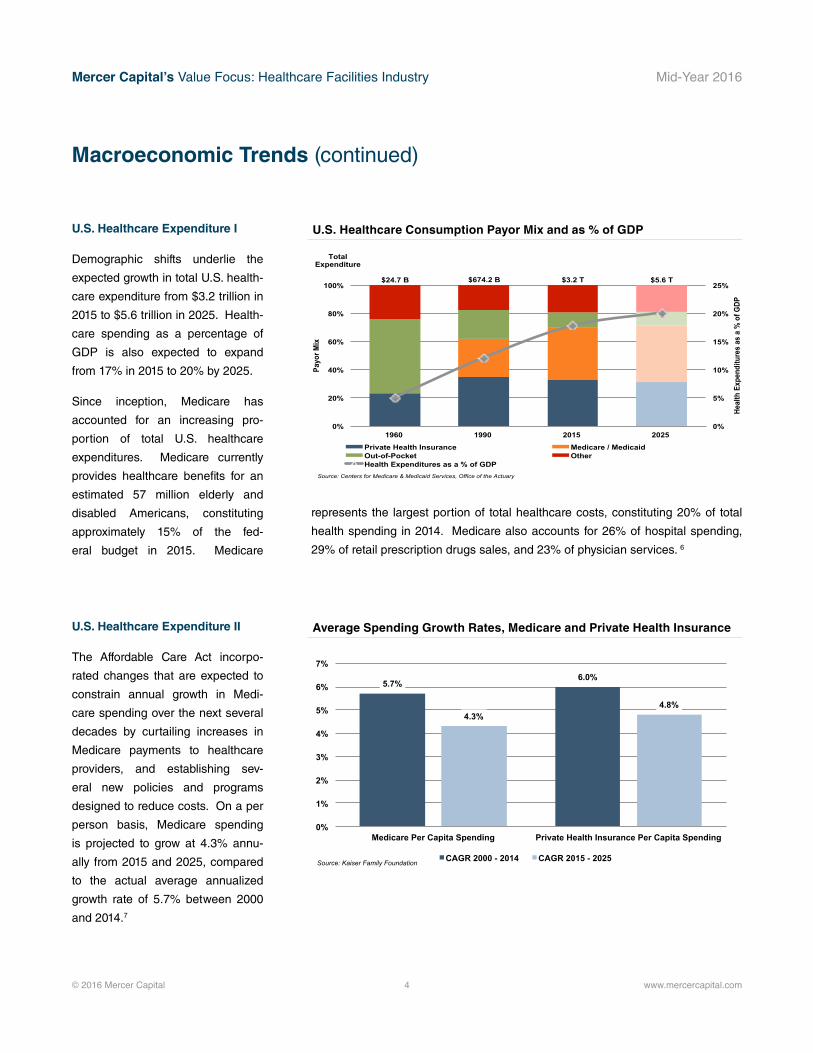
U.S. Healthcare Expenditure I
Demographic shifts underlie the
expected growth in total U.S. health-
care expenditure from $3.2 trillion in
2015 to $5.6 trillion in 2025. Health-
care spending as a percentage of
GDP is also expected to expand
from 17% in 2015 to 20% by 2025.
Since inception, Medicare has
accounted for an increasing pro-
portion of total U.S. healthcare
expenditures. Medicare currently
provides healthcare benefits for an
estimated 57 million elderly and
disabled Americans, constituting
approximately 15% of the fed-
eral budget in 2015. Medicare
U.S. Healthcare Consumption Payor Mix and as % of GDP
0%
5%
10%
15%
20%
25%
0%
20%
40%
60%
80%
100%
1960 1990 2015 2025
Heal
th E
xpen
ditu
res
as a
% o
f GDP
Payo
r Mix
Private Health Insurance Medicare / Medicaid Out-of-Pocket Other Health Expenditures as a % of GDP
Source: Centers for Medicare & Medicaid Services, Office of the Actuary
$24.7 B $674.2 B $3.2 T $5.6 T
Total Expenditure
Macroeconomic Trends (continued)
Average Spending Growth Rates, Medicare and Private Health Insurance
5.7% 6.0%
4.3% 4.8%
0%
1%
2%
3%
4%
5%
6%
7%
Medicare Per Capita Spending Private Health Insurance Per Capita Spending
CAGR 2000 - 2014 CAGR 2015 - 2025 Source: Kaiser Family Foundation
U.S. Healthcare Expenditure II
The Affordable Care Act incorpo-
rated changes that are expected to
constrain annual growth in Medi-
care spending over the next several
decades by curtailing increases in
Medicare payments to healthcare
providers, and establishing sev-
eral new policies and programs
designed to reduce costs. On a per
person basis, Medicare spending
is projected to grow at 4.3% annu-
ally from 2015 and 2025, compared
to the actual average annualized
growth rate of 5.7% between 2000
and 2014.7
represents the largest portion of total healthcare costs, constituting 20% of total
health spending in 2014. Medicare also accounts for 26% of hospital spending,
29% of retail prescription drugs sales, and 23% of physician services. 6
Mercer Capital’s Value Focus: Healthcare Facilities Industry Mid-Year 2016
© 2016 Mercer Capital 5 www.mercercapital.com
Macroeconomic Trends (continued)
Health Insurance Enrollment Totals
78%
80%
82%
84%
86%
88%
90%
92%
94%
0
50
100
150
200
250
300
350
400
2009 2010 2011 2012 2013 2014 2015 2016 2017 2018 2019 2020 2021 2022 2023 2024 2025
(% o
f per
sons
insu
red)
(milli
ons
of p
erso
ns)
Total Enrollment Insured Share of US Population
Source: Centers for Medicare & Medicaid Services, Office of the Actuary, National Health Statistics GroupMercer Capital Analysis
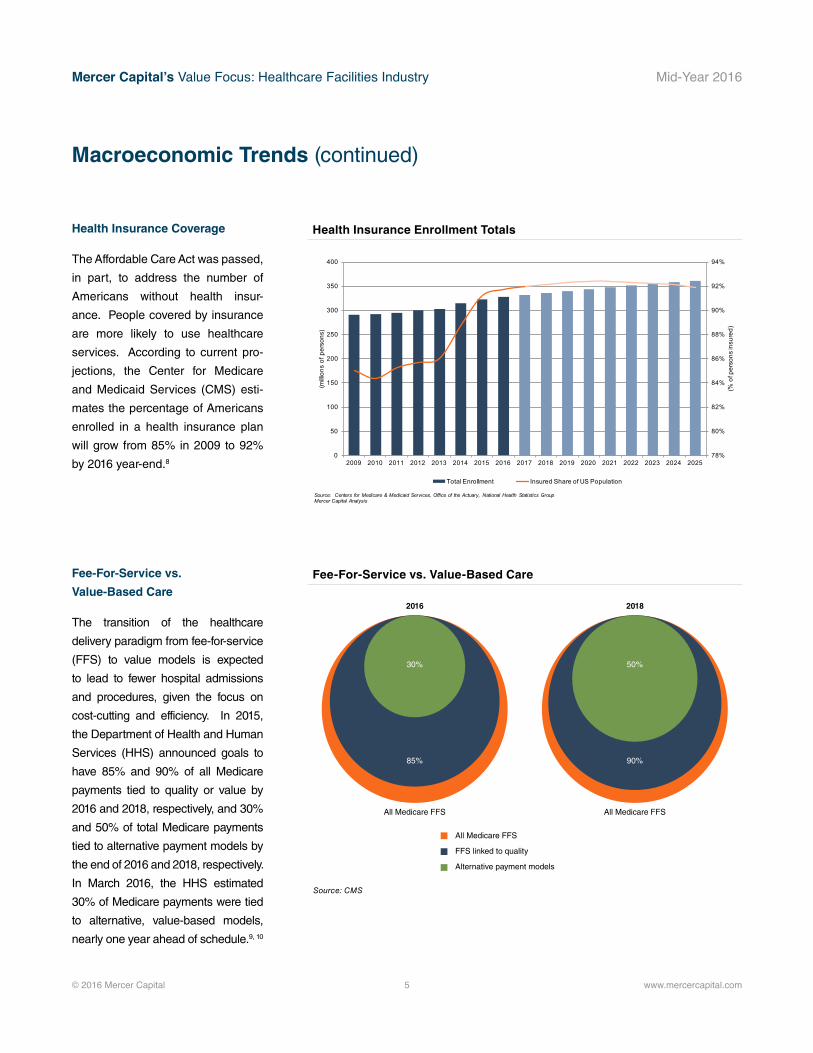
Health Insurance Coverage
The Affordable Care Act was passed,
in part, to address the number of
Americans without health insur-
ance. People covered by insurance
are more likely to use healthcare
services. According to current pro-
jections, the Center for Medicare
and Medicaid Services (CMS) esti-
mates the percentage of Americans
enrolled in a health insurance plan
will grow from 85% in 2009 to 92%
by 2016 year-end.8
Fee-For-Service vs. Value-Based CareFee-For-Service vs.
Value-Based Care
The transition of the healthcare
delivery paradigm from fee-for-service
(FFS) to value models is expected
to lead to fewer hospital admissions
and procedures, given the focus on
cost-cutting and efficiency. In 2015,
the Department of Health and Human
Services (HHS) announced goals to
have 85% and 90% of all Medicare
payments tied to quality or value by
2016 and 2018, respectively, and 30%
and 50% of total Medicare payments
tied to alternative payment models by
the end of 2016 and 2018, respectively.
In March 2016, the HHS estimated
30% of Medicare payments were tied
to alternative, value-based models,
nearly one year ahead of schedule.9, 10
Source: CMS
2016 2018
Alternative payment models
FFS linked to quality
All Medicare FFS
30% 50%
85% 90%
All Medicare FFS All Medicare FFS
Mercer Capital’s Value Focus: Healthcare Facilities Industry Mid-Year 2016
© 2016 Mercer Capital 6 www.mercercapital.com
Valuation Trends
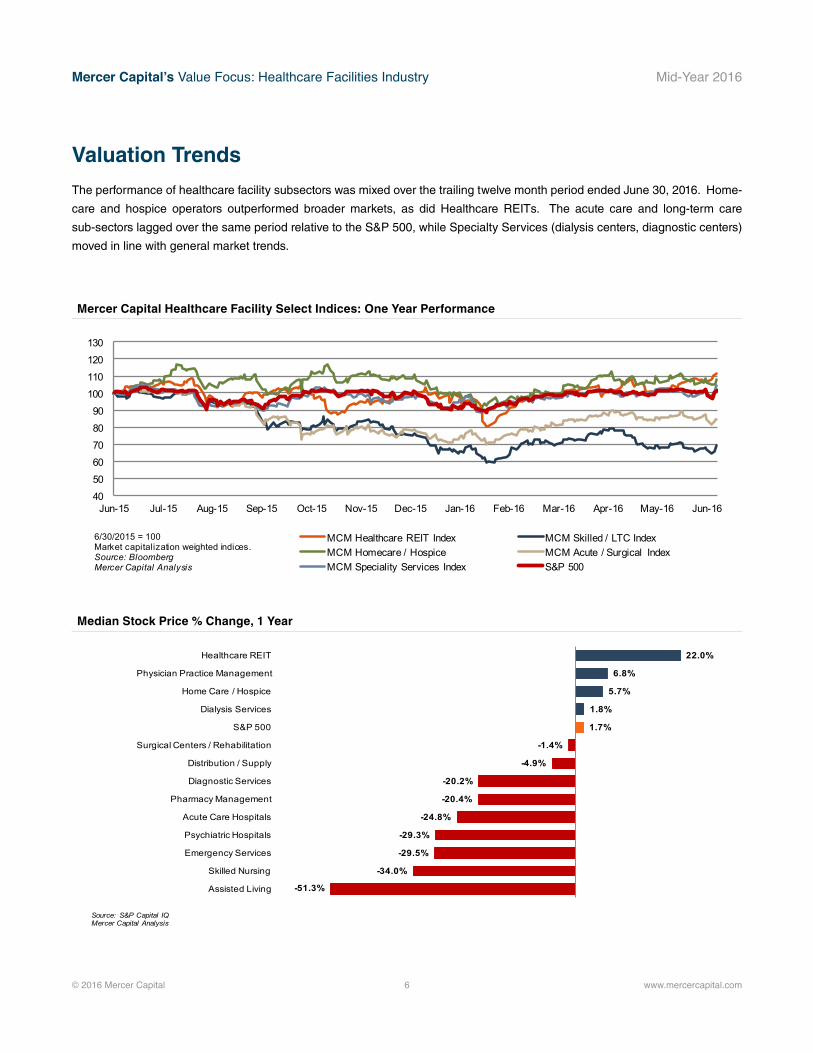
The performance of healthcare facility subsectors was mixed over the trailing twelve month period ended June 30, 2016. Home-
care and hospice operators outperformed broader markets, as did Healthcare REITs. The acute care and long-term care
sub-sectors lagged over the same period relative to the S&P 500, while Specialty Services (dialysis centers, diagnostic centers)
moved in line with general market trends.
405060708090
100110120130
Jun-15 Jul-15 Aug-15 Sep-15 Oct-15 Nov-15 Dec-15 Jan-16 Feb-16 Mar-16 Apr-16 May-16 Jun-16
MCM Healthcare REIT Index MCM Skilled / LTC IndexMCM Homecare / Hospice MCM Acute / Surgical IndexMCM Speciality Services Index S&P 500
6/30/2015 = 100Market capitalization weighted indices. Source: BloombergMercer Capital Analysis
Mercer Capital Healthcare Facility Select Indices: One Year Performance
Median Stock Price % Change, 1 Year
-51.3%
-34.0%
-29.5%
-29.3%
-24.8%
-20.4%
-20.2%
-4.9%
-1.4%
1.7%
1.8%
5.7%
6.8%
22.0%
Assisted Living
Skilled Nursing
Emergency Services
Psychiatric Hospitals
Acute Care Hospitals
Pharmacy Management
Diagnostic Services
Distribution / Supply
Surgical Centers / Rehabilitation
S&P 500
Dialysis Services
Home Care / Hospice
Physician Practice Management
Healthcare REIT
Source: S&P Capital IQMercer Capital Analysis
Mercer Capital’s Value Focus: Healthcare Facilities Industry Mid-Year 2016
© 2016 Mercer Capital 7 www.mercercapital.com
Valuation Trends (continued)
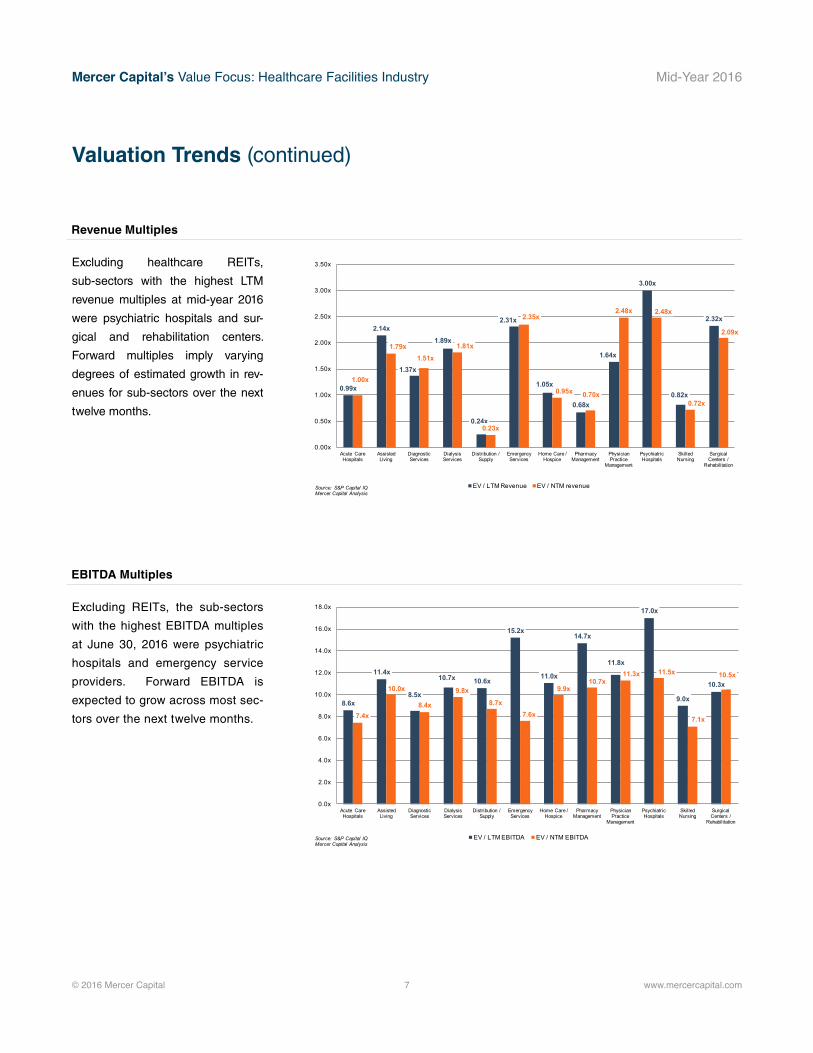
Excluding healthcare REITs,
sub-sectors with the highest LTM
revenue multiples at mid-year 2016
were psychiatric hospitals and sur-
gical and rehabilitation centers.
Forward multiples imply varying
degrees of estimated growth in rev-
enues for sub-sectors over the next
twelve months.
Excluding REITs, the sub-sectors
with the highest EBITDA multiples
at June 30, 2016 were psychiatric
hospitals and emergency service
providers. Forward EBITDA is
expected to grow across most sec-
tors over the next twelve months.
Revenue Multiples
EBITDA Multiples
0.99x
2.14x
1.37x
1.89x
0.24x
2.31x
1.05x
0.68x
1.64x
3.00x
0.82x
2.32x
1.00x
1.79x1.51x
1.81x
0.23x
2.35x
0.95x 0.70x
2.48x 2.48x
0.72x
2.09x
0.00x
0.50x
1.00x
1.50x
2.00x
2.50x
3.00x
3.50x
Acute Care Hospitals
Assisted Living
Diagnostic Services
Dialysis Services
Distribution / Supply
Emergency Services
Home Care / Hospice
Pharmacy Management
Physician Practice
Management
Psychiatric Hospitals
Skilled Nursing
Surgical Centers /
Rehabilitation
EV / LTM Revenue EV / NTM revenueSource: S&P Capital IQMercer Capital Analysis
8.6x
11.4x
8.5x
10.7x 10.6x
15.2x
11.0x
14.7x
11.8x
17.0x
9.0x
10.3x
7.4x
10.0x
8.4x
9.8x8.7x
7.6x
9.9x10.7x
11.3x 11.5x
7.1x
10.5x
0.0x
2.0x
4.0x
6.0x
8.0x
10.0x
12.0x
14.0x
16.0x
18.0x
Acute Care Hospitals
Assisted Living
Diagnostic Services
Dialysis Services
Distribution / Supply
Emergency Services
Home Care / Hospice
Pharmacy Management
Physician Practice
Management
Psychiatric Hospitals
Skilled Nursing
Surgical Centers /
Rehabilitation
EV / LTM EBITDA EV / NTM EBITDASource: S&P Capital IQMercer Capital Analysis
Mercer Capital’s Value Focus: Healthcare Facilities Industry Mid-Year 2016
© 2016 Mercer Capital 8 www.mercercapital.com
Mergers & Acquisitions
Trends
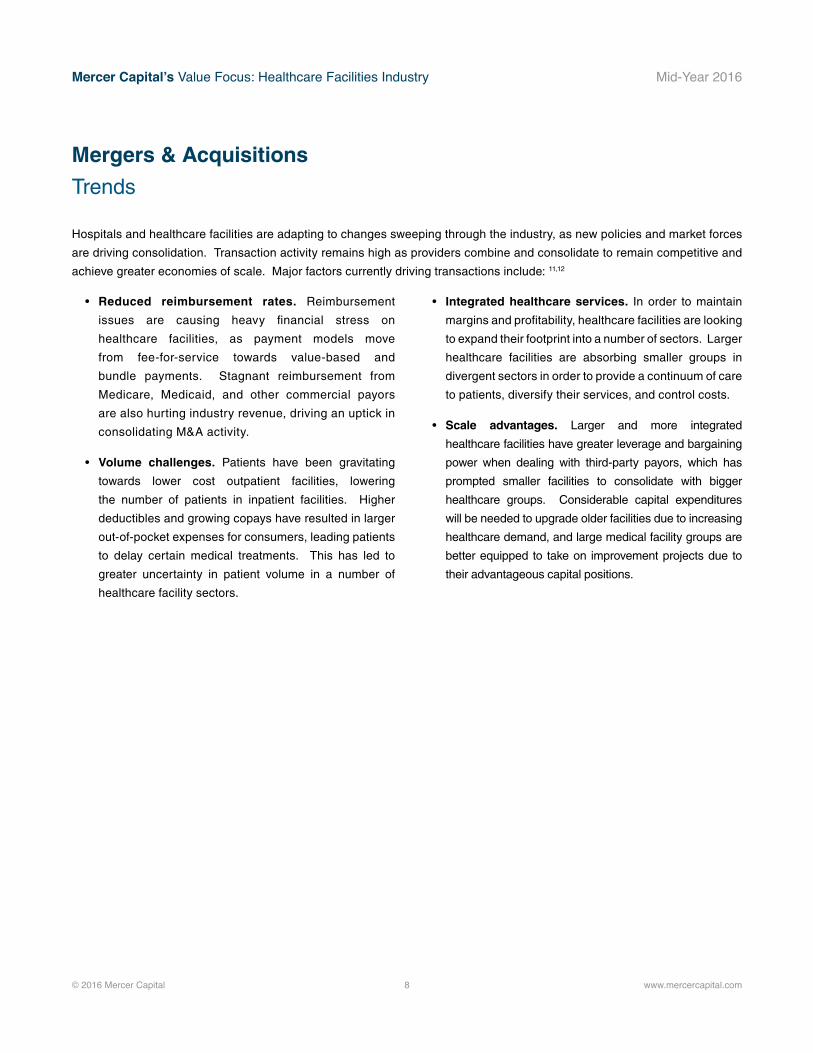
• Reduced reimbursement rates. Reimbursement
issues are causing heavy financial stress on
healthcare facilities, as payment models move
from fee-for-service towards value-based and
bundle payments. Stagnant reimbursement from
Medicare, Medicaid, and other commercial payors
are also hurting industry revenue, driving an uptick in
consolidating M&A activity.
• Volume challenges. Patients have been gravitating
towards lower cost outpatient facilities, lowering
the number of patients in inpatient facilities. Higher
deductibles and growing copays have resulted in larger
out-of-pocket expenses for consumers, leading patients
to delay certain medical treatments. This has led to
greater uncertainty in patient volume in a number of
healthcare facility sectors.
• Integrated healthcare services. In order to maintain
margins and profitability, healthcare facilities are looking
to expand their footprint into a number of sectors. Larger
healthcare facilities are absorbing smaller groups in
divergent sectors in order to provide a continuum of care
to patients, diversify their services, and control costs.
• Scale advantages. Larger and more integrated
healthcare facilities have greater leverage and bargaining
power when dealing with third-party payors, which has
prompted smaller facilities to consolidate with bigger
healthcare groups. Considerable capital expenditures
will be needed to upgrade older facilities due to increasing
healthcare demand, and large medical facility groups are
better equipped to take on improvement projects due to
their advantageous capital positions.
Hospitals and healthcare facilities are adapting to changes sweeping through the industry, as new policies and market forces
are driving consolidation. Transaction activity remains high as providers combine and consolidate to remain competitive and
achieve greater economies of scale. Major factors currently driving transactions include: 11,12
Mercer Capital’s Value Focus: Healthcare Facilities Industry Mid-Year 2016
© 2016 Mercer Capital 9 www.mercercapital.com
Buyer / Acquirer Target / SellerAnnounce
DateClose Date
Implied Enterprise
Value($ millions)
Implied Enterprise Value /
EBITDA Revenue
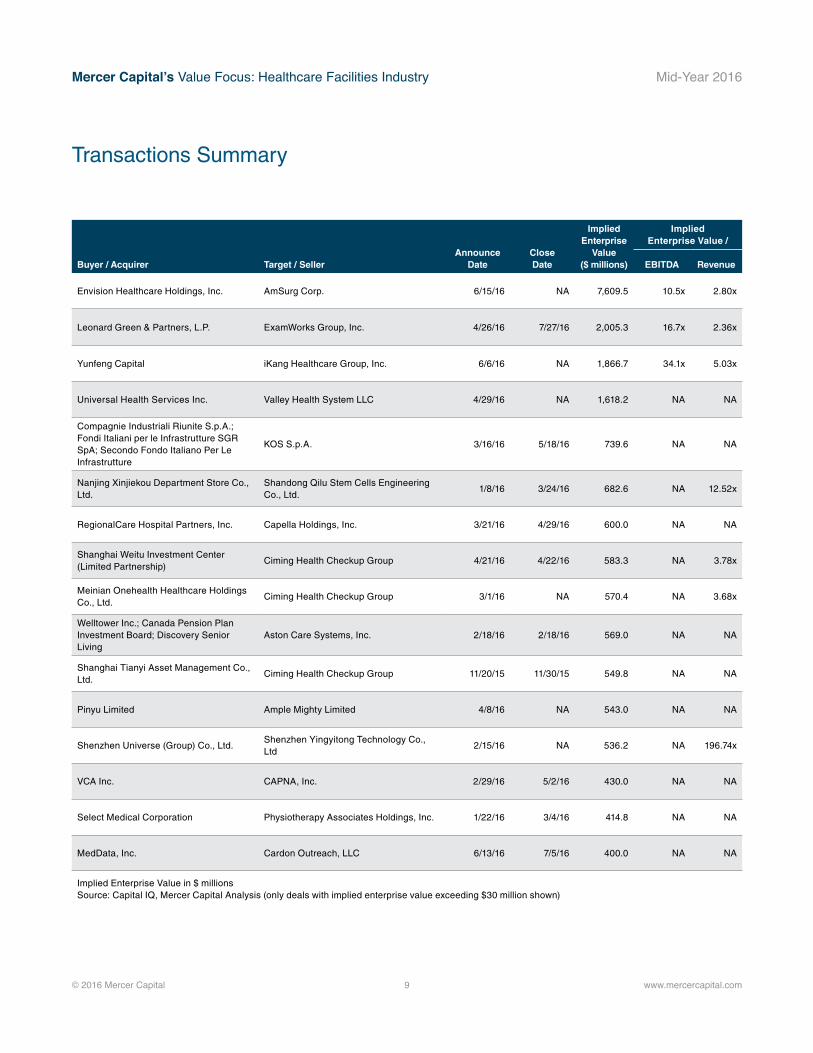
Envision Healthcare Holdings, Inc. AmSurg Corp. 6/15/16 NA 7,609.5 10.5x 2.80x
Leonard Green & Partners, L.P. ExamWorks Group, Inc. 4/26/16 7/27/16 2,005.3 16.7x 2.36x
Yunfeng Capital iKang Healthcare Group, Inc. 6/6/16 NA 1,866.7 34.1x 5.03x
Universal Health Services Inc. Valley Health System LLC 4/29/16 NA 1,618.2 NA NA
Compagnie Industriali Riunite S.p.A.; Fondi Italiani per le Infrastrutture SGR SpA; Secondo Fondo Italiano Per Le Infrastrutture
KOS S.p.A. 3/16/16 5/18/16 739.6 NA NA
Nanjing Xinjiekou Department Store Co., Ltd.
Shandong Qilu Stem Cells Engineering Co., Ltd.
1/8/16 3/24/16 682.6 NA 12.52x
RegionalCare Hospital Partners, Inc. Capella Holdings, Inc. 3/21/16 4/29/16 600.0 NA NA
Shanghai Weitu Investment Center (Limited Partnership)
Ciming Health Checkup Group 4/21/16 4/22/16 583.3 NA 3.78x
Meinian Onehealth Healthcare Holdings Co., Ltd.
Ciming Health Checkup Group 3/1/16 NA 570.4 NA 3.68x
Welltower Inc.; Canada Pension Plan Investment Board; Discovery Senior Living
Aston Care Systems, Inc. 2/18/16 2/18/16 569.0 NA NA
Shanghai Tianyi Asset Management Co., Ltd.
Ciming Health Checkup Group 11/20/15 11/30/15 549.8 NA NA
Pinyu Limited Ample Mighty Limited 4/8/16 NA 543.0 NA NA
Shenzhen Universe (Group) Co., Ltd.Shenzhen Yingyitong Technology Co., Ltd
2/15/16 NA 536.2 NA 196.74x
VCA Inc. CAPNA, Inc. 2/29/16 5/2/16 430.0 NA NA
Select Medical Corporation Physiotherapy Associates Holdings, Inc. 1/22/16 3/4/16 414.8 NA NA
MedData, Inc. Cardon Outreach, LLC 6/13/16 7/5/16 400.0 NA NA
Implied Enterprise Value in $ millions Source: Capital IQ, Mercer Capital Analysis (only deals with implied enterprise value exceeding $30 million shown)
Transactions Summary
Mercer Capital’s Value Focus: Healthcare Facilities Industry Mid-Year 2016
© 2016 Mercer Capital 10 www.mercercapital.com
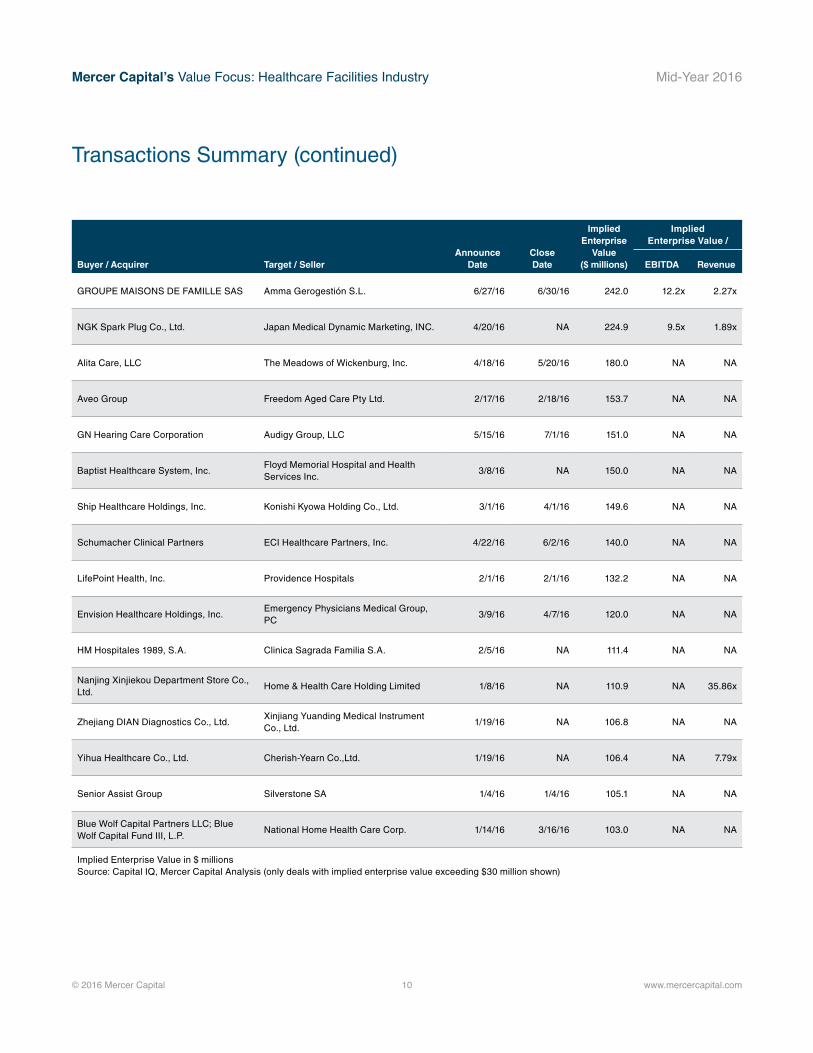
Transactions Summary (continued)
Buyer / Acquirer Target / SellerAnnounce
DateClose Date
Implied Enterprise
Value($ millions)
Implied Enterprise Value /
EBITDA Revenue
GROUPE MAISONS DE FAMILLE SAS Amma Gerogestión S.L. 6/27/16 6/30/16 242.0 12.2x 2.27x
NGK Spark Plug Co., Ltd. Japan Medical Dynamic Marketing, INC. 4/20/16 NA 224.9 9.5x 1.89x
Alita Care, LLC The Meadows of Wickenburg, Inc. 4/18/16 5/20/16 180.0 NA NA
Aveo Group Freedom Aged Care Pty Ltd. 2/17/16 2/18/16 153.7 NA NA
GN Hearing Care Corporation Audigy Group, LLC 5/15/16 7/1/16 151.0 NA NA
Baptist Healthcare System, Inc.Floyd Memorial Hospital and Health Services Inc.
3/8/16 NA 150.0 NA NA
Ship Healthcare Holdings, Inc. Konishi Kyowa Holding Co., Ltd. 3/1/16 4/1/16 149.6 NA NA
Schumacher Clinical Partners ECI Healthcare Partners, Inc. 4/22/16 6/2/16 140.0 NA NA
LifePoint Health, Inc. Providence Hospitals 2/1/16 2/1/16 132.2 NA NA
Envision Healthcare Holdings, Inc.Emergency Physicians Medical Group, PC
3/9/16 4/7/16 120.0 NA NA
HM Hospitales 1989, S.A. Clinica Sagrada Familia S.A. 2/5/16 NA 111.4 NA NA
Nanjing Xinjiekou Department Store Co., Ltd.
Home & Health Care Holding Limited 1/8/16 NA 110.9 NA 35.86x
Zhejiang DIAN Diagnostics Co., Ltd.Xinjiang Yuanding Medical Instrument Co., Ltd.
1/19/16 NA 106.8 NA NA
Yihua Healthcare Co., Ltd. Cherish-Yearn Co.,Ltd. 1/19/16 NA 106.4 NA 7.79x
Senior Assist Group Silverstone SA 1/4/16 1/4/16 105.1 NA NA
Blue Wolf Capital Partners LLC; Blue Wolf Capital Fund III, L.P.
National Home Health Care Corp. 1/14/16 3/16/16 103.0 NA NA
Implied Enterprise Value in $ millions Source: Capital IQ, Mercer Capital Analysis (only deals with implied enterprise value exceeding $30 million shown)
Mercer Capital’s Value Focus: Healthcare Facilities Industry Mid-Year 2016
© 2016 Mercer Capital 11 www.mercercapital.com
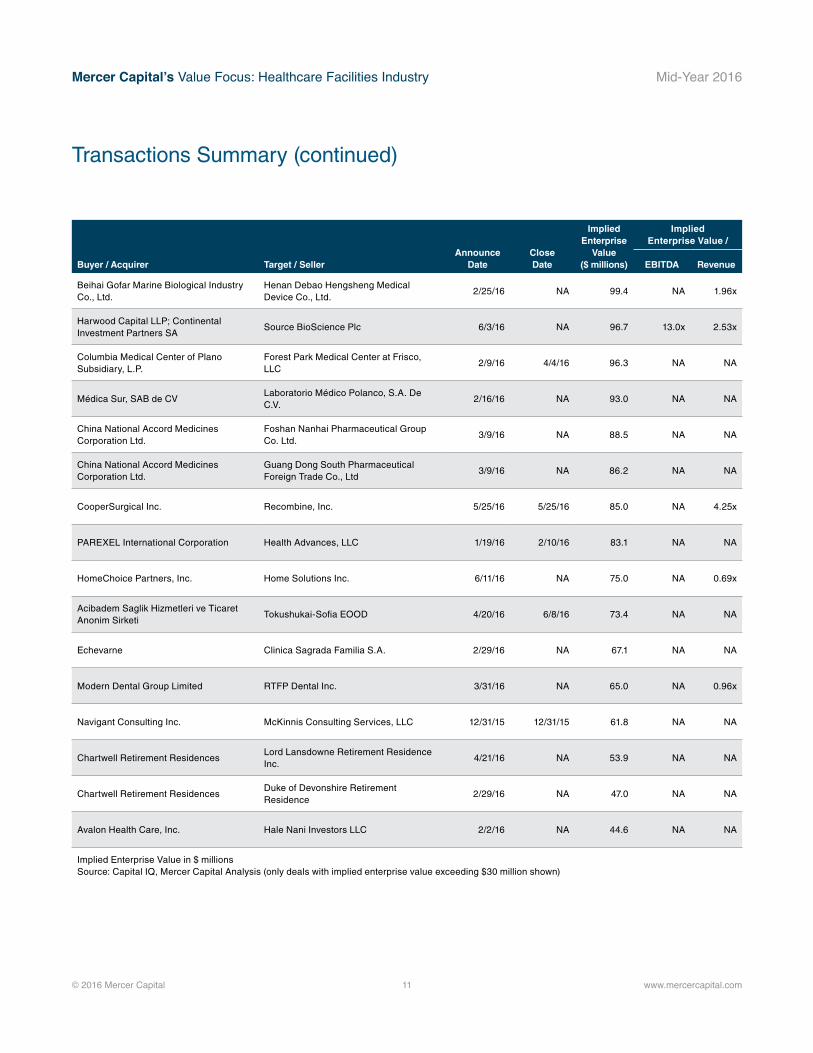
Transactions Summary (continued)
Buyer / Acquirer Target / SellerAnnounce
DateClose Date
Implied Enterprise
Value($ millions)
Implied Enterprise Value /
EBITDA Revenue
Beihai Gofar Marine Biological Industry Co., Ltd.
Henan Debao Hengsheng Medical Device Co., Ltd.
2/25/16 NA 99.4 NA 1.96x
Harwood Capital LLP; Continental Investment Partners SA
Source BioScience Plc 6/3/16 NA 96.7 13.0x 2.53x
Columbia Medical Center of Plano Subsidiary, L.P.
Forest Park Medical Center at Frisco, LLC
2/9/16 4/4/16 96.3 NA NA
Médica Sur, SAB de CVLaboratorio Médico Polanco, S.A. De C.V.
2/16/16 NA 93.0 NA NA
China National Accord Medicines Corporation Ltd.
Foshan Nanhai Pharmaceutical Group Co. Ltd.
3/9/16 NA 88.5 NA NA
China National Accord Medicines Corporation Ltd.
Guang Dong South Pharmaceutical Foreign Trade Co., Ltd
3/9/16 NA 86.2 NA NA
CooperSurgical Inc. Recombine, Inc. 5/25/16 5/25/16 85.0 NA 4.25x
PAREXEL International Corporation Health Advances, LLC 1/19/16 2/10/16 83.1 NA NA
HomeChoice Partners, Inc. Home Solutions Inc. 6/11/16 NA 75.0 NA 0.69x
Acibadem Saglik Hizmetleri ve Ticaret Anonim Sirketi
Tokushukai-Sofia EOOD 4/20/16 6/8/16 73.4 NA NA
Echevarne Clinica Sagrada Familia S.A. 2/29/16 NA 67.1 NA NA
Modern Dental Group Limited RTFP Dental Inc. 3/31/16 NA 65.0 NA 0.96x
Navigant Consulting Inc. McKinnis Consulting Services, LLC 12/31/15 12/31/15 61.8 NA NA
Chartwell Retirement ResidencesLord Lansdowne Retirement Residence Inc.
4/21/16 NA 53.9 NA NA
Chartwell Retirement ResidencesDuke of Devonshire Retirement Residence
2/29/16 NA 47.0 NA NA
Avalon Health Care, Inc. Hale Nani Investors LLC 2/2/16 NA 44.6 NA NA
Implied Enterprise Value in $ millions Source: Capital IQ, Mercer Capital Analysis (only deals with implied enterprise value exceeding $30 million shown)
Mercer Capital’s Value Focus: Healthcare Facilities Industry Mid-Year 2016
© 2016 Mercer Capital 12 www.mercercapital.com
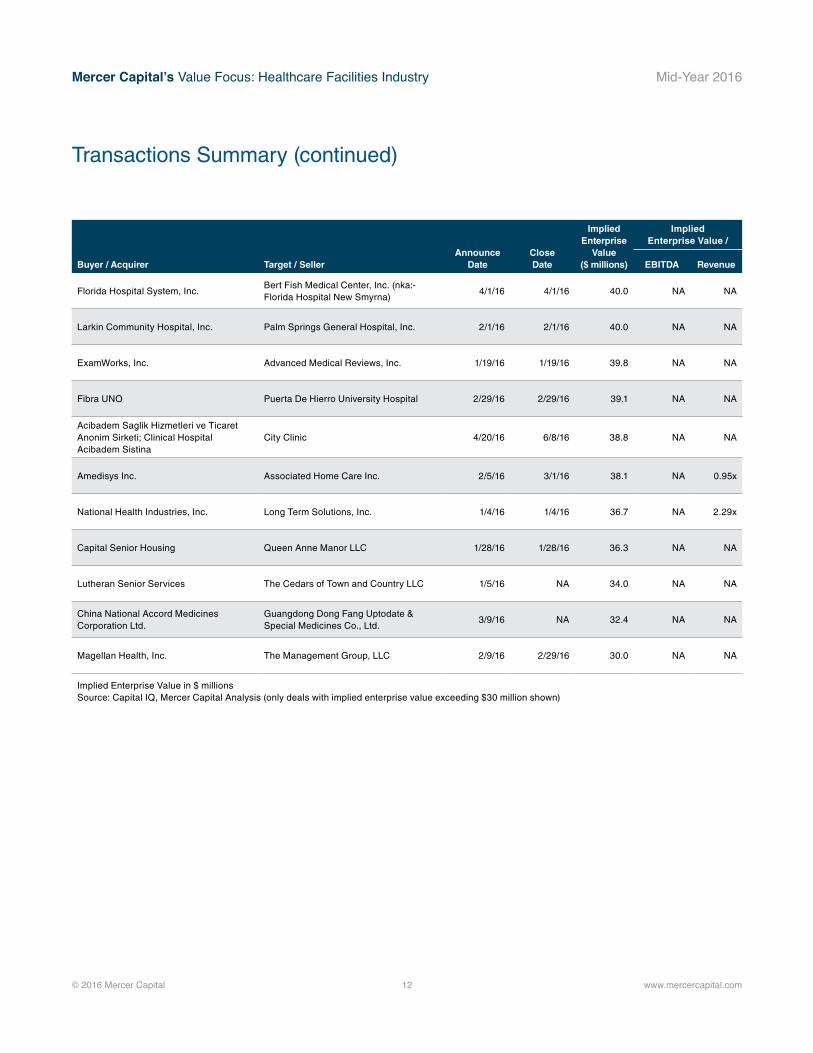
Transactions Summary (continued)
Buyer / Acquirer Target / SellerAnnounce
DateClose Date
Implied Enterprise
Value($ millions)
Implied Enterprise Value /
EBITDA Revenue
Florida Hospital System, Inc.Bert Fish Medical Center, Inc. (nka:-Florida Hospital New Smyrna)
4/1/16 4/1/16 40.0 NA NA
Larkin Community Hospital, Inc. Palm Springs General Hospital, Inc. 2/1/16 2/1/16 40.0 NA NA
ExamWorks, Inc. Advanced Medical Reviews, Inc. 1/19/16 1/19/16 39.8 NA NA
Fibra UNO Puerta De Hierro University Hospital 2/29/16 2/29/16 39.1 NA NA
Acibadem Saglik Hizmetleri ve Ticaret Anonim Sirketi; Clinical Hospital Acibadem Sistina
City Clinic 4/20/16 6/8/16 38.8 NA NA
Amedisys Inc. Associated Home Care Inc. 2/5/16 3/1/16 38.1 NA 0.95x
National Health Industries, Inc. Long Term Solutions, Inc. 1/4/16 1/4/16 36.7 NA 2.29x
Capital Senior Housing Queen Anne Manor LLC 1/28/16 1/28/16 36.3 NA NA
Lutheran Senior Services The Cedars of Town and Country LLC 1/5/16 NA 34.0 NA NA
China National Accord Medicines Corporation Ltd.
Guangdong Dong Fang Uptodate & Special Medicines Co., Ltd.
3/9/16 NA 32.4 NA NA
Magellan Health, Inc. The Management Group, LLC 2/9/16 2/29/16 30.0 NA NA
Implied Enterprise Value in $ millions Source: Capital IQ, Mercer Capital Analysis (only deals with implied enterprise value exceeding $30 million shown)
© 2016 Mercer Capital 13 www.mercercapital.com
Mercer Capital’s Value Focus: Healthcare Facilities Industry Mid-Year 2016
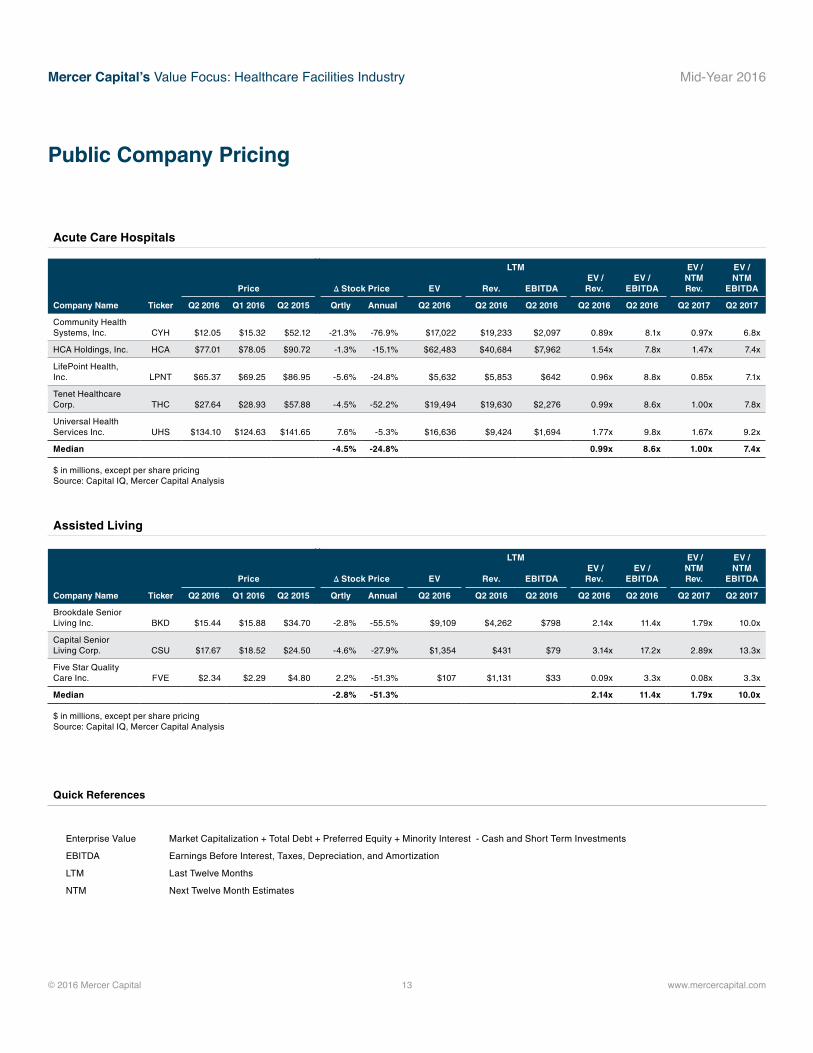
Public Company Pricing
Acute Care Hospitals
Assisted Living
LTM EV / Rev.
EV / EBITDA
EV / NTM Rev.
EV / NTM
EBITDAPrice ∆ Stock Price EV Rev. EBITDA
Company Name Ticker Q2 2016 Q1 2016 Q2 2015 Qrtly Annual Q2 2016 Q2 2016 Q2 2016 Q2 2016 Q2 2016 Q2 2017 Q2 2017
Community Health Systems, Inc. CYH $12.05 $15.32 $52.12 -21.3% -76.9% $17,022 $19,233 $2,097 0.89x 8.1x 0.97x 6.8x
HCA Holdings, Inc. HCA $77.01 $78.05 $90.72 -1.3% -15.1% $62,483 $40,684 $7,962 1.54x 7.8x 1.47x 7.4x
LifePoint Health, Inc. LPNT $65.37 $69.25 $86.95 -5.6% -24.8% $5,632 $5,853 $642 0.96x 8.8x 0.85x 7.1x
Tenet Healthcare Corp. THC $27.64 $28.93 $57.88 -4.5% -52.2% $19,494 $19,630 $2,276 0.99x 8.6x 1.00x 7.8x
Universal Health Services Inc. UHS $134.10 $124.63 $141.65 7.6% -5.3% $16,636 $9,424 $1,694 1.77x 9.8x 1.67x 9.2x
Median -4.5% -24.8% 0.99x 8.6x 1.00x 7.4x
$ in millions, except per share pricing Source: Capital IQ, Mercer Capital Analysis
Quick References
Enterprise Value Market Capitalization + Total Debt + Preferred Equity + Minority Interest - Cash and Short Term Investments
EBITDA Earnings Before Interest, Taxes, Depreciation, and Amortization
LTM Last Twelve Months
NTM Next Twelve Month Estimates
LTM EV / Rev.
EV / EBITDA
EV / NTM Rev.
EV / NTM
EBITDAPrice ∆ Stock Price EV Rev. EBITDA
Company Name Ticker Q2 2016 Q1 2016 Q2 2015 Qrtly Annual Q2 2016 Q2 2016 Q2 2016 Q2 2016 Q2 2016 Q2 2017 Q2 2017
Brookdale Senior Living Inc. BKD $15.44 $15.88 $34.70 -2.8% -55.5% $9,109 $4,262 $798 2.14x 11.4x 1.79x 10.0x
Capital Senior Living Corp. CSU $17.67 $18.52 $24.50 -4.6% -27.9% $1,354 $431 $79 3.14x 17.2x 2.89x 13.3x
Five Star Quality Care Inc. FVE $2.34 $2.29 $4.80 2.2% -51.3% $107 $1,131 $33 0.09x 3.3x 0.08x 3.3x
Median -2.8% -51.3% 2.14x 11.4x 1.79x 10.0x
$ in millions, except per share pricing Source: Capital IQ, Mercer Capital Analysis
© 2016 Mercer Capital 14 www.mercercapital.com
Mercer Capital’s Value Focus: Healthcare Facilities Industry Mid-Year 2016
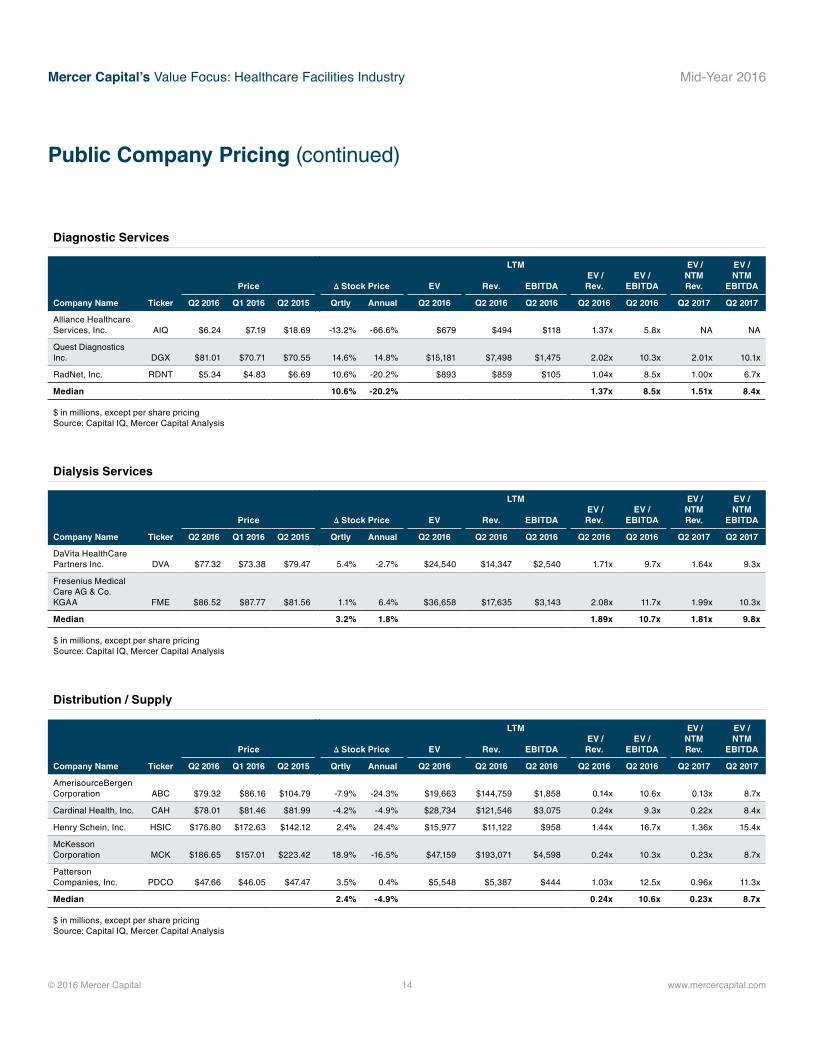
Diagnostic Services
Dialysis Services
Public Company Pricing (continued)
Distribution / Supply
LTM EV / Rev.
EV / EBITDA
EV / NTM Rev.
EV / NTM
EBITDAPrice ∆ Stock Price EV Rev. EBITDA
Company Name Ticker Q2 2016 Q1 2016 Q2 2015 Qrtly Annual Q2 2016 Q2 2016 Q2 2016 Q2 2016 Q2 2016 Q2 2017 Q2 2017
Alliance Healthcare Services, Inc. AIQ $6.24 $7.19 $18.69 -13.2% -66.6% $679 $494 $118 1.37x 5.8x NA NA
Quest Diagnostics Inc. DGX $81.01 $70.71 $70.55 14.6% 14.8% $15,181 $7,498 $1,475 2.02x 10.3x 2.01x 10.1x
RadNet, Inc. RDNT $5.34 $4.83 $6.69 10.6% -20.2% $893 $859 $105 1.04x 8.5x 1.00x 6.7x
Median 10.6% -20.2% 1.37x 8.5x 1.51x 8.4x
$ in millions, except per share pricing Source: Capital IQ, Mercer Capital Analysis
LTM EV / Rev.
EV / EBITDA
EV / NTM Rev.
EV / NTM
EBITDAPrice ∆ Stock Price EV Rev. EBITDA
Company Name Ticker Q2 2016 Q1 2016 Q2 2015 Qrtly Annual Q2 2016 Q2 2016 Q2 2016 Q2 2016 Q2 2016 Q2 2017 Q2 2017
DaVita HealthCare Partners Inc. DVA $77.32 $73.38 $79.47 5.4% -2.7% $24,540 $14,347 $2,540 1.71x 9.7x 1.64x 9.3x
Fresenius Medical Care AG & Co. KGAA FME $86.52 $87.77 $81.56 1.1% 6.4% $36,658 $17,635 $3,143 2.08x 11.7x 1.99x 10.3x
Median 3.2% 1.8% 1.89x 10.7x 1.81x 9.8x
$ in millions, except per share pricing Source: Capital IQ, Mercer Capital Analysis
LTM EV / Rev.
EV / EBITDA
EV / NTM Rev.
EV / NTM
EBITDAPrice ∆ Stock Price EV Rev. EBITDA
Company Name Ticker Q2 2016 Q1 2016 Q2 2015 Qrtly Annual Q2 2016 Q2 2016 Q2 2016 Q2 2016 Q2 2016 Q2 2017 Q2 2017
AmerisourceBergen Corporation ABC $79.32 $86.16 $104.79 -7.9% -24.3% $19,663 $144,759 $1,858 0.14x 10.6x 0.13x 8.7x
Cardinal Health, Inc. CAH $78.01 $81.46 $81.99 -4.2% -4.9% $28,734 $121,546 $3,075 0.24x 9.3x 0.22x 8.4x
Henry Schein, Inc. HSIC $176.80 $172.63 $142.12 2.4% 24.4% $15,977 $11,122 $958 1.44x 16.7x 1.36x 15.4x
McKesson Corporation MCK $186.65 $157.01 $223.42 18.9% -16.5% $47,159 $193,071 $4,598 0.24x 10.3x 0.23x 8.7x
Patterson Companies, Inc. PDCO $47.66 $46.05 $47.47 3.5% 0.4% $5,548 $5,387 $444 1.03x 12.5x 0.96x 11.3x
Median 2.4% -4.9% 0.24x 10.6x 0.23x 8.7x
$ in millions, except per share pricing Source: Capital IQ, Mercer Capital Analysis
© 2016 Mercer Capital 15 www.mercercapital.com
Mercer Capital’s Value Focus: Healthcare Facilities Industry Mid-Year 2016
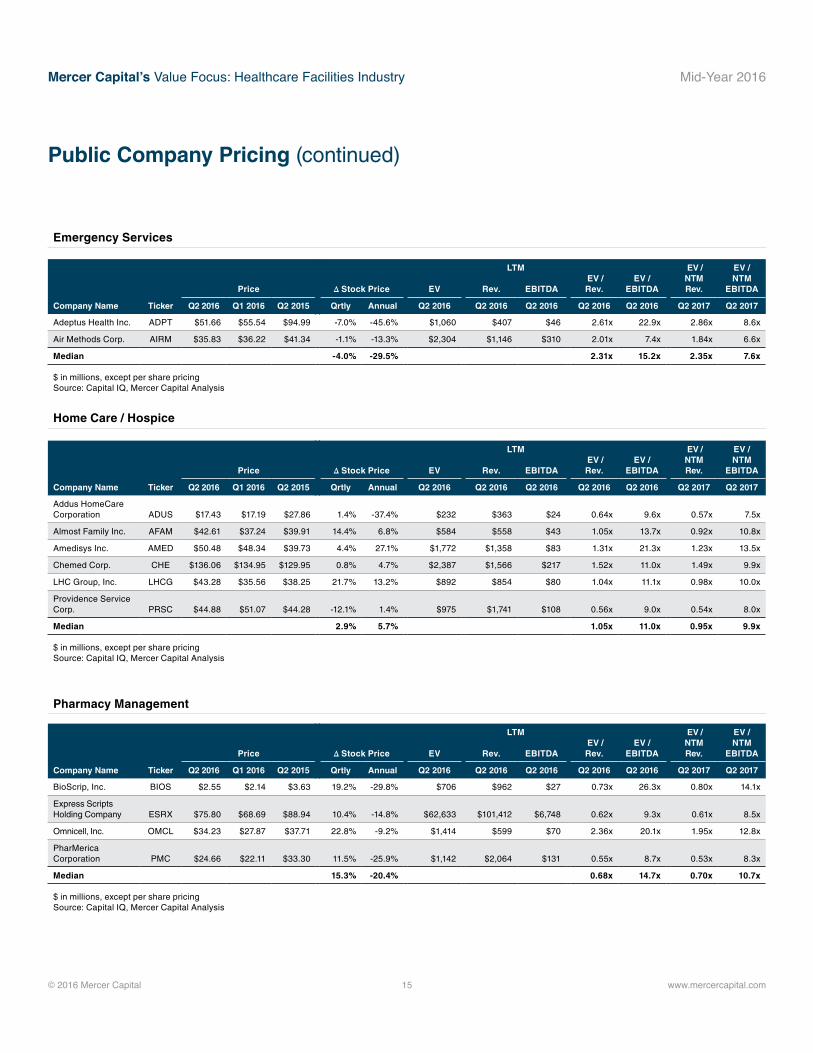
Emergency Services
Public Company Pricing (continued)
Home Care / Hospice
LTM EV / Rev.
EV / EBITDA
EV / NTM Rev.
EV / NTM
EBITDAPrice ∆ Stock Price EV Rev. EBITDA
Company Name Ticker Q2 2016 Q1 2016 Q2 2015 Qrtly Annual Q2 2016 Q2 2016 Q2 2016 Q2 2016 Q2 2016 Q2 2017 Q2 2017
Adeptus Health Inc. ADPT $51.66 $55.54 $94.99 -7.0% -45.6% $1,060 $407 $46 2.61x 22.9x 2.86x 8.6x
Air Methods Corp. AIRM $35.83 $36.22 $41.34 -1.1% -13.3% $2,304 $1,146 $310 2.01x 7.4x 1.84x 6.6x
Median -4.0% -29.5% 2.31x 15.2x 2.35x 7.6x
$ in millions, except per share pricing Source: Capital IQ, Mercer Capital Analysis
LTM EV / Rev.
EV / EBITDA
EV / NTM Rev.
EV / NTM
EBITDAPrice ∆ Stock Price EV Rev. EBITDA
Company Name Ticker Q2 2016 Q1 2016 Q2 2015 Qrtly Annual Q2 2016 Q2 2016 Q2 2016 Q2 2016 Q2 2016 Q2 2017 Q2 2017
Addus HomeCare Corporation ADUS $17.43 $17.19 $27.86 1.4% -37.4% $232 $363 $24 0.64x 9.6x 0.57x 7.5x
Almost Family Inc. AFAM $42.61 $37.24 $39.91 14.4% 6.8% $584 $558 $43 1.05x 13.7x 0.92x 10.8x
Amedisys Inc. AMED $50.48 $48.34 $39.73 4.4% 27.1% $1,772 $1,358 $83 1.31x 21.3x 1.23x 13.5x
Chemed Corp. CHE $136.06 $134.95 $129.95 0.8% 4.7% $2,387 $1,566 $217 1.52x 11.0x 1.49x 9.9x
LHC Group, Inc. LHCG $43.28 $35.56 $38.25 21.7% 13.2% $892 $854 $80 1.04x 11.1x 0.98x 10.0x
Providence Service Corp. PRSC $44.88 $51.07 $44.28 -12.1% 1.4% $975 $1,741 $108 0.56x 9.0x 0.54x 8.0x
Median 2.9% 5.7% 1.05x 11.0x 0.95x 9.9x
$ in millions, except per share pricing Source: Capital IQ, Mercer Capital Analysis
Pharmacy Management
LTM EV / Rev.
EV / EBITDA
EV / NTM Rev.
EV / NTM
EBITDAPrice ∆ Stock Price EV Rev. EBITDA
Company Name Ticker Q2 2016 Q1 2016 Q2 2015 Qrtly Annual Q2 2016 Q2 2016 Q2 2016 Q2 2016 Q2 2016 Q2 2017 Q2 2017
BioScrip, Inc. BIOS $2.55 $2.14 $3.63 19.2% -29.8% $706 $962 $27 0.73x 26.3x 0.80x 14.1x
Express Scripts Holding Company ESRX $75.80 $68.69 $88.94 10.4% -14.8% $62,633 $101,412 $6,748 0.62x 9.3x 0.61x 8.5x
Omnicell, Inc. OMCL $34.23 $27.87 $37.71 22.8% -9.2% $1,414 $599 $70 2.36x 20.1x 1.95x 12.8x
PharMerica Corporation PMC $24.66 $22.11 $33.30 11.5% -25.9% $1,142 $2,064 $131 0.55x 8.7x 0.53x 8.3x
Median 15.3% -20.4% 0.68x 14.7x 0.70x 10.7x
$ in millions, except per share pricing Source: Capital IQ, Mercer Capital Analysis
© 2016 Mercer Capital 16 www.mercercapital.com
Mercer Capital’s Value Focus: Healthcare Facilities Industry Mid-Year 2016
Public Company Pricing (continued)
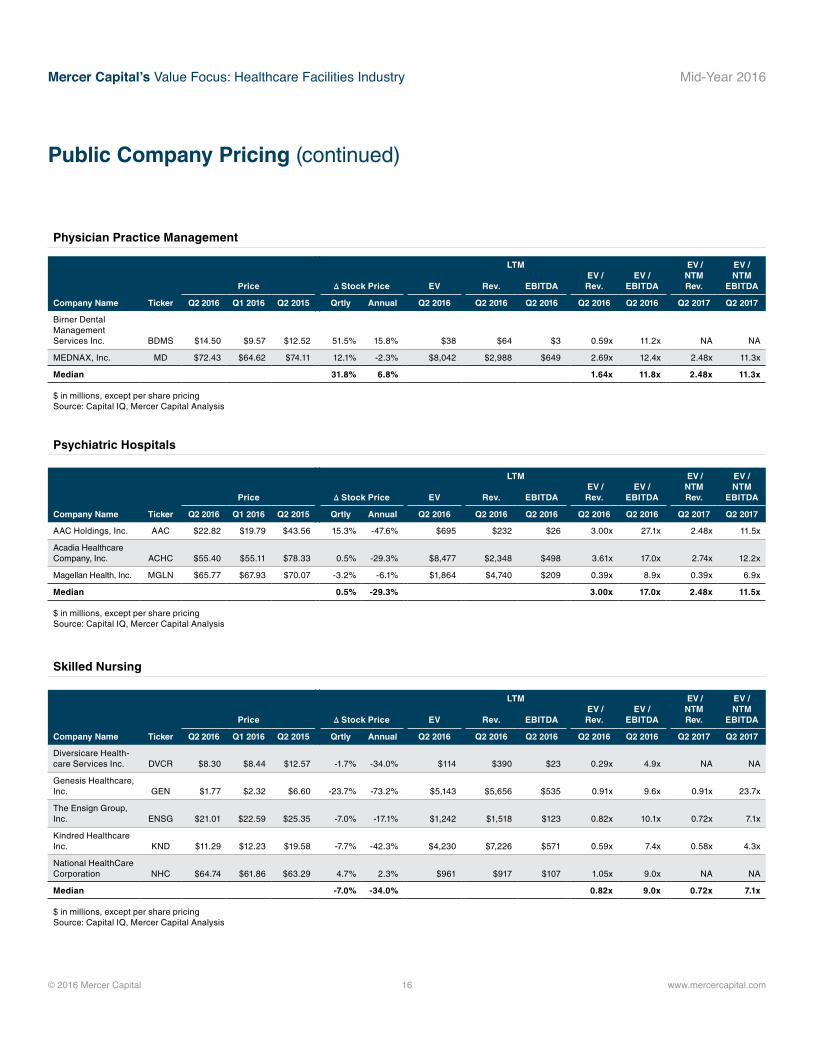
Physician Practice Management
Psychiatric Hospitals
LTM EV / Rev.
EV / EBITDA
EV / NTM Rev.
EV / NTM
EBITDAPrice ∆ Stock Price EV Rev. EBITDA
Company Name Ticker Q2 2016 Q1 2016 Q2 2015 Qrtly Annual Q2 2016 Q2 2016 Q2 2016 Q2 2016 Q2 2016 Q2 2017 Q2 2017
Birner Dental Management Services Inc. BDMS $14.50 $9.57 $12.52 51.5% 15.8% $38 $64 $3 0.59x 11.2x NA NA
MEDNAX, Inc. MD $72.43 $64.62 $74.11 12.1% -2.3% $8,042 $2,988 $649 2.69x 12.4x 2.48x 11.3x
Median 31.8% 6.8% 1.64x 11.8x 2.48x 11.3x
$ in millions, except per share pricing Source: Capital IQ, Mercer Capital Analysis
LTM EV / Rev.
EV / EBITDA
EV / NTM Rev.
EV / NTM
EBITDAPrice ∆ Stock Price EV Rev. EBITDA
Company Name Ticker Q2 2016 Q1 2016 Q2 2015 Qrtly Annual Q2 2016 Q2 2016 Q2 2016 Q2 2016 Q2 2016 Q2 2017 Q2 2017
AAC Holdings, Inc. AAC $22.82 $19.79 $43.56 15.3% -47.6% $695 $232 $26 3.00x 27.1x 2.48x 11.5x
Acadia Healthcare Company, Inc. ACHC $55.40 $55.11 $78.33 0.5% -29.3% $8,477 $2,348 $498 3.61x 17.0x 2.74x 12.2x
Magellan Health, Inc. MGLN $65.77 $67.93 $70.07 -3.2% -6.1% $1,864 $4,740 $209 0.39x 8.9x 0.39x 6.9x
Median 0.5% -29.3% 3.00x 17.0x 2.48x 11.5x
$ in millions, except per share pricing Source: Capital IQ, Mercer Capital Analysis
Skilled Nursing
LTM EV / Rev.
EV / EBITDA
EV / NTM Rev.
EV / NTM
EBITDAPrice ∆ Stock Price EV Rev. EBITDA
Company Name Ticker Q2 2016 Q1 2016 Q2 2015 Qrtly Annual Q2 2016 Q2 2016 Q2 2016 Q2 2016 Q2 2016 Q2 2017 Q2 2017
Diversicare Health-care Services Inc. DVCR $8.30 $8.44 $12.57 -1.7% -34.0% $114 $390 $23 0.29x 4.9x NA NA
Genesis Healthcare, Inc. GEN $1.77 $2.32 $6.60 -23.7% -73.2% $5,143 $5,656 $535 0.91x 9.6x 0.91x 23.7x
The Ensign Group, Inc. ENSG $21.01 $22.59 $25.35 -7.0% -17.1% $1,242 $1,518 $123 0.82x 10.1x 0.72x 7.1x
Kindred Healthcare Inc. KND $11.29 $12.23 $19.58 -7.7% -42.3% $4,230 $7,226 $571 0.59x 7.4x 0.58x 4.3x
National HealthCare Corporation NHC $64.74 $61.86 $63.29 4.7% 2.3% $961 $917 $107 1.05x 9.0x NA NA
Median -7.0% -34.0% 0.82x 9.0x 0.72x 7.1x
$ in millions, except per share pricing Source: Capital IQ, Mercer Capital Analysis
© 2016 Mercer Capital 17 www.mercercapital.com
Mercer Capital’s Value Focus: Healthcare Facilities Industry Mid-Year 2016
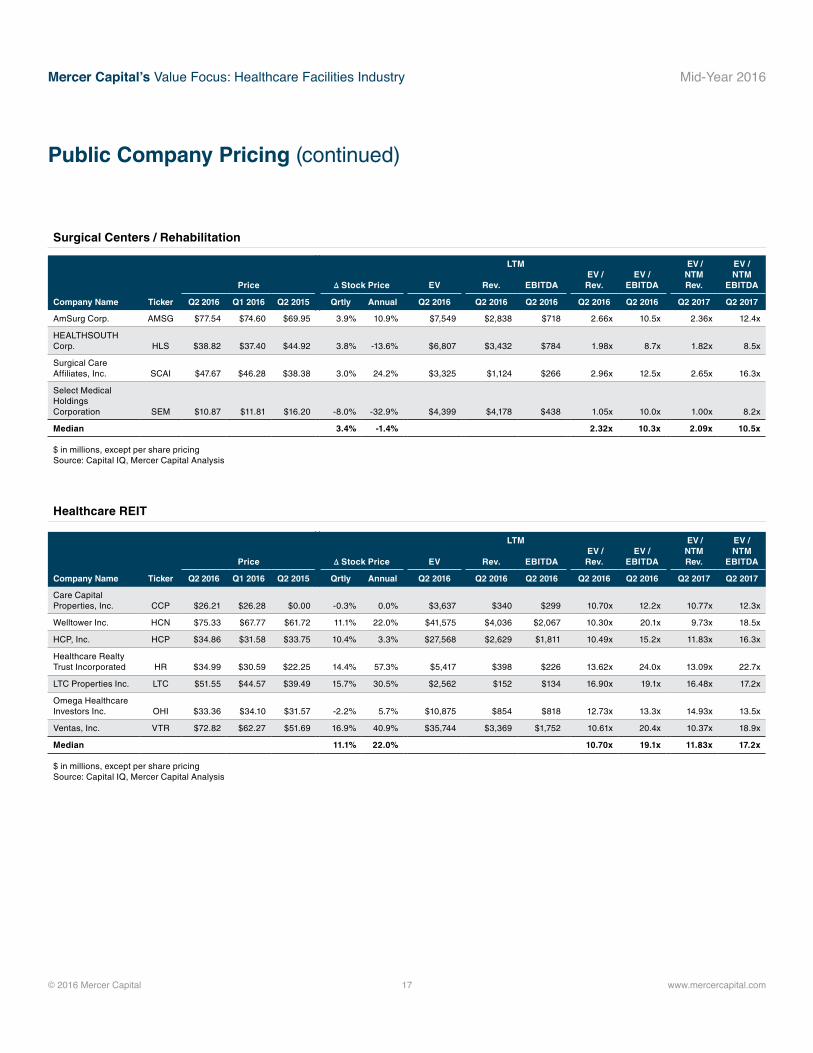
Public Company Pricing (continued)
Surgical Centers / Rehabilitation
Healthcare REIT
LTM EV / Rev.
EV / EBITDA
EV / NTM Rev.
EV / NTM
EBITDAPrice ∆ Stock Price EV Rev. EBITDA
Company Name Ticker Q2 2016 Q1 2016 Q2 2015 Qrtly Annual Q2 2016 Q2 2016 Q2 2016 Q2 2016 Q2 2016 Q2 2017 Q2 2017
AmSurg Corp. AMSG $77.54 $74.60 $69.95 3.9% 10.9% $7,549 $2,838 $718 2.66x 10.5x 2.36x 12.4x
HEALTHSOUTH Corp. HLS $38.82 $37.40 $44.92 3.8% -13.6% $6,807 $3,432 $784 1.98x 8.7x 1.82x 8.5x
Surgical Care Affiliates, Inc. SCAI $47.67 $46.28 $38.38 3.0% 24.2% $3,325 $1,124 $266 2.96x 12.5x 2.65x 16.3x
Select Medical Holdings Corporation SEM $10.87 $11.81 $16.20 -8.0% -32.9% $4,399 $4,178 $438 1.05x 10.0x 1.00x 8.2x
Median 3.4% -1.4% 2.32x 10.3x 2.09x 10.5x
$ in millions, except per share pricing Source: Capital IQ, Mercer Capital Analysis
LTM EV / Rev.
EV / EBITDA
EV / NTM Rev.
EV / NTM
EBITDAPrice ∆ Stock Price EV Rev. EBITDA
Company Name Ticker Q2 2016 Q1 2016 Q2 2015 Qrtly Annual Q2 2016 Q2 2016 Q2 2016 Q2 2016 Q2 2016 Q2 2017 Q2 2017
Care Capital Properties, Inc. CCP $26.21 $26.28 $0.00 -0.3% 0.0% $3,637 $340 $299 10.70x 12.2x 10.77x 12.3x
Welltower Inc. HCN $75.33 $67.77 $61.72 11.1% 22.0% $41,575 $4,036 $2,067 10.30x 20.1x 9.73x 18.5x
HCP, Inc. HCP $34.86 $31.58 $33.75 10.4% 3.3% $27,568 $2,629 $1,811 10.49x 15.2x 11.83x 16.3x
Healthcare Realty Trust Incorporated HR $34.99 $30.59 $22.25 14.4% 57.3% $5,417 $398 $226 13.62x 24.0x 13.09x 22.7x
LTC Properties Inc. LTC $51.55 $44.57 $39.49 15.7% 30.5% $2,562 $152 $134 16.90x 19.1x 16.48x 17.2x
Omega Healthcare Investors Inc. OHI $33.36 $34.10 $31.57 -2.2% 5.7% $10,875 $854 $818 12.73x 13.3x 14.93x 13.5x
Ventas, Inc. VTR $72.82 $62.27 $51.69 16.9% 40.9% $35,744 $3,369 $1,752 10.61x 20.4x 10.37x 18.9x
Median 11.1% 22.0% 10.70x 19.1x 11.83x 17.2x
$ in millions, except per share pricing Source: Capital IQ, Mercer Capital Analysis
Mercer Capital’s Value Focus: Healthcare Facilities Industry Mid-Year 2016
© 2016 Mercer Capital 18 www.mercercapital.com
Sources1 “Addus HomeCare’s (ADUS) CEO Dirk Allison on Q2 2016 Results - Earnings Call Transcript,” Available online at, http://seekingalpha.com/article/3994632-
addus-homecares-adus-ceo-dirk-allison-q2-2016-results-earnings-call-transcript, Accessed January 10, 2017.2 “AMEDYSIS’ (AMED) CEO Paul Kusserow on Q2 2016 Results - Earnings Call Transcript,” Available online at, http://seekingalpha.com/article/3995392-
amedysis-amed-ceo-paul-kusserow-q2-2016-results-earnings-call-transcript, Accessed January 10, 2017.3 “HCA Holdings’ (HCA) CEO Milton Johnson on Q2 2016 Results - Earnings Call Transcript,” Available online at, http://seekingalpha.com/article/3992909-
hca-holdings-hca-ceo-milton-johnson-q2-2016-results-earnings-call-transcript, Accessed January 10, 2017.4 “Keynote Address of FTC Chairwoman Edith Ramirez Antitrust in Healthcare Conference,” Available online at, https://www.ftc.gov/system/files/docu-
ments/public_statements/950143/160519antitrusthealthcarekeynote.pdf, Accessed January 10, 2017. 5 “NHE Fact Sheet,” Available online at https://www.cms.gov/research-statistics-data-and-systems/statistics-trends-and-reports/nationalhealthexpend-
data/nhe-fact-sheet.html, Accessed August 18, 2016. 6 “The Facts on Medicare Spending and Financing,” Available online at http://kff.org/medicare/issue-brief/the-facts-on-medicare-spending-and-financing/,
Accessed August 19, 2016. 7 “The Facts on Medicare Spending and Financing,” Available online at http://kff.org/medicare/issue-brief/the-facts-on-medicare-spending-and-financing/,
Accessed August 19, 2016.8 “Centers for Medicare & Medicaid Services, Office of the Actuary, National Health Statistics Group,” Available online at, https://www.cms.gov/Research-Sta-
tistics-Data-and-Systems/Statistics-Trends-and-Reports/NationalHealthExpendData/NationalHealthAccountsProjected.html, Accessed December 28,
2016.9 “Value Based Reimbursement: The Rock Thrown Into The Health Care Pond,” Available online at http://healthaffairs.org/blog/2016/07/08/value-based-
reimbursement-the-rock-thrown-into-the-health-care-pond/, Accessed August 22, 2016.10 “HHS reaches goal of tying 30 percent of Medicare payments to quality ahead of schedule,” Available online at http://www.hhs.gov/about/news/2016/03/03/
hhs-reaches-goal-tying-30-percent-medicare-payments-quality-ahead-schedule.html, Accessed August 22, 2016. 11 “Moody’s: 5 key for profit hospital consolidation trends,” Online, Available, http://www.beckershospitalreview.com/hospital-transactions-and-valuation/
moody-s-5-key-for-profit-hospital-consolidation-trends.html, Accessed December 28, 2016.12 “Healthcare and Life Science Insider: June 2014,” Online, Available, www.bglco.com/files/healthcare__life_sciences_insider_jun_14.pdf, Accessed
August 19, 2016.
Mercer CapitalHealthcare Facilities Industry Services
Contact Us
Copyright © 2016 Mercer Capital Management, Inc. All rights reserved. It is illegal under Federal law to reproduce this publication or any portion of its contents without the publisher’s permission. Media
quotations with source attribution are encouraged. Reporters requesting additional information or editorial comment should contact Barbara Walters Price at 901.685.2120. Mercer Capital’s Industry
Focus does not constitute legal or financial consulting advice. It is offered as an information service to our clients and friends. Those interested in specific guidance for legal or accounting matters should
seek competent professional advice. Inquiries to discuss specific valuation matters are welcomed. To add your name to our mailing list to receive this complimentary publication, visit our web site at
www.mercercapital.com.
Mercer Capital provides business valuation and financial advisory services to companies operating in the healthcare facilities industry.
Industry Segments
Mercer Capital serves the following industry segments:
• Acute care hospitals
• Assisted living facilities
• Emergency services
• Home care and hospice
Services We Provide
• Valuation of healthcare companies for tax compliance
• Valuations for purchase accounting and impairment testing
• Fairness and solvency opinions
• Transaction advisory for acquisitions and divestitures
• Litigation support for economic damages and valuation and shareholder disputes
Contact a Mercer Capital professional to discuss your needs in confidence.
Sujan Rajbhandary, [email protected]
Timothy R. Lee, [email protected]
Jay D. Wilson, Jr., CFA, ASA, [email protected]
Atticus L. [email protected]
MERCER CAPITAL
Memphis5100 Poplar Avenue, Suite 2600Memphis, Tennessee 38137901.685.2120
Dallas12201 Merit Drive, Suite 480Dallas, Texas 75251214.468.8400
Nashville102 Woodmont Blvd., Suite 231Nashville, Tennessee 37205615.345.0350
www.mercercapital.com
• Long-term care
• Surgical centers and rehabilitation facilities
• Other healthcare facilities
BUSINESS VALUATION & FINANCIAL ADVISORY SERVICES