Embed Size (px)
Citation preview

Vale’s Performance in 2018

www.vale.com
Tel.: (55 21) 3485-3900
Investor Relations Department
André Figueiredo
André Werner
Carla Albano Miller
Fernando Mascarenhas
Samir Bassil
Bruno Siqueira
Clarissa Couri
Renata Capanema
Conference call and webcast on Thursday, March 28th
Portuguese (non-translated) at 10:00 a.m. Rio de Janeiro time
Brazil: (55 11) 3193-1001 or (55 11) 2820-4001 USA and Canada: (1 800) 492-3904 or (1 800) 469-5743 Other countries: (1 646) 828-8246 or (1 646) 291-8936 Access code: VALE
English, at 12:00 p.m. Rio de Janeiro time (11:00 a.m. New York time, 3:00 p.m. London time).
Brazil: (55 11) 3193-1001 or (55 11) 2820-4001 USA and Canada: (1 866) 262-4553 Other countries: (1 412) 317-6029 Access code: VALE
The conference call and presentation will be transmitted live via webcast available at: www.choruscall.com.br/vale/4q18.htm
Except where otherwise indicated the operational and financial information in this release is based on the consolidated figures in accordance with IFRS. Our quarterly financial statements are reviewed by the company’s independent auditors. The main subsidiaries that are consolidated are the following: Companhia Portuária da Baía de Sepetiba, Mineração Corumbaense Reunida S.A., Minerações Brasileiras Reunidas S.A. PT Vale Indonesia Tbk, Salobo Metais S.A, Vale International Holdings GMBH, Vale Canada Limited, Vale International S.A., Vale Manganês S.A., Vale Malaysia Minerals Sdn. Bhd., Vale Moçambique S.A., Vale Nouvelle-Calédonie SAS, Vale Oman Pelletizing Company LLC and Vale Oman Distribution Center LLC. This press release may include statements about Vale's current expectations about future events or results (forward-looking statements). Many of those forward-looking statements can be identified by the use of forward-looking words such as "anticipate," "believe," "could," "expect," "should," "plan," "intend," "estimate" “will” and "potential," among others. All forward-looking statements involve various risks and uncertainties. Vale cannot guarantee that these statements will prove correct. These risks and uncertainties include, among others, factors related to: (a) the countries where Vale operates, especially Brazil and Canada; (b) the global economy; (c) the capital markets; (d) the mining and metals prices and their dependence on global industrial production, which is cyclical by nature; and (e) global competition in the markets in which Vale operates. Vale cautions you that actual results may differ materially from the plans, objectives, expectations, estimates and intentions expressed in this presentation. Vale undertakes no obligation to publicly update or revise any forward-looking statement, whether as a result of new information or future events or for any other reason. To obtain further information on factors that may lead to results different from those forecast by Vale, please consult the reports that Vale files with the U.S. Securities and Exchange Commission (SEC), the Brazilian Comissão de Valores Mobiliários (CVM), the French Autorité des Marchés Financiers (AMF) and, in particular, the factors discussed under “Forward-Looking Statements” and “Risk Factors” in Vale’s annual report on Form 20-F. Cautionary Note to U.S. Investors - The SEC permits mining companies, in their filings with the SEC, to disclose only those mineral deposits that a company can economically and legally extract or produce. We present certain information in this presentation, including ‘measured resources,’ ‘indicated resources,’ ‘inferred resources,’ ‘geologic resources’, which would not be permitted in an SEC filing. These materials are not proven or probable reserves, as defined by the SEC, and we cannot assure you that these materials will be converted into proven or probable reserves, as defined by the SEC. U.S. Investors should consider closely the disclosure in our Annual Report on Form 20-K, which may be obtained from us, from our website or at http://http://us.sec.gov/edgar.shtml. The information contained in this press release includes financial measures that are not prepared in accordance with IFRS. These non-IFRS measures differ from the most directly comparable measures determined under IFRS, but we have not presented a reconciliation to the most directly comparable IFRS measures, because the non-IFRS measures are forward-looking and a reconciliation cannot be prepared without unreasonable efforts.
3
Rupture of Brumadinho Dam I
In the early afternoon of January 25th, 2019, there was a rupture of the Dam I in the Córrego do
Feijão Mine in Brumadinho (MG) and, since then, Vale has been making every effort to meet the
needs of those affected and to mitigate damages.
Since the first days following the rupture of the Dam I, Vale’s initiatives have had four main
purposes: (i) assistance to the affected people and recovery of the area affected by the rupture
of the Dam I; (ii) determination of the causes of the rupture of the Dam I; (iii) ensure the safety of
our existing upstream structures and of the communities nearby; and, (iv) acceleration of the
decommissioning or de-characterization process of our remaining upstream dams.
Extensive details about all those initiatives may be found at the “Report from Administration”
published on March 27th, 2019.
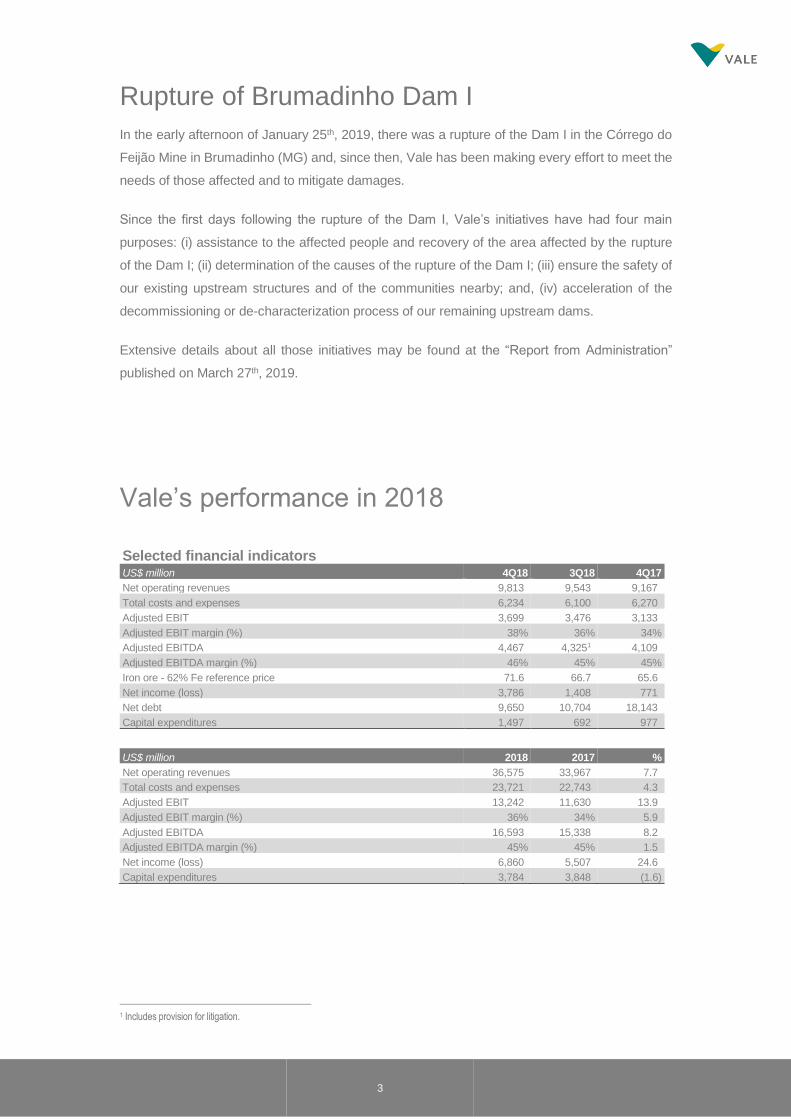
Vale’s performance in 2018
Selected financial indicators
US$ million 4Q18 3Q18 4Q17
Net operating revenues 9,813 9,543 9,167
Total costs and expenses 6,234 6,100 6,270
Adjusted EBIT 3,699 3,476 3,133
Adjusted EBIT margin (%) 38% 36% 34%
Adjusted EBITDA 4,467 4,3251 4,109
Adjusted EBITDA margin (%) 46% 45% 45%
Iron ore - 62% Fe reference price 71.6 66.7 65.6
Net income (loss) 3,786 1,408 771
Net debt 9,650 10,704 18,143
Capital expenditures 1,497 692 977
US$ million 2018 2017 %
Net operating revenues 36,575 33,967 7.7
Total costs and expenses 23,721 22,743 4.3
Adjusted EBIT 13,242 11,630 13.9
Adjusted EBIT margin (%) 36% 34% 5.9
Adjusted EBITDA 16,593 15,338 8.2
Adjusted EBITDA margin (%) 45% 45% 1.5
Net income (loss) 6,860 5,507 24.6
Capital expenditures 3,784 3,848 (1.6)
1 Includes provision for litigation.
4
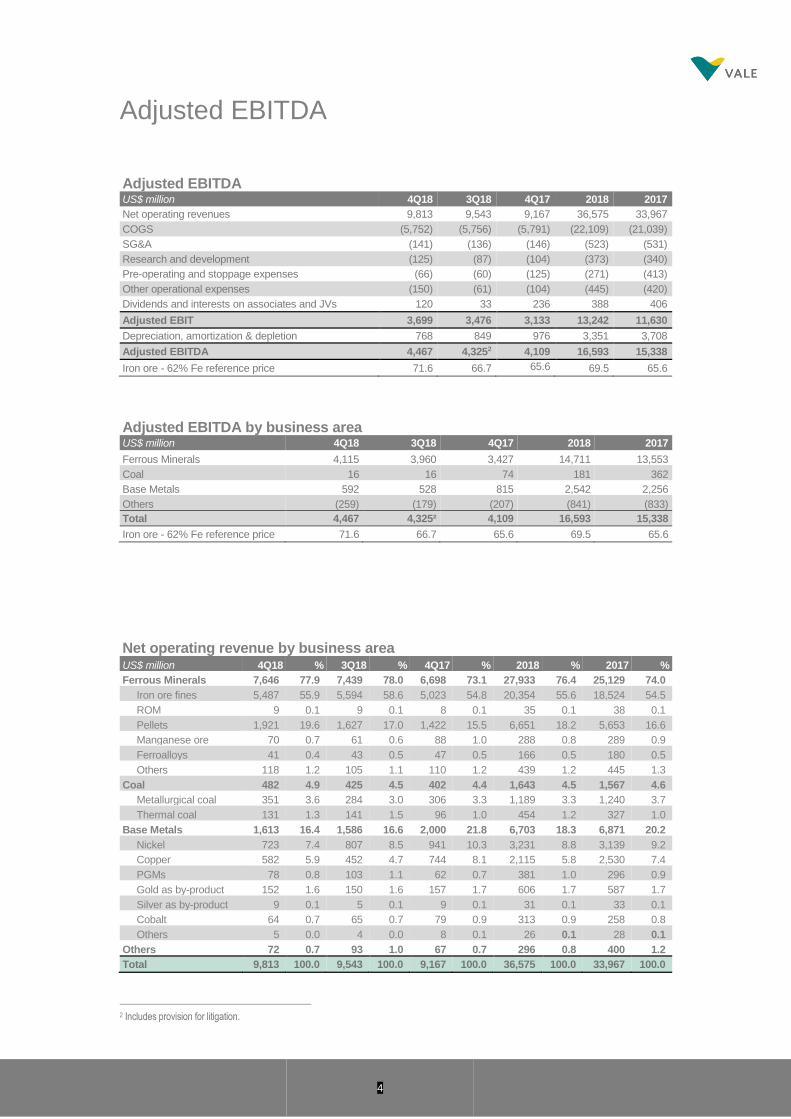
Adjusted EBITDA
Adjusted EBITDA US$ million 4Q18 3Q18 4Q17 2018 2017
Net operating revenues 9,813 9,543 9,167 36,575 33,967
COGS (5,752) (5,756) (5,791) (22,109) (21,039)
SG&A (141) (136) (146) (523) (531)
Research and development (125) (87) (104) (373) (340)
Pre-operating and stoppage expenses (66) (60) (125) (271) (413)
Other operational expenses (150) (61) (104) (445) (420)
Dividends and interests on associates and JVs 120 33 236 388 406
Adjusted EBIT 3,699 3,476 3,133 13,242 11,630
Depreciation, amortization & depletion 768 849 976 3,351 3,708
Adjusted EBITDA 4,467 4,3252 4,109 16,593 15,338
Iron ore - 62% Fe reference price 71.6 66.7 65.6
69.5 65.6
Adjusted EBITDA by business area US$ million 4Q18 3Q18 4Q17 2018 2017
Ferrous Minerals 4,115 3,960 3,427 14,711 13,553
Coal 16 16 74 181 362
Base Metals 592 528 815 2,542 2,256
Others (259) (179) (207) (841) (833)
Total 4,467 4,325² 4,109 16,593 15,338
Iron ore - 62% Fe reference price 71.6 66.7 65.6 69.5 65.6
Net operating revenue by business area US$ million 4Q18 % 3Q18 % 4Q17 % 2018 % 2017 %
Ferrous Minerals 7,646 77.9 7,439 78.0 6,698 73.1 27,933 76.4 25,129 74.0
Iron ore fines 5,487 55.9 5,594 58.6 5,023 54.8 20,354 55.6 18,524 54.5
ROM 9 0.1 9 0.1 8 0.1 35 0.1 38 0.1
Pellets 1,921 19.6 1,627 17.0 1,422 15.5 6,651 18.2 5,653 16.6
Manganese ore 70 0.7 61 0.6 88 1.0 288 0.8 289 0.9
Ferroalloys 41 0.4 43 0.5 47 0.5 166 0.5 180 0.5
Others 118 1.2 105 1.1 110 1.2 439 1.2 445 1.3
Coal 482 4.9 425 4.5 402 4.4 1,643 4.5 1,567 4.6
Metallurgical coal 351 3.6 284 3.0 306 3.3 1,189 3.3 1,240 3.7
Thermal coal 131 1.3 141 1.5 96 1.0 454 1.2 327 1.0
Base Metals 1,613 16.4 1,586 16.6 2,000 21.8 6,703 18.3 6,871 20.2
Nickel 723 7.4 807 8.5 941 10.3 3,231 8.8 3,139 9.2
Copper 582 5.9 452 4.7 744 8.1 2,115 5.8 2,530 7.4
PGMs 78 0.8 103 1.1 62 0.7 381 1.0 296 0.9
Gold as by-product 152 1.6 150 1.6 157 1.7 606 1.7 587 1.7
Silver as by-product 9 0.1 5 0.1 9 0.1 31 0.1 33 0.1
Cobalt 64 0.7 65 0.7 79 0.9 313 0.9 258 0.8
Others 5 0.0 4 0.0 8 0.1 26 0.1 28 0.1
Others 72 0.7 93 1.0 67 0.7 296 0.8 400 1.2
Total 9,813 100.0 9,543 100.0 9,167 100.0 36,575 100.0 33,967 100.0
2 Includes provision for litigation.

5
COGS by business segment US$ million 4Q18 % 3Q18 % 4Q17 % 2018 % 2017 %
Ferrous Minerals 3,881 67 3,808 66 3,664 63 14,641 66 13,007 62
Base Metals 1,260 22 1,383 24 1,558 27 5,363 24 5,989 28
Coal 543 9 498 9 490 8 1,820 8 1,641 8
Other products 68 1 67 1 79 1 285 1 402 2
Total COGS 5,752 100 5,756 100 5,791 100 22,109 100 21,039 100
Depreciation 738 814 918 3,207 3,484
COGS, ex-depreciation 5,014 4,942 4,873 18,902 17,555
Expenses US$ million 4Q18 3Q18 4Q17 2018 2017
SG&A ex-depreciation 129 118 125 461 440
SG&A 141 136 146 523 531
Administrative 110 118 127 428 463
Personnel 48 61 62 212 234
Services 34 21 29 92 77
Depreciation 12 18 21 62 91
Others 16 18 15 62 61
Selling 31 18 19 95 68
R&D 125 87 104 373 340
Pre-operating and stoppage expenses 66 60 125 271 413
Stobie & Birchtree 4 3 - 16 50
S11D 22 17 43 82 150
Others 22 23 45 91 80
Depreciation 18 17 37 82 133
Other operating expenses 150 61 104 445 420
Total expenses 482 344 479 1,612 1,704
Depreciation 30 35 58 144 224
Expenses ex-depreciation 452 309 421 1,468 1,480
Financial results US$ million 4Q18 3Q18 4Q17 2018 2017
Financial expenses (550) (367) (562) (2,345) (3,273)
Gross interest (283) (272) (378) (1,185) (1,697)
Capitalization of interest 40 50 73 194 370
Tax and labor contingencies (7) (7) (10) (31) (52)
Shareholder debentures (60) (3) (54) (550) (625)
Others (195) (87) (124) (571) (872)
Financial expenses (REFIS) (45) (48) (69) (202) (397)
Financial income 113 111 149 423 478
Derivatives¹ 55 (105) (29) (266) 454
Currency and interest rate swaps 83 (80) (133) (279) 313
Others² (bunker oil, commodities, etc) (28) (25) 104 13 141
Foreign Exchange 448 (685) (540) (2,247) (467)
Monetary variation (81) (217) (305) (522) (211)
Financial result, net (15) (1,263) (1,287) (4,957) (3,019)
¹ The net derivatives loss of US$ 55 million in 4Q18 is comprised of settlement loss of US$ 32 million and mark-to-market gains of US$ 87 million.
² Other derivatives include bunker oil derivatives which, for 4Q18 were US$51 million.

6
Shareholders’ remuneration
In light of the breach of Dam I of the Córrego do Feijão mine in Brumadinho (MG, Brazil), on
January 27th, 2019, Vale’s Board of Directors decided to suspend of the Shareholder
Remuneration Policy, and therefore the non-payment of dividends and interest on capital, as well
as any other decisions on shares buyback. By its turn, the Brazilian corporate law and establishes
a mandatory shareholder remuneration of 25% of the company’s profits in the fiscal year, a
definition that was duly complied with as per the performance in 2018.
Vale’s net profit in 2018 was R$ 25.657 billion, out of which the minimum legal reserves and fiscal
incentives (R$ 2.780 billion) need to be discounted, following local regulation on the subject.
Hence, the net profit to be used as the basis for the calculation of the minimum mandatory
shareholder remuneration in 2018 was R$ 22.877 billion. The 25% share of this amount equals
to R$ 5.719 billion. Considering that the distribution of interest on capital is subject to a 15%
deduction of withholding income tax borne by shareholders, and taking into account that local
regulation defines that the 25% of net profit needs to be the net amount of cash received by
shareholders after such taxes are applied, the final minimum mandatory shareholder
remuneration for the fiscal year of 2018 – as defined by the Brazilian law and established in Vale’s
By-laws – was R$ 6.729 billion.
Vale has already remunerated over and above this minimum threshold with the payment of
dividends / interest on capital of R$ 7.694 billion on September 20th, 2018, which was paid as a
component of the minimum remuneration related to the period ended on December 31st, 2018.
7
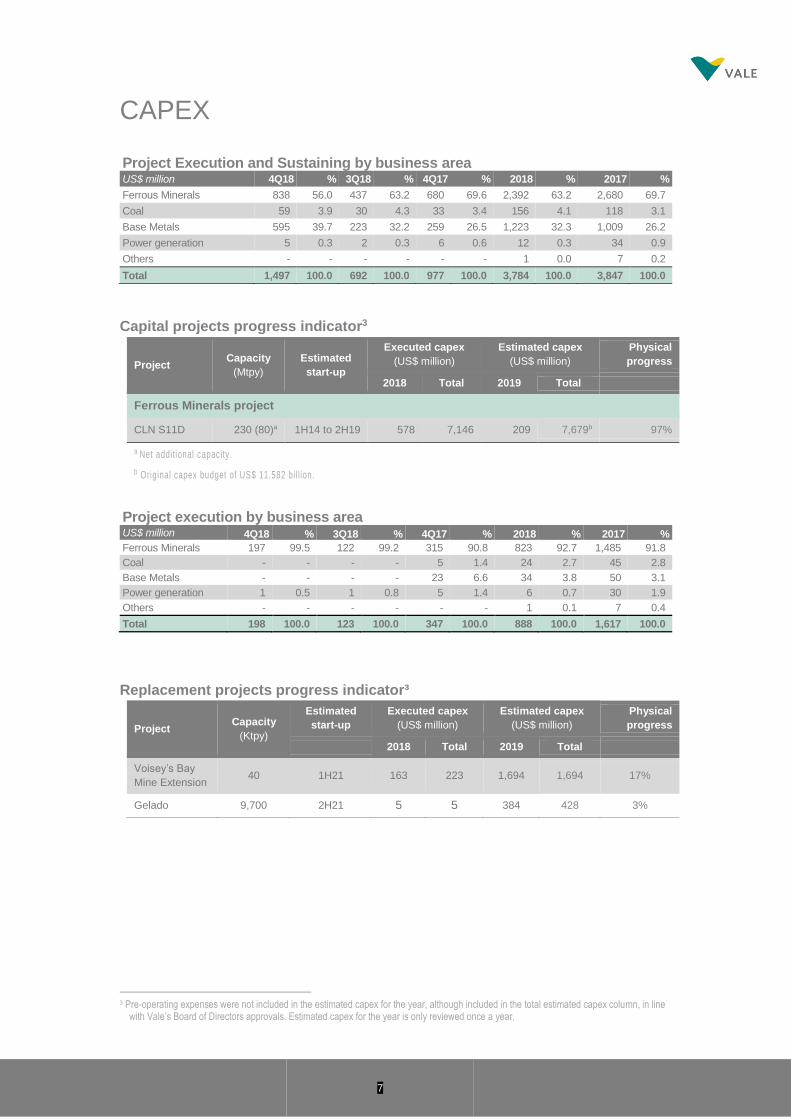
CAPEX
Project Execution and Sustaining by business area US$ million 4Q18 % 3Q18 % 4Q17 % 2018 % 2017 %
Ferrous Minerals 838 56.0 437 63.2 680 69.6 2,392 63.2 2,680 69.7
Coal 59 3.9 30 4.3 33 3.4 156 4.1 118 3.1
Base Metals 595 39.7 223 32.2 259 26.5 1,223 32.3 1,009 26.2
Power generation 5 0.3 2 0.3 6 0.6 12 0.3 34 0.9
Others - - - - - - 1 0.0 7 0.2
Total 1,497 100.0 692 100.0 977 100.0 3,784 100.0 3,847 100.0
Capital projects progress indicator3
Project execution by business area US$ million 4Q18 % 3Q18 % 4Q17 % 2018 % 2017 %
Ferrous Minerals 197 99.5 122 99.2 315 90.8 823 92.7 1,485 91.8
Coal - - - - 5 1.4 24 2.7 45 2.8
Base Metals - - - - 23 6.6 34 3.8 50 3.1
Power generation 1 0.5 1 0.8 5 1.4 6 0.7 30 1.9
Others - - - - - - 1 0.1 7 0.4
Total 198 100.0 123 100.0 347 100.0 888 100.0 1,617 100.0
Replacement projects progress indicator³
3 Pre-operating expenses were not included in the estimated capex for the year, although included in the total estimated capex column, in line
with Vale’s Board of Directors approvals. Estimated capex for the year is only reviewed once a year.
Project Capacity
(Mtpy)
Estimated
start-up
Executed capex
(US$ million)
Estimated capex
(US$ million)
Physical
progress
2018 Total 2019 Total
Ferrous Minerals project
CLN S11D 230 (80)a 1H14 to 2H19 578 7,146 209 7,679b 97%
a Net additional capacity.
b Original capex budget of US$ 11.582 bi ll ion.
Project Capacity
(Ktpy)
Estimated
start-up
Executed capex
(US$ million)
Estimated capex
(US$ million)
Physical
progress
2018 Total 2019 Total
Voisey’s Bay
Mine Extension 40 1H21 163 223 1,694 1,694 17%
Gelado 9,700 2H21 5 5 384 428 3%
8
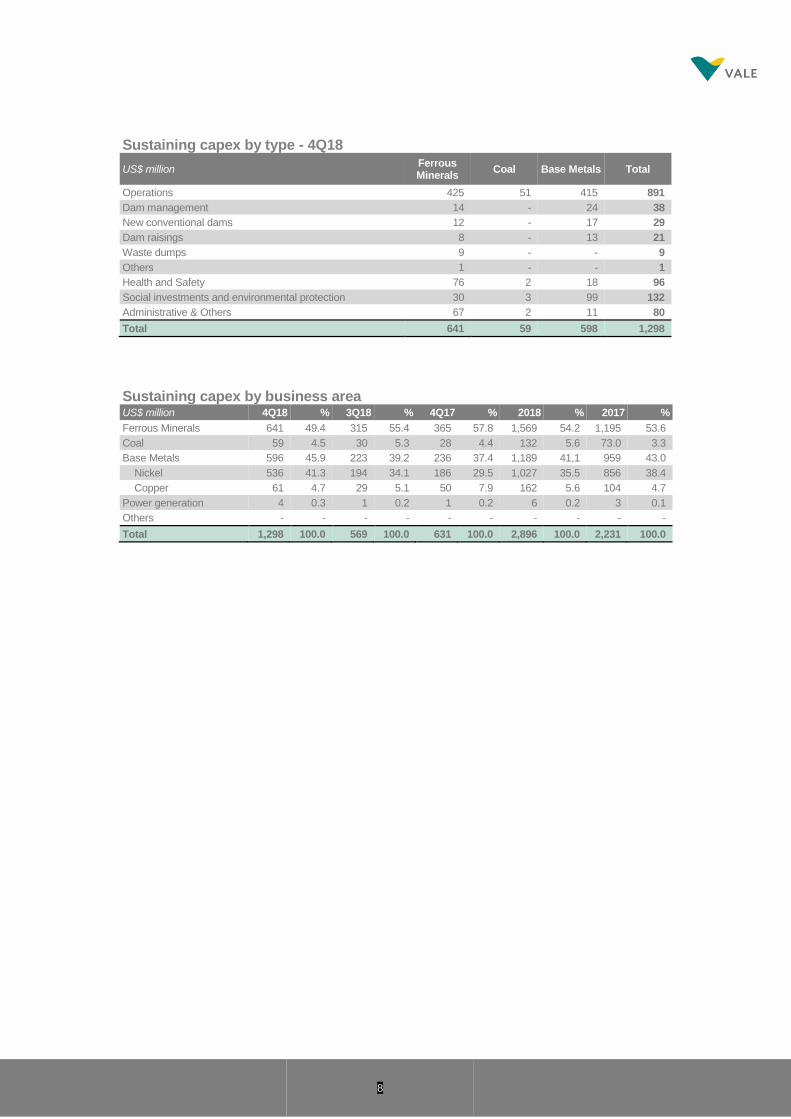
Sustaining capex by type - 4Q18
US$ million Ferrous Minerals
Coal Base Metals Total
Operations 425 51 415 891
Dam management 14 - 24 38
New conventional dams 12 - 17 29
Dam raisings 8 - 13 21
Waste dumps 9 - - 9
Others 1 - - 1
Health and Safety 76 2 18 96
Social investments and environmental protection 30 3 99 132
Administrative & Others 67 2 11 80
Total 641 59 598 1,298
Sustaining capex by business area US$ million 4Q18 % 3Q18 % 4Q17 % 2018 % 2017 %
Ferrous Minerals 641 49.4 315 55.4 365 57.8 1,569 54.2 1,195 53.6
Coal 59 4.5 30 5.3 28 4.4 132 5.6 73.0 3.3
Base Metals 596 45.9 223 39.2 236 37.4 1,189 41,1 959 43.0
Nickel 536 41.3 194 34.1 186 29.5 1,027 35.5 856 38.4
Copper 61 4.7 29 5.1 50 7.9 162 5.6 104 4.7
Power generation 4 0.3 1 0.2 1 0.2 6 0.2 3 0.1
Others - - - - - - - - - -
Total 1,298 100.0 569 100.0 631 100.0 2,896 100.0 2,231 100.0
9
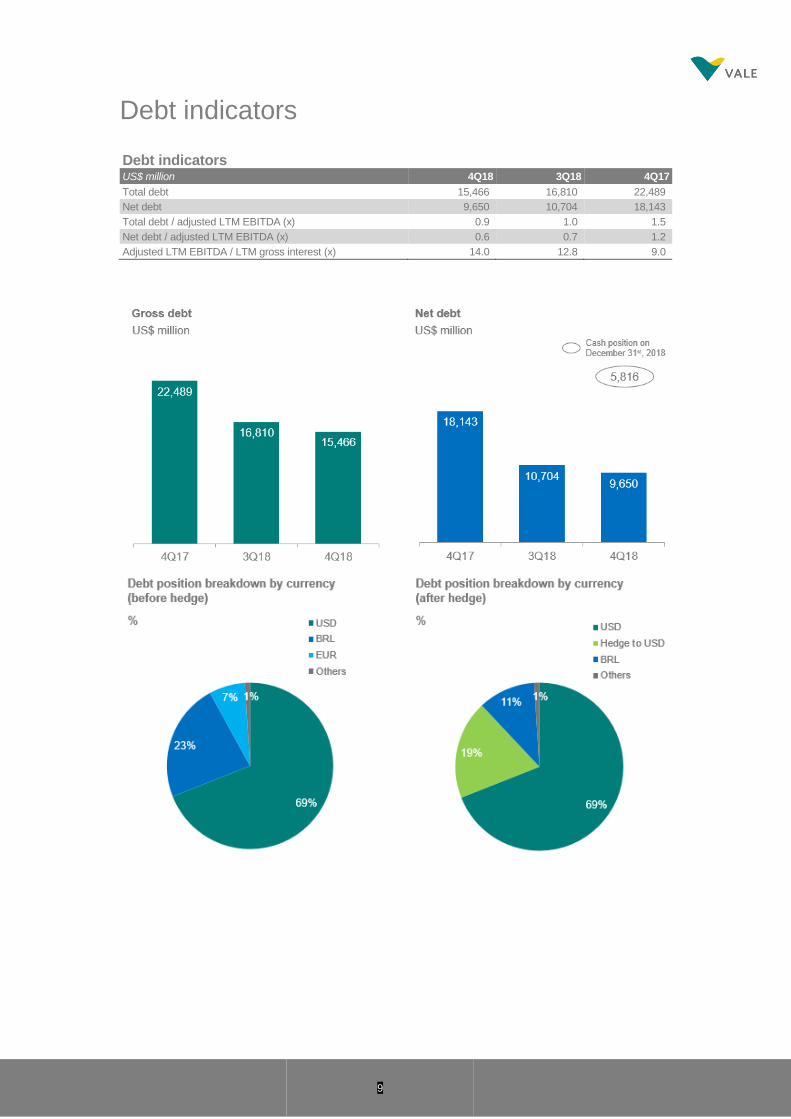
Debt indicators
Debt indicators US$ million 4Q18 3Q18 4Q17
Total debt 15,466 16,810 22,489
Net debt 9,650 10,704 18,143
Total debt / adjusted LTM EBITDA (x) 0.9 1.0 1.5
Net debt / adjusted LTM EBITDA (x) 0.6 0.7 1.2
Adjusted LTM EBITDA / LTM gross interest (x) 14.0 12.8 9.0
10
11
IFRS 16 - Changes to accounting standards on leasing
From 1Q19 onwards Vale will adopt the IFRS 16 accounting standard, issued by IASB in
January 2016 with mandatory adoption date of January 1st, 2019. Vale expects the
following impacts on its financial reporting:
• The majority of leases will be recognized on the balance sheet as the distinction
between operating and finance leases is removed. Both assets (the right to use
the leased item) and financial liabilities to pay rentals are recognized – exemptions
are applied for some short-term leases and leases of low-value items.
• Upon adoption, a simplified transition approach will be undertaken, not restating
comparative amounts for the year prior to first adoption of the new standard.
• Right-of-use assets will be measured at the amount of the lease liability upon
adoption.
As of now, Vale has a total nominal value (non-NPV) of US$ 2.5 billion of non-cancellable
operating lease commitments, and an NPV ranging from US$ 1.8 billion to US$ 2.0 billion
will be recognized as right-of-use assets and lease liabilities on the balance sheet from
1Q19 onwards.
Therefore, with the changes to IFRS 16, financial liabilities should be expected to increase
in line with the increase in assets; by its turn, these changes will generate a favorable
impact on EBITDA, as what is currently being accounted as operating leases will be
classified as depreciation, with a corresponding positive effect on the EBITDA breakeven,
among other indicators.
The above-mentioned figures are just an estimate of the impact and, as such, they are still
subject to changes as (i) the assessment is still ongoing by a dedicated team and (ii) the
new accounting policies may still be modified until Vale presents its 1Q19 Financial
Statements.
12
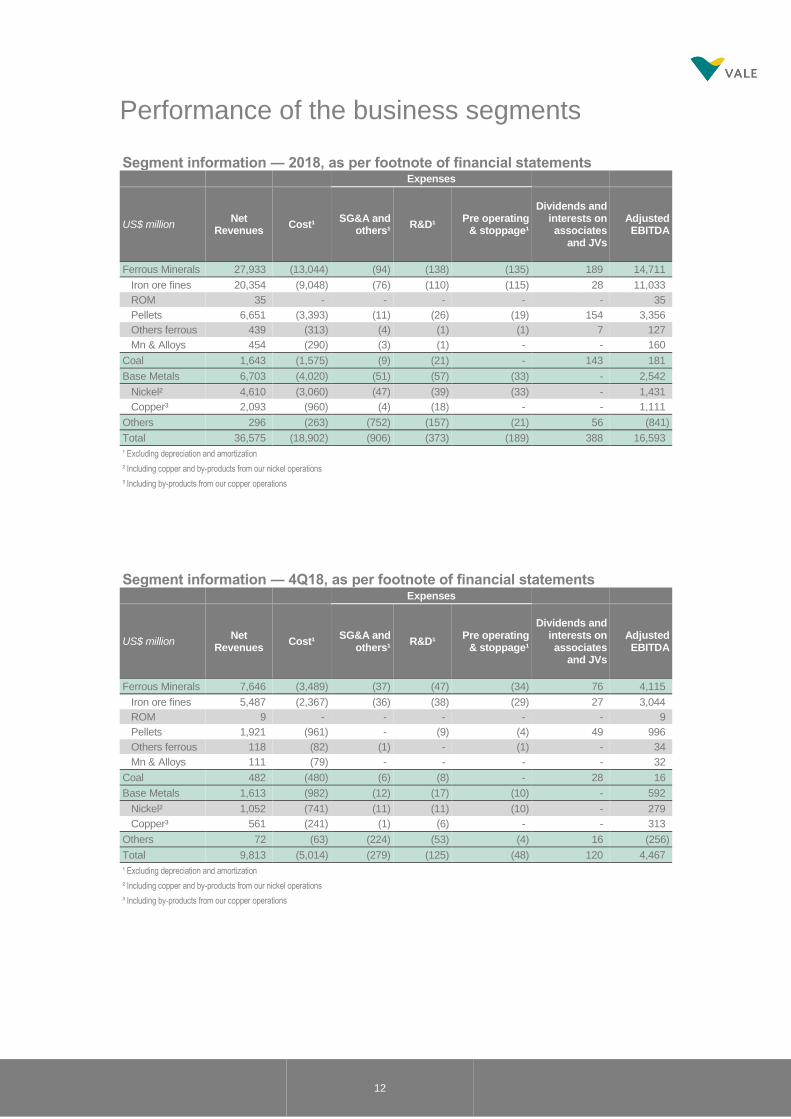
Performance of the business segments
Segment information ― 2018, as per footnote of financial statements Expenses
US$ million Net
Revenues Cost¹
SG&A and others¹
R&D¹ Pre operating
& stoppage¹
Dividends and interests on associates
and JVs
Adjusted EBITDA
Ferrous Minerals 27,933 (13,044) (94) (138) (135) 189 14,711
Iron ore fines 20,354 (9,048) (76) (110) (115) 28 11,033
ROM 35 - - - - - 35
Pellets 6,651 (3,393) (11) (26) (19) 154 3,356
Others ferrous 439 (313) (4) (1) (1) 7 127
Mn & Alloys 454 (290) (3) (1) - - 160
Coal 1,643 (1,575) (9) (21) - 143 181
Base Metals 6,703 (4,020) (51) (57) (33) - 2,542
Nickel² 4,610 (3,060) (47) (39) (33) - 1,431
Copper³ 2,093 (960) (4) (18) - - 1,111
Others 296 (263) (752) (157) (21) 56 (841)
Total 36,575 (18,902) (906) (373) (189) 388 16,593
¹ Excluding depreciation and amortization
² Including copper and by-products from our nickel operations
³ Including by-products from our copper operations
Segment information ― 4Q18, as per footnote of financial statements Expenses
US$ million Net
Revenues Cost¹
SG&A and others¹
R&D¹ Pre operating
& stoppage¹
Dividends and interests on associates
and JVs
Adjusted EBITDA
Ferrous Minerals 7,646 (3,489) (37) (47) (34) 76 4,115
Iron ore fines 5,487 (2,367) (36) (38) (29) 27 3,044
ROM 9 - - - - - 9
Pellets 1,921 (961) - (9) (4) 49 996
Others ferrous 118 (82) (1) - (1) - 34
Mn & Alloys 111 (79) - - - - 32
Coal 482 (480) (6) (8) - 28 16
Base Metals 1,613 (982) (12) (17) (10) - 592
Nickel² 1,052 (741) (11) (11) (10) - 279
Copper³ 561 (241) (1) (6) - - 313
Others 72 (63) (224) (53) (4) 16 (256)
Total 9,813 (5,014) (279) (125) (48) 120 4,467
¹ Excluding depreciation and amortization
² Including copper and by-products from our nickel operations
³ Including by-products from our copper operations
13
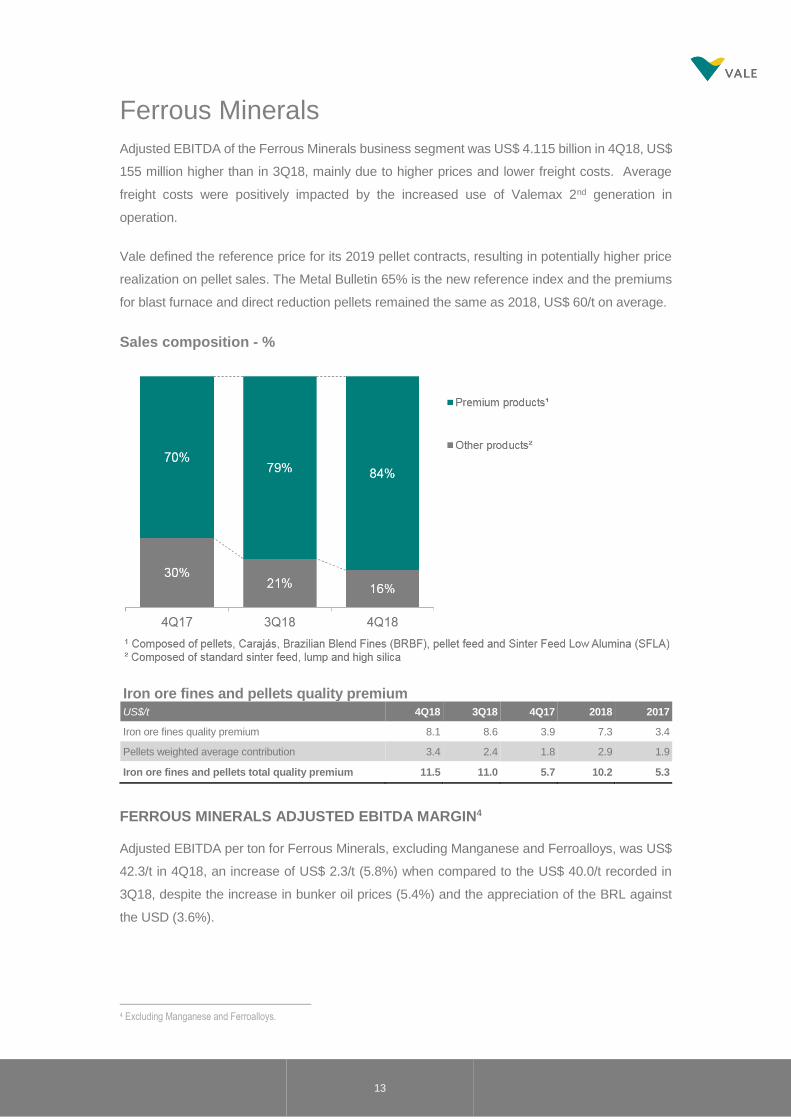
Ferrous Minerals
Adjusted EBITDA of the Ferrous Minerals business segment was US$ 4.115 billion in 4Q18, US$
155 million higher than in 3Q18, mainly due to higher prices and lower freight costs. Average
freight costs were positively impacted by the increased use of Valemax 2nd generation in
operation.
Vale defined the reference price for its 2019 pellet contracts, resulting in potentially higher price
realization on pellet sales. The Metal Bulletin 65% is the new reference index and the premiums
for blast furnace and direct reduction pellets remained the same as 2018, US$ 60/t on average.
Sales composition - %
Iron ore fines and pellets quality premium
US$/t 4Q18 3Q18 4Q17 2018 2017
Iron ore fines quality premium 8.1 8.6 3.9 7.3 3.4
Pellets weighted average contribution 3.4 2.4 1.8 2.9 1.9
Iron ore fines and pellets total quality premium 11.5 11.0 5.7 10.2 5.3
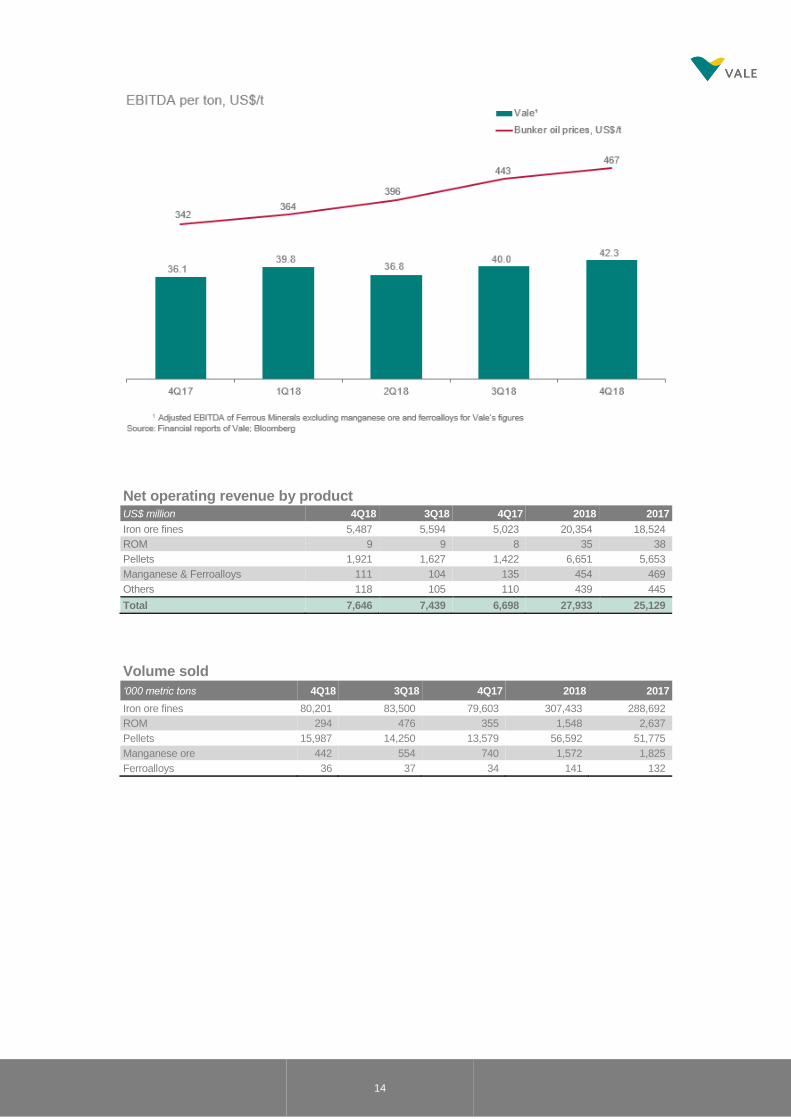
FERROUS MINERALS ADJUSTED EBITDA MARGIN4
Adjusted EBITDA per ton for Ferrous Minerals, excluding Manganese and Ferroalloys, was US$
42.3/t in 4Q18, an increase of US$ 2.3/t (5.8%) when compared to the US$ 40.0/t recorded in
3Q18, despite the increase in bunker oil prices (5.4%) and the appreciation of the BRL against
the USD (3.6%).
4 Excluding Manganese and Ferroalloys.
14
Net operating revenue by product US$ million 4Q18 3Q18 4Q17 2018 2017
Iron ore fines 5,487 5,594 5,023 20,354 18,524
ROM 9 9 8 35 38
Pellets 1,921 1,627 1,422 6,651 5,653
Manganese & Ferroalloys 111 104 135 454 469
Others 118 105 110 439 445
Total 7,646 7,439 6,698 27,933 25,129
Volume sold
‘000 metric tons 4Q18 3Q18 4Q17 2018 2017
Iron ore fines 80,201 83,500 79,603 307,433 288,692
ROM 294 476 355 1,548 2,637
Pellets 15,987 14,250 13,579 56,592 51,775
Manganese ore 442 554 740 1,572 1,825
Ferroalloys 36 37 34 141 132
15
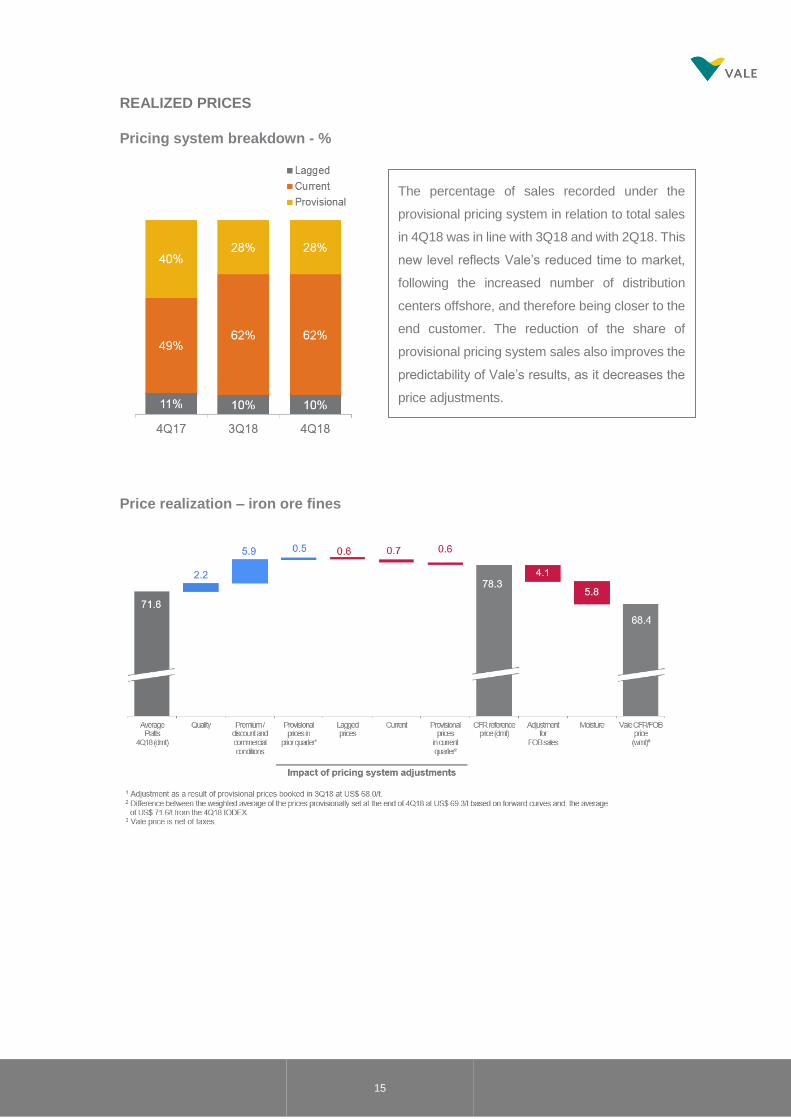
REALIZED PRICES
Pricing system breakdown - %
Price realization – iron ore fines
The percentage of sales recorded under the
provisional pricing system in relation to total sales
in 4Q18 was in line with 3Q18 and with 2Q18. This
new level reflects Vale’s reduced time to market,
following the increased number of distribution
centers offshore, and therefore being closer to the
end customer. The reduction of the share of
provisional pricing system sales also improves the
predictability of Vale’s results, as it decreases the
price adjustments.
16
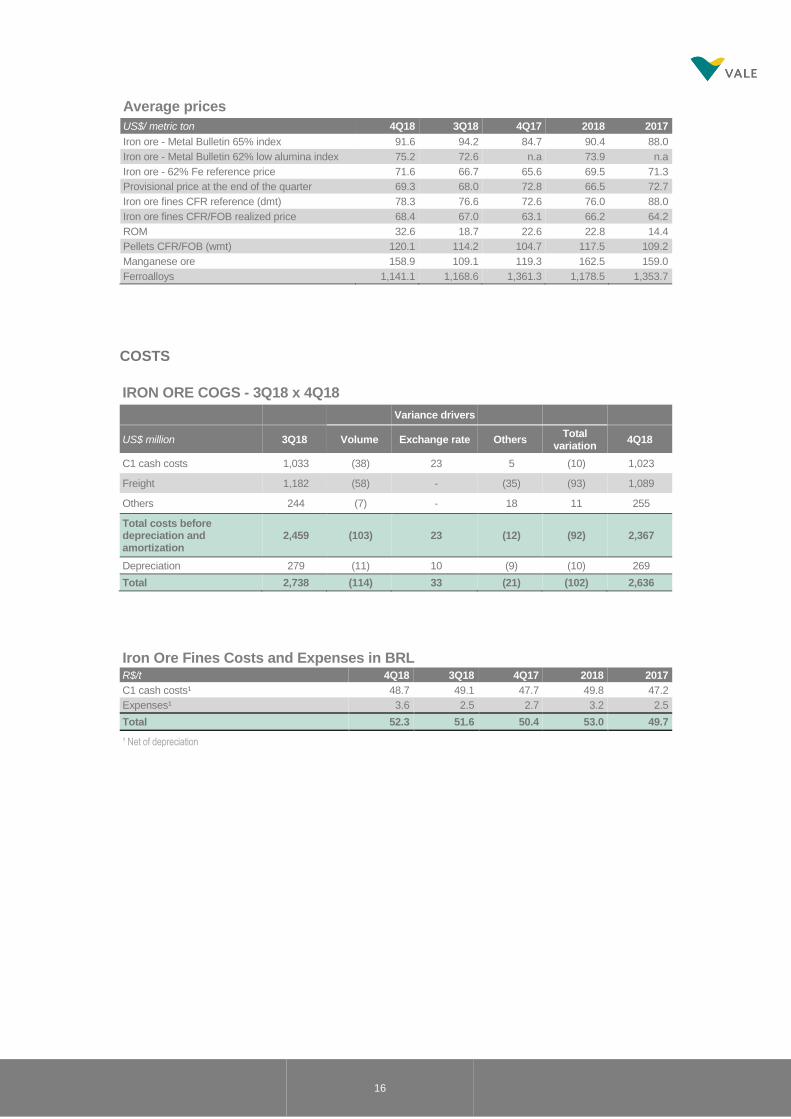
Average prices US$/ metric ton 4Q18 3Q18 4Q17 2018 2017
Iron ore - Metal Bulletin 65% index 91.6 94.2 84.7 90.4 88.0
Iron ore - Metal Bulletin 62% low alumina index 75.2 72.6 n.a 73.9 n.a
Iron ore - 62% Fe reference price 71.6 66.7 65.6 69.5 71.3
Provisional price at the end of the quarter 69.3 68.0 72.8 66.5 72.7
Iron ore fines CFR reference (dmt) 78.3 76.6 72.6 76.0 88.0
Iron ore fines CFR/FOB realized price 68.4 67.0 63.1 66.2 64.2
ROM 32.6 18.7 22.6 22.8 14.4
Pellets CFR/FOB (wmt) 120.1 114.2 104.7 117.5 109.2
Manganese ore 158.9 109.1 119.3 162.5 159.0
Ferroalloys 1,141.1 1,168.6 1,361.3 1,178.5 1,353.7
COSTS
IRON ORE COGS - 3Q18 x 4Q18
Variance drivers
US$ million 3Q18 Volume Exchange rate Others Total
variation 4Q18
C1 cash costs 1,033 (38) 23 5 (10) 1,023
Freight 1,182 (58) - (35) (93) 1,089
Others 244 (7) - 18 11 255
Total costs before depreciation and amortization
2,459 (103) 23 (12) (92) 2,367
Depreciation 279 (11) 10 (9) (10) 269
Total 2,738 (114) 33 (21) (102) 2,636
Iron Ore Fines Costs and Expenses in BRL R$/t 4Q18 3Q18 4Q17 2018 2017
C1 cash costs¹ 48.7 49.1 47.7 49.8 47.2
Expenses¹ 3.6 2.5 2.7 3.2 2.5
Total 52.3 51.6 50.4 53.0 49.7
¹ Net of depreciation
17
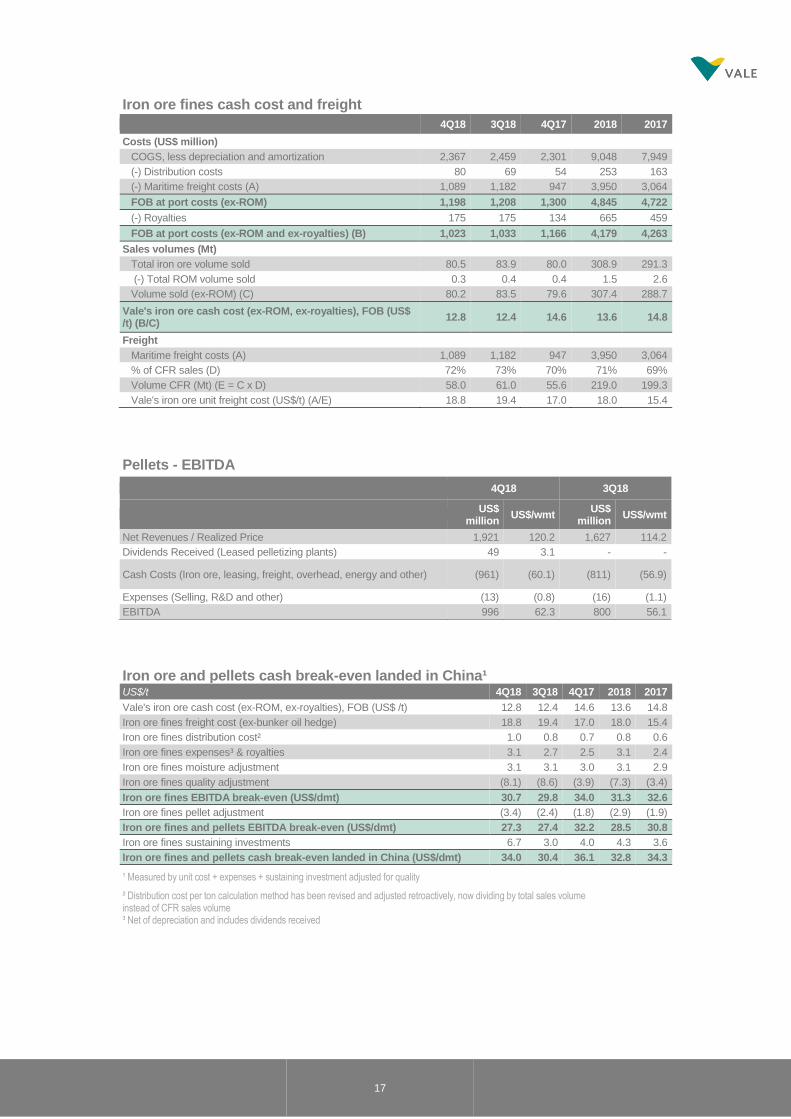
Iron ore fines cash cost and freight 4Q18 3Q18 4Q17 2018 2017
Costs (US$ million)
COGS, less depreciation and amortization 2,367 2,459 2,301 9,048 7,949
(-) Distribution costs 80 69 54 253 163
(-) Maritime freight costs (A) 1,089 1,182 947 3,950 3,064
FOB at port costs (ex-ROM) 1,198 1,208 1,300 4,845 4,722
(-) Royalties 175 175 134 665 459
FOB at port costs (ex-ROM and ex-royalties) (B) 1,023 1,033 1,166 4,179 4,263
Sales volumes (Mt)
Total iron ore volume sold 80.5 83.9 80.0 308.9 291.3
(-) Total ROM volume sold 0.3 0.4 0.4 1.5 2.6
Volume sold (ex-ROM) (C) 80.2 83.5 79.6 307.4 288.7
Vale's iron ore cash cost (ex-ROM, ex-royalties), FOB (US$ /t) (B/C)
12.8 12.4 14.6 13.6 14.8
Freight
Maritime freight costs (A) 1,089 1,182 947 3,950 3,064
% of CFR sales (D) 72% 73% 70% 71% 69%
Volume CFR (Mt) (E = C x D) 58.0 61.0 55.6 219.0 199.3
Vale's iron ore unit freight cost (US$/t) (A/E) 18.8 19.4 17.0 18.0 15.4
Pellets - EBITDA
4Q18 3Q18
US$
million US$/wmt
US$ million
US$/wmt
Net Revenues / Realized Price 1,921 120.2 1,627 114.2
Dividends Received (Leased pelletizing plants) 49 3.1 - -
Cash Costs (Iron ore, leasing, freight, overhead, energy and other) (961) (60.1) (811) (56.9)
Expenses (Selling, R&D and other) (13) (0.8) (16) (1.1)
EBITDA 996 62.3 800 56.1
Iron ore and pellets cash break-even landed in China¹ US$/t 4Q18 3Q18 4Q17 2018 2017
Vale's iron ore cash cost (ex-ROM, ex-royalties), FOB (US$ /t) 12.8 12.4 14.6 13.6 14.8
Iron ore fines freight cost (ex-bunker oil hedge) 18.8 19.4 17.0 18.0 15.4
Iron ore fines distribution cost² 1.0 0.8 0.7 0.8 0.6
Iron ore fines expenses³ & royalties 3.1 2.7 2.5 3.1 2.4
Iron ore fines moisture adjustment 3.1 3.1 3.0 3.1 2.9
Iron ore fines quality adjustment (8.1) (8.6) (3.9) (7.3) (3.4)
Iron ore fines EBITDA break-even (US$/dmt) 30.7 29.8 34.0 31.3 32.6
Iron ore fines pellet adjustment (3.4) (2.4) (1.8) (2.9) (1.9)
Iron ore fines and pellets EBITDA break-even (US$/dmt) 27.3 27.4 32.2 28.5 30.8
Iron ore fines sustaining investments 6.7 3.0 4.0 4.3 3.6
Iron ore fines and pellets cash break-even landed in China (US$/dmt) 34.0 30.4 36.1 32.8 34.3
¹ Measured by unit cost + expenses + sustaining investment adjusted for quality
² Distribution cost per ton calculation method has been revised and adjusted retroactively, now dividing by total sales volume instead of CFR sales volume ³ Net of depreciation and includes dividends received
18
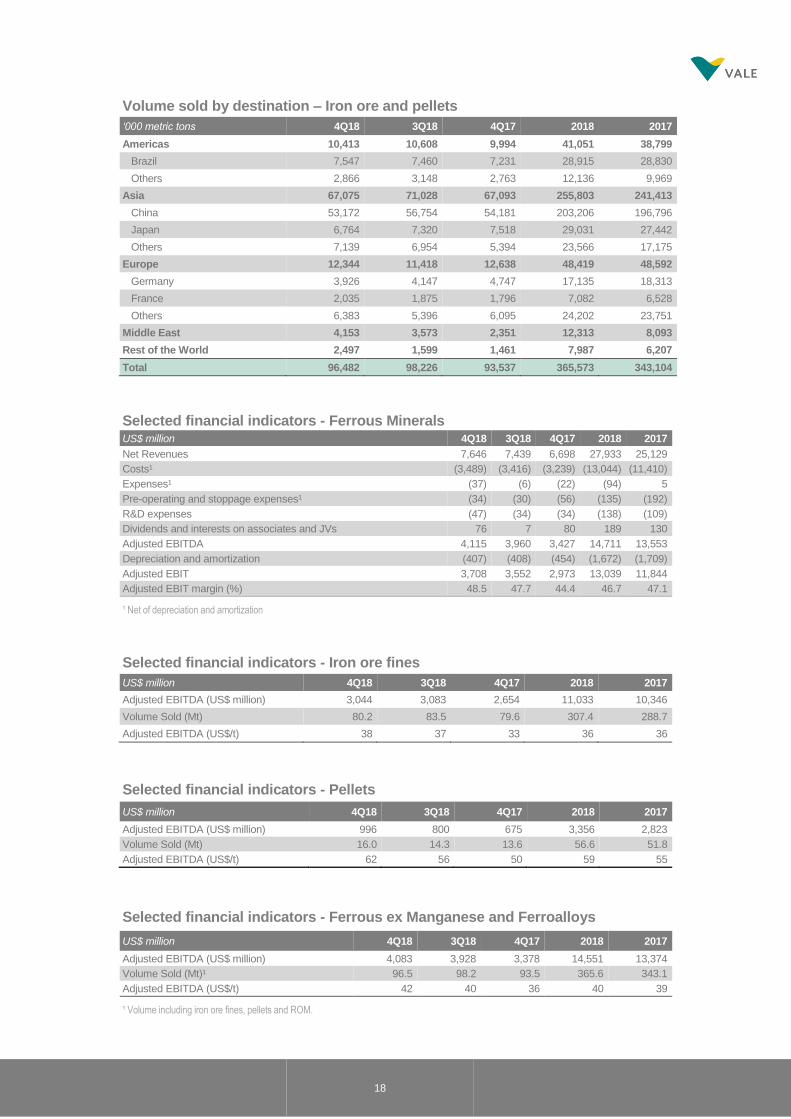
Volume sold by destination – Iron ore and pellets
‘000 metric tons 4Q18 3Q18 4Q17 2018 2017
Americas 10,413 10,608 9,994 41,051 38,799
Brazil 7,547 7,460 7,231 28,915 28,830
Others 2,866 3,148 2,763 12,136 9,969
Asia 67,075 71,028 67,093 255,803 241,413
China 53,172 56,754 54,181 203,206 196,796
Japan 6,764 7,320 7,518 29,031 27,442
Others 7,139 6,954 5,394 23,566 17,175
Europe 12,344 11,418 12,638 48,419 48,592
Germany 3,926 4,147 4,747 17,135 18,313
France 2,035 1,875 1,796 7,082 6,528
Others 6,383 5,396 6,095 24,202 23,751
Middle East 4,153 3,573 2,351 12,313 8,093
Rest of the World 2,497 1,599 1,461 7,987 6,207
Total 96,482 98,226 93,537 365,573 343,104
Selected financial indicators - Ferrous Minerals US$ million 4Q18 3Q18 4Q17 2018 2017
Net Revenues 7,646 7,439 6,698 27,933 25,129
Costs¹ (3,489) (3,416) (3,239) (13,044) (11,410)
Expenses¹ (37) (6) (22) (94) 5
Pre-operating and stoppage expenses¹ (34) (30) (56) (135) (192)
R&D expenses (47) (34) (34) (138) (109)
Dividends and interests on associates and JVs 76 7 80 189 130
Adjusted EBITDA 4,115 3,960 3,427 14,711 13,553
Depreciation and amortization (407) (408) (454) (1,672) (1,709)
Adjusted EBIT 3,708 3,552 2,973 13,039 11,844
Adjusted EBIT margin (%) 48.5 47.7 44.4 46.7 47.1
¹ Net of depreciation and amortization
Selected financial indicators - Iron ore fines
US$ million 4Q18 3Q18 4Q17 2018 2017
Adjusted EBITDA (US$ million) 3,044 3,083 2,654 11,033 10,346
Volume Sold (Mt) 80.2 83.5 79.6 307.4 288.7
Adjusted EBITDA (US$/t) 38 37 33 36 36
Selected financial indicators - Pellets
US$ million 4Q18 3Q18 4Q17 2018 2017
Adjusted EBITDA (US$ million) 996 800 675 3,356 2,823
Volume Sold (Mt) 16.0 14.3 13.6 56.6 51.8
Adjusted EBITDA (US$/t) 62 56 50 59 55
Selected financial indicators - Ferrous ex Manganese and Ferroalloys
US$ million 4Q18 3Q18 4Q17 2018 2017
Adjusted EBITDA (US$ million) 4,083 3,928 3,378 14,551 13,374
Volume Sold (Mt)¹ 96.5 98.2 93.5 365.6 343.1
Adjusted EBITDA (US$/t) 42 40 36 40 39
¹ Volume including iron ore fines, pellets and ROM.
19
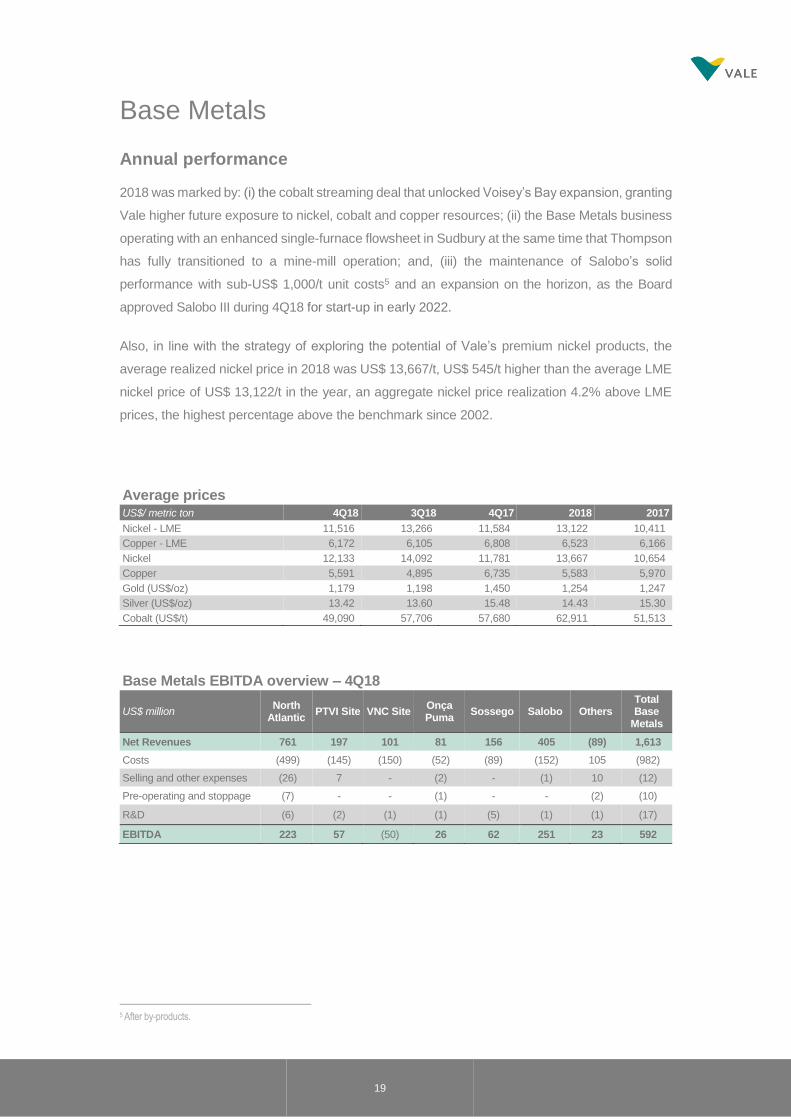
Base Metals
Annual performance
2018 was marked by: (i) the cobalt streaming deal that unlocked Voisey’s Bay expansion, granting
Vale higher future exposure to nickel, cobalt and copper resources; (ii) the Base Metals business
operating with an enhanced single-furnace flowsheet in Sudbury at the same time that Thompson
has fully transitioned to a mine-mill operation; and, (iii) the maintenance of Salobo’s solid
performance with sub-US$ 1,000/t unit costs5 and an expansion on the horizon, as the Board
approved Salobo III during 4Q18 for start-up in early 2022.
Also, in line with the strategy of exploring the potential of Vale’s premium nickel products, the
average realized nickel price in 2018 was US$ 13,667/t, US$ 545/t higher than the average LME
nickel price of US$ 13,122/t in the year, an aggregate nickel price realization 4.2% above LME
prices, the highest percentage above the benchmark since 2002.
Average prices US$/ metric ton 4Q18 3Q18 4Q17 2018 2017
Nickel - LME 11,516 13,266 11,584 13,122 10,411
Copper - LME 6,172 6,105 6,808 6,523 6,166
Nickel 12,133 14,092 11,781 13,667 10,654
Copper 5,591 4,895 6,735 5,583 5,970
Gold (US$/oz) 1,179 1,198 1,450 1,254 1,247
Silver (US$/oz) 13.42 13.60 15.48 14.43 15.30
Cobalt (US$/t) 49,090 57,706 57,680 62,911 51,513
Base Metals EBITDA overview – 4Q18
US$ million North
Atlantic PTVI Site VNC Site
Onça Puma
Sossego Salobo Others Total Base
Metals
Net Revenues 761 197 101 81 156 405 (89) 1,613
Costs (499) (145) (150) (52) (89) (152) 105 (982)
Selling and other expenses (26) 7 - (2) - (1) 10 (12)
Pre-operating and stoppage (7) - - (1) - - (2) (10)
R&D (6) (2) (1) (1) (5) (1) (1) (17)
EBITDA 223 57 (50) 26 62 251 23 592
5 After by-products.

20
Nickel operations
Nickel operations – EBITDA by operation US$ million 4Q18 3Q18 4Q17 2018 2017
North Atlantic operation¹ 223 148 366 1,022 910
PTVI 57 70 45 236 117
VNC (50) (42) 12 (63) (62)
Onça Puma 26 29 32 105 45
Others² 23 55 (13) 131 49
Total 279 260 441 1,431 1,059
¹ Includes the operations in Canada and in the United Kingdom.
² Includes the PTVI and VNC off-takes, intercompany sales eliminations, purchase of finished nickel and corporate center allocation for Base Metals.
Nickel operations – unit cash cost of sales, net of by-product credits
US$/t 4Q18 3Q18 4Q17 2018 2017
North Atlantic operations¹ 4,703 9,234 4,624 6,227 5,287
PTVI 6,897 7,084 6,609 7,090 6,515
VNC 13,793 15,100 8,420 12,405 10,053
Onça Puma 7,517 7,938 7,536 7,751 8,642
¹ North Atlantic figures include Clydach refining costs.
EBITDA breakeven – nickel operations¹
¹ Considering only the cash effect of US$ 400/oz that Wheaton Precious Metals pays for 70% of Sudbury’s gold by-product, nickel operations EBITDA breakeven would increase to US$ 7,646/t.
21
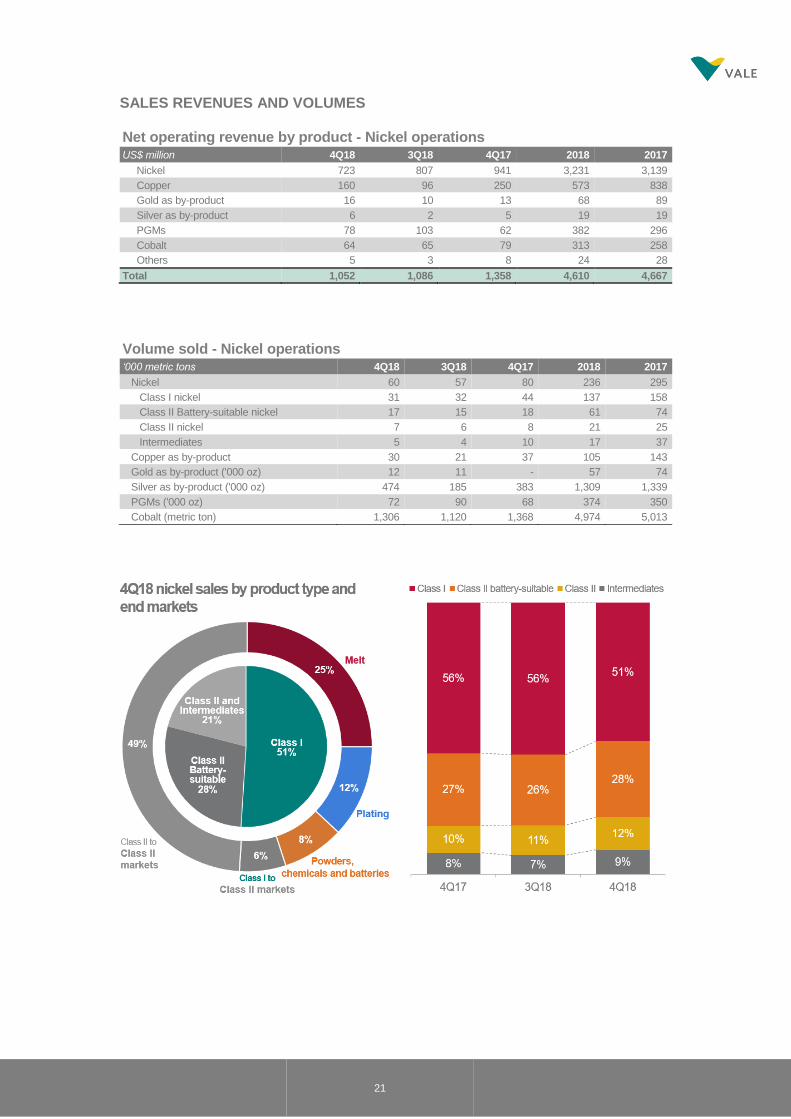
SALES REVENUES AND VOLUMES
Net operating revenue by product - Nickel operations US$ million 4Q18 3Q18 4Q17 2018 2017
Nickel 723 807 941 3,231 3,139
Copper 160 96 250 573 838
Gold as by-product 16 10 13 68 89
Silver as by-product 6 2 5 19 19
PGMs 78 103 62 382 296
Cobalt 64 65 79 313 258
Others 5 3 8 24 28
Total 1,052 1,086 1,358 4,610 4,667
Volume sold - Nickel operations ‘000 metric tons 4Q18 3Q18 4Q17 2018 2017
Nickel 60 57 80 236 295
Class I nickel 31 32 44 137 158
Class II Battery-suitable nickel 17 15 18 61 74
Class II nickel 7 6 8 21 25
Intermediates 5 4 10 17 37
Copper as by-product 30 21 37 105 143
Gold as by-product ('000 oz) 12 11 - 57 74
Silver as by-product ('000 oz) 474 185 383 1,309 1,339
PGMs ('000 oz) 72 90 68 374 350
Cobalt (metric ton) 1,306 1,120 1,368 4,974 5,013

22
Class I products, 31 kt, 51% of nickel sales in 4Q18
Class II Battery-suitable, Class II and Intermediates, 29 kt, 49% of nickel sales in 4Q18
Premiums / discount by nickel product US$/t 4Q18 3Q18 4Q17
Class I nickel 1,240 1,320 940
Class II Battery-suitable nickel (500) (90) (230)
Class II nickel 50 260 200
Intermediates (2,970) (2,860) (1,370)

23
Nickel premium/discount by product and average aggregate premiums
Nickel COGS - 3Q18 x 4Q18
Variance drivers
US$ million 3Q18 Volume Exchange
rate Others Total variation 4Q18
Nickel operations 804 27 (5) (85) (63) 741
Depreciation 314 41 (1) (119) (79) 235
Total 1,118 68 (6) (204) (142) 976
Selected financial indicators - Nickel operations
US$ million 4Q18 3Q18 4Q17 2018 2017
Net Revenues 1,052 1,086 1,358 4,610 4,667
Costs¹ (741) (804) (874) (3,060) (3,437)
Expenses¹ (11) (3) (3) (47) (47)
Pre-operating and stoppage expenses¹ (10) (8) (25) (33) (75)
R&D expenses (11) (11) (15) (39) (49)
Dividends and interests on associates and JVs - - - - -
Adjusted EBITDA 279 260 441 1,431 1,059
Depreciation and amortization (237) (316) (377) (1,162) (1,372)
Adjusted EBIT 42 (56) 64 269 (313)
Adjusted EBIT margin (%) 4.0 (5.2) 4.7 5.8 (6.7)
¹ Net of depreciation and amortization
24
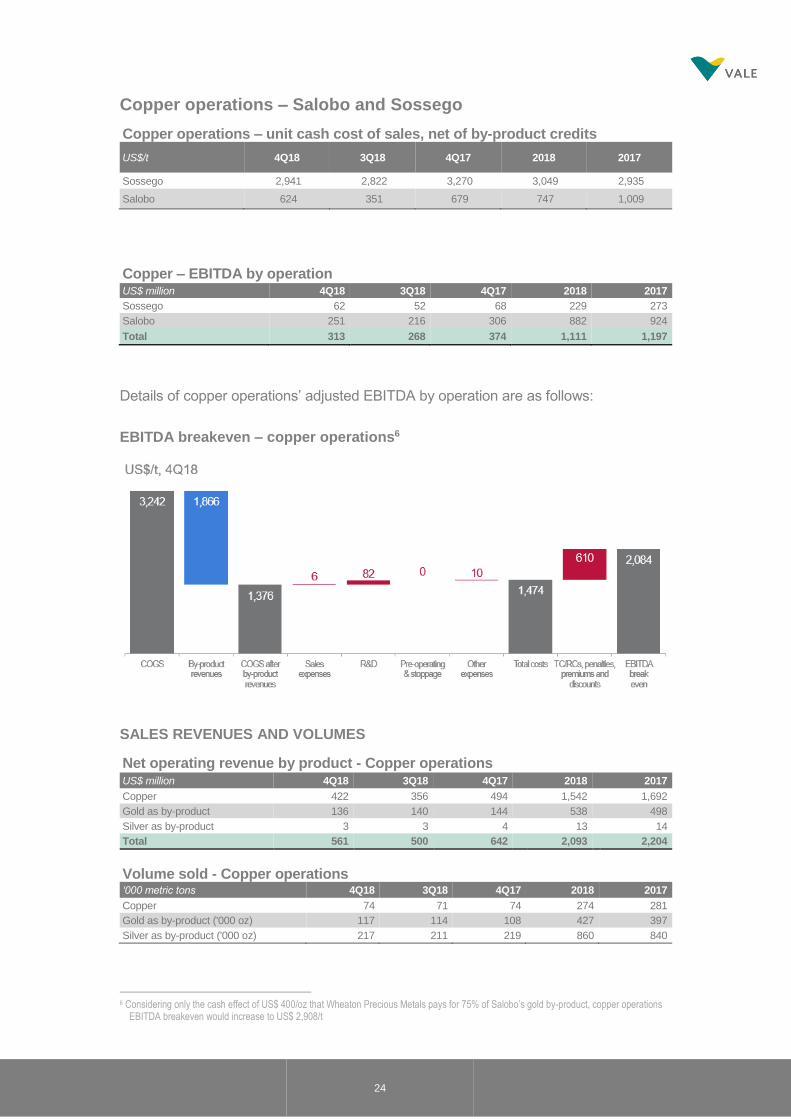
Copper operations – Salobo and Sossego
Copper operations – unit cash cost of sales, net of by-product credits
US$/t 4Q18 3Q18 4Q17 2018 2017
Sossego 2,941 2,822 3,270 3,049 2,935
Salobo 624 351 679 747 1,009
Copper – EBITDA by operation US$ million 4Q18 3Q18 4Q17 2018 2017
Sossego 62 52 68 229 273
Salobo 251 216 306 882 924
Total 313 268 374 1,111 1,197
Details of copper operations’ adjusted EBITDA by operation are as follows:
EBITDA breakeven – copper operations6
SALES REVENUES AND VOLUMES
Net operating revenue by product - Copper operations US$ million 4Q18 3Q18 4Q17 2018 2017
Copper 422 356 494 1,542 1,692
Gold as by-product 136 140 144 538 498
Silver as by-product 3 3 4 13 14
Total 561 500 642 2,093 2,204
Volume sold - Copper operations ‘000 metric tons 4Q18 3Q18 4Q17 2018 2017
Copper 74 71 74 274 281
Gold as by-product ('000 oz) 117 114 108 427 397
Silver as by-product ('000 oz) 217 211 219 860 840
6 Considering only the cash effect of US$ 400/oz that Wheaton Precious Metals pays for 75% of Salobo’s gold by-product, copper operations
EBITDA breakeven would increase to US$ 2,908/t
25
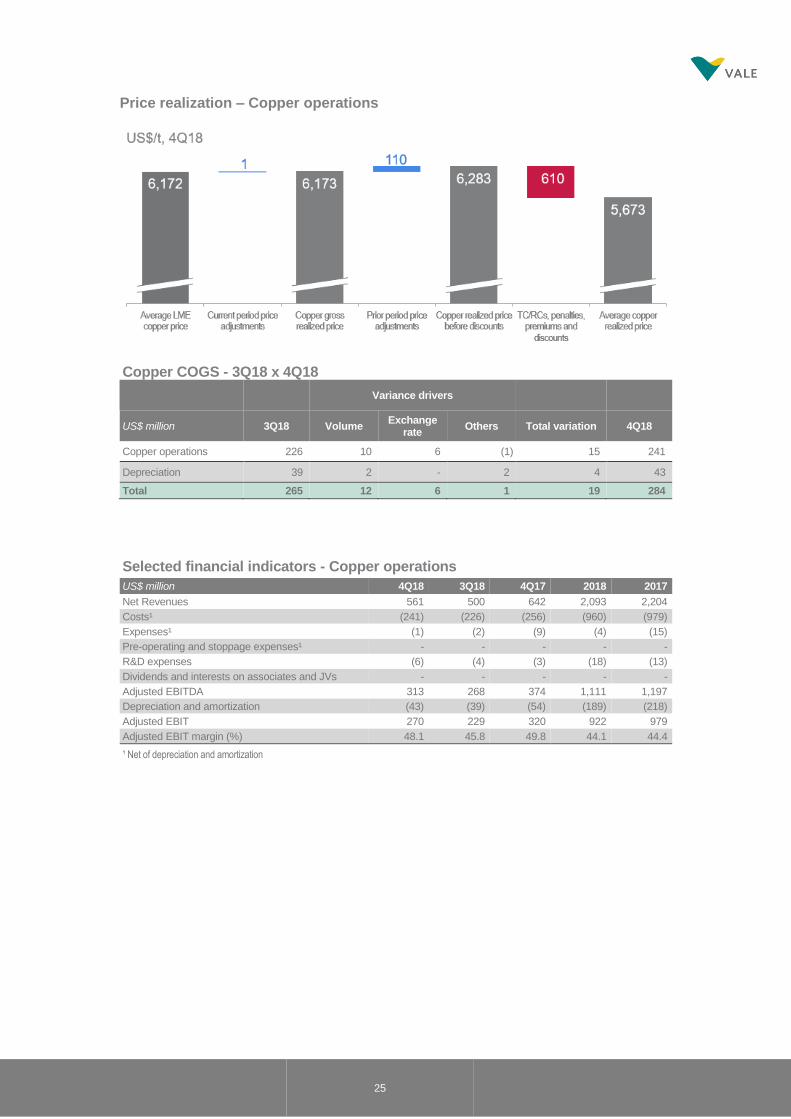
Price realization – Copper operations
Copper COGS - 3Q18 x 4Q18
Variance drivers
US$ million 3Q18 Volume Exchange
rate Others Total variation 4Q18
Copper operations 226 10 6 (1) 15 241
Depreciation 39 2 - 2 4 43
Total 265 12 6 1 19 284
Selected financial indicators - Copper operations
US$ million 4Q18 3Q18 4Q17 2018 2017
Net Revenues 561 500 642 2,093 2,204
Costs¹ (241) (226) (256) (960) (979)
Expenses¹ (1) (2) (9) (4) (15)
Pre-operating and stoppage expenses¹ - - - - -
R&D expenses (6) (4) (3) (18) (13)
Dividends and interests on associates and JVs - - - - -
Adjusted EBITDA 313 268 374 1,111 1,197
Depreciation and amortization (43) (39) (54) (189) (218)
Adjusted EBIT 270 229 320 922 979
Adjusted EBIT margin (%) 48.1 45.8 49.8 44.1 44.4
¹ Net of depreciation and amortization
26
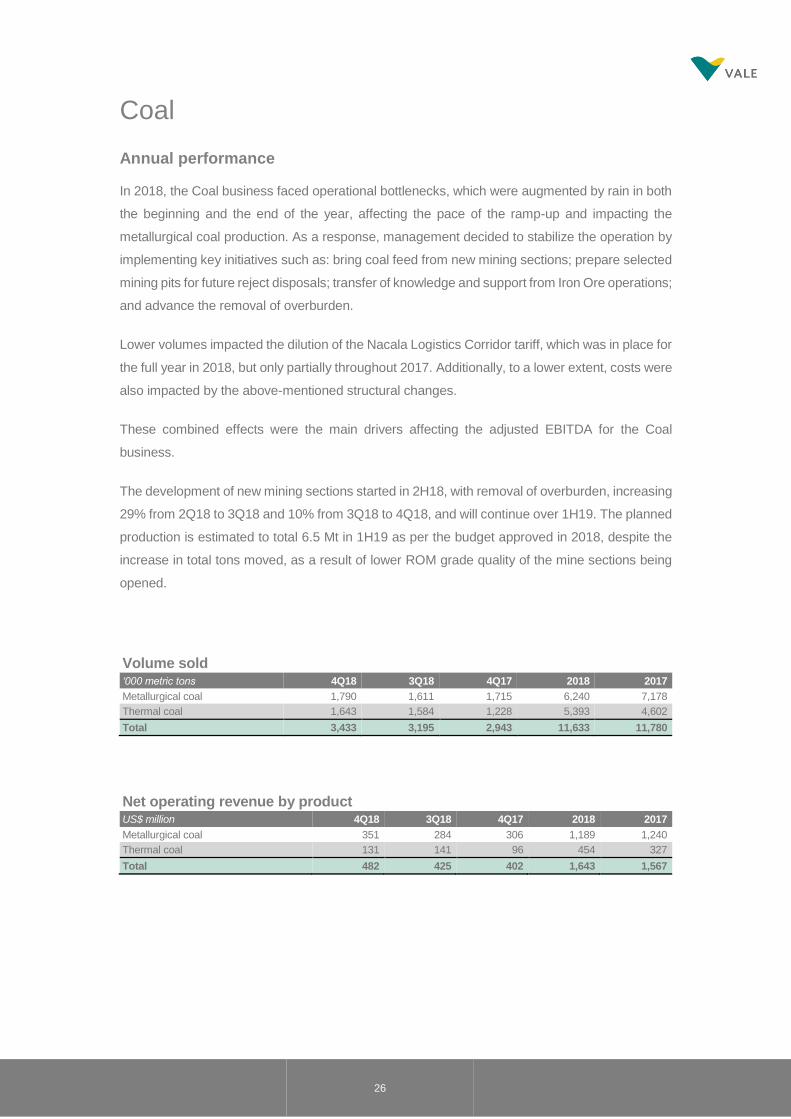
Coal
Annual performance
In 2018, the Coal business faced operational bottlenecks, which were augmented by rain in both
the beginning and the end of the year, affecting the pace of the ramp-up and impacting the
metallurgical coal production. As a response, management decided to stabilize the operation by
implementing key initiatives such as: bring coal feed from new mining sections; prepare selected
mining pits for future reject disposals; transfer of knowledge and support from Iron Ore operations;
and advance the removal of overburden.
Lower volumes impacted the dilution of the Nacala Logistics Corridor tariff, which was in place for
the full year in 2018, but only partially throughout 2017. Additionally, to a lower extent, costs were
also impacted by the above-mentioned structural changes.
These combined effects were the main drivers affecting the adjusted EBITDA for the Coal
business.
The development of new mining sections started in 2H18, with removal of overburden, increasing
29% from 2Q18 to 3Q18 and 10% from 3Q18 to 4Q18, and will continue over 1H19. The planned
production is estimated to total 6.5 Mt in 1H19 as per the budget approved in 2018, despite the
increase in total tons moved, as a result of lower ROM grade quality of the mine sections being
opened.
Volume sold ‘000 metric tons 4Q18 3Q18 4Q17 2018 2017
Metallurgical coal 1,790 1,611 1,715 6,240 7,178
Thermal coal 1,643 1,584 1,228 5,393 4,602
Total 3,433 3,195 2,943 11,633 11,780
Net operating revenue by product US$ million 4Q18 3Q18 4Q17 2018 2017
Metallurgical coal 351 284 306 1,189 1,240
Thermal coal 131 141 96 454 327
Total 482 425 402 1,643 1,567
27
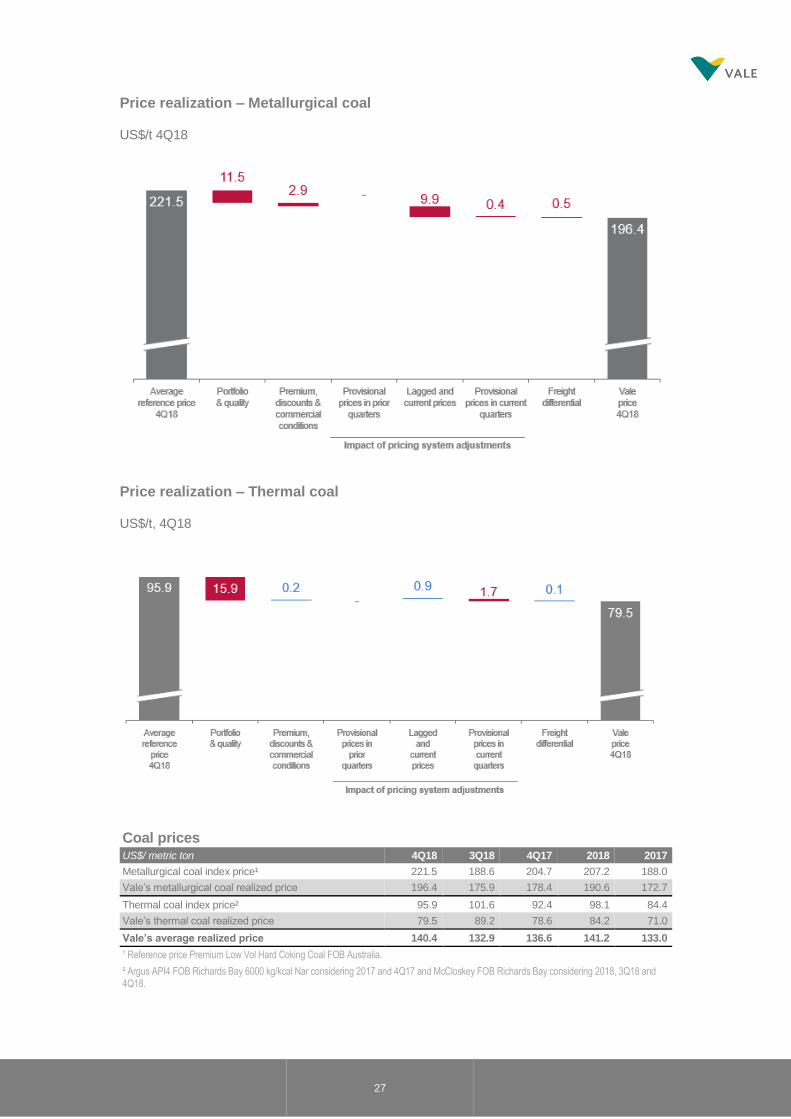
Price realization – Metallurgical coal
US$/t 4Q18
Price realization – Thermal coal
US$/t, 4Q18
Coal prices US$/ metric ton 4Q18 3Q18 4Q17 2018 2017
Metallurgical coal index price¹ 221.5 188.6 204.7 207.2 188.0
Vale’s metallurgical coal realized price 196.4 175.9 178.4 190.6 172.7
Thermal coal index price² 95.9 101.6 92.4 98.1 84.4
Vale’s thermal coal realized price 79.5 89.2 78.6 84.2 71.0
Vale’s average realized price 140.4 132.9 136.6 141.2 133.0
¹ Reference price Premium Low Vol Hard Coking Coal FOB Australia. ² Argus API4 FOB Richards Bay 6000 kg/kcal Nar considering 2017 and 4Q17 and McCloskey FOB Richards Bay considering 2018, 3Q18 and 4Q18.
28
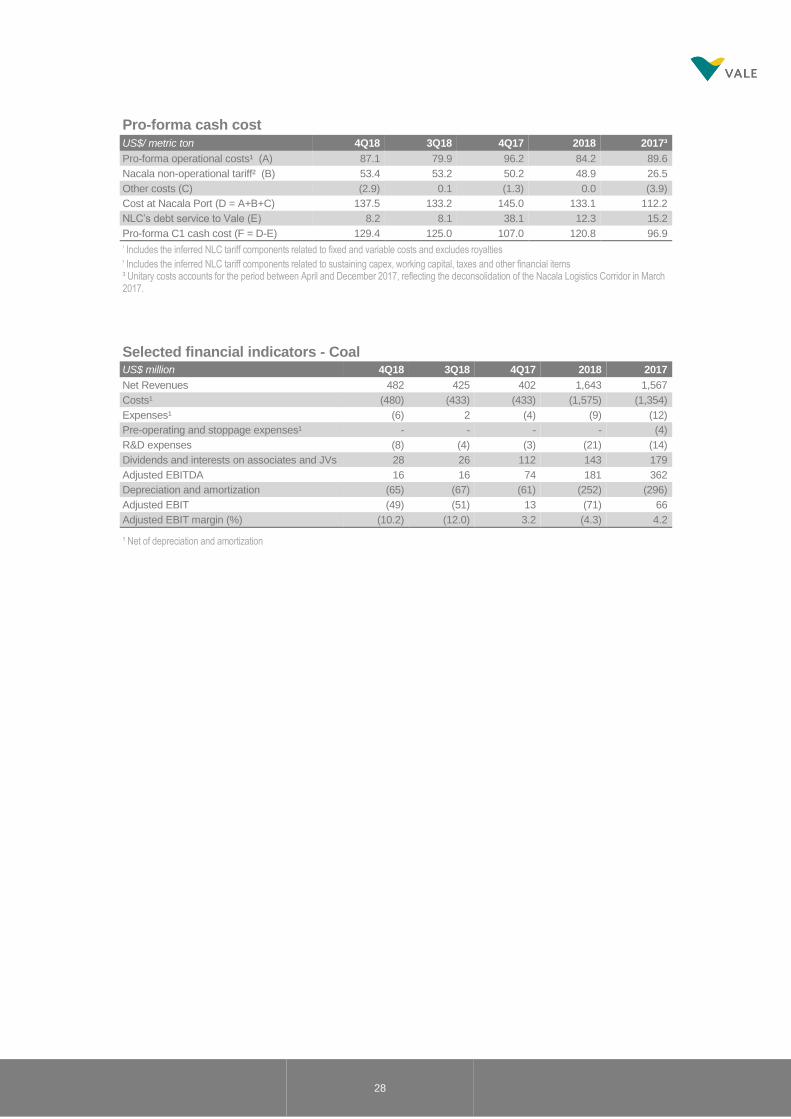
Pro-forma cash cost US$/ metric ton 4Q18 3Q18 4Q17 2018 2017³
Pro-forma operational costs¹ (A) 87.1 79.9 96.2 84.2 89.6
Nacala non-operational tariff² (B) 53.4 53.2 50.2 48.9 26.5
Other costs (C) (2.9) 0.1 (1.3) 0.0 (3.9)
Cost at Nacala Port (D = A+B+C) 137.5 133.2 145.0 133.1 112.2
NLC’s debt service to Vale (E) 8.2 8.1 38.1 12.3 15.2
Pro-forma C1 cash cost (F = D-E) 129.4 125.0 107.0 120.8 96.9
¹ Includes the inferred NLC tariff components related to fixed and variable costs and excludes royalties ² Includes the inferred NLC tariff components related to sustaining capex, working capital, taxes and other financial items ³ Unitary costs accounts for the period between April and December 2017, reflecting the deconsolidation of the Nacala Logistics Corridor in March 2017.
Selected financial indicators - Coal US$ million 4Q18 3Q18 4Q17 2018 2017
Net Revenues 482 425 402 1,643 1,567
Costs¹ (480) (433) (433) (1,575) (1,354)
Expenses¹ (6) 2 (4) (9) (12)
Pre-operating and stoppage expenses¹ - - - - (4)
R&D expenses (8) (4) (3) (21) (14)
Dividends and interests on associates and JVs 28 26 112 143 179
Adjusted EBITDA 16 16 74 181 362
Depreciation and amortization (65) (67) (61) (252) (296)
Adjusted EBIT (49) (51) 13 (71) 66
Adjusted EBIT margin (%) (10.2) (12.0) 3.2 (4.3) 4.2
¹ Net of depreciation and amortization
29
ANNEXES
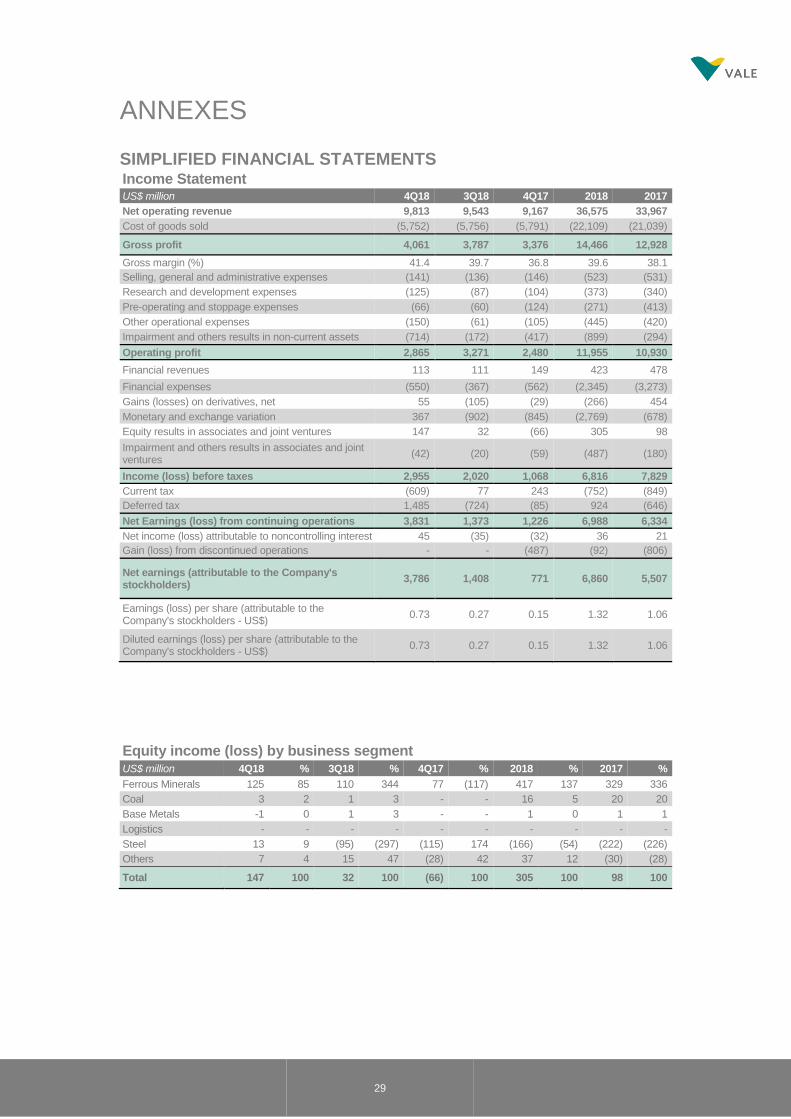
SIMPLIFIED FINANCIAL STATEMENTS Income Statement US$ million 4Q18 3Q18 4Q17 2018 2017
Net operating revenue 9,813 9,543 9,167 36,575 33,967
Cost of goods sold (5,752) (5,756) (5,791) (22,109) (21,039)
Gross profit 4,061 3,787 3,376 14,466 12,928
Gross margin (%) 41.4 39.7 36.8 39.6 38.1
Selling, general and administrative expenses (141) (136) (146) (523) (531)
Research and development expenses (125) (87) (104) (373) (340)
Pre-operating and stoppage expenses (66) (60) (124) (271) (413)
Other operational expenses (150) (61) (105) (445) (420)
Impairment and others results in non-current assets (714) (172) (417) (899) (294)
Operating profit 2,865 3,271 2,480 11,955 10,930
Financial revenues 113 111 149 423 478
Financial expenses (550) (367) (562) (2,345) (3,273)
Gains (losses) on derivatives, net 55 (105) (29) (266) 454
Monetary and exchange variation 367 (902) (845) (2,769) (678)
Equity results in associates and joint ventures 147 32 (66) 305 98
Impairment and others results in associates and joint ventures
(42) (20) (59) (487) (180)
Income (loss) before taxes 2,955 2,020 1,068 6,816 7,829
Current tax (609) 77 243 (752) (849)
Deferred tax 1,485 (724) (85) 924 (646)
Net Earnings (loss) from continuing operations 3,831 1,373 1,226 6,988 6,334
Net income (loss) attributable to noncontrolling interest 45 (35) (32) 36 21
Gain (loss) from discontinued operations - - (487) (92) (806)
Net earnings (attributable to the Company's stockholders)
3,786 1,408 771 6,860 5,507
Earnings (loss) per share (attributable to the Company's stockholders - US$)
0.73 0.27 0.15 1.32 1.06
Diluted earnings (loss) per share (attributable to the Company's stockholders - US$)
0.73 0.27 0.15 1.32 1.06
Equity income (loss) by business segment US$ million 4Q18 % 3Q18 % 4Q17 % 2018 % 2017 %
Ferrous Minerals 125 85 110 344 77 (117) 417 137 329 336
Coal 3 2 1 3 - - 16 5 20 20
Base Metals -1 0 1 3 - - 1 0 1 1
Logistics - - - - - - - - - -
Steel 13 9 (95) (297) (115) 174 (166) (54) (222) (226)
Others 7 4 15 47 (28) 42 37 12 (30) (28)
Total 147 100 32 100 (66) 100 305 100 98 100
30
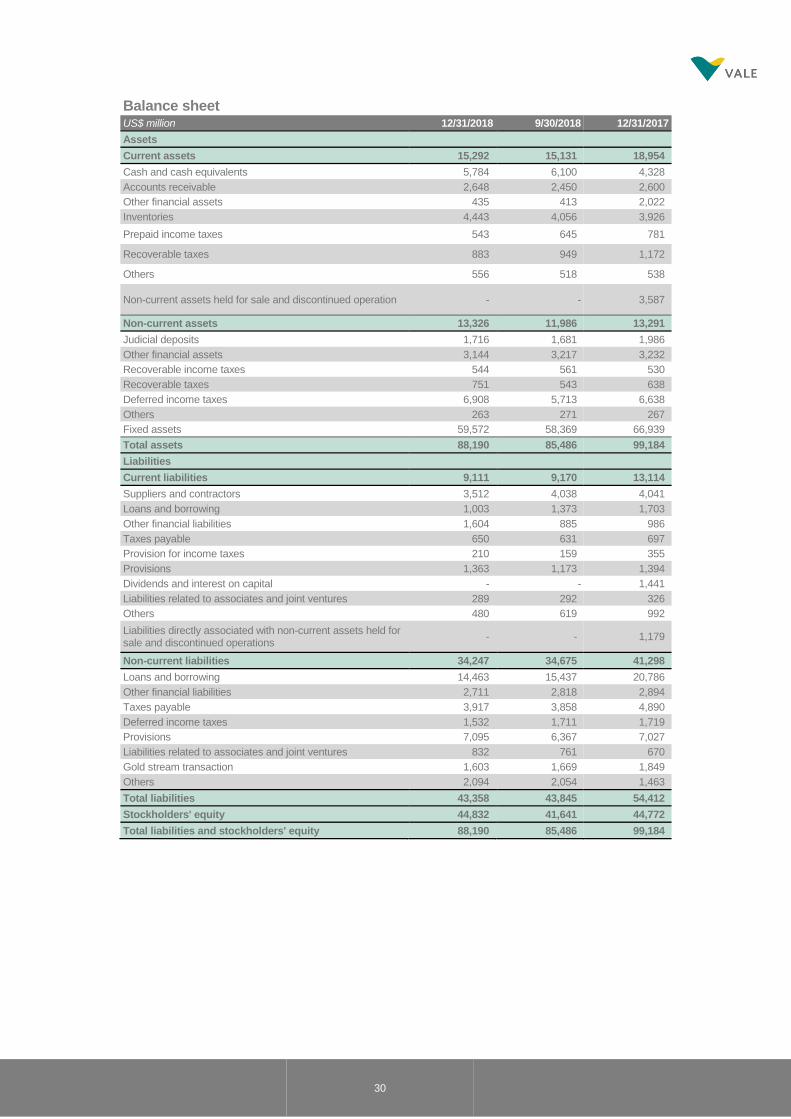
Balance sheet US$ million 12/31/2018 9/30/2018 12/31/2017
Assets
Current assets 15,292 15,131 18,954
Cash and cash equivalents 5,784 6,100 4,328
Accounts receivable 2,648 2,450 2,600
Other financial assets 435 413 2,022
Inventories 4,443 4,056 3,926
Prepaid income taxes 543 645 781
Recoverable taxes 883 949 1,172
Others 556 518 538
Non-current assets held for sale and discontinued operation - - 3,587
Non-current assets 13,326 11,986 13,291
Judicial deposits 1,716 1,681 1,986
Other financial assets 3,144 3,217 3,232
Recoverable income taxes 544 561 530
Recoverable taxes 751 543 638
Deferred income taxes 6,908 5,713 6,638
Others 263 271 267
Fixed assets 59,572 58,369 66,939
Total assets 88,190 85,486 99,184
Liabilities
Current liabilities 9,111 9,170 13,114
Suppliers and contractors 3,512 4,038 4,041
Loans and borrowing 1,003 1,373 1,703
Other financial liabilities 1,604 885 986
Taxes payable 650 631 697
Provision for income taxes 210 159 355
Provisions 1,363 1,173 1,394
Dividends and interest on capital - - 1,441
Liabilities related to associates and joint ventures 289 292 326
Others 480 619 992
Liabilities directly associated with non-current assets held for sale and discontinued operations
- - 1,179
Non-current liabilities 34,247 34,675 41,298
Loans and borrowing 14,463 15,437 20,786
Other financial liabilities 2,711 2,818 2,894
Taxes payable 3,917 3,858 4,890
Deferred income taxes 1,532 1,711 1,719
Provisions 7,095 6,367 7,027
Liabilities related to associates and joint ventures 832 761 670
Gold stream transaction 1,603 1,669 1,849
Others 2,094 2,054 1,463
Total liabilities 43,358 43,845 54,412
Stockholders' equity 44,832 41,641 44,772
Total liabilities and stockholders' equity 88,190 85,486 99,184
31
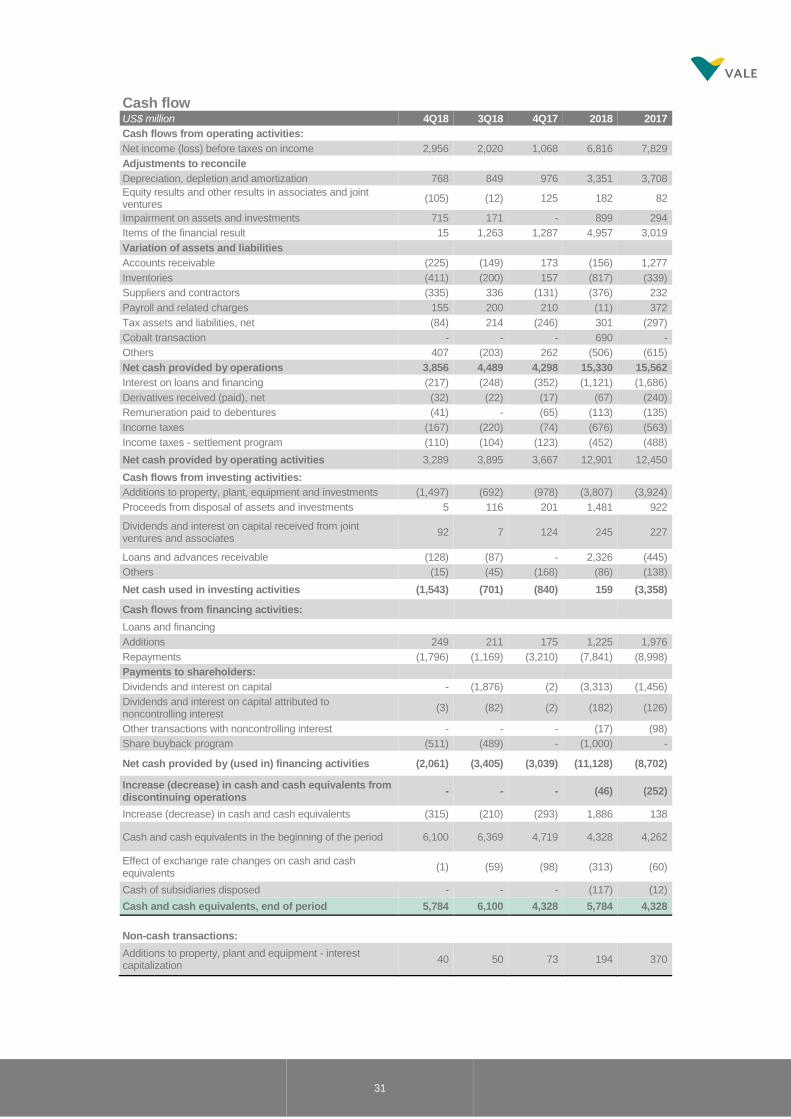
Cash flow US$ million 4Q18 3Q18 4Q17 2018 2017
Cash flows from operating activities:
Net income (loss) before taxes on income 2,956 2,020 1,068 6,816 7,829
Adjustments to reconcile
Depreciation, depletion and amortization 768 849 976 3,351 3,708
Equity results and other results in associates and joint ventures
(105) (12) 125 182 82
Impairment on assets and investments 715 171 - 899 294
Items of the financial result 15 1,263 1,287 4,957 3,019
Variation of assets and liabilities
Accounts receivable (225) (149) 173 (156) 1,277
Inventories (411) (200) 157 (817) (339)
Suppliers and contractors (335) 336 (131) (376) 232
Payroll and related charges 155 200 210 (11) 372
Tax assets and liabilities, net (84) 214 (246) 301 (297)
Cobalt transaction - - - 690 -
Others 407 (203) 262 (506) (615)
Net cash provided by operations 3,856 4,489 4,298 15,330 15,562
Interest on loans and financing (217) (248) (352) (1,121) (1,686)
Derivatives received (paid), net (32) (22) (17) (67) (240)
Remuneration paid to debentures (41) - (65) (113) (135)
Income taxes (167) (220) (74) (676) (563)
Income taxes - settlement program (110) (104) (123) (452) (488)
Net cash provided by operating activities 3,289 3,895 3,667 12,901 12,450
Cash flows from investing activities:
Additions to property, plant, equipment and investments (1,497) (692) (978) (3,807) (3,924)
Proceeds from disposal of assets and investments 5 116 201 1,481 922
Dividends and interest on capital received from joint ventures and associates
92 7 124 245 227
Loans and advances receivable (128) (87) - 2,326 (445)
Others (15) (45) (168) (86) (138)
Net cash used in investing activities (1,543) (701) (840) 159 (3,358)
Cash flows from financing activities:
Loans and financing
Additions 249 211 175 1,225 1,976
Repayments (1,796) (1,169) (3,210) (7,841) (8,998)
Payments to shareholders:
Dividends and interest on capital - (1,876) (2) (3,313) (1,456)
Dividends and interest on capital attributed to noncontrolling interest
(3) (82) (2) (182) (126)
Other transactions with noncontrolling interest - - - (17) (98)
Share buyback program (511) (489) - (1,000) -
Net cash provided by (used in) financing activities (2,061) (3,405) (3,039) (11,128) (8,702)
Increase (decrease) in cash and cash equivalents from discontinuing operations
- - - (46) (252)
Increase (decrease) in cash and cash equivalents (315) (210) (293) 1,886 138
Cash and cash equivalents in the beginning of the period 6,100 6,369 4,719 4,328 4,262
Effect of exchange rate changes on cash and cash equivalents
(1) (59) (98) (313) (60)
Cash of subsidiaries disposed - - - (117) (12)
Cash and cash equivalents, end of period 5,784 6,100 4,328 5,784 4,328
Non-cash transactions:
Additions to property, plant and equipment - interest capitalization
40 50 73 194 370
32
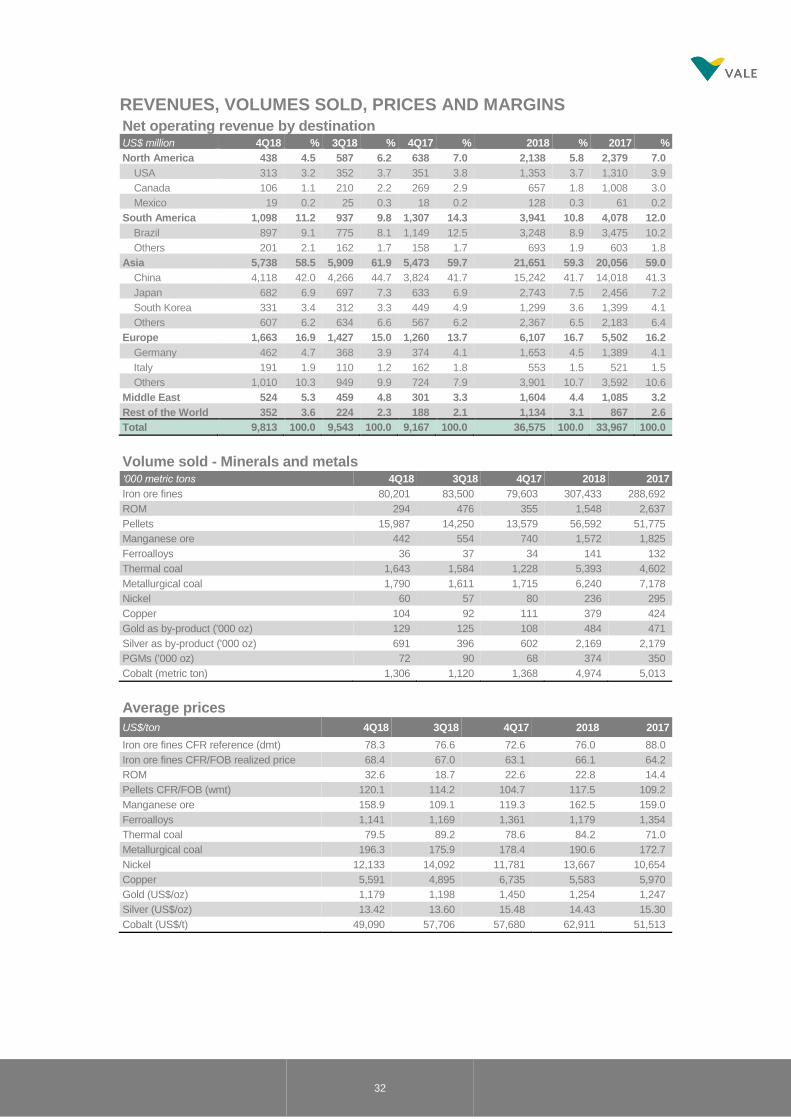
REVENUES, VOLUMES SOLD, PRICES AND MARGINS
Net operating revenue by destination US$ million 4Q18 % 3Q18 % 4Q17 % 2018 % 2017 %
North America 438 4.5 587 6.2 638 7.0 2,138 5.8 2,379 7.0
USA 313 3.2 352 3.7 351 3.8 1,353 3.7 1,310 3.9
Canada 106 1.1 210 2.2 269 2.9 657 1.8 1,008 3.0
Mexico 19 0.2 25 0.3 18 0.2 128 0.3 61 0.2
South America 1,098 11.2 937 9.8 1,307 14.3 3,941 10.8 4,078 12.0
Brazil 897 9.1 775 8.1 1,149 12.5 3,248 8.9 3,475 10.2
Others 201 2.1 162 1.7 158 1.7 693 1.9 603 1.8
Asia 5,738 58.5 5,909 61.9 5,473 59.7 21,651 59.3 20,056 59.0
China 4,118 42.0 4,266 44.7 3,824 41.7 15,242 41.7 14,018 41.3
Japan 682 6.9 697 7.3 633 6.9 2,743 7.5 2,456 7.2
South Korea 331 3.4 312 3.3 449 4.9 1,299 3.6 1,399 4.1
Others 607 6.2 634 6.6 567 6.2 2,367 6.5 2,183 6.4
Europe 1,663 16.9 1,427 15.0 1,260 13.7 6,107 16.7 5,502 16.2
Germany 462 4.7 368 3.9 374 4.1 1,653 4.5 1,389 4.1
Italy 191 1.9 110 1.2 162 1.8 553 1.5 521 1.5
Others 1,010 10.3 949 9.9 724 7.9 3,901 10.7 3,592 10.6
Middle East 524 5.3 459 4.8 301 3.3 1,604 4.4 1,085 3.2
Rest of the World 352 3.6 224 2.3 188 2.1 1,134 3.1 867 2.6
Total 9,813 100.0 9,543 100.0 9,167 100.0 36,575 100.0 33,967 100.0
Volume sold - Minerals and metals ‘000 metric tons 4Q18 3Q18 4Q17 2018 2017
Iron ore fines 80,201 83,500 79,603 307,433 288,692
ROM 294 476 355 1,548 2,637
Pellets 15,987 14,250 13,579 56,592 51,775
Manganese ore 442 554 740 1,572 1,825
Ferroalloys 36 37 34 141 132
Thermal coal 1,643 1,584 1,228 5,393 4,602
Metallurgical coal 1,790 1,611 1,715 6,240 7,178
Nickel 60 57 80 236 295
Copper 104 92 111 379 424
Gold as by-product ('000 oz) 129 125 108 484 471
Silver as by-product ('000 oz) 691 396 602 2,169 2,179
PGMs ('000 oz) 72 90 68 374 350
Cobalt (metric ton) 1,306 1,120 1,368 4,974 5,013
Average prices
US$/ton 4Q18 3Q18 4Q17 2018 2017
Iron ore fines CFR reference (dmt) 78.3 76.6 72.6 76.0 88.0
Iron ore fines CFR/FOB realized price 68.4 67.0 63.1 66.1 64.2
ROM 32.6 18.7 22.6 22.8 14.4
Pellets CFR/FOB (wmt) 120.1 114.2 104.7 117.5 109.2
Manganese ore 158.9 109.1 119.3 162.5 159.0
Ferroalloys 1,141 1,169 1,361 1,179 1,354
Thermal coal 79.5 89.2 78.6 84.2 71.0
Metallurgical coal 196.3 175.9 178.4 190.6 172.7
Nickel 12,133 14,092 11,781 13,667 10,654
Copper 5,591 4,895 6,735 5,583 5,970
Gold (US$/oz) 1,179 1,198 1,450 1,254 1,247
Silver (US$/oz) 13.42 13.60 15.48 14.43 15.30
Cobalt (US$/t) 49,090 57,706 57,680 62,911 51,513
33
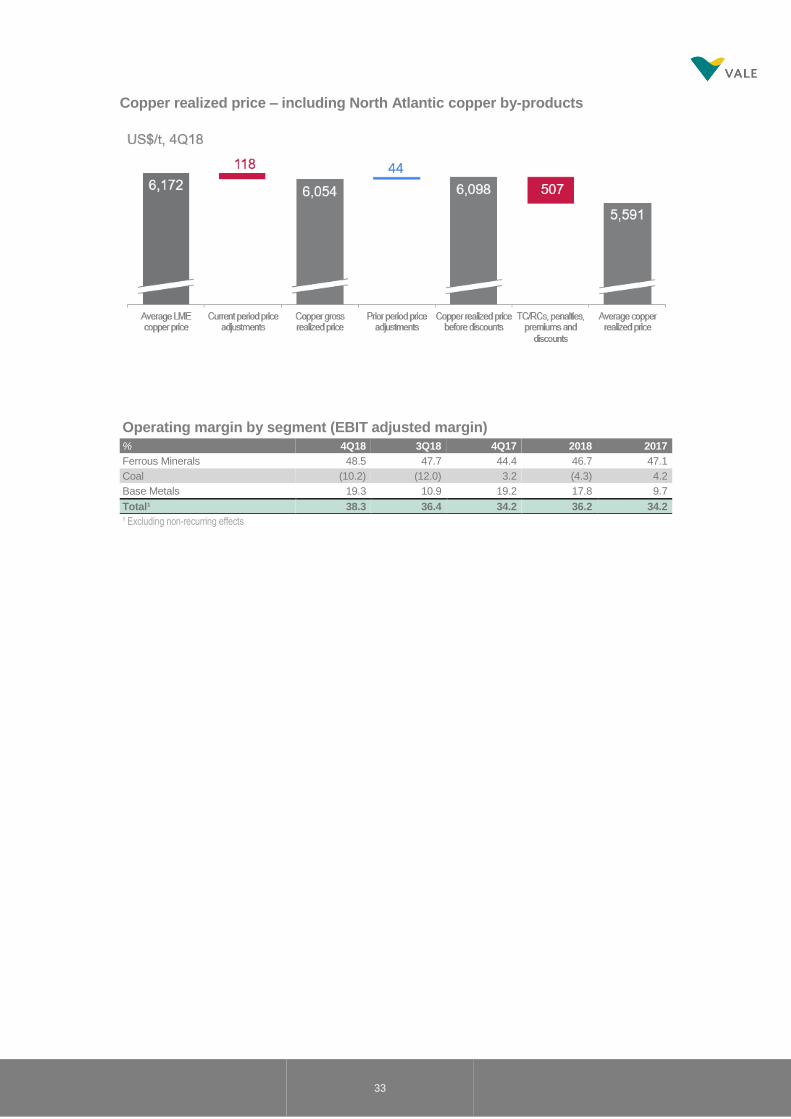
Copper realized price – including North Atlantic copper by-products
Operating margin by segment (EBIT adjusted margin)
% 4Q18 3Q18 4Q17 2018 2017
Ferrous Minerals 48.5 47.7 44.4 46.7 47.1
Coal (10.2) (12.0) 3.2 (4.3) 4.2
Base Metals 19.3 10.9 19.2 17.8 9.7
Total¹ 38.3 36.4 34.2 36.2 34.2
¹ Excluding non-recurring effects
34
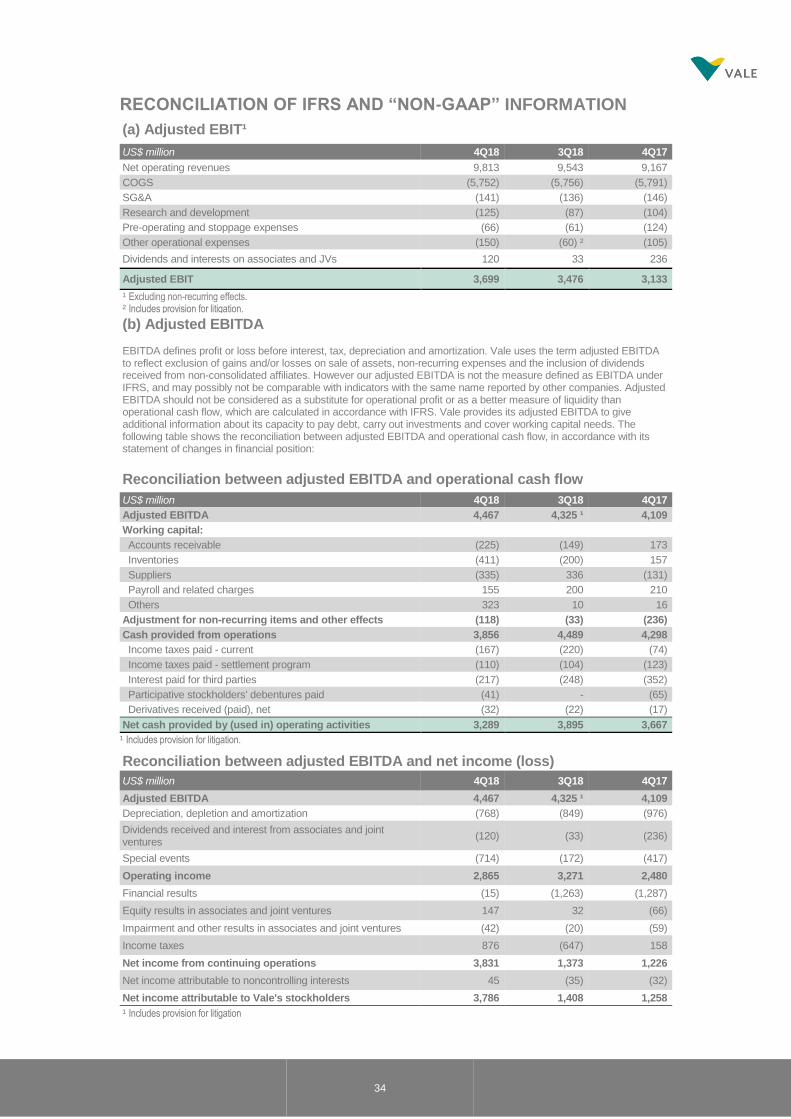
RECONCILIATION OF IFRS AND “NON-GAAP” INFORMATION
(a) Adjusted EBIT¹
US$ million 4Q18 3Q18 4Q17
Net operating revenues 9,813 9,543 9,167
COGS (5,752) (5,756) (5,791)
SG&A (141) (136) (146)
Research and development (125) (87) (104)
Pre-operating and stoppage expenses (66) (61) (124)
Other operational expenses (150) (60) ² (105)
Dividends and interests on associates and JVs 120 33 236
Adjusted EBIT 3,699 3,476 3,133
¹ Excluding non-recurring effects. ² Includes provision for litigation.
(b) Adjusted EBITDA
EBITDA defines profit or loss before interest, tax, depreciation and amortization. Vale uses the term adjusted EBITDA to reflect exclusion of gains and/or losses on sale of assets, non-recurring expenses and the inclusion of dividends received from non-consolidated affiliates. However our adjusted EBITDA is not the measure defined as EBITDA under IFRS, and may possibly not be comparable with indicators with the same name reported by other companies. Adjusted EBITDA should not be considered as a substitute for operational profit or as a better measure of liquidity than operational cash flow, which are calculated in accordance with IFRS. Vale provides its adjusted EBITDA to give additional information about its capacity to pay debt, carry out investments and cover working capital needs. The following table shows the reconciliation between adjusted EBITDA and operational cash flow, in accordance with its statement of changes in financial position:
Reconciliation between adjusted EBITDA and operational cash flow
US$ million 4Q18 3Q18 4Q17
Adjusted EBITDA 4,467 4,325 ¹ 4,109
Working capital:
Accounts receivable (225) (149) 173
Inventories (411) (200) 157
Suppliers (335) 336 (131)
Payroll and related charges 155 200 210
Others 323 10 16
Adjustment for non-recurring items and other effects (118) (33) (236)
Cash provided from operations 3,856 4,489 4,298
Income taxes paid - current (167) (220) (74)
Income taxes paid - settlement program (110) (104) (123)
Interest paid for third parties (217) (248) (352)
Participative stockholders' debentures paid (41) - (65)
Derivatives received (paid), net (32) (22) (17)
Net cash provided by (used in) operating activities 3,289 3,895 3,667
¹ Includes provision for litigation. Reconciliation between adjusted EBITDA and net income (loss)
US$ million 4Q18 3Q18 4Q17
Adjusted EBITDA 4,467 4,325 ¹ 4,109
Depreciation, depletion and amortization (768) (849) (976)
Dividends received and interest from associates and joint ventures
(120) (33) (236)
Special events (714) (172) (417)
Operating income 2,865 3,271 2,480
Financial results (15) (1,263) (1,287)
Equity results in associates and joint ventures 147 32 (66)
Impairment and other results in associates and joint ventures (42) (20) (59)
Income taxes 876 (647) 158
Net income from continuing operations 3,831 1,373 1,226
Net income attributable to noncontrolling interests 45 (35) (32)
Net income attributable to Vale's stockholders 3,786 1,408 1,258
¹ Includes provision for litigation
35
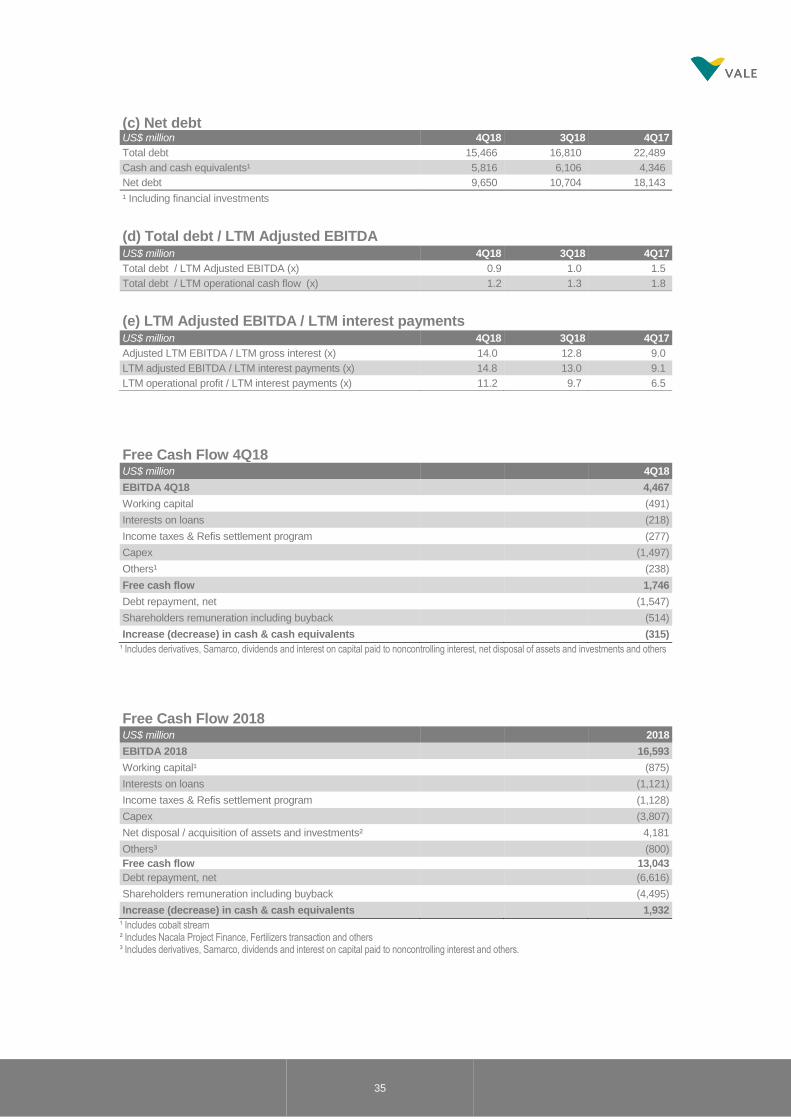
(c) Net debt US$ million 4Q18 3Q18 4Q17
Total debt 15,466 16,810 22,489
Cash and cash equivalents¹ 5,816 6,106 4,346
Net debt 9,650 10,704 18,143
¹ Including financial investments
(d) Total debt / LTM Adjusted EBITDA
US$ million 4Q18 3Q18 4Q17
Total debt / LTM Adjusted EBITDA (x) 0.9 1.0 1.5
Total debt / LTM operational cash flow (x) 1.2 1.3 1.8
(e) LTM Adjusted EBITDA / LTM interest payments US$ million 4Q18 3Q18 4Q17
Adjusted LTM EBITDA / LTM gross interest (x) 14.0 12.8 9.0
LTM adjusted EBITDA / LTM interest payments (x) 14.8 13.0 9.1
LTM operational profit / LTM interest payments (x) 11.2 9.7 6.5
Free Cash Flow 4Q18 US$ million 4Q18
EBITDA 4Q18 4,467
Working capital (491)
Interests on loans (218)
Income taxes & Refis settlement program (277)
Capex (1,497)
Others¹ (238)
Free cash flow 1,746
Debt repayment, net (1,547)
Shareholders remuneration including buyback (514)
Increase (decrease) in cash & cash equivalents (315)
¹ Includes derivatives, Samarco, dividends and interest on capital paid to noncontrolling interest, net disposal of assets and investments and others
Free Cash Flow 2018 US$ million 2018
EBITDA 2018 16,593
Working capital¹ (875)
Interests on loans (1,121)
Income taxes & Refis settlement program (1,128)
Capex (3,807)
Net disposal / acquisition of assets and investments² 4,181
Others³ (800)
Free cash flow 13,043
Debt repayment, net (6,616)
Shareholders remuneration including buyback (4,495)
Increase (decrease) in cash & cash equivalents 1,932
¹ Includes cobalt stream ² Includes Nacala Project Finance, Fertilizers transaction and others ³ Includes derivatives, Samarco, dividends and interest on capital paid to noncontrolling interest and others.