Embed Size (px)
Citation preview

Using SP Xpress for Assessment Data Analysis to Enhance the Learning
and Teaching of Reading Strategies
Zoe So-yee Chan
Lingnan University Alumni Association (HK) Primary School

Assessment for Learning
The purpose of assessment for learning is to collect
information about students’ progress and achievements
in relation to the learning objectives at the corresponding
level. Teachers review their expectations of students’
learning, the content of learning, and their teaching
strategies to enhance learning and teaching through
assessment, thereby providing quality feedback on how
to improve performance. This is assessment for learning.
CDC, 2004
Our Aim Every teacher has:
(1) equipped oneself to make well-founded
judgments about students’ attainment,
especially in reading,
(2) understood the concepts and principles of
progression, and
(3) enabled oneself to use assessment judgments to
plan ahead, particularly for students who are
not achieving basic levels of competence.

Using SP Xpress® (Version 2.2) as an Analysis Tool
• An assessment data analysis tool which helps
teachers to implement assessment for learning
• Analyzes students’ performance in assessments,
thereby generating statistical data and graphs to
help teachers diagnose the strengths and
weaknesses of each student
• Helps teachers further improve the quality of
assessing items in order to transcend learning
and teaching

Using SP Xpress® (Version 2.2) as an Analysis Tool
4 categories of students’ performance
• Type A:
high learning ability; high learning stability
• Type B:
high learning ability; low learning stability
• Type C:
low learning ability; low learning stability
• Type D:
low learning ability; high learning stability

Using SP Xpress® (Version 2.2) as an Analysis Tool – Decoding of Students’ Ability
Type A Able Students
Type B
Type D Remedial
Students
Type C
Modification Caution Index (MCI)
Passing rate Lack preparation?
• Lack of preparation? • Lack of understanding of
the assessment items? • Emotional problems? • Luck? • Special needs?

Using SP Xpress® (Version 2.2) as an Analysis Tool – Decoding of Question Quality
Type A Good Questions
Type B Amendment
Needed
Type C Should Be
Cancelled
Type D Difficult
Questions for
Gifted Students
Modification Caution Index (MCI)
Passing rate

Using SP Xpress® (Version 2.2) as an Analysis Tool Column ID: 9 6 2 5 1 3 7 13 8 11 12 4 10 14
MC or blank MC MC MC MC MC MC
Key: B 1 1 1 1 1 1 B 1 C C 1 A B
Row ID Student ID Student Name Item Name: QC1 QB2 QA2 QB1 QA1 QA3 QB3 QC5 QB4 QC3 QC4 QA4 QC2 QC6 MC CR TOTAL MC % CR % Total % MCI Performance Type
27 s27 Isabella Chan + + 0 0 + + 0 A 0 D + 0 C + 3 3 6 21.43 21.43 42.86 0.37 0.43 C
28 s28 Serena Chan + + + + 0 + + + + A + 0 D D 3 6 9 21.43 42.86 64.29 0.03 0.64 A
29 s29 Anchor Ho + 0 + + 0 + 0 + + + + 0 C D 4 4 8 28.57 28.57 57.14 0.23 0.57 A
30 s30 Kristy Ip + + + + + + + + + + B + C + 4 8 12 28.57 57.14 85.71 0.14 0.86 A
31 s31 Sam Lee + + + + + 0 + + + + B 0 D + 4 6 10 28.57 42.86 71.43 0.12 0.71 A
32 s32 Samuel Li + 0 + 0 + + 0 + 0 + + + C A 4 4 8 28.57 28.57 57.14 0.40 0.57 B
33 s33 Matthew Wu + + + + + 0 + + + + A + B + 4 7 11 28.57 50.00 78.57 0.21 0.79 A
34 s34 Konrad Chan + + + 0 0 0 0 C 0 B D 0 + A 2 2 4 14.29 14.29 28.57 0.24 0.29 D
35 s35 Marco Cheng + + 0 + + 0 0 + 0 B + 0 B A 3 3 6 21.43 21.43 42.86 0.14 0.43 D
36 s36 Carrie Cheng + + 0 + 0 + 0 + 0 D B 0 + C 3 3 6 21.43 21.43 42.86 0.23 0.43 D
37 s37 Angel Choi + + + + + + + + 0 + + + + + 6 7 13 42.86 50.00 92.86 0.25 0.93 A
38 s38 Cheryl Kwan + 0 + + + + + A 0 + + + B A 3 6 9 21.43 42.86 64.29 0.26 0.64 A
39 s39 Stanford Liu + + + + + + 0 A + A + + + A 3 7 10 21.43 50.00 71.43 0.21 0.71 A
40 s40 Edward Man + + 0 + 0 0 + C + A B 0 D A 1 4 5 7.14 28.57 35.71 0.15 0.36 D
41 s41 Connie Poon + + + + 0 0 + A 0 A A 0 + C 2 4 6 14.29 28.57 42.86 0.11 0.43 D
42 s42 Aslan Pun + + + + 0 0 + + + + B 0 D + 4 5 9 28.57 35.71 64.29 0.15 0.64 A
43 s43 Sunny Tse + + + 0 + + 0 A + D B + C A 1 6 7 7.14 42.86 50.00 0.23 0.50 A
44 s44 Griffin Wong + + + + 0 0 + A 0 + + 0 + C 4 4 8 28.57 28.57 57.14 0.17 0.57 A
Freq. of 1 15 14 14 10 10 10 9 7
Freq. of 0 3 4 4 8 8 8 9 11
Freq. of Missing 0 0 0 0 0 0 0 0
% of 1 83.33 77.78 77.78 55.56 55.56 55.56 50.00 38.89
% of 0 16.67 22.22 22.22 44.44 44.44 44.44 50.00 61.11
% of Missing 0.00 0.00 0.00 0.00 0.00 0.00 0.00 0.00
Freq. of A 0 6 4 2 6 7
Freq. of B 18 10 2 6 3 6
Freq. of C 0 2 9 9 5 3
Freq. of D 0 0 3 1 4 2
Freq. of Missing 0 0 0 0 0 0
% of A 0.00 33.33 22.22 11.11 33.33 38.89
% of B 100.00 55.56 11.11 33.33 16.67 33.33
% of C 0.00 11.11 50.00 50.00 27.78 16.67
% of D 0.00 0.00 16.67 5.56 22.22 11.11
% of Missing 0.00 0.00 0.00 0.00 0.00 0.00
Item MCI 0.00 0.48 0.08 0.16 0.20 0.31 0.20 0.20 0.29 0.09 0.40 0.12 0.56 0.12
Item P-value 1.00 0.83 0.78 0.78 0.56 0.56 0.56 0.56 0.50 0.50 0.50 0.39 0.33 0.33
Item MCI Type A B A A A B A A A A B D C D
Item Disc. Index 0.00 0.00 0.50 0.25 1.00 0.25 0.50 0.75 0.50 1.00 0.25 0.75 -0.50 1.00
Pt-Bis NA -0.18 0.40 0.27 0.30 0.09 0.30 0.30 0.15 0.53 -0.05 0.46 -0.29 0.44
AlphaWO 0.53 0.58 0.47 0.50 0.49 0.54 0.49 0.49 0.52 0.42 0.57 0.45 0.61 0.45
Mean 8.17
SD 2.39
Alpha 0.53
Types of students
Types of questions
Accuracy rates
Key answer
Student Names
Total accuracy rate for each
student

Procedure of Running SP Xpress® (Version 2.2)
• Insert Data
• Create a template in SP Xpress® (Version 2.2)
• Run SP Xpress® (Version 2.2)
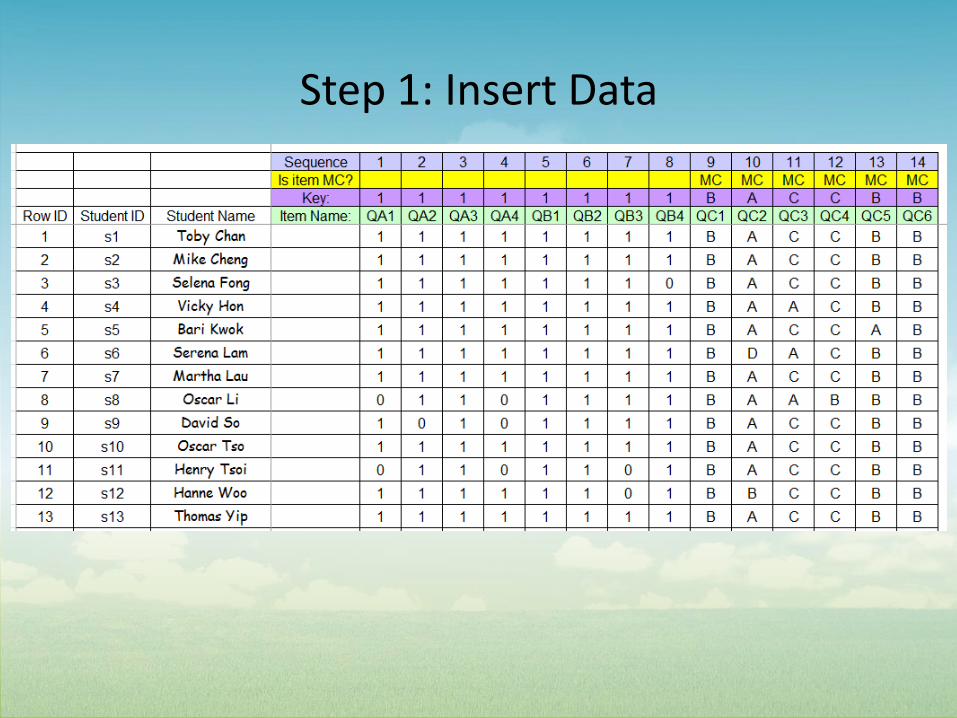
Step 1: Insert Data

Step 2: Create a template in SP Xpress® (Version 2.2)

Step 2: Create a template in SP Xpress® (Version 2.2)
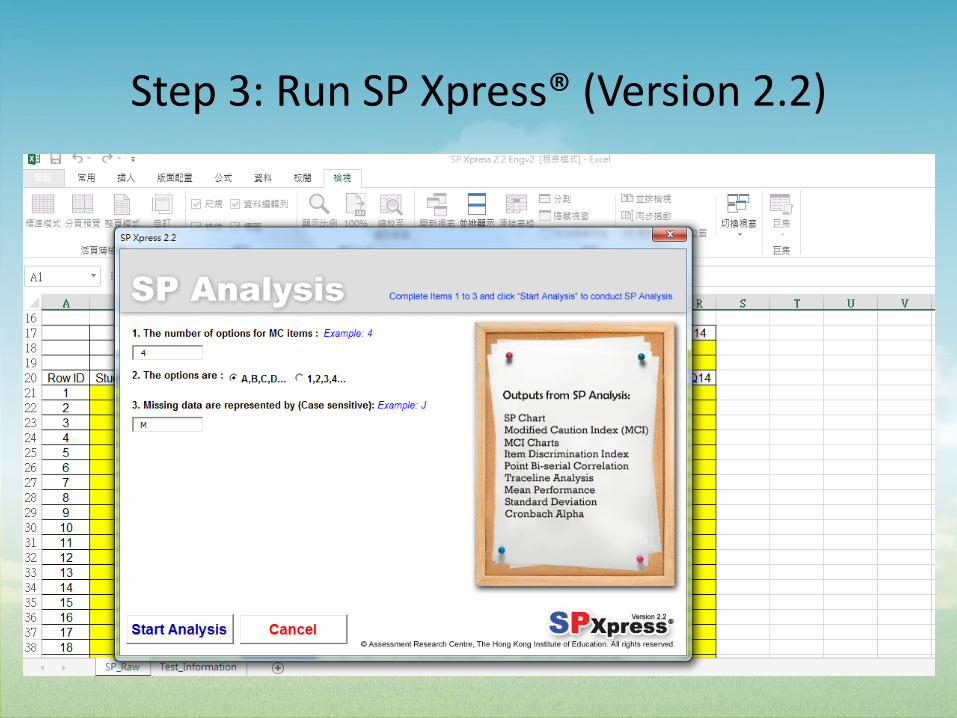
Step 3: Run SP Xpress® (Version 2.2)

The Use of School-based Assessment Information

Using Summative Assessment Data for Groupings
Place students into 2 groups according to English learning ability in Primary 4 to Primary 5.
• RED Group (Type A)
• BLUE Group (Type D)
Type A Type B
Type C Type D

Using Summative Assessment Data for Groupings
Place students into 3 groups according to English learning ability in Primary 3 and Primary 6.
• RED Group (Type A1)
• BLUE Group (Type A2)
• YELLOW Group (Type D)
Type A2
Type B
Type C Type D
Type A1

Using Summative Assessment Data for Locating Students’ Learning Difficulties
21 Reading Strategies
• Locating specific information
• Constructing meaning from the text
• Identifying main ideas
• Interpreting references
• Finding word meaning from context or knowledge or the world
• Reference skills
• Finding word features
• Making inferences
• Making predictions
• Understanding intention, attitudes and feelings conveyed in the text
• Identifying meaning of specific words or expressions
• Recognizing the format and language features of some common text types
• Problem solving skills
• Synthesis skills
• Evaluation skills
• Analysis skills
• Relating personal experience or knowledge or the world to reading
• Using pictorial clues to help understanding
• Dictionary skills
• Identifying onomatopoeic words
• Vocabulary application

School-based Curriculum Framework

21 School-based Reading Strategies

Using Summative Assessment Data for Locating Students’ Learning Difficulties Follow-up work
• Set up the core reading strategies for the specific form level – Comprehension questions during shared/guided reading (unit of work)
– Comprehension questions in reading worksheets
• Questions with those reading strategies will be assessed with reading comprehension in both formative and summative assessment to understand students’ learning progress.
Question Q.1 Q.2 Q.3 Q.4 Q.5 Q.6 Q.7 Average
Reading Strategies
Recognizing the format of text types
Analysis skills Constructing meaning from the text
Dictionary skills
Identifying main ideas
Constructing meaning from the text
Relating personal experiences to reading
5Red accuracy rate
92.59% 14.81% 66.67% 37.04% 14.81% 66.67% 100% 56.08%
5Blue accuracy rate
61.54% 15.38% 26.92% 26.92% 15.38% 42.31% 65.38% 36.26%
Total accuracy rate
77.36% 15.09% 47.17% 32.08% 15.09% 54.72% 83.02% 46.36%

Using Formative Assessment Data for Locating Students’ Learning Difficulties
• 8 Formative Assessments in each term
– 2 Reading assessments
– 2 Writing assessments
– 1 Listening assessments
– 3 Speaking assessments

Using Formative Assessment Data to Detect Students’ Learning Difficulties
Follow-up work
• Decode the target reading strategies for the coming unit
– Comprehension questions during shared/guided reading (unit of
work)
– Comprehension questions in reading worksheets
Question Q.1 Q.2 Q.3 Q.4 Q.5 Average
Reading Strategies
Recognising the format and language features of some common text types
Identifying main ideas
Locating specific information
Locating specific information
Analysis skills
3RED accuracy rate
100% 92.59% 85.19% 77.78% 100% 91.11%
3BLUE accuracy rate
95.83% 95.83% 29.17% 62.5% 54.17% 67.50%
Total accuracy rate
97.92% 94.21% 57.18% 70.14% 77.09% 69.22%

Outcomes of Using Assessment Data Analysis
• Teachers, as well as students and parents, know what
students are learning and what is going to be assessed.
• Teachers know more about students’ learning difficulties
and with the development of structured and systematic
assessment systems.
• Teachers find it easier to track students’ progress,
especially in reading.
• Students’ reading level is improving when having bench
mark level reading tests and the TSA.

The Use of TSA Data

The Use of TSA Past Paper • Launch in January
• Select suitable questions from the past papers according
to the core reading strategies
• Categorise the question items according the 21 school-
based reading strategies

The Use of TSA Past Paper
• Use SP Xpress 2.2 SP Xpress® (Version 2.2) as an
Analysis Tool
• Diagnose students’ weaknesses in reading
• Categorise students’ into the 4 types
• Compare the school-based data to the corresponding
TSA years
• Compile a TSA Analysis Report
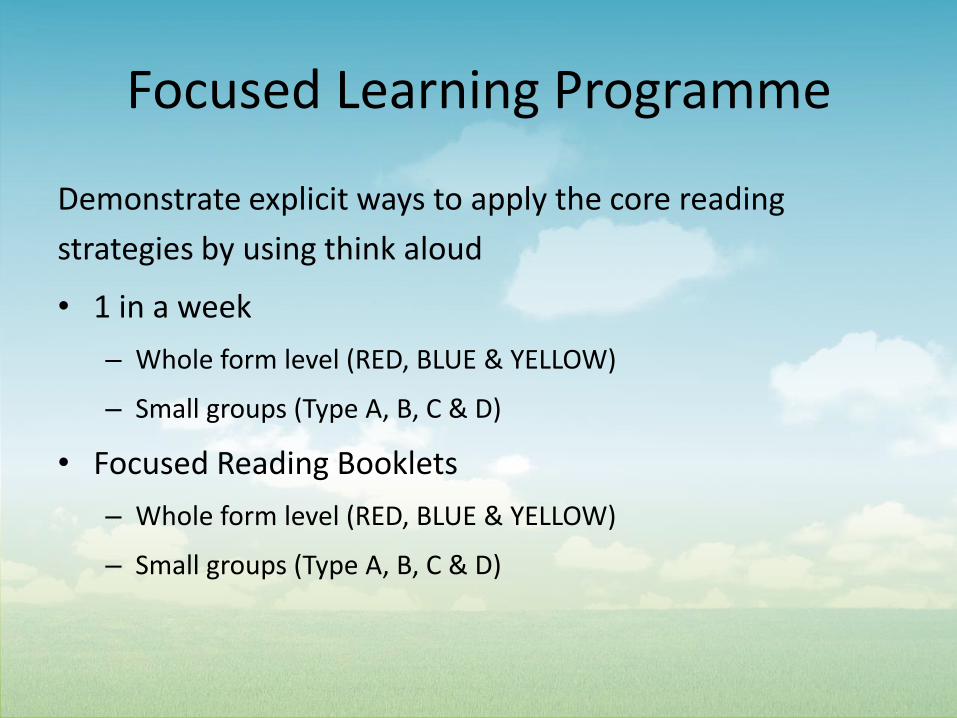
Focused Learning Programme
Demonstrate explicit ways to apply the core reading
strategies by using think aloud
• 1 in a week
– Whole form level (RED, BLUE & YELLOW)
– Small groups (Type A, B, C & D)
• Focused Reading Booklets
– Whole form level (RED, BLUE & YELLOW)
– Small groups (Type A, B, C & D)

Focused Learning Programme – Whole Form Level
Focused Reading Programme

Focused Learning Programme – Small Groups
Focused Reading Programme (B) Focused Reading Programme (C) Focused Reading Programme (D)

Further Development – Self-regulated Learning
Having built on the work of our teachers, our aims for the next stage are that:
• every student is aware of their progress, and understands what is required to improve and how to achieve this.
• every parent is aware of how their child is doing, what they need to do to improve and how they can support their child and their teachers.
References The Curriculum Development Council (2004). English Language Education Key Learning Area: English Language Curriculum Guide (Primary 1-6). Hong Kong: The Education and Manpower Bureau.
Galton, M. (2007). Learning and teaching in the primary school. London: Sage Publications.
Lee, J. C.-K., Yin, H., & Zhang, Z. (2009). Exploring the influence of the classroom environment on students’ motivation and self-regulated learning in Hong Kong. The Asia-Pacific Education Researcher, 18(2), 219- 232.
莫慕貞、丁彥銓、何昊璇、黃英華、謝棹南、徐坤、姚靜靜 (2011)。 《優化學習導向評估之SP Xpress 2.2》。香港:PACE Publishing Ltd。