Embed Size (px)
Citation preview
USING FRACTURE MECHANICS CONCEPTS TO PREDICT SHEAR STRENGTH OF CONCRETE STRUCTURES
S. Kono and N.M. Hawkins Department of Civil Engineering, University of Illinois at UrbanaChampaign, Urbana, IL 61801, U.S.A. A.S. Kobayashi Department of Mechanical Engineering, FU-10, University of Washington Seattle, WA 98195, U.S.A.
Abstract Tests were conducted on three point bend specimens with offset notches exterior steel bars to investigate using fracture mechanics concepts to shear strength. Results were analyzed using finite elements methods. new criterion had to be developed to accurately forecast crack curving effects.
1 Introduction
the U.S.A. efforts to incorporate fracture mechanics concepts Code 318 have been unsuccessful largely because current concepts do not explain existing information, especially that on shear strength, any than the Code's empirical concepts. For linear elastic fracture mechanics, (LEFM), the shear strength of a beam without web reinforcement decreases in inverse proportion to the square root of the beam's depth. information from physical tests indicates that shear strength is proportional to the inverse of the fourth root of the beam's depth. This paper examines
1707
why fracture mechanics concepts are unable to predict existing test results.
2 Size Dependency of Shear Strength
Studies Kani ( 1979) tested geometrically similar beams and found the nominal ultimate shear stress to decrease with increasing beam depth. No simple size factor could be used to modify any basic shear strength equation so that it included depth effects. Kani concluded that shear failure occurred when the overstressed concrete at the root of a tooth, formed by adjacent cracks, broke
flexure. Thus, shear strength depended on the load to cause cracking at a location and the resistance of the tooth formed at that location.
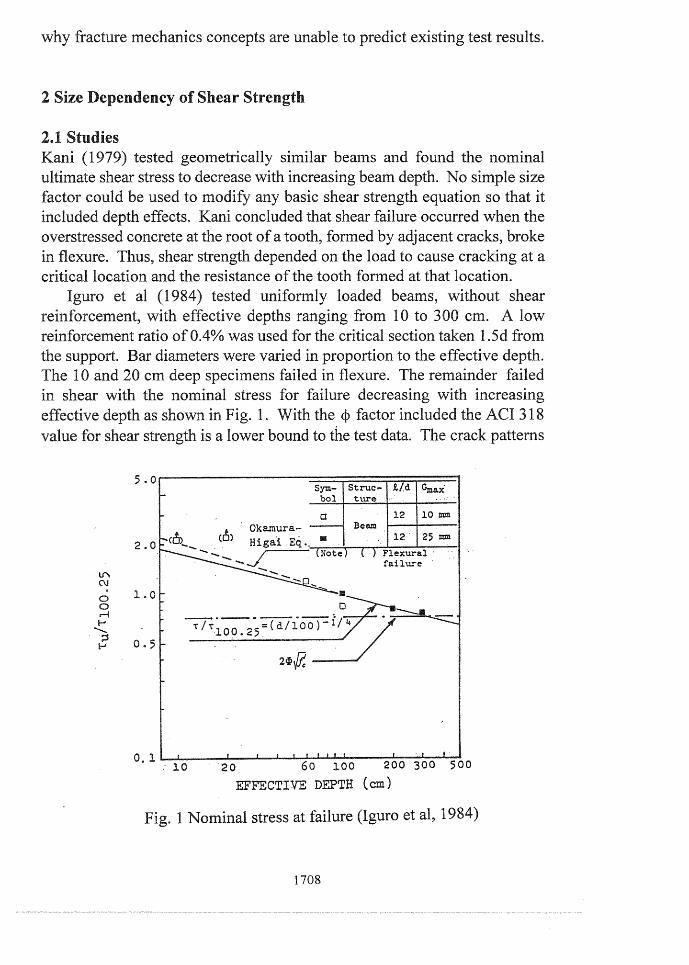
Iguro et al ( 1984) tested uniformly loaded beams, without shear reinforcement, with effective depths ranging from 10 to 300 cm. A low reinforcement ratio of 0.4% was used for the critical section taken l .5d from the support. Bar diameters were varied in proportion to the effective depth. The l 0 and 20 cm deep specimens failed in flexure. The remainder failed
shear with the nominal stress for failure decreasing with increasing a.TT.C•,......,.1 ,,0 depth as shown in Fig. 1. With the Q:> factor included the ACI 318
for shear strength is a lower bound to the test data. The crack patterns
a · Okamura-ca__ (CJ) Higai Eq .. • 2.0 ~----.:--,........._._~.__---_, .----.r-- Note ----
1.0
0.5
o.i1....-1~0~~2~0~-'-......J....-'-6~0~~1~0-o---::-2~00-:-'.'.3~0~0-'-:5~00 EFFECTIVE DEPTH (cm)
Fig. 1 Nominal stress at failure (Iguro et al, 1984)
1708
for all specimens failing in shear were similar, in spite of different load levels for failure. The inclined cracks causing failure crossed the reinforcing bars at about 1.5d from the support. Iguro et al concluded that size effects for shear strength depended on size effects for concrete flexural tensile strength, which for depths greater than 100 cm was inversely proportional to the fourth root of the effective depth. That finding agrees with prior element predictions made by Hillerborg et al (1976).
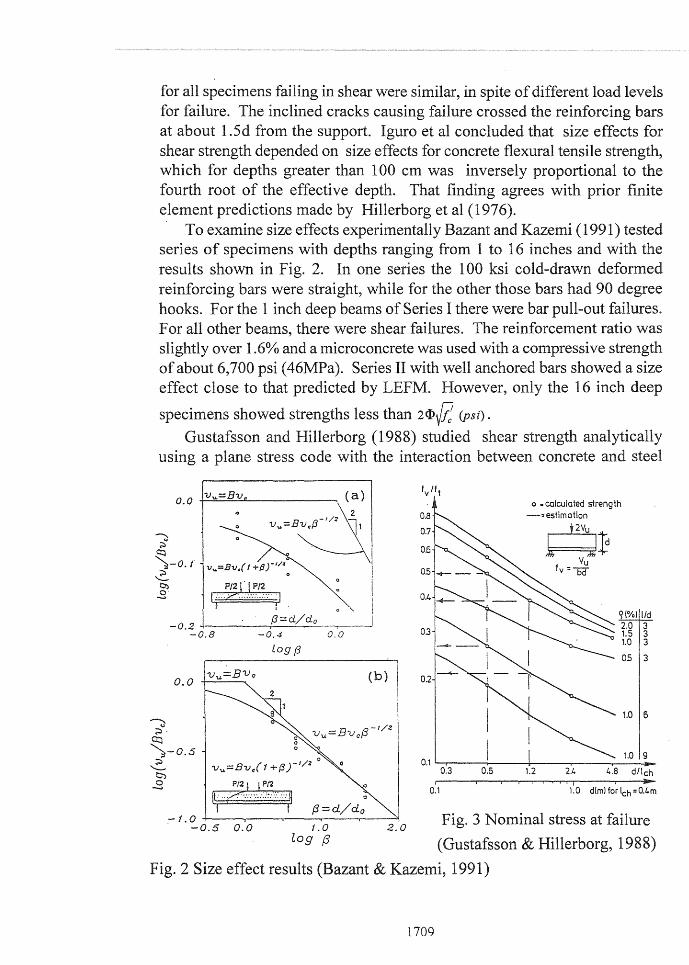
To examine size effects experimentally Bazant and Kazemi (1991) series of specimens with depths ranging from 1 to 16 inches and results shown in Fig. 2. one series the 100 ksi cold-drawn ......... JL'VJ. ... ,. ..... ,"""
reinforcing bars were straight, while for the other those bars had 90 hooks. For the 1 inch deep beams of Series I there were bar pull-out failures. For all other beams, there were shear failures. The reinforcement ratio was slightly over 1.6% and a microconcrete was used with a compressive strength of about 6,700 psi ( 46MPa). Series II with well anchored bars showed a size effect close to that predicted by LEFM. However, only the 16 inch
specimens showed strengths less than 2<P{i: (psi).
Gustafsson and Hillerborg (1988) studied shear strength analytically using a plane stress code with interaction between concrete
o.o v,,_=Bv
P/2 I' l P/2 f.· .. -.z· .. :::::.::: ·1 I 1
0 '
{3=d/do -o. 2 -+--~--r----'--~~----' -0.8 -0.4 0.0
log f3
(b)
0
(3=d/d 0 - 1. 0 -i----,.---.------.----r-----'\
. -0.5 0.0 1.0 2.0 log (3
0.8
0.7
0.6
03
0.2
o "calculated strength -=estimation
9(%1 l/d 2.0 3 1.5 3 1.0 3
05 3
1.0 6
0.1 '--T---i-----lr-----,.---..--1.0----llg-0.3 0.6 1.2 2.4 L..8 dflch
0.1 1. 0 d{ml for lch = O.l. m
Fig. 3 Nominal stress at
(Gustafsson & Hillerborg, 1988)
Fig. 2 Size effect results (Bazant & Kazemi, 1991)
1709
properties of the concrete modeled by a straight line relationship between stress and crack opening displacement. In Fig. 3, their shear strength predictions, divided by concrete tensile strength J;, are plotted versus the
overall depth d, divided by the characteristic length, Qch, of the concrete. The
quantity, Qch, equals EG /f: where Eis the modulus of elasticity, and G1 is the
fracture energy. A decrease in shear strength was predicted with increasing beam size and decreasing Qch. The effect of beam size was almost independent of the span-to-depth ratio for ratios between 3 and 9, and the influence of reinforcement ratio, p, was greater the smaller the beam.
2.2 Findings The foregoing suggest that bond between reinforcing bar and concrete the vicinity of an inclined crack, and the fracture characteristics of the concrete, have more significant effects on the shear strength of beams without stirrups than currently recognized by Codes. Two fracture characteristics may be important: those associated with the flexural crack that initiates the inclined crack; and those associated with the curving of that flexural crack.
3 University of Illinois Fracture Investigation
3.1 Objective To explore the fundamental issues associated with constructing an appropriate fracture mechanics model for shear failure a system was developed for both testing concrete under mixed mode conditions and for conducting nonlinear analysis of those conditions. The three objectives were determination of: (1) stress transfer conditions along the crack interface; (2) crack propagation criteria; and (3) crack curving criteria.
3.2 Experiments
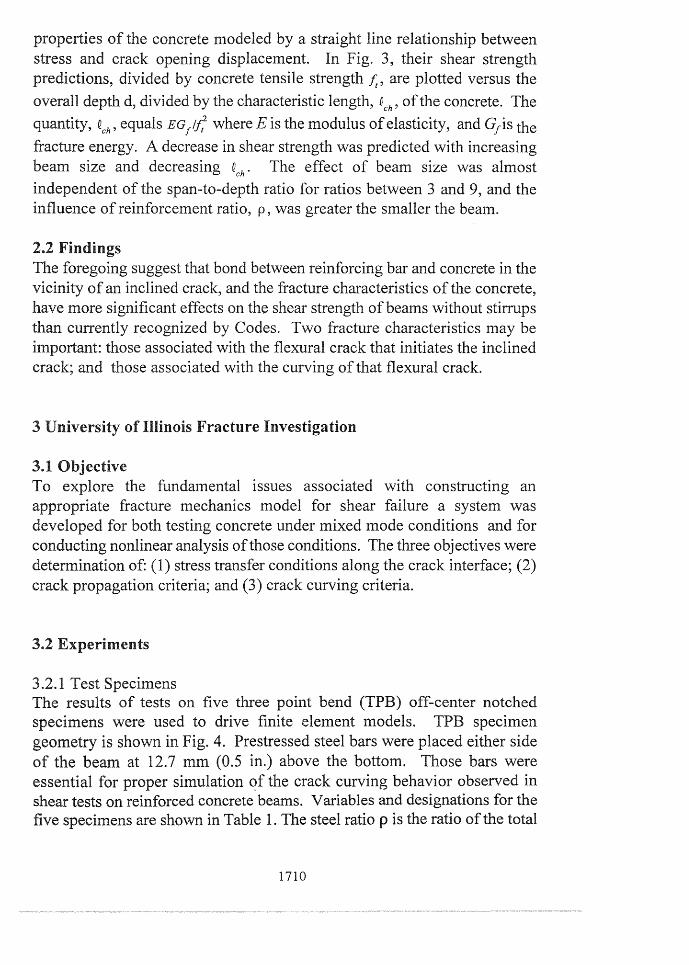
3.2.1 Test Specimens The results of tests on five three point bend (TPB) off-center notched specimens were used to drive finite element models. TPB specimen geometry is shown in 4. Prestressed steel bars were placed either side of the beam at 12.7 mm (0.5 in.) above the bottom. Those bars were essential for proper simulation <?f the crack curving behavior observed in shear tests on reinforced concrete beams. Variables and designations for the five specimens are shown in Table 1. The steel ratio p is the ratio of the total
1710
Load llllllllStrain Gage 559
127
Loading Span 508
Fig. 4 Geometry and instrumentation for TPB tests
area for the two bars to the gross cross section of the beam.
Table 1 Test variables and specimen nomenclature x p 0% p 0.5 %
102mm TH400A (Plain Concrete) TH412A (ps = 890 N) TH412B (ps = 890 N)
TH414A (ps = 1780 N) TH414B (ps = 1780 N)
p: Steel ratio; x: Notch offset; ps: Total prestressing force
Specimens were made using a type high early strength cement. maximum aggregate size was 9.5 mm (3/8 in.). The proportions on a saturated surface dry state were 1: 2.03: 3.01: 0.57 (cement: sand: gravel: water). All specimens and their companion 150x300 mm (6x12 cylinders were cast in steel mold and cured in the moist room testing. tests were conducted at 330 days. The cylinder strength at age was 58. l MPa (8430 psi) in compression and 3.5 MPa (510 psi) splitting tension.
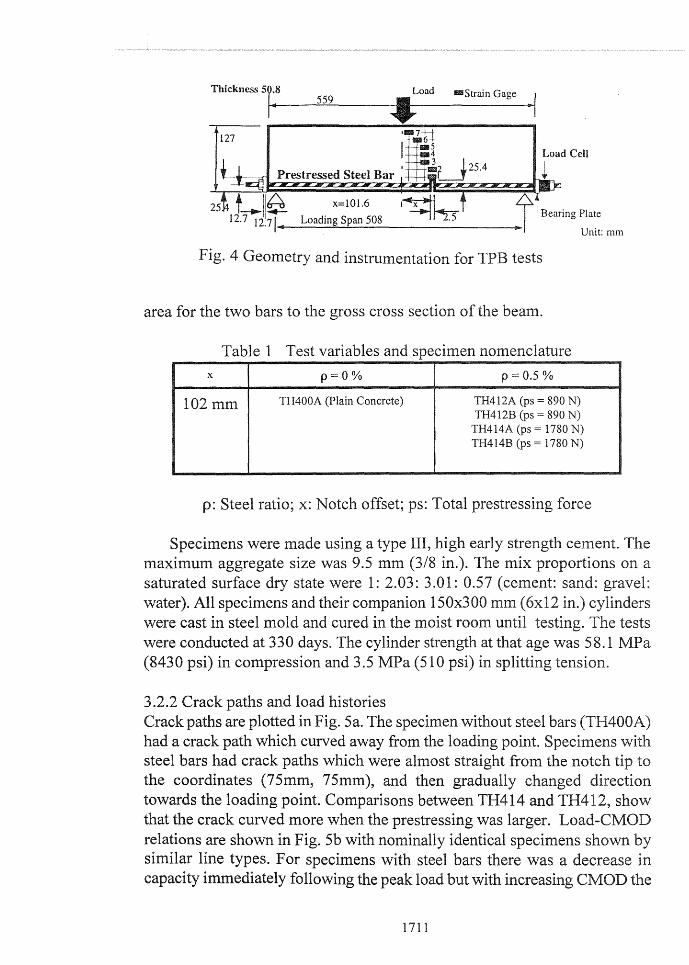
3 .2.2 Crack paths and load histories Crack paths are plotted in Fig. 5a. The specimen without steel bars had a crack path which curved away from the loading point. Specimens steel bars had crack paths which were almost straight from the tip to the coordinates (75mm, 75mm), and then gradually changed towards the loading point. Comparisons between TH4 and show that the crack curved more when the prestressing was larger. Load-CMOD relations are shown in Fig. 5b with nominally identical specimens shown by similar line types. For specimens with steel bars there was a decrease capacity immediately following the peak load but with increasing the
1711
-1 0 2 (in.) 3 4 125 ,......_,....,.......--,~~~~~~~~~~
100
(mm)
75
50
25
0 8 (x 10·3 in.) 16
0 0.1 0.2 0.3 0.4 0.5 (mm) CMOD(mrn)
(a) Crack paths (b) Load-CMOD relations
Fig. 5 Crack paths and load histories
began to increase. On the relation for 14A, the crack progress by solid circles. That progress was determined from strain
for the seven gages located shown 4.
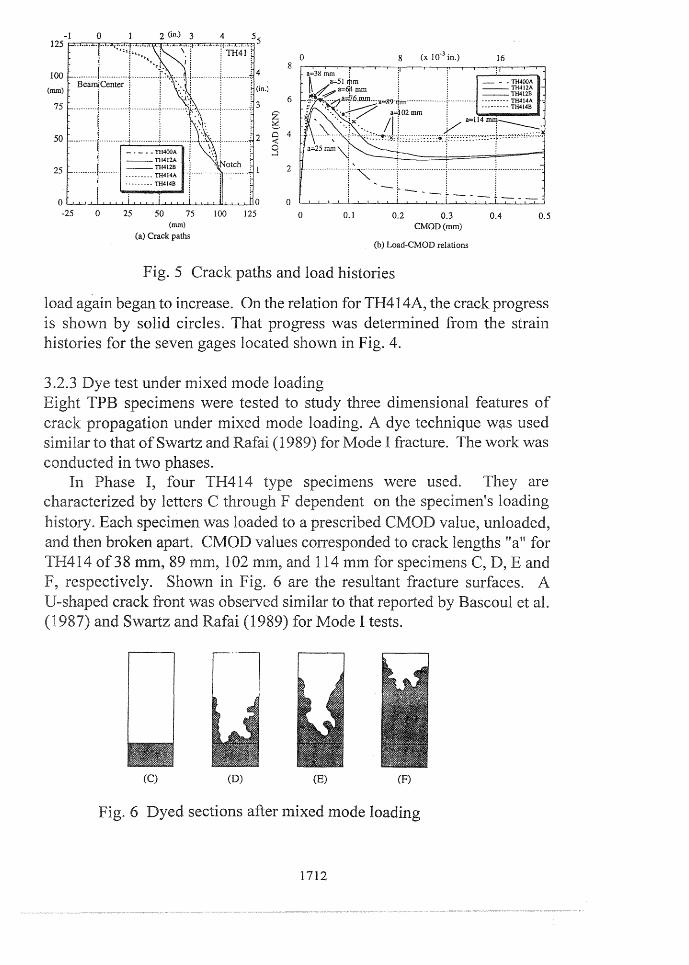
test under mixed mode loading specimens were tested to study
propagation ~AAA,,AA-A to that of Swartz
dimensional features of dye technique was used I was
two phases. Phase I, four were used.
by letters C on the specimen's Each specimen was loaded to a prescribed CMOD value, ......... ..,,'"'....._....._...,, ..... broken apart. values corresponded to crack lengths
3 8 mm, 89 1 specimens C, .................. ,., ...... ,., fracture
~AAA•-AA-A to reported by Bascoul et 989) for Mode I tests.
(C) (D) (E) (F)
Fig. 6 Dyed sections after mixed mode loading
1712
32 25 Dotted line indicates the original beam section.
IJ Initial notch
(I) Unit: mm
(G) (G) (H) (I)
(a) Specimen sections for the additional dye test (b) Dyed section after the mixed mode loading
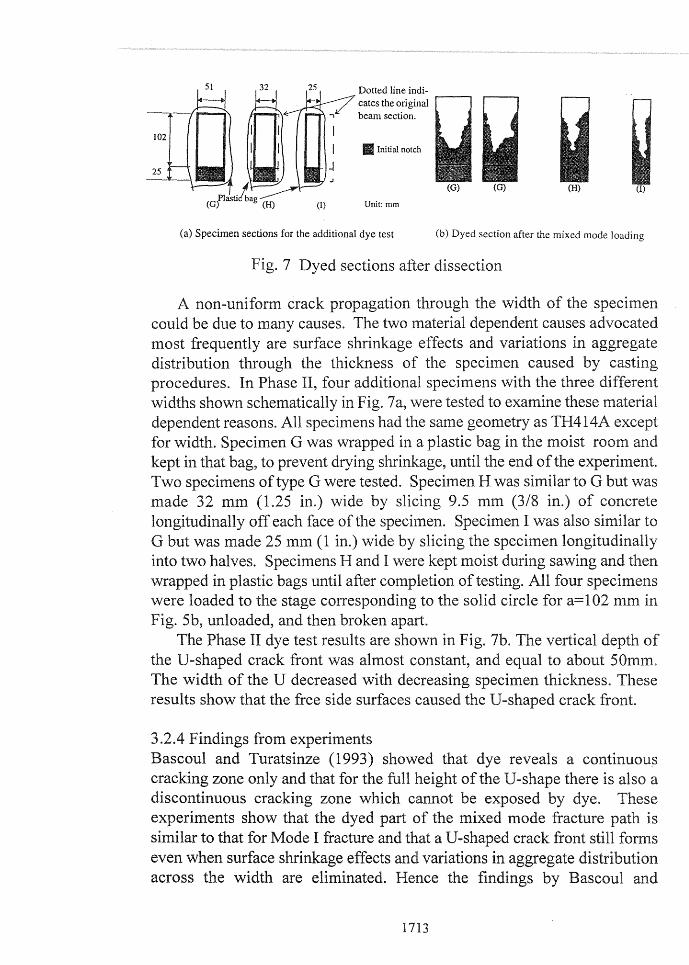
Fig. 7 Dyed sections after dissection
A non-uniform crack propagation through the width the specimen could be due to many causes. The two material dependent causes advocated most frequently are surface shrinkage effects and variations in aggregate distribution through the thickness of the specimen caused by casting procedures. In Phase II, four additional specimens with three different widths shown schematically in Fig. 7a, were tested to examine these material dependent reasons. All specimens had the same geometry as except
width. Specimen G was wrapped in a plastic bag in moist room kept in that bag, to prevent drying shrinkage, until the end of the experiment. Two specimens of type G were tested. Specimen H was similar to G but was made 32 mm (1.25 in.) wide by slicing 9.5 mm (3/8 in.) of concrete longitudinally off each face of the specimen. Specimen I was also similar to
but was made 25 mm (1 in.) wide by slicing the specimen longitudinally into two halves. Specimens Hand I were kept moist during sawing and wrapped in plastic bags until after completion of testing. four specimens were loaded to the stage corresponding to the solid circle a= l 02 mm Fig. Sb, unloaded, and then broken apart.
The Phase II dye test results are shown in Fig. 7b. vertical depth of the U-shaped crack front was almost constant, and equal to about 50mm. The width of the U decreased with decreasing specimen thickness. These results show that the free side surfaces caused the U-shaped crack front.
3 .2.4 Findings from experiments Bascoul and Turatsinze ( 1993) showed that dye reveals a continuous cracking zone only and that for the full height of the U-shape there is also a discontinuous cracking zone which cannot be exposed by dye. These experiments show that the dyed part of the mixed mode fracture path is similar to that for Mode I fracture and that a U-shaped crack front still even when surface shrinkage effects and variations in aggregate distribution across the width are eliminated. Hence the findings by Bascoul
1713
Turatsinze for Mode I fraCture should also be applicable for mixed .mode fracture. Inside the specimen discontinuous cracking exists in front of the continuous crack but the total crack length due to continuous and discontinuous cracking is almost constant through the thickness.
4 Analyses
Using the results of th~ experiments, a two dimensional finite element code was used to investigate the three objectives listed in Section 3.1. Although the experiments provided useful information on some three dimensional features of the fracture processes more detailed information could not be extracted with the test setup used. Hence the two dimensional analyses had to be such that effects of three dimensional crack features could be examined.
Numerical Modeling
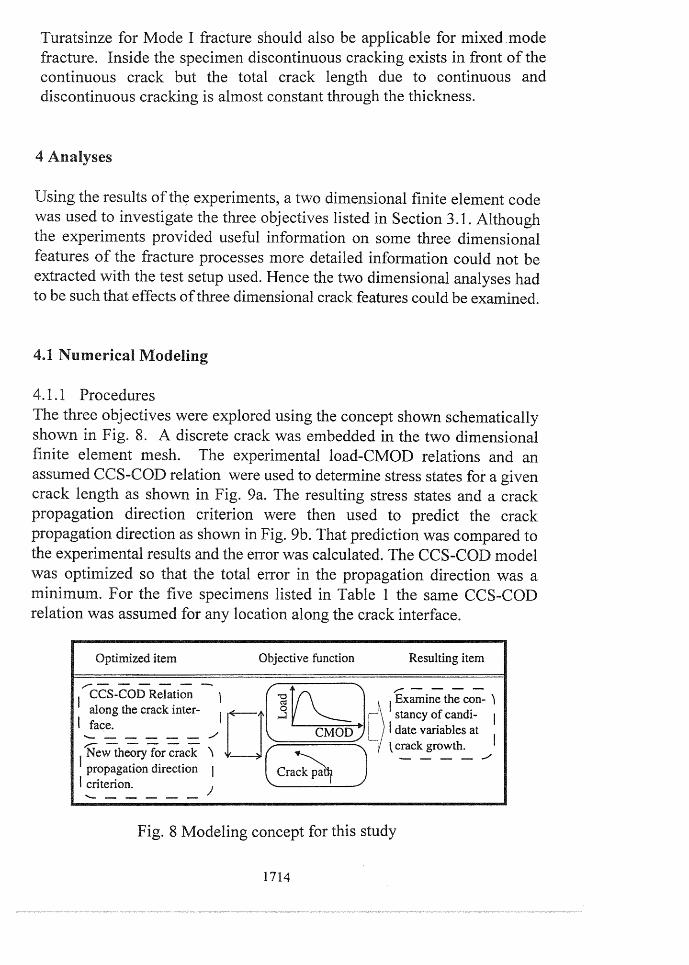
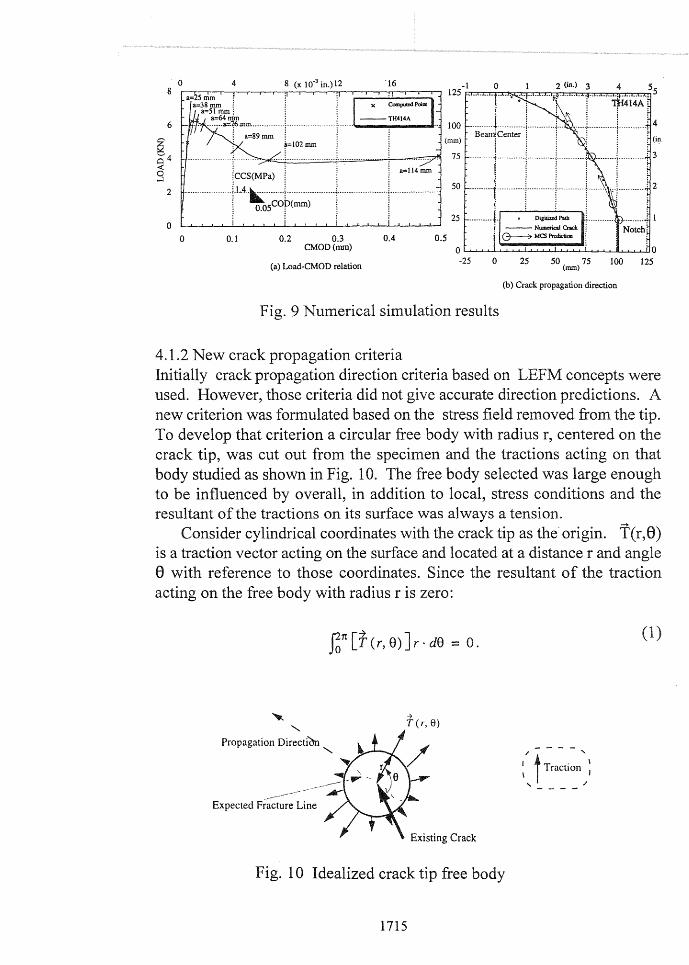
4.1. l Procedures The three objectives were explored using the concept shown schematically shown Fig. 8. A discrete crack was embedded in the two dimensional finite element mesh. The experimental load-CMOD relations and an assumed CCS-COD relation were used to determine stress states for a given crack length as shown in Fig. 9a. The resulting stress states and a crack propagation direction criterion were then used to predict the crack propagation direction as shown in Fig. 9b. That prediction was compared to the experimental results and the error was calculated. The CCS-COD model was optimized so that the total error in the propagation direction was a minimum. For the five specimens listed in Table 1 the same CCS-COD relation was assumed for any location along the crack interface.
Optimized item Objective function Resulting item
1,..-cCS-CODRelation - l / ~~ Examineth;con-)
alo.ng the crack inter- I
1. J j Q I stancy of candi- I
I face. CMOD I date variables at ______ / ' I ,,......... - - - - - l crack growth. New theory for crack \ ( ~ J _ _ _ _ .../
I pr?p~gation direction I Crack pa~ I cntenon. J · ------
Fig. 8 Modeling concept for this study
1714
0 4 8 (x 10-3 in.) 12 0 2 (in.) 3
6
2
0
0 O.l 0.2 0.3 0.4 0.5 CMOD(mm)
(a) Load-CMOD relation 0 25 50 75 100 125 (mm)
(b) Crack propagation direction
Fig. 9 Numerical simulation results
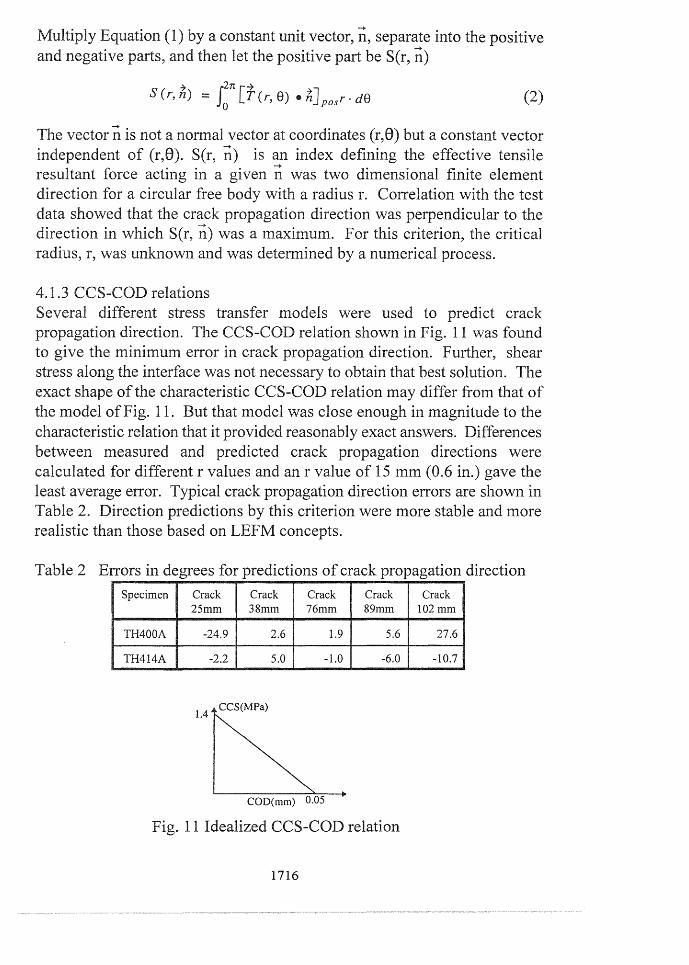
4.1.2 New crack propagation criteria Initially crack propagation direction criteria based on LEFM concepts were used. However, those criteria did not give accurate direction predictions. A new criterion was formulated based on the stress field removed from the tip. To develop that criterion a circular free body with radius r, centered on the crack tip, was cut out from the specimen and the tractions acting on that body studied as shown in Fig. 10. The free body selected was large enough to be influenced by overall, in addition to local, stress conditions and the resultant of the tractions on its surface was always a tension.
Consider cylindrical coordinates with the crack tip as the· origin. f (r,8) is a traction vector acting on the surface and located at a distance r and angle 8 with reference to those coordinates. Since the resultant of the traction acting on the free body with radius r is zero:
fo1t [ r < r, e) J r . de = o . (1)
-7 T(r, 8)
Propagation Directiem ........... ,.----,
~ t Traction ~ '----/
-------------Expected Fracture Line
Fig. 10 Idealized crack tip free body
1715
Equation (1) by a constant unit vector, ii, separate into the positive and negative parts, and let the positive part be S(r, ii)
? J2n [~ 7 S (r, n) = T (r, 8) • n] r. dfJ 0 pas (2)
vector ii is not a normal vector at coordinates (r,8) but a constant vector independent of (r,8). S(r, n) is an index defining the effective tensile resultant force acting a given ii was two dimensional finite element direction for a circular free body with a radius r. Correlation with the test data showed that the crack propagation direction was perpendicular to the
in which S(r, ii) was a maximum. For this criterion, the critical r, was unknown and was determined by a numerical process.
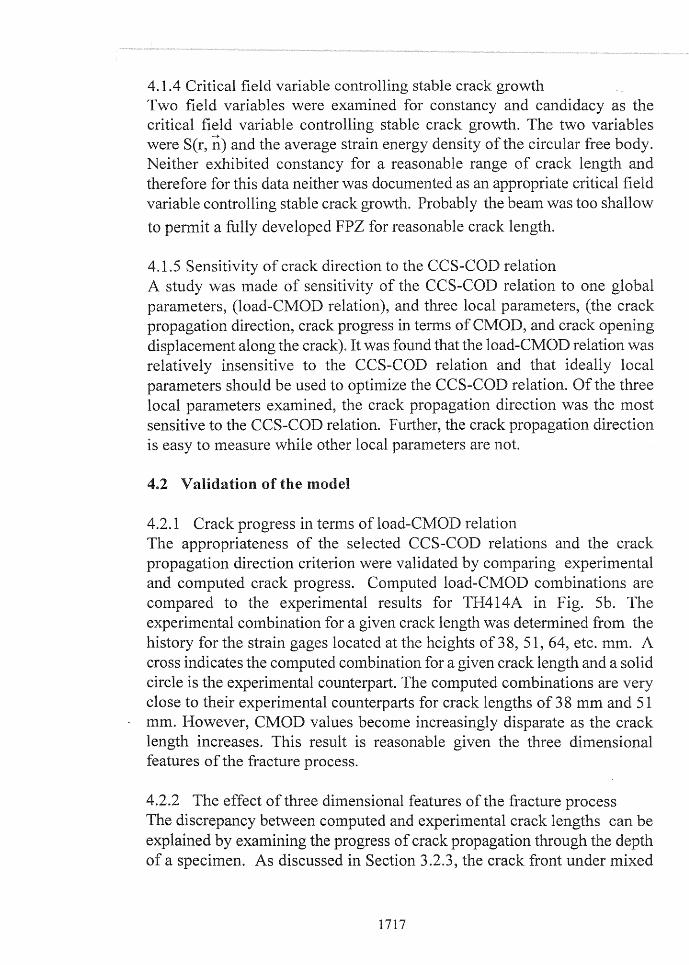
different stress transfer models were used to predict crack propagation direction. CCS-COD relation shown in Fig. 11 was found to the minimum error in crack propagation direction. Further, shear stress along the interface was not necessary to obtain that best solution. The exact shape of the characteristic CCS-COD relation may differ from that of
model of Fig. 11. But model was close enough in magnitude to the characteristic relation that it provided reasonably exact answers. Differences
measured and predicted crack propagation directions were calculated for different r values and an r value of 15 mm (0.6 in.) gave the least average eITor. Typical crack propagation direction errors are shown in Table 2. Direction predictions by this criterion were more stable and more realistic than those based on LEFM concepts.
Table 2 Errors in degrees for predictions of crack propagation direction
Specimen Crack Crack Crack Crack Crack 25mm 38mm 76mm 89mm 102 mm
TH400A -24.9 2.6 1.9 5.6 27.6
TH414A -2.2 5.0 -i.o I -6.0 -10.7
1 CCS(MPa)
.4
COD(mm) 0.05
Fig. 11 Idealized CCS-COD relation
1716
4.1.4 Critical field variable controlling stable crack growth Two field variables were examined for constancy and candidacy as critical field variable controlling stable crack growth. two variables were S(r, Ii) and the average strain energy density of the circular free body. Neither exhibited constancy for a reasonable range of crack length therefore for this data neither was documented as an appropriate critical variable controlling stable crack growth. Probably the beam was too shallow
to permit a fully developed FPZ for reasonable crack length.
4.1.5 Sensitivity of crack direction to the CCS-COD relation study was made of sensitivity of the CCS-COD relation to one global
parameters, (load-CMOD relation), and three local parameters, (the crack propagation direction, crack progress in terms of CMOD, crack opening displacement along the crack). It was found that the load-CMOD relation was relatively insensitive to the CCS-COD relation and ideally local parameters should be used to optimize the CCS-COD relation. Of the three local parameters examined, the crack propagation direction was the most sensitive to the CCS-COD relation. Further, the crack propagation direction is easy to measure while other local parameters are not.
4.2 Validation of the model
4.2.1 Crack progress in terms of load-CMOD relation The appropriateness of the selected CCS-COD relations and the crack propagation direction criterion were validated by comparing experimental and computed crack progress. Computed load-CMOD combinations are compared to the experimental results for TH414A Fig. Sb. experimental combination for a given crack length was determined from the history for the strain gages located at the heights of 3 8, 51, 64, etc. mm. A cross indicates the computed combination for a given crack length and a solid circle is the experimental counterpart. computed combinations are very close to their experimental counterparts for crack lengths 3 8 mm and 51 mm. However, CMOD values become increasingly disparate as the crack length increases. This result is reasonable given the three dimensional features of the fracture process.
4.2.2 The effect of three dimensional features of the fracture process discrepancy between computed and experimental crack lengths can be
explained by examining the progress of crack propagation through the of a specimen. As discussed in Section 3.2.3, the crack under mixed
1717
(a) Different stages of the continuous crack front
Front for the
Crack propagation direction J; discontinuous crack.
. I I Crack front ~-----K_a ::J det~rmined by a
~s m~~~
Lower edge of the continuous cracked zone.
Mathematical two dimensional crack tip.
Centroid of the vertical projection of the discontinuous cracking zone ..
(b) Vertical projection of a typical crack
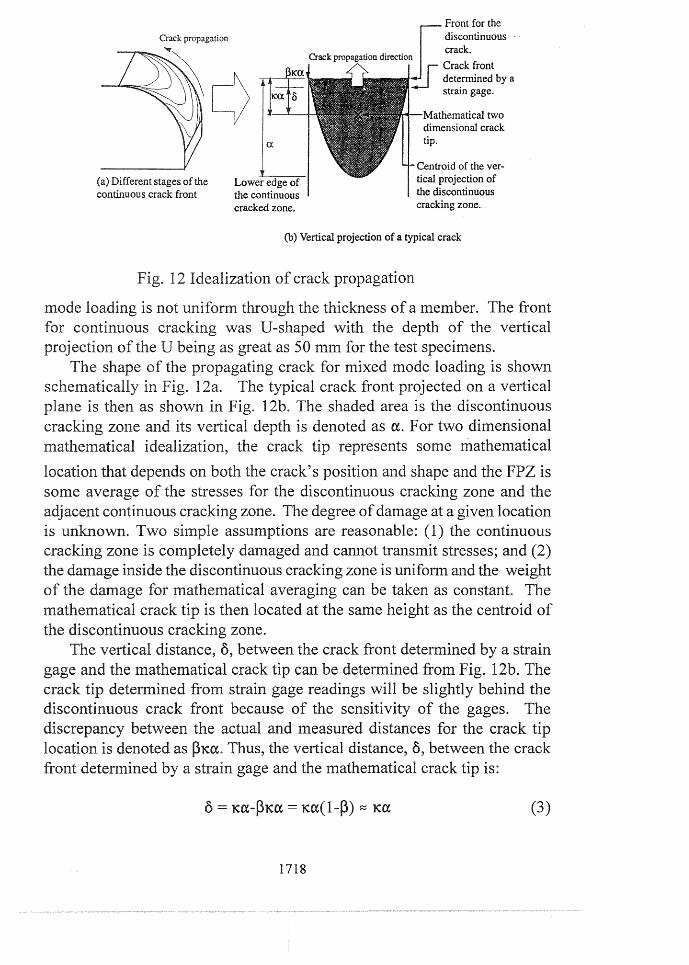
Fig. 12 Idealization of crack propagation
loading is not through the thickness of a member. The front continuous cracking was U-shaped with the depth of the vertical _.., ... ~"" ...... of the U being as great as 50 mm for the test specimens.
shape of the propagating crack for mixed mode loading is shown schematically in Fig. 12a. The typical crack front projected on a vertical
is then as shown Fig. 12b. The shaded area is the discontinuous ....... n_,.. ... .., .. p;... zone and its vertical depth is denoted as ex. For two dimensional
idealization, the crack tip represents some mathematical
'""·"'"'.,,that depends on both the crack's position and shape and the FPZ is some average of the stresses for the discontinuous cracking zone and the adjacent continuous cracking zone. The degree of damage at a given location
unknown. Two simple assumptions are reasonable: (1) the continuous cracking zone is completely damaged and cannot transmit stresses; and (2)
damage inside the discontinuous cracking zone is uniform and the weight damage for mathematical averaging can be taken as constant. The
.JUl.Jl. ... ~ ................... i.~ .. .ll....,~ ... crack tip is then located at the same height as the centroid of discontinuous cracking zone.
vertical distance, o, between the crack front determined by a strain and the mathematical crack tip can be determined from Fig. l 2b. The tip determined from strain gage readings will be slightly behind the
discontinuous crack front because of the sensitivity of the gages. The between actual and measured distances for the crack tip
,,, .. ,,T,,.,,.,.... is denoted as PKcx. Thus, the vertical distance, o, between the crack determined by a strain gage and the mathematical crack tip is:
(3)
1718
The magnitude of P must be small and Ka. must be the dominant term. In the experiments dye injection showed that a ranged from about 0 to 50 mm. If the continuous crack front is approximated by a parabola, then oranges from 0 to 20 mm. Thus, a discrepancy between computed and experimental crack lengths is to be expected as the crack length increases.
4.3 Findings from Illinois investigations 1. The curvature of the crack demonstrates the extent of the Mode II
component present in a mixed mode loading condition. The magnitude of that component increases with increasing steel constraints and decreasing concrete compressive strength.
2. The crack front has 3D features that make accurate 2D mathematical modeling even more difficult for mixed mode loading than for Mode I loading. Dye tests showed a U-shaped continuous crack front for mixed mode loading. Mathematical modeling requires definition of the position of the crack front; characterization of the CCS-COD relation; and for determining crack propagation direction, a method for compensating for the 3D features of the crack front.
3. With the CCS-COD relation of Fig. 11 and the experimental load-CM OD relation the crack propagation direction could be simulated. Mathematically, that CCS-COD relation characterized adequately the FPZ and shear stress on the crack interface could be neglected.
4. In 2D analysis, the stress field removed from the 2D mathematical crack tip, rather than the near tip stress field, needs to be considered order to accurately study the fracture process. A crack propagation direction criterion based on that concept was developed that gave more accurate results than a criterion based on LEFM concepts.
5. Global parameters, such as load and LLD, are easy to measure but are not sensitive to the characteristics of the fracture model and should not be used alone to determine the characteristics of that model. Local parameters, such as the COD profile, are sensitive to the characteristics of the fracture model. However, such parameters are difficult to measure accurately. Crack propagation direction is one local parameter that is easy to measure and calculate.
5. Conclusions
1. Available fracture concepts cannot accurately predict the shear strength of reinforced concrete beams of normal proportions.
2. Crack curving and an increasing post-inclined cracking capacity can be
1719
predicted using an appropriate CCS-COD relation and appropriate mathematical modeling adjustment for the 3D features of the crack front. Interface shear transfer effects are not needed to explain crack curving or post-inclined cracking capacity increases.
3. accurately predict shear strengths the critical field variable controlling stable crack growth must be determined. Tests on specimens larger than those used in this investigation are needed to establish that variable.
References
M.W., Higgins, N.W. and Wittkopp, R.R. (1979) Kani on Shea:r in Reinforced Concrete. Dept. of Civil Engrg., Univ. of Toronto, Canada.
M., Shioya, T., Nojiri, Y. and Akiyama, H. (1984) Experimental studies on shear strength of large reinforced concrete beams under uniformly distributed loads. Proc. of JSCE, 345N-l, 137-154.
Hillerborg, A., Modeer, M. and Petersson, (1976) Analysis of crack formatio~ and crack growth in concrete by means of fracture mechanics
finite elements. Cem. & Coner. Res., 6, 773-782. ·
................................... , Z.P. ( 1984) effect in blunt fracture: concrete, rock, metal. Journal ofEngrg. Mech., ASCE 110, 518-535.
Bazant, Z.P. and Kazemi, M.T. (1991) Size effect on diagonal shear failure of beams without stirrups. ACI Struc. Jnl., 88, No. 3, 268-276.
Gustafsson, P.J. and Hiller}?org, A. (1988) Sensitivity in shear strength longitudinally reinforced concrete beams to fracture energy of
concrete. ACI St:ruc. Jnl., 85, No. 3, 286-294.
Bascoul, A and Turatsinze, A. (1992) Discontinuous crack growth as process zone through SEM analysis. Proc. of Framcos 1, Breckinridge, CO, June 1992, (ed. Bazant) Elsevier, 503-508.
Swartz. S.E. and Refai, (1989) Cracked surface revealed by dye and its utility in determining fracture parameters. Fracture Toughness and Fracture Energy - Test Methods for Concrete and Rock (eds. H. Mihashi, H. Takahashi, and F.H. Wittmann) 509-520.
1720