Embed Size (px)
Citation preview
Cleared for Public Release – Copyright 2016 Southwest Research Institute
Fracture Mechanics and Nondestructive Evaluation Modeling
to Support Rapid Qualification of
Additively Manufactured Parts
Craig McClung, Michael Enright, John McFarland, Jonathan Moody
Southwest Research Institute
Irving Gray, Joe Gray NDE Technologies, Inc.
ASTM Workshop on Mechanical Behavior of Additive Manufactured Components May 4, 2016
San Antonio, Texas

Cleared for Public Release – Copyright 2016 Southwest Research Institute 2
Acknowledgments
• Funding for this SBIR effort provided by the US Air Force Research Laboratory Andrew Nauss, AFRL Program Monitor for Phase I Bill Musinski, AFRL Program Monitor for Phase II

Cleared for Public Release – Copyright 2016 Southwest Research Institute
Motivation
• Additive Manufacturing methods can produce defects
• NDE may be required to ensure structural integrity
• Key questions: What size defects can be found in a complex part? What size defects matter to structural integrity?
• Simulation modeling can be used to answer these questions without expensive physical testing NDE simulation can determine what size defects can be found Fracture mechanics simulation can determine what size defects
matter to structural integrity Coupled simulations can determine the impact of NDE reliability on
fracture risk
3

Cleared for Public Release – Copyright 2016 Southwest Research Institute
Method: Integrated NDE and Fracture Risk Models
4
Stress and Fracture Mechanics Analysis
CAD
Risk of Fracture With Inspection
NDE Process Simulation
Probability of Detection Curve

Cleared for Public Release – Copyright 2016 Southwest Research Institute
Overview
• Defect Morphology Identify anomaly types associated with DMLS additive
manufacturing processes
• POD Curve Simulation Link NESSUS with XRSIM to generate location-specific POD
curves
• Fracture Risk Simulation Link NESSUS/XRSIM-generated POD curves with DARWIN to
predict risk of fracture with inspection
• Application Example Illustrate generation of location-specific POD curves and fracture
risk assessment for actual component (engine mount)
5

Cleared for Public Release – Copyright 2016 Southwest Research Institute
Representative AM Defects
Low Energy- Lack Of Fusion High Energy- Keyhole Porosity
6

Cleared for Public Release – Copyright 2016 Southwest Research Institute
Simulating Non-Destructive Inspections Using XRSIM
• XRSIM simulates the application of X-Rays to a component to identify defects
• The intensity of the simulated X-Ray images is dependent on a number of factors Equipment
• Inherent filtration of x-ray tube, eddy current lift off and coil tilt, broad band center frequency
Setup • Placement of the central axis of the x-ray tube, orientation of the UT
probe, scan variation in lift off and probe tilt Signal Noise Flaw morphology
• Size, shape, position & orientation in the part
7
Cleared for Public Release – Copyright 2016 Southwest Research Institute
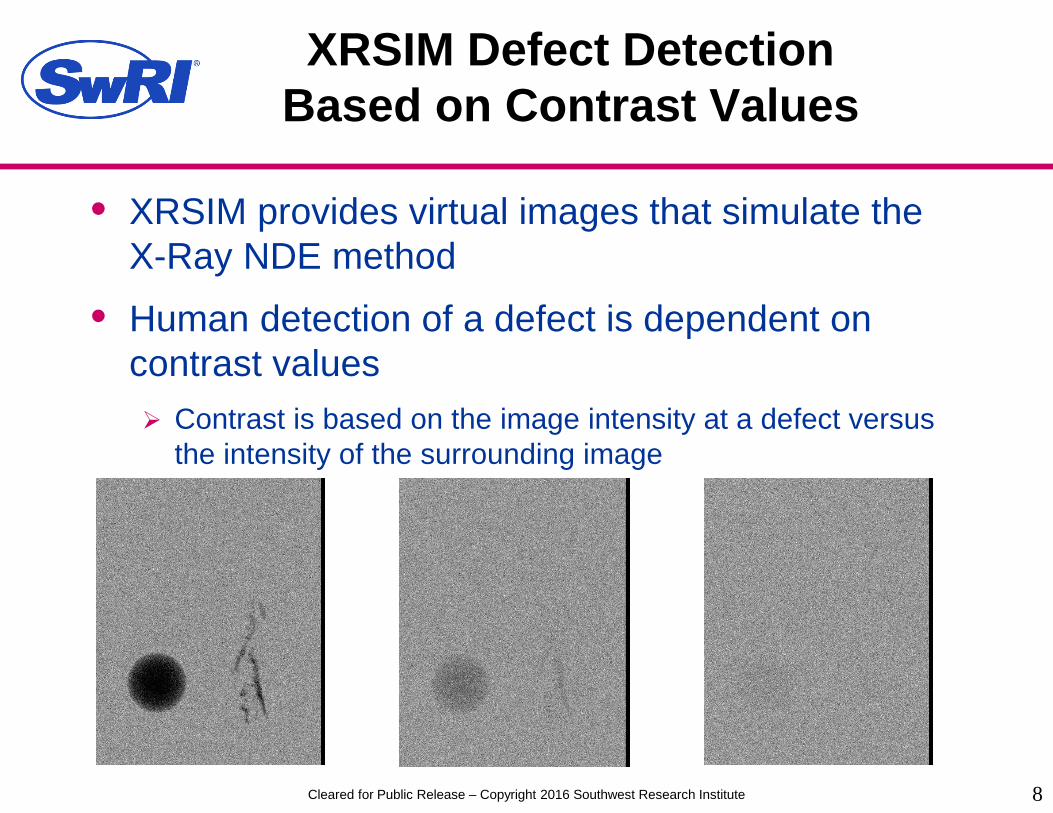
XRSIM Defect Detection Based on Contrast Values
• XRSIM provides virtual images that simulate the X-Ray NDE method
• Human detection of a defect is dependent on contrast values Contrast is based on the image intensity at a defect versus
the intensity of the surrounding image
8

Cleared for Public Release – Copyright 2016 Southwest Research Institute
Simulating POD Curves Using Probabilistic Analysis
• The contrast value associated with a single defect size is modeled as a random variable
• The threshold contrast value at which a defect can be detected by a human is also modeled as a random variable
9
Simulated Contrast (Single Defect Size) Human Detection Threshold
Contrast
Probability of Detection

Cleared for Public Release – Copyright 2016 Southwest Research Institute
Simulating POD Curves Using Probabilistic Analysis (cont.)
• The POD values for each anomaly size can be used to construct the full POD curve
10
Human Detection Threshold
Contrast
Simulated Contrast Increasing Defect Size
POD
Defect Size
Detection Probabilities

Cleared for Public Release – Copyright 2016 Southwest Research Institute 11
POD Curve Simulation Using NESSUS and XRSIM
• Create a response surface model Relates contrast values with XRSIM input
variables
• Propagate NDI random variables through response surface Result: PDF of contrast values
• Create a probabilistic model (PDF) of human contrast detection threshold Based on detect/no detect data
• Obtain POD curve Achieved by comparing contrast PDF with
contrast threshold PDF at each anomaly size
Input Random Variables
NESSUS
XRSIM
DOE Input File
DOE Results File
NESSUS
POD File

Cleared for Public Release – Copyright 2016 Southwest Research Institute 12
Process for Constructing Contrast Response Surface
• Identify ranges of XRSIM input variables
• Generate a table of XRSIM input data using design of experiments (DOE) approach in NESSUS
• Generate training data for each set in DOE table using XRSIM
• Construct a Gaussian Process response surface fit to the contrast training data using NESSUS
Design of Experiments Input Variable Ranges Response Surface

Cleared for Public Release – Copyright 2016 Southwest Research Institute
DARWIN GUI Overview Design Assessment of Reliability With INspection
POD curves provided as input to DARWIN

Cleared for Public Release – Copyright 2016 Southwest Research Institute
Linking XRSIM/NESSUS with DARWIN
14
CAD Model
Input Random Variables
NESSUS
XRSIM
DARWIN
NESSUS
Risk of Fracture With Inspection
• Contrast values • Detect/no detect data
• Part thickness • Detector signal • Spherical pore size
• Part thickness • Detector signal • Spherical pore size
• POD versus - pore size - part thickness
DMLS
Part Thickness File
DOE Input File
DOE Results File
POD File
Part Thickness File
ANSYS Model

Cleared for Public Release – Copyright 2016 Southwest Research Institute 15
Application Example: Additive Manufacturing
Location 1 Location 2
Location 3
• Actual engine mount developed under DARPA project (DMLS AM process, Ni 718 Alloy)
CAE Model

Cleared for Public Release – Copyright 2016 Southwest Research Institute 16
XRSIM Input Variables
• Geometry complexity implies Multiple orientations of the part Several kilovoltage settings
• POD data assumes application of an inspection protocol where kilovoltage and orientations are fixed
• Key parameters controlling contrast Part thickness Pore size Detector signal (grey scale) Contrast noise

Cleared for Public Release – Copyright 2016 Southwest Research Institute 17
XRSIM Thickness Maps
Front View Right View
Left View Back View
Top View
Thickness Legend
Cleared for Public Release – Copyright 2016 Southwest Research Institute 18
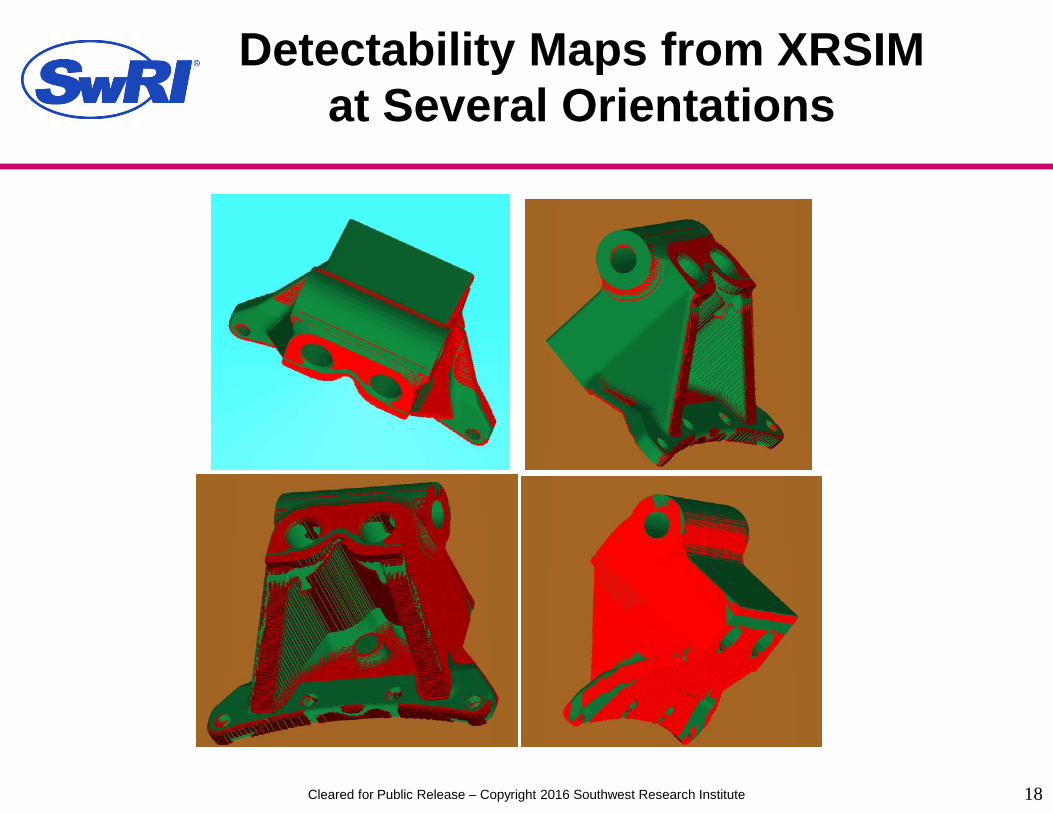
Detectability Maps from XRSIM at Several Orientations

Cleared for Public Release – Copyright 2016 Southwest Research Institute 19
Probabilistic Model of Human Detectability Contrast Threshold
• Threshold value estimated based on 100 XRSIM results and corresponding detect/no detect data from NDE Technologies
• Detection does not follow a strict rule based on a single threshold value, so threshold modeled as a random variable
• Maximum likelihood used to estimate threshold mean and standard deviation, assuming normal distribution: Mean=183, Stdev=41
Zoomed in to show detail near threshold
Outlier
Detect/no detect results
Cleared for Public Release – Copyright 2016 Southwest Research Institute 20
Probability of Detection Curves
• Deterministic input variables: Part thickness Pore size
• Random input variables: Detector signal: Uniform (10,14000) Contrast noise: Normal (0,79) Contrast threshold: Normal (183,41)
• POD curves were computed using Monte Carlo simulation combined with conditional expectation POD = Probability [Contrast > Contrast threshold]

Cleared for Public Release – Copyright 2016 Southwest Research Institute 21
Location 1 Results
Thickness = 8.1 mm (0.319 in)
RSM boundary
Orientation 1
Orientation 2 Thickness = 45.45 mm (1.79 in)
Beyond range of RSM applicability
(1mm to 35mm)

Cleared for Public Release – Copyright 2016 Southwest Research Institute 22
Influence of NDI on Manufacturing Anomaly Distribution
Cleared for Public Release – Copyright 2016 Southwest Research Institute
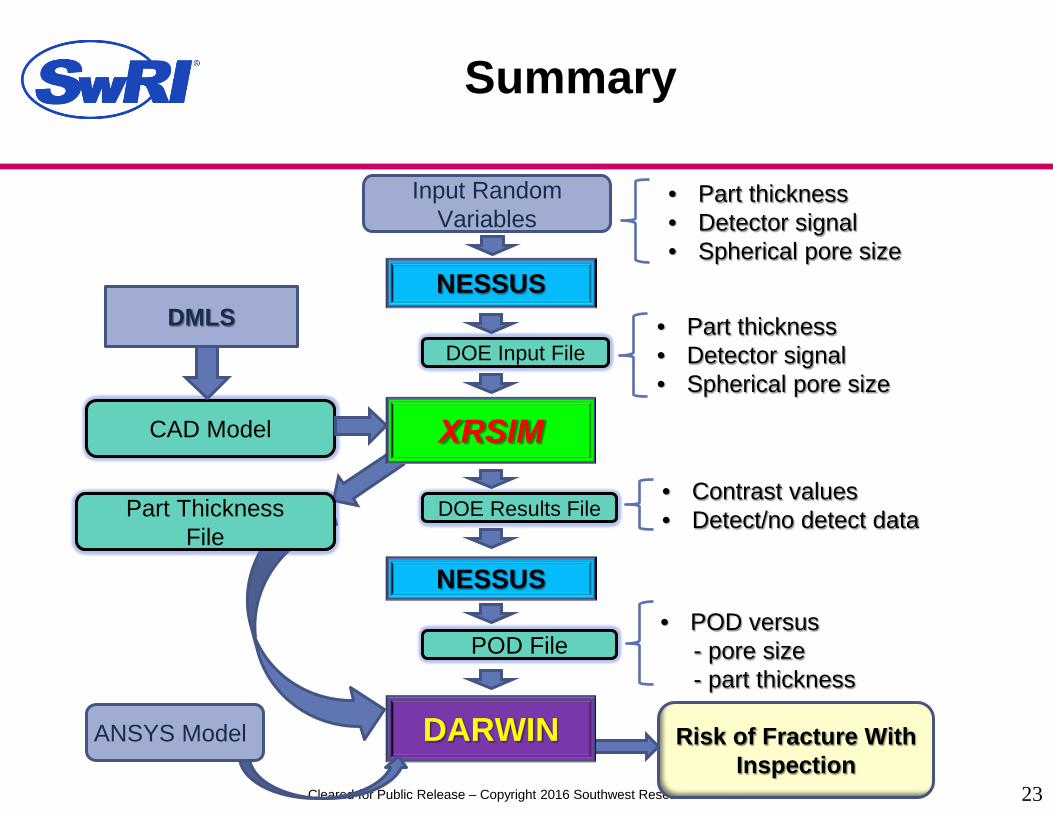
Summary
23
CAD Model
Input Random Variables
NESSUS
XRSIM
DARWIN
NESSUS
Risk of Fracture With Inspection
• Contrast values • Detect/no detect data
• Part thickness • Detector signal • Spherical pore size
• Part thickness • Detector signal • Spherical pore size
• POD versus - pore size - part thickness
DMLS
Part Thickness File
DOE Input File
DOE Results File
POD File
Part Thickness File
ANSYS Model

Cleared for Public Release – Copyright 2016 Southwest Research Institute 24
Continuing Tasks
• Automate POD curve creation in XRSIM
• Automate transfer of location-specific POD curves from XRSIM to DARWIN
• Implement inverse calculation of critical initial crack size in DARWIN and transfer to XRSIM
• Verification and validation
Cleared for Public Release – Copyright 2016 Southwest Research Institute
Potential Future Extensions
• Use the integrated XRSIM-DARWIN modeling system to optimize NDE scan plans
• Combine with ICME models of the AM process (including models of microstructure and defect formation) to optimize the AM process itself
25
Cleared for Public Release – Copyright 2016 Southwest Research Institute
Role of Material Properties
• The fracture risk simulations also depend on known/assumed values of material properties (e.g., FCG)
• The uncertainties in these properties could be included as another random variable in the fracture risk simulations
• The material properties will be functions of the local microstructure, which will depend on the manufacturing process and the location/orientation within the part
26