Embed Size (px)
Citation preview
U.S. TRANSMISSION CAPACITY:PRESENT STATUS AND FUTURE PROSPECTS
Eric HirstConsulting in Electric-Industry Restructuring
Bellingham, Washington
June 2004
Prepared forEnergy Delivery GroupEdison Electric Institute
Washington, DCRussell Tucker, Project Manager
and
Office of Electric Transmission and DistributionU.S. Department of Energy
Washington, DCLarry Mansueti, Project Manager

ii
iii
CONTENTS
Page
SUMMARY . . . . . . . . . . . . . . . . . . . . . . . . . . . . . . . . . . . . . . . . . . . . . . . . . . . . . . . . . . . . . . v
LIST OF ACRONYMS . . . . . . . . . . . . . . . . . . . . . . . . . . . . . . . . . . . . . . . . . . . . . . . . . . . . vii
1. INTRODUCTION . . . . . . . . . . . . . . . . . . . . . . . . . . . . . . . . . . . . . . . . . . . . . . . . . . . . . . . 1
2. TRANSMISSION CAPACITY: DATA AND PROJECTIONS . . . . . . . . . . . . . . . . . . . 5HISTORICAL DATA . . . . . . . . . . . . . . . . . . . . . . . . . . . . . . . . . . . . . . . . . . . . . . . . 5CURRENT CONDITIONS . . . . . . . . . . . . . . . . . . . . . . . . . . . . . . . . . . . . . . . . . . . . 9PROJECTIONS . . . . . . . . . . . . . . . . . . . . . . . . . . . . . . . . . . . . . . . . . . . . . . . . . . . . . 9SUMMARY . . . . . . . . . . . . . . . . . . . . . . . . . . . . . . . . . . . . . . . . . . . . . . . . . . . . . . . 15
3. REVIEW OF TRANSMISSION PLANS . . . . . . . . . . . . . . . . . . . . . . . . . . . . . . . . . . . . 17NORTHEAST POWER COORDINATING COUNCIL . . . . . . . . . . . . . . . . . . . . 19MID-ATLANTIC AREA COUNCIL . . . . . . . . . . . . . . . . . . . . . . . . . . . . . . . . . . . 25SOUTHEASTERN ELECTRIC RELIABILITY COUNCIL . . . . . . . . . . . . . . . . . 26FLORIDA RELIABILITY COORDINATING COUNCIL . . . . . . . . . . . . . . . . . . 28MIDWEST . . . . . . . . . . . . . . . . . . . . . . . . . . . . . . . . . . . . . . . . . . . . . . . . . . . . . . . . 28SOUTHWEST POWER POOL . . . . . . . . . . . . . . . . . . . . . . . . . . . . . . . . . . . . . . . . 33ELECTRIC RELIABILITY COUNCIL OF TEXAS . . . . . . . . . . . . . . . . . . . . . . . 34WESTERN ELECTRICITY COORDINATING COUNCIL . . . . . . . . . . . . . . . . . 35
4. DISCUSSION OF PLANS . . . . . . . . . . . . . . . . . . . . . . . . . . . . . . . . . . . . . . . . . . . . . . . 43
5. CONCLUSIONS . . . . . . . . . . . . . . . . . . . . . . . . . . . . . . . . . . . . . . . . . . . . . . . . . . . . . . . 49
ACKNOWLEDGMENTS . . . . . . . . . . . . . . . . . . . . . . . . . . . . . . . . . . . . . . . . . . . . . . . . . . 52
REFERENCES . . . . . . . . . . . . . . . . . . . . . . . . . . . . . . . . . . . . . . . . . . . . . . . . . . . . . . . . . . 53

iv
v
Transmiles
0
0.5
1
1.5
2
2.5
3
1982-1992 1992-2002 2002-2012
GR
OW
TH R
ATE
(%/y
ear)
Transmission (GW-miles) Summer Peak (GW)
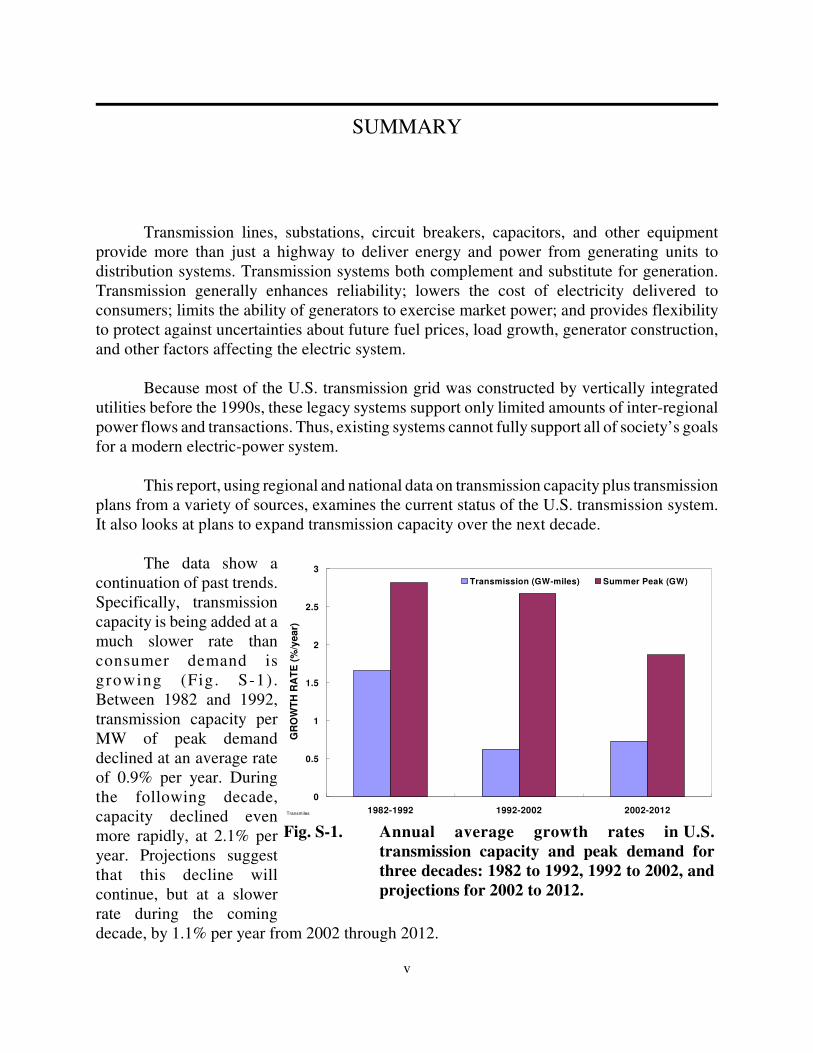
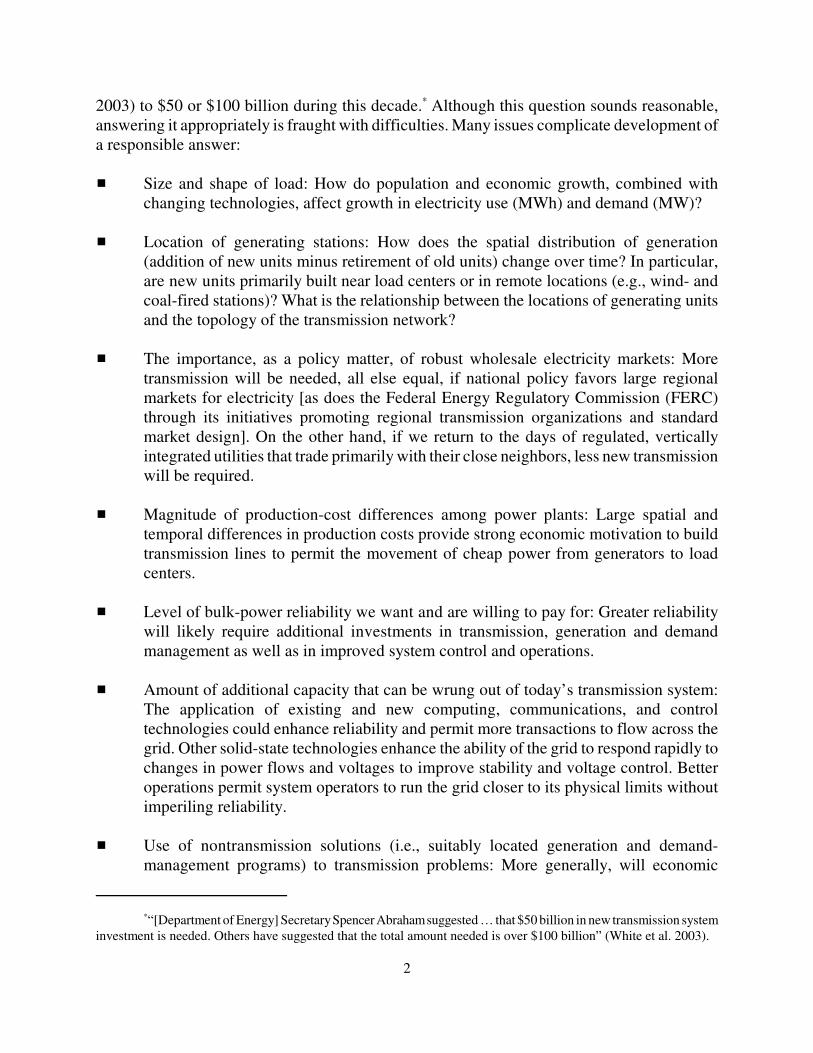
Fig. S-1. Annual average growth rates in U.S.transmission capacity and peak demand forthree decades: 1982 to 1992, 1992 to 2002, andprojections for 2002 to 2012.
SUMMARY
Transmission lines, substations, circuit breakers, capacitors, and other equipmentprovide more than just a highway to deliver energy and power from generating units todistribution systems. Transmission systems both complement and substitute for generation.Transmission generally enhances reliability; lowers the cost of electricity delivered toconsumers; limits the ability of generators to exercise market power; and provides flexibilityto protect against uncertainties about future fuel prices, load growth, generator construction,and other factors affecting the electric system.
Because most of the U.S. transmission grid was constructed by vertically integratedutilities before the 1990s, these legacy systems support only limited amounts of inter-regionalpower flows and transactions. Thus, existing systems cannot fully support all of society’s goalsfor a modern electric-power system.
This report, using regional and national data on transmission capacity plus transmissionplans from a variety of sources, examines the current status of the U.S. transmission system.It also looks at plans to expand transmission capacity over the next decade.
The data show acontinuation of past trends.Specifically, transmissioncapacity is being added at amuch slower rate thanconsumer demand isgrowing (Fig. S-1) .Between 1982 and 1992,transmission capacity perMW of peak demanddeclined at an average rateof 0.9% per year. Duringthe following decade,capacity declined evenmore rapidly, at 2.1% peryear. Projections suggestthat this decline willcontinue, but at a slowerrate during the comingdecade, by 1.1% per year from 2002 through 2012.

vi
A review of 20 transmission plans and related documents shows enormous variabilityin the topics covered and the comprehensive and quality of the reports. Roughly half the studiesfocused on reliability, while the other half focused on economics (reducing congestion to lowerthe cost of power delivered to consumers). Few reports addressed all the reasons for addingtransmission capacity to a system: meet reliability requirements, lower costs to consumers,interconnect new generation and load, replace old or obsolete equipment, and, in some cases,improve local air quality.
In addition to substantial differences among the reports, many transmission owners andregional reliability councils do not publish transmission plans at all. Thus, the geographicalcoverage of this study is spotty and limited.
Most of the recent and planned investment in transmission facilities is intended to solvelocal reliability problems and serve growing loads in large population centers. Few projectscross utility or regional boundaries and are planned to move large blocks of low-cost powerlong distances to support large regional wholesale electricity markets. Thus, many opportunitiesto lower consumer power costs will be forgone because of insufficient transmission capacity.
vii
LIST OF ACRONYMS
ACC Arizona Corporation Commission
ATC American Transmission Company
BPA Bonneville Power Administration
CRR Congestion revenue rights
ECAR East Central Area Reliability Coordination Agreement
EEI Edison Electric Institute
EIA Energy Information Administration
ERCOT Electric Reliability Council of Texas
FERC U.S. Federal Energy Regulatory Commission
FRCC Florida Reliability Coordinating Council
ISO Independent system operator
LMP Locational marginal price
MAAC Mid-Atlantic Area Council
MAIN Mid-America Interconnected Network
MAPP Mid-Continent Area Power Pool
MISO Midwest ISO
NERC North American Electric Reliability Council
NPCC Northeast Power Coordinating Council
NTAC Northwest Transmission Assessment Committee
viii
PJM Pennsylvania, New Jersey, Maryland Interconnection, LLC
PSC Public service commission
PUC Public utility commission
RMR Reliability must run
ROW Right of way
SERC Southeastern Electric Reliability Council
SPP Southwest Power Pool
SSG-WI Seams Steering Group—Western Interconnection
STEP Southwest Transmission Expansion Project
TLR Transmission loading relief
WECC Western Electricity Coordinating Council
CHAPTER 1
INTRODUCTION
There’s plenty of talk about transmission. But real action on transmissionconstruction is scant. Conferences and reports abound. Projects of all sizes arebeing proposed. But, except for local reinforcements and new generationinterconnections, few transmission construction proposals are moving forward.The vast majority of larger projects are stalled for lack of financial commitment(Mullen 2003).
The August 2003 blackout that hit the Midwest, Northeast, and Ontario was a wake-upcall on the U.S. transmission system. Whether one considers the transmission grid adequate,“fragile,” “antiquated,” or even “third-world” (Burns, Potter, and Wiotkind-Davis 2004),almost everyone agrees that the electricity industry and government policy makers should paymore attention to transmission, in particular construction of needed new facilities.
A survey of state regulators showed considerable concern about transmission adequacy(Mullen 2003): “Just 23% in the Midwest and a paltry 18% in the West described the grid as‘fully adequate.’ … Regulators in the Northeast and South were more sanguine. In theNortheast, 40% of respondents described the grid as fully adequate, versus 63% in the South.”On a positive note, a survey of 72 top officers in U.S. and Canadian electric utilities found that“Transmission is seen as the most profitable sector [and] where most capital will go” (GFEnergy 2004).
This report analyzes recent data and projections on U.S. transmission capacity andcapital expenditures on transmission. In addition, this report reviews recent transmission plansand related documents published by electric utilities (both public and private), independentsystem operators (ISOs), standalone transmission companies, regional reliability councils, andstate public utility commissions (PUCs).
The motivation for this project goes well beyond the August 2003 blackout. Indeed, thisproject is stimulated primarily by the long-term and continuing decline in the amount oftransmission capacity relative to peak electrical demand (Hirst 2000; Hirst and Kirby 2001;U.S. Department of Energy 2002).
How much should we invest in the U.S. transmission grid to meet the needs of ourgrowing economy? Estimates range from $27 billion over the next several years (Richardson
*“[Department of Energy] Secretary Spencer Abraham suggested … that $50 billion in new transmission systeminvestment is needed. Others have suggested that the total amount needed is over $100 billion” (White et al. 2003).
2
2003) to $50 or $100 billion during this decade.* Although this question sounds reasonable,answering it appropriately is fraught with difficulties. Many issues complicate development ofa responsible answer:
� Size and shape of load: How do population and economic growth, combined withchanging technologies, affect growth in electricity use (MWh) and demand (MW)?
� Location of generating stations: How does the spatial distribution of generation(addition of new units minus retirement of old units) change over time? In particular,are new units primarily built near load centers or in remote locations (e.g., wind- andcoal-fired stations)? What is the relationship between the locations of generating unitsand the topology of the transmission network?
� The importance, as a policy matter, of robust wholesale electricity markets: Moretransmission will be needed, all else equal, if national policy favors large regionalmarkets for electricity [as does the Federal Energy Regulatory Commission (FERC)through its initiatives promoting regional transmission organizations and standardmarket design]. On the other hand, if we return to the days of regulated, verticallyintegrated utilities that trade primarily with their close neighbors, less new transmissionwill be required.
� Magnitude of production-cost differences among power plants: Large spatial andtemporal differences in production costs provide strong economic motivation to buildtransmission lines to permit the movement of cheap power from generators to loadcenters.
� Level of bulk-power reliability we want and are willing to pay for: Greater reliabilitywill likely require additional investments in transmission, generation and demandmanagement as well as in improved system control and operations.
� Amount of additional capacity that can be wrung out of today’s transmission system:The application of existing and new computing, communications, and controltechnologies could enhance reliability and permit more transactions to flow across thegrid. Other solid-state technologies enhance the ability of the grid to respond rapidly tochanges in power flows and voltages to improve stability and voltage control. Betteroperations permit system operators to run the grid closer to its physical limits withoutimperiling reliability.
� Use of nontransmission solutions (i.e., suitably located generation and demand-management programs) to transmission problems: More generally, will economic
*The Eastern Interconnection contains 75% of the nation’s summer peak demand, while ERCOT and theWestern (WECC) Interconnections contain 8 and 17%, respectively (NERC 2003d).
3
signals [especially, locational marginal prices (LMPs) and congestion revenue rights(CRRs), key elements of FERC’s standard market design] stimulate the construction ofgenerating units and the creation of demand-management programs at locations thatreduce congestion? Will these economic signals motivate construction of appropriatelylocated merchant transmission projects?
As an example of how different answers to these questions might affect the amounts,types, and locations of transmission investment, consider the needs for reliability and economicefficiency. Krapels (2003) suggests that “A few billion well-placed dollars will solve thereliability problem; it will take tens of billions to thoroughly modernize and optimize the grid.”
More broadly, new transmission can be built for different purposes, including:
� Interconnection of new load or generation: Facilities required to connect to thetransmission grid, but not necessarily to transport power across the grid.
� Reliability: Facilities required to meet NERC, regional reliability council, and otherstandards, primarily the NERC (1997) Planning Standards.
� Economics: Facilities that lower the cost of electricity production by reducing losses andcongestion to permit greater use of low-cost generators to serve distant load centers.
� Replacement: Facilities that replace old, worn-out, and/or obsolete equipment.
The amount of money needed for transmission investment will depend on which categories areconsidered.
Finally, opinions vary widely on the severity of our transmission problems and the needfor additional capital expenditures. Huntoon and Metzner (2003) suggest we need “a stableregulatory environment” to address the “myth of the transmission deficit.” They believe newtransmission needed for reliability purposes should be determined on a regional basis throughexisting institutions, and transmission needed to relieve congestion should be built on acompetitive basis when it is the most efficient solution to congestion. Hirst and Kirby (2001 and2003) believe that separating reliability from economic needs is very difficult and thatsubstantial investments for both purposes are required. Others believe that serious transmissionproblems exist but can be addressed in large part with nontransmission solutions, in particulardispersed generation and demand management (White et al. 2003).
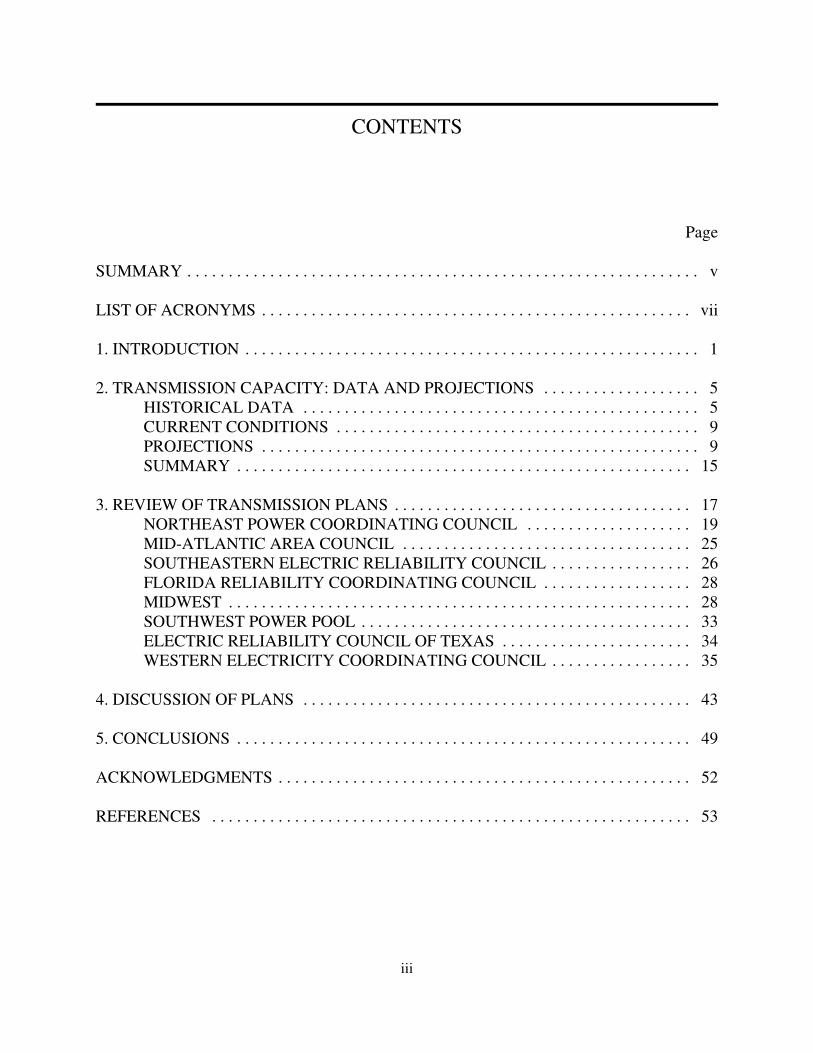
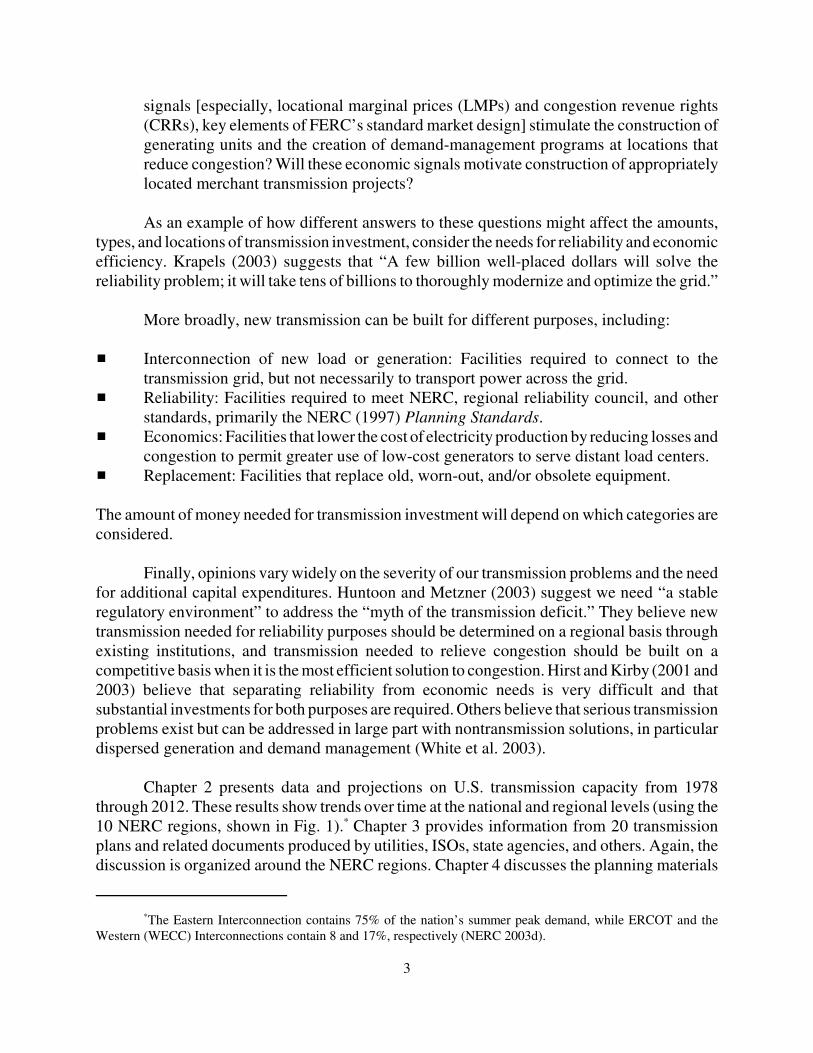
Chapter 2 presents data and projections on U.S. transmission capacity from 1978through 2012. These results show trends over time at the national and regional levels (using the10 NERC regions, shown in Fig. 1).* Chapter 3 provides information from 20 transmissionplans and related documents produced by utilities, ISOs, state agencies, and others. Again, thediscussion is organized around the NERC regions. Chapter 4 discusses the planning materials
4
Fig. 1. Map of the United States showing the locationsof the 10 reliability regions. WECC and ERCOTare Interconnections as well as regions. Theremaining eight regions are part of the EasternInterconnection.
covered in Chapter 3 andidentifies several criticaltransmission issues invarious regions and theirresolution. Finally, Chapter 5presents conclusions fromthis project.
*The EEI data have, at various times, included distribution as well as transmission lines, and data from ruralcoops as well as from other types of utilities. These data are reported for 12 voltage levels ranging from less than 22kV to 601 kV and over.
#The NERC data are based on utility and regional-reliability-council filings to the Energy InformationAdministration (EIA 2001 and 2002) on forms EIA-411 and 412 and to FERC on its Form-1. EIA-411 collectsinformation on “Proposed Transmission Lines,” while EIA-412 and FERC Form-1 collect data on “ExistingTransmission Lines.” NERC reports transmission mileage for four voltage levels ranging from 230 kV to 765 kV.
§These capacity values are as of December 31 for the year stated, i.e., from the end of 1989 through the endof 2002.
5
CHAPTER 2
TRANSMISSION CAPACITY: DATA AND PROJECTIONS
HISTORICAL DATA
For the past few decades, the Edison Electric Institute (EEI 2003) has collected andpublished data each year on the number of circuit miles of transmission lines in the UnitedStates.* Since 1989, NERC (2003c) has published similar data.# Together, these two data setsprovide a long historical record on the amount of transmission capacity available to moveelectricity from generators to distribution systems.
Although these data sets contain much useful information, they suffer from data-qualityproblems. For example, the NERC data show several occasions when the transmission mileagein a region drops from one year to the next. Almost 20% of the year-to-year changes inhistorical transmission mileage show declines. It is highly unlikely that a utility would retirea line from service rather than replace the conductors or towers with newer ones (perhaps withhigher voltage and MVA ratings).
In addition to data-quality issues, interpreting these data is complicated by the sevenissues listed in Chapter 1. In particular, locations of generating units relative to load centers hasan enormous effect on the need for transmission. Also, not all transmission facilities addmileage to the system; devices such as transformers, capacitor banks, breakers, meters, andcommunication systems are important elements of the grid.
I used the NERC data from 1989§ through 2002 and the EEI data (with a smalladjustment to match the NERC data for the years when both data sets were available) for theearlier years to develop a record of transmission capacity (in both circuit miles and MW-miles);
6
TransMiles
0
20,000
40,000
60,000
80,000
100,000
120,000
140,000
160,000
1978 1980 1982 1984 1986 1988 1990 1992 1994 1996 1998 2000 2002
U.S
. TR
AN
SM
ISS
ION
CA
PA
CIT
Y
Miles GW-miles
TransMiles
0
50
100
150
200
250
300
1978 1980 1982 1984 1986 1988 1990 1992 1994 1996 1998 2000 2002
U.S
. TR
AN
SM
ISS
ION
CA
PA
CIT
Y (n
orm
aliz
ed)
Miles/GW Summer Peak
MW-miles/MW Summer Peak
Growth Decline
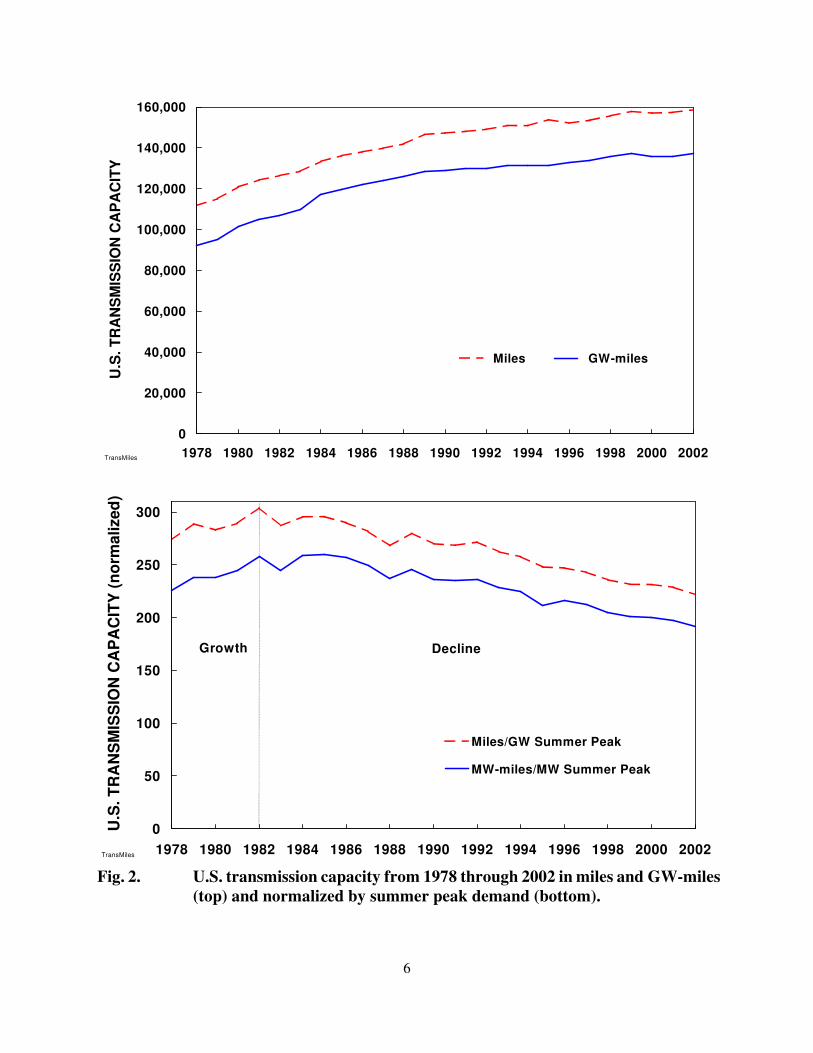
Fig. 2. U.S. transmission capacity from 1978 through 2002 in miles and GW-miles(top) and normalized by summer peak demand (bottom).
*Investor-owned utilities own about three-fourths of the total U.S. transmission grid, with municipal, federal,rural cooperative utilities, and transmission-only companies owning the rest.
#To some extent, this change in trend might be caused by differences in data-collection procedures used by EEIbefore and after 1999.
§EEI resurveyed utilities to obtain more accurate data. The revised results for 2000 through 2002 were 5%higher than the original numbers shown in Fig. 3.
7
98054
y = -0.0504x + 104R2 = 0.43
0
1
2
3
4
5
1975 1980 1985 1990 1995 2000 2005
TRA
NS
MIS
SIO
N IN
VE
STM
EN
T (b
illio
n 20
03-$
/yea
r)
-$50 million/year
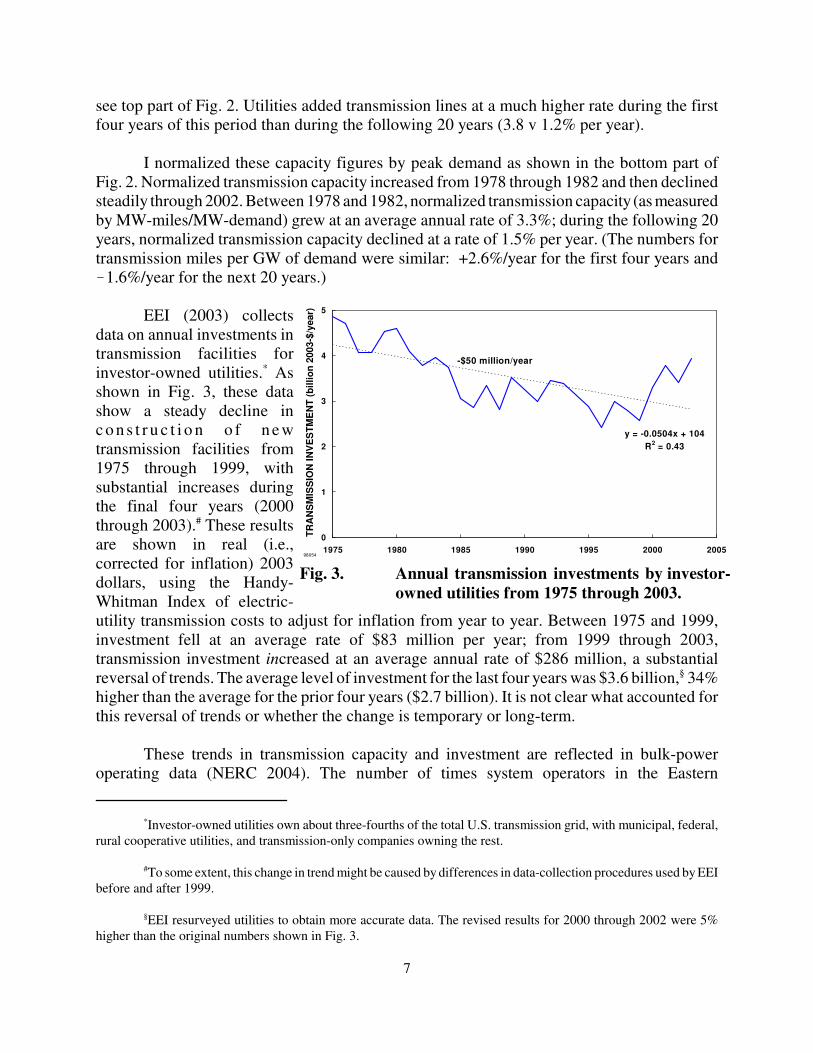
Fig. 3. Annual transmission investments by investor-owned utilities from 1975 through 2003.
see top part of Fig. 2. Utilities added transmission lines at a much higher rate during the firstfour years of this period than during the following 20 years (3.8 v 1.2% per year).
I normalized these capacity figures by peak demand as shown in the bottom part ofFig. 2. Normalized transmission capacity increased from 1978 through 1982 and then declinedsteadily through 2002. Between 1978 and 1982, normalized transmission capacity (as measuredby MW-miles/MW-demand) grew at an average annual rate of 3.3%; during the following 20years, normalized transmission capacity declined at a rate of 1.5% per year. (The numbers fortransmission miles per GW of demand were similar: +2.6%/year for the first four years and�1.6%/year for the next 20 years.)
EEI (2003) collectsdata on annual investments intransmission facilities forinvestor-owned utilities.* Asshown in Fig. 3, these datashow a steady decline inc o n s t r u c t i o n o f n e wtransmission facilities from1975 through 1999, withsubstantial increases duringthe final four years (2000through 2003).# These resultsare shown in real (i.e.,corrected for inflation) 2003dollars, using the Handy-Whitman Index of electric-utility transmission costs to adjust for inflation from year to year. Between 1975 and 1999,investment fell at an average rate of $83 million per year; from 1999 through 2003,transmission investment increased at an average annual rate of $286 million, a substantialreversal of trends. The average level of investment for the last four years was $3.6 billion,§ 34%higher than the average for the prior four years ($2.7 billion). It is not clear what accounted forthis reversal of trends or whether the change is temporary or long-term.
These trends in transmission capacity and investment are reflected in bulk-poweroperating data (NERC 2004). The number of times system operators in the Eastern
*NERC has six levels of TLR, ranging from 1 (least severe) to 6 (emergency conditions). Level 2 requires thesystem operator to “hold Interchange Transactions at current levels to prevent Operating Security Limit violations.”Higher levels restrict nonfirm transactions first and then, if necessary, firm transactions.
#The patterns and the number of TLRs are, in part, a function of regional differences in weather. For example,the summer 2000 temperatures were low in the north and high in the south, leading to substantial north-to-southelectricity flows. According to NERC (2003d), “Because weather patterns are unpredictable, transmission constraintsand congestion have the potential to shift from day to day, season to season, and year to year.” TLR calls may beaffected more by trends in wholesale transactions than trends in peak demands.
8
TLR
0
50
100
150
200
250
Jan Feb Mar Apr May Jun Jul Aug Sep Oct Nov Dec
NO
. OF
TLR
s LE
VE
L 2
AN
D H
IGH
ER 2003 2002
2001 2000
1999 1998
1997
TLR
0
50
100
150
200
250
Jan-98
Jul-98
Jan-99
Jul-99
Jan-00
Jul-00
Jan-01
Jul-01
Jan-02
Jul-02
Jan-03
Jul-03
Jan-04
NO
. OF
TLR
s LE
VE
L 2
AN
D H
IGH
ER
12-month rolling average
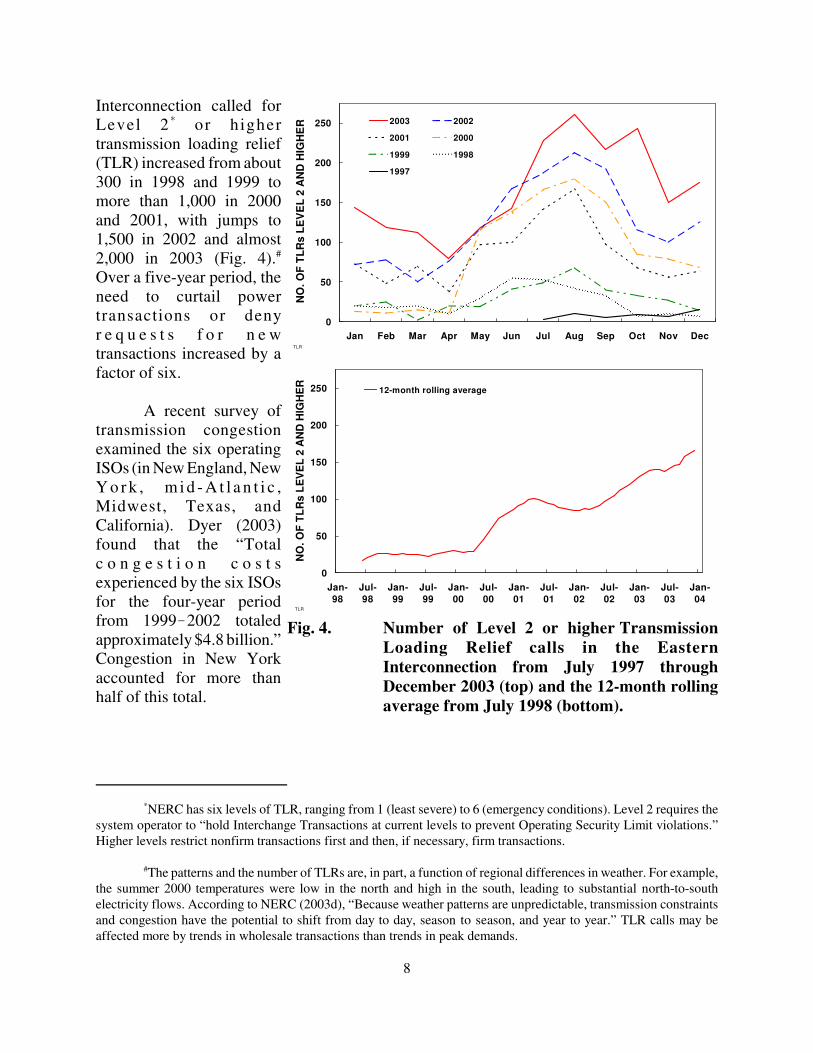
Fig. 4. Number of Level 2 or higher TransmissionLoading Relief calls in the EasternInterconnection from July 1997 throughDecember 2003 (top) and the 12-month rollingaverage from July 1998 (bottom).
Interconnection called forLevel 2 * or highertransmission loading relief(TLR) increased from about300 in 1998 and 1999 tomore than 1,000 in 2000and 2001, with jumps to1,500 in 2002 and almost2,000 in 2003 (Fig. 4).#
Over a five-year period, theneed to curtail powertransactions or denyr e q u e s t s f o r n e wtransactions increased by afactor of six.
A recent survey oftransmission congestionexamined the six operatingISOs (in New England, NewY o r k , m i d - A t l a n t i c ,Midwest, Texas, andCalifornia). Dyer (2003)found that the “Totalc o n g e s t i o n c o s t sexperienced by the six ISOsfor the four-year periodfrom 1999�2002 totaledapproximately $4.8 billion.”Congestion in New Yorkaccounted for more thanhalf of this total.
*According to Jones (2004), “ERCOT is very active in improving its transmission infrastructure and has addedover 700 miles of new 345 kV and 200 miles of 138 kV transmission in the past three years. Many more miles are nowin the construction and certification phase.
9
CURRENT CONDITIONS
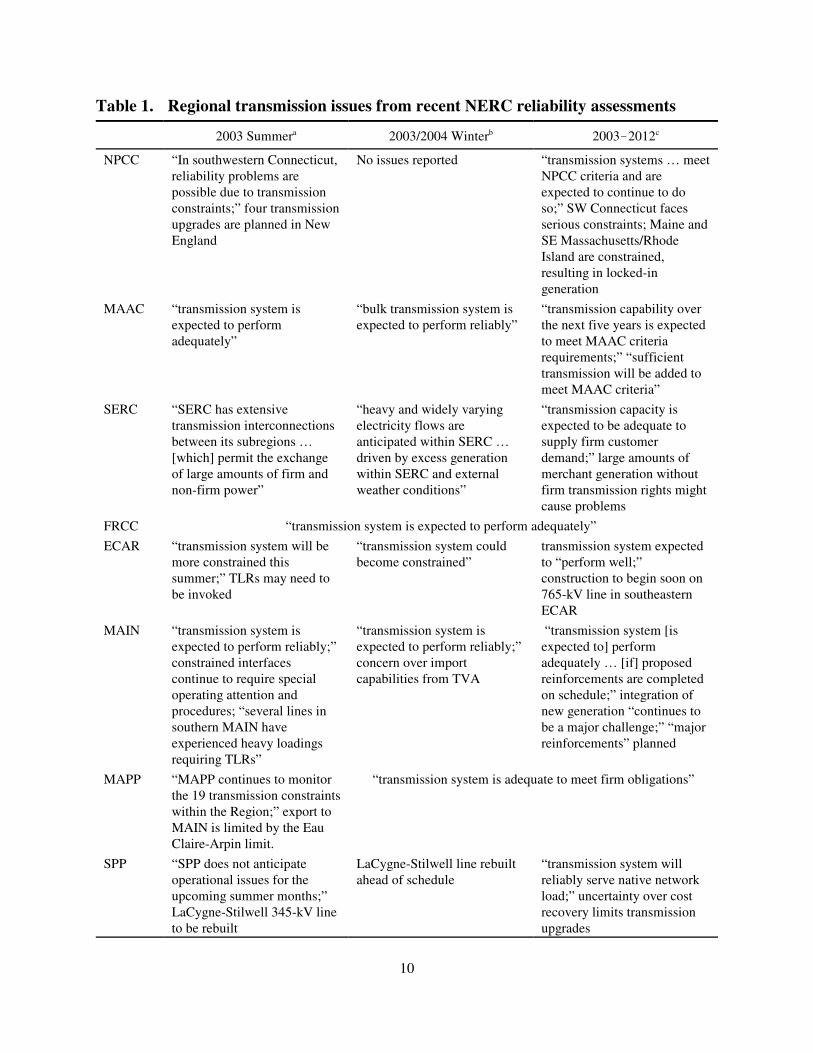
NERC (2003a and b) issues summer and winter reliability assessments, as well as a 10-year assessment (NERC 2003d) each year. Table 1 summarizes the transmission issues notedin each region’s report to NERC for the 2003 Summer, 2003/2004 Winter, and 2003�2012reliability assessments.
Table 1 shows considerable variation among regions in the status of their transmissionsystems. Some regions, such as FRCC, MAAC, SERC, and WECC, report no serious problems.Others, however note episodic or ongoing problems. For example, imports to southwesternConnecticut remain a serious and perhaps long-term problem in New England. ERCOT facesproblems moving the output from generation to the growing urban loads in Dallas-Ft. Worthand Houston. However, ERCOT, unlike some other regions, is able to plan and build newtransmission facilities in a timely fashion.* Imports from MAPP to Wisconsin (MAIN) remaina critical concern. Curiously, not one of the NPCC reports mentions the transmissionconstraints for imports to New York City and Long Island.
PROJECTIONS
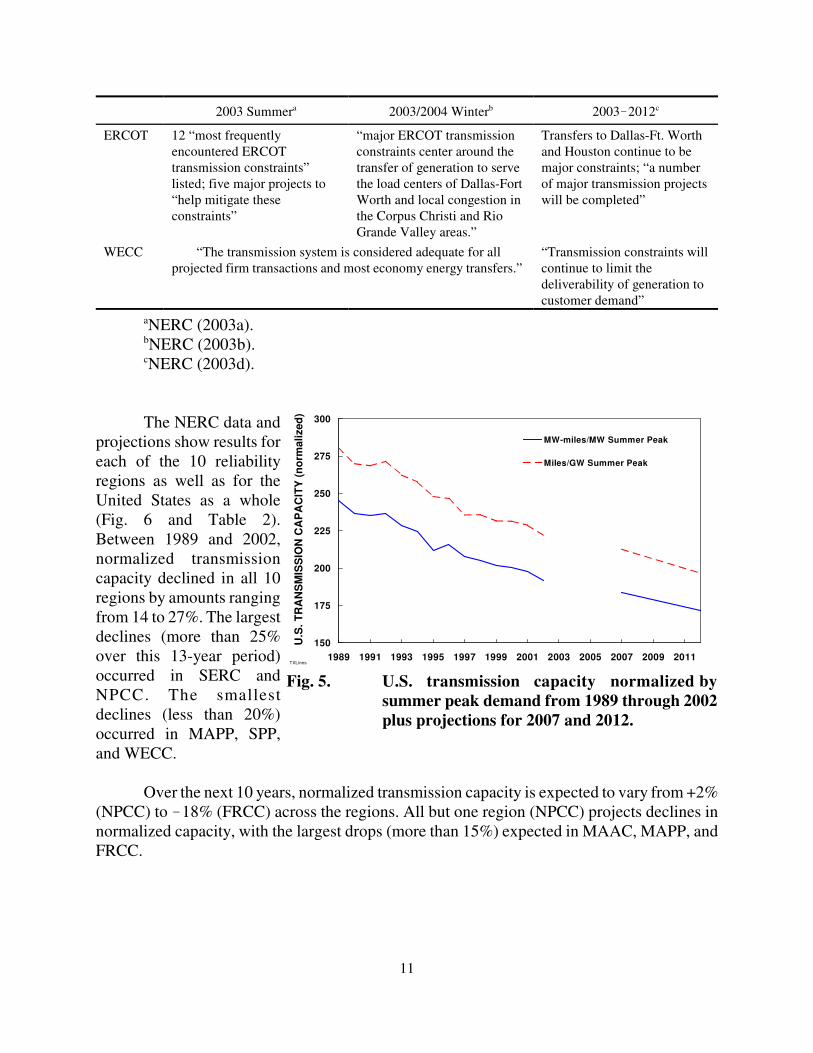
Each year, as part of its annual Reliability Assessment, NERC (2003d) issues itsElectricity Supply and Demand Database and Software (NERC 2003c). This database showsplanned transmission-line additions for each of the following 10 years, from 2003 through 2012for the latest version (Fig.5).
The projections are consistent with the historical data: both show continuing declinesin normalized transmission capacity. Between 1992 and 2002, 9,600 miles (7,300 GW-miles)of transmission were added; between 2002 and 2012, an additional 10,400 miles (10,300 GW-miles) are expected to be added.
Although normalized transmission capacity declined by almost 19% between 1992 and2002, it is expected to drop by only 11% during the following decade (2002 to 2012). In otherwords, transmission capacity is expected to continue to decline during the coming decade, butat a slower rate than during the past decade.
10
Table 1. Regional transmission issues from recent NERC reliability assessments
2003 Summera 2003/2004 Winterb 2003�2012c
NPCC “In southwestern Connecticut,reliability problems arepossible due to transmissionconstraints;” four transmissionupgrades are planned in NewEngland
No issues reported “transmission systems … meetNPCC criteria and areexpected to continue to doso;” SW Connecticut facesserious constraints; Maine andSE Massachusetts/RhodeIsland are constrained,resulting in locked-ingeneration
MAAC “transmission system isexpected to performadequately”
“bulk transmission system isexpected to perform reliably”
“transmission capability overthe next five years is expectedto meet MAAC criteriarequirements;” “sufficienttransmission will be added tomeet MAAC criteria”
SERC “SERC has extensivetransmission interconnectionsbetween its subregions …[which] permit the exchangeof large amounts of firm andnon-firm power”
“heavy and widely varyingelectricity flows areanticipated within SERC …driven by excess generationwithin SERC and externalweather conditions”
“transmission capacity isexpected to be adequate tosupply firm customerdemand;” large amounts ofmerchant generation withoutfirm transmission rights mightcause problems
FRCC “transmission system is expected to perform adequately”ECAR “transmission system will be
more constrained thissummer;” TLRs may need tobe invoked
“transmission system couldbecome constrained”
transmission system expectedto “perform well;”construction to begin soon on765-kV line in southeasternECAR
MAIN “transmission system isexpected to perform reliably;”constrained interfacescontinue to require specialoperating attention andprocedures; “several lines insouthern MAIN haveexperienced heavy loadingsrequiring TLRs”
“transmission system isexpected to perform reliably;”concern over importcapabilities from TVA
“transmission system [isexpected to] performadequately … [if] proposedreinforcements are completedon schedule;” integration ofnew generation “continues tobe a major challenge;” “majorreinforcements” planned
MAPP “MAPP continues to monitorthe 19 transmission constraintswithin the Region;” export toMAIN is limited by the EauClaire-Arpin limit.
“transmission system is adequate to meet firm obligations”
SPP “SPP does not anticipateoperational issues for theupcoming summer months;”LaCygne-Stilwell 345-kV lineto be rebuilt
LaCygne-Stilwell line rebuiltahead of schedule
“transmission system willreliably serve native networkload;” uncertainty over costrecovery limits transmissionupgrades
2003 Summera 2003/2004 Winterb 2003�2012c
11
TXLines
150
175
200
225
250
275
300
1989 1991 1993 1995 1997 1999 2001 2003 2005 2007 2009 2011
U.S
. TR
AN
SM
ISS
ION
CA
PA
CIT
Y (n
orm
aliz
ed)
MW-miles/MW Summer Peak
Miles/GW Summer Peak
Fig. 5. U.S. transmission capacity normalized bysummer peak demand from 1989 through 2002plus projections for 2007 and 2012.
ERCOT 12 “most frequentlyencountered ERCOTtransmission constraints”listed; five major projects to“help mitigate theseconstraints”
“major ERCOT transmissionconstraints center around thetransfer of generation to servethe load centers of Dallas-FortWorth and local congestion inthe Corpus Christi and RioGrande Valley areas.”
Transfers to Dallas-Ft. Worthand Houston continue to bemajor constraints; “a numberof major transmission projectswill be completed”
WECC “The transmission system is considered adequate for allprojected firm transactions and most economy energy transfers.”
“Transmission constraints willcontinue to limit thedeliverability of generation tocustomer demand”
aNERC (2003a).bNERC (2003b).cNERC (2003d).
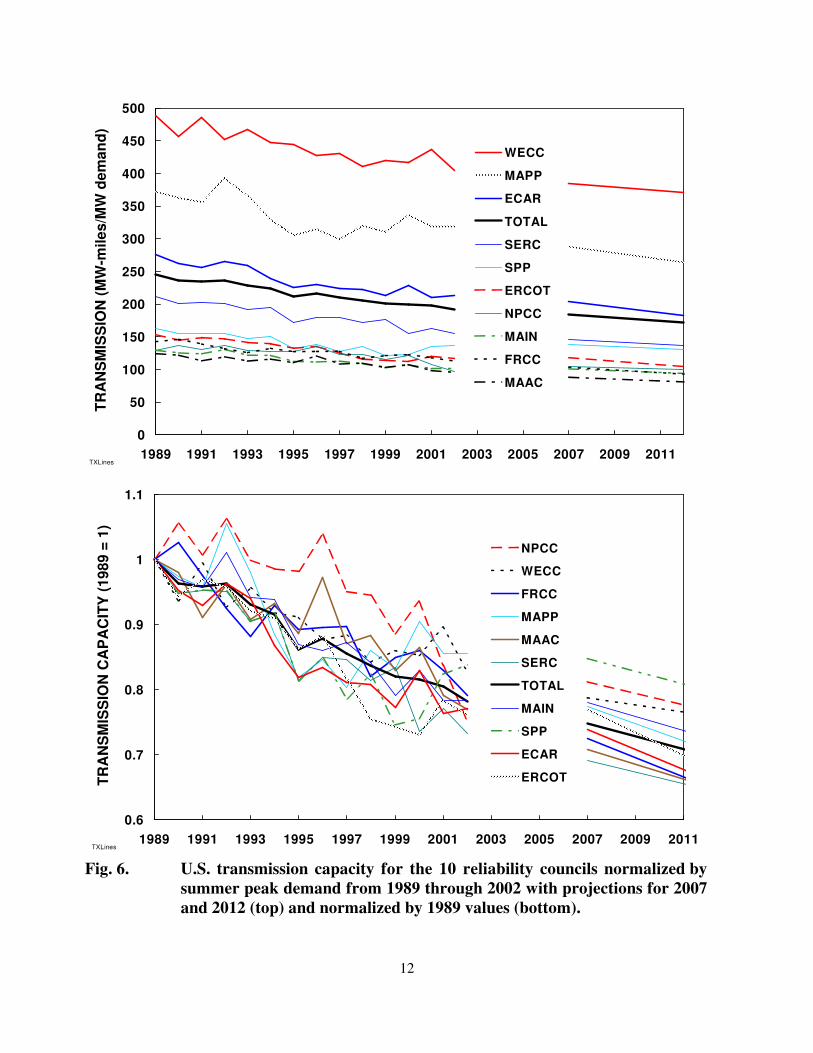
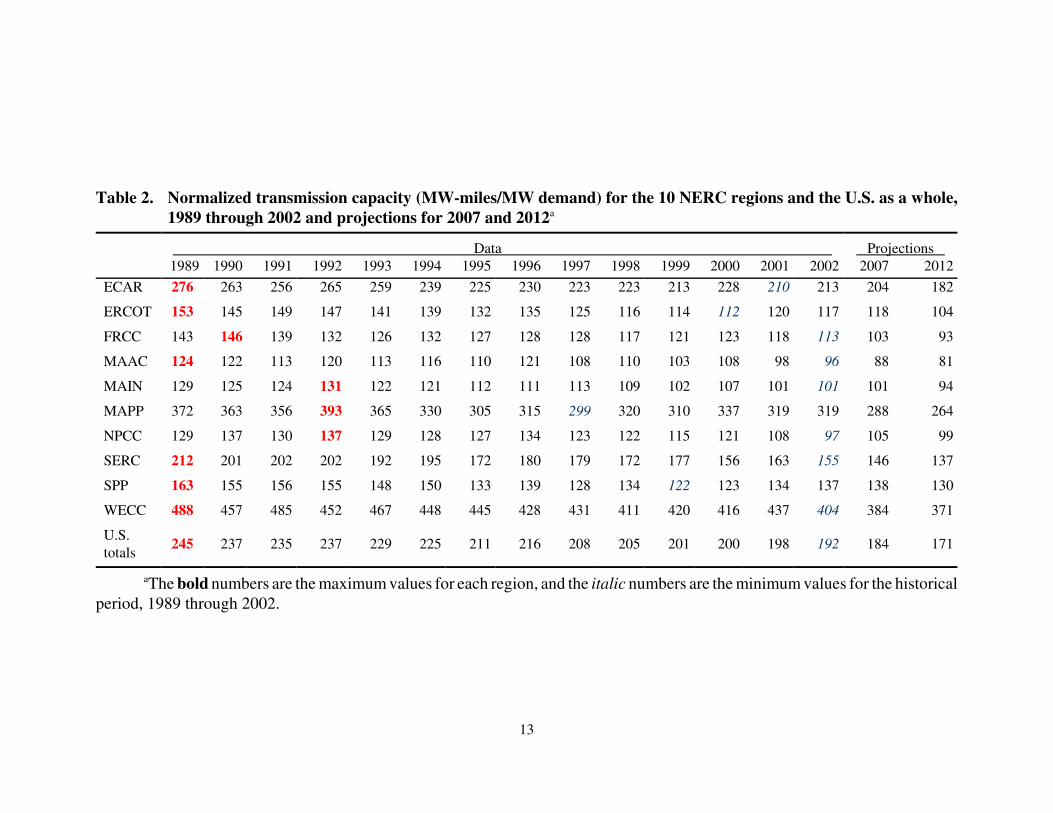
The NERC data andprojections show results foreach of the 10 reliabilityregions as well as for theUnited States as a whole(Fig. 6 and Table 2).Between 1989 and 2002,normalized transmissioncapacity declined in all 10regions by amounts rangingfrom 14 to 27%. The largestdeclines (more than 25%over this 13-year period)occurred in SERC andNPCC. The smallestdeclines (less than 20%)occurred in MAPP, SPP,and WECC.
Over the next 10 years, normalized transmission capacity is expected to vary from +2%(NPCC) to �18% (FRCC) across the regions. All but one region (NPCC) projects declines innormalized capacity, with the largest drops (more than 15%) expected in MAAC, MAPP, andFRCC.
12
TXLines
0
50
100
150
200
250
300
350
400
450
500
1989 1991 1993 1995 1997 1999 2001 2003 2005 2007 2009 2011
TRA
NS
MIS
SIO
N (M
W-m
iles/
MW
dem
and)
WECC
MAPP
ECAR
TOTAL
SERC
SPP
ERCOT
NPCC
MAIN
FRCC
MAAC
TXLines
0.6
0.7
0.8
0.9
1
1.1
1989 1991 1993 1995 1997 1999 2001 2003 2005 2007 2009 2011
TRA
NS
MIS
SIO
N C
AP
AC
ITY
(198
9 =
1)
NPCC
WECC
FRCC
MAPP
MAAC
SERC
TOTAL
MAIN
SPP
ECAR
ERCOT
Fig. 6. U.S. transmission capacity for the 10 reliability councils normalized bysummer peak demand from 1989 through 2002 with projections for 2007and 2012 (top) and normalized by 1989 values (bottom).
13
Table 2. Normalized transmission capacity (MW-miles/MW demand) for the 10 NERC regions and the U.S. as a whole,1989 through 2002 and projections for 2007 and 2012a
Data Projections 1989 1990 1991 1992 1993 1994 1995 1996 1997 1998 1999 2000 2001 2002 2007 2012
ECAR 276 263 256 265 259 239 225 230 223 223 213 228 210 213 204 182
ERCOT 153 145 149 147 141 139 132 135 125 116 114 112 120 117 118 104
FRCC 143 146 139 132 126 132 127 128 128 117 121 123 118 113 103 93
MAAC 124 122 113 120 113 116 110 121 108 110 103 108 98 96 88 81
MAIN 129 125 124 131 122 121 112 111 113 109 102 107 101 101 101 94
MAPP 372 363 356 393 365 330 305 315 299 320 310 337 319 319 288 264
NPCC 129 137 130 137 129 128 127 134 123 122 115 121 108 97 105 99
SERC 212 201 202 202 192 195 172 180 179 172 177 156 163 155 146 137
SPP 163 155 156 155 148 150 133 139 128 134 122 123 134 137 138 130
WECC 488 457 485 452 467 448 445 428 431 411 420 416 437 404 384 371
U.S.totals 245 237 235 237 229 225 211 216 208 205 201 200 198 192 184 171
aThe bold numbers are the maximum values for each region, and the italic numbers are the minimum values for the historicalperiod, 1989 through 2002.
*Only seven of these projects are retirements, with a total of only 220 miles of transmission lines to be retiredbetween 2002 and 2012. Even if transmission lines have a 50-year lifetime, at least 2,500 miles would be retired eachyear (or, more likely, replaced with newer facilities using the same right of way). The unreasonably small number ofretirements is another indication of data-quality problems.
14
Because the individual transmission-owner reports show that almost 70% of the newtransmission lines are to be built during the first five years of this 10-year period, theprojections for 2007 might be more meaningful than those for 2012. Between 2002 and 2007,normalized transmission capacity is expected to vary from +8% (NPCC) to �10% (MAPP).Three regions show expected increases for this initial 5-year period (ERCOT, SPP, and NPCC),while four regions show declines of 5% or more (SERC, MAAC, FRCC, and MAPP).
Of the 416 transmission projects planned for the next 10 years,* 95% are shorter than100 miles, with an average length of only 18 miles. These numbers suggest that most plannedtransmission projects are local in scope and are not intended to address large regional issues.The 21 longer projects (5% of the total) average 170 miles in length.
SUMMARY
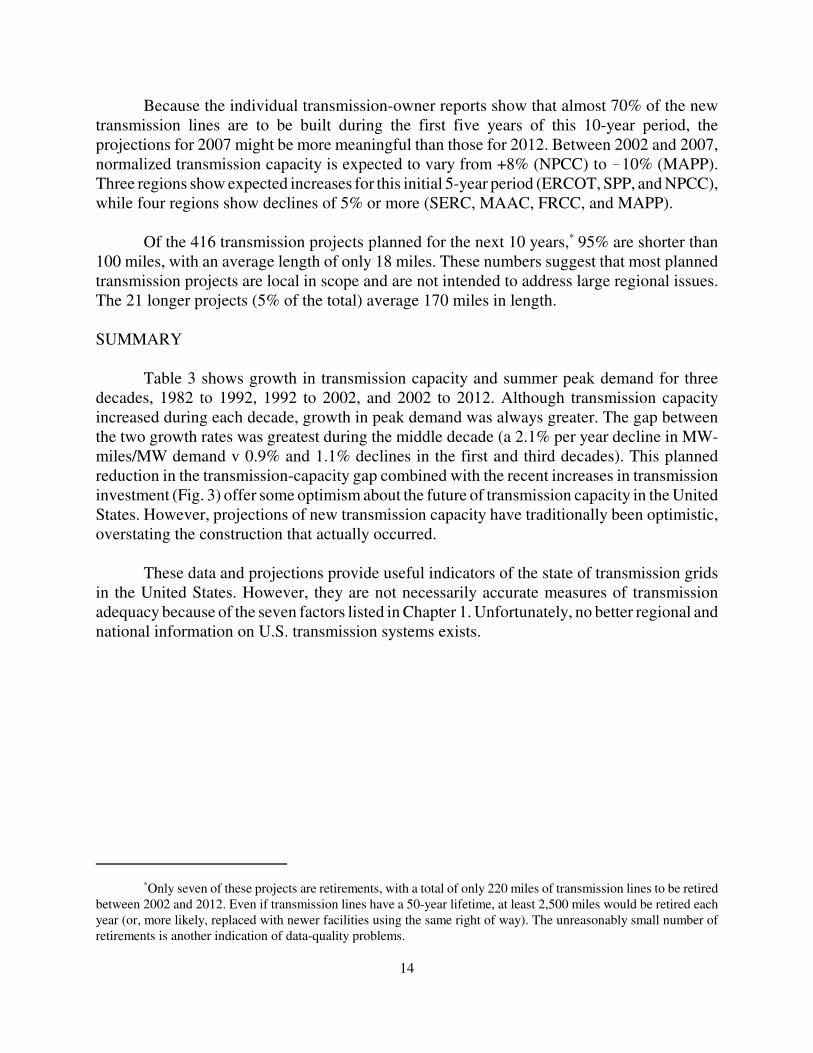
Table 3 shows growth in transmission capacity and summer peak demand for threedecades, 1982 to 1992, 1992 to 2002, and 2002 to 2012. Although transmission capacityincreased during each decade, growth in peak demand was always greater. The gap betweenthe two growth rates was greatest during the middle decade (a 2.1% per year decline in MW-miles/MW demand v 0.9% and 1.1% declines in the first and third decades). This plannedreduction in the transmission-capacity gap combined with the recent increases in transmissioninvestment (Fig. 3) offer some optimism about the future of transmission capacity in the UnitedStates. However, projections of new transmission capacity have traditionally been optimistic,overstating the construction that actually occurred.
These data and projections provide useful indicators of the state of transmission gridsin the United States. However, they are not necessarily accurate measures of transmissionadequacy because of the seven factors listed in Chapter 1. Unfortunately, no better regional andnational information on U.S. transmission systems exists.
15
Table 3. Comparisons of growth in transmission capacity and summer peak demandfor three decades
Percentage change per year
1982-1992 1992-2002 2002-2012
Transmission (miles) 1.66 0.63 0.73
Transmission (GW-miles) 1.94 0.55 0.63
Summer Peak (GW) 2.82 2.68 1.87
MW-miles/MW demand -0.85 -2.07 -1.12
Miles/GW demand -1.12 -2.00 -1.12

16

*Because I did not review the planning processes used by any of these entities, my comments focus solely ontheir planning reports.
17
CHAPTER 3
REVIEW OF TRANSMISSION PLANS
I reviewed 20 transmission plans and related documents from a variety of sources,including ISOs, regional reliability councils, individual utilities, groups of utilities, stateregulators, transmission companies, and consulting firms. The purpose of this review was toidentify the key transmission problems in each region and the recommended solutions to theseproblems. I had intended to use these planning reports to estimate regional and national needsfor new transmission in both MW-miles and investment dollars. This review was to be abottoms-up complement to the data review presented in Chapter 2.
In practice, the coverage of plans was quite spotty in both geography and substance. Ilikely overlooked some important documents that should have been included in this study.More important, several transmission owners and reliability councils do not make transmissionplans available to the public. Two reasons were cited for keeping such studies confidential:national security (especially in the aftermath of 9-11) and competition.
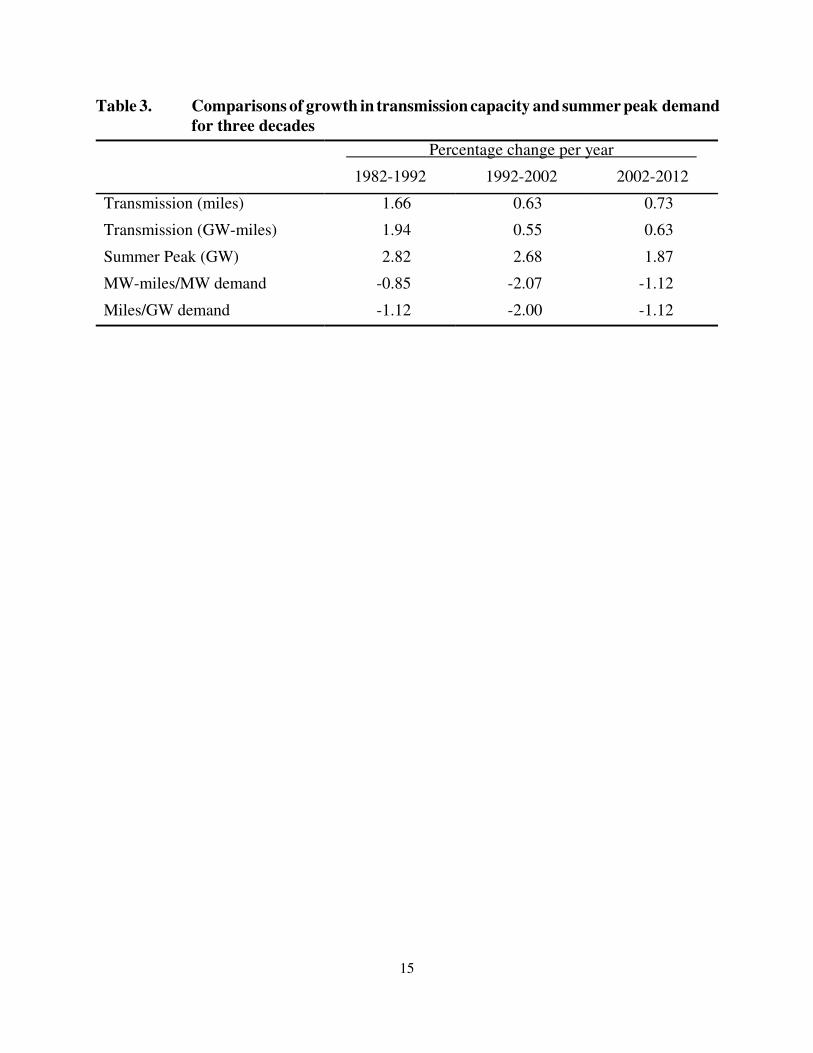
Because of these limitations in plan coverage, the results of this review of transmissionreports should be considered suggestive rather than definitive. In addition, I focused less onresults (because fewer than expected plans were available) and more on the quality of the plansthemselves. I used the planning process proposed by Hirst and Kirby (2002) to drawconclusions about the quality of these 20 planning documents.* In brief, Hirst/Kirby suggestthat transmission plans include the steps shown in Table 4.
For convenience, the discussion of plans is organized around the 10 regional reliabilitycouncils (see Fig. 1 in Chapter 1 for a map showing the locations of these regions). As the U.S.electricity industry continues to evolve (whether towards greater competition or back to moreregulation is unclear), the future planning role of the councils is uncertain. Many councils haveno planning role per se. Instead, they assess the adequacy of plans developed by their members.The Midwest ISO (MISO) includes transmission systems in three councils (ECAR, MAIN, andMAPP). WECC, both a reliability council and an Interconnection, is enormous, encompassingroughly half the land mass of the contiguous United States.
This chapter briefly describes each of the 20 planning reports. Chapter 4 synthesizes thekey issues, findings, and lessons learned from the reviews of these 20 documents.
18
Table 4. Summary of Hirst/Kirby proposed transmission-planning approach
1. What is the purpose of this plan? These purposes could include maintenance of reliability,promotion of competitive electricity markets, support for development of new generation,promotion of economic growth, and so on.
2. Describe the current situation, covering bulk-power operations, wholesale markets, andtransmission pricing. What problems (e.g., reliability, congestion, losses, generator marketpower), if any, occur that are caused by limitations in the transmission system? Whattransmission projects are under construction or planned for completion within the next fewyears to address these problems? What are the estimated costs and benefits of theseprojects? What entities are expected to benefit and to pay for these projects?
3. Describe the likely future bulk-power system(e.g., in five and ten years). What are thelevels, patterns, and locations of loads? Describe the region’s fleet of generating units,including locations, capacity, and operating costs (or bid prices). What are the likelyeffects of new generation on use of the transmission system? Given the many uncertaintiesthat affect future fuel prices, loads, generation, transmission, and market rules, createvarious scenarios that can be used to analyze potential problems and transmissionimprovements (Steps 4 and 5).
4. What transmission problems, both reliability and commercial, are likely to exist given thescenarios developed in Step 3?
5. What transmission facilities might be added to address the problems identified in Step 4?What effects would these facilities have on compliance with reliability standards,commercial transactions, losses, and regional electricity costs? What are the likely capitalcosts and benefits of these transmission additions? Can any of these transmission projectsbe built on a merchant (i.e., for profit and unregulated) basis?
6. What nontransmission alternatives (including suitably located generation and price-responsive load programs as well as alternative transmission-pricing schemes) might bedeployed to address the problems identified in Step 4? To what extent can thesealternatives address the problems for which the transmission facilities suggested in Step5 were proposed?
7. Based on the foregoing analyses, recommend transmission pricing, generator locations,demand-management programs, and construction of new transmission facilities. If marketparticipants do not propose the solutions analyzed in Steps 5 and 6, recommend thosetransmission facilities (from Step 6) that should be built under regulation. Summarize thebenefits and costs of these proposed projects. Can the projects ultimately be approved,financed, and built in a timely fashion?

19
NORTHEAST POWER COORDINATING COUNCIL
The U.S. portion of NPCC is home to two ISOs, ISO New England (which covers allsix New England states) and the New York ISO. NPCC also includes the Canadian provincesof Ontario, Quebec, and the Maritimes, which are not covered in this report.
ISO New England
ISO New England (2003) has a well-established planning process and has nowpublished three annual plans. The latest one is well written, accessible to people with differentinterests and backgrounds (including nonspecialists), and comprehensive. The plan coversreliability and congestion (economics), analyzes local and regional transmission issues, and isopen to market solutions (generation, demand management, and merchant transmission) as wellas regulated transmission solutions. This plan, which covers 10 years (2003 to 2012), identifiesnearly 250 regulated transmission projects that would cost between $1.5 and $3 billion. Thislarge range in estimated cost occurs because specific costs have not been calculated for severalof the projects analyzed.
ISO New England develops the plan with its Transmission Expansion AdvisoryCommittee, which has an open membership. The ISO also works closely with the region’stransmission owners and with the surrounding control areas (on inter-regional issues).
The most critical areas within New England remain imports into southwesternConnecticut, followed by northwestern Vermont. The cost to address the Connecticut problemsis almost $900 million for Phases I and II. The report also identifies major transmissionfacilities needed to increase imports into the Connecticut and Boston areas.
The resource-adequacy and congestion studies use a simple transportation model thatdoes not address local issues. The transmission planning studies, on the other hand, are muchmore detailed and consider “thermal, voltage, short circuit and stability limits, and system andequipment performance under potential contingency conditions.”
This report is well organized. It includes a 40-page summary, a 165-page technicalreport, and an appendix of nearly 300 pages. The Technical Report provides detail on thedemand forecast, resource capacity and energy issues, distributed resources (including demandresponse), system dynamic performance, transmission-performance assessments and proposedsolutions for each of the New England subregions, and inter-regional coordination. TheAppendices provide additional details on the data, assumptions, computer models, and resultsfor each study. Thus, this plan is accessible to different kinds of readers with different policyand technical interests.
The Technical Report illustrates how various improvements can permit existingequipment to be operated closer to its limits; see Table 5. That is, some transmission
20
NERTOP03
0
10
20
30
40
50
Proposed Planned Under Construction
2002 PROJECTS
STA
TUS
IN 2
003 Proposed Planned
Under Construction In Service
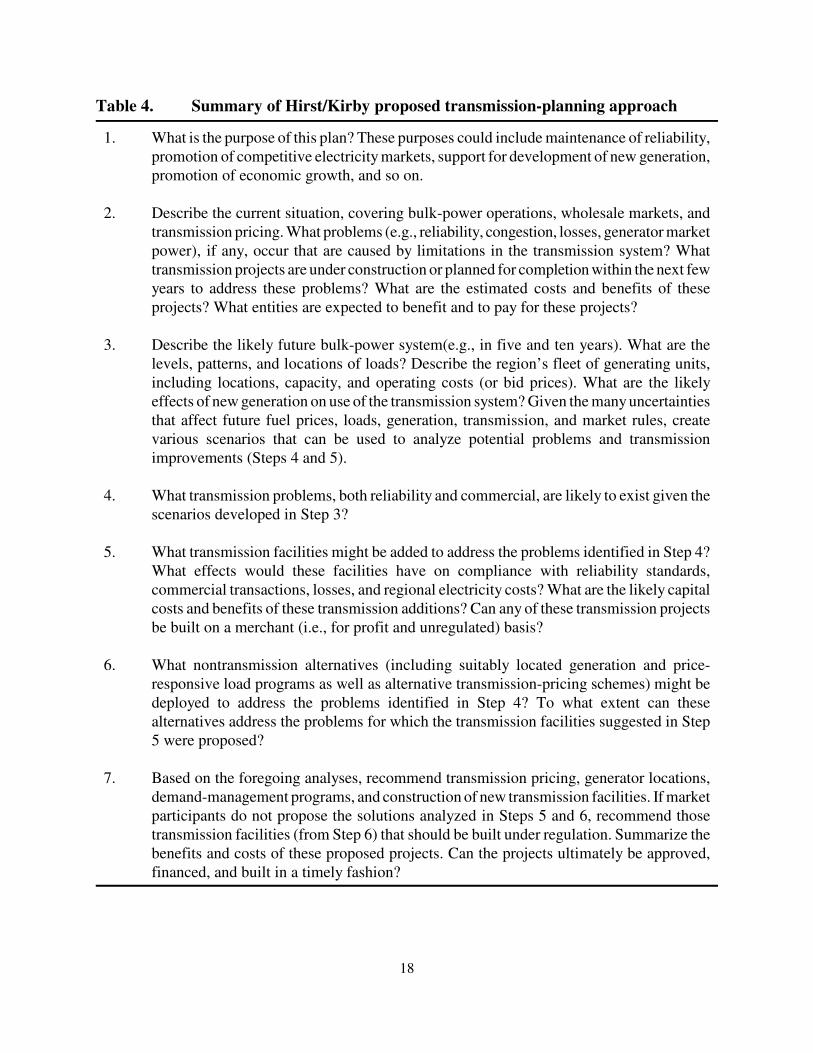
Fig. 7. 2003 status of transmission projects included inthe 2002 New England transmission plan.
investments don’t add new capacity; instead, they permit existing capacity to be more fullyutilized. The cost of these projects is about $39 million.
Table 5. Deerfield and Buxton enhancements and benefits on Maine to NewHampshire transfer limits (MW)
Existingsystem
With Deerfield500 MVAR
SVCa
With SVC andSect. 391 Loop
With SVC and 391Loop, Breakers and
2nd Auto
Voltage 950 1,175 1,250 1,650Thermal 1,225 1,225 1,325 1,625Stabilityb 1,400 1,400 1,400 1,400
aSVC means static VAR compensator, which provides dynamic voltage support.bPreliminary results suggest that the stability limit can be increased to 1,400 MW.
One measure ofsuccess for a transmissionplan is the extent to whichprojects are implemented.As shown in Fig. 7, morethan half the projects fromthe 2002 plan hadprogressed one or moresteps as of a year later. Inpart, transmission projectsare moving ahead in NewEngland because very littletransmission constructionoccurred during the past 15years. So the region is nowplaying catchup. Forexample, three 345-kV lines into the Boston area are under construction. Projects are goingahead now because the need is real and imminent (there is no more fat in the system) andbecause transmission owners have greater confidence in the ISO and FERC treatment ofinvestments (i.e., assurance they will get paid for investment).
The New England plan provides only a limited discussion of the economics (benefitsand costs) of the various transmission projects being considered and planned. Economicanalysis of new transmission is complicated by notions of scarcity pricing (i.e., LMP),accounting for reduction in market power, changes in reliability-must-run (RMR) contracts, andloss reductions. However, the New England plan does discuss congestion, LMP, and interface
21
NGFYS
0
10
20
30
40
50
60
ConEd + LI im
port
SE NY im
port
ME to N
H
NYC import
NE to N
Y
Boston im
port
LI import
North to
South
Norwalk
/Sta
mfo
rd im
port
CT import
No. NY ex
port
Total E
ast
Dysinger
Eas
t
Wes
t Cen
tral
New B
runsw
ick to
NE
SE MA/R
I exp
ort
SW C
T import
CO
NG
ES
TIO
N R
ISK
(%)
Fig. 8. The likelihood of congestion at 17 boundarieswithin New England and New York in 2008.
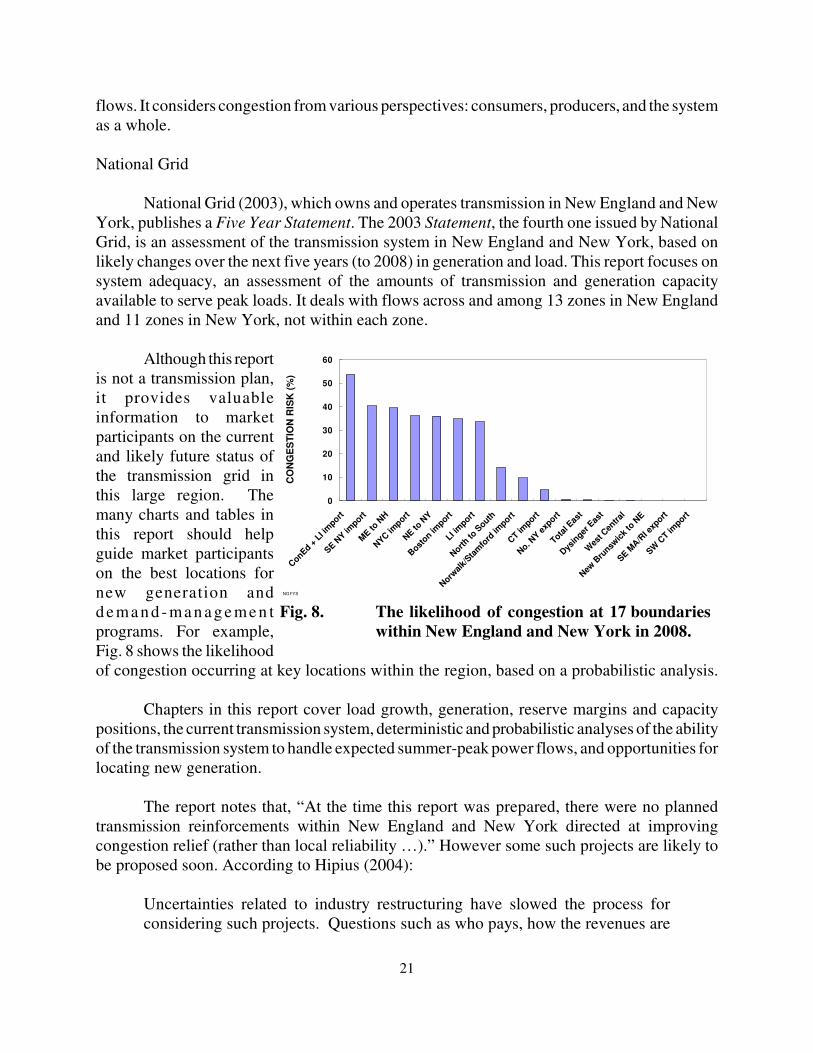
flows. It considers congestion from various perspectives: consumers, producers, and the systemas a whole.
National Grid
National Grid (2003), which owns and operates transmission in New England and NewYork, publishes a Five Year Statement. The 2003 Statement, the fourth one issued by NationalGrid, is an assessment of the transmission system in New England and New York, based onlikely changes over the next five years (to 2008) in generation and load. This report focuses onsystem adequacy, an assessment of the amounts of transmission and generation capacityavailable to serve peak loads. It deals with flows across and among 13 zones in New Englandand 11 zones in New York, not within each zone.
Although this reportis not a transmission plan,it provides valuableinformation to marketparticipants on the currentand likely future status ofthe transmission grid inthis large region. Themany charts and tables inthis report should helpguide market participantson the best locations fornew generation andd e ma n d - ma n a g e me n tprograms. For example,Fig. 8 shows the likelihoodof congestion occurring at key locations within the region, based on a probabilistic analysis.
Chapters in this report cover load growth, generation, reserve margins and capacitypositions, the current transmission system, deterministic and probabilistic analyses of the abilityof the transmission system to handle expected summer-peak power flows, and opportunities forlocating new generation.
The report notes that, “At the time this report was prepared, there were no plannedtransmission reinforcements within New England and New York directed at improvingcongestion relief (rather than local reliability …).” However some such projects are likely tobe proposed soon. According to Hipius (2004):
Uncertainties related to industry restructuring have slowed the process forconsidering such projects. Questions such as who pays, how the revenues are
22
collected and distributed, and how large a return is appropriate given increasedrisk have made it harder to initiate such projects. New England has mechanismsin place that may enable the utilities to get past these issues more easily than inNew York. In fact, projects to relieve congestion in New England have been inthe planning stages and are moving toward implementation. In New York, thequestions have not been satisfactorily resolved, and the problem is compoundedby long-term retail rate freezes. Since transmission costs are not unbundled fromretail rates, improving the transmission system could create unrecoverable costsfor some utilities. These are not impossible problems to solve, but they aredifficult and politically charged. In New York, the costs to construct a trulymajor system reinforcement (e.g., DC lines into New York City) have beenviewed as prohibitive by the utilities, and doubts about their financial viabilityhave always been a deterrent. It may be less costly to live with some level ofcongestion than to eliminate it entirely. And it’s made worse by the fact thatupstate utilities would be shooting themselves in the foot to reinforce theirtransmission paths into southeast New York—upstate utility customers wouldpay higher locational prices, to the benefit of New York City and Long Islandcustomers, and their reward might be having to pay for all or part of the project!Aside from the paths into southeast New York and Long Island, there is verylittle congestion on the New York system, so reinforcements into the southeastare the only kinds of projects one might expect to be proposed and built.
The north-to-south diversity in New England and New York suggests there areadditional opportunities for cost-effective inter-regional electricity trade with Canada and PJM.With no constraints in the transmission system, imports from Quebec would increase by about900 MW (20% over baseline conditions), and imports from PJM would decrease by about 400MW (8%).
Power flows in this region are from the western, northern, and eastern extremities of thesystem. Transfers progressively increase and become more concentrated as they approachBoston, New York City, Long Island, and Connecticut.
The best places to site new generation are in Boston, southwestern Connecticut,Norwalk/Stamford (in Connecticut), and New York City and Long Island. The worst locationsfor new generation are Maine and New Hampshire in New England and the Millwood andDunwoodie regions in upstate New York.
New York ISO
The New York ISO does not yet have a planning process in place. The ISO is workingwith its stakeholders to develop a formal planning process, initially to focus on reliability, laterto develop a comprehensive process that will include congestion. The ISO expects to file itsplanning approach with FERC in summer 2004.
23
The ISO and its contractors have published several interesting transmission-planningstudies. As part of its reliability responsibilities to NPCC and the New York State ReliabilityCouncil, the New York ISO (2002a) analyzed the reliability of the New York transmission gridfor the year 2007. This electrical-engineering study included four assessments: (1) load flowand stability analysis to assess the thermal, voltage, and stability performance of the NYISObulk-power system under normal (design) contingencies; (2) load flow and stability analysisfor extreme contingencies; (3) consequences of failure or misoperation of Special ProtectionSystems; and (4) evaluation of the dynamic control systems on certain generators.
The study is based on the 2002 FERC 715 filings from the utilities. The study lists theproposed transmission improvements through 2007, which “consist of five 345-kVtransmission modifications to interconnect new generation, a DC tie between Connecticut andLong Island, a DC tie between Sayreville, NJ and Manhattan, and plans to add about 30additional miles of 115 and 138 kV transmission.”
This study focuses exclusively on reliability with no mention of economic investmentsin transmission. It looks only at planned generation and transmission projects to see if they willyield a reliable system in 2007. The answer is yes, although close attention needs to be paid tovoltage levels in southern New York.
Obessis (2002) reviewed the day-ahead energy market prices in New York to identifythe key transmission constraints. Congestion cost electricity consumers $1,240 million in 2000,$570 million in 2001, and $451 million for the first half of 2002. [Recent analysis showscongestion costs of $310 million in 2001, $525 million in 2002, and $688 million in 2003(Patton 2004).] The Central East interface, in upstate New York, accounted for two-thirds ofthe total congestion, in and around New York City accounted for one-sixth, and in and aroundLong Island accounted for the remaining one-sixth. The report states: “Upgrading the notedconstraints will not necessarily eliminate or even significantly reduce congestion costs. …[O]ther transmission constraints are likely to be lurking behind the ones noted here, and wouldthemselves cause congestion if the present set are relieved.”
The New York ISO (2002b) analyzed “the amount of congestion cost reduction that willresult between 2003 and 2010 as a result of the expected generation additions, increased tiecapability with neighboring control areas and upgrade of selected internal transmissionbottlenecks.” This report, however, analyzed only the physics of transmission and did notexamine the costs and benefits of transmission investments.
Locational pricing in New York has had a substantial impact on the location of newgeneration, with large shifts to downstate locations (including New York City and Long Island).Adding new transmission lowers congestion costs, but primarily in the short term (2003) andless so in 2006 and 2010. The reduction in benefits over time is a consequence of the assumedincrease in downstate generation. An issue not addressed in this study is whether lessgeneration would (should?) be built downstate if new transmission is constructed.
24
This report concludes that development of combined-cycle units in the congestion zones“will be the major element …” in providing congestion relief. “… generation development,which is responding to locational market prices, is locating in areas where the capacityadditions have a positive impact on congestion costs. The generation expansion scenario resultsin a close to 60% reduction in congestion costs between 2003 and 2010. Since the opening ofthe NY wholesale electricity market and the implementation of locational pricing there has beena noticeable shift in the location preference of generation development.”
However, although congestion is a persistent problem in the state:
“… there has not been any major transmission projects proposed to expand theAC transmission network in NY with the primary objective to improve marketefficiency. This situation exists even in light of the fact that since January 1,2000 NY has experienced transmission congestion costs on the order of 2.23billion dollars or annual rate of 900 million dollars a year. This level ofcongestion cost is equivalent to slightly more than 75% of the annual revenuerequirement (1,155.9 million dollars) necessary to recover the embedded cost ofthe [New York] transmission assets … .”
Although congestion costs in downstate New York are very high (perhaps the highestin the United States), little transmission is planned to reduce these costs. Four reasons havebeen suggested for this lack of transmission expansion. First, as noted above, New York hasnot decided who will pay for new transmission and how. That uncertainty, coupled with retail-rate freezes, inhibits utilities from making what might otherwise be needed investments.Second, building more transmission might not lower overall electricity costs in New York.Instead, such investment might lower costs for downstate consumers at the expense of upstateconsumers. That is, the amount of low-cost generating capacity located upstate (upstream ofthe congested interfaces) is not sufficient to serve the needs of both downstate and upstateconsumers. Third, locational pricing is motivating investors to build new generation in and nearNew York City and Long Island. Finally, the congestion costs are largely hedged throughTransmission Congestion Contracts, leading to large differences between net and grosscongestion costs..
Conjunction LLC, the developer of a proposed 2,000-MW merchant transmissionproject from upstate to downstate New York, cancelled an auction of capacity on the proposedDC line in March 2004. It appears that potential buyers of transmission capacity, on this andother merchant projects, are unable to accept the risks associated with long-term commitments.Because of this risk aversion, some merchant developers are seeking regulatory solutions tofinancing problems (Hipius 2004).
25
MID-ATLANTIC AREA COUNCIL
MAAC includes some or all of the following states: Pennsylvania, New Jersey,Maryland, Delaware, Virginia and the District of Columbia. MAAC contains one control area,PJM. (PJM West includes parts of ECAR and MAIN.)
Although PJM has an extensive planning process, its focus has been on generatorinterconnection and reliability. PJM is nearing completion of its Economic Planning Processin response to FERC’s (2003) approval of PJM’s process for assessing the economic need fornew transmission. FERC recognizes that these issues are difficult, complicated, and not yetfully resolved. To illustrate, should congestion be measured on the basis of the actual powerflows across congested interfaces or the amounts that would flow if the constraints wererelieved? Should congestion be measured from the perspective of retail customers, generators,or both?
However, PJM’s long history of LMPs and CRRs provides powerful economic signalsto investors in new generation (and demand-management programs) on where to best locatenew power plants (and demand-management programs), reducing the need for newtransmission. Congestion costs for PJM amount to $400 to $500 million a year, 6 to 9% of totalPJM billings (PJM 2004). In March 2004, PJM opened a market window for solutions tocongestion on 34 PJM transmission facilities (PR Newswire 2004). This 1-year window isintended to encourage market participants to propose generation, merchant transmission,distributed generation, or demand-management programs to reduce congestion on thesefacilities.
PJM’s (2003) latest plan accommodates over 175 generator interconnection requests andsix merchant transmission projects, and contains more than 200 transmission upgrades toaddress reliability requirements through 2007 (Table 6). To date, PJM’s transmission plans callfor nearly $700 million in investment, of which over $225 million has been completed (Gass2004).
The PJM plan is primarily a compilation of the projects needed to interconnect newgeneration to the PJM grid and those needed to comply with NERC and MAAC reliabilityrequirements. The latest report identified four sets of potential reliability problems; projectshave been identified and scheduled to resolve these problems. The projects include: addingstatic and dynamic reactive support to solve voltage magnitude and voltage drop problems,replacing transformers to remedy thermal overload problems, upgrading the current carryingcapability of a transmission line to eliminate overloads under contingency conditions, andreplacing circuit breakers with larger circuit breakers where their fault interrupting capabilityis inadequate. However, the PJM plan contains no information on nontransmission alternativesand no assessment of the economic benefits (e.g., reduction of congestion costs) of newtransmission. Future PJM plans will identify projects required for economics, consistent withthe aforementioned Economic Planning Process.
26
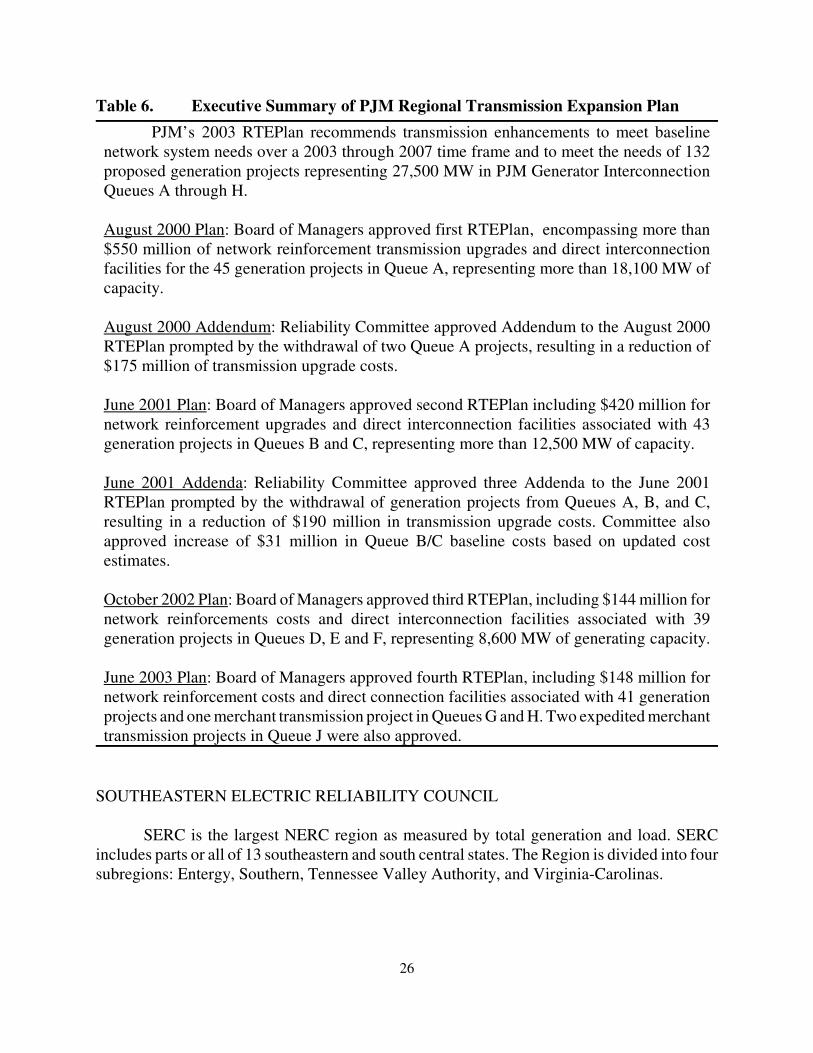
Table 6. Executive Summary of PJM Regional Transmission Expansion PlanPJM’s 2003 RTEPlan recommends transmission enhancements to meet baseline
network system needs over a 2003 through 2007 time frame and to meet the needs of 132proposed generation projects representing 27,500 MW in PJM Generator InterconnectionQueues A through H.
August 2000 Plan: Board of Managers approved first RTEPlan, encompassing more than$550 million of network reinforcement transmission upgrades and direct interconnectionfacilities for the 45 generation projects in Queue A, representing more than 18,100 MW ofcapacity. August 2000 Addendum: Reliability Committee approved Addendum to the August 2000RTEPlan prompted by the withdrawal of two Queue A projects, resulting in a reduction of$175 million of transmission upgrade costs. June 2001 Plan: Board of Managers approved second RTEPlan including $420 million fornetwork reinforcement upgrades and direct interconnection facilities associated with 43generation projects in Queues B and C, representing more than 12,500 MW of capacity. June 2001 Addenda: Reliability Committee approved three Addenda to the June 2001RTEPlan prompted by the withdrawal of generation projects from Queues A, B, and C,resulting in a reduction of $190 million in transmission upgrade costs. Committee alsoapproved increase of $31 million in Queue B/C baseline costs based on updated costestimates.
October 2002 Plan: Board of Managers approved third RTEPlan, including $144 million fornetwork reinforcements costs and direct interconnection facilities associated with 39generation projects in Queues D, E and F, representing 8,600 MW of generating capacity. June 2003 Plan: Board of Managers approved fourth RTEPlan, including $148 million fornetwork reinforcement costs and direct connection facilities associated with 41 generationprojects and one merchant transmission project in Queues G and H. Two expedited merchanttransmission projects in Queue J were also approved.
SOUTHEASTERN ELECTRIC RELIABILITY COUNCIL
SERC is the largest NERC region as measured by total generation and load. SERCincludes parts or all of 13 southeastern and south central states. The Region is divided into foursubregions: Entergy, Southern, Tennessee Valley Authority, and Virginia-Carolinas.
*Conversations with several transmission planners in SERC suggest that deliverability limits are causedprimarily by the many gas-fired merchant power plants built in the southeast that did not obtain firm transmissionservice.
27
I was unable to identify any published transmission plans for this region. However, I didfind two relevant planning documents, and I obtained transmission-planning data (on aconfidential basis) from a few utilities within the region.
The Southeastern Association of Regulatory Commissioners (2002) assessed thegeneration and transmission infrastructure within this region, including the role of the states inplanning and siting generation and transmission, and development of regional transmissionorganizations. The information on transmission in this report comes entirely from the NERCES&D data base (discussed in Chapter 2).
The assessment notes that “the SERC transmission systems meet NERC and SERCreliability criteria and should have adequate capability to supply forecast demand and energyrequirements under normal and contingency conditions. Interregional transfer studies indicatethat the ability to transfer power between SERC and other regions, above contractuallycommitted uses, has become marginal on some interfaces.”*
SERC (2003) publishes an annual reliability review, which looks at demand and energy,supply resources and additions thereto, and existing and planned transmission. This assessmentlooks only at reliability issues, with no attention given to the economics of imports, exports, andintraregional transfers. The latest assessment states:
Joint planning studies for the near term horizon continue to indicate thatbulk transmission system performance in the SERC Region is adequate to meetprojected peak demands and provide contracted firm transmission services. Insome instances, operating procedures continue to be utilized to facilitatetransfers. The ability to transfer power above contractually committed uses, bothintra-regionally and inter-regionally, continues to be marginal on some interfacesunder both studied and actual operating conditions. This is a reliability concernbecause it impacts the geographic diversity of external resources that can becalled upon during emergency import scenarios that may result from large unitoutages.
SERC completed its second annual Survey of Transmission Development on annualcapital expenditures for transmission construction from 2003 through 2007. The five-year totalis $6.3 billion, of which $200 million is to interconnect new generation. The 2002 actual figurewas lower than the forecast ($1.0 v $1.3 billion), and the 2003 forecasts are lower than the 2002forecasts, probably because of a slowdown in construction of new generation. The surveyshows that all the planned transmission is inside SERC, with no connections planned to otherregions. In addition, almost all the planned transmission is within the individual utility
*The Commission’s December 2002 report, Review of Electric Utility Ten-Year Site Plans, and its September2003 Statistics of the Florida Electric Utility Industry 2002 might be expected to include information on thetransmission system, but neither report contained any such information.
28
subregions. Although interesting, the SERC report provides little information on the need foradditional transmission (for both reliability and commerce) and says nothing about the costsof individual projects or about nontransmission alternatives.
FLORIDA RELIABILITY COORDINATING COUNCIL
Created in 1996, FRCC encompasses peninsular Florida. Florida may represent the otherend of the spectrum from New England in terms of the availability of useful information ontransmission planning and plans. Searches of the websites of the Florida Public ServiceCommission (PSC) and FRCC uncovered no documents related to transmission plans.*
Conversations with staffers at the two organizations provided little information. FRCCprovides almost no data to the public, revealing its workings and results only to its membersand the PSC. The reasons offered for this tight control on its information concern commercialconfidentiality and national security. Commission staff, similarly, provided little guidance onthe availability of transmission information. In the end, I obtained only one document (FRCC2003) that contained any information on transmission: a two-page table that lists proposedtransmission lines (including line ownership, length, in-service date, voltage, and capacity). Nonarrative accompanied the table to explain the current status of the Florida transmission grid,likely future problems, potential solutions to those problems, and the specific projects and theircosts that would resolve these problems.
MIDWEST
As defined here, the Midwest includes ECAR, MAIN, and MAPP. I combined theseregions into one section because the Midwest ISO covers parts of all three. Some utilities inECAR and MAIN are, or plan to become, part of PJM West.
Midwest ISO
MISO includes transmission systems in 15 states, with more than 110,000 miles oftransmission. MISO (2003) issued its first transmission plan in mid-2003. It assembles thereliability-related projects from the individual member utilities, discusses plans to do anindependent “top-down reliability review” in 2004, and presents a very interesting economicanalysis of congestion reduction, based on simulated LMPs. Thus, the focus of this initial planis on a regional congestion analysis under a variety of generation- and transmission-expansionscenarios.
29
During the two-year period, 2001 and 2002, MISO called TLRs on 110 flowgates, 19of which accounted for 80% of all the calls. Transmission owners plan to make transmissionimprovements that will address 12 of these 19 flowgates.
The local plans are “reliability driven,” and focus on the 2002 to 2007 period. Thesetransmission-owner projects call for the addition of 3,600 miles of transmission, relative totoday’s 112,00 miles of transmission. Only about 1,200 of the 3,600 miles to be added representnew right-of-way (ROW), while the rest involve existing ROW. And about two-thirds of themileage is for lower voltages, 115 and 138 kV, with the rest at 161, 230, and 345 kV. The totalcost of these projects is about $1.8 billion. Capacitor banks would add $0.13 billion to the $1.8billion. Of this nearly $1.9 billion total, 59% is for “native network load,” 20% for “generatorinterconnections,” 14% for “transmission service,” and 6% for miscellaneous.
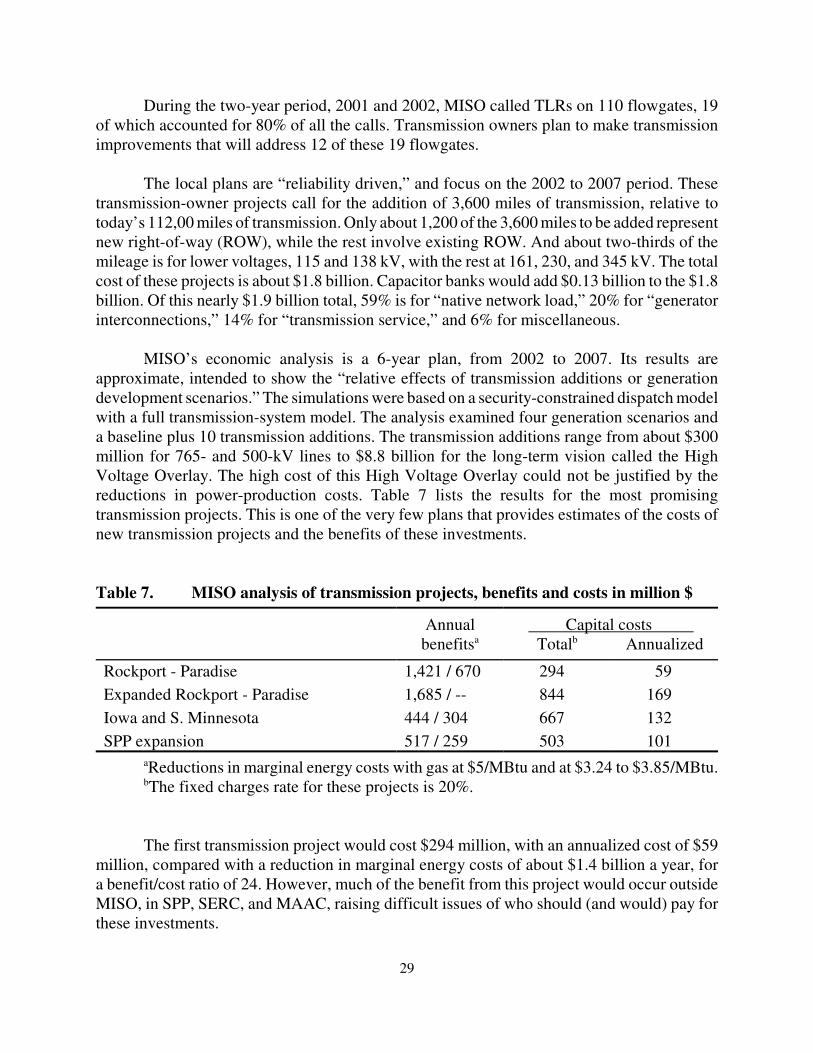
MISO’s economic analysis is a 6-year plan, from 2002 to 2007. Its results areapproximate, intended to show the “relative effects of transmission additions or generationdevelopment scenarios.” The simulations were based on a security-constrained dispatch modelwith a full transmission-system model. The analysis examined four generation scenarios anda baseline plus 10 transmission additions. The transmission additions range from about $300million for 765- and 500-kV lines to $8.8 billion for the long-term vision called the HighVoltage Overlay. The high cost of this High Voltage Overlay could not be justified by thereductions in power-production costs. Table 7 lists the results for the most promisingtransmission projects. This is one of the very few plans that provides estimates of the costs ofnew transmission projects and the benefits of these investments.
Table 7. MISO analysis of transmission projects, benefits and costs in million $
Annualbenefitsa
Capital costs Totalb Annualized
Rockport - Paradise 1,421 / 670 294 59Expanded Rockport - Paradise 1,685 / -- 844 169Iowa and S. Minnesota 444 / 304 667 132SPP expansion 517 / 259 503 101
aReductions in marginal energy costs with gas at $5/MBtu and at $3.24 to $3.85/MBtu.bThe fixed charges rate for these projects is 20%.
The first transmission project would cost $294 million, with an annualized cost of $59million, compared with a reduction in marginal energy costs of about $1.4 billion a year, fora benefit/cost ratio of 24. However, much of the benefit from this project would occur outsideMISO, in SPP, SERC, and MAAC, raising difficult issues of who should (and would) pay forthese investments.
30
Like some of the other better transmission plans, this one is well written. It includes anextensive Executive Summary, available separately from the main 300+ page report.
East-Central Area Reliability Coordination Agreement
I was unable to locate any transmission plans within ECAR. The utilities I spoke withdo not publish their plans. And, a review of the ECAR website uncovered no transmission-planning reports. Although ECAR’s mission does not include planning, ECAR conductsassessments of the transmission system to determine whether the transmission plans of itsmembers will maintain reliability. ECAR’s Transmission Facilities Panel has the followingfunctions:
� Maintain surveillance of transmission line construction schedules. � Develop programs of mutual assistance for times of emergency with regard to exchange
of crews and materials. � Collect and analyze scheduled maintenance practices and unscheduled outages. � Correlate transmission line performance with types of transmission line design and
equipment specifications.
ECAR’s Transmission System Performance Panel has the following functions:
� Develop procedures, methods, and criteria for evaluating ECAR bulk powertransmission system performance.
� Appraise the reliability of the ECAR bulk power transmission system, both present andfuture.
� Perform technical studies as required.
Mid-America Interconnected Network
MAIN, located west of ECAR, includes all of Illinois and portions of Missouri,Wisconsin, Iowa, Minnesota and Michigan. American Transmission Company (ATC 2003),a transmission-only entity within MAIN, published its third plan in September 2003. Formedin 2001, ATC owns and operates 8,900 miles of transmission in Wisconsin, upper Michigan,and Illinois. ATC issues a detailed planning report every year, with six-month updates inbetween. The ATC system is divided into five zones. Planning occurs at the project level (e.g.,generator interconnection), zonal level, the ATC level, and regional level (with surroundingutilities and MISO). ATC has a formal public- and customer-involvement process.
Over the next 10 years (2003�2012), ATC plans 38 projects involving 460 miles on newROW and 70 projects on 1,050 miles of existing ROW. In addition, ATC plans to install 38new transformers and 34 new capacitor banks. These projects are expected to cost about $1.7billion. “ATC anticipates total capital expenditures of around $2.8 billion over this same
*This $2.8 billion exceeds the $1.9 billion for all of the MISO transmission owners because the ATC numberis for 10 years and the MISO number is for five years, ATC includes lower voltages than did MISO, and ATC lookedat a broader range of projects.
31
period.”* The extra $1.1 billion is for generator interconnections, strategic or conceptualprojects, small transmission-distribution interconnections, capital-related maintenance projects,and replacements of protective relays. This new investment is equal to the current book valueof the ATC transmission system, which is heavily depreciated.
ATC categorizes projects as conceptual, proposed, or planned depending on how faralong in the analytical, planning, and regulatory processes the project is. ATC also considersstrategic projects, which would “increase transfer capability into the ATC system,” andtherefore would improve the economics (lower production costs) of power supply to ATCcustomers. ATC conducts several types of analyses: power-flow analyses for summer onpeakand shoulder peak for 2004, 2008, and 2012; stability analysis (“to ensure that generatorsremain stable during transmission system contingencies”); and transfer capability assessments.
The ATC report discusses transmission-system characteristics and limitations for eachof the five zones, as well as alternative solutions to the identified problems. Issues relate togenerator instability, voltage instability, overloaded lines and equipment, low voltages, and theneed to import more power from neighboring zones or regions. The ATC plan emphasizes theimportance of the Arrowhead-Weston project, a new 220-mile 345-kV line from Minnesota toWisconsin. Finally, ATC creates two umbrella plans, one for the northern zones and the otherfor the southern zones. These umbrella plans seek to optimize system performance over all theprojects in each zone.
Mid-Continent Area Power Pool
MAPP, located west and north of MAIN, covers the upper midwest and includes thefollowing states and provinces: Minnesota, Nebraska, North Dakota, Manitoba, Saskatchewan,and parts of Wisconsin, Montana, Iowa and South Dakota. The MAPP members own 20,000miles of transmission.
MAPP (2002) prepares a 10-year plan every two years focusing on voltages of 115 kVand higher. This plan includes sections for each of the five subregions within MAPP. MAPP’sTransmission Planning Subcommittee (part of the Regional Transmission Committee) developsthe MAPP plan based on the individual utility plans and the plans from the SubregionalPlanning Groups. The plan includes a section on “A Visionary Concept of FutureTransmission” that includes “over 1,900 miles of new 500-kV lines at a cost of about $1.3billion for lines and substations.” The plan focuses on broad regional transfers (economics) andnot on local or reliability issues (although the subregional planning groups do look atreliability). This report provides no information on the costs and benefits of these proposedtransmission additions.
32
MAPPTX
0
200
400
600
800
1000
115 161 230 345VOLTAGE LEVEL (kV)
MIL
ES
TO
BE
AD
DE
D
Upgrade New
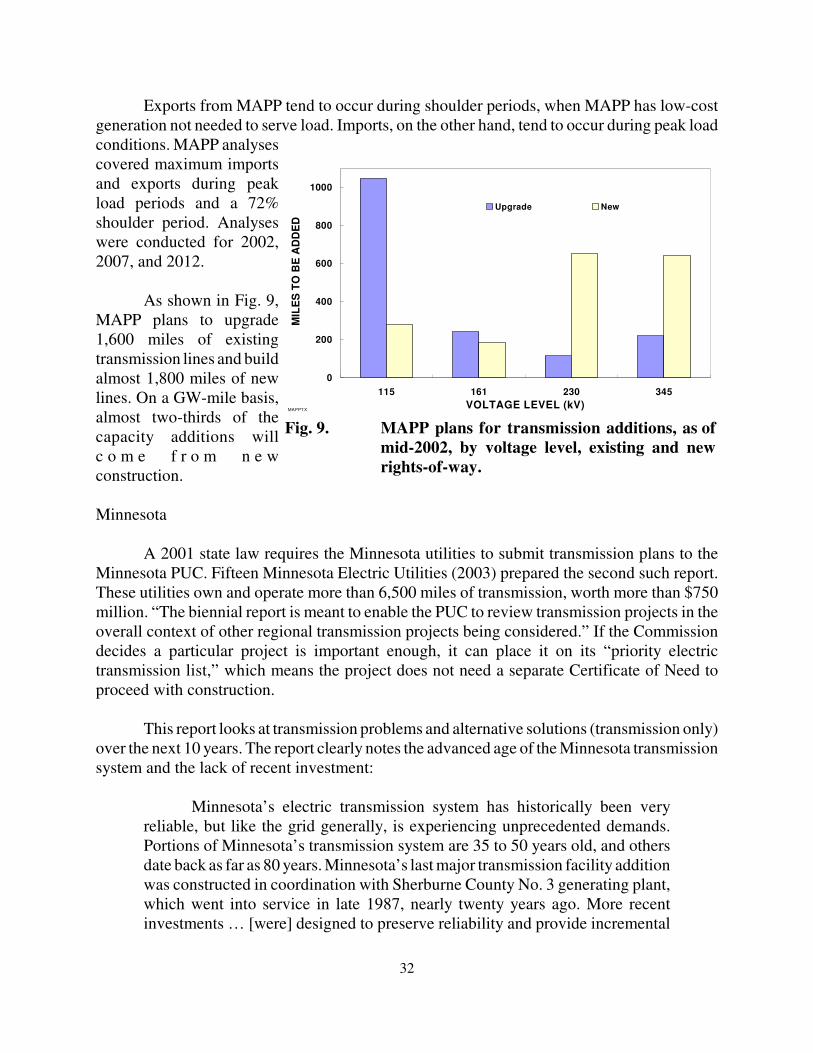
Fig. 9. MAPP plans for transmission additions, as ofmid-2002, by voltage level, existing and newrights-of-way.
Exports from MAPP tend to occur during shoulder periods, when MAPP has low-costgeneration not needed to serve load. Imports, on the other hand, tend to occur during peak loadconditions. MAPP analysescovered maximum importsand exports during peakload periods and a 72%shoulder period. Analyseswere conducted for 2002,2007, and 2012.
As shown in Fig. 9,MAPP plans to upgrade1,600 miles of existingtransmission lines and buildalmost 1,800 miles of newlines. On a GW-mile basis,almost two-thirds of thecapacity additions willc o m e f r o m n e wconstruction.
Minnesota
A 2001 state law requires the Minnesota utilities to submit transmission plans to theMinnesota PUC. Fifteen Minnesota Electric Utilities (2003) prepared the second such report.These utilities own and operate more than 6,500 miles of transmission, worth more than $750million. “The biennial report is meant to enable the PUC to review transmission projects in theoverall context of other regional transmission projects being considered.” If the Commissiondecides a particular project is important enough, it can place it on its “priority electrictransmission list,” which means the project does not need a separate Certificate of Need toproceed with construction.
This report looks at transmission problems and alternative solutions (transmission only)over the next 10 years. The report clearly notes the advanced age of the Minnesota transmissionsystem and the lack of recent investment:
Minnesota’s electric transmission system has historically been veryreliable, but like the grid generally, is experiencing unprecedented demands.Portions of Minnesota’s transmission system are 35 to 50 years old, and othersdate back as far as 80 years. Minnesota’s last major transmission facility additionwas constructed in coordination with Sherburne County No. 3 generating plant,which went into service in late 1987, nearly twenty years ago. More recentinvestments … [were] designed to preserve reliability and provide incremental
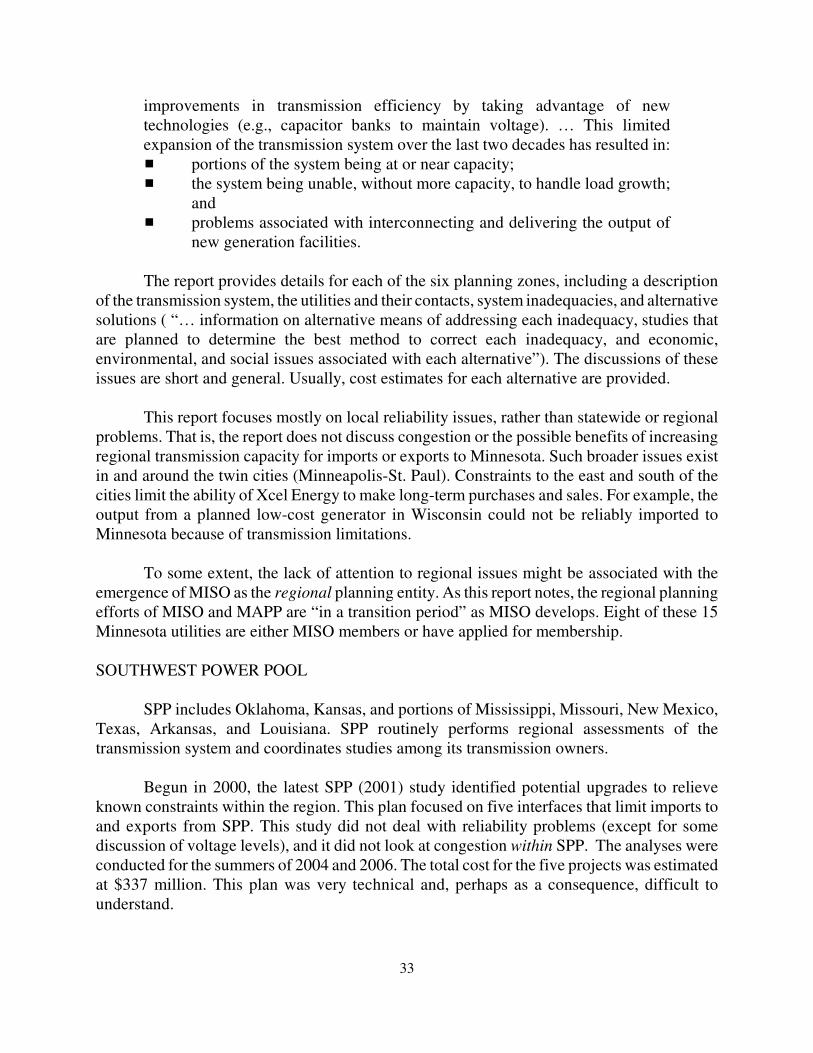
33
improvements in transmission efficiency by taking advantage of newtechnologies (e.g., capacitor banks to maintain voltage). … This limitedexpansion of the transmission system over the last two decades has resulted in:� portions of the system being at or near capacity;� the system being unable, without more capacity, to handle load growth;
and� problems associated with interconnecting and delivering the output of
new generation facilities.
The report provides details for each of the six planning zones, including a descriptionof the transmission system, the utilities and their contacts, system inadequacies, and alternativesolutions ( “… information on alternative means of addressing each inadequacy, studies thatare planned to determine the best method to correct each inadequacy, and economic,environmental, and social issues associated with each alternative”). The discussions of theseissues are short and general. Usually, cost estimates for each alternative are provided.
This report focuses mostly on local reliability issues, rather than statewide or regionalproblems. That is, the report does not discuss congestion or the possible benefits of increasingregional transmission capacity for imports or exports to Minnesota. Such broader issues existin and around the twin cities (Minneapolis-St. Paul). Constraints to the east and south of thecities limit the ability of Xcel Energy to make long-term purchases and sales. For example, theoutput from a planned low-cost generator in Wisconsin could not be reliably imported toMinnesota because of transmission limitations.
To some extent, the lack of attention to regional issues might be associated with theemergence of MISO as the regional planning entity. As this report notes, the regional planningefforts of MISO and MAPP are “in a transition period” as MISO develops. Eight of these 15Minnesota utilities are either MISO members or have applied for membership.
SOUTHWEST POWER POOL
SPP includes Oklahoma, Kansas, and portions of Mississippi, Missouri, New Mexico,Texas, Arkansas, and Louisiana. SPP routinely performs regional assessments of thetransmission system and coordinates studies among its transmission owners.
Begun in 2000, the latest SPP (2001) study identified potential upgrades to relieveknown constraints within the region. This plan focused on five interfaces that limit imports toand exports from SPP. This study did not deal with reliability problems (except for somediscussion of voltage levels), and it did not look at congestion within SPP. The analyses wereconducted for the summers of 2004 and 2006. The total cost for the five projects was estimatedat $337 million. This plan was very technical and, perhaps as a consequence, difficult tounderstand.
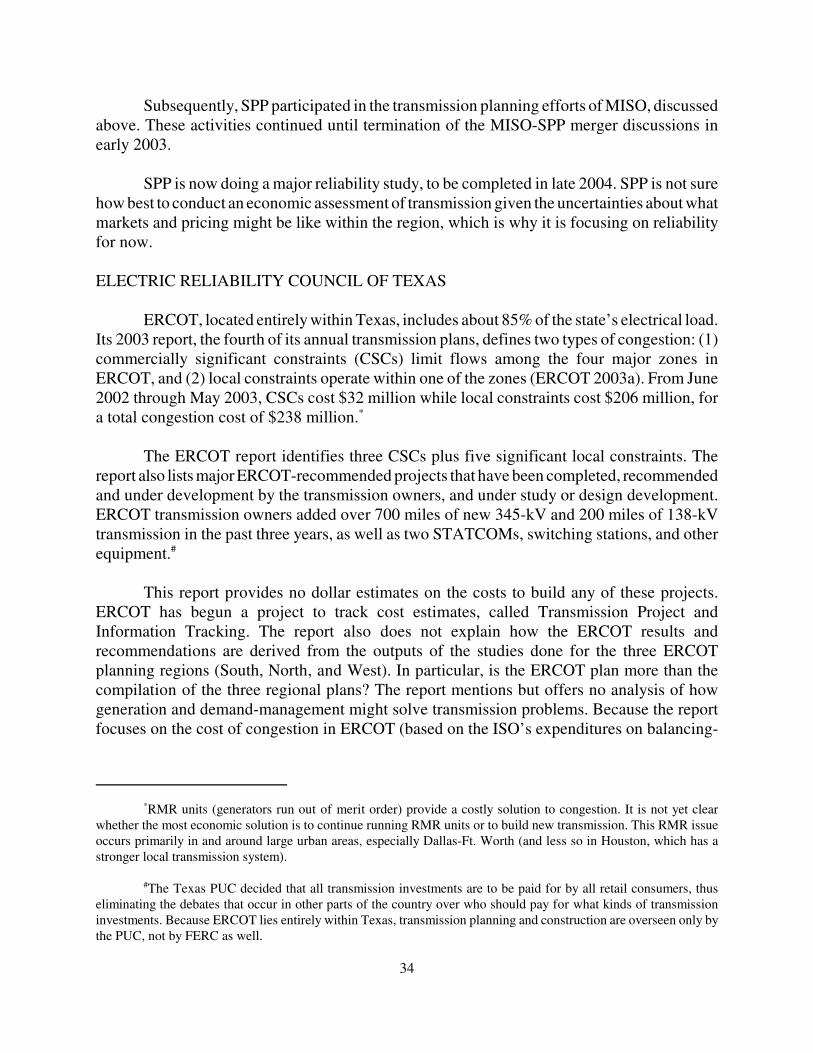
*RMR units (generators run out of merit order) provide a costly solution to congestion. It is not yet clearwhether the most economic solution is to continue running RMR units or to build new transmission. This RMR issueoccurs primarily in and around large urban areas, especially Dallas-Ft. Worth (and less so in Houston, which has astronger local transmission system).
#The Texas PUC decided that all transmission investments are to be paid for by all retail consumers, thuseliminating the debates that occur in other parts of the country over who should pay for what kinds of transmissioninvestments. Because ERCOT lies entirely within Texas, transmission planning and construction are overseen only bythe PUC, not by FERC as well.
34
Subsequently, SPP participated in the transmission planning efforts of MISO, discussedabove. These activities continued until termination of the MISO-SPP merger discussions inearly 2003.
SPP is now doing a major reliability study, to be completed in late 2004. SPP is not surehow best to conduct an economic assessment of transmission given the uncertainties about whatmarkets and pricing might be like within the region, which is why it is focusing on reliabilityfor now.
ELECTRIC RELIABILITY COUNCIL OF TEXAS
ERCOT, located entirely within Texas, includes about 85% of the state’s electrical load.Its 2003 report, the fourth of its annual transmission plans, defines two types of congestion: (1)commercially significant constraints (CSCs) limit flows among the four major zones inERCOT, and (2) local constraints operate within one of the zones (ERCOT 2003a). From June2002 through May 2003, CSCs cost $32 million while local constraints cost $206 million, fora total congestion cost of $238 million.*
The ERCOT report identifies three CSCs plus five significant local constraints. Thereport also lists major ERCOT-recommended projects that have been completed, recommendedand under development by the transmission owners, and under study or design development.ERCOT transmission owners added over 700 miles of new 345-kV and 200 miles of 138-kVtransmission in the past three years, as well as two STATCOMs, switching stations, and otherequipment.#
This report provides no dollar estimates on the costs to build any of these projects.ERCOT has begun a project to track cost estimates, called Transmission Project andInformation Tracking. The report also does not explain how the ERCOT results andrecommendations are derived from the outputs of the studies done for the three ERCOTplanning regions (South, North, and West). In particular, is the ERCOT plan more than thecompilation of the three regional plans? The report mentions but offers no analysis of howgeneration and demand-management might solve transmission problems. Because the reportfocuses on the cost of congestion in ERCOT (based on the ISO’s expenditures on balancing-
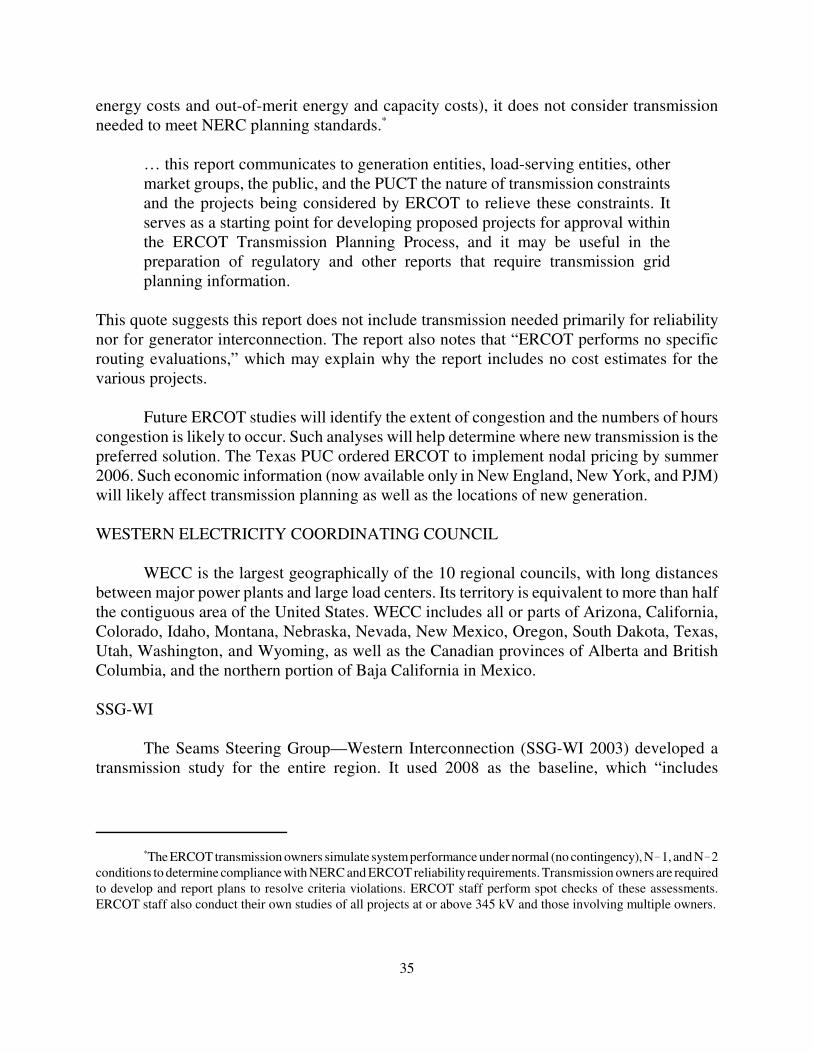
*The ERCOT transmission owners simulate system performance under normal (no contingency), N�1, and N�2conditions to determine compliance with NERC and ERCOT reliability requirements. Transmission owners are requiredto develop and report plans to resolve criteria violations. ERCOT staff perform spot checks of these assessments.ERCOT staff also conduct their own studies of all projects at or above 345 kV and those involving multiple owners.
35
energy costs and out-of-merit energy and capacity costs), it does not consider transmissionneeded to meet NERC planning standards.*
… this report communicates to generation entities, load-serving entities, othermarket groups, the public, and the PUCT the nature of transmission constraintsand the projects being considered by ERCOT to relieve these constraints. Itserves as a starting point for developing proposed projects for approval withinthe ERCOT Transmission Planning Process, and it may be useful in thepreparation of regulatory and other reports that require transmission gridplanning information.
This quote suggests this report does not include transmission needed primarily for reliabilitynor for generator interconnection. The report also notes that “ERCOT performs no specificrouting evaluations,” which may explain why the report includes no cost estimates for thevarious projects.
Future ERCOT studies will identify the extent of congestion and the numbers of hourscongestion is likely to occur. Such analyses will help determine where new transmission is thepreferred solution. The Texas PUC ordered ERCOT to implement nodal pricing by summer2006. Such economic information (now available only in New England, New York, and PJM)will likely affect transmission planning as well as the locations of new generation.
WESTERN ELECTRICITY COORDINATING COUNCIL
WECC is the largest geographically of the 10 regional councils, with long distancesbetween major power plants and large load centers. Its territory is equivalent to more than halfthe contiguous area of the United States. WECC includes all or parts of Arizona, California,Colorado, Idaho, Montana, Nebraska, Nevada, New Mexico, Oregon, South Dakota, Texas,Utah, Washington, and Wyoming, as well as the Canadian provinces of Alberta and BritishColumbia, and the northern portion of Baja California in Mexico.
SSG-WI
The Seams Steering Group—Western Interconnection (SSG-WI 2003) developed atransmission study for the entire region. It used 2008 as the baseline, which “includes

*The 2008 case also shows “significant stranding of low-cost generation in Canada and in the DesertSouthwest. Approximately 1,300 miles of new 345- and 500-kV line would be required to completely eliminate thisidentified congestion, which could result in an annual savings in the production cost of generation … totaling at least$110 million.”
36
generation and transmission infrastructure reasonably certain to be in place by 2008.”* Thestudy focused on and analyzed three generation scenarios for 2013. These scenariosemphasized different fuels in the mix of generation: natural gas, coal, or renewables. Thescenarios consider three different gas prices and two different levels of hydroelectric output.The need for new transmission is more sensitive to the price of gas than to hydro conditions.The transmission investments required for the three 2013 scenarios are: $2.6 billion for gas(1,300 miles of new transmission), $16.7 billion for coal (7,600 miles), and $6.7 for renewables(3,400 miles).
The key findings from this study are
� If new generation is primarily gas fired relatively few transmission additions will berequired.
� The development of coal and renewable resources in remote locations will requiresubstantial transmission additions. However, this could be more cost effective from anoverall perspective than new natural gas generation because it would lower powerproduction costs substantially.
� There are areas on the grid that will be congested in the near future; solutions to theseproblems should be investigated in subregional forums.
These findings show the interactions between generation investment and transmissioninvestment. The need for new transmission to support wind farms located far from load centerswas also identified in ERCOT (to move wind output from west Texas to the load centers) andMinnesota (to move wind output from the southern part of the state to the Twin Cities).
This study looked only at congestion (economic) issues and did not considertransmission investments that might be needed for reliability. The report examined the 33 majortransmission interfaces in the west and not any intracontrol-area issues.
Because the SSG-WI study was conducted over such a large geographical area, it couldnot analyze transmission on a disaggregate basis. Therefore, this study cannot form the basisfor specific investment decisions. Four sub-regional planning groups, coordinated by SSG-WI,do detailed transmission planning, including that needed for reliability. The Central ArizonaTransmission System group, formed in 2000, prepared detailed studies, some of which led toconstruction of new transmission, especially around the Palo Verde substation. CATS, recently
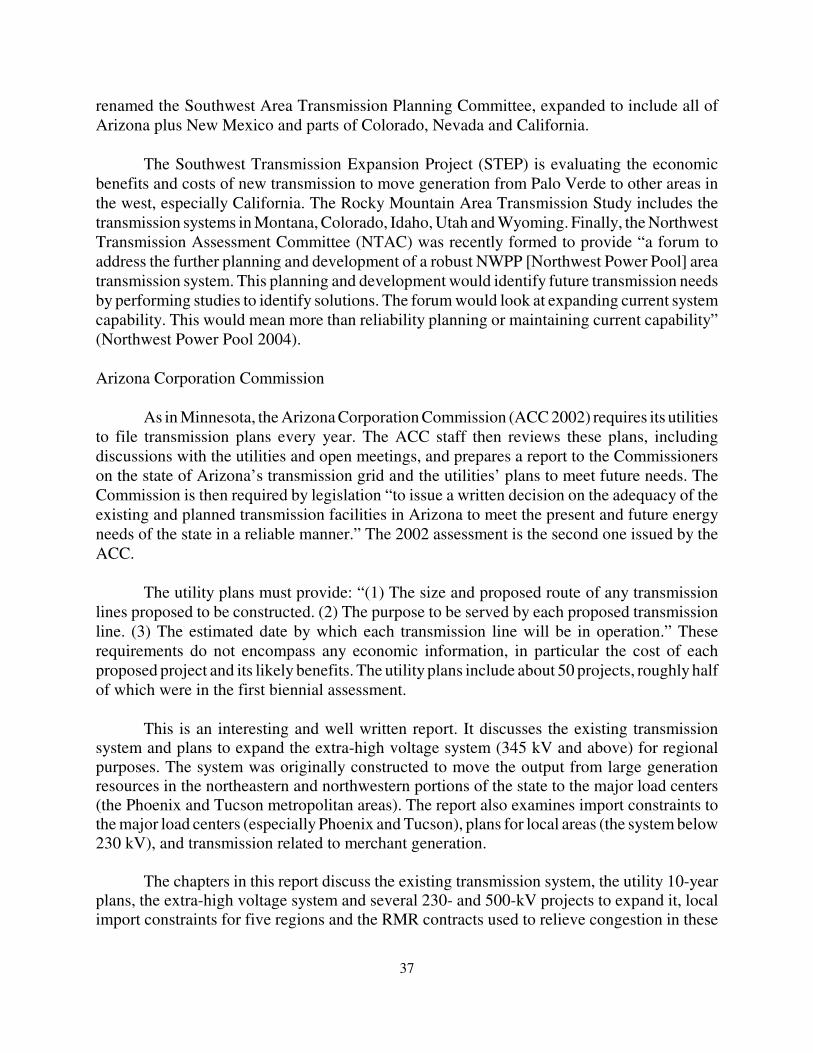
37
renamed the Southwest Area Transmission Planning Committee, expanded to include all ofArizona plus New Mexico and parts of Colorado, Nevada and California.
The Southwest Transmission Expansion Project (STEP) is evaluating the economicbenefits and costs of new transmission to move generation from Palo Verde to other areas inthe west, especially California. The Rocky Mountain Area Transmission Study includes thetransmission systems in Montana, Colorado, Idaho, Utah and Wyoming. Finally, the NorthwestTransmission Assessment Committee (NTAC) was recently formed to provide “a forum toaddress the further planning and development of a robust NWPP [Northwest Power Pool] areatransmission system. This planning and development would identify future transmission needsby performing studies to identify solutions. The forum would look at expanding current systemcapability. This would mean more than reliability planning or maintaining current capability”(Northwest Power Pool 2004).
Arizona Corporation Commission
As in Minnesota, the Arizona Corporation Commission (ACC 2002) requires its utilitiesto file transmission plans every year. The ACC staff then reviews these plans, includingdiscussions with the utilities and open meetings, and prepares a report to the Commissionerson the state of Arizona’s transmission grid and the utilities’ plans to meet future needs. TheCommission is then required by legislation “to issue a written decision on the adequacy of theexisting and planned transmission facilities in Arizona to meet the present and future energyneeds of the state in a reliable manner.” The 2002 assessment is the second one issued by theACC.
The utility plans must provide: “(1) The size and proposed route of any transmissionlines proposed to be constructed. (2) The purpose to be served by each proposed transmissionline. (3) The estimated date by which each transmission line will be in operation.” Theserequirements do not encompass any economic information, in particular the cost of eachproposed project and its likely benefits. The utility plans include about 50 projects, roughly halfof which were in the first biennial assessment.
This is an interesting and well written report. It discusses the existing transmissionsystem and plans to expand the extra-high voltage system (345 kV and above) for regionalpurposes. The system was originally constructed to move the output from large generationresources in the northeastern and northwestern portions of the state to the major load centers(the Phoenix and Tucson metropolitan areas). The report also examines import constraints tothe major load centers (especially Phoenix and Tucson), plans for local areas (the system below230 kV), and transmission related to merchant generation.
The chapters in this report discuss the existing transmission system, the utility 10-yearplans, the extra-high voltage system and several 230- and 500-kV projects to expand it, localimport constraints for five regions and the RMR contracts used to relieve congestion in these
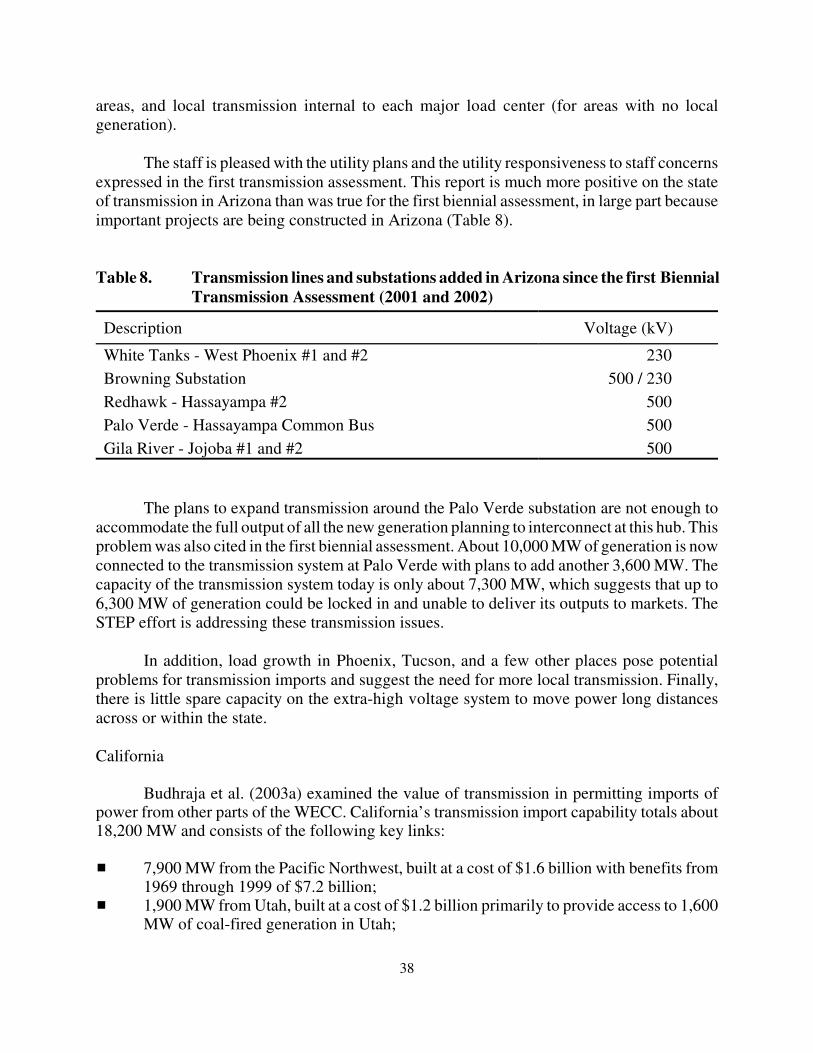
38
areas, and local transmission internal to each major load center (for areas with no localgeneration).
The staff is pleased with the utility plans and the utility responsiveness to staff concernsexpressed in the first transmission assessment. This report is much more positive on the stateof transmission in Arizona than was true for the first biennial assessment, in large part becauseimportant projects are being constructed in Arizona (Table 8).
Table 8. Transmission lines and substations added in Arizona since the first BiennialTransmission Assessment (2001 and 2002)
Description Voltage (kV)
White Tanks - West Phoenix #1 and #2 230Browning Substation 500 / 230Redhawk - Hassayampa #2 500Palo Verde - Hassayampa Common Bus 500Gila River - Jojoba #1 and #2 500
The plans to expand transmission around the Palo Verde substation are not enough toaccommodate the full output of all the new generation planning to interconnect at this hub. Thisproblem was also cited in the first biennial assessment. About 10,000 MW of generation is nowconnected to the transmission system at Palo Verde with plans to add another 3,600 MW. Thecapacity of the transmission system today is only about 7,300 MW, which suggests that up to6,300 MW of generation could be locked in and unable to deliver its outputs to markets. TheSTEP effort is addressing these transmission issues.
In addition, load growth in Phoenix, Tucson, and a few other places pose potentialproblems for transmission imports and suggest the need for more local transmission. Finally,there is little spare capacity on the extra-high voltage system to move power long distancesacross or within the state.
California
Budhraja et al. (2003a) examined the value of transmission in permitting imports ofpower from other parts of the WECC. California’s transmission import capability totals about18,200 MW and consists of the following key links:
� 7,900 MW from the Pacific Northwest, built at a cost of $1.6 billion with benefits from1969 through 1999 of $7.2 billion;
� 1,900 MW from Utah, built at a cost of $1.2 billion primarily to provide access to 1,600MW of coal-fired generation in Utah;
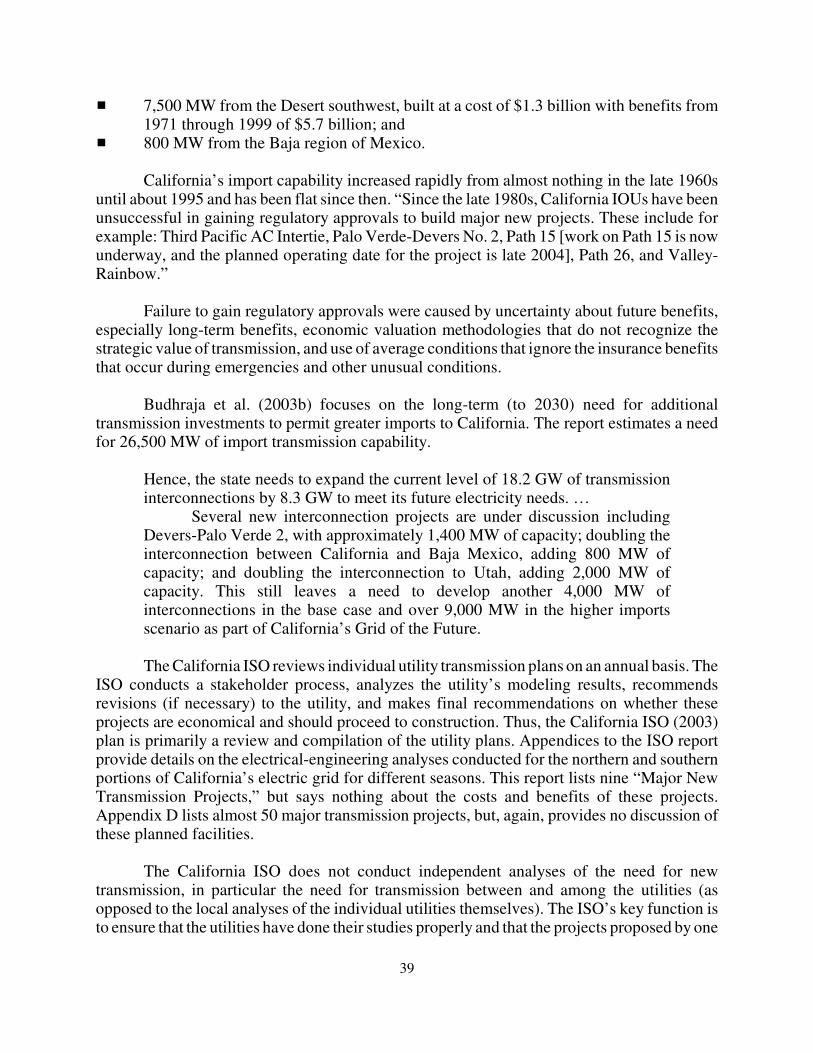
39
� 7,500 MW from the Desert southwest, built at a cost of $1.3 billion with benefits from1971 through 1999 of $5.7 billion; and
� 800 MW from the Baja region of Mexico.
California’s import capability increased rapidly from almost nothing in the late 1960suntil about 1995 and has been flat since then. “Since the late 1980s, California IOUs have beenunsuccessful in gaining regulatory approvals to build major new projects. These include forexample: Third Pacific AC Intertie, Palo Verde-Devers No. 2, Path 15 [work on Path 15 is nowunderway, and the planned operating date for the project is late 2004], Path 26, and Valley-Rainbow.”
Failure to gain regulatory approvals were caused by uncertainty about future benefits,especially long-term benefits, economic valuation methodologies that do not recognize thestrategic value of transmission, and use of average conditions that ignore the insurance benefitsthat occur during emergencies and other unusual conditions.
Budhraja et al. (2003b) focuses on the long-term (to 2030) need for additionaltransmission investments to permit greater imports to California. The report estimates a needfor 26,500 MW of import transmission capability.
Hence, the state needs to expand the current level of 18.2 GW of transmissioninterconnections by 8.3 GW to meet its future electricity needs. …
Several new interconnection projects are under discussion includingDevers-Palo Verde 2, with approximately 1,400 MW of capacity; doubling theinterconnection between California and Baja Mexico, adding 800 MW ofcapacity; and doubling the interconnection to Utah, adding 2,000 MW ofcapacity. This still leaves a need to develop another 4,000 MW ofinterconnections in the base case and over 9,000 MW in the higher importsscenario as part of California’s Grid of the Future.
The California ISO reviews individual utility transmission plans on an annual basis. TheISO conducts a stakeholder process, analyzes the utility’s modeling results, recommendsrevisions (if necessary) to the utility, and makes final recommendations on whether theseprojects are economical and should proceed to construction. Thus, the California ISO (2003)plan is primarily a review and compilation of the utility plans. Appendices to the ISO reportprovide details on the electrical-engineering analyses conducted for the northern and southernportions of California’s electric grid for different seasons. This report lists nine “Major NewTransmission Projects,” but says nothing about the costs and benefits of these projects.Appendix D lists almost 50 major transmission projects, but, again, provides no discussion ofthese planned facilities.
The California ISO does not conduct independent analyses of the need for newtransmission, in particular the need for transmission between and among the utilities (asopposed to the local analyses of the individual utilities themselves). The ISO’s key function isto ensure that the utilities have done their studies properly and that the projects proposed by one
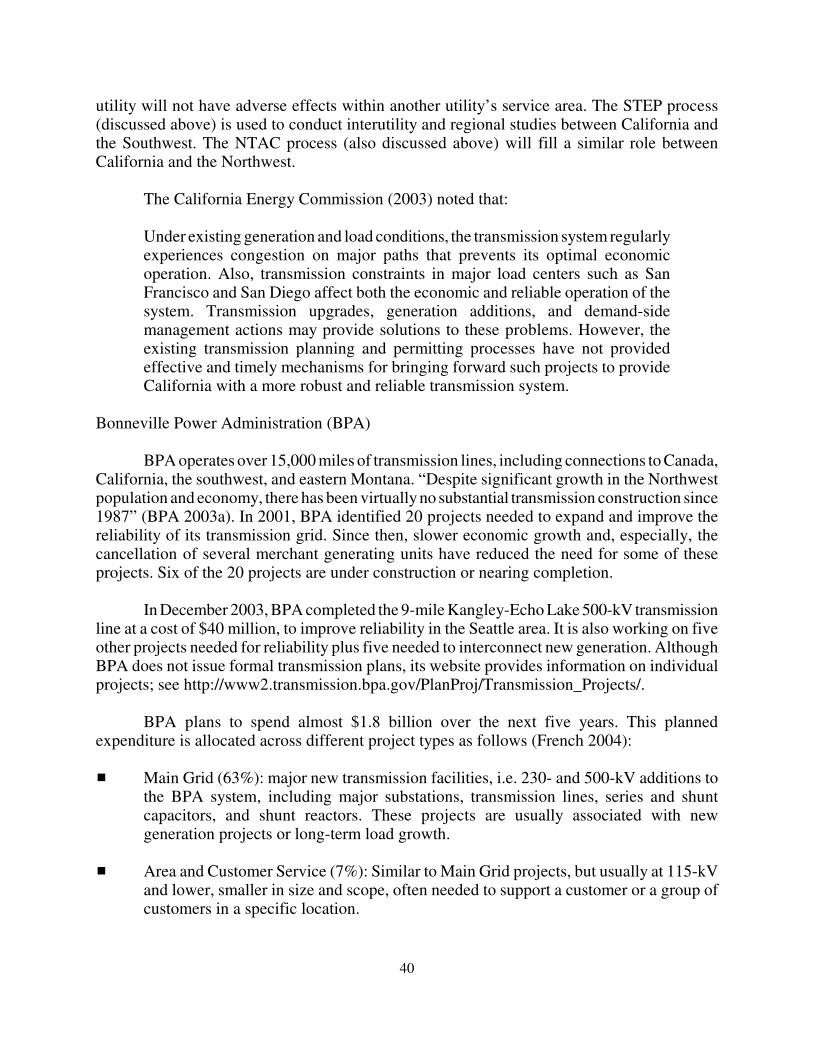
40
utility will not have adverse effects within another utility’s service area. The STEP process(discussed above) is used to conduct interutility and regional studies between California andthe Southwest. The NTAC process (also discussed above) will fill a similar role betweenCalifornia and the Northwest.
The California Energy Commission (2003) noted that:
Under existing generation and load conditions, the transmission system regularlyexperiences congestion on major paths that prevents its optimal economicoperation. Also, transmission constraints in major load centers such as SanFrancisco and San Diego affect both the economic and reliable operation of thesystem. Transmission upgrades, generation additions, and demand-sidemanagement actions may provide solutions to these problems. However, theexisting transmission planning and permitting processes have not providedeffective and timely mechanisms for bringing forward such projects to provideCalifornia with a more robust and reliable transmission system.
Bonneville Power Administration (BPA)
BPA operates over 15,000 miles of transmission lines, including connections to Canada,California, the southwest, and eastern Montana. “Despite significant growth in the Northwestpopulation and economy, there has been virtually no substantial transmission construction since1987” (BPA 2003a). In 2001, BPA identified 20 projects needed to expand and improve thereliability of its transmission grid. Since then, slower economic growth and, especially, thecancellation of several merchant generating units have reduced the need for some of theseprojects. Six of the 20 projects are under construction or nearing completion.
In December 2003, BPA completed the 9-mile Kangley-Echo Lake 500-kV transmissionline at a cost of $40 million, to improve reliability in the Seattle area. It is also working on fiveother projects needed for reliability plus five needed to interconnect new generation. AlthoughBPA does not issue formal transmission plans, its website provides information on individualprojects; see http://www2.transmission.bpa.gov/PlanProj/Transmission_Projects/.
BPA plans to spend almost $1.8 billion over the next five years. This plannedexpenditure is allocated across different project types as follows (French 2004):
� Main Grid (63%): major new transmission facilities, i.e. 230- and 500-kV additions tothe BPA system, including major substations, transmission lines, series and shuntcapacitors, and shunt reactors. These projects are usually associated with newgeneration projects or long-term load growth.
� Area and Customer Service (7%): Similar to Main Grid projects, but usually at 115-kV
and lower, smaller in size and scope, often needed to support a customer or a group ofcustomers in a specific location.
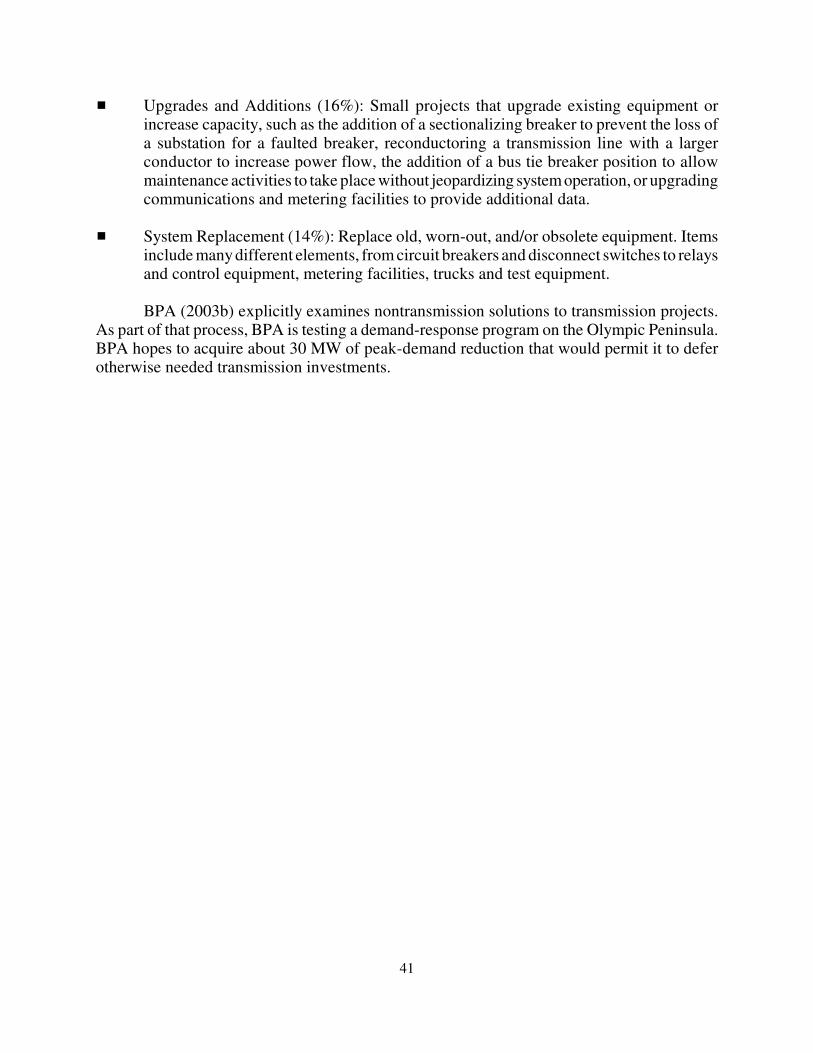
41
� Upgrades and Additions (16%): Small projects that upgrade existing equipment orincrease capacity, such as the addition of a sectionalizing breaker to prevent the loss ofa substation for a faulted breaker, reconductoring a transmission line with a largerconductor to increase power flow, the addition of a bus tie breaker position to allowmaintenance activities to take place without jeopardizing system operation, or upgradingcommunications and metering facilities to provide additional data.
� System Replacement (14%): Replace old, worn-out, and/or obsolete equipment. Items
include many different elements, from circuit breakers and disconnect switches to relaysand control equipment, metering facilities, trucks and test equipment.
BPA (2003b) explicitly examines nontransmission solutions to transmission projects.As part of that process, BPA is testing a demand-response program on the Olympic Peninsula.BPA hopes to acquire about 30 MW of peak-demand reduction that would permit it to deferotherwise needed transmission investments.

42
43
CHAPTER 4
DISCUSSION OF PLANS
Chapter 3 discussed 20 transmission plans and related documents. This chaptersummarizes the key elements of this very diverse set of planning documents. These studiesvaried considerably in the topics covered, the provision of information on the current status ofthe transmission system and its uses and problems, alternative solutions to these problems, thecosts and benefits of these alternatives, and the clarity of presentation (Table 9).
The studies were roughly split in their focus on transmission needed to maintainreliability v transmission needed to reduce congestion. Few of the studies took a broad viewof transmission needs and studied both reliability and economics, as well as interconnection andequipment-replacement issues. In several cases, the analyses of transmission needs forreliability and those for economics were conducted by different groups. This separation makesit difficult to ensure consistency among studies.
The studies generally did not report the projected costs of the transmission projectsstudied. Even fewer analyzed the potential benefits of these projects and sought to comparecosts and benefits; the Midwest ISO and SSG-WI studies were the sole exceptions. Almost allthese plans ignored transmission-system losses and the potential for reducing losses. Withouta clear understanding of the costs and potential benefits of a transmission project, it is difficultfor regulators and stakeholders to consider whether the project should be built and, if so, whoshould pay for it.
Analyzing the economic benefits of transmission projects is difficult. Reliability projectscould be assessed in terms of their ability to reduce the loss-of-load-probability and the value-of-lost-load. While it is possible to calculate changes in LOLP associated with differentamounts and location of generation and transmission, estimates of VOLL vary widely. TheVOLL is probably very case specific, a function of the particular customer, when the outageoccurs, how long it lasts, and whether the customer had advance notice of the outage.
For transmission projects aimed at reducing the cost of power production and delivery,the benefits can be assessed from the perspective of customers, generators, or the system as awhole. Such transmission projects can involve major wealth transfers between consumers andproducers in different locations. For example, consumers downstream and suppliers upstreamof a constrained interface benefit from construction of transmission facilities that relieve theconstraint, but downstream suppliers and upstream consumers can be hurt by such investments.
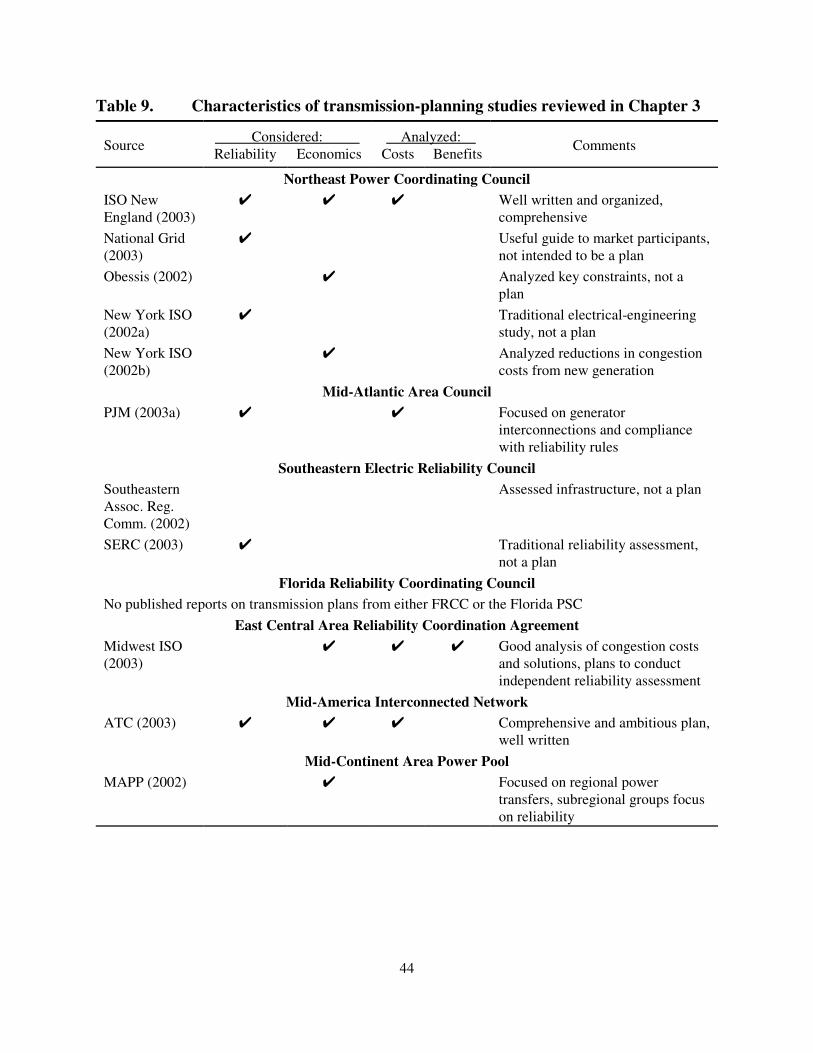
44
Table 9. Characteristics of transmission-planning studies reviewed in Chapter 3
Source Considered: Analyzed: CommentsReliability Economics Costs Benefits
Northeast Power Coordinating CouncilISO NewEngland (2003)
� � � Well written and organized,comprehensive
National Grid(2003)
� Useful guide to market participants,not intended to be a plan
Obessis (2002) � Analyzed key constraints, not aplan
New York ISO(2002a)
� Traditional electrical-engineeringstudy, not a plan
New York ISO(2002b)
� Analyzed reductions in congestioncosts from new generation
Mid-Atlantic Area CouncilPJM (2003a) � � Focused on generator
interconnections and compliancewith reliability rules
Southeastern Electric Reliability CouncilSoutheasternAssoc. Reg.Comm. (2002)
Assessed infrastructure, not a plan
SERC (2003) � Traditional reliability assessment,not a plan
Florida Reliability Coordinating CouncilNo published reports on transmission plans from either FRCC or the Florida PSC
East Central Area Reliability Coordination AgreementMidwest ISO(2003)
� � � Good analysis of congestion costsand solutions, plans to conductindependent reliability assessment
Mid-America Interconnected NetworkATC (2003) � � � Comprehensive and ambitious plan,
well writtenMid-Continent Area Power Pool
MAPP (2002) � Focused on regional powertransfers, subregional groups focuson reliability
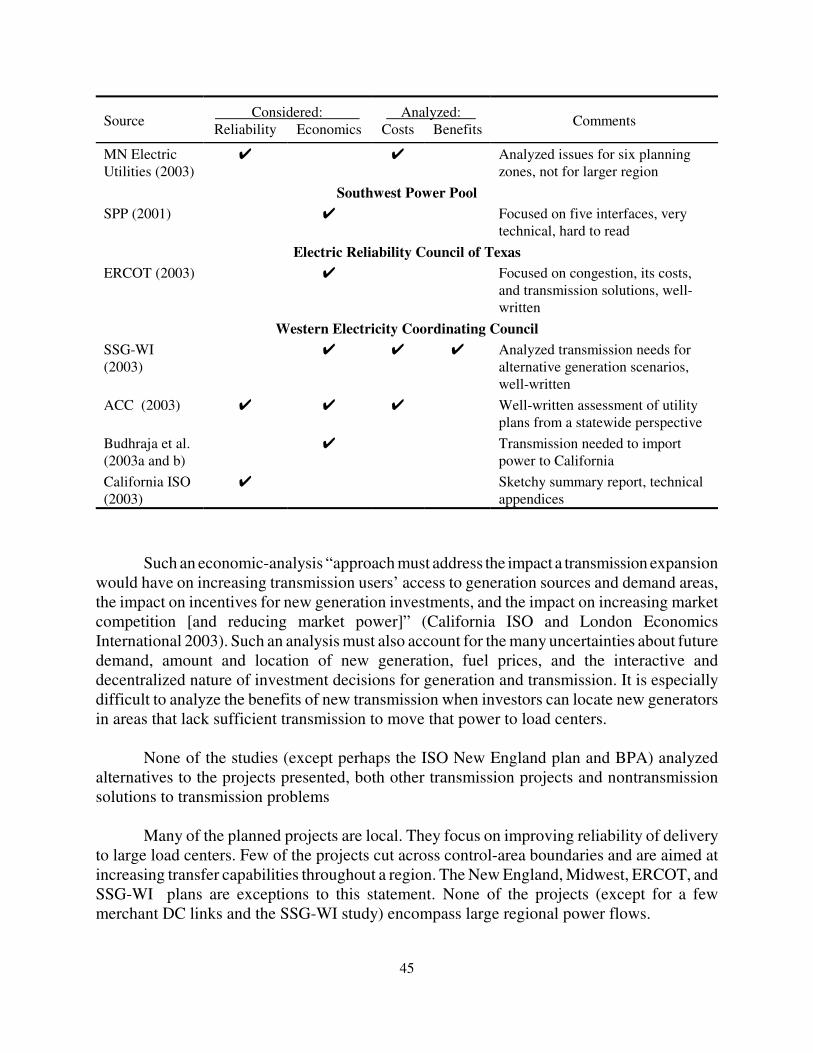
Source Considered: Analyzed: CommentsReliability Economics Costs Benefits
45
MN ElectricUtilities (2003)
� � Analyzed issues for six planningzones, not for larger region
Southwest Power PoolSPP (2001) � Focused on five interfaces, very
technical, hard to readElectric Reliability Council of Texas
ERCOT (2003) � Focused on congestion, its costs,and transmission solutions, well-written
Western Electricity Coordinating CouncilSSG-WI(2003)
� � � Analyzed transmission needs foralternative generation scenarios,well-written
ACC (2003) � � � Well-written assessment of utilityplans from a statewide perspective
Budhraja et al.(2003a and b)
� Transmission needed to importpower to California
California ISO(2003)
� Sketchy summary report, technicalappendices
Such an economic-analysis “approach must address the impact a transmission expansionwould have on increasing transmission users’ access to generation sources and demand areas,the impact on incentives for new generation investments, and the impact on increasing marketcompetition [and reducing market power]” (California ISO and London EconomicsInternational 2003). Such an analysis must also account for the many uncertainties about futuredemand, amount and location of new generation, fuel prices, and the interactive anddecentralized nature of investment decisions for generation and transmission. It is especiallydifficult to analyze the benefits of new transmission when investors can locate new generatorsin areas that lack sufficient transmission to move that power to load centers.
None of the studies (except perhaps the ISO New England plan and BPA) analyzedalternatives to the projects presented, both other transmission projects and nontransmissionsolutions to transmission problems
Many of the planned projects are local. They focus on improving reliability of deliveryto large load centers. Few of the projects cut across control-area boundaries and are aimed atincreasing transfer capabilities throughout a region. The New England, Midwest, ERCOT, andSSG-WI plans are exceptions to this statement. None of the projects (except for a fewmerchant DC links and the SSG-WI study) encompass large regional power flows.
46
As shown by the spotty geographical coverage of the plans, many entities provide littleor no public information on transmission. The director of the transmission-planning departmentin a large utility stated: “We publish those portions of our transmission plan that are necessaryto meet regulatory requirements, such as the federal EIA-411 and FERC Form 715 datarequests, as well as various state filings. When we request regulatory approval for a specificproject, our application focuses on that project as required by state certification rules. None ofour regulatory commissions requires the filing of a comprehensive, systemwide transmissionplan.” Thus, many transmission owners likely prepare plans but do not publish them.
The electricity industry often encounters opposition to its proposals for construction ofnew transmission lines. Addressing and overcoming such opposition requires that transmissionowners explain clearly, and in layperson’s terms, why the project is needed, possiblealternatives to that project, expected project costs, expected benefits, and who the beneficiarieswill be. Closing the gap between current planning reports and best practices provides a clearopportunity to improve prospects for transmission-system enhancement.
The ERCOT (2003b) System Planning charter sets forth a useful structure for analyzingtransmission problems and proposed solutions:
���� Description of the reliability and/or economic problem that is being solved;���� Description of the proposed project, feasible alternative(s) considered, data, and all
studies supporting the need for the project, accurate maps and one line diagramsshowing locations of project and feasible alternatives;
���� Analysis of rejected alternatives, including cost estimates, effect upon transfercapability, and other factors considered in the comparison of alternatives with theproposed project;
���� Assumptions used in computer studies such that credible performance deficiencies canbe identified;
���� Performance analyses that are consistent with system operating practices and compliantwith the ERCOT Planning Criteria;
���� Documented process to identify specific performance deficiencies (reliability andeconomic);
���� Stakeholder/market participant review of the assumptions justifying transmissionprojects based on economic benefits as opposed to reliability criteria violations;
���� Consideration of both transmission and non-transmission solutions to performancedeficiencies; cost estimates should account for transmission investments, system losses,and congestion relief. To the extent generation dispatch can alleviate reliability needs,both reliability and economic impacts should be considered in the selection of solutions;
���� Consideration of alternatives submitted by market participants and due considerationof their transmission project proposals, with an opportunity for timely input by otherstakeholders;
���� Implementation of planned solutions on a schedule that permits adjustment of scope orschedule when conditions change significantly;
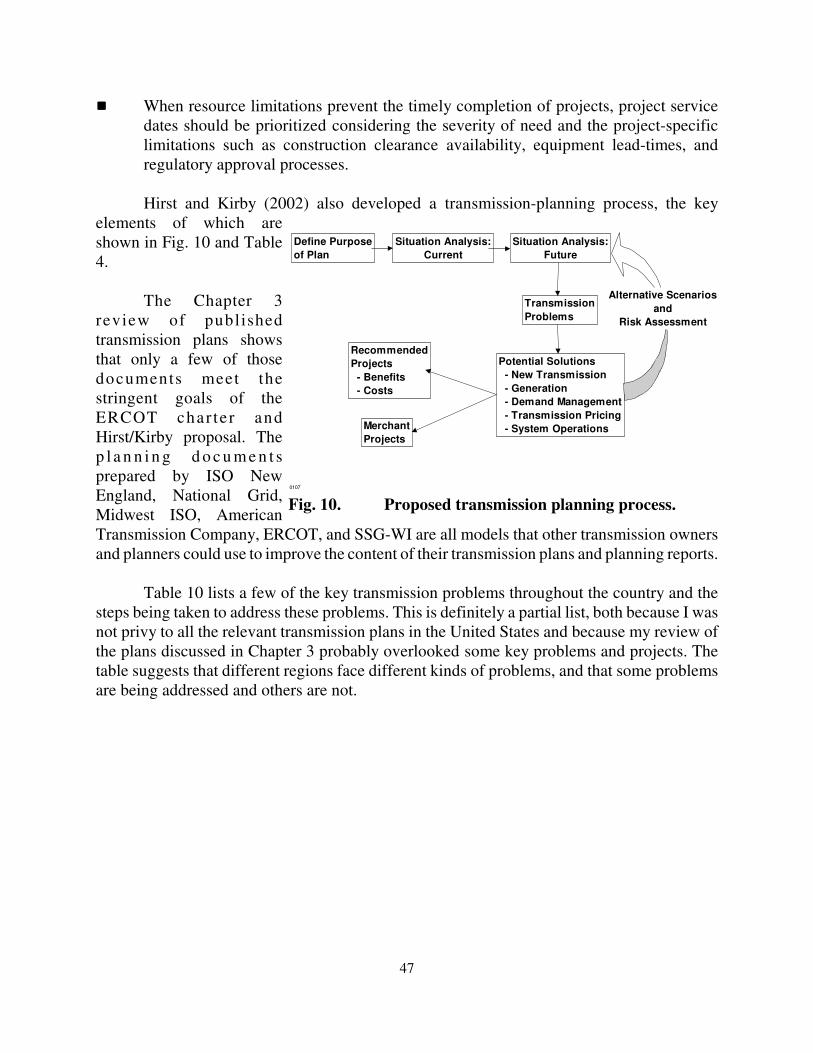
47
0107
Define Purposeof Plan
Situation Analysis:Current
Situation Analysis:Future
TransmissionProblems
Potential Solutions - New Transmission - Generation - Demand Management - Transmission Pricing - System Operations
Alternative Scenariosand
Risk Assessment
RecommendedProjects - Benefits - Costs
MerchantProjects
Fig. 10. Proposed transmission planning process.
���� When resource limitations prevent the timely completion of projects, project servicedates should be prioritized considering the severity of need and the project-specificlimitations such as construction clearance availability, equipment lead-times, andregulatory approval processes.
Hirst and Kirby (2002) also developed a transmission-planning process, the keyelements of which areshown in Fig. 10 and Table4.
The Chapter 3review of publishedtransmission plans showsthat only a few of thosedocuments meet thestringent goals of theERCOT char te r andHirst/Kirby proposal. Thep l a n n i n g d o c u m e n t sprepared by ISO NewEngland, National Grid,Midwest ISO, AmericanTransmission Company, ERCOT, and SSG-WI are all models that other transmission ownersand planners could use to improve the content of their transmission plans and planning reports.
Table 10 lists a few of the key transmission problems throughout the country and thesteps being taken to address these problems. This is definitely a partial list, both because I wasnot privy to all the relevant transmission plans in the United States and because my review ofthe plans discussed in Chapter 3 probably overlooked some key problems and projects. Thetable suggests that different regions face different kinds of problems, and that some problemsare being addressed and others are not.
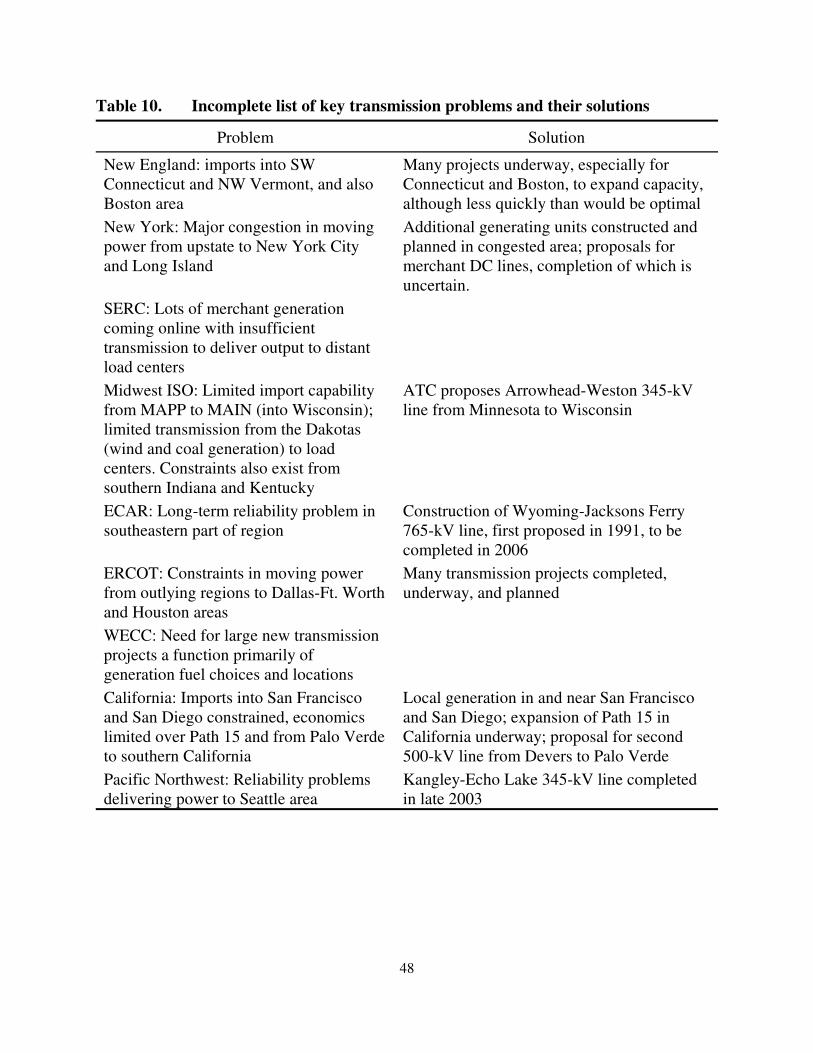
48
Table 10. Incomplete list of key transmission problems and their solutions
Problem Solution
New England: imports into SWConnecticut and NW Vermont, and alsoBoston area
Many projects underway, especially forConnecticut and Boston, to expand capacity,although less quickly than would be optimal
New York: Major congestion in movingpower from upstate to New York Cityand Long Island
Additional generating units constructed andplanned in congested area; proposals formerchant DC lines, completion of which isuncertain.
SERC: Lots of merchant generationcoming online with insufficienttransmission to deliver output to distantload centersMidwest ISO: Limited import capabilityfrom MAPP to MAIN (into Wisconsin);limited transmission from the Dakotas(wind and coal generation) to loadcenters. Constraints also exist fromsouthern Indiana and Kentucky
ATC proposes Arrowhead-Weston 345-kVline from Minnesota to Wisconsin
ECAR: Long-term reliability problem insoutheastern part of region
Construction of Wyoming-Jacksons Ferry765-kV line, first proposed in 1991, to becompleted in 2006
ERCOT: Constraints in moving powerfrom outlying regions to Dallas-Ft. Worthand Houston areas
Many transmission projects completed,underway, and planned
WECC: Need for large new transmissionprojects a function primarily ofgeneration fuel choices and locationsCalifornia: Imports into San Franciscoand San Diego constrained, economicslimited over Path 15 and from Palo Verdeto southern California
Local generation in and near San Franciscoand San Diego; expansion of Path 15 inCalifornia underway; proposal for second500-kV line from Devers to Palo Verde
Pacific Northwest: Reliability problemsdelivering power to Seattle area
Kangley-Echo Lake 345-kV line completedin late 2003
49
CHAPTER 5
CONCLUSIONS
NERC’s (2003d) latest Reliability Assessment noted that
The pace of transmission investment has lagged behind the rate of loadgrowth and generating capacity additions. Many factors have led to thiscondition, including the way in which the grid was developed, viable alternativesto the construction of new transmission lines, and public, regulatory, andfinancial obstacles to the construction of new transmission facilities. In light ofthese factors, it is likely that transmission owners will increasingly rely onsystem upgrades rather than new transmission lines for increased transmissioncapacity.
The North American transmission systems are expected to performreliably. However, in some areas the transmission system is not adequate totransmit the output of all new generating units to their targeted markets, limitingsome economy energy transactions but not adversely impacting reliability.
This assessment is supported by the data NERC collects on installed and plannedtransmission capacity. These data and projections, discussed in Chapter 2, show a continuationof past trends. Transmission owners continue to add transmission capacity at a much lower ratethan consumer demand is growing. These trends are roughly consistent across all 10 reliabilityregions. Interpreting these trends is difficult because details on the types of transmissionconstruction and the problems these investments are meant to solve are not available. While Iconsider these trends troubling, others might view them as an indicator of increased efficiencyof transmission usage or a consequence of the recent construction of gas-fired generation closeto load centers.
However, other analysis indicates that the transmission investments planned for the nextseveral years may not even be enough to replace today’s aging infrastructure let alone meetgrowing demand: “The evidence suggests that investor-owned utilities have reducedtransmission and distribution spending to bare-bones levels, that spending will have to risesignificantly in the near future in order to meet the needs of customers, and that the higher levelof spending will trigger rate hike filings in order to cover the costs of the new capital” (Hyman2004). And U.S. transmission investment as a share of electric revenue declined from 10% in1970 to 6% in 1975, 4% in 1980, and just over 1% from 1985 through 2000 (Boston 2004).
The one exception to these declining trends are the EEI data on investments in newtransmission facilities made by investor-owned utilities. Although these data show the same
50
long-term decline in construction expenditures, the data from 2000 through 2003 showsubstantial increases in transmission investments.
Given the value of these NERC and EEI data for understanding transmission issues,more time and attention should be devoted to ensuring complete reporting by all transmissionowners, expanding the data collected to cover facilities that add capacity but do not add mileageto the transmission system, verifying the accuracy of these data, analyzing them, and reportingthe results of these analyses. Although EIA and FERC collect data on past and projectedtransmission facilities, neither cleans the data nor publishes summaries. Given the importanceof transmission as a policy issue, this situation should change even though tight budgets limitwhat can reasonably be done. EIA (2004) proposes to expand its data collection on Form EIA-412 to include “Transmission System Upgrades” to existing lines (e.g., reconductor line, installdynamic thermal rating, install capacitors, or install reactors) and terminal stations (e.g.,transformer, bus bar, protection system, or switchgear).
The review of transmission plans and related documents (Chapter 3) shows widevariation across utilities and regions. The need for new transmission is not uniform across thecountry; rather, it is very location specific. Krapels (2003) writes that:
“In 90 percent of … the United States, it is challenging, but possible, to establisha mix of generation and transmission assets that constitute an efficient powerinfrastructure. In the other 10 percent, it is extremely difficult to do so, and overtime these areas have evolved into ‘load pockets.’ These are typically denselypopulated areas where generation facilities were built decades ago, are difficultto refurbish (and thus highly polluting) and where transmission grids aresimilarly dated and compressed.
The majority of the people in this country live in that 10 percent of thelandscape. Thus, the central interest in transmission policy should be—butseldom is—in the 10 percent of the landscape that contains the load pockets ofthe power markets.
Locational prices and congestion revenue rights can help stimulate market solutions totransmission problems. By themselves, however, they are probably not enough. And LMPs andCRRs are used in only a few parts of the country where ISOs are well established (NewEngland, New York, and PJM with plans for the Midwest, ERCOT, and California). Thedifficulties merchant projects have experienced recently in obtaining long-term commitmentsfrom users indicates the limits of this approach. PJM just initiated a process to encouragemarket solutions to transmission problems. If market participants do not propose solutionswithin a year, PJM will recommend regulated transmission solutions.
Most of the transmission planned for the next few years is focused on local reliabilityneeds. Other than a few merchant DC projects, I found no plans to build transmission lines toconnect large regions. Although the SSG-WI study discusses several such projects, the region’s
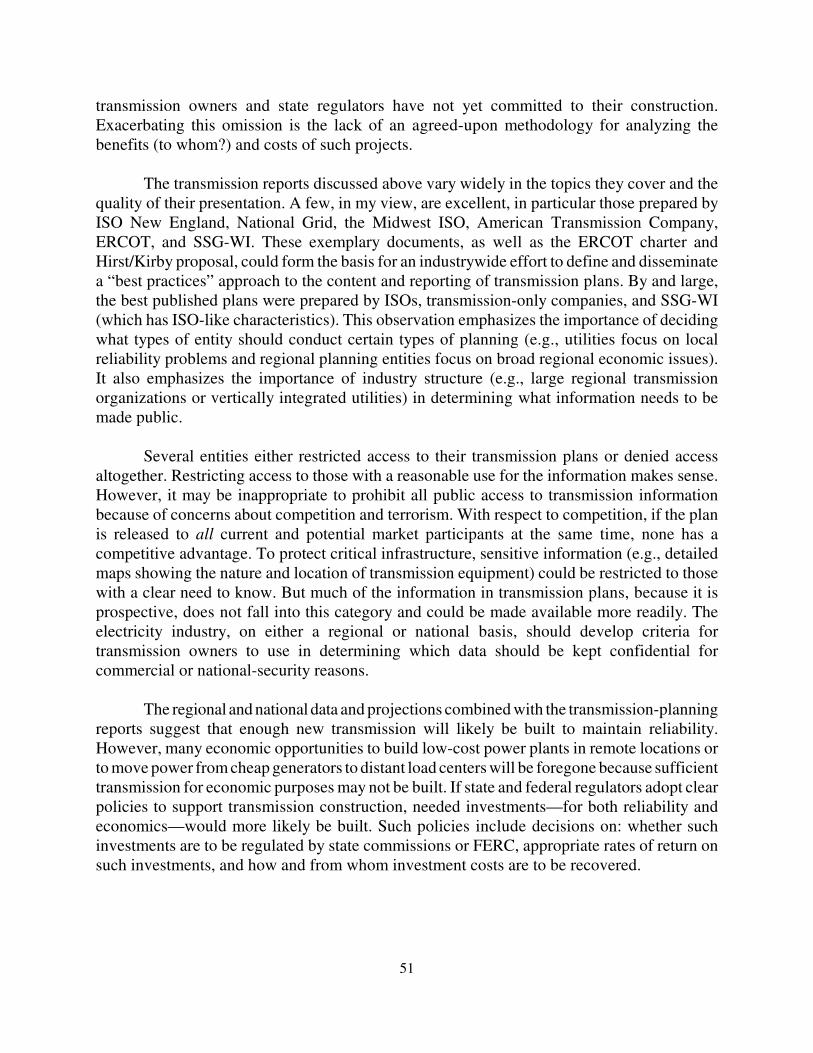
51
transmission owners and state regulators have not yet committed to their construction.Exacerbating this omission is the lack of an agreed-upon methodology for analyzing thebenefits (to whom?) and costs of such projects.
The transmission reports discussed above vary widely in the topics they cover and thequality of their presentation. A few, in my view, are excellent, in particular those prepared byISO New England, National Grid, the Midwest ISO, American Transmission Company,ERCOT, and SSG-WI. These exemplary documents, as well as the ERCOT charter andHirst/Kirby proposal, could form the basis for an industrywide effort to define and disseminatea “best practices” approach to the content and reporting of transmission plans. By and large,the best published plans were prepared by ISOs, transmission-only companies, and SSG-WI(which has ISO-like characteristics). This observation emphasizes the importance of decidingwhat types of entity should conduct certain types of planning (e.g., utilities focus on localreliability problems and regional planning entities focus on broad regional economic issues).It also emphasizes the importance of industry structure (e.g., large regional transmissionorganizations or vertically integrated utilities) in determining what information needs to bemade public.
Several entities either restricted access to their transmission plans or denied accessaltogether. Restricting access to those with a reasonable use for the information makes sense.However, it may be inappropriate to prohibit all public access to transmission informationbecause of concerns about competition and terrorism. With respect to competition, if the planis released to all current and potential market participants at the same time, none has acompetitive advantage. To protect critical infrastructure, sensitive information (e.g., detailedmaps showing the nature and location of transmission equipment) could be restricted to thosewith a clear need to know. But much of the information in transmission plans, because it isprospective, does not fall into this category and could be made available more readily. Theelectricity industry, on either a regional or national basis, should develop criteria fortransmission owners to use in determining which data should be kept confidential forcommercial or national-security reasons.
The regional and national data and projections combined with the transmission-planningreports suggest that enough new transmission will likely be built to maintain reliability.However, many economic opportunities to build low-cost power plants in remote locations orto move power from cheap generators to distant load centers will be foregone because sufficienttransmission for economic purposes may not be built. If state and federal regulators adopt clearpolicies to support transmission construction, needed investments—for both reliability andeconomics—would more likely be built. Such policies include decisions on: whether suchinvestments are to be regulated by state commissions or FERC, appropriate rates of return onsuch investments, and how and from whom investment costs are to be recovered.

52
ACKNOWLEDGMENTS
The work described in this report was funded by the Energy Delivery Group, EdisonElectric Institute and the Office of Electric Transmission and Distribution, Electric MarketsTechnical Assistance Program, U.S. Department of Energy under contract No. DE-AC03-76SF00098 with Lawrence Berkeley National Laboratory. I thank Russell Tucker (EEI), LarryMansueti (DOE), and Charles Goldman (LBNL) for their support throughout the course of thisproject.
I thank John Adams, James Alders, Scott Barnhart, Bill Bojorquez, Jay Caspary, JamesDyer, Chris Eisenbrey, Scott Gass, George Hakun, Michael Henderson, Joseph Hipius, DouglasLarson, John Makens, Bernard Pasternack, Armando Perez, Dean Perry, William Reinke, JerrySmith, Perry Stowe, Brian Silverstein, Peggy Suggs, Ausma Tomsevics, Charles Tyson, JeffreyWebb, and James Whitehead for their help in providing information and insights during thecourse of this project.
I thank John Adams, Grace Anderson, Scott Barnhart, Terry Boston, Vikram Budhraja,Chris Eisenbrey, Wally Gibson, Charles Goldman, George Hakung, John Howe, Joseph Hipius,John Hughes, Brendan Kirby, John Makens, Larry Mansueti, Paul McCoy, Bernard Pasternack,William Reinke, Julie Simon, Marsha Smith, Tracy Terry, and Russell Tucker for their veryhelpful comments on a draft of this report.
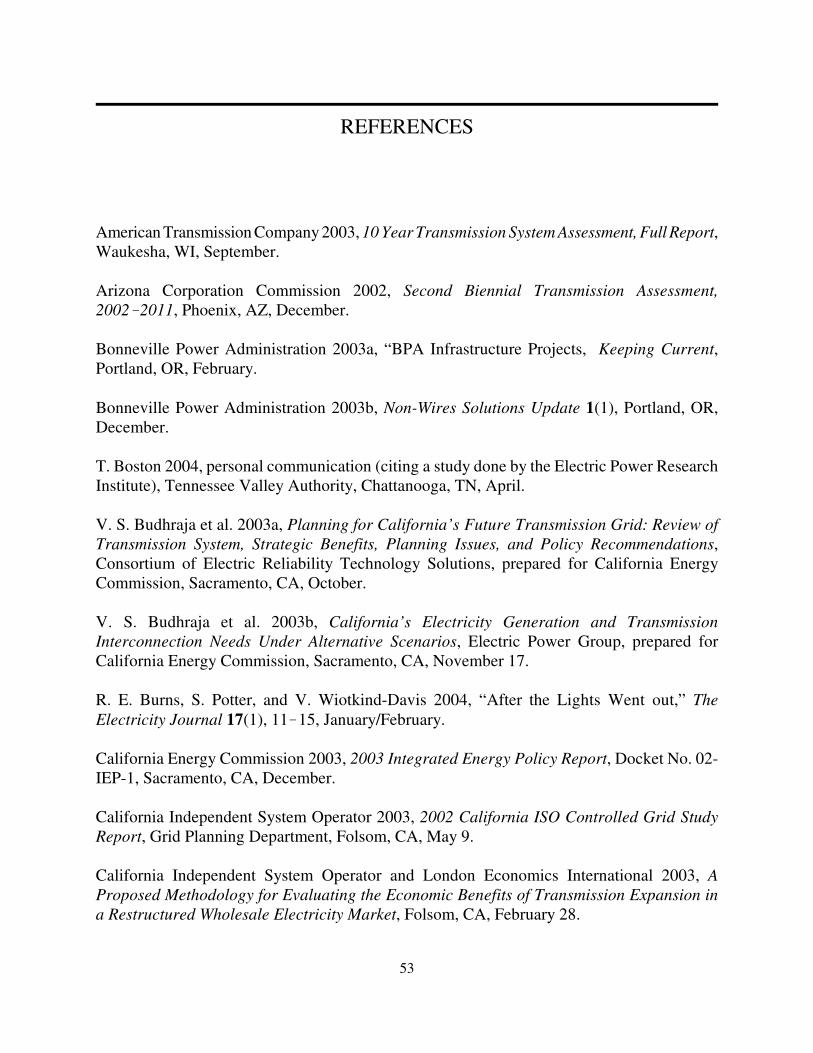
53
REFERENCES
American Transmission Company 2003, 10 Year Transmission System Assessment, Full Report,Waukesha, WI, September.
Arizona Corporation Commission 2002, Second Biennial Transmission Assessment,2002�2011, Phoenix, AZ, December.
Bonneville Power Administration 2003a, “BPA Infrastructure Projects, Keeping Current,Portland, OR, February.
Bonneville Power Administration 2003b, Non-Wires Solutions Update 1(1), Portland, OR,December.
T. Boston 2004, personal communication (citing a study done by the Electric Power ResearchInstitute), Tennessee Valley Authority, Chattanooga, TN, April.
V. S. Budhraja et al. 2003a, Planning for California’s Future Transmission Grid: Review ofTransmission System, Strategic Benefits, Planning Issues, and Policy Recommendations,Consortium of Electric Reliability Technology Solutions, prepared for California EnergyCommission, Sacramento, CA, October.
V. S. Budhraja et al. 2003b, California’s Electricity Generation and TransmissionInterconnection Needs Under Alternative Scenarios, Electric Power Group, prepared forCalifornia Energy Commission, Sacramento, CA, November 17.
R. E. Burns, S. Potter, and V. Wiotkind-Davis 2004, “After the Lights Went out,” TheElectricity Journal 17(1), 11�15, January/February.
California Energy Commission 2003, 2003 Integrated Energy Policy Report, Docket No. 02-IEP-1, Sacramento, CA, December.
California Independent System Operator 2003, 2002 California ISO Controlled Grid StudyReport, Grid Planning Department, Folsom, CA, May 9.
California Independent System Operator and London Economics International 2003, AProposed Methodology for Evaluating the Economic Benefits of Transmission Expansion ina Restructured Wholesale Electricity Market, Folsom, CA, February 28.

54
J. Dyer 2003, U.S. Department of Energy Transmission Bottleneck Project Report, ElectricPower Group, prepared for Consortium of Electric Reliability Technology Solutions, Pasadena,CA, March 19.
Edison Electric Institute 2003, Statistical Yearbook of the Electric Utility Industry, 2001 DataWith Preview 2002 Data, Washington, DC, May.
Electric Reliability Council of Texas 2003a, Report on Existing and Potential Electric SystemConstraints and Needs Within the ERCOT Region, Taylor, TX, October 1.
Electric Reliability Council of Texas 2003b, Power System Planning Charter and Process,Taylor, TX, October 22.
Energy Information Administration 2001, “Annual Electric Industry Financial Report,” FormEIA-412 (2001), U.S. Department of Energy, Washington, DC.
Energy Information Administration 2002, “Coordinated Bulk Power Supply Program Report,”Form EIA-411 (2002), U.S. Department of Energy, Washington, DC.
Energy Information Administration 2004, “Agency Information Collection Activities: ProposedCollection; Comment Request,” Federal Register 69(64), Washington, DC, April 2.
GF Energy 2004, 2004 Electricity Outlook, Washington, DC, January.
Florida Reliability Coordinating Council 2003, 2003 Regional Load & Resource Plan, Tampa,FL, July.
J. French 2004, personal communication, Transmission Business Line, Bonneville PowerAdministration, Portland, OR, January.
S. Gass 2004, personal communication, PJM Interconnection, LLC, Norristown, PA, March.
J. Hipius 2004, personal communication, National Grid, Syracuse, NY, January.
E. Hirst 2000, Expanding U.S. Transmission Capacity, Edison Electric Institute, Washington,DC, August.
E. Hirst and B. Kirby 2001, Transmission Planning for a Restructuring U.S. ElectricityIndustry, Edison Electric Institute, Washington, DC, June.
E. Hirst and B. Kirby 2002, “Expanding Transmission Capacity: A Proposed PlanningProcess,” The Electricity Journal 15(8), 54�59, October.
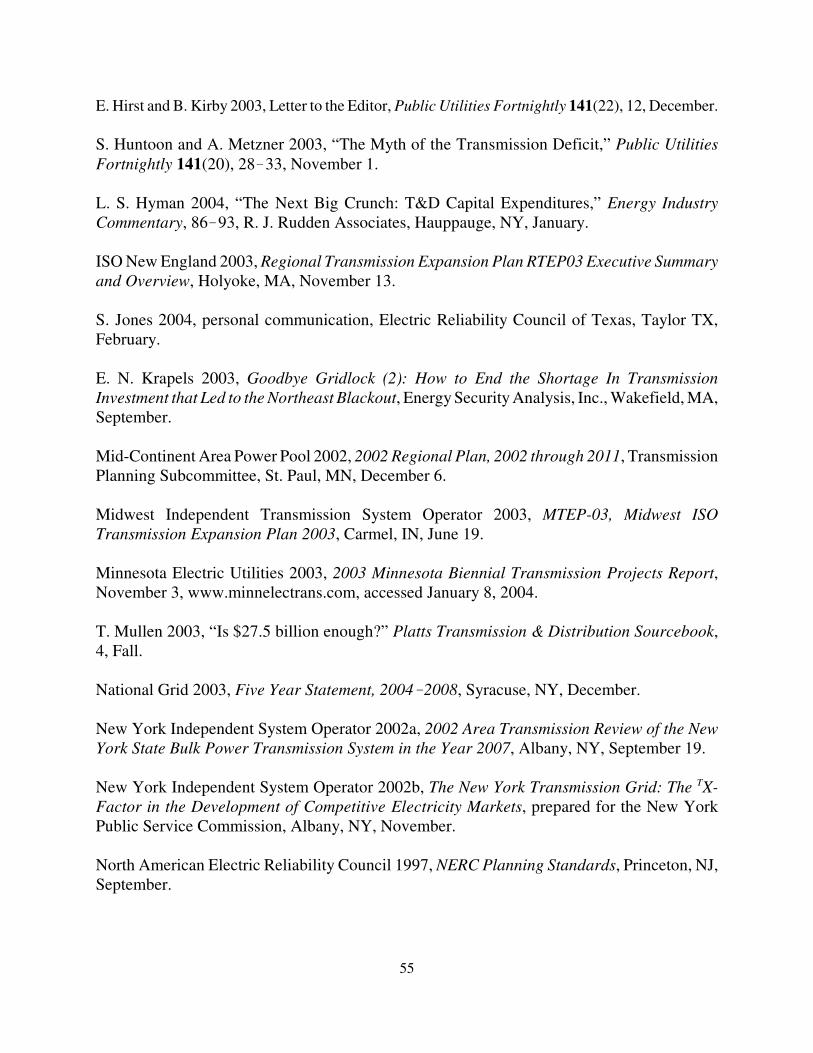
55
E. Hirst and B. Kirby 2003, Letter to the Editor, Public Utilities Fortnightly 141(22), 12, December.
S. Huntoon and A. Metzner 2003, “The Myth of the Transmission Deficit,” Public UtilitiesFortnightly 141(20), 28�33, November 1.
L. S. Hyman 2004, “The Next Big Crunch: T&D Capital Expenditures,” Energy IndustryCommentary, 86�93, R. J. Rudden Associates, Hauppauge, NY, January.
ISO New England 2003, Regional Transmission Expansion Plan RTEP03 Executive Summaryand Overview, Holyoke, MA, November 13.
S. Jones 2004, personal communication, Electric Reliability Council of Texas, Taylor TX,February.
E. N. Krapels 2003, Goodbye Gridlock (2): How to End the Shortage In TransmissionInvestment that Led to the Northeast Blackout, Energy Security Analysis, Inc., Wakefield, MA,September.
Mid-Continent Area Power Pool 2002, 2002 Regional Plan, 2002 through 2011, TransmissionPlanning Subcommittee, St. Paul, MN, December 6.
Midwest Independent Transmission System Operator 2003, MTEP-03, Midwest ISOTransmission Expansion Plan 2003, Carmel, IN, June 19.
Minnesota Electric Utilities 2003, 2003 Minnesota Biennial Transmission Projects Report,November 3, www.minnelectrans.com, accessed January 8, 2004.
T. Mullen 2003, “Is $27.5 billion enough?” Platts Transmission & Distribution Sourcebook,4, Fall.
National Grid 2003, Five Year Statement, 2004�2008, Syracuse, NY, December.
New York Independent System Operator 2002a, 2002 Area Transmission Review of the NewYork State Bulk Power Transmission System in the Year 2007, Albany, NY, September 19.
New York Independent System Operator 2002b, The New York Transmission Grid: The TX-Factor in the Development of Competitive Electricity Markets, prepared for the New YorkPublic Service Commission, Albany, NY, November.
North American Electric Reliability Council 1997, NERC Planning Standards, Princeton, NJ,September.
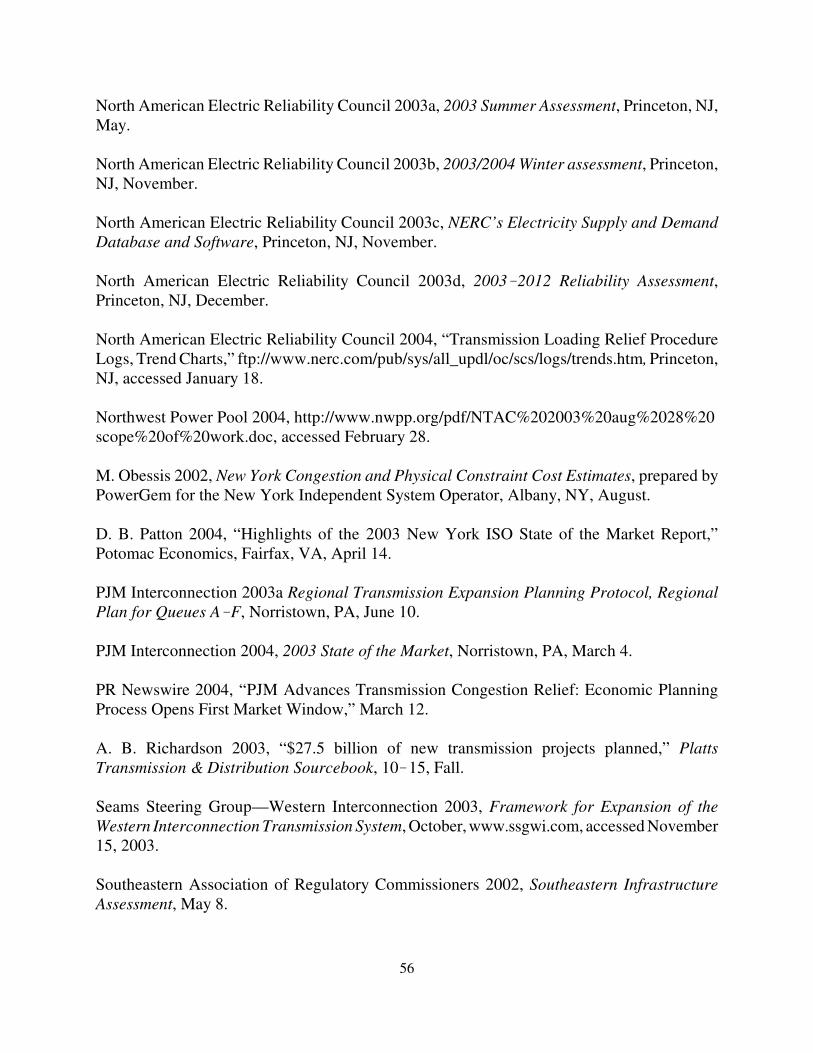
56
North American Electric Reliability Council 2003a, 2003 Summer Assessment, Princeton, NJ,May.
North American Electric Reliability Council 2003b, 2003/2004 Winter assessment, Princeton,NJ, November.
North American Electric Reliability Council 2003c, NERC’s Electricity Supply and DemandDatabase and Software, Princeton, NJ, November.
North American Electric Reliability Council 2003d, 2003�2012 Reliability Assessment,Princeton, NJ, December.
North American Electric Reliability Council 2004, “Transmission Loading Relief ProcedureLogs, Trend Charts,” ftp://www.nerc.com/pub/sys/all_updl/oc/scs/logs/trends.htm, Princeton,NJ, accessed January 18.
Northwest Power Pool 2004, http://www.nwpp.org/pdf/NTAC%202003%20aug%2028%20scope%20of%20work.doc, accessed February 28.
M. Obessis 2002, New York Congestion and Physical Constraint Cost Estimates, prepared byPowerGem for the New York Independent System Operator, Albany, NY, August.
D. B. Patton 2004, “Highlights of the 2003 New York ISO State of the Market Report,”Potomac Economics, Fairfax, VA, April 14.
PJM Interconnection 2003a Regional Transmission Expansion Planning Protocol, RegionalPlan for Queues A�F, Norristown, PA, June 10.
PJM Interconnection 2004, 2003 State of the Market, Norristown, PA, March 4.
PR Newswire 2004, “PJM Advances Transmission Congestion Relief: Economic PlanningProcess Opens First Market Window,” March 12.
A. B. Richardson 2003, “$27.5 billion of new transmission projects planned,” PlattsTransmission & Distribution Sourcebook, 10�15, Fall.
Seams Steering Group—Western Interconnection 2003, Framework for Expansion of theWestern Interconnection Transmission System, October, www.ssgwi.com, accessed November15, 2003.
Southeastern Association of Regulatory Commissioners 2002, Southeastern InfrastructureAssessment, May 8.
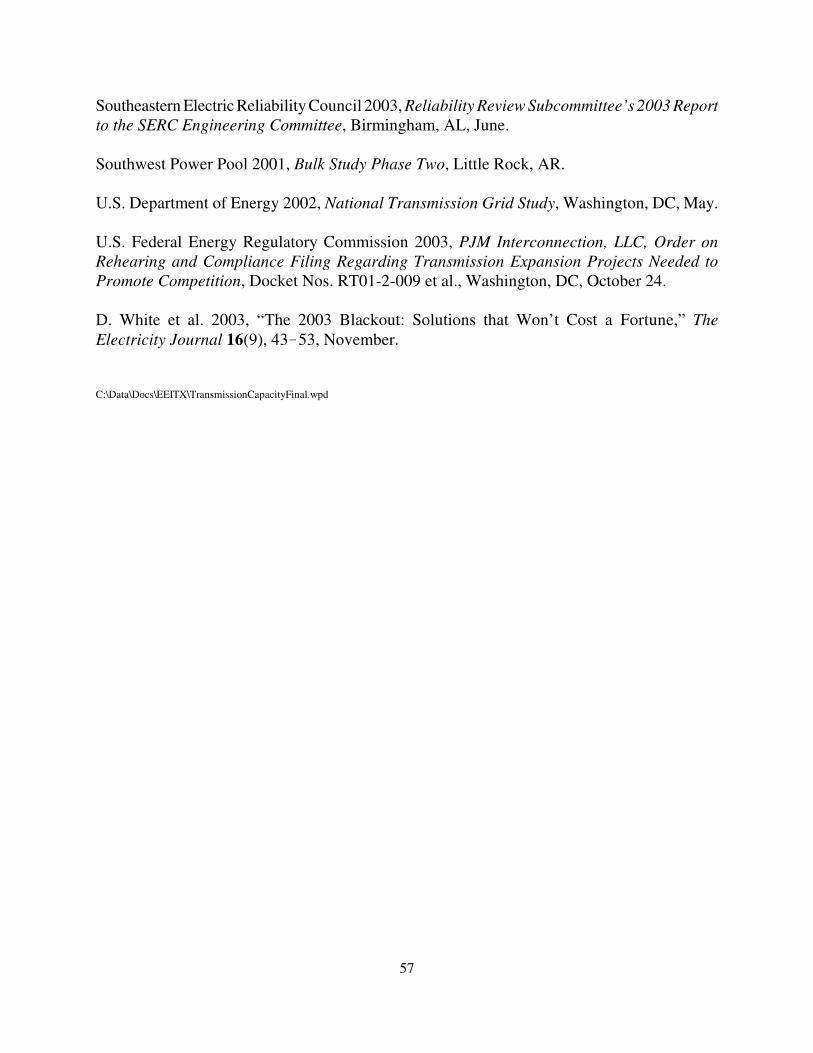
57
Southeastern Electric Reliability Council 2003, Reliability Review Subcommittee’s 2003 Reportto the SERC Engineering Committee, Birmingham, AL, June.
Southwest Power Pool 2001, Bulk Study Phase Two, Little Rock, AR.
U.S. Department of Energy 2002, National Transmission Grid Study, Washington, DC, May.
U.S. Federal Energy Regulatory Commission 2003, PJM Interconnection, LLC, Order onRehearing and Compliance Filing Regarding Transmission Expansion Projects Needed toPromote Competition, Docket Nos. RT01-2-009 et al., Washington, DC, October 24.
D. White et al. 2003, “The 2003 Blackout: Solutions that Won’t Cost a Fortune,” TheElectricity Journal 16(9), 43�53, November.
C:\Data\Docs\EEITX\TransmissionCapacityFinal.wpd