Embed Size (px)
Citation preview

FUTAJEET 8 (2) (2014) (82-90)
Transmission Capacity Enhancement for Nigerian Power Transmission Grid using TCSC and UPFC
Melodi A.O. and Akinloye B.O. Department of Electrical and Electronics Engineering, Federal University of Technology, Akure
A B S T R A C T
Keywords:
UPFC,
TCSC,
Optimal Location,
Pay-Back-Period,
330 kV Grid
Correspondence:Tel: +2348037704625
E-mail address: [email protected]
82
This study aimed to evaluate the application of Flexible Alternating Current Transmission System (FACTS) for
enhancing transmission capacity (TC) of existing lines in Nigeria's 330 kV power transmission grid (PTG). Two
FACTS devices, Thyristor Controlled Series Converter (TCSC) and Unified Power Flow Controller (UPFC), were
considered and their installation modeled. The PTG was modeled as a complex 28-bus system. Load flow in the PTG
was carried out using Newton-Raphson algorithm – coded and implemented in MATLAB. Optimal locations of the
respective devices were determined using computation of load flow and known sensitivity functions. The required
capacities and pay-back-periods (PBP) on the devices were evaluated using PBP and cumulative gain functions.
The results show that the TC of the existing PTG can be enhanced by installing a TCSC in Ikeja-Ayede single circuit
line and a UPFC in Jos-Gombe single circuit line. PBP analysis showed that investment in TCSC and UPFC will be
recouped in about 3 months and 6 years respectively. This assessment shows that TCSC and UPFC can be deployed
for improving the TC of Nigeria's PTG effectively.
1. Introduction
Over the years in Nigeria's power system, the total regional
demands for power exceeded both the generation and transmission
capacities. The solution to generation adequacy is time intensive. The
existing generation increment obtainable from Independent Power
Projects (IPP) and repair of existing generating units requires
immediate reinforced transmission corridors of network for power
supply to consumers. Finding solutions to this prevailing state have
been proposed in the system.
Considering the current privatization and deregulation initiative, the
power industry in Nigeria is expected to experience a rapid growth in
generation of electrical energy to fully meet the National demand. A
consequence of this is the need to commensurately reinforce the
existing transmission lines (TLs) to carry the increased load. The
choice of improving the existing TLs is considered in this study
because of the severe limitation in resources and environmental
concerns of constructing new TLs (Abido, 2009).
This study is aimed to evaluate the application of selected Flexible
Alternating Current Transmission Systems (FACTS) devices to
improve the transmission capacity (TC) and prole of existing
transmission network. Thyristor Controlled Series Converter (TCSC)
and Unied Power Flow Controller (UPFC), FACTS devices, which
are not in use in Nigeria's system, were considered.
A TCSC is a series-controlled capacitive reactance that can provide
continuous control of power on the ac line over a wide range. TCSC
functioning can be modeled as shown in Figure 1 (Seyed and Hadi,
2008). TCSC injects voltage in series with the line, and either
supplies or consumes variable reactive power during operation
(Georgilakis and Vernados, 2011).
Figure 1: Impedance Diagram of TCSC Connection in TL.
The UPFC injects current into the TL with the shunt part of its
controller, and voltage in series with the line using the series part of
its controller. Connection model of UPFC to the TL and the
equivalent circuit are as shown in Figure 2 (Seyed and Hadi, 2008). A
series inserted voltage (SIV) and its phase angle are introduced into
the TL. The SIV is 10% of the nominal voltage of the TL. The UPFC
consists of a shunt and a series transformers, and two voltage source
converters (VSC) that have a common capacitor between them. The
U shunt is the shunt voltage and the Useries is the series voltage
injected by the series transformer.
According to Sayed and Hadi (2008), the application of these
FACTS devices can be economically effective if well located. For
this to be realized, it is pertinent to connect the devices at the
appropriate line (where needed). To achieve this, Sayed and Hadi

Melodi and Akinloye / FUTAJEET 8 (2) (2014) (82-90) 83
Figure 3: Graphical Display of Process Stages by Simulation (Produced by Metso Minerals)
B’KEBBI T.S KAINJI G.S
JEBBA G.S JEBBA T.S SHIRORO G.S
KADUNA T.S
OSOGBO T.S National Control Center
IKEJA T.S
EGBIN G.S AES G.S
AKANGBAT.
S
AJA T.S
AYEDE T.S
KATAMPE T.S
KANO T.S
JOS T.S GOMBE T.S
BENIN T.S ONITSHA T.S
ALAOJI T.S ALAOJI G.S
AJAOKUTA T.S
N/HAVEN T.S
DELTA G.S
SAPELE T.S
ALADJA T.S
AFAM G.S
OKPAI T.S
2
3
4
5
6
7
8 9
10
11
12
13
14
15
16
17 18
19
20 21
22
23
24
25
26
27
28
1
(2008) suggested the use of a method based on the sensitivity of the
total system reactive power loss with respect to the control variables.
This method is adopted for this study.
Three specific tasks were carried out and presented in this study:
determining required capacities of FACTS devices; their respective
locations for best TC improvement in Nigeria's transmission
corridors; and cost effectiveness or PBP on such technical
investment. Nigeria's 330 kV 28-bus PTG is as shown in Figure 3
Figure 2: (a) Single Line Structure of UPFC; and (b) Impedance Diagram of Connection of UPFC to TL.
2. Methodology
In order to achieve the study aim, algorithms of specific tasks
were carried out as follows.
a) Power Flow in existing PTG with and without TCSC and
UPFC
Normal mode power flow computations incorporating TCSC
and UPFC models were carried out using Newton-Raphson method
(NRM), which was coded and implemented in Matlab. The applied
equations of state in the power flow algorithm for the PTG are as in
Equations 1 to 15 (Acharya and Mithulanantha, 2006).
According to Acharya and Mithulanantha (2006), active and reactive
p o w e r fl o w s i n l i n e s , b e t w e e n t h e b u s e s
I and j , are evaluated using
Melodi and Akinloye / FUTAJEET 8 (2) (2014) (82-90)84
16 was adopted to determine the appropriate line for the TCSC
device (Habur and O'Leans, 2004);
where α , is the sensitivity of the line to reactive power loss, ∂Q is ij L
the change in the reactive power loss, ∂x is the change in the ij
reactance of the line connecting buses i and j. The values of α i j
indicated the expected optimal location of the device; TCSC is
placed on the line with the lowest absolute value of α The results ij
obtained for α is presented in Figure 5.Equation 17, according to ij
Kowsalya et al , was used to determine the appropriate bus for the
UPFC device:
where Y is the bus admittance, V is generator bus voltage, V bus gen regrouped
is the regrouped load bus voltage, and L is the voltage stability index
of the bus. UPFC is placed at the line with the highest value of L.
The flow chart for implementing power flow algorithm is as shown
in Figure 4. The input data are the lines and the bus parameters and
bus loads (R, X, I , P, Q, etc). ΔP = P - P are the real power at buses MAX i j
I and j respectively. ‘t’ is the number of iterations.
c) Loading Test by Thermal Rating
The loading coefficients of the lines were calculated using Equation
18
where LC is the loading Coefficients of the lines, P is the active ij
th power flowing in line connecting buses i and j and P is the thermal ij
limit constraint of the lines. The existing 330 kV transmission system
uses double and single circuit twin Bison Aluminium Conductors,
Steel Reinforced (ACSR) overhead lines. Bison is a 350 mm2
conductor, with a continuous current rating of about 680 A per
conductor, which equates to a continuous maximum thermal limit
for each circuit of 777.3 MVA.
d) Pay-Back Period Analysis
The range of cost of major FACTS devices is presented in
Siemens AG Database (Habur and O'Leans, 2004). Based on this, a
polynomial cost function of FACTS devices is proposed and used in
(Cai, Erlich, and Stamtsis, 2004) for FACTS allocation. The cost
function of TCSC (C ) is given by Equation 19 in US$/kvar.tcsc
Then, the cost function of UPFC (C ) is given by Equation 20UPFC
where C is the cost of TCSC in US$/kvar and .S and S are TCSC TCSC UFFC
where
δij=δi - δj, Vi, δi, Vj, δi are voltages and angles in buses i and j respectively
Gij is line conductan cef,or B ij is line susceptance, and
Active and reactive power flows between the buses j and i are given by
[7];
where Vm is the magnitude of voltage in the data collected from the
utility.
For TCSC, injected powers are modelled as follows (Chung and
Li, 2001; Gerbex, Cherkaoui, and Germond, 2001; Cai, Erlich, and
Stamtsis, 2004); P , P , Q
buses I and j
where ΔGis the conductance and Δ B
joining buses I and j
For UPFC, the injected powers are modeled as (Chung and Li,
2001; Cai, Erlich, and Stamtsis, 2004):
where Ø is the phase angle of inserted voltage by Unified Power
Flow Controller(UPFC).
b) Optimal Location of FACTS Devices.
For the benefit-cost ratio of applying a FACTS device to be maximal, it
must be placed at the correct and needed line in the network. Equation

Melodi and Akinloye / FUTAJEET 8 (2) (2014) (82-90) 85
YES
NO
Input data (bus and line data)
Form Admittance Matrix
Give Voltage and Voltage angle initial values Vm
(0) and θ(0)
t=0
Calculate ΔP(t), ΔQ(t) accordingly
Modify ΔP(t) and ΔQ(t) by FACTS inclusion
Form the Jacobian matrix with FACTS parameters included
Calculate mismatch vector /ΔP/,/ ΔQ/
Convergent norm/ΔP(t), ΔQ(t) /<?
Norm//Δ
Output Result
Update Vmi and θi using Xit+1=Xi +ΔXi
t
t = t + 1
Calculate ΔVm and Δθ using ΔX= J/ΔM Compute
CFACTS
NO
are the operating range of TCSC and UPFC respectively in Mvar
The operating range is the difference of the reactive power of
the line before and after installation of the device (Hasma, Ismail, and
Muhammad, 2010). This is expressed as in Equation 21:
Where Qij is the reactive power ow through the branch before device ‘d’ installation and Q is the reactive power flow through the branch i,j
after the installation of device 'd' (TCSC or UPFC). The results
obtained for S 'd' is presented in Table 4.
Pay-Back-Period on investment in FACTS devices was
evaluated using
where IC is the net investment cost on FACTS device C is per ‘d’ ‘d’
kvar cost of device (Equations 19 and 20), C is the conversion rate rate
from dollars to naira ( C = 160 ₦ / $ ), C is per unit cost of energy rate s
(11.35 ₦ / k W.hr), ∆P or ΔP ‘d’ is active power gain from ‘d’ i,j
installation of device, T is hours in month (T = 720 hrs). PBP is op op ‘d’
in Table 4.‘d’ The cumulative gain on the devices CG versus time t in t
months is obtained and plotted using:
whereα is the discount factor is the percentage
discount per annum (x% taken as 4.25%)
3. Results
The values of the variables and indexes considered in this study are
presented in this section as Figures 5 to 9 and Tables 1 to 4.
Figure 4: Flow Chart For Newton Raphson Algorithm
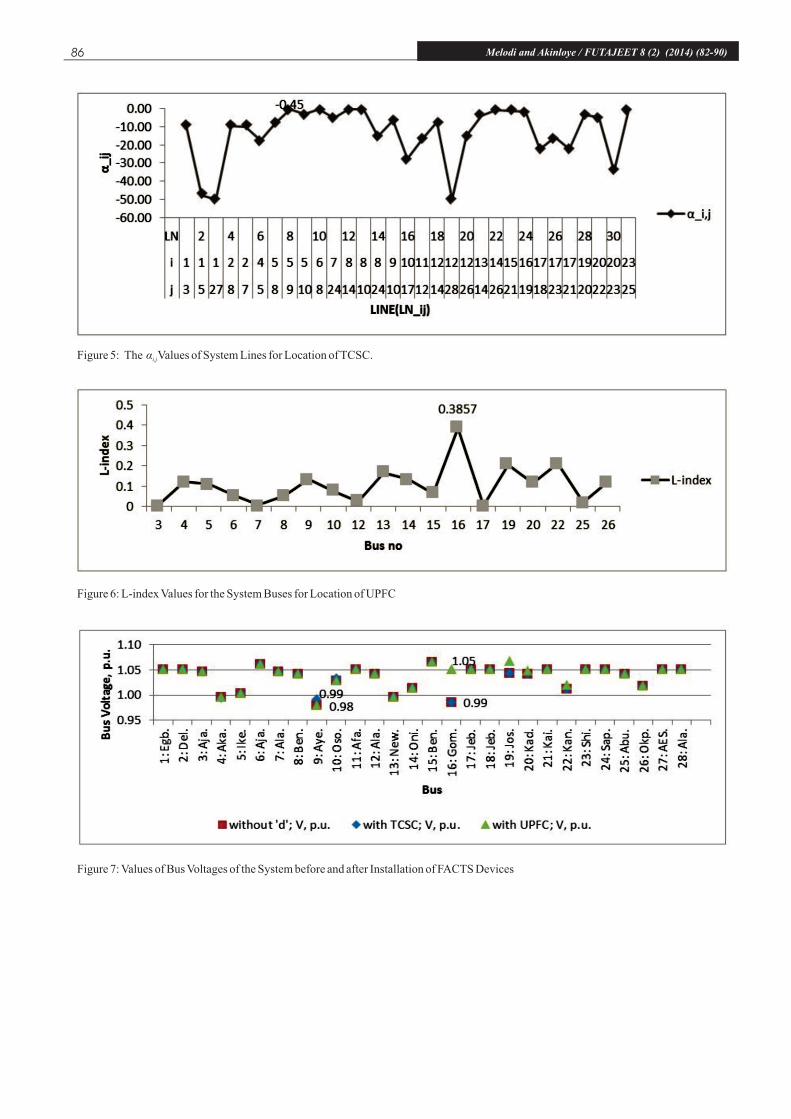
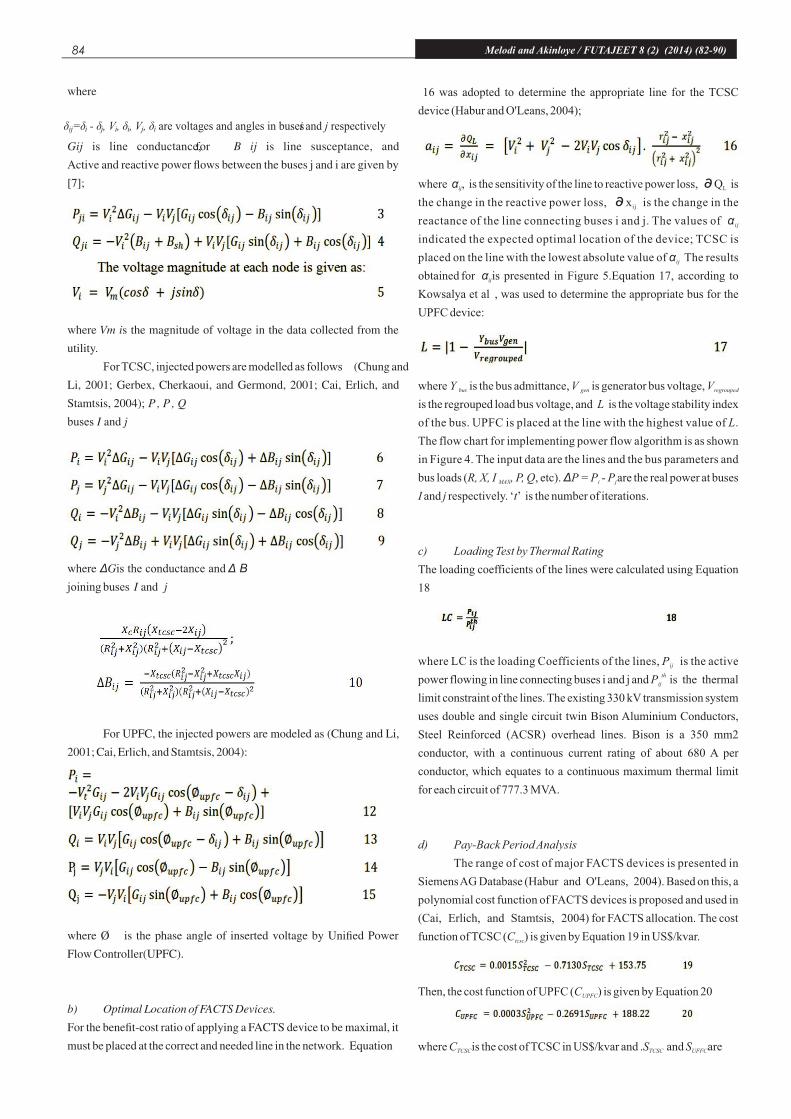
Figure 5: The α Values of System Lines for Location of TCSC.i,j
Figure 6: L-index Values for the System Buses for Location of UPFC
Figure 7: Values of Bus Voltages of the System before and after Installation of FACTS Devices
Melodi and Akinloye / FUTAJEET 8 (2) (2014) (82-90)86
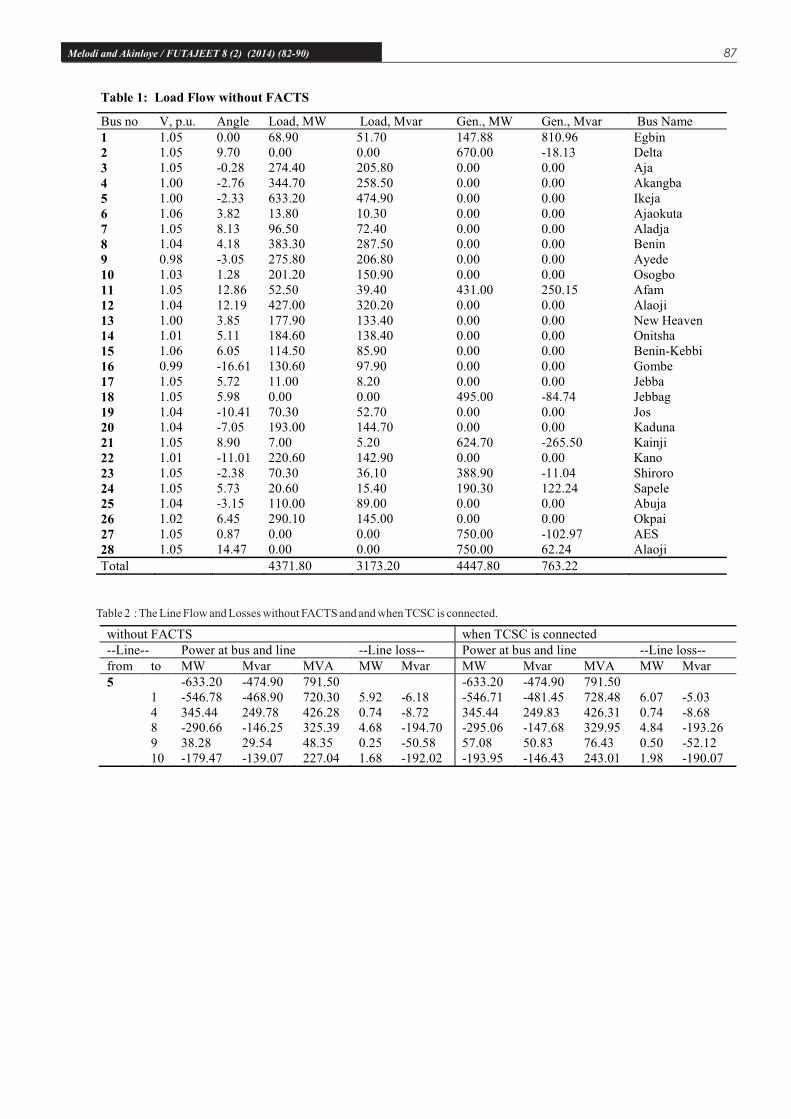
Table 2 : The Line Flow and Losses without FACTS and and when TCSC is connected.
Melodi and Akinloye / FUTAJEET 8 (2) (2014) (82-90) 87
Table 1: Load Flow without FACTS
Bus no V, p.u. Angle Load, MW Load, Mvar Gen., MW Gen., Mvar Bus Name 1 1.05 0.00 68.90 51.70 147.88 810.96 Egbin 2 1.05 9.70 0.00 0.00 670.00 -18.13 Delta 3 1.05 -0.28 274.40 205.80 0.00 0.00 Aja 4 1.00 -2.76 344.70 258.50 0.00 0.00 Akangba 5 1.00 -2.33 633.20 474.90 0.00 0.00 Ikeja 6 1.06 3.82 13.80 10.30 0.00 0.00 Ajaokuta 7 1.05 8.13 96.50 72.40 0.00 0.00 Aladja 8 1.04 4.18 383.30 287.50 0.00 0.00 Benin 9 0.98 -3.05 275.80 206.80 0.00 0.00 Ayede 10 1.03 1.28 201.20 150.90 0.00 0.00 Osogbo 11 1.05 12.86 52.50 39.40 431.00 250.15 Afam 12 1.04 12.19 427.00 320.20 0.00 0.00 Alaoji 13 1.00 3.85 177.90 133.40 0.00 0.00 New Heaven 14 1.01 5.11 184.60 138.40 0.00 0.00 Onitsha 15 1.06 6.05 114.50 85.90 0.00 0.00 Benin-Kebbi 16 0.99 -16.61 130.60 97.90 0.00 0.00 Gombe 17 1.05 5.72 11.00 8.20 0.00 0.00 Jebba 18 1.05 5.98 0.00 0.00 495.00 -84.74 Jebbag 19 1.04 -10.41 70.30 52.70 0.00 0.00 Jos 20 1.04 -7.05 193.00 144.70 0.00 0.00 Kaduna 21 1.05 8.90 7.00 5.20 624.70 -265.50 Kainji 22 1.01 -11.01 220.60 142.90 0.00 0.00 Kano 23 1.05 -2.38 70.30 36.10 388.90 -11.04 Shiroro 24 1.05 5.73 20.60 15.40 190.30 122.24 Sapele 25 1.04 -3.15 110.00 89.00 0.00 0.00 Abuja 26 1.02 6.45 290.10 145.00 0.00 0.00 Okpai 27 1.05 0.87 0.00 0.00 750.00 -102.97 AES 28 1.05 14.47 0.00 0.00 750.00 62.24 Alaoji
Total 4371.80 3173.20 4447.80 763.22
without FACTS when TCSC is connected --Line-- Power at bus and line --Line loss-- Power at bus and line --Line loss-- from to MW Mvar MVA MW Mvar MW Mvar MVA MW Mvar 5 -633.20 -474.90 791.50 -633.20 -474.90 791.50 1 -546.78 -468.90 720.30 5.92 -6.18 -546.71 -481.45 728.48 6.07 -5.03 4 345.44 249.78 426.28 0.74 -8.72 345.44 249.83 426.31 0.74 -8.68 8 -290.66 -146.25 325.39 4.68 -194.70 -295.06 -147.68 329.95 4.84 -193.26 9 38.28 29.54 48.35 0.25 -50.58 57.08 50.83 76.43 0.50 -52.12 10 -179.47 -139.07 227.04 1.68 -192.02 -193.95 -146.43 243.01 1.98 -190.07
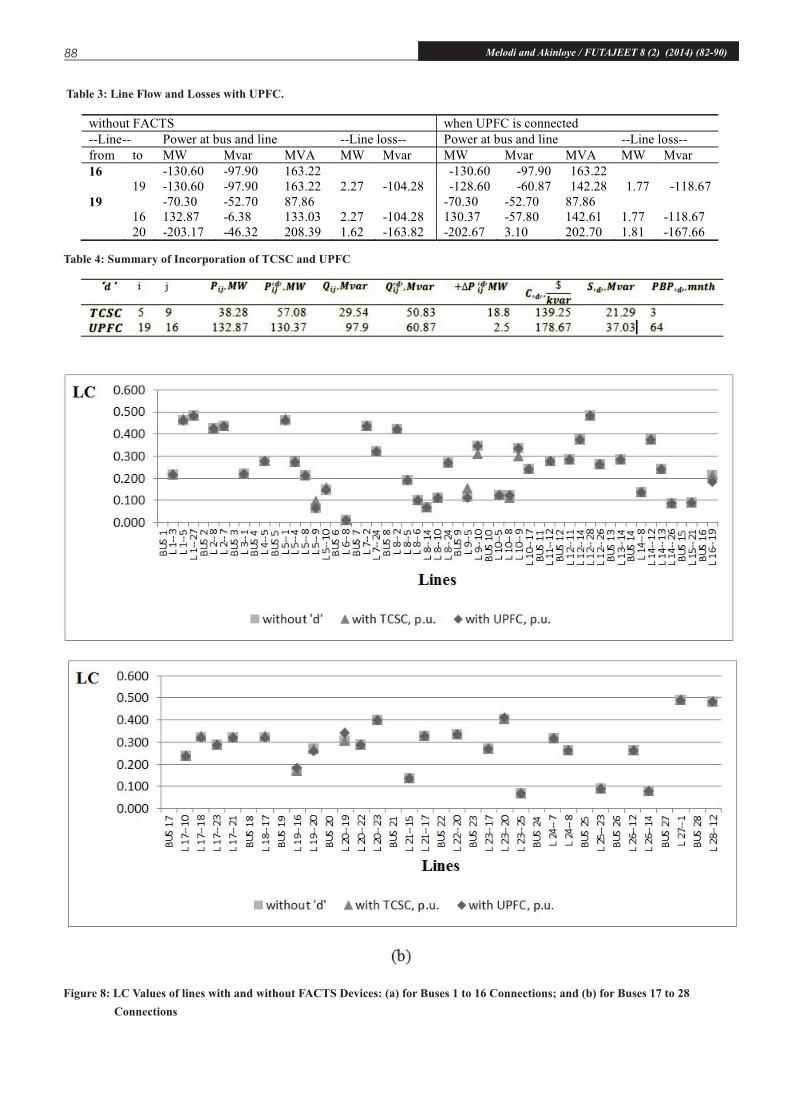
Table 3: Line Flow and Losses with UPFC.
Table 4: Summary of Incorporation of TCSC and UPFC
Figure 8: LC Values of lines with and without FACTS Devices: (a) for Buses 1 to 16 Connections; and (b) for Buses 17 to 28
Connections
Melodi and Akinloye / FUTAJEET 8 (2) (2014) (82-90)
without FACTS when UPFC is connected --Line-- Power at bus and line --Line loss-- Power at bus and line --Line loss-- from to MW Mvar MVA MW Mvar MW Mvar MVA MW Mvar 16 -130.60 -97.90 163.22 -130.60 -97.90 163.22 19 -130.60 -97.90 163.22 2.27 -104.28 -128.60 -60.87 142.28 1.77 -118.67 19 -70.30 -52.70 87.86 -70.30 -52.70 87.86 16 132.87 -6.38 133.03 2.27 -104.28 130.37 -57.80 142.61 1.77 -118.67 20 -203.17 -46.32 208.39 1.62 -163.82 -202.67 3.10 202.70 1.81 -167.66
88

Melodi and Akinloye / FUTAJEET 8 (2) (2014) (82-90) 89
Figure 9 : Graph of Cumulative Gain versus Months.
Without the installation of these FACTS devices in the grid, Table 1
shows that the equivalent generated power in the existing system is
approximately Without the installation of these FACTS devices in the
grid, Table 1 shows that the equivalent generated power in the existing
system is approximately 4.45 + j0.76 GVA, and the equivalent
network load is 4.37 + j3.17GVA; and the bus voltages range from
0.98 to 1.06 p.u. of nominal voltage, which is within standard
permissible range. From these values, active network losses are
approximately 80 MW (2%).
However, the values of αi,j in Figure 5 show that the weakest link or
the expected optimal location of TCSC (EOL) is line 5-9 (Ikeja-Ayede
line) where α1,5 is the highest (-0.45). Values of the voltage stability
index (L-index) in Figure 6 shows that the (EOL) for UPFC is bus 16
(Gombe), which is the bus with the highest L-index (approximately
0.4).
Tables 1 to 3 and Figure 7 show that on application of TCSC in
line 5-9, it facilitated an improvement in voltage from 0.98 to 0.99 p.u.
in receiving transmission station bus 9, which is an increase in voltage
stability capability (VSCap) of the line; this facilitates the possibility
of increase in power ow from 38.28MW to 57.08MW with higher
VSCap.These results show that the TCSC can be deployed to improve
the TC of weak regional link-lines of the Nigerian grid significantly in
normal operating mode. For UPFC on bus 16 (Gombe), Figure 7
shows an improvement in voltage from 0.99 to 1.05 p.u., further
improving the VSCap and a corresponding gain of approximately 2.5
MW (Table 4) in TC of line 19-16 (Jos-Gombe) line in the
northeastern region of the national grid.
Also, with the observed gains on installation of these FACTS
devices, the thermal capacity reserves of all lines, indicated by LC
values in Figure 8, remained substantial (all values of LC were less
than 50%).Table 4 and Figure 9 show that installing TCSC and UPFC
for improved TC in the system for normaml ode operation have
relatively short payback periods of 3 and 64 months respectively, i.e.
– less than a year to about 5 years and 4 months respectively. In
addition, this shows that with the observed scenarios of weak links in
the grid, the application of UPFC is far more expensive compared to
TCSC.
4. Conclusion
In this paper, normal steady mode load ow calculation based on
Newton-Raphson algorithm was used to evaluate the load ow
effect of applying TCSC and UPFC in the 28-bus model of Nigeria's
330kV PTG. The results showed that, using TCSC in the obtained
optimal location (line 5-9), the transmission capacity (TC) is
increased by 49% from initial 38.28MW. Apart from the certain
benets of improved VSCap (sending and receiving ends voltages)
from installing UPFC, a corresponding gain not less than 2.5 MW
could be obtained on the Jos-Gombe line alone (that is, besides the
sub-transmission grid downstream). Further, PBP analysis, derived
as function of reactive power flow reduction and active power gain,
established that the investment costs for UPFC and TCSC can be
recouped in relatively short periods; PBP for TCSC is about 3
months and for UPFC is between 5 to 6 years. This information can
be deployed for use in the Nigerian system planning to improve TC
or voltage stability margins of lines.
References
Abido, M. A. (2009, April). Power System Stability Enhancement
Using Facts Controllers. The Arabian Journal for Science and
Engineering, XXXIV, 153.
Acharya, N., & Mithulanantha, N. (2006). Locating Series FACTS
devices for Congestion Management in Deregulated
Electricity Market.
Abido, M. A. (2009, April). Power System Stability Enhancement
Using Facts Controllers. The Arabian Journal for Science and
Engineering, XXXIV, 153.
Acharya, N., & Mithulanantha, N. (2006). Locating Series FACTS
devices for Congestion Management in Deregulated Electricity
Market. Naresh Acharya and N. Mithulanantha, “Locating
Series FACTS devices Electric power Research 77, Thailand,.
Cai, L. J., Erlich, I., & Stamtsis, G. (2004). Optimal Choice and
Allocation of FACTS Devices in Deregulated Electricity
Market Using Genetic Algorithm. IEEE PES Power System
Conference and Exposition, (pp. 10-13). New York.
Chung, T. S., & Li, Y. Z. (2001). A Hybrid GA approach for OPF with
Consideration of FACTS Devices. IEEE Power Engineering
Review, 47-57.
Georgilakis, S. P., & Vernados, G. P. (2011). Flexible AC `
Transmission System Controllers: An Evaluation. Materials
Science Forum, 670, 399-406.
Gerbex, R., Cherkaoui, R., & Germond, A. J. (2001). Optimal
Location of Multi-type FACTS Devices in a Power System by
Means of Genetic Algorithms. IEEE Trans. Power Systems,
XVI, 537-544
Habur, K., & O'Leans, D. (2004, August). FACTS - Flexible
Alternating Current Transmission Systems: for C o s t
Effective and Reliable Transmission of Electrical
Energy. Retrieved from www.worldbank.org
Hasma, A. N., Ismail, M., & Muhammad, M. (2010).
Transmission Loss Minimization and UPFC Installation
Cost Using Evolutionary Computation for Improvement
of Voltage Stability. Proceedings of 14th International
Middle East Power Systems Conference, Cairo
University, (pp. 19-21). Egypt.
Kowsalya, M., Ray, K. K., Shipurkar, U., & Saranathan. (2009).
Voltage Stability Enhancement by Optimal Placement
of UPFC. Journal of Electrical Engineering and
Technology, 4(3), 310-314.
Seyed, A. T., & Hadi, B. (2008). Transmission Congestion
Management by Determining Optimal Location of FACTS
Devices in Deregulated Power Systems.
Seyed, A.T . Hadi, B. “Transmission Congestion Management by
Determining Optimal LocationAmerican Journal of
Applied Sciences, 5(3), 242-247
Melodi and Akinloye / FUTAJEET 8 (2) (2014) (82-90)90