Embed Size (px)
Citation preview

1
U.S. Offshore Wind Analysis
Considerations for creating a regulatory and business environment
conducive to the development of offshore wind power in the United States of America
Benjamin Buchheim-Jurisson
Julia Chang
Stephanie Mui
Daniel Povitsky

2
Table of Contents
I. The Problem
Ia. Wind vs. Other Energy Sources
Ib. Drawbacks of Wind
Ic. Offshore Wind
Id. Literature Review
II. How Wind Power Works
IIa. The Mechanics of a Wind Turbine and Wind Farm
IIb. Importance of Location, Size, and Height of Turbine
IIc. Challenges Facing Offshore Wind Farm Construction
IId. Current Research and Development on Offshore Wind in the United States
III. Current Public Policy
IIIa. Status of Offshore Wind within the U.S. and Globally
IIIb. State Level and Regional Policies
IIIc. Offshore Wind Project Timeline
IIId. State Level and Regional Policies
IIIe. Regulatory Processes and Offshore Wind Project Timeline
IV. Current Financing Structure for Wind Energy
IVa. Equity: Tax Equity and Project Equity
IVb. Debt: Clean Renewable Energy Bonds (CREBs) and Bank Loans
V. Cost-Benefit Analysis
VI. Final Policy Recommendations
VII. Final Financing Recommendations

3
VIIa. Renewable Energy Covered Bonds (RECBs)
VIIb. Real Estate Investment Trust (REIT) Structure
VIII. Conclusion
IX. Areas of Further Research
X. Acknowledgments
XI. Appendix
XII. Bibliography

4
I. The Problem
Developing large and sustainable sources of energy is one of the most pressing problems
of our time. Energy demand in 2010 was 524 Quadrillion BTU, and growth in the next 30 years
is forecasted at 56%, to 820 quadrillion BTU in 2040. Much of this growth will come from non-
OECD countries, where population will grow
rapidly, and energy demand as a function of
population will increase exponentially.1 How this
demand is satisfied will have far-reaching economic,
political, and environmental effects.
Energy demand today is primarily satisfied
by fossil fuels, which supplied 87% of global
demand in 2012.2 While fossil fuels will continue to
play a major role, concerns with global warming will
curtail coal demand and force the world to turn to
alternative sources, namely solar and wind. We posit that wind, offshore wind in particular, is the
best option going forward for a number of reasons.
Wind, both onshore and offshore, does not have many of the complications associated
with other sources of power. The current issues inherent to most power generation techniques
can essentially be summed up in three many categories: pollution, safety, and limited nature of
fuel.
1 EIA, “International Energy Outlook 2013”
2 BP, “2012 in review”
World energy needs will rapidly
increase in the future, especially in
developing countries.
Source: EIA, “International Energy
Outlook 2013”

5
Ia. Wind vs. Other Energy Sources
Of all the current energy sources currently in use, fossil fuels are widely understood to be
the most polluting. Burning coal in particular releases many harmful materials into the
atmosphere that seem to both accelerate global warming and have detrimental effects on
individuals near the plant. Even nuclear energy, which does not produce carbon emissions in the
generation process (although sequestering waste products can hypothetically involve heavy
carbon emissions), has a pollution issue. The depleted radioactive elements, whether they are
recycled or sequestered, eventually result in a radioactive substance that must be disposed of and
which will certainly cause some amount of damage to the surrounding environment. In contrast
to these sources, apart from the actual production and construction of the turbines (which has
minimal negative environmental effects), wind produces no pollutants whatsoever, and does not
have any detrimental chemical effects upon the atmosphere or the surrounding ecosystem.
Other resources, namely nuclear, are regarded in many circles as being relatively unsafe.
While chances of a meltdown or reactor failure are relatively rare, the effects, as we have seen
with 3-Mile Island and Chernobyl, can be catastrophic, limiting public willingness to pursue
nuclear power sources. Again, wind does not pose any threat to public safety. Short of a
windmill collapsing, it poses essentially no danger to its surroundings.
Finally, unlike any other resource with the exception of solar energy, wind is an
effectively unlimited resource. Fossil fuels, nuclear energy, and hydro are all limited by amount
of material or accessible energy, while wind is not. Estimates suggest there is about 400,000 MW
6
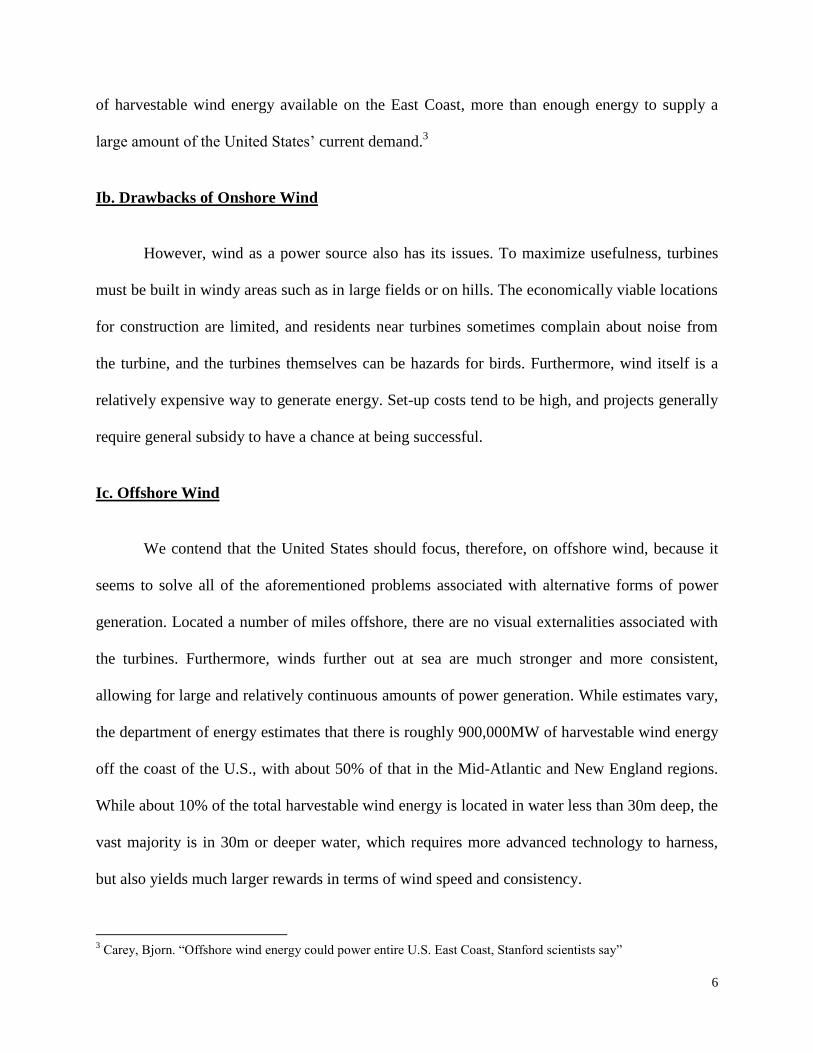
of harvestable wind energy available on the East Coast, more than enough energy to supply a
large amount of the United States’ current demand.3
Ib. Drawbacks of Onshore Wind
However, wind as a power source also has its issues. To maximize usefulness, turbines
must be built in windy areas such as in large fields or on hills. The economically viable locations
for construction are limited, and residents near turbines sometimes complain about noise from
the turbine, and the turbines themselves can be hazards for birds. Furthermore, wind itself is a
relatively expensive way to generate energy. Set-up costs tend to be high, and projects generally
require general subsidy to have a chance at being successful.
Ic. Offshore Wind
We contend that the United States should focus, therefore, on offshore wind, because it
seems to solve all of the aforementioned problems associated with alternative forms of power
generation. Located a number of miles offshore, there are no visual externalities associated with
the turbines. Furthermore, winds further out at sea are much stronger and more consistent,
allowing for large and relatively continuous amounts of power generation. While estimates vary,
the department of energy estimates that there is roughly 900,000MW of harvestable wind energy
off the coast of the U.S., with about 50% of that in the Mid-Atlantic and New England regions.
While about 10% of the total harvestable wind energy is located in water less than 30m deep, the
vast majority is in 30m or deeper water, which requires more advanced technology to harness,
but also yields much larger rewards in terms of wind speed and consistency.
3 Carey, Bjorn. “Offshore wind energy could power entire U.S. East Coast, Stanford scientists say”

7
Although a number of different firms have tried to develop offshore wind farms (and
construction on a number of sites may well start in 2014), offshore wind is currently non-existent
in the United States. The objective of this paper is to present viable suggestions to create a
regulatory and business environment conducive to the development of offshore wind power in
the United States. We will analyze the specific case of building a wind farm in the New
England/Mid-Atlantic region of the United States.
We will first address the specifics of wind power and illustrate the unique benefits and
costs associated with offshore production. Next, we will discuss the current status of wind, both
onshore and offshore, globally and in the United States. We will subsequently present our cost
benefit analysis of constructing an offshore wind farm in the New England/Mid-Atlantic region
of the United States. Finally, we will present our federal policy and investment recommendations
that we believe would best incentivize investment.
Id. Literature Review
For an appropriate scope of analysis, our research has carefully deliberated on multiple
facets of offshore wind, including: the need for offshore wind power generation in the U.S., the
technology necessary for offshore wind, the current status of offshore wind globally and in the
U.S., current U.S. public policy impacting the industry, current financing structures,
considerations for improvements and adaptations of public policy and financing, and finally a
social cost-benefit analysis as well as private cost-benefit discounted cash flow model.
Prior publications on the subject of offshore wind in the U.S. have primarily focused on a
single facet of offshore wind (either technology or public policy or financing separately). For

8
example, Musial and Ram focus on opportunities and barriers for large scale offshore wind in the
U.S.4 and Firestone and Kempton examine public opinion regarding offshore wind.
5 However,
our paper provides a unique perspective in its comprehensive and robust application of all the
aforementioned factors to rigorous social cost-benefit and private cost-benefit analyses.
Furthermore, as a 2013 publication, our research considers the most recent changes and
developments in technology, public policy and financial markets to provide the most accurate
view of offshore wind feasibility in the U.S. today.
II. How Wind Power Works
IIa. The Mechanics of a Wind Turbine and Wind Farm
Although there are varying designs for wind turbines and many share similar parts, in this
paper, we will focus specifically on the
Horizontal Axis Wind Turbines (HAWT)
given that they are the only commercially-
produced, utility-scale model – especially
for offshore wind farms. Basic parts of a
turbine include a rotor, three blades, a
gearbox, a generator, a yaw-adjustment
mechanism, and a tower.6
First, the yaw-adjustment mechanism, consisting of electric motors and gearboxes, uses
an electronic controller to read the position of a wind vane, a device that rotates and shows the
4 Musial and Ram, Large-scale offshore wind power in the United States: Assessment of opportunities and barriers
5 Firestone and Kempton, “Public opinion about large offshore wind power: underlying factors.”
6 Evolve Green, “The Basics”
Source: http://www1.eere.energy.gov/wind/inside_a_wind_turbine.html
Anatomy of a turbine

9
direction of the wind. Based on the information it receives, the yaw system moves the rotor’s,
the ‘head’ of the wind turbine containing a central hub attached to three blades, position in order
to capture the most potential wind energy available. Wind causes air pressure to be uneven
between one side of each blade and the other, causing the three blades to spin around the center.
The spinning blades cause kinetic energy from the moving air to be transformed into mechanical
energy.7 The power available from a wind turbine can be calculated via the formula below:
( )
(
)
The rotor is attached to a low-speed shaft, which is connected to a high-speed shaft
through the gears of a gearbox, increasing rotational speeds from about 30-60 rotations per
minute (rpm) to 1,000-1,800 rpm. Now with an rpm high enough to produce electricity, this
high-speed shaft connects to a generator.
The generator ultimately creates
electricity through producing voltage –
transforming the mechanical energy from
the blades to electrical energy. The high-
speed shaft mentioned above connects to
7 Australian Academy of Technological Sciences and Engineering, “Wind Energy”
Source: http://www1.eere.energy.gov/wind/wind_animation.html
Illustrative wind farm to grid infrastructure

10
an array of magnets that surrounds a coil of wire, which serves as a conductor. This set-up
(causing the shaft to spin the magnets) allows the generator to use properties of electromagnetic
induction, which is essentially the production of voltage in the coil of wire. Voltage, well
described as “electrical pressure,” is a difference in electrical charge – the force that “moves
electricity, or electrical current, from one point to another.”8 Voltage causes the electrical current
created by this process (called alternative current (AC) power) to pass through heavy electric
cables in the turbine’s tower. At the base of each turbine is a transformer, which increases the
AC power to the distribution voltage, roughly thousands of volts.9 This distribution-voltage
power moves through underground cables to a substation, a collection point that brings the
voltage from multiple turbines together.4 From this substation, electricity is distributed through
transmission lines to the high voltage electric power transmission system, also known as the
power grid, which connects to homes and buildings – allowing them to receive electricity.
IIb. Importance of Location, Size, and Height of Turbine
Wind generation capacity is also reliant on a number of exogenous factors. First, wind is
itself inconsistent, and therefore the amount of wind power generated in a period of time is not
certain. Second, capacity is also heavily determined by a turbine’s height, size, and location. The
potential wind power available is proportional to the cube of the wind’s speed – meaning if wind
speed triples, the wind power available by each turbine increases 27-fold.4 Third, since wind
speeds are faster and there is less blocking of wind at greater heights, the height of a turbine has
a positive relationship with the amount of the power generated. Estimates suggest that doubling
8 HowStuffWorks, “How Wind Power Works: Parts of a Wind Turbine”
9 HowStuff Works, “Modern Wind-power Technology”

11
the height of a turbine results in access to 12% faster wind speed. Finally, the size of turbine
blades is also relevant –doubling rotor diameter increases energy output fourfold.6
Recent offshore wind farm construction data corroborates the fact that wind farms are
being built larger and with more capacity than ever before.8 While average project size for 2010-
2012 was 173 MW, the average capacity for projects due for completion in 2013-2014 is 247
MW. Examining data for individual turbines, there is a similar trend. Turbines today are larger,
typically 3-6MW, feature rotors at least 120 meters in diameter, and have an average hub height
of 85 meters. Current prototypes have capacities between 4 MW and 8MW.10
IIc. Challenges Facing Offshore Wind Farm Construction
It is also important to consider the unique challenges faced by constructing turbines in the
ocean. The most significant consideration is balancing the turbine itself in the water, which is
highly costly, as well as disturbing to aquatic life. While installing the turbine in the ground
usually represents 70 percent of offshore wind construction costs, it is no more than 30 percent
for onshore turbines10
Furthermore, the location and environment of offshore wind farms can drastically raise
operation and maintenance costs. Corrosive salt water can damage turbine parts, and large waves
and storms have been known to actually debase turbines. However, even with sturdier parts,
long-term Operations and Maintenance (O&M) costs remain significant with offshore wind
farms. Maintenance crews, purpose-built equipment (like vessels for farms in specific
locations/climates), and proactive maintenance make offshore wind expensive to maintain.6
10
HowStuff Works, “Modern Wind-power Technology”

12
Finally, transmission costs can be quite high. Installing power conversion stations near
the wind farm to convert AC power to DC can be costly, especially because this station typically
requires a full-time crew. Additionally, high voltage direct current cables must be installed
seafloor to transmit the power back to land, where it will be converted back into AC power and
connected to the grid.
IId. Current Research and Development on Offshore Wind in the United States
Given these high costs, it is clear that further research and development needs to be done
in order to make offshore wind a more cost-effective method of producing energy. The most
important agency in federal support for offshore wind is the Wind and Water Power
Technologies Office (WWPTO) within the U.S. Department of Energy’s (DOE’s) Office of
Energy Efficiency and Renewable Energy (EERE), which across eight broad areas, spent over
$300 million from 2006 to 2012 to fund research and development of offshore wind projects.11,12
The private sector is currently less enthusiastic about offshore wind investment. BP Wind
Energy, a company that dedicates $300 million a year (roughly the same amount as the
Department of Energy invests) to wind development is reluctant about pursuing offshore wind.13
In 2007, when BP first entered the wind market, BP Wind Energy’s President and CEO, John
Graham, made the strategic decision to purely focus on U.S. onshore wind. Six years later, he
remains skeptical and BP Wind continues to focus solely on onshore wind. Similarly, Atlantic
Grid Development LLC, a Google-backed company well-known for its plan to build an undersea
power-transmission line for offshore wind farms, announced in late October 2013 that it would
11
U.S. Department of Energy Wind and Water Power Technologies Office Funding in het U.S., “Offshore Wind
Market” 12
Ibid. 13
Trabish, Herman K. “BP Wind Energy: Undiscouraged and Still Building Wind Farms”

13
be shifting gears. Because of the lack of network of wind farms off the U.S. East Coast (a
network that the company previously believed would have existed by now) and the high cost and
risk of pursuing this transmission line, the company instead decided to settle for an onshore
transmission line, described as a “goal that’s easier to achieve.”14
III. Current Status of Offshore Wind and Public Policy
IIIa. Status of Offshore Wind in the U.S. and Globally
Relative to other nations investing nations investing in alternative energy, the United
States is far behind in offshore wind development. Europe installed its first offshore turbine in
1991 and has been investing heavily in the sector ever since. As of September 2013, the
countries of the European Union (EU) have built 1,939 offshore wind turbines with 6,040 MW
of capacity.15
Current forecast indicate that the EU is on target to supply 20% of its electricity
demand from renewable sources by 2020, and 40% by 2030. In stark contrast, there are no wind
farms operating or even under construction in the U.S. Although the U.S. is a leader in onshore
wind turbine capacity, the nation is far behind Europe in offshore wind.8
Despite these setbacks, there have been recent successes that give hope to believe that
offshore wind farms will soon be developed successfully in the U.S. In June of 2013, for
example, the first single offshore wind turbine was successfully built. Although the turbine was
small – a mere 60 feet with 20 KW capacity, enough to power only a handful of homes – it
serves as a positive step for development and a symbol for more to come. Another recent victory
comes from the well-known $2.6 billion Cape Wind project, one that is infamous for its decade-
14
Goossens, Ehren. “Google-Backed Atlantic Offshore Wind Cable Shifts Focus to New Jersey” 15
Levitan, Dave. “Is U.S. Offshore Wind Power Finally Ready to Take Off?”

14
long litigation battles due to opposition from local residents concerned that the project would
have a negative environmental impact and destroy the area’s natural beauty. Now with its power
purchase agreements secured, the project is set to begin construction in 2014.11
Upon its
completion, Jim Gordon (Cape Wind’s developer) projects that 75% of Cape Cod’s electricity
demand will be obtained through the project.
Finally, construction costs, the largest barrier for offshore wind farms, are predicted to go
with increased investment interest and technological improvement. According to the U.S.
National Energy Technology, the price of electricity generated offshore on the U.S. East Coast is
predicted to be about 15 cents per kilowatt hour (significantly higher than the cost currently of
coal or natural gas).16, 16
However, these costs are expected to decrease to roughly 10 cents per
kilowatt hour by 2020, and by 7 cents in 2030 – making offshore wind highly competitive with
current energy costs. Although some analysts have a negative short-term outlook on offshore
wind because of high costs and uncertainties, many are optimistic for increased U.S.
development of offshore wind in the medium to long term.16
IIIb. U.S. Wind Energy Policy
Investment opportunities are analyzed on two basic factors: risk and return. In order to
facilitate investment in U.S. offshore wind, there must be a regulatory environment that: one,
incentivizes investment and production in case of market failure and two, has strong guidance
and low uncertainty to minimize investor risk. The following sections explore the current U.S.
regulatory landscape and develop a framework for regulation going forward.
16
U.S. Department of Energy, “Role of Alternative Energy Sources: Wind Technology Assessment”

15
IIIc. Federal Policy
While the U.S. government currently subsidizes wind production, this subsidy has been
notoriously inconsistent. The financial catalyst of U.S. onshore wind projects is the federal
government’s Renewable Electricity Production Tax Credit (PTC). The PTC is a corporate tax
credit that awards a rebate of 2.3¢/kWh for electricity generated by eligible facilities for the first
ten years of operation, and wind developers can sell this tax credit to unrelated persons during
the taxable year as an additional source of revenue.17
The PTC program was instated in 1992,
and has been the primary driver of wind development in the U.S. ever since. However, federal
support for the program has been inconsistent; the program has been renewed, expanded, and
allowed to expire at various points throughout its existence. Federal requirements for eligibility
have also been inconsistent, sometimes requiring plants to finish construction by year end or
alternatively, requiring construction to begin by year end. The current version of the regulation
requires wind developers to begin construction by December 31, 2013 to qualify for the credit.
However, the current PTC is set to expire at year end 2013, and there has been limited
congressional support for a renewal.
However, another federal subsidy—the Business Energy Investment Tax Credit (ITC)—
would be more applicable than the PTC for offshore wind because of its treatment of capital
expenditures. The ITC gives a 30% rebate for expenditures on development of wind turbines
placed in service after year end 2008, and was originally catered towards small wind properties
with a maximum size of 100kW in capacity because capital expenditures on these smaller wind
projects are disproportionate to future generation potential.18
After the 2008 financial crisis, the
American Recovery and Reinvestment Act of 2009 expanded the ITC program to cover all PTC
17
U.S. Department of Energy, Renewable Electricity Production Tax Credit (PTC) 18
U.S. Department of Energy, Business Energy Investment Tax Credit (ITC)

16
eligible wind projects of any size, as long as construction is started by December 31, 2013, in
order to spur further wind investment. Therefore, because offshore wind is similar to small wind
projects with respect to its extreme capital costs that outweigh future generation potential, the
ITC a better financial incentive for offshore wind developers. The ITC program for wind energy
systems is currently due to expire for wind projects placed in service post December 31, 2016,
and there has been little federal guidance on the possibility of renewal. There has been some
speculation that Congress will lower the ITC to 10% of capital expenditure costs, but no formal
guidance has been announced.19
Another potential mechanism to fix energy market distortions is a carbon tax. A carbon
tax is a tax on greenhouse gas emissions (GHG) generated from burning fossil fuels. The tax is a
“dollars-per-ton” tax of GHG emissions, which thus incentivizes decreasing emissions. One
advantage of the carbon tax over other emissions reductions policies is its flexibility: businesses
and consumers can choose whether they want to reduce fuel consumption, increase fuel
efficiency, or use cleaner energy based on their individual cost-benefit analyses of the carbon
tax. The U.S. currently has no carbon tax in place but Congress has considered numerous
manifestations of one. A recent CBO report says that a $25/ton tax that rises with inflation
would raise over $1 trillion of revenue in a decade—also extremely beneficial for our federal
debt.20
Opponents of the carbon tax argue that it will burden the economy by raising the cost of
producing emissions intensive goods and services. Another option for the U.S. is a revenue
neutral carbon tax that recycles the carbon tax revenue through tax reductions in other areas.
This would alleviate the tax burden on the economy by returning carbon tax revenue to
consumers through other means, while still incentivizing reduced emissions and cleaner energy.
19
Trabish, "Report: Nuclear Received 4 Times More Subsidies Than Solar in CA" 20
Geman, "CBO: Carbon Tax Chops $1 Trillion from Deficit"

17
One determination the U.S. government will have to make is whether increased carbon tax
revenue or potentially decreased economic activity is optimal. In the meantime, various lobbies
and interest groups that represent emissions- heavy industries have also been blocking the carbon
tax, such as traditional oil and gas lobbies.
IIId. State Level and Regional Policies
Outside of federal policies, many states have also developed state-level clean energy
initiatives. Many individual states have adopted Renewable Energy Portfolio Standards (RPS)
which are mandates to purchase a certain percentage of their electricity from clean energy
sources. Massachusetts is a good case study for state level RPS as it was one of the first states to
adopt a RPS that requires suppliers of electricity to obtain a certain percentage of their total
electricity load from renewable energy sources for retail customers. The RPS was implemented
with an obligation of 1% in 2003 and was stepped up by 0.5% until it reached a target of 4% in
2009.21
Afterwards, state regulators developed the RPS further and created RPS Class I and RPS
Class II, which has different supplier compliance percentages and different qualifying generators
used to meet the requirements. RPS Class I started at 5% in 2010 and increases by 1% annually,
and applies to renewable generation facilities that began commercial operation after 1997.22
RPS Class II applies to generation facilities open pre-1998, and requires compliance from targets
of 3.6% from renewables and 3.5% from waste energy.23
In Massachusetts, electricity suppliers purchase Renewable Energy Certificates (RECs)
or make Annual Compliance Payments (ACPs) to comply with state RPS policies. RECs are a
21
Massachusetts Office of Energy and Environmental Affairs, "RPS and APS Program Summaries" 22
Ibid. 23
Ibid.

18
monetary representation of the positive environmental externalities created from clean energy
production, and one REC is created per MWh of electricity generated by a qualifying renewables
facility. Electricity suppliers must purchase a number of RECs equal to their obligation for that
year, and if they do not purchase enough RECs to meet requirements, they are required to
purchase ACPs to match the difference. ACPs are a penalty payment and serve as a ceiling price
for RECs; thus, suppliers are incentivized to purchase RECs from renewable projects for less
than the ACP price to meet their RPS obligation. Revenue generated from ACPs are used to
fund further clean energy initiatives in the state. These state mandates on clean energy
purchasing create additional interference in the marketplace to try and fix the distortions and
market failure in regards to traditional power.
There are also regional GHG standards that attempt to reduce GHG emissions in member
states. For example, the Regional Greenhouse Gas Initiative (RGGI) is a cap and trade system
for CO2 emissions from power plants in member states and provinces in the Northeast/Mid-
Atlantic region and Eastern Canada.24
In this cap and trade program, power plants have carbon
emissions limits and must buy carbon allowances if they are to exceed their limit. The member
states sell emissions allowances through auctions and then use the revenues to invest in other
renewables initiatives. The program is a cooperative effort amongst states to reduce power
sector carbon emissions, and complements individual state RPS activities as well.
IIIe. Regulatory Processes and Offshore Wind Project Timeline
In addition to financial risk, there is also high uncertainty about procedural risk in
offshore wind developments because of the lack of precedents. Federal and state regulators are
24
RGGI, “CO2 Budget Trading Program”

19
currently working to develop a regulatory framework that will facilitate the permitting processes
for offshore wind projects and thus minimize the procedural uncertainty and risk faced by
potential developers. However, the wide dispersion of responsibility over a variety of federal
and state agencies for siting, permitting, and construction processes is a tremendous challenge to
offshore wind. This impedes the development process because of conflicts of interest, levels of
bureaucracy and paperwork, and coordination problems.
Our hypothetical project timeline currently takes at least 10 years before operation of an
offshore wind farm can begin. Phase 1 of the project timeline is initial project development and
leasing of waters. This includes an estimated 1-3 year planning period, the lease auction process,
and 6 months to submit a Site Assessment Plan for approval. We are assuming development of
offshore wind in federal waters because of increased wind potential in deeper waters offshore. In
addition, this simplifies the permitting process because the federal government has sole authority
over permitting for projects outside of the 3 mile state boundary.25
Specifically, the U.S.
Department of Energy and the Department of the Interior are responsible for developing
commercial offshore wind potential in the US, with the Bureau of Ocean Energy Management,
Regulation and Enforcement (BOEM) acting as the lead agency in permitting offshore wind. In
addition, the U.S. Army Corps of Engineers (USACE) is in charge of permitting in locations that
could impede U.S. navigable waters or national security—projects cannot interfere with ship
navigation lanes and naval limited access areas. As part of the permitting process, the BOEM
has developed a competitive lease sale auction process for the leasing of high potential wind
areas in federal waters, designated as Wind Energy Areas. In fact, the BOEM held the first
25
For state waters, there is a significant amount of additional regulatory approval needed from state, local, and tribal
government bodies in order to permit an offshore wind project. The USACE is also the lead federal agency that
participates in permitting in state waters, e.g. the Great Lakes.

20
competitive lease sale for renewable energy in federal waters in July 2013 to jumpstart offshore
wind development.26
Approximately 165,000 acres of Wind Energy Areas off the coast of
Rhode Island and Massachusetts were leased to Deepwater Wind for $3.8m with an operating
term of 25 years.27
BOEM will continue to hold competitive lease sales over the next few years
to allocate waters off the mid-Atlantic coast. The final step in Phase 1 is the Site Assessment
plan, where a wind developer has 6 months to submit their plan for federal approval after
winning a lease auction.28
Phase 2 of the project timeline consists of construction plan development and approval
and is estimated to span over 5 years. Wind developers will have up to 4.5 years to submit a
Construction and Operations Plan for approval after the initial Site Assessment Plan is approved,
and the Construction and Operations Plan will need to provide a detailed plan for the
construction and operation of the wind energy project on the lease.29
In addition to traditional
construction and logistics decisions, projects must be shown to not interfere with air or sea
navigation, protected species, commercial and regional fisheries, protected marine and coastal
habitats, and protection of other marine or historical areas.30
Therefore, additional federal
agencies with authority over these different aspects of offshore wind projects are involved in the
Phase 2 approval process, such as the Federal Aviation Administration and environmental
agencies like the Environmental Protection Agency. This diffusion of responsibility across all
the agencies creates extreme fragmentation in the offshore wind planning process, which has
significantly delayed the project approval project even further and hindered future development.
26
U.S. Department of Interior, Interior Holds First-Ever Competitive Lease Sale for Renewable Energy in Federal
Waters. 27
Ibid. 28
U.S. Department of Interior, Interior Holds First-Ever Competitive Lease Sale for Renewable Energy in Federal
Waters. 29
Ibid. 30
U.S. Department of Energy, National Offshore Wind Strategy

21
However, the federal government has begun taking a more aggressive stance regarding clean
energy development and is currently trying to streamline its regulatory process to combat this
problem. For example, the DOI’s Smart from the Start program is an initiative to help expedite
siting, leasing, and construction of commercial-scale offshore wind projects through strategic
coordination on federal, state, and local levels.31
The program also hopes to create coordinated
planning and have concurrent project review in order to expedite the Phase 2 approval process as
much as possible.
Phase 3 of the project timeline involves the financing, construction, and operation of the
offshore wind project. After the Construction and Operations Plan is approved, the wind
developer can begin negotiating Power Purchase Agreements (PPAs) with local utilities. PPAs
are contracts to buy electricity generated by a power plant for fixed rates and over a fixed period
of time—generally 15-20 years. PPAs guarantee a long term stream of revenue for the power
plant, which serves as a guarantee to investors when financing these capital intensive projects.
After securing a PPA, the wind developers can begin the project financing process, which will be
discussed in the following section. Construction can begin after financing is obtained, and we
estimate a minimum construction period of 1 year. This is actually an aggressive estimate for
wind farm construction and leads to a more optimistic project timeline. After construction is
completed, the wind developer will have an operating lease of 25 years.
Therefore, the success of offshore wind in the U.S. will depend largely on the success of
programs like Smart from the Start, as the current state of project development from start to
finish can take over 10 years. From a developer’s point of view, it is extremely risky to take on
an offshore wind project when federal energy policies are so shortsighted. In fact, the current
31
U.S. Department of Energy, National Offshore Wind Strategy

22
policy timeline implies that offshore wind will not be eligible for federal subsidies because both
the PTC and ITC credits will expire before an offshore wind project could begin construction.
Compounded with potential risks about macroeconomic conditions, unknown future investment
environments, uncertainty over fuel prices for traditional energy generation, and the general lack
of long term emissions reductions policies, the significant length of the planning process can
make incentivizing project development almost impossible.
IV. Current Financing Structure for Wind Energy
In the United States, project finance is the traditional structure used to finance capital and
asset intensive wind energy projects. The project finance structure is comprised of both equity
and debt tranches with the mix divided amongst tax equity investors and direct project equity
investors for the former and banks for the latter. Terms set forth by both equity investors and
lenders are based on the project’s perceived riskiness and its expected future cash flows.
In order to offset the perceived riskiness of renewable energy ventures, investors and
lenders typically require a signed Power Purchase Agreement (PPA) to close the contract.32
As a
long-term agreement between the seller of wind energy and the purchaser, the PPA is a critical
step to securing financing for the project. The agreement secures the expected long-term revenue
stream of the project as it stipulates the sale of energy to the utility company in the local or
regional area. The PPA also includes provisions concerning duration of the contract,
commissioning process, transmission issues, defaults, credit, insurance and environmental
32
Windustry. Power Purchase Agreement.

23
attributes of the project.33
In this way, the PPA allows investors and lenders to reach a more
granular understanding of the feasibility and likelihood of monetary success of the project.
Today, wind energy farms and the companies building them have developed a strong
reputation as a result of successfully executing numerous projects . This maturing of the industry
has resulted in several major wind farms being able to attain project financing without first
having secured a long-term PPA.34
Nonetheless, the PPA remains an important step in securing
the expected cash flows of the project and once financing feasibility is confirmed, capital
allocation is sorted among investors and lenders.
IVa. Equity: Tax Equity and Project Equity
A starting point of discussion between wind farm developers and banks is generally
focused on tax equity. The federal government offers wind farm developers various tax credit
incentives (ITC and PTC) which offset the cost of new installations; however, these credits only
apply to those developers profitable enough to pay income taxes. As most wind energy
companies earn their income in “currently depressed energy markets,”35
they lack the robust
balance sheets necessary to reap the entirety of the credit benefits themselves. Consequently,
they seek a tax equity partner who can capture the credit in the financing structure. Tax equity
partners have traditionally been large investment banks, commercial banks and insurance
33
Windustry. Power Purchase Agreement. 34
Mintz Levin Cohn Ferris Glovsky and Popeo PC. Renewable Energy Project Finance in the U.S.: An Overview
and Midterm Outlook: 6. 35
U.S. Partnership for Renewable Energy Finance. Tax Credits, Tax Equity and Alternatives to Spur Clean Energy
Financing: 1.

24
companies with a high tax burden that seek to offset some portion of their expected tax liability.
Their investment generally comprises 30-90% of the entire project finance capital.36
In the United States, the two primary tax equity financing mechanisms in the project
financing structure of wind energy projects are the sale-leaseback model and the partnership-flip
model.37
The sale-leaseback model was first introduced in the 2009 American Recovery and
Reinvestment Act to spur investment in renewable energy. Since, it has become the standard in
renewable energy transactions. In the sale-leaseback model, the developer of the wind energy
farm constructs the farm in its traditional manner and subsequently sells the farm at fair value to
a tax equity investor. The tax equity investor then leases back the project to the developer for
fixed rate payments. The developer, who owns the PPA contract, uses the cash flows from the
PPA to pay for the lease. Once the lease contract between the developer and tax equity investor
runs out, the tax equity investor may choose to remain the owner of the farm or sell it back to the
developer. Because the tax equity investor receives tax credit compensation from being the
formal owner of the farm, it charges the developer less to lease the project2. This unique structure
allows the developer to recoup the entirety of its investment while not having to directly buy into
the wind farm.38
The partnership-flip model, although more complex than its sale-leaseback peer, is
preferred by project developers as it offers them greater control in the developer-tax equity
investor partnership.39
In this model, the developer and tax equity investor create a partnership
company by which they co-own all assets of the farm. As a result, the single entity partnership
36
French energy banker. Financing wind farms. 37
Mintz Levin Cohn Ferris Glovsky and Popeo PC. Renewable Energy Project Finance in the U.S.: An Overview
and Midterm Outlook: 7. 38
Mintz Levin Cohn Ferris Glovsky and Popeo PC: 8. 39
Mintz Levin Cohn Ferris Glovsky and Popeo PC: 9.

25
collects all cash flows from the PPA and all tax credits. The revenue and tax credit inflows are
then split between the developer and the tax equity investor as outlined through a negotiated
contract. The tax equity investor typically has a six to ten year internal rate of return benchmark
which hopes to attain. Consequently, the split of cash flows is generally in the favor of the
investor for the first few years of operation.40
For example, during this period, the tax equity
investor might claim 80% of revenue and tax credits and the developer, the remaining 20%.
Once the tax equity investor has reached its required return, the payout structure typically flips
with the developer owning the majority of the split for the remainder of the life of the farm.41
In the United States, the major players in the tax equity partnership space since 2007 have
been Bank of America, Citibank, Credit Suisse, General Electric Energy Financial Services, JP
Morgan, Morgan Stanley and Union Bank.42
Since the financial crisis of 2008, there are
significantly fewer financial institutions actively involved in partnerships, mostly as a result of
the insolvencies, bankruptcies and consolidations which emerged from the crisis (e.g. AIG,
Lehman Brothers, and Merrill Lynch among others) 5
. As financial markets have moved forward
from 2008, taxable income at major banks has risen leading to heightened tax equity appetites.
There has been further growth in the investor base as Fortune 500 companies begin to display
interest. Technology, industrial and large retail companies have been approached by the Obama
administration as potential market entrants. Fortune 500 companies have materialized as strong
candidates to take advantage of the tax credit incentive for investing in wind and renewable
energy in general as they paid a combined US$137bn in taxes in 2012.43
40
Mintz Levin Cohn Ferris Glovsky and Popeo PC: 9. 41
Ibid. 42
Project Finance International.Renewables Report: 6. 43
Project Finance International.Renewables Report: 8.

26
In addition to the tax equity investors, private equity firms serve as important sources of
capital through provisions of general project equity also known as cash equity. These direct
equity investors invest a specified amount in a project in return for a certain stake in the project’s
future cash flows. Relative to traditional private equity leveraged buyout transactions, investment
in wind energy (and renewable energy in general) is perceived as a more alternative arena given
its novelty, the heightened capital demands and unique risks. Wind energy has become an
attractive target for the largest private equity firms such as Kohlberg Kravis Roberts and The
Blackstone Group who have the appetite for high yield and the size to take on higher risk.44
Typically these firms allocate capital in the period during development, construction and the first
two years of operation. Wind energy development companies are especially eager to accept
capital during this period given the payout structure of cash grant incentives created by the
Investment Tax Credit of 2009. The cash grants, which cover 30% of a project’s installed cost,
are disbursed 60 days after the project starts operation; and as a result, developers still need
bridge financing to get through the project’s construction phase.45
Private equity firms provide
equity in the form of an equity bridge loan which meets the demands for the project’s last minute
capital needs until the cash grant becomes available, at which time the investor is repaid.46
IVb. Debt: Clean Renewable Energy Bonds (CREBs) and Bank Loans
Rounding out the project finance package is the project debt typically funded by a
combination of the issuance of Clean Renewable Energy Bonds (CREBs) and loans supplied by
a bank or a syndicate of banks.
44
European Wind Energy Conference & Exhibition. Private Equity Financing for Offshore Wind Farms During
Implementation Phase. 45
Mintz Levin Cohn Ferris Glovsky and Popeo PC: 9. 46
Ibid.

27
CREBs are a primary initiative for wind energy development companies in raising debt
funding as they are a low-cost relative to bank loans. By the CREB vehicle, the federal
government effectively lowers the cost of debt for renewable energy companies by providing a
tax credit to the bond holders in lieu of interest payments from the issuer.47
The issuance of such
interest-free bonds, backed by payments from the U.S. Department of the Treasury, was
introduced in the Energy Tax Incentives Act of 2005. The CREB program entails an application
and allocation process administered by the Internal Revenue Service (IRS). Interested and
qualified issuers include governmental bodies (e.g. municipalities), cooperative electric utilities
and public power providers. The Treasury Department awards yearly allocations to issuers of
each category until each respective category has reached US$800mm in allocation.48
Once issued
by the entity, the tax credit received by bond holders is calculated quarterly and is defined as the
current tax credit rate multiplied by the CREB’s outstanding principle. The tax credit paid to the
bond holder is considered taxable income.
While bank debt packages vary based on project size and technology, most wind projects
incorporate traditional term loans and construction loans. Term loans are generic commercial
loans that carry fixed interest rates with periodic (generally quarterly) repayments. Term loans
for renewable energy projects are typically long term, with maturity dates generally between 10
and 20 years and the collateral for term-loans is typically the project itself.49
Construction loans
are generally distributed in several installments. After the first installment, and through the term
of the construction loan, the borrower makes interest payments on the installments received to
date. When construction is complete, payment is due for the entire amount. In some cases,
47
NREL (National Renewable Energy Laboratory). Fact Sheet Series on Financing Renewable Energy Projects: 1. 48
Ibid. 49
Mintz Levin Cohn Ferris Glovsky and Popeo PC: 12.

28
construction loans will automatically convert to term loans once commercial operation is
reached. The interest rate on construction loans is generally higher than on term loans.
V. Cost-Benefit Analysis
Our cost-benefit analysis is two-fold. First, we aim to illustrate the social benefits of offshore
wind. Based off of this determination, we take the perspective of the government in analyzing
potential subsidy strategies to adequately incentivize offshore wind construction. By modeling
out private costs and benefits with a discounted cash-flow model, we examine the effects of
different subsidy structures upon project launch.
Assumptions for Cost-Benefit Analysis
In building this model we make a number of important assumptions:
1. This project will only use 5MW turbines, which have an effective working life of 20
years.50
2. 50 total turbines will be constructed. This is a relatively modestly sized wind farm.
However, we believe that given the current status of offshore wind in the U.S. that this is
more realistic.
3. The equivalent generating capacity of this wind farm is modeled by a natural as plant,
which has the same nameplate capacity times availability as the wind farm project (100
MW). This plant would therefore generate, at 90% utilization, 788,400 MW-h/year.
50
BOEM, "Technology White Paper on Wind Energy Potential on the U.S. Outer Continental Shelf"
29
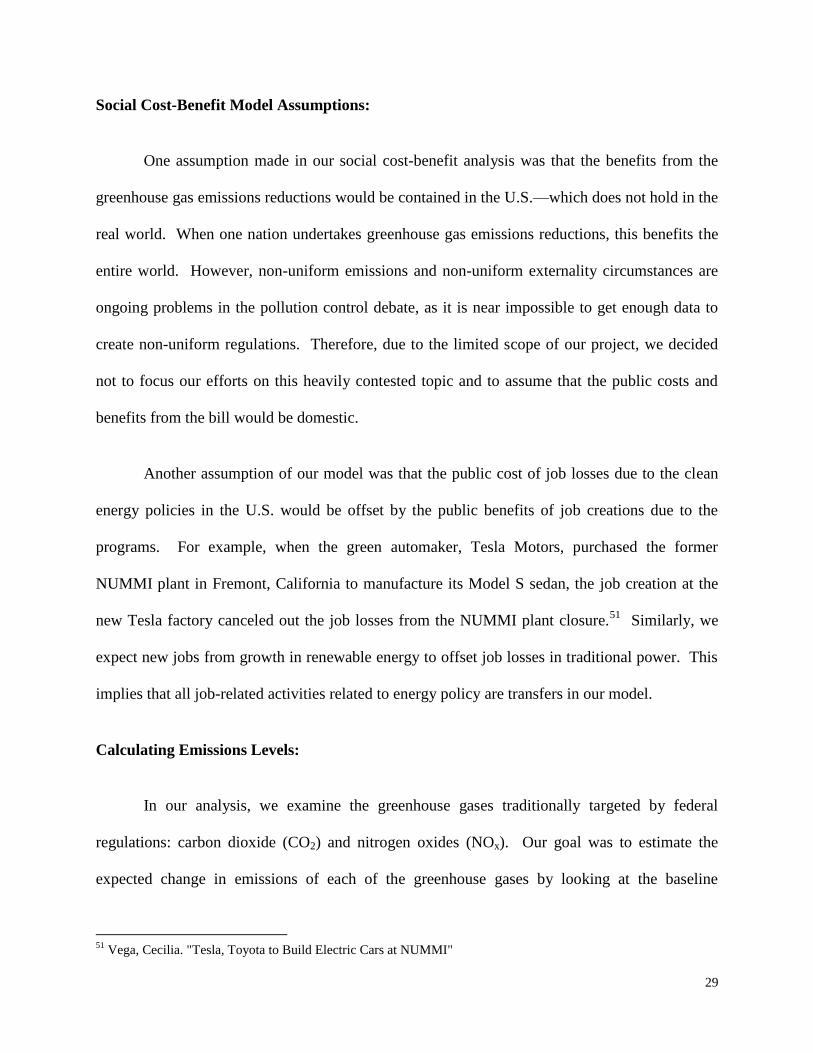
Social Cost-Benefit Model Assumptions:
One assumption made in our social cost-benefit analysis was that the benefits from the
greenhouse gas emissions reductions would be contained in the U.S.—which does not hold in the
real world. When one nation undertakes greenhouse gas emissions reductions, this benefits the
entire world. However, non-uniform emissions and non-uniform externality circumstances are
ongoing problems in the pollution control debate, as it is near impossible to get enough data to
create non-uniform regulations. Therefore, due to the limited scope of our project, we decided
not to focus our efforts on this heavily contested topic and to assume that the public costs and
benefits from the bill would be domestic.
Another assumption of our model was that the public cost of job losses due to the clean
energy policies in the U.S. would be offset by the public benefits of job creations due to the
programs. For example, when the green automaker, Tesla Motors, purchased the former
NUMMI plant in Fremont, California to manufacture its Model S sedan, the job creation at the
new Tesla factory canceled out the job losses from the NUMMI plant closure.51
Similarly, we
expect new jobs from growth in renewable energy to offset job losses in traditional power. This
implies that all job-related activities related to energy policy are transfers in our model.
Calculating Emissions Levels:
In our analysis, we examine the greenhouse gases traditionally targeted by federal
regulations: carbon dioxide (CO2) and nitrogen oxides (NOx). Our goal was to estimate the
expected change in emissions of each of the greenhouse gases by looking at the baseline
51
Vega, Cecilia. "Tesla, Toyota to Build Electric Cars at NUMMI"

30
emissions levels and the post regulation emissions levels. In our analysis, we assume the status
quo power generation source to be gas plants for the following reasons:
We expect the exponential growth of fracking and liquefied natural gas to keep
natural gas prices low in the short to mid-term.
Increasingly strict environmental compliance regulation on coal plants has
required costly technology upgrades for plants. This capital expenditure burden
usually exceeds $200 million and will cause many coal plants to become
unprofitable post compliance deadline (approximately 2016).52
Therefore, we
expect a significant amount of coal plant retirements in the next few years.
We used EIA natural gas plant emissions estimates (metric tons emitted/MWh of natural
gas) to estimate the emissions savings of each of the representative greenhouse gases on a per
year basis from 2020-2040 due to the introduction of offshore wind to the U.S. generation mix.
Specifically, gas plants emit approximately 1.135 metric tons of CO2 per MWh and .0017 metric
tons of NOx per MWh.53
Estimating Social Costs of GHG:
Our next step was estimating the expected social cost per metric ton of emissions for each
greenhouse gas in order to calculate the expected social benefit from the emissions savings. Our
model uses a base case of $40/ton of CO2, derived from 2013 median estimates provided by the
EPA.54
Similarly, we derived our estimated social cost of NOx from various sources, primarily a
52
Edison Mission Energy, “Presentation to Senior Unsecured Noteholders: January 9, 2013” 53
EPA, “Natural Gas Emissions” 54
Interagency Working Group on Social Cost of Carbon, United States Government, Technical Support Document:
- Technical Update of the Social Cost of Carbon for Regulatory Impact Analysis - Under Executive Order 12866

31
study on the economics of pollution trading for NOx.55
We therefore arrive at a cost estimate of
$1807/ton of NOx for our model. Furthermore, we recognize that there is a vast amount of
literature debating the expected social cost of greenhouse gases. We incorporate this uncertainty
into our model by performing a sensitivity analysis that accounts for changes in our social cost
estimate. Our emissions level estimates imply that gas plants emit almost 668x more CO2 than
NOx during power generation. Therefore, we decided to perform the sensitivity analysis on the
social cost of CO2 instead of NOx for greatest impact and look at scenarios where we step up the
social cost of CO2 from $0/ton to $100/ton, in increments of $20/ton in accordance with the
spectrum of existing research.56
Visual/Audial Externalities
One of the main advantages of offshore wind, as discussed earlier in the paper, is that
they are far enough from shore (5-10 miles) so that they can be neither seen nor heard by
individuals living on land. Sound will definitively not be transmitted that far, and it is possible to
determine by determining distance to the horizon that this wind farm would be too far out at sea
to see with the naked eye, thus eliminating the visual externality.
Wildlife/Ecosystem Effects
Marine Life
Due to the lack of existing offshore wind farms in the United States, there is no current
data on how offshore wind would affect marine ecosystems in the mid-Atlantic/New England
region. It is also difficult to make and long term predictions, as offshore wind technology is
55
Burtraw, Economics of Pollution Trading for SO2 and NOx 56
Pearce, David. "The social cost of carbon and its policy implications"

32
itself relatively new; however, it seems that there are already some visible benefits to wildlife of
offshore wind.
The most significant threats to marine life are acoustic disturbances and physical seabed
disturbances. Research suggests that while there is an initial disturbance to marine life in the
installation process, the installed base actually becomes a highly desirable environment for reef
formation, given the solid structure of the base and the rules stopping ships from sailing through
wind farms.57
These areas seemingly exhibit high biodiversity and growth after the reef recovers
from initial construction. It is very difficult to put a dollar amount on this value however, given
that most estimates are for coral reefs. Although we feel that turbines would likely present a net
benefit for aquatic life, given that we are unable to quantify this we feel that it is appropriate to
have benefits balance with costs to a net zero for each year.
Avian Life
It is also possible for birds to be killed by wind turbines. The two factors that matter most
in this case are the height of bird flight and the height of the turbines.58
Studies suggest that
building fewer turbines will drastically decrease the number of bird strikes that occur on a wind
farm. Given that our project involves larger (5MW) turbines and consequently necessitates less
total turbines, we believe that bird strikes will have a very low likelihood, and consequently do
not assign a cost value for loss of birds in the model.59
57
UK dept. of Energy and Climate Change, "UK Offshore Energy Strategic Assessment" 58
Bird Guides, “High-flying birds at greater risk of collision with offshore wind turbines” 59
UK dept. of Energy and Climate Change, "UK Offshore Energy Strategic Assessment"

33
Social Cost-Benefit Results:
Our model shows that the addition of offshore wind to the current U.S. energy generation
mix will produce a positive net present value under all our discount rate/social cost of carbon
scenarios. Greenhouse gas emissions benefits are the primary driver of the value, as there is
negligible visual and noise pollution and wildlife benefits. In our base case of 7% discount rate
and $40/ton of CO2, we calculate the net present value of the net benefits each year over the
useful life of an offshore wind turbine (20 years):
∑ ( )
where n = the year, starting from year 0 and ending in year 20
Cash Flow = total social benefits – total social costs
r = discount rate
We arrive at an NPV of $269.6 million for adding one offshore wind farm with a nameplate
capacity of 250MW. This implies a net present benefit of $1.1 million per MW of offshore wind
operating capacity, and this value is monotonically scalable to the total capacity of offshore wind
in the US. It is important to note that our sensitivity analysis assumes a constant cost of NOx
because we argue that the discount rate is a more important factor. We could theoretically have a
### -$ 20$ 40$ 60$ 80$ 100$
5% 22,511,429$ 188,861,061$ 355,210,693$ 521,560,326$ 687,909,958$ 854,259,590$
6% 19,571,910$ 164,199,777$ 308,827,645$ 453,455,513$ 598,083,381$ 742,711,249$
7% 17,085,663$ 143,341,250$ 269,596,838$ 395,852,426$ 522,108,013$ 648,363,601$
8% 14,973,683$ 125,622,660$ 236,271,638$ 346,920,615$ 457,569,593$ 568,218,571$
9% 13,172,053$ 110,507,771$ 207,843,489$ 305,179,207$ 402,514,925$ 499,850,643$
Discount rate
Social cost of carbon ($/ton)

34
net present value of $0 if we also set the social cost of NOx to be $0/ton; however, we find the
research on the social costs of greenhouse gases to be scientifically and economically compelling
and therefore do not build that scenario into our model. Given our discount rate range of 5-9%
and social cost of carbon of $0-100/ton, we can have an NPV range of $22.5 million to $500
million.
Private Cost Benefit Analysis
Assumptions:
In our private costs analysis, we look first at the basics of the costs and benefits to a private
entity, and then determine the necessary levels of PTC/ITC/Carbon tax to incentivize investment.
We assume that the private entity would begin operations on January 1st, 2014 and would expend
$9 million over the 6 years (non-discounted) on permitting and prospecting fees, salaries, and
other pre-construction costs necessary to begin a wind farm project. We allotted 6 years for this
process as other wind farm projects, notably Cape Wind, have had issues actually beginning
construction and we believe this is enough time to sort out any potential issues (regulatory
approval, private legal issues, PPA signing, and financing). Construction would begin on January
1st 2014 and would take one year to complete.
60 Due to the nature of wind-farm projects, prices
of individual components are not available. Important components include:
1. Turbine materials (blades, tower, and internal components)
2. Power conversion stations (onshore and offshore) for conversion to DC power to be
transmitted to land and reconverted
60
Tittel and Seymour, “N.J must make wind farm permitting process as quick and easy as possible”
35
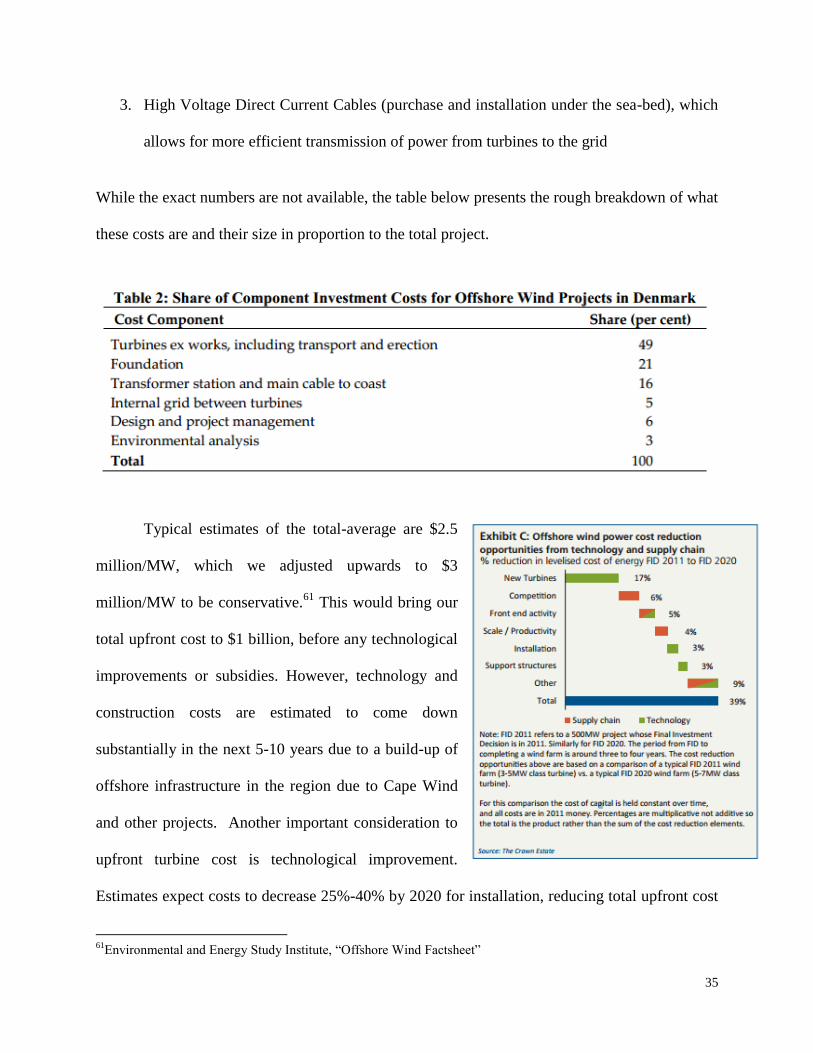
3. High Voltage Direct Current Cables (purchase and installation under the sea-bed), which
allows for more efficient transmission of power from turbines to the grid
While the exact numbers are not available, the table below presents the rough breakdown of what
these costs are and their size in proportion to the total project.
Typical estimates of the total-average are $2.5
million/MW, which we adjusted upwards to $3
million/MW to be conservative.61
This would bring our
total upfront cost to $1 billion, before any technological
improvements or subsidies. However, technology and
construction costs are estimated to come down
substantially in the next 5-10 years due to a build-up of
offshore infrastructure in the region due to Cape Wind
and other projects. Another important consideration to
upfront turbine cost is technological improvement.
Estimates expect costs to decrease 25%-40% by 2020 for installation, reducing total upfront cost
61
Environmental and Energy Study Institute, “Offshore Wind Factsheet”

36
substantially.62
We use the bottom range of this estimate resulting in an upfront cost of $750
million.
Another important cost is maintenance and repair, which is relatively small when
compared to other forms of energy generation, but still meaningful. Current estimates are
roughly $50,000 per MW and we adjust this figure upward to $60,000 per MW. 63
This results in
an annual cost of $15 million.
Finally, decommissioning costs are expected to amount to roughly 5% of total upfront
cost, considering that metal from the turbines may be sold for scrap. 64
This cost, occurring in
2040, would amount to a total of $75 million.
Our private benefits are relatively easy to forecast because the power purchase agreement
guarantees the fixed stream of revenue throughout the operating term of the contract. We
estimate starting value of the PPA to be 15 cents per KW-h with a 3.5% per year escalation.65
This is based off of the Cape Wind PPA, with a slight adjustment downwards to be conservative.
We estimate availability of the generation capacity to be 40% of nameplate capacity through the
year.
We implemented a straight line depreciation schedule with a useful life of 20 years from
the upfront construction cost, meaning there is an annual depreciation expense every year of
1/20th
of the upfront construction cost, with the exceptions of the first year due to construction
and the final year due to decommissioning.
62
Junginger, "COST REDUCTION PROSPECTS FOR THE OFFSHORE WIND ENERGY SECTOR" 63
Tuerck, “The Costs and Economic Impact of Offshore Wind Energy in New Jersey” 64
BOEM, "Technology White Paper on Wind Energy Potential on the U.S. Outer Continental Shelf" 65
Mass. Department of Public Utilities, Wind PPA
37
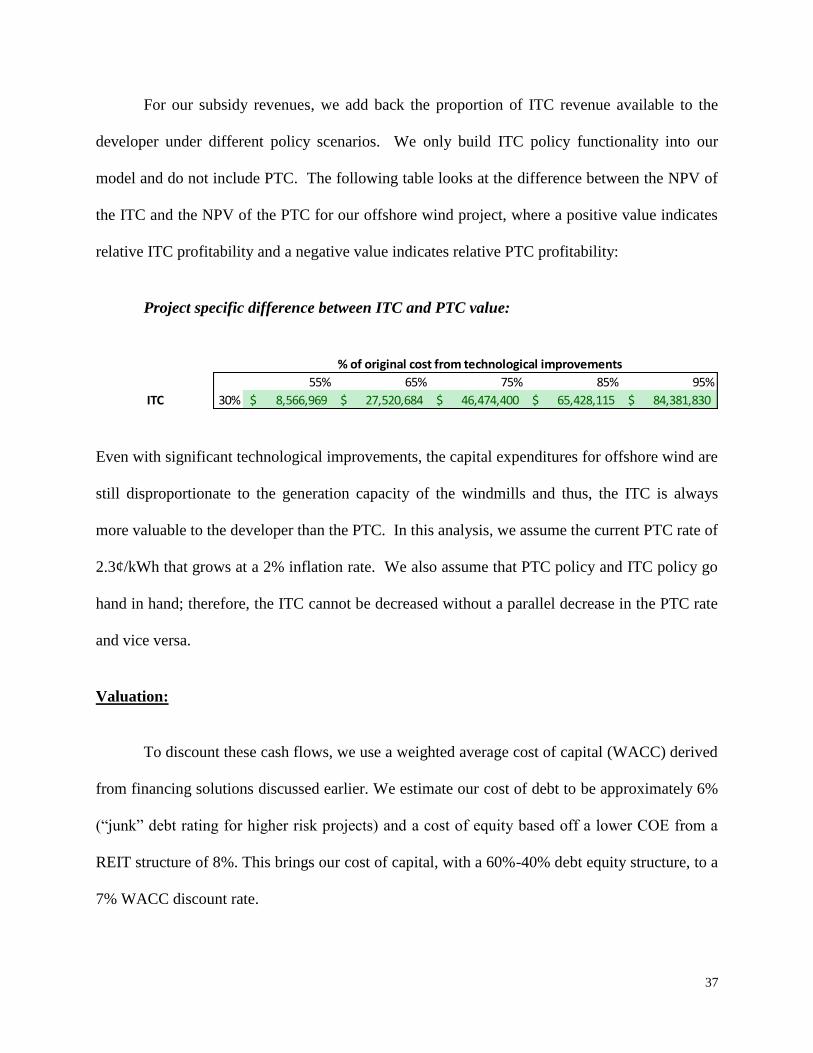
For our subsidy revenues, we add back the proportion of ITC revenue available to the
developer under different policy scenarios. We only build ITC policy functionality into our
model and do not include PTC. The following table looks at the difference between the NPV of
the ITC and the NPV of the PTC for our offshore wind project, where a positive value indicates
relative ITC profitability and a negative value indicates relative PTC profitability:
Project specific difference between ITC and PTC value:
Even with significant technological improvements, the capital expenditures for offshore wind are
still disproportionate to the generation capacity of the windmills and thus, the ITC is always
more valuable to the developer than the PTC. In this analysis, we assume the current PTC rate of
2.3¢/kWh that grows at a 2% inflation rate. We also assume that PTC policy and ITC policy go
hand in hand; therefore, the ITC cannot be decreased without a parallel decrease in the PTC rate
and vice versa.
Valuation:
To discount these cash flows, we use a weighted average cost of capital (WACC) derived
from financing solutions discussed earlier. We estimate our cost of debt to be approximately 6%
(“junk” debt rating for higher risk projects) and a cost of equity based off a lower COE from a
REIT structure of 8%. This brings our cost of capital, with a 60%-40% debt equity structure, to a
7% WACC discount rate.
## 55% 65% 75% 85% 95%
ITC 30% 8,566,969$ 27,520,684$ 46,474,400$ 65,428,115$ 84,381,830$
% of original cost from technological improvements

38
To actually model the private costs and benefits, we built the above listed items into a
schedule of cashflows, starting with exploration and permitting charges in 2014 and ending, like
our social cost benefit analysis, with decommissioning of the project in 2040. To calculate the
cashflow for each year we used the formula below for free cash flow:
( )
( )
To calculate Free Cash Flow (FCF) for a a given year, we first calculated earnings before
interest and depreciation (EBIT) by subtracting operation and maintenance costs and annual
depreciation from our revenue. We then tax-effected this number by using a 35% tax rate and
added back depreciation to this post-tax number as depreciation is a non-cash expense and would
not affect actual cash flow for a given year. Finally, we subtracted capital expenditures for the
year, which were construction costs for 2020 and decommissioning in 2040, and zeroed out
change in net working capital as that value serves no purpose for our analysis.
After calculating cash flow for each year, we discounted all cash flows back to the
present using our weighted average cost of capital (WACC) discussed earlier, which we pegged
at 7%. The formula used is below:
411,214,992.76$ 55% 65% 75% 85% 95%
30% 450,306,682$ 414,172,551$ 378,038,420$ 341,904,289$ 305,770,158$
10% 377,595,572$ 328,241,239$ 278,886,907$ 229,532,574$ 180,178,241$
0% 341,240,017$ 285,275,584$ 229,311,150$ 173,346,717$ 117,382,283$
% of original cost from technological improvements
ITC

39
∑
( )
where n = the year, starting from year 0 and ending in year 26
The sensitivity table below details an internal rate of return (IRR) calculated from
discounted cash flow (DCF) values as a function of the exogenous variables: ITC subsidy
percentages and technological improvement. Technological improvement is measured in this
case as percentage of original cost for construction and materials. We are looking at IRR
because for the purposes of private equity or REIT type investors, it is the most relevant metric.
The IRR of a project is the discount rate that sets the net present value of all cash flows to zero,
and is commonly estimated to be the rate of return on the project. The standard expected rate of
return for an investor is 20%, so we examined the IRRs of this project with the same exogenous
variables in the sensitivity table below:
As the table shows, an IRR equal to or exceeding 20% requires an immense reduction in
cost for construction; we believe this cost reduction to be unrealistic for construction starting in
the next 10 years. Our base case is 75% percent of original construction cost, and as is evidenced
from the table, the IRR is highly sensitive to the ITC in this case. It is clear, therefore, that given
18% 55% 65% 75% 85% 95%
30% 24% 21% 18% 16% 14%
10% 19% 16% 14% 12% 11%
0% 17% 15% 13% 11% 9%
% of original cost from technological improvements
ITC

40
the high-risk and capital-intensive nature of offshore wind projects that substantial cost reduction
would be necessary for them to become an investment option.
VI. Final Policy Recommendations
As seen in our sensitivity analysis above, building an offshore wind farm will never be an
appealing investment to investors if the federal government allows for the ITC to expire post-
2016. Even with the most aggressive estimates of technological improvements almost halving
the construction cost of offshore wind farms, the IRR generated by such a project is still below
the generous 20% IRR threshold. Even if Congress renews the ITC at the decreased level of
10% of capital expenditures, offshore wind projects will still be unable to generate reasonable
returns that will attract investors. Only with the existing ITC structure of 30% can an offshore
wind project generate a 20%+ IRR, and that is only with aggressive technological improvement
estimates of 55-65% of original construction cost.
In order to create an environment that is more conducive to investment in offshore wind,
the federal government must create additional policies that will correct the current energy market
price distortion that ignores the net present social benefit of $1.1 million per MW of offshore
wind operating capacity. Wind is significantly more expensive than traditional power generation
and we will need to develop economies of scale if offshore wind is to become market
competitive in the U.S. The federal government needs to step in to provide financial incentives to
advance wind development and incentivize companies to invest in additional research and
development that will ultimately improve technologies and drive down the costs of offshore
wind. More importantly, the federal government will need to provide strong regulatory guidance

41
for future energy policy aims in order to reduce the risk associated with taking on these long
term projects. The following are federal policy suggestions to help achieve this goal:
Continue federally subsidizing offshore wind production at current levels or higher. As
seen above, the current ITC rate is barely an incentive for investors and a decrease in the
ITC rate will make offshore wind completely inaccessible for investors. Another
possibility would be to create a higher PTC rate for offshore wind projects because the
current PTC rate will never be a financial incentive for offshore wind developers, when
compared to ITC value.
Create a carbon tax to make traditional power generation more expensive and thus, make
offshore wind generation relatively less expensive. However, this will face heavy
opposition in Congress because its effects extend beyond the power industry and will
affect costs of production for all goods and services. In addition, the federal government
will have to do additional analyses on: 1. optimal pricing of the carbon tax and 2. revenue
generating vs. revenue neutral tax.
Continue streamlining the regulatory and permitting processes for U.S. offshore wind
projects. As discussed earlier, the current project timeline (10+ years) creates an
unreasonable amount of procedural risk compounded with financial risk. We will need to
shorten the project approval process if offshore wind is to take off in the U.S.
VII. Final Financing Recommendations
The installation of offshore wind energy farms will require improvements and
innovations in the way development companies raise capital. Indeed, current methods of

42
financing even onshore wind have not entirely met capital demand.66
To date, wind energy
companies have not exhibited strong ambitions to file under regulatory statuses conducive to
attaining cheaper credit, nor have they actively sought to create investment vehicles capable of
reaching a broader set of investors.67
VIIa. Real Estate Investment Trust (REIT) Structure
Applying the Real Estate Investment Trust (REIT) structure to offshore wind energy
projects would make investment in the industry accessible to a broader range of interests
including those of U.S. tax-exempt investors (e.g. private pension funds), foreign portfolio
investors (e.g. foreign sovereign wealth funds) and U.S. retail investors, all entities who have not
yet been tapped in capital sourcing.
REITs were first established under Real Estate Investment Trust Act of 1960 as a means
to allow all investors the opportunity to hold equity in large scale, diversified portfolios of
income-producing real estate. Today, REITs are a source of financing for the owners and
developers of real property, ranging from apartment complexes to shopping malls and health care
facilities. In the United States today, there are 154 publicly traded REITs with an aggregate
market capitalization of over US$400bn in addition to 1,000 privately held REITs.68
Owners and developers of real property may structure their corporation as a REIT by
filing an election with the IRS. To qualify as a REIT, the corporation must “derive at least 75%
of its gross income from rents on real property, be managed by a board of directors and have full
66
North American Windpower. The Role of REITs in Wind Power Finance: 1. 67
Ibid. 68
North American Windpower. The Role of REITs in Wind Power Finance: 1.

43
transferable shares with a minimum of 100 shareholders.”69
The incentive to do so is the
significant reduction, and at times elimination, of the application of the U.S. corporate income
tax as well as the ability to raise equity capital at lower costs. In exchange of the more favorable
capital structure (cheaper equity), REITs are obligated to distribute 90% of their taxable income
in the form of dividends to investors.70
While a wind farm owner or developer would have a relatively straightforward path to
meeting the income, executive management and shareholder requirements of the IRS’s REIT
legislation, questions do arise as to the legality of categorizing wind assets as real estate assets
that are “physically connected and functionally independent.” 71
There is precedent for the IRS
determining that certain energy assets satisfy these criteria. The wind energy assets comprising a
system that transmits energy from a generation source to end users meeting these criteria include
“interests in land, towers or poles that are permanently affixed to the ground, and lines or wires
attached to the towers or poles or buried underground.” 72
Given the overlap between the
description of technology and infrastructure assets behind a wind energy farm and those allowed
to be held in a REIT by the IRS, it is likely that at least some wind energy assets can qualify for
an appealing REIT structure. Indeed, studies of IRS and power and utilities legislation have
determined that certain components of a wind energy farm would qualify for REIT status (the
wind towers and the pads on which they stand), while power-generation equipment itself (the
turbine, nacelle and blades) would not.73
69
Ibid. 70
North American Windpower. The Role of REITs in Wind Power Finance: 1. 71
North American Windpower. The Role of REITs in Wind Power Finance: 2. 72
Practical Law Company. RIETS: A Viable Alternative for Renewable Energy Project Financing?: 2. 73
Ibid.

44
Though a setback, adaptations in the operating structure of the offshore wind farm
developer could be made to allow for an operating entity to own real estate assets while another
entity owns the non-qualifying power generation assets. Dividing the wind project into two
separate taxable pieces, the power generation entity (GENco.) would hold the turbine, nacelle
and blades while the REIT entity (REITco.) would carry out a sale-leaseback structure on the
remainder of the project assets.
Such an adaptation in the operating structure of the farm makes sense not only for the
explicit REIT qualification purposes, but also for the implicit tax benefits. As REITs pay very
minimal (to zero) income tax, they are not eligible to receive the tax credits (ITC and PTC)
traditionally allocated by the government to renewable energy companies. Consequently, it
would be inefficient for the REIT to own power generation assets (the turbine, nacelle and
blades) from which it cannot claim tax benefits. Creating a GENco. entity to hold those assets
would ensure that those credits are captured. Further analysis can be made on a project-by-
project basis to optimize the proportion of total project assets owned by each entity. For
example, because each component of the wind energy system has intrinsic monetary value, it
contributes to income. By allocating certain more expensive, non-tax credit eligible assets into
REITco., and away from GENco., the developer would effectively reduce the income of
GENco., thereby giving GENco. the benefit of collecting higher tax credit awards and allowing
REITco. to distribute higher dividends, drawing investor interest to the vehicle.
VIIb. Renewable Energy Covered Bonds (RECBs)
Creating investment vehicles that can reach a broader set of investors will provide
another method by which offshore wind farm developers can raise capital, an advancement that

45
is especially important in the present environment where bank loan debt has become harder to
raise given stricter Basel III requirements and more conservative, risk-averse banking lending
models.74
This setting of increased constraints leveraged against banks and the rising demand for
debt funding should offshore wind energy farms take off in the United States necessitates a
solution that is present in an existing investment vehicle known as the covered bond. Covered
bonds are fixed income debt securities that are asset backed by a “covered pool” of assets,
guaranteed by the issuing entity. The cover pool of assets is transparent and government
legislation mandates a high level of visibility of the assets being securitized so that investors can
exercise an appropriate level of scrutiny. The unique guaranteed, asset backed quality of covered
bonds makes them a more secure form of senior debt and they consequently carry high credit
ratings.75
These elements of security and credit worthiness appeal to investors who are more risk
averse and desire the additional claim against assets in the investment. At present, covered bonds
have a broad investor base and are issued in forty-two countries around the world.76
Covered bond are as a financing source to support infrastructure development is
especially prominent in Germany, where the securities are known as Pfandbriefe. Established in
2005, the Pfandbriefe has become a common funding source for public sector development such
as housing and commercial real estate in the country. The marquee characteristic of the German
covered bond is the well outlined legislation surrounding the issuance and covered pool of assets.
An independent trustee is appointed to monitor the assets in a cover pool by the Federal
74
Climate Bonds Initiative. How Covered Bond markets can be adapted for Renewable Energy Finance and how
this could Catalyse Innovation in Low-Carbon Capital Markets: 2. 75
Climate Bonds Initiative. How Covered Bond markets can be adapted for Renewable Energy Finance and how
this could Catalyse Innovation in Low-Carbon Capital Markets: 1. 76
Ibid.
46
Financial Supervisory Authority, a government body. In this way, investors can be assured of the
quality and value of the securitized assets behind their claim. Not only does such stringent
oversight provide for a sense of security, spurring investor interest, but it also allows for dynamic
cover pools, an appealing mark for investors concerned with the quality of assets over time. With
an independent trustee monitoring the cover pool, it is able to be dynamic and have its
underlying assets change over time given different time periods of maturity of the bond and
depreciation of the physical assets.77
The success of the German Pfandbriefe and its appeal to investors has spurred countries
around the world to develop the covered bond model for public infrastructure development.78
Among the keys to an effective adoption of the model has been proper public policy guiding the
issuance. Standards for the filing and registration of assets in the covered pool have added
credibility to the claim against the issuer, ensuring that investors feel secure in their purchase of
a covered bond. Furthermore, issuers have made a precedent of distributing additional
information pertaining to the covered pool above the minimum requirement by law.
Given the existing popularity of and trust in covered bonds as a means to support
infrastructure development within the public and private sphere, the use of the securities to
finance renewable energy infrastructure is very compelling. In a social cost-benefit analysis the,
benefits of offshore wind energy are considered to have similar economic multiplier effects as
general public infrastructure such as housing or roads.79
Consequently, it seems very appropriate
to lobby for the establishment of Renewable Energy Covered Bonds (RECBs) as a novel source
77
Climate Bonds Initiative. How Covered Bond markets can be adapted for Renewable Energy Finance and how
this could Catalyse Innovation in Low-Carbon Capital Markets: 8. 78
Climate Bonds Initiative. How Covered Bond markets can be adapted for Renewable Energy Finance and how
this could Catalyse Innovation in Low-Carbon Capital Markets: 9. 79
Ibid.

47
of debt financing to complement Clean Renewable Energy Bonds (CREBs). In the issuance of
RECBs, the underlying cover pool of assets would be comprised of the offshore wind farm’s
physical real estate and power generation assets which would need to be valued, appraised and
depreciated on a regular basis with the watchful eye of an appointed trustee.
Issuance of RECBs would provide an additional source of capital to offshore wind energy
farm developers as their ability to tap banks for outsized loans dwindles in a heightened
regulatory environment. In addition, bond investors would be able to gain exposure to renewable
energy assets with minimal adaptation of existing portfolio guidelines because of the high level
of security offered by covered bonds. To ensure the proper development of a RECB market,
government agencies such as the IRS would need to identify criteria under which they could
guarantee renewable energy projects, which would form a covered asset pool for the issuance.
Over time, investors will become more knowledgeable about RECBs and the regulatory
oversight as well as financial performance of the underlying covered pool, thereby stimulating
development of an RECB market for offshore wind farms.
XIII. Conclusion
Our research upon the technology, policy and financing of offshore wind yielded the following
conclusions:
While currently expensive, offshore wind has the potential to become a highly efficient
means of supplying large amounts of energy.
Developing and streamlining of PTCs, ITCs, and carbon taxes to lower upfront costs of
offshore wind construction would stimulate rapid growth in the space: therefore our

48
policy recommendation is to quickly implement these policies to facilitate investment
into offshore wind.
Applying existing but thus far unexploited financial structures and instruments to
offshore wind funding has the potential to mitigate preventatively high financing costs
and encourage investment into offshore wind.
IX. Areas of Further Research
This conclusion comes with the limitations due to the assumptions used to narrow the scope of
our model. What remains to be seen is a precedent for an offshore wind farm in the U.S.;
however, once such a farm is developed, constructed and operational, further research should
highlight the results of that endeavor. In addition, our cost and benefit estimates (e.g. social cost
of GHG) come with a range of error due to the wide range of research and uncertainty regarding
values. However, we used multiple case scenarios and sensitivity analyses to account for these
potential variations. Further application of statistics and econometrics would advance the accuracy of
our numbers. We would also like to see implementations of our public policy and financing
considerations so that thought papers may be written at a later time to examine the success of
these applications and their role in spearheading the creation of an offshore wind farm and
making the creation more financially viable. At that point, step-by-step instructions can be
written on the proper paths by which public and private institutions can collaborate to spur
further construction of wind farms.

49
X. Acknowledgments
The authors would like to express their gratitude to the course instructors Professor
Stephen Berry and Professor George Tolley for their helpful guidance in accomplishing this
project. Additional comments and informational assistance from Global Energy Group
investment bankers at Credit Suisse (New York) are also appreciated.
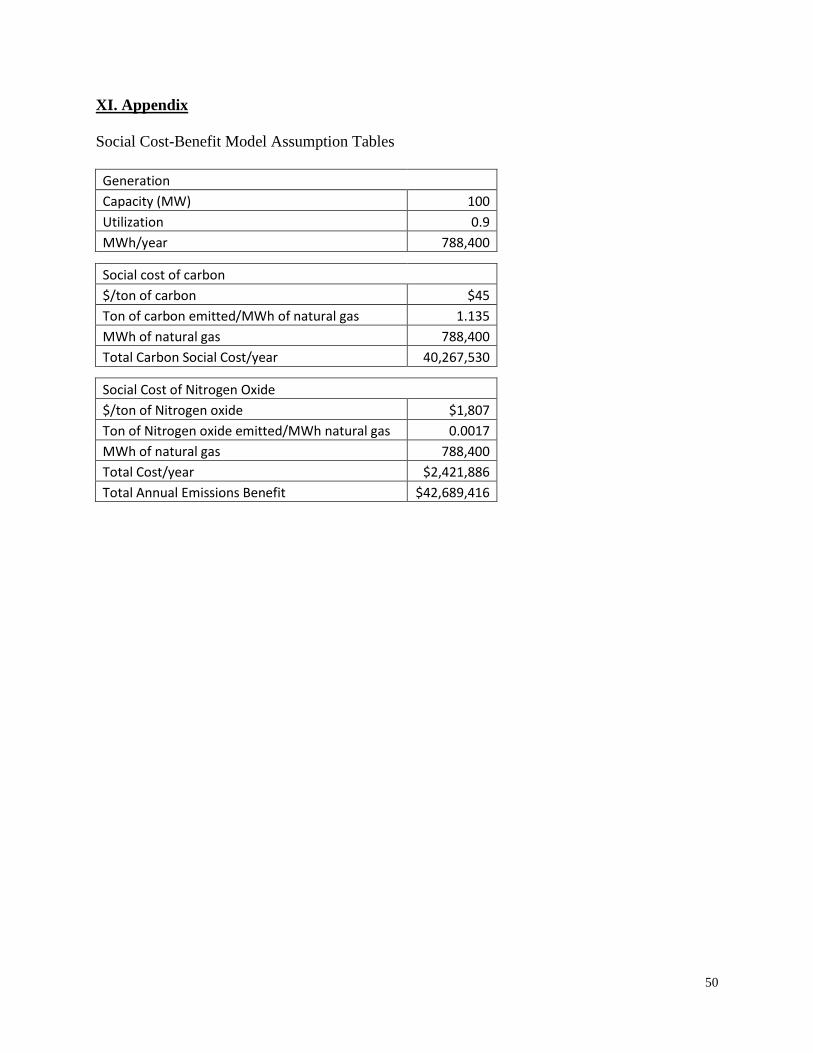
50
XI. Appendix
Social Cost-Benefit Model Assumption Tables
Generation
Capacity (MW) 100
Utilization 0.9
MWh/year 788,400
Social cost of carbon
$/ton of carbon $45
Ton of carbon emitted/MWh of natural gas 1.135
MWh of natural gas 788,400
Total Carbon Social Cost/year 40,267,530
Social Cost of Nitrogen Oxide
$/ton of Nitrogen oxide $1,807
Ton of Nitrogen oxide emitted/MWh natural gas 0.0017
MWh of natural gas 788,400
Total Cost/year $2,421,886
Total Annual Emissions Benefit $42,689,416

51
Discounted Cash Flow Assumptions
Weighted Average Cost of Capital = Discount Rate
Cost of equity 12% % equity 40%
Cost of debt 6% % debt 60%
tax 35% WACC 7%
Base PPA price ($/kWh) 0.15
PPA escalation rate 0.035
Useful life of turbines 20
Tax rate 0.3
Discount rate 7%

52
XII. Bibliography
2012 in review . British Petroleum , 2013. Film. Web.
Burtraw, Dallas, David A. Evans, Alan Krupnick, Karen Palmer, and Russell Toth. Economics of
Pollution Trading for SO2 and NOx. Working paper. Washington D.C.: Resources for the
Future, 2005. Print.
Business Energy Investment Tax Credit (ITC). U.S. Department of Energy, n.d. Web. 07 Dec.
2013.
Carey, Bjorn. "Offshore wind energy could power entire U.S. East Coast." Stanford University .
(2012): n. page. Web. 6 Dec. 2013.
Climate Bonds Initiative. (May 2012). How Covered Bond markets can be adapted for
Renewable Energy Finance and how this could Catalyse Innovation in Low-Carbon
Capital Markets. Web.
"CO2 Budget Trading Program." RGGI, n.d. Web. 07 Dec. 2013.
Edison Mission Energy. "Presentation to Senior Unsecured Noteholders: January 9,2013."
(2013): n. pag. Print.
Commonwealth of Massachusetts . Department of Public Utilities . PPA for Wind Power. 2012.
Web.
European Wind Energy Conference & Exhibition. (2010, April 23). Private Equity Financing for
Offshore Wind Farms During Implementation Phase. Web.
Firestone, Jeremy, and Willett Kempton. "Public opinion about large offshore wind power:
underlying factors." Energy policy 35.3 (2007): 1584-1598.
French energy banker. (2004). Financing wind farms. Web.
Geman, Ben. "CBO: Carbon Tax Chops $1 Trillion from Deficit." The Hill. N.p., 13 Nov. 2013.
Web.
Goossens, Ehren. "Google-Backed Atlantic Offshore Wind Cable Shifts Focus to New
Jersey." Renewable Energy World. Renewable Energy World, 29 Oct. 2013. Web. 06
Dec. 2013.
Junginger, M. "COST REDUCTION PROSPECTS FOR THE OFFSHORE WIND ENERGY
SECTOR." CiteSeer n.pag. Web.
Layton, Julia. "How Wind Power Works." HowStuffWorks. HowStuffWorks, 09 Aug. 2006.
Web. 06 Dec. 2013.
Layton, Julia. "How Wind Power Works." HowStuffWorks. HowStuffWorks, 09 Aug. 2006.
Web. 06 Dec. 2013.

53
Levitan, Dave. "Is U.S. Offshore Wind Power Finally Ready to Take Off?" The Guardian.
Guardian News and Media, 23 Sept. 2013. Web. 06 Dec. 2013.
Marcacci, Silvio. "A $1.6 Million Win In America’s Second Offshore Wind Lease
Auction." CleanTechnica. CleanTechnica, n.d. Web. 06 Dec. 2013.
Mintz Levin Cohn Ferris Glovsky and Popeo PC. (2012). Renewable Energy Project Finance in
the U.S.: An Overview and Midterm Outlook. Web.
Musial, Walter, and Bonnie Ram. Large-scale offshore wind power in the United States:
Assessment of opportunities and barriers. No. NREL/TP-500-40745. National Renewable
Energy Laboratory (NREL), Golden, CO., 2010.
National Offshore Wind Strategy. Rep. US Department of Energy, 7 Feb. 2011. Web.
"Natural Gas Emissions." EPA. Environmental Protection Agency, n.d. Web.
North American Windpower. (May 2011). The Role of REITs in Wind Power Finance. Web.
NREL (National Renewable Energy Laboratory). (2010). Fact Sheet Series on Financing
Renewable Energy Projects.
"Offshore Wind Energy Factsheet." Environmental and Energy Study Institute, 2010. Web.
"Offshore Wind Market." Wind and Water Power Technologies Office. U.S. Department of
Energy Wind and Water Power Technologies Office Funding in the United States, Dec.
2012. Web. 6 Dec. 2013.
"Offshore Wind Market Acceleration Projects." Wind Program - Research and Development.
U.S. Department of Energy, 11 Nov. 2013. Web. 06 Dec. 2013.
Pearce, David. "The social cost of carbon and its policy implications." Oxford review of
economic policy 19.3 (2003): 362-384.
Practical Law Company. (2013). RIETS: A Viable Alternative for Renewable Energy Project
Financing? Web.
Project Finance International. (May 2012). Renewables Report. Web.
Renewable Electricity Production Tax Credit (PTC). U.S. Department of Energy, n.d. Web. 07
Dec. 2013.
"Role of Alternative Energy Sources: Wind Technology Assessment." National Energy
Technology Laboratory. U.S. Department of Energy, 30 Aug. 2013. Web. 01 Dec. 2013.
"RPS and APS Program Summaries." RPS and APS Program Summaries. Massachusetts Office
of Energy and Environmental Affairs, n.d. Web. 05 Dec. 2013.
Technical Support Document: - Technical Update of the Social Cost of Carbon for Regulatory
Impact Analysis - Under Executive Order 12866. Rep. Interagency Working Group on
Social Cost of Carbon, United States Government, Nov. 2013. Web.

54
"The Basics." Evolve Green. N.p., 2008. Web. 1 Dec. 2013.
Tittel, Jeff, and Seymour, Kara. "N.J. must make wind farm permitting process as quick and easy
as possible." New Jersey News Room. New Jersey Sierra Club, 11 06 2009. Web.
Trabish, Herman K. "BP Wind Energy: Undiscouraged and Still Building Wind
Farms."Greentech Media. Greentech Media, 10 Oct. 2010. Web. 06 Dec. 2013.
Trabish, Herman K. "Report: Nuclear Received 4 Times More Subsidies Than Solar in CA."
Greentech Media. Greentech Media, 28 Aug. 2013. Web.
Trabish, Herman K. "Report: Offshore Wind Can Be Installed in Deeper Waters at Cheaper
Cost." Greentech Media. Greentech Media, 10 Sept. 2013. Web. 01 Dec. 2013.
Tuerck, David. "The Costs and Economic Impact of Offshore Wind in New Jersey." Beacon Hill
Institute . (2011): n. page. Web. 6 Dec. 2013.
United Kingdom. Department of Energy and Climate Change. UK Offshore Energy Strategic
Assessment . 2009. Web.
United States. Bureau of Ocean Energy. Technology White Paper on Wind Energy Potential on
the U.S. Outer Continental Shelf. 2006. Web.
United States. EIA. International Energy Outlook 2013. EIA, n.d. Web.
US Department of Interior. Interior Holds First-Ever Competitive Lease Sale for Renewable
Energy in Federal Waters. DOI.gov. N.p., 31 July 2013. Web.
U.S. Partnership for Renewable Energy Finance. (2012) Tax Credits, Tax Equity and
Alternatives to Spur Clean Energy Financing.
Vega, Cecilia. "Tesla, Toyota to Build Electric Cars at NUMMI." ABC News [Palo Alto, CA] 21
May 2010: n. pag. Print.
"Wind Energy." ATSE STELR Project. ATSE STELR, n.d. Web. 06 Dec. 2013.
"Wind Program – Research & Development." Wind Program: Offshore Wind Research and
Development. U.S. Department of Energy, 22 Oct. 2013. Web. 06 Dec. 2013.
Windustry. (2012). Power Purchase Agreement. http://www.windustry.org/community-
wind/toolbox/chapter-13-power-purchase-agreement