Embed Size (px)
Citation preview
Important disclosures and certifications are contained from page 7 of this report. www.danskeresearch.com
Investment Research — General Market Conditions
Jobs report preview
The October jobs report is due out on Friday (13:30 CET) and will provide important
input in the Fed’s decision as to whether it hikes or not in December. Thus, we may
change our current call for ‘no Fed hike’ this year after the release. For more on the
Fed, read our FOMC Preview: Fed to stay on hold this week - likelihood of a December
hike has increased due to better economic data, 31 October 2016.
Labour market data in October was mixed. Claims figures continue to signal job growth
well above 200,000 while the PMI employment index for October points to only modest
growth of just above 100,000. We estimate job growth was 170,000 in October (in line
with consensus), slightly higher than September’s growth of 156,000 jobs. We estimate
job growth in October was driven primarily by the private service sector with around
160,000 jobs added here. We expect the more cyclically-sensitive construction and
manufacturing sectors to have added 20,000 in total in October, as the economy has gained
a little momentum recently.
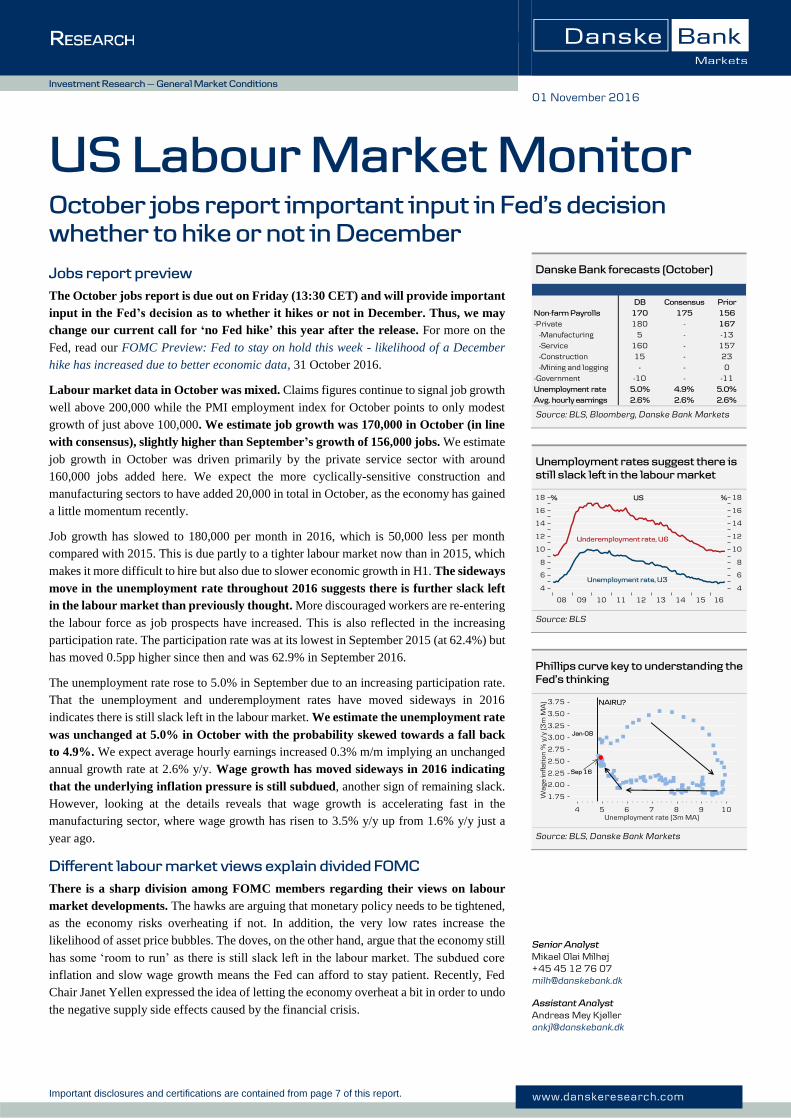
Job growth has slowed to 180,000 per month in 2016, which is 50,000 less per month
compared with 2015. This is due partly to a tighter labour market now than in 2015, which
makes it more difficult to hire but also due to slower economic growth in H1. The sideways
move in the unemployment rate throughout 2016 suggests there is further slack left
in the labour market than previously thought. More discouraged workers are re-entering
the labour force as job prospects have increased. This is also reflected in the increasing
participation rate. The participation rate was at its lowest in September 2015 (at 62.4%) but
has moved 0.5pp higher since then and was 62.9% in September 2016.
The unemployment rate rose to 5.0% in September due to an increasing participation rate.
That the unemployment and underemployment rates have moved sideways in 2016
indicates there is still slack left in the labour market. We estimate the unemployment rate
was unchanged at 5.0% in October with the probability skewed towards a fall back
to 4.9%. We expect average hourly earnings increased 0.3% m/m implying an unchanged
annual growth rate at 2.6% y/y. Wage growth has moved sideways in 2016 indicating
that the underlying inflation pressure is still subdued, another sign of remaining slack.
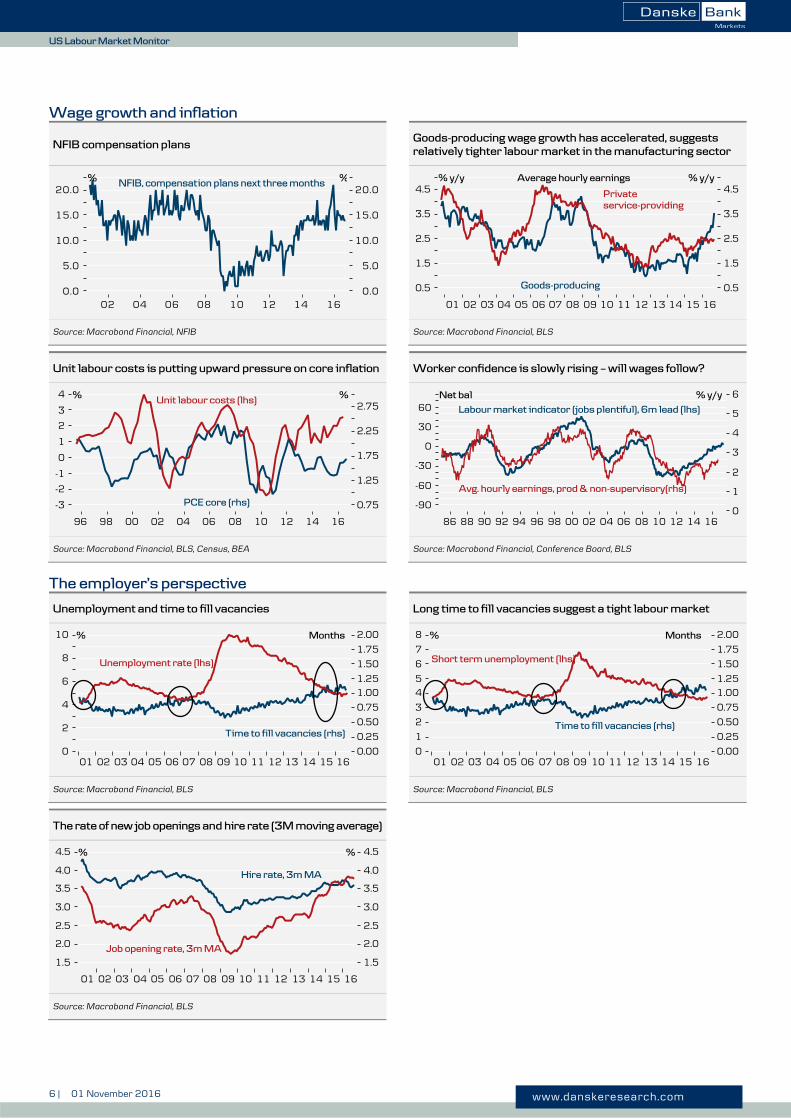
However, looking at the details reveals that wage growth is accelerating fast in the
manufacturing sector, where wage growth has risen to 3.5% y/y up from 1.6% y/y just a
year ago.
Different labour market views explain divided FOMC
There is a sharp division among FOMC members regarding their views on labour
market developments. The hawks are arguing that monetary policy needs to be tightened,
as the economy risks overheating if not. In addition, the very low rates increase the
likelihood of asset price bubbles. The doves, on the other hand, argue that the economy still
has some ‘room to run’ as there is still slack left in the labour market. The subdued core
inflation and slow wage growth means the Fed can afford to stay patient. Recently, Fed
Chair Janet Yellen expressed the idea of letting the economy overheat a bit in order to undo
the negative supply side effects caused by the financial crisis.
01 November 2016
Senior Analyst Mikael Olai Milhøj +45 45 12 76 07 [email protected]
Assistant Analyst Andreas Mey Kjøller [email protected]
US Labour Market Monitor
October jobs report important input in Fed’s decision
whether to hike or not in December
Danske Bank forecasts (October)
Source: BLS, Bloomberg, Danske Bank Markets
Unemployment rates suggest there is
still slack left in the labour market
Source: BLS
Phillips curve key to understanding the
Fed’s thinking
Source: BLS, Danske Bank Markets
DB Consensus Prior
Non-farm Payrolls 170 175 156
-Private 180 - 167
-Manufacturing 5 - -13
-Service 160 - 157
-Construction 15 - 23
-Mining and logging - - 0
-Government -10 - -11
Unemployment rate 5.0% 4.9% 5.0%
Avg. hourly earnings 2.6% 2.6% 2.6%
2 | 01 November 2016 www.danskeresearch.com
US
Lab
ou
r Ma
rket M
on
itor
US Labour Market Monitor
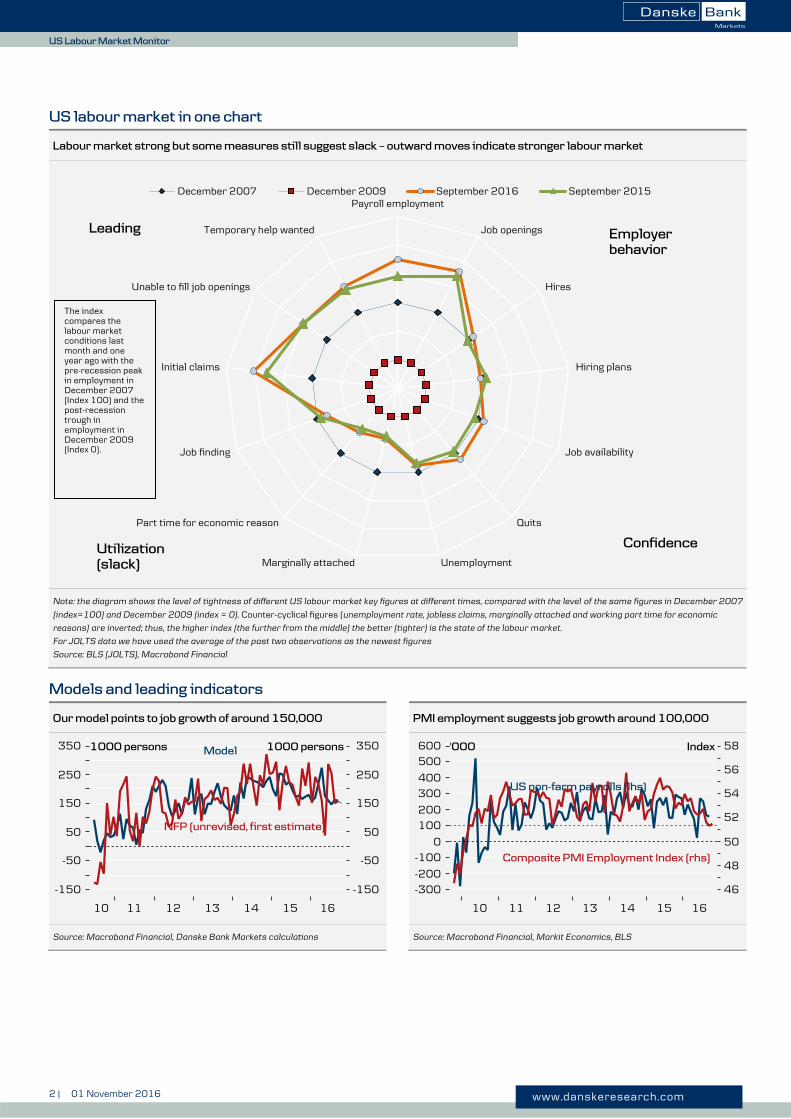
US labour market in one chart
Labour market strong but some measures still suggest slack – outward moves indicate stronger labour market
Note: the diagram shows the level of tightness of different US labour market key figures at different times, compared with the level of the same figures in December 2007
(index=100) and December 2009 (index = 0). Counter-cyclical figures (unemployment rate, jobless claims, marginally attached and working part time for economic
reasons) are inverted; thus, the higher index (the further from the middle) the better (tighter) is the state of the labour market.
For JOLTS data we have used the average of the past two observations as the newest figures
Source: BLS (JOLTS), Macrobond Financial
Models and leading indicators
Our model points to job growth of around 150,000 PMI employment suggests job growth around 100,000
Source: Macrobond Financial, Danske Bank Markets calculations Source: Macrobond Financial, Markit Economics, BLS
Payroll employment
Job openings
Hires
Hiring plans
Job availability
Quits
UnemploymentMarginally attached
Part time for economic reason
Job finding
Initial claims
Unable to fill job openings
Temporary help wanted
December 2007 December 2009 September 2016 September 2015
LeadingEmployer
behavior
Utilization
(slack)
Confidence
The index compares the labour market conditions last month and one year ago with the pre-recession peak in employment in December 2007 (Index 100) and the post-recession trough in employment in December 2009 (Index 0).
3 | 01 November 2016 www.danskeresearch.com
US
Lab
ou
r Ma
rket M
on
itor
US Labour Market Monitor
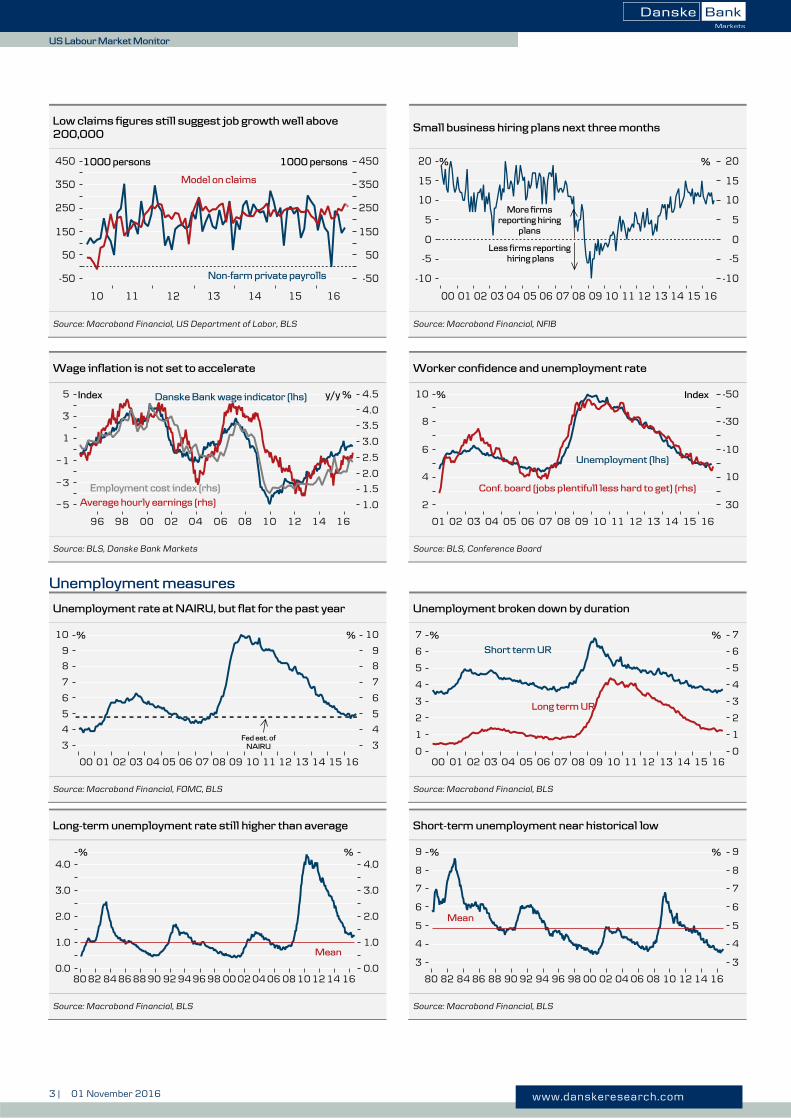
Low claims figures still suggest job growth well above
200,000 Small business hiring plans next three months
Source: Macrobond Financial, US Department of Labor, BLS Source: Macrobond Financial, NFIB
Wage inflation is not set to accelerate Worker confidence and unemployment rate
Source: BLS, Danske Bank Markets Source: BLS, Conference Board
Unemployment measures
Unemployment rate at NAIRU, but flat for the past year Unemployment broken down by duration
Source: Macrobond Financial, FOMC, BLS Source: Macrobond Financial, BLS
Long-term unemployment rate still higher than average Short-term unemployment near historical low
Source: Macrobond Financial, BLS Source: Macrobond Financial, BLS
4 | 01 November 2016 www.danskeresearch.com
US
Lab
ou
r Ma
rket M
on
itor
US Labour Market Monitor
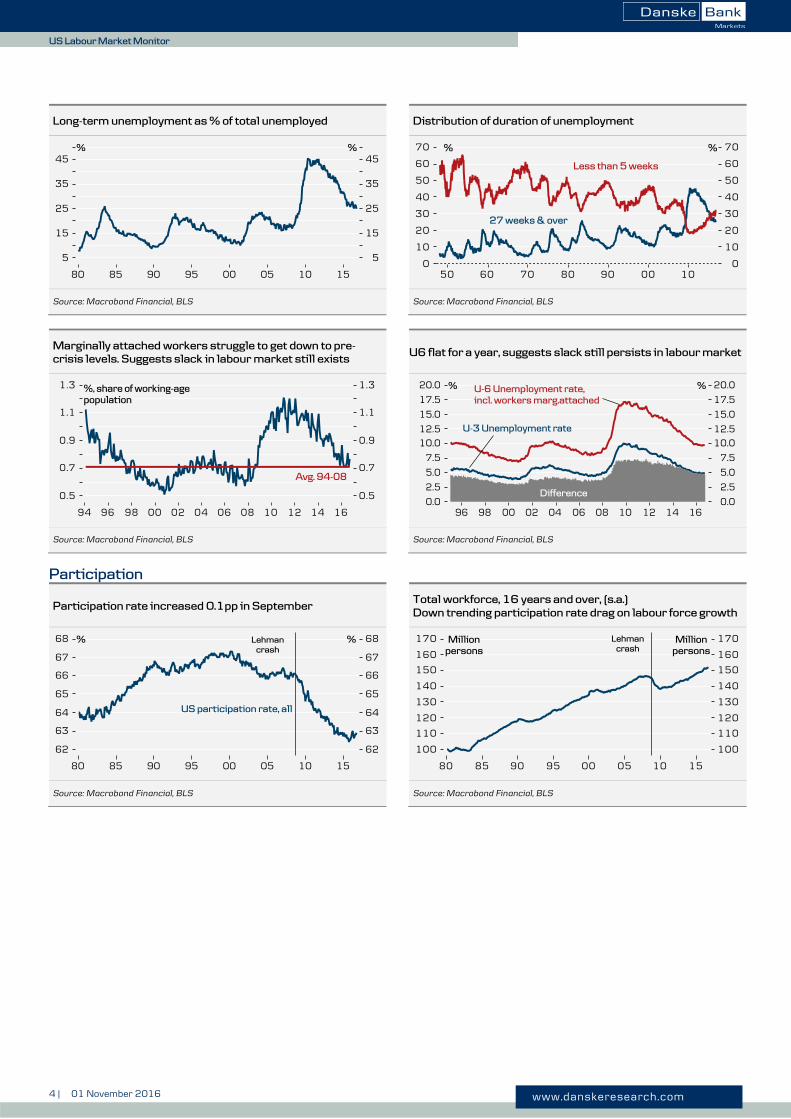
Long-term unemployment as % of total unemployed Distribution of duration of unemployment
Source: Macrobond Financial, BLS Source: Macrobond Financial, BLS
Marginally attached workers struggle to get down to pre-
crisis levels. Suggests slack in labour market still exists U6 flat for a year, suggests slack still persists in labour market
Source: Macrobond Financial, BLS Source: Macrobond Financial, BLS
Participation
Participation rate increased 0.1pp in September Total workforce, 16 years and over, (s.a.)
Down trending participation rate drag on labour force growth
Source: Macrobond Financial, BLS Source: Macrobond Financial, BLS
5 | 01 November 2016 www.danskeresearch.com
US
Lab
ou
r Ma
rket M
on
itor
US Labour Market Monitor
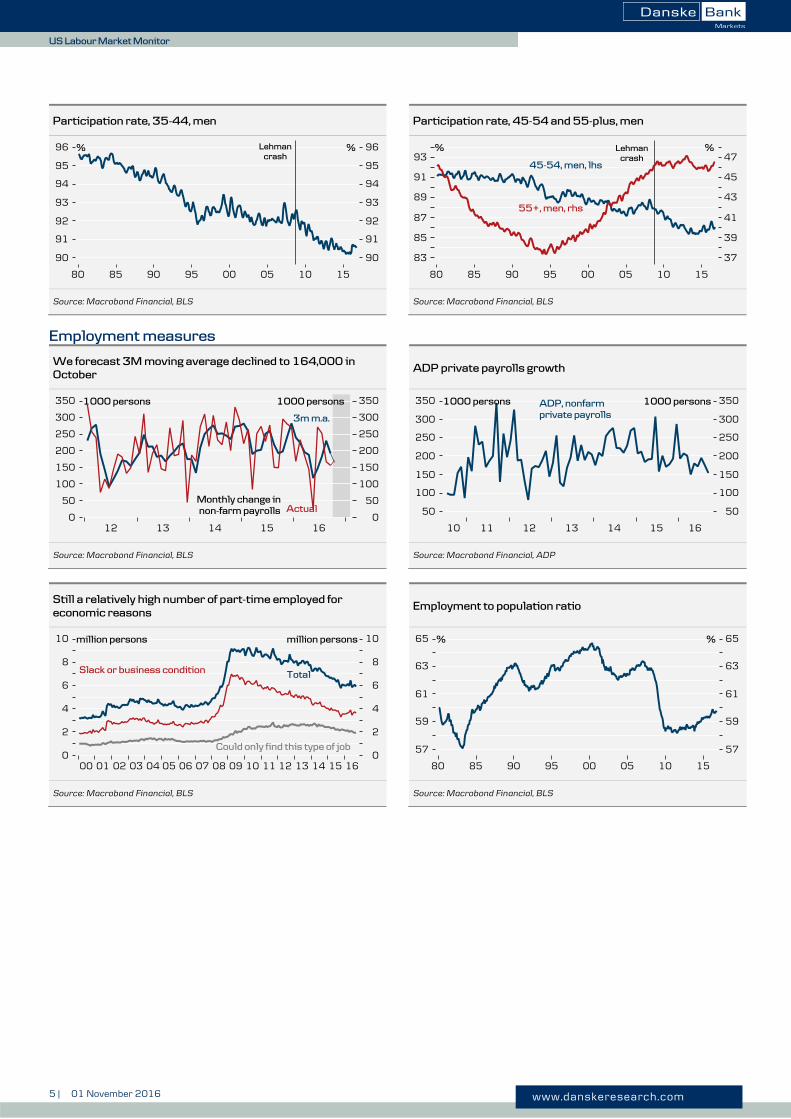
Participation rate, 35-44, men Participation rate, 45-54 and 55-plus, men
Source: Macrobond Financial, BLS Source: Macrobond Financial, BLS
Employment measures
We forecast 3M moving average declined to 164,000 in
October ADP private payrolls growth
Source: Macrobond Financial, BLS Source: Macrobond Financial, ADP
Still a relatively high number of part-time employed for
economic reasons Employment to population ratio
Source: Macrobond Financial, BLS Source: Macrobond Financial, BLS
6 | 01 November 2016 www.danskeresearch.com
US
Lab
ou
r Ma
rket M
on
itor
US Labour Market Monitor
Wage growth and inflation
NFIB compensation plans Goods-producing wage growth has accelerated, suggests
relatively tighter labour market in the manufacturing sector
Source: Macrobond Financial, NFIB Source: Macrobond Financial, BLS
Unit labour costs is putting upward pressure on core inflation Worker confidence is slowly rising – will wages follow?
Source: Macrobond Financial, BLS, Census, BEA Source: Macrobond Financial, Conference Board, BLS
The employer’s perspective
Unemployment and time to fill vacancies Long time to fill vacancies suggest a tight labour market
Source: Macrobond Financial, BLS Source: Macrobond Financial, BLS
The rate of new job openings and hire rate (3M moving average)
Source: Macrobond Financial, BLS
7 | 01 November 2016 www.danskeresearch.com
US
Lab
ou
r Ma
rket M
on
itor
US Labour Market Monitor
Disclosures This research report has been prepared by Danske Bank Markets, a division of Danske Bank A/S (‘Danske Bank’).
The authors of this research report are listed on the front page.
Analyst certification
Each research analyst responsible for the content of this research report certifies that the views expressed in the
research report accurately reflect the research analyst’s personal view about the financial instruments and issuers
covered by the research report. Each responsible research analyst further certifies that no part of the compensation
of the research analyst was, is or will be, directly or indirectly, related to the specific recommendations expressed
in the research report.
Regulation
Danske Bank is authorised and subject to regulation by the Danish Financial Supervisory Authority and is subject
to the rules and regulation of the relevant regulators in all other jurisdictions where it conducts business. Danske
Bank is subject to limited regulation by the Financial Conduct Authority and the Prudential Regulation Authority
(UK). Details on the extent of the regulation by the Financial Conduct Authority and the Prudential Regulation
Authority are available from Danske Bank on request.
The research reports of Danske Bank are prepared in accordance with the Danish Finance Society’s rules of ethics
and the recommendations of the Danish Securities Dealers Association.
Conflicts of interest
Danske Bank has established procedures to prevent conflicts of interest and to ensure the provision of high-quality
research based on research objectivity and independence. These procedures are documented in Danske Bank’s
research policies. Employees within Danske Bank’s Research Departments have been instructed that any request
that might impair the objectivity and independence of research shall be referred to Research Management and the
Compliance Department. Danske Bank’s Research Departments are organised independently from and do not report
to other business areas within Danske Bank.
Research analysts are remunerated in part based on the overall profitability of Danske Bank, which includes
investment banking revenues, but do not receive bonuses or other remuneration linked to specific corporate finance
or debt capital transactions.
Financial models and/or methodology used in this research report
Calculations and presentations in this research report are based on standard econometric tools and methodology as
well as publicly available statistics for each individual security, issuer and/or country. Documentation can be
obtained from the authors on request.
Risk warning
Major risks connected with recommendations or opinions in this research report, including a sensitivity analysis of
relevant assumptions, are stated throughout the text.
Expected updates
None.
Date of first publication
See the front page of this research report for the date of first publication.
General disclaimer This research has been prepared by Danske Bank Markets (a division of Danske Bank A/S). It is provided for
informational purposes only. It does not constitute or form part of, and shall under no circumstances be considered
as, an offer to sell or a solicitation of an offer to purchase or sell any relevant financial instruments (i.e. financial
instruments mentioned herein or other financial instruments of any issuer mentioned herein and/or options,
warrants, rights or other interests with respect to any such financial instruments) (‘Relevant Financial Instruments’).
The research report has been prepared independently and solely on the basis of publicly available information that
Danske Bank considers to be reliable. While reasonable care has been taken to ensure that its contents are not untrue
or misleading, no representation is made as to its accuracy or completeness and Danske Bank, its affiliates and
subsidiaries accept no liability whatsoever for any direct or consequential loss, including without limitation any
loss of profits, arising from reliance on this research report.
The opinions expressed herein are the opinions of the research analysts responsible for the research report and
reflect their judgement as of the date hereof. These opinions are subject to change, and Danske Bank does not
undertake to notify any recipient of this research report of any such change nor of any other changes related to the
information provided in this research report.
This research report is not intended for, and may not be redistributed to, retail customers in the United Kingdom or
the United States.
This research report is protected by copyright and is intended solely for the designated addressee. It may not be
reproduced or distributed, in whole or in part, by any recipient for any purpose without Danske Bank’s prior written
consent.
8 | 01 November 2016 www.danskeresearch.com
US
Lab
ou
r Ma
rket M
on
itor
US Labour Market Monitor
Disclaimer related to distribution in the United States This research report was created by Danske Bank A/S and is distributed in the United States by Danske Markets
Inc., a U.S. registered broker-dealer and subsidiary of Danske Bank A/S, pursuant to SEC Rule 15a-6 and related
interpretations issued by the U.S. Securities and Exchange Commission. The research report is intended for
distribution in the United States solely to ‘U.S. institutional investors’ as defined in SEC Rule 15a-6. Danske
Markets Inc. accepts responsibility for this research report in connection with distribution in the United States solely
to ‘U.S. institutional investors’.
Danske Bank is not subject to U.S. rules with regard to the preparation of research reports and the independence of
research analysts. In addition, the research analysts of Danske Bank who have prepared this research report are not
registered or qualified as research analysts with the NYSE or FINRA but satisfy the applicable requirements of a
non-U.S. jurisdiction.
Any U.S. investor recipient of this research report who wishes to purchase or sell any Relevant Financial Instrument
may do so only by contacting Danske Markets Inc. directly and should be aware that investing in non-U.S. financial
instruments may entail certain risks. Financial instruments of non-U.S. issuers may not be registered with the U.S.
Securities and Exchange Commission and may not be subject to the reporting and auditing standards of the U.S.
Securities and Exchange Commission.