Embed Size (px)
Citation preview

Turning labour market information into labour
market intelligencePaul Bivand
Inclusion
Developments
SourcesMethodsVisualisationBeing up to the minute
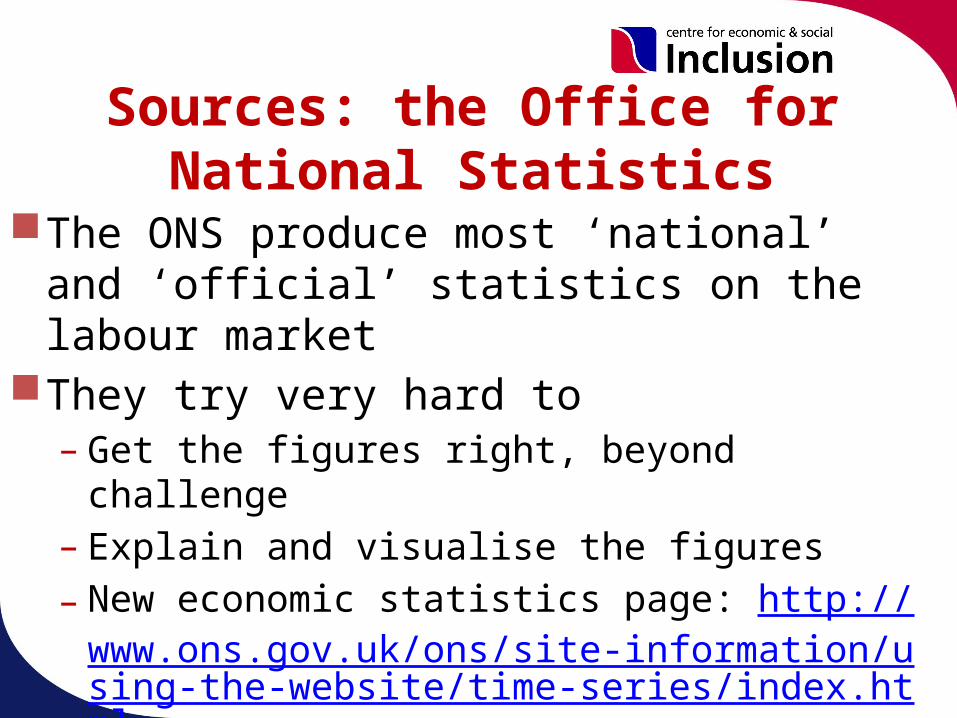
Sources: the Office for National Statistics
The ONS produce most ‘national’ and ‘official’ statistics on the labour market
They try very hard to – Get the figures right, beyond challenge– Explain and visualise the figures– New economic statistics page: http://
www.ons.gov.uk/ons/site-information/using-the-website/time-series/index.html
– Youtube https://www.youtube.com/user/onsstats
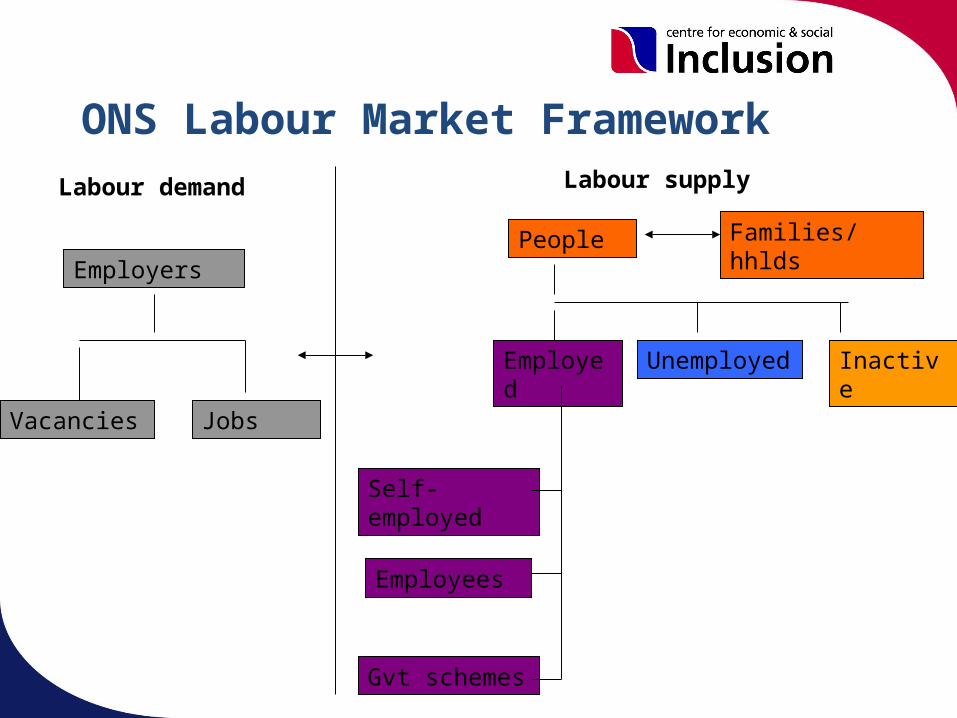
ONS Labour Market Framework
People Families/hhlds
Labour supplyLabour demand
Employed Unemployed Inactive
Self-employed
Employees
Gvt schemes
Employers
Vacancies Jobs
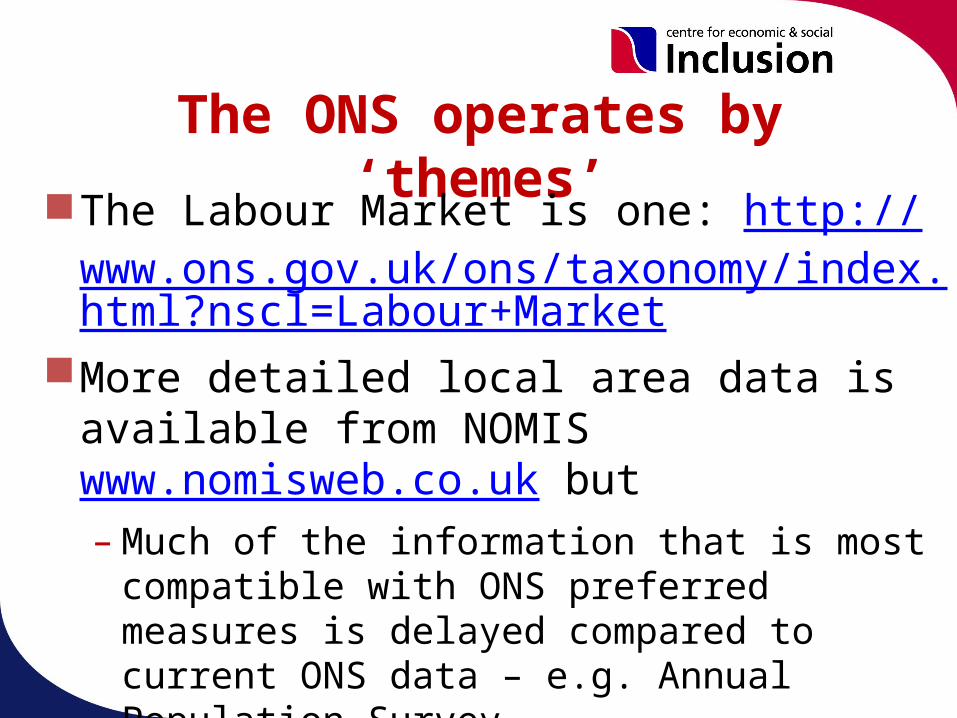
The ONS operates by ‘themes’The Labour Market is one: http://
www.ons.gov.uk/ons/taxonomy/index.html?nscl=Labour+Market
More detailed local area data is available from NOMIS www.nomisweb.co.uk but– Much of the information that is most
compatible with ONS preferred measures is delayed compared to current ONS data – e.g. Annual Population Survey
– And not seasonally adjusted, which can confuse

Visualising expressed demand for skills and
occupationsUsing earnings surveys – the Annual
Survey of Hours and EarningsAnd the Labour Force Survey –
looking at people who have started jobs in the previous three months– Can include people moving jobs
What’s expressed demand?
Employers pay earnings packages they need to recruit, retain and motivate staff
Relative pay therefore encodes some features of expressed demand
So do changes in relative pay, and changes in numbers employed
Only two chartsMy
first chart shows ASHE annual earnings by occupation
Showing the earnings distribution by boxplots – so the hinges are quartiles and the whiskers are deciles
Ordered the occupations by median pay
I’ve then coloured the fill of each box to show the qualification level of recruits

Labour Force Survey analysisWe now have eight quarters of LFS
coded to SOC 20107.2 million (weighted) instances of
jobs starting in the previous 3 months – recruits
Have estimated the qualification level of recruits
Information for 353 out of 369 4-digit occupation groups

This tells usWhat is the pay range for each
occupation – what employers are paying
What qualifications are held by job starters
Could have coloured by:Numbers of job starters – giving a
different picture
This is just a static analysisASHE gives us the opportunity to
measure changeHowever, the change in Occupation
Classification means that any medium-term change can only be done up to 2011 or the 2011-12 change
Single year changes contain random effects (like when pay reviews happen early or late)
Relative rises and fallsWe have plotted the change in earnin
gs 2006-11 and in ASHE employee numbers 2006-11
We have coloured the occupations by the qualification level of new job entrants in 2009-10 – with red as high qualified this time
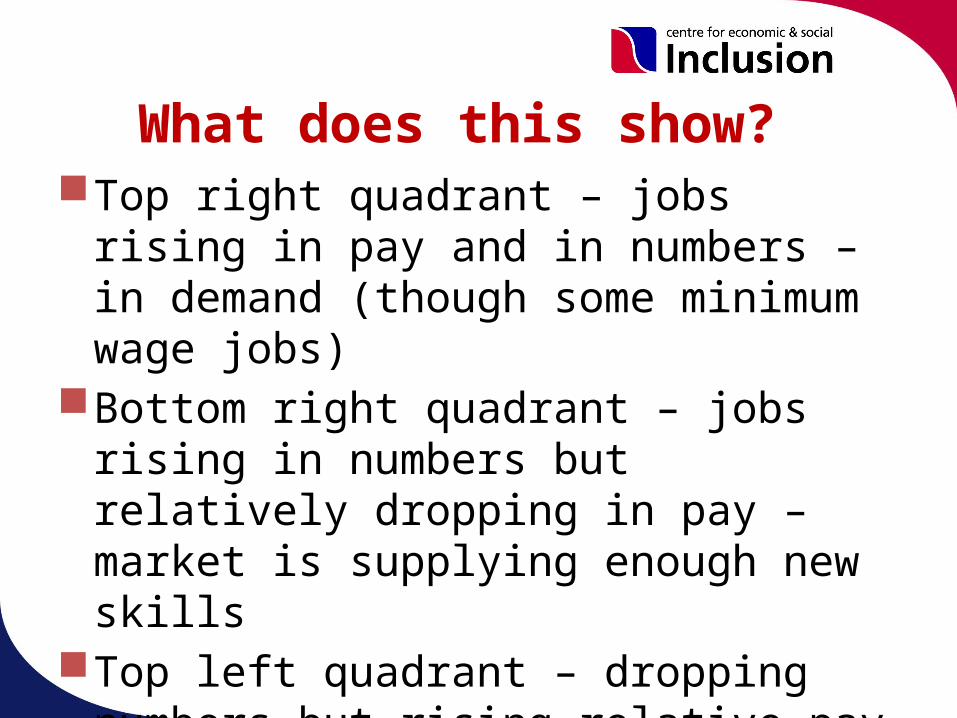
What does this show?Top right quadrant – jobs rising in pay
and in numbers – in demand (though some minimum wage jobs)
Bottom right quadrant – jobs rising in numbers but relatively dropping in pay – market is supplying enough new skills
Top left quadrant – dropping numbers but rising relative pay – employers making a market response to recruit when careers more risky
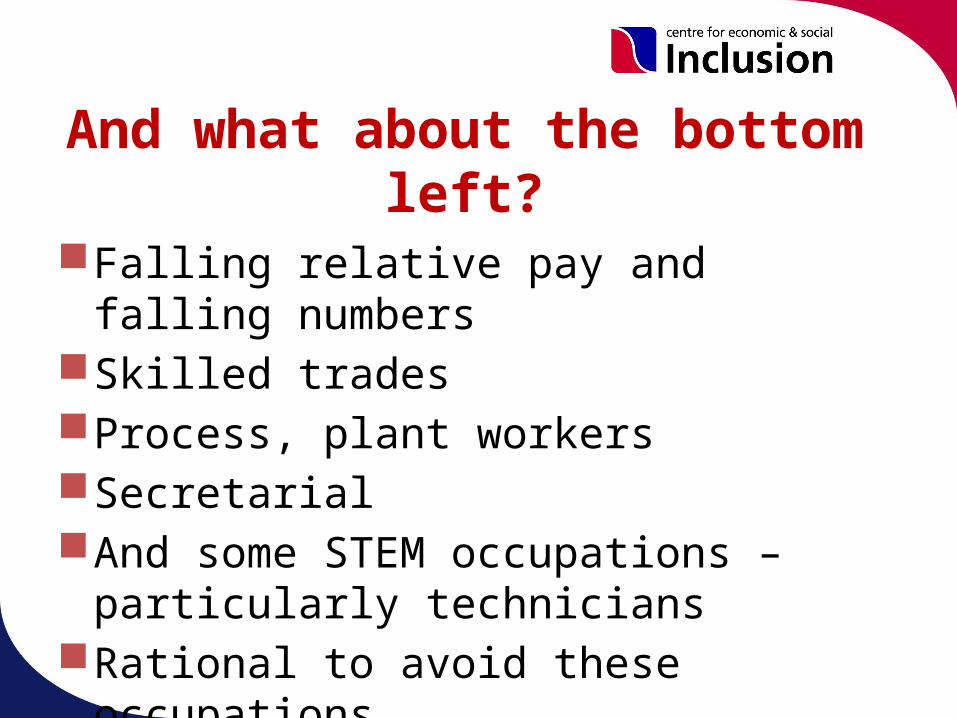
And what about the bottom left?
Falling relative pay and falling numbers
Skilled tradesProcess, plant workersSecretarialAnd some STEM occupations –
particularly techniciansRational to avoid these occupations
Visualisation: the next big thing
The ONS visualisations we saw earlier are useful,
because they enable users not only to interact,
but also to download copies in a range of formats
As well as the underlying data
More information will be circulated...
A couple of years ago I prepared a set of course notes on labour market information– How to use NOMIS (still good)– How to use Neighbourhood Statistics
(mostly still works)– Other Government departments – the
move to GOV.UK has changed most things

![British Columbia Labour Market Outlook 2010 - 2020 · Labour Market OutlookLabour Market Outlook British Columbia Labour Market Outlook: 2010-2020 [2] B.C. Labour Market Outlook,](https://img.pdfslide.us/doc/110x75/5e167e8e481eae63a43f8127/british-columbia-labour-market-outlook-2010-2020-labour-market-outlooklabour-market.jpg)