Embed Size (px)
Citation preview

EPA and Hardrock Mining: A Source Book for Industry in the Northwest and Alaska
January 2003
APPENDIX C
CHARACTERIZATION OF ORE, WASTE ROCK, AND TAILINGS

EPA and Hardrock Mining: A Source Book for Industry in the Northwest and AlaskaAppendix C: Characterization of Ore, Waste Rock, and Tailings
C-i January 2003
TABLE OF CONTENTS
1.0 GOALS AND PURPOSE OF THE APPENDIX . . . . . . . . . . . . . . . . . . . . . . . . . . . . . . C-1
2.0 ANALYSIS OF PHYSICAL CHARACTERISTICS . . . . . . . . . . . . . . . . . . . . . . . . . . . C-12.1 Extent of Analysis . . . . . . . . . . . . . . . . . . . . . . . . . . . . . . . . . . . . . . . . . . . . . . . . . C-12.2 Physical Parameters . . . . . . . . . . . . . . . . . . . . . . . . . . . . . . . . . . . . . . . . . . . . . . . . C-22.3 Mineralogical Composition . . . . . . . . . . . . . . . . . . . . . . . . . . . . . . . . . . . . . . . . . . C-3
3.0 ANALYSIS OF CHEMICAL COMPOSITION . . . . . . . . . . . . . . . . . . . . . . . . . . . . . . . C-43.1 Analysis of Solids . . . . . . . . . . . . . . . . . . . . . . . . . . . . . . . . . . . . . . . . . . . . . . . . . . C-43.2 Analysis of Liquids . . . . . . . . . . . . . . . . . . . . . . . . . . . . . . . . . . . . . . . . . . . . . . . . C-6
4.0 ANALYSIS OF CONTAMINANT MOBILITY FROM SOLIDS . . . . . . . . . . . . . . . . . C-84.1 Mineralogical Considerations . . . . . . . . . . . . . . . . . . . . . . . . . . . . . . . . . . . . . . . . C-84.2 Physical Considerations . . . . . . . . . . . . . . . . . . . . . . . . . . . . . . . . . . . . . . . . . . . . . C-94.3 Acid Generation Potential . . . . . . . . . . . . . . . . . . . . . . . . . . . . . . . . . . . . . . . . . . . C-9
4.3.1 Static Tests . . . . . . . . . . . . . . . . . . . . . . . . . . . . . . . . . . . . . . . . . . . . . . . C-104.3.1.1 Acid-Base Accounting Tests . . . . . . . . . . . . . . . . . . . . . . . . . . . C-11
4.3.1.1.1 Methods to Determine Acid Generating Potential . C-114.3.1.1.2 Methods to Determine Acid Neutralizing Potential C-13
4.3.1.2 Static Tests that Produce a Single Indicator Value . . . . . . . . . . C-154.3.1.3 Interpreting Static Test Results . . . . . . . . . . . . . . . . . . . . . . . . C-154.3.1.4 State Recommendations . . . . . . . . . . . . . . . . . . . . . . . . . . . . . . C-16
4.3.2 Kinetic Tests . . . . . . . . . . . . . . . . . . . . . . . . . . . . . . . . . . . . . . . . . . . . . . . C-184.3.2.1 Kinetic Test Methods . . . . . . . . . . . . . . . . . . . . . . . . . . . . . . . . C-18
4.3.2.1.1 Conventional and Modified Conventional HumidityCells . . . . . . . . . . . . . . . . . . . . . . . . . . . . . . . . . . . . . C-18
4.3.2.1.2 SRK Humidity Cells . . . . . . . . . . . . . . . . . . . . . . . . C-194.3.2.1.3 Soxhlet Extractions . . . . . . . . . . . . . . . . . . . . . . . . . C-204.3.2.1.4 Column Tests . . . . . . . . . . . . . . . . . . . . . . . . . . . . . . C-204.3.2.1.5 Shake Flask Extractions . . . . . . . . . . . . . . . . . . . . . C-214.3.2.1.6 Field Tests . . . . . . . . . . . . . . . . . . . . . . . . . . . . . . . . C-21
4.3.2.2 Interpreting Kinetic Test Results . . . . . . . . . . . . . . . . . . . . . . . C-214.3.2.3 State Recommendations . . . . . . . . . . . . . . . . . . . . . . . . . . . . . C-23
4.3.3 Other Methods . . . . . . . . . . . . . . . . . . . . . . . . . . . . . . . . . . . . . . . . . . . . . C-234.3.4 Mathematical Models . . . . . . . . . . . . . . . . . . . . . . . . . . . . . . . . . . . . . . . . C-23
4.4 Leaching Procedures . . . . . . . . . . . . . . . . . . . . . . . . . . . . . . . . . . . . . . . . . . . . . . C-244.4.1 U.S. EPA Procedures . . . . . . . . . . . . . . . . . . . . . . . . . . . . . . . . . . . . . . . . C-25
4.4.1.1 EP Toxicity Test . . . . . . . . . . . . . . . . . . . . . . . . . . . . . . . . . . . . C-254.4.1.2 Toxicity Characteristic Leaching Procedure Test . . . . . . . . . . . C-254.4.1.3 Synthetic Precipitation Leaching Procedure Test . . . . . . . . . . . C-254.4.1.4 Monofilled Waste Extraction Procedure . . . . . . . . . . . . . . . . . . C-26
EPA and Hardrock Mining: A Source Book for Industry in the Northwest and AlaskaAppendix C: Characterization of Ore, Waste Rock, and Tailings
C-ii January 2003
TABLE OF CONTENTS (continued)
4.0 ANALYSIS OF CONTAMINANT MOBILITY FROM SOLIDS (continued)4.4 Leaching Procedures (continued)
4.4.2 State Procedures . . . . . . . . . . . . . . . . . . . . . . . . . . . . . . . . . . . . . . . . . . . . C-264.4.3 Other Leaching Procedures . . . . . . . . . . . . . . . . . . . . . . . . . . . . . . . . . . . C-27
4.4.3.1 British Columbia Procedures . . . . . . . . . . . . . . . . . . . . . . . . . . . C-274.4.3.2 U.S. Army Corps of Engineers Procedures . . . . . . . . . . . . . . . C-274.4.3.3 ASTM Procedures . . . . . . . . . . . . . . . . . . . . . . . . . . . . . . . . . . . C-28
4.4.4 State Recommendations . . . . . . . . . . . . . . . . . . . . . . . . . . . . . . . . . . . . . . C-284.4.5 Comparison of Leaching Procedures . . . . . . . . . . . . . . . . . . . . . . . . . . . . C-28
5.0 ANALYSIS OF FATE AND TRANSPORT . . . . . . . . . . . . . . . . . . . . . . . . . . . . . . . . C-295.1 Developing a Conceptual Model . . . . . . . . . . . . . . . . . . . . . . . . . . . . . . . . . . . . . C-305.2 Mathematical Models . . . . . . . . . . . . . . . . . . . . . . . . . . . . . . . . . . . . . . . . . . . . . . C-30
5.2.1 Categories of Mathematical Models . . . . . . . . . . . . . . . . . . . . . . . . . . . . . C-315.2.2 Chemical Equilibrium Models . . . . . . . . . . . . . . . . . . . . . . . . . . . . . . . . . C-335.2.3 Physical Flow and Transport Models . . . . . . . . . . . . . . . . . . . . . . . . . . . . C-33
6.0 SAMPLING PROGRAMS . . . . . . . . . . . . . . . . . . . . . . . . . . . . . . . . . . . . . . . . . . . . . . C-346.1 Objectives of a Geochemical Sampling Program . . . . . . . . . . . . . . . . . . . . . . . . . C-346.2 Sample Representativeness . . . . . . . . . . . . . . . . . . . . . . . . . . . . . . . . . . . . . . . . . C-35
6.2.1 Proposed Mine Sites . . . . . . . . . . . . . . . . . . . . . . . . . . . . . . . . . . . . . . . . . C-356.2.2 Existing or Abandoned Mine Sites . . . . . . . . . . . . . . . . . . . . . . . . . . . . . . C-36
6.3 Quality Control and Quality Assurance . . . . . . . . . . . . . . . . . . . . . . . . . . . . . . . . C-386.3.1 Quality Control . . . . . . . . . . . . . . . . . . . . . . . . . . . . . . . . . . . . . . . . . . . . . C-386.3.2 Quality Assurance . . . . . . . . . . . . . . . . . . . . . . . . . . . . . . . . . . . . . . . . . . C-38
7.0 REFERENCES . . . . . . . . . . . . . . . . . . . . . . . . . . . . . . . . . . . . . . . . . . . . . . . . . . . . . . . C-39
LIST OF TABLES
C-1. Summary of Commonly Used Static Test Methods . . . . . . . . . . . . . . . . . . . . . . . . . . C-12C-2. Suggested Guidelines for Static Test Interpretation . . . . . . . . . . . . . . . . . . . . . . . . . . C-17
LIST OF FIGURES
C-1. Conceptual physical model of ground water flow from Anderson and Woessner . . . C-31C-2. Conceptual physicochemical model of metal transport in a river from Schnoor . . . . C-32C-3. Minimum number of samples as a function of rock mass recommended
by the BC AMD Task Force . . . . . . . . . . . . . . . . . . . . . . . . . . . . . . . . . . . . . . . . . . . . C-37

EPA and Hardrock Mining: A Source Book for Industry in the Northwest and AlaskaAppendix C: Characterization of Ore, Waste Rock, and Tailings
C-1 January 2003
1.0 GOALS AND PURPOSE OF THE APPENDIX
EPA expects that applicants will conduct a sufficient number and variety ofenvironmental tests on a representative suite of samples in order to support projections ofwastewater and solid waste management practices and effluent quality. This appendix describesthe methods used to characterize the solid wastes from mining activities and the rationale fortheir implementation. The materials in this appendix complement those in Appendix B,Receiving Waters and Appendix F, Solid Waste Management.
Determining the physical and chemical character of solid waste materials is a prerequisiteto delineating the area that would be affected by waste disposal; recognizing the physical,chemical, and biological impacts of waste disposal; and developing appropriate mitigationmeasures. Environmental test samples should be collected as part of a comprehensive programdesigned to examine the range of conditions that occur or could occur. For areas in whichmining has concluded or is on-going, tested materials should be produced by normal mineoperations. For areas in which mining is proposed or production methods are expected tochange, tested materials should include batch and pilot-plant waste products. Physical andchemical characterization studies should be conducted in a manner that provides conservativeestimates of the potential environmental impacts.
An environmental sampling program should be related to the mine plan and should bedesigned to represent the different lithologic units that have been or will be encountered,excavated, processed, disposed of, or exposed (for example in pit walls). It should establish thechemical and physical variability of each geologic unit encountered at the mine site, includingborrow materials. It can have the benefit of reducing or eliminating the potential future costsassociated with mismanagement of disposed materials. For proposed or expanding miningactivities, ore sample testing should be representative of the range of materials that will be minedand wastes that will be generated. Although simple in concept, developing and implementing areliable environmental sampling program may be a complex endeavor.
This appendix presents the methods used to determine the physical and chemicalcharacteristics of waste materials, describes the environmental tests used to assess contaminantmobility, outlines the conceptual models used to analyze contaminant fate and transport, anddiscusses the elements of quality assurance and quality control engendered in an environmentaltesting program.
2.0 ANALYSIS OF PHYSICAL CHARACTERISTICS
2.1 Extent of Analysis
The proposed mine plan should be used to determine the types and volumes of materials that will be excavated or otherwise disturbed and the management of those materials. Thisinformation, some of which can be presented in the form of maps and cross-sections, providesthe basis for determining the types of characterization studies that will be needed. For example,if waste rock materials will be used in road construction, then the potential effects on water
EPA and Hardrock Mining: A Source Book for Industry in the Northwest and AlaskaAppendix C: Characterization of Ore, Waste Rock, and Tailings
C-2 January 2003
quality will need to be ascertained. If the gangue rock at the site consists of several lithologictypes that will be mined in sequence, then the resulting waste rock dump could contain verticalor lateral changes in rock type that might impact water quality models and geotechnical stability. Because many material or waste dumps cover significant areas, characterization studies ofsubstrate materials can determine whether lateral changes in physical properties are present thatcould impact dump stabilities and contaminant transport models. Although the physical andchemical characterization of solid materials can be an intricate process, a well-planned andexecuted program can provide the benefits of improved project design and environmental impactmitigation.
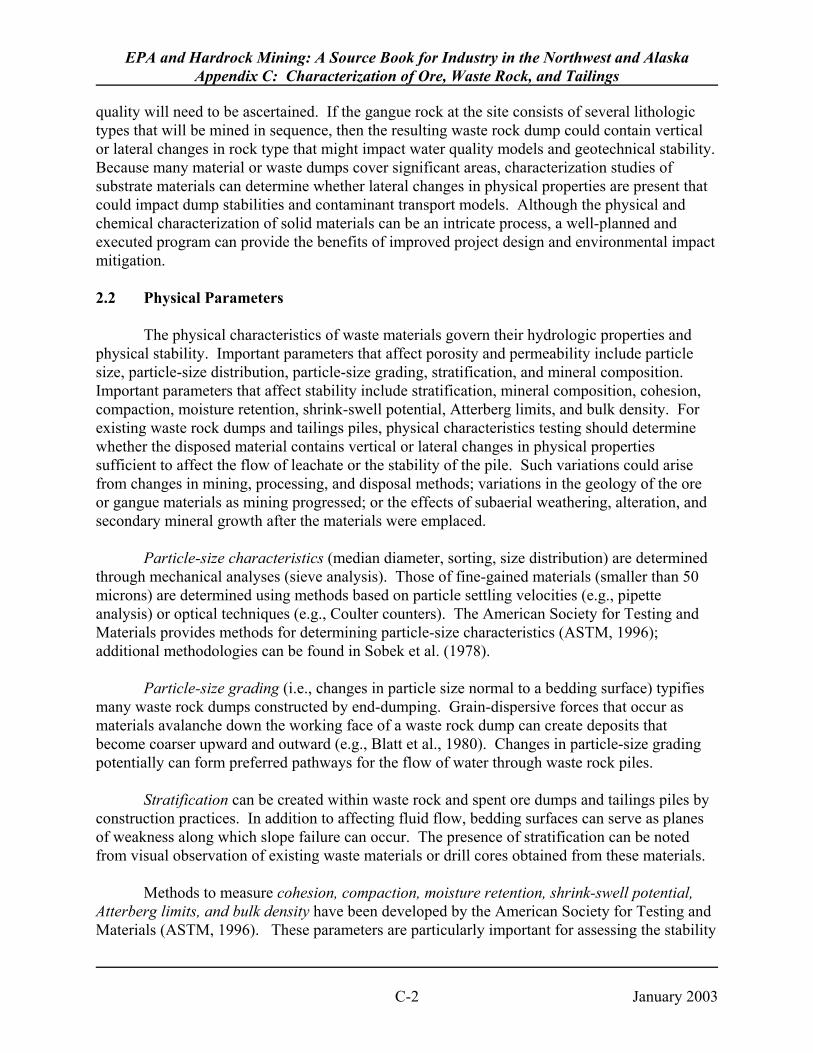
2.2 Physical Parameters
The physical characteristics of waste materials govern their hydrologic properties andphysical stability. Important parameters that affect porosity and permeability include particlesize, particle-size distribution, particle-size grading, stratification, and mineral composition. Important parameters that affect stability include stratification, mineral composition, cohesion,compaction, moisture retention, shrink-swell potential, Atterberg limits, and bulk density. Forexisting waste rock dumps and tailings piles, physical characteristics testing should determinewhether the disposed material contains vertical or lateral changes in physical propertiessufficient to affect the flow of leachate or the stability of the pile. Such variations could arisefrom changes in mining, processing, and disposal methods; variations in the geology of the oreor gangue materials as mining progressed; or the effects of subaerial weathering, alteration, andsecondary mineral growth after the materials were emplaced.
Particle-size characteristics (median diameter, sorting, size distribution) are determinedthrough mechanical analyses (sieve analysis). Those of fine-gained materials (smaller than 50microns) are determined using methods based on particle settling velocities (e.g., pipetteanalysis) or optical techniques (e.g., Coulter counters). The American Society for Testing andMaterials provides methods for determining particle-size characteristics (ASTM, 1996);additional methodologies can be found in Sobek et al. (1978).
Particle-size grading (i.e., changes in particle size normal to a bedding surface) typifiesmany waste rock dumps constructed by end-dumping. Grain-dispersive forces that occur asmaterials avalanche down the working face of a waste rock dump can create deposits thatbecome coarser upward and outward (e.g., Blatt et al., 1980). Changes in particle-size gradingpotentially can form preferred pathways for the flow of water through waste rock piles.
Stratification can be created within waste rock and spent ore dumps and tailings piles byconstruction practices. In addition to affecting fluid flow, bedding surfaces can serve as planesof weakness along which slope failure can occur. The presence of stratification can be notedfrom visual observation of existing waste materials or drill cores obtained from these materials.
Methods to measure cohesion, compaction, moisture retention, shrink-swell potential,Atterberg limits, and bulk density have been developed by the American Society for Testing andMaterials (ASTM, 1996). These parameters are particularly important for assessing the stability
EPA and Hardrock Mining: A Source Book for Industry in the Northwest and AlaskaAppendix C: Characterization of Ore, Waste Rock, and Tailings
C-3 January 2003
of waste rock and spent ore dumps, tailings piles, and pit benches. For existing waste materials,vertical or lateral changes in the amount and type of clay minerals can cause many of theseparameters to change throughout a deposit. Consequently, existing waste deposits should besampled in several locations and at several depths to determine the range of values that occur. For those tests that cannot be conducted on materials in situ, appropriate ASTM proceduresshould be followed to ensure sample integrity. The stability of waste rock dumps and tailingspiles is discussed in more detail in Appendix F.
2.3 Mineralogical Composition
Mineralogical composition and mineral textures can be determined using a petrographic(polarizing light) microscope equipped with both transmitted and reflected light. Samples can beviewed in thin-section, as grain mounts, or as discrete grains. Mineral percentages can beestimated through counts of a statistically significant number of points or grains. Thin-sectionsare particularly useful for recognizing mineral reaction (alteration) textures and products thatmay influence the interpretation of geochemical test results as described in the next section. Moreover, they permit identification of reaction products that may form as a consequence ofmineral processing (by examining samples “before” and “after” processing). Petrographictechniques, including oil immersion, are well-established and widely accepted (Kerr, 1977;Sobek et al., 1978; Gribble and Hall, 1993; Craig and Vaughn, 1994).
X-ray diffraction (XRD) is used to identify minerals that are difficult to resolve with apetrographic microscope and to characterize crystal structures. The method measures thediffraction of an incident beam of X-rays during its passage through a crystal structure caused byatoms or atomic layers in the crystal (e.g., Hutchison, 1974; Bish and Post, 1989). The techniqueis a quick and easy means to determine the compositions of clay minerals that are associatedwith many ore deposits (e.g., Sobek et al., 1978). Analyzing clay minerals, which have differentsorptive properties, can provide useful data that can be used in the design of waste rock and tailings piles, drainage covers, compacted liners, and remediation plans.
Scanning electron microscopy (SEM) can be used to image reaction products and graincoatings that cannot be resolved with an optical (petrographic) microscope. For example, it canbe used to gather data on secondary mineral growths in the pore spaces of waste materials. Thisknowledge can be used to refine models of fate and transport by clarifying the potential forcontaminant sorption onto the surfaces of clays or other minerals. In addition, the technique canbe used to gather quantitative or semi-quantitative chemical data on the major constituents ofminerals at scales that vary from a few microns to a few millimeters. The SEM scans a tightlyfocused beam of high-energy electrons across the surface of a prepared sample. The beamdislodges secondary electrons from the atoms in the sample, which are then collected, countedand formed into an image of the specimen surface (e.g., Goldstein et al., 1981). Because theenergies with which secondary electrons are emitted are unique to each element, secondaryelectrons also provide compositional data through energy dispersive microanalysis.
Electron microprobe (EMP) analysis is used to determine the compositions of mineralgrains in a sample. The EMP focuses a beam of high-energy electrons onto a fixed spot on a
EPA and Hardrock Mining: A Source Book for Industry in the Northwest and AlaskaAppendix C: Characterization of Ore, Waste Rock, and Tailings
C-4 January 2003
sample surface (typically 1 to 2 microns in diameter). The beam dislodges secondary electronsthat emit radiation in wavelengths and energies characteristic of particular elements. Similar toSEM analysis, EMPs can be operated in an energy dispersive analysis mode. However, thesemachines typically are operated using wavelength dispersive detectors, which provide lowerdetection limits and more accurate analyses. Because it utilizes a tightly focused incident beamof high energy, EMP microanalysis is poorly suited for determinations of light elements(atomicnumber less than 10) and volatile elements.
3.0 ANALYSIS OF CHEMICAL COMPOSITION
Acceptable techniques for determining the concentrations of inorganic and organicconstituents in solid and liquid wastes are given in 40 CFR, Part 136.3. Analytical methods aredetailed in publications by the U.S. EPA (1983; 1986a), American Public Health Association(APHA et al., 1992), American Society for Testing and Materials (ASTM, 1996), and the U.S.Geological Survey (Fishman and Friedman, 1989). Considerations regarding the number andtypes of samples that should be tested are described in Section 6.0.
3.1 Analysis of Solids
The chemical composition of solid materials such as waste rock, tailings, or spent ore canbe determined using a variety of techniques. Most analytical techniques require solubilization ofthe solid material into a liquid form prior to analysis. An exception is X-ray fluorescence(XRF), which is a common technique used to determine the major and minor chemicalconstituents of rocks and minerals (Norrish and Chappell, 1967; Bertin, 1970; Johnson andMaxwell, 1981). The technique analyzes sample materials in solid form (either as compactedpowders or powders that have been fused into glass) by bombarding the sample with X-rays ofknown wavelength and energy. Excitation by the primary X-rays induces emissions ofsecondary photons (fluoresence) with energies and wavelengths characteristic of individualelements. The number of photons emitted (intensity) at a given wavelength or energy isproportional to the abundance of a given element. X-ray fluorescence is capable of determiningthe abundance of many elements that occur in concentrations of a few parts per million. It is aninferior technique for light elements, volatile elements, and many elements occurring atconcentrations of less than 10 ppm.
Solid samples commonly are solubilized using strong-acid dissolution. Methods to digestsolid materials in nitric acid are common and widely accepted (ASTM D5198 [ASTM, 1996];EPA Method 3051 [U.S. EPA,1986a]). The subsequent liquids can be analyzed by severalmethods that most commonly include atomic absorption spectrometry, inductively coupledplasma spectrometry, and colorimetry.
In atomic absorption (AA) spectrometry, samples are vaporized at high temperatures andthe concentrations of selected elements are determined by measuring the absorption of light atwavelengths characteristic of that element (Harris, 1987; Patniak, 1997). The technique is highlysensitive, comparatively simple, and permits determination of a variety of metals to levels of

EPA and Hardrock Mining: A Source Book for Industry in the Northwest and AlaskaAppendix C: Characterization of Ore, Waste Rock, and Tailings
C-5 January 2003
parts per million or less. In the direct aspiration method, sample solutions are injected into aflame, where they are dissociated and made amenable to absorption. The more sensitive graphitefurnace technique uses an electrically heated furnace to vaporize the sample solution. Thegraphite furnace technique affords lower detection limits, but is more sensitive to matrixinterference effects; it works best on relatively “clean” samples (U.S. EPA, 1986a). A primarydisadvantage of the AA technique is that it is time-consuming, because each element must beanalyzed separately (i.e., a sample must be analyzed repeatedly). Accepted atomic absorptiontechniques using both methods are given in U.S. EPA (1983; EPA 200 series methods) and U.S.EPA (1986a; EPA 7000 series). Methods for determining trace metal concentrations at levels ofa few tens to hundreds of parts per trillion were recently developed by U.S. EPA (1996d, f). Theabsorption of elements that occur at low concentrations can be masked by interference fromelements at higher concentrations. Consequently, chemical separation is used to isolate theseelements and permit their analysis without interference. The cold-vapor technique (EPAMethods 245.1 and 245.2, U.S. EPA [1983]; EPA Method 7470A, U.S. EPA [1986a]; EPAMethod 1631 for low detection limits, U.S. EPA [1996a]) is used to reduce and isolate mercuryfor analysis. The gas hydride method is used to reduce and isolate selenium (EPA Method7741A; U.S. EPA [1986a]) and arsenic (EPA Method 7061A; U.S. EPA [1986a]; EPA Method1632 for low detection levels; U.S. EPA [1996b]) for analysis. A co-precipitation method (EPAMethod 218.5, U.S. EPA [1983]; EPA Method 7195, U.S. EPA [1986a]) is used to removetrivalent chromium from solution, permitting measurement of hexavalent chromium in theremaining solution by AA.
In inductively coupled plasma (ICP) spectrometry, aqueous samples are ionized atextreme temperatures in an argon plasma. The ions are focused into a stream of material that isaccelerated toward detectors that measure either the photon emissions at specific wavelengths(ICP-AES, atomic emission spectrometry) or the masses of specific isotopes (ICP-MS, massspectrometry) (Robinson, 1990). Standard ICP techniques can detect elements in concentrationsof a few parts per billion to parts per million, but recently developed guidelines permit detectionof a few to a few hundred parts per trillion. The primary advantage of ICP analysis is that itpermits rapid, simultaneous or sequential determination of multiple elements in a singleanalytical session (i.e., a sample need only be analyzed once). Disadvantages includeinterference from the plasma gases, background radiation from other elements, and interferencesfrom large excesses of single elements (U.S. EPA, 1986a). Accepted standard ICP techniquesusing both methods are given in U.S. EPA (1986a; EPA Method 6010A for ICP-AES; EPAMethod 6020 for ICP-MS). “Ultraclean” ICP-MS techniques that permit low detection limits are given in U.S. EPA (1996e,1996g).
Colorimetry is a type of spectrophotometric analysis that uses the absorption of visibleradiation (Harris, 1987; Patniak, 1997) to determine concentration. The technique uses aspectrophotometer or filter photometer to determine the concentration of a constituent in aspecially prepared aqueous solution by measuring the absorbance at a specific visible lightwavelength. An accepted colorimetric technique for hexavalent chromium (EPA Method7196A) is given in U.S. EPA (1986a). Colorimetric techniques also have been developed fornitrate-nitrogen, nitrate plus nitrite-nitrogen, ammonium nitrogen, and total cyanide.
EPA and Hardrock Mining: A Source Book for Industry in the Northwest and AlaskaAppendix C: Characterization of Ore, Waste Rock, and Tailings
C-6 January 2003
3.2 Analysis of Liquids
Samples of waters and wastewaters typically are filtered in the field prior to analysis. Methods developed by EPA require filtration using a 0.45 :m filter. Care should be taken whenreusing field filters to ensure that they do not become sources of contamination. Importantly,some colloidal particulates can pass through this filter and will report as dissolved constituents inwater quality analyses. Because some of these constituents (e.g., iron oxyhydroxides) readilyadsorb metals from solution, the presence of colloidal particles smaller than 0.45 :m caninfluence measurements of dissolved metals such as cadmium, copper, lead, and zinc.
Liquid samples may be analyzed as collected, but they typically are treated followingcollection to preserve their chemical constituents. In many cases, multiple splits of a givensample are preserved using a variety of techniques. Electrical conductivity and pH should bemeasured on untreated samples at the time of collection. In contrast, samples that must bedelivered to a lab for analysis of their inorganic and organic constituents are preserved topreclude precipitation of metal compounds or the volatilization of organic compounds betweenthe time of sample collection and analysis. Samples collected for total metals analysis should beacidified to pH <2.0 using nitric acid and stored at 4°C to permit dissolution of suspendedconstituents (EPA Method 200.0; U.S. EPA [1983]). In contrast, samples collected for cyanideanalysis should be adjusted to pH >12.0 using sodium hydroxide and stored at 4°C to prevent theformation of hydrogen cyanide (EPA Method 335.3; U.S. EPA [1983]). Samples collected foranalysis of their organic constituents should be preserved at 4°C and left untreated or treatedwith sodium thiosulfate (EPA 3500 and 5000 series methods; U.S. EPA [1986a]).
Many metals in ambient waters occur in concentrations of less than 1 part per billion,which are below the detection limits of most standard analytical techniques. To permit accuratedeterminations of background water quality, the U.S. EPA recently released draft Method 1669(U.S. EPA, 1996h). This method provides guidance for collecting samples that will be analyzedby newly developed “ultraclean” ICP-MS, AA, and ion chromatographic techniques (U.S. EPA,1996a-g). Using these sampling and analytical methods, trace metal constituents in ambientwater can be determined at levels of a few to a few hundred parts per trillion.
Prior to analysis, organic constituents are separated using solvent extraction or purge-and-trap techniques. Nonvolatile and semi-volatile organic compounds are extracted usingsolvents such as methylene chloride and techniques that include liquid-liquid extraction, soxhletextraction, or ultrasonic extraction (EPA 3500 series methods; U.S. EPA [1986a]). Volatileorganic compounds are extracted by bubbling an inert gas (either N2 or He) through the samplesolution to liberate the volatile components which are trapped in a sorbent column (EPA 5000series methods; U.S. EPA [1986a]).
The concentrations of metals and other inorganic cationic constituents in samples ofsurface water, ground water, waste rock leachate, or mine drainage are analyzed using the AA,ICP, and colorimetric methods described above. Other techniques used to analyze aqueoussamples include titrimetry, gravimetry, ion-selective electrode analysis, ion chromatography, gaschromatography, liquid chromatography, and Fourier transform infrared spectroscopy.

EPA and Hardrock Mining: A Source Book for Industry in the Northwest and AlaskaAppendix C: Characterization of Ore, Waste Rock, and Tailings
C-7 January 2003
Titrimetric analysis is used to measure the acidity and alkalinity of aqueous samples(Patniak, 1997). Acidity is measured by titrating a solution to a predetermined pH endpointusing sodium hydroxide (EPA Method 305.2; U.S. EPA [1983]). Alkalinity is determined bytitrating a solution to a predetermined pH endpoint using a strong acid (EPA Method 310.1; U.S.EPA [1983]). In both cases, the amount of titrant is converted to milliequivalents of acidity oralkalinity per liter of solution.
In gravimetric analysis, the mass of a reaction product is used to determine the quantityof the original analyte (Harris, 1987). Although these techniques are among the most accurate inanalytical chemistry, they are no longer widely used because they are time consuming. However, gravimetric analysis remains the most common method for determining total dissolvedsolids (TDS) and total suspended solids (TSS) in a sample. To determine these parameters, asample is filtered through a standard glass fiber filter. The filter is dried and weighed, with theweight increase representing TSS concentration (EPA Method, 160.2; U.S. EPA [1983]). Totaldissolved solids are measured by evaporating the filtrate and weighing the residual solids (EPAMethod 160.1; U.S. EPA [1983]).
Ion-selective electrodes respond to a single ionic species in solution (Harris, 1987;Patniak, 1997). The electrodes measure the electrical potential difference across a membranebetween a solute at constant chemical activity within the electrode and the activity of the solutein the solution of interest. Ion-selective electrodes can be used to measure the concentrations offluorine, cyanide, and ammonia in water samples (Standard Method 4500 series; APHA et al.[1992]).
Chromatographic techniques, in which constituents of interest are separated from oneanother to permit their identification, include ion chromatography, gas chromatography, andhigh-performance liquid chromatography. Ion chromatography is used to measure theconcentrations of common anionic constituents (EPA Method 300.0; U.S. EPA [1983]). Thetechnique uses a series of columns filled with ion-exchange resins to separate the anions fromsolution and combine them with hydrogen to form acids (Harris, 1987; Patniak, 1997). Theelectrical conductivities of the different acids, which are variably strong electrolytes, aremeasured using a conductivity detector, from which anion concentrations can be determined. Amethod for determining low levels of hexavalent chromium by ion chromatography was recentlydeveloped by U.S. EPA (1996c). Gas chromatography is used to measure the concentrations ofa wide variety of organic constituents. In this technique, a liquid sample is vaporized and carriedby an inert gas through a column filled with a partitioning material (Harris, 1987; Patniak, 1997). Organic compounds are separated in the column by their variable affinities for the partitioningmaterial, which causes the different compounds have discrete retention times prior to emergingfrom the column and flowing to a detector. Several detector types are employed includingelectrolytic conductivity detectors, electron capture detectors, and flame ionization detectors(EPA 8000 series methods; U.S. EPA [1986a]). More sensitive detection can be accomplishedby using mass spectrometers (EPA 8200 series methods; U.S. EPA [1986a]). Constituents thatcannot be differentiated by mass (i.e., isomers) can be distinguished using Fourier transforminfrared spectroscopy, in which isomers are distinguished by their infrared absorptionfrequencies (EPA Method 8410; U.S. EPA [1986a]). High-performance liquid chromatography
EPA and Hardrock Mining: A Source Book for Industry in the Northwest and AlaskaAppendix C: Characterization of Ore, Waste Rock, and Tailings
C-8 January 2003
also is used to measure the concentrations of organic constituents. This technique uses columnsfilled with adsorbent material (typically microporous silica with a covalently bonded stationaryphase) to separate the compounds of interest, which are then eluted from the column by solvents(Harris, 1987; Patniak, 1997; EPA 8300 series methods, U.S. EPA [1986a]). Liquid flow isaccomplished under high pressure to increase efficiency of the system. Absorbance, refractiveindex, and polarographic monitors are used to detect solutes eluted from the column. Potentialinterferences occur in all chromatographic techniques when two or more solutes have similarretention times in the separation column or, for mass spectrometry, have similar masses.
4.0 ANALYSIS OF CONTAMINANT MOBILITY FROM SOLIDS
Rigorous geochemical testing programs can reveal whether the rocks exposed by themining process or the wastes and materials produced by extractive operations are likely torelease metals or other contaminants that could degrade the environment at or surrounding amine site. Testing programs are aimed at determining the potential for acid generation andconstituent release through weathering and leaching. Because these laboratory programs areconducted in a manner intended to speed natural processes, test results must be interpreted withcaution. Particle size and mineralogy play pivotal roles that govern the long-term behavior ofmaterials in the environment. Consequently, these variables should not be ignored by a testingprogram. Considerations regarding the number and types of samples that should be tested aredescribed in Section 6.0.
4.1 Mineralogical Considerations
It is critical to understand the mineralogy of waste rock, tailings, and spent ore materialsin order to establish a sound geochemical testing program. Because many ore deposits and theirgangue materials are chemically and mineralogically zoned (also true of some waste rock dumpsand tailings piles), selecting appropriate test materials requires knowledge of mineralcomposition, abundance and distribution. Recognizing spatial variations in mineral abundance isespecially important for potentially reactive sulfides (e.g., pyrite), nonreactive but leachablesulfides (e.g., galena), acid- and nonacid-sulfates (e.g., jarosite and gypsum), readily soluble andcomparatively insoluble carbonates (e.g., calcite and siderite), and other minerals that may affecttest results (e.g., clays and feldspars). Smith et al. (1994) showed that alteration zoning can havea significant impact on the pH and metals content of drainage generated from a quartz-aluniteepithermal deposit. Testing programs need to recognize the mineralogical changes thatsecondary alteration may have imparted to a given rock unit and characterize the range ofenvironmental behavior that could occur as a result.
Mineralogical studies provide a framework for interpreting the results of the geochemicaltests outlined below. For example, hydroxide coatings on calcite or sulfate coatings on pyritemay preclude these minerals from participating in acid neutralization or generation in existingwaste rock dumps. Samples of this material that are crushed to fine particle sizes prior to acid-base accounting tests may exhibit net neutralization potentials significantly different from that ofthe in situ waste material. Having knowledge of mineral coatings would allow one to interpret

EPA and Hardrock Mining: A Source Book for Industry in the Northwest and AlaskaAppendix C: Characterization of Ore, Waste Rock, and Tailings
C-9 January 2003
the test results in a more sound scientific manner. Mineralogical studies also can provideinformation regarding the sorptive properties of host minerals (e.g., clays) which could allow adetermination of whether they are likely to retard the movement of certain contaminants. Studiesof mineral compositions could permit identification of the mineralogical sources of trace metalsin leachates and provide a basis for designing effective disposal plans.
4.2 Physical Considerations
The ability of a material or solid waste to generate acidity or alkalinity, or to contributemetals or other constituents to the environment through leaching, depends partly on the particle-size characteristics of the waste material. Interpretation of test results is complicated if theparticle size of the test materials differs significantly from the particle size of a waste material asit is or will be disposed of in the environment. Particle-size characteristics impact both reactionrate and reaction duration by affecting the reactive surface area, the distances betweenpotentially reactive particles, and the porosity and permeability of the waste.
Test materials that are finely ground can impact the results of acid-base accounting tests(Robertson and Broughton, 1992; Lapakko et al., 1998). Crushing to small particle sizesincreases the surface area of reactive sulfide and neutralizing minerals. In addition, fine crushingcan increase the acid generating potential of a sample by releasing reactive sulfides that areenclosed in inert minerals (e.g., pyrite enclosed in quartz) and which would not be exposed tooxidation in coarser materials (Lapakko et al., 1998). The distance between reactive particlesand neutralizing particles is greatly diminished in fine-grained materials, which may inhibit theformation of localized zones of low pH that are known to occur in coarse-grained waste rockpiles (Robertson and Broughton, 1992).
The leaching characteristics of waste materials also are affected by changes in particlesize. Smaller particle sizes increase the surface area of materials amenable to leaching. Moreover, smaller particle diameters and a smaller range of particle sizes (better grading) affectspore sizes and permeability, both of which influence the volume of extraction fluid held in thepore spaces of granular materials and the amount of time that it is retained by the material.
4.3 Acid Generation Potential
Materials that contain iron sulfide minerals such as pyrite, marcasite, or pyrrhotite cangenerate acid if exposed to moisture (for example, humid air) and an oxidant (either oxygen fromthe atmosphere or a chemical source such as ferric iron). In addition, some sulfate minerals,such as jarosite, can dissolve to form acidic solutions (e.g., Lapakko, 1991). Bacteria commonlyaccelerate the process of acid generation from sulfides by enhancing the rate of ferrous ironoxidation (e.g., Kleinman and Erickson, 1983) or the rate of reduced-sulfur oxidation (BC AMDTask Force, 1989). The rate at which acid is generated depends on the composition of thesulfide mineral (e.g., Lundgren and Silver, 1980), its crystal size and shape (surface area;Caruccio et al., 1977), the presence of reaction coatings that may form on the surfaces of sulfideminerals (Goldhaber, 1983; Nicholson et al., 1990; Sherlock et al., 1995), and the environmentalconditions (for example, pH, humidity, oxygen fugacity, temperature) at the site of oxidation

EPA and Hardrock Mining: A Source Book for Industry in the Northwest and AlaskaAppendix C: Characterization of Ore, Waste Rock, and Tailings
C-10 January 2003
(BC AMD Task Force, 1989). In general, acid generation involves a rather complex set ofchemical reactions that change through time (BC AMD Task Force, 1989).
The potential for acid generation is offset by the ability of a material to neutralize acid. Acid neutralization is imparted by various minerals including calcium- and magnesium-bearingcarbonates, oxides and hydroxides of calcium, magnesium, and aluminum, some silicateminerals, and some phosphates (Sherlock et al., 1995). In general, dissolution rates (and henceneutralization) are considerably faster for carbonate minerals than for other neutralizingminerals. Factors that influence mineral dissolution rates include pH, dissolved carbon dioxidecontent, temperature, mineral composition, crystal size and shape, redox conditions, and theconcentration of “foreign” ions (e.g., trace metals) (Sherlock et al., 1995).
Static predictive tests are used to define the balance between potentially acid-generatingminerals and potentially acid-neutralizing minerals in a sample (BC AMD Task Force, 1989). These tests, which are quick and comparatively inexpensive, cannot be used to predict thequality of effluent that may drain from waste materials in the future. However, they are usefulfor determining which geologic units have the potential to generate acidity and, in essence, serveas positive/negative indicators of the theoretical potential for acid generation (Robertson andBroughton, 1992). When coupled with mineralogical and petrological data from the testsamples, certain static test procedures can provide some measure of neutralization rate (Mills,1998a). Kinetic tests are used to define reaction rates through time under specific environmentalconditions. These tests are significantly more expensive and may take months or years tocomplete.
In general, acid mine drainage testing programs utilize a two-step approach in whichstatic tests of numerous samples are used to identify potentially acid-generating geologic unitsand to characterize the variability that occurs within them. Kinetic tests are then run on samplesdeemed representative of the range of compositions within potentially reactive units to determinewhether acid drainage will occur. Although New Mexico (NMED, 1996) and Nevada (NV DEP,1990; 1996) have specific guidelines mandating static and kinetic testing of mine wastes, thestates of EPA Region 10 have not adopted a similar approach.
4.3.1 Static Tests
Static test methods, which were developed initially to determine the potential for acidgeneration from coal mine wastes, have been adapted for use in the metal mining industry. Thevariety of static test methods that are available are collectively referred to as acid-baseaccounting (ABA) analyses. Static test methodologies are described and evaluated in reports byLapakko (1991; 1992), Lawrence and Wang (1996), and Mills (1998a; 1998b); digestionmethods are compared and evaluated in Skousen et al. (1996). Table C-1 summarizes several ofthe more commonly used test methods.
EPA and Hardrock Mining: A Source Book for Industry in the Northwest and AlaskaAppendix C: Characterization of Ore, Waste Rock, and Tailings
C-11 January 2003
4.3.1.1 Acid-Base Accounting Tests
Specific procedures for conducting acid-base accounting (ABA) tests are compiled inMills (1998a; 1998b). Although a few tests produce a single value that can be used to indicatethe likelihood for acid generation (Section 4.3.1.2), most static tests determine separate valuesfor the acid generating potential (AP) and acid neutralizing potential (NP) of a sample. Thesevalues, expressed in units of tons of CaCO3 equivalent per kiloton of material, are used togetherto indicate whether a sample has a stochiometric balance that favors net acidity or net alkalinity. In general, determinations of acid generating potential are relatively straightforward. This is nottrue of tests to measure neutralizing potential. The problem stems from the widely variablesolubilities and reaction rates of minerals that have the potential to neutralize acidity (e.g.,carbonates vs. silicates), the relative differences in aggressiveness of the various methods used todetermine neutralization potential, and the different titration endpoints employed by each test(e.g., Mills, 1998a). Studies in which the neutralizing potential of a sample was determinedusing different methods concluded that the NP value is highly sensitive to test methodology(e.g., Lapakko, 1994). Consequently, it is important that any program established to test wastesand materials prior to or during operation use a single test method to ensure that the programproduces data that are internally consistent.
4.3.1.1.1 Methods to Determine Acid Generating Potential
Acid generating potential is determined from the sulfur content of a sample (expressed inweight percent). This value is converted to acid generating potential (AP) by multiplying by afactor of 31.25 that is derived from the molar stoichiometry of the oxidation and neutralizationreactions. The conversion factor assumes that all reported sulfur occurs as pyrite, that pyrite iscompletely oxidized to sulfate and ferric hydroxide, and that hydrogen ions produced in theoxidation reaction are neutralized by CaCO3. Acid generating potential is reported in kilogramsof CaCO3 equivalent per metric ton of sample (also expressed in units of metric tons of CaCO3equivalent per kilotonne of material).
Samples typically contain sulfur in more than one form, not all of which are capable ofgenerating acidity. The sulfur speciation tests of Sobek et al. (1978) are the most commonlyused methods to determine sulfur content. Alternative methods include the hydrogen peroxidemethod (O’Shay et al., 1990) and reactive sulfur tests.
Sobek et al. (1978) describe procedures to determine the total sulfur, HCl-extractablesulfate sulfur, HNO3-extractable sulfide sulfur, and organic sulfur contents of a sample. Thetests require a sample crushed to particle sizes smaller than 60 mesh (0.25 mm), which is splitinto three parts that are analyzed for total sulfur using a Leco sulfur analyzer. One split is leftuntreated and provides a measure of the total sulfur content of the sample. A second split isleached with HCl and a third split is leached with HNO3. Acid-extractable sulfate sulfur (e.g.,gypsum and anhydrite) is computed from the difference between the total sulfur contents of theuntreated and HCl-treated splits. Acid-soluble sulfide sulfur (e.g., pyrite) is computed from thedifference between the total sulfur contents of the HCl-treated and HNO3-treated splits. Nonextractable organic sulfur is computed as the total sulfur content of the HNO3-treated split.

EPA and Hardrock Mining: A Source Book for Industry in the Northwest and AlaskaAppendix C: Characterization of Ore, Waste Rock, and Tailings
C-12 January 2003
The test methods have disadvantages that include the potential removal of highly reactive sulfideby HCl and the potential nondetection of sulfide that is slow to oxidize under experimentalconditions, but which may form acid in the environment (BC AMD Task Force, 1989).
It is important to recognize that sulfur speciation tests like those described above do notdistinguish acid-insoluble sulfates, such as barite or jarosite, which will report as sulfide sulfur. As a result, samples containing significant quantities of these minerals will appear to have moresulfide sulfur than they actually do. Although acid-insoluble sulfates will not oxidize to produceacid, some of these minerals (e.g., jarosite, alunite, and melanterite) may dissolve, hydrolyze,and generate acidity (Carson et al., 1982; Mills; 1998a). Mills (1998a) states that whole-rockbarium concentrations can be used to correct sulfide sulfur determinations when barite is present. However, barium also may be present in common alteration phases such as potassium feldsparand biotite (Deer et al., 1992). Consequently, caution must be used when applying a bariumcorrection of this type. As pointed out by Mills (1998a), it is rarely acknowledged that each stepin the sulfur speciation tests introduces analytical error; these errors are cumulative.
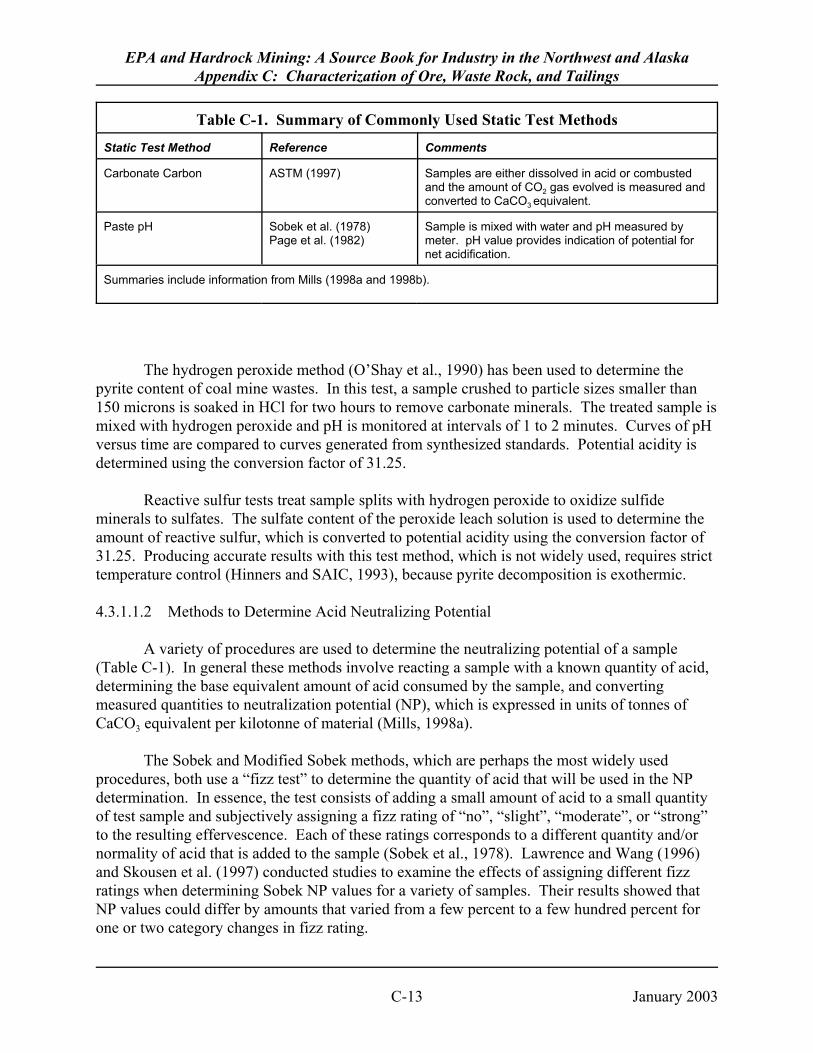
Table C-1. Summary of Commonly Used Static Test Methods
Static Test Method Reference Comments
Sobek Sobek et al. (1978) AP uses sulfur speciation and Leco analyzer.NP uses fizz test and heated HCl that dissolvescarbonates and most silicate minerals; NaOH titrationendpoint of 7.0. This is an aggressive test thatprovides “best case” values.
Modified Sobek NP Lawrence and Wang(1997)
NP uses fizz test and HCl at ambient temperaturethat dissolves carbonates and reactive silicateminerals; NaOH titration endpoint of 8.3. Lessaggressive test due to use of ambient temperatureacid. Lapakko (1992) suggested that the alkalinetitration endpoint may lead to overly optimisticestimates of NP.
Sobek NP SideriteCorrection
Skousen et al. (1997) NP uses fizz test and heated HCl; hydrogen peroxideadded prior to titration to oxidize ferrous iron fromdissolved siderite. Yields less alkaline NP thanstandard Sobek method when siderite is abundant.
BCRI Initial Duncan and Bruynesteyn(1979)
AP uses total sulfur by Leco furnace or wet chemistry.NP uses H2SO4 added to pH 3.5 at ambienttemperature that dissolves carbonates and possiblylimonite and chlorite; gives “most likely case” values.
Lapakko NP Lapakko (1994) NP uses H2SO4 added to pH 6.0 at ambienttemperature for up to 1 week that dissolvescarbonates; gives “worst case” value.
Net Acid Generation (NAG) Miller et al. (1997) Crushed sample is boiled with hydrogen peroxidethen titrated to pH 4.5 with NaOH. NAG value,expressed in units of kg H2SO4/tonne, providesindication of potential for net acidification.
EPA and Hardrock Mining: A Source Book for Industry in the Northwest and AlaskaAppendix C: Characterization of Ore, Waste Rock, and Tailings
Table C-1. Summary of Commonly Used Static Test Methods
Static Test Method Reference Comments
C-13 January 2003
Carbonate Carbon ASTM (1997) Samples are either dissolved in acid or combustedand the amount of CO2 gas evolved is measured andconverted to CaCO3 equivalent.
Paste pH Sobek et al. (1978)Page et al. (1982)
Sample is mixed with water and pH measured bymeter. pH value provides indication of potential fornet acidification.
Summaries include information from Mills (1998a and 1998b).
The hydrogen peroxide method (O’Shay et al., 1990) has been used to determine thepyrite content of coal mine wastes. In this test, a sample crushed to particle sizes smaller than150 microns is soaked in HCl for two hours to remove carbonate minerals. The treated sample ismixed with hydrogen peroxide and pH is monitored at intervals of 1 to 2 minutes. Curves of pHversus time are compared to curves generated from synthesized standards. Potential acidity isdetermined using the conversion factor of 31.25.
Reactive sulfur tests treat sample splits with hydrogen peroxide to oxidize sulfideminerals to sulfates. The sulfate content of the peroxide leach solution is used to determine theamount of reactive sulfur, which is converted to potential acidity using the conversion factor of31.25. Producing accurate results with this test method, which is not widely used, requires stricttemperature control (Hinners and SAIC, 1993), because pyrite decomposition is exothermic.
4.3.1.1.2 Methods to Determine Acid Neutralizing Potential
A variety of procedures are used to determine the neutralizing potential of a sample(Table C-1). In general these methods involve reacting a sample with a known quantity of acid,determining the base equivalent amount of acid consumed by the sample, and convertingmeasured quantities to neutralization potential (NP), which is expressed in units of tonnes ofCaCO3 equivalent per kilotonne of material (Mills, 1998a).
The Sobek and Modified Sobek methods, which are perhaps the most widely usedprocedures, both use a “fizz test” to determine the quantity of acid that will be used in the NPdetermination. In essence, the test consists of adding a small amount of acid to a small quantityof test sample and subjectively assigning a fizz rating of “no”, “slight”, “moderate”, or “strong”to the resulting effervescence. Each of these ratings corresponds to a different quantity and/ornormality of acid that is added to the sample (Sobek et al., 1978). Lawrence and Wang (1996)and Skousen et al. (1997) conducted studies to examine the effects of assigning different fizzratings when determining Sobek NP values for a variety of samples. Their results showed thatNP values could differ by amounts that varied from a few percent to a few hundred percent forone or two category changes in fizz rating.

EPA and Hardrock Mining: A Source Book for Industry in the Northwest and AlaskaAppendix C: Characterization of Ore, Waste Rock, and Tailings
C-14 January 2003
Neutralization potential (NP) by the Sobek and Modified Sobek methods is determined
by treating the sample with an excess of hydrochloric acid and then titrating with sodiumhydroxide to determine the amount of unconsumed acid. In the original test procedure outlinedby Sobek et al. (1978), the sample is reacted with hot acid and titrated to a pH of 7. In theModified Sobek procedure outlined by Coastech Research (1989), the sample is agitated withacid at room temperature for 24 hours and titrated to a pH of 8.3 (cf., Lawrence and Wang,1997). In both cases, the amount of titrated base is converted to a calcium carbonate equivalentin units of kilograms per metric ton of sample (also expressed in units of metric tons of CaCO3equivalent per kiloton of material).
The Sobek and Modified Sobek tests determine the maximum amount of neutralizationpotential available in a sample, but do not predict the rate of neutralization nor indicate the pH towhich a sample can neutralize acidity. Lapakko (1992) showed that both tests provided a fairlyreliable estimate of NP for samples composed of quartz, alkali feldspar, and mica, butoverestimated NP in samples with abundant calcic feldspar, chlorite, clay, pyroxene and olivine. Similar conclusions were drawn by Skousen et al. (1996) who showed that NP estimates for asingle sample could vary by an order of magnitude depending on sample mineralogy anddigestion method. Other criticisms of the Sobek and Modified Sobek methods (see Lapakko,1991; 1992 and Hinners and SAIC, 1993) include: 1) the small particle size used in the tests mayproduce unrealistically high values for NP, 2) hot acid which is mixed with water and heated toboiling in the Sobek method may increase analytical scatter, 3) hot acid may digest siderite (ironcarbonate) and clay minerals that increase NP values but provide little alkalinity, 4) NP may beoverestimated because pH is back-titrated to values of 7.0 or 8.3, not 6.0 which is a typical waterquality standard, and 5) NP may be overestimated if metal hydroxides precipitate during theaddition of the sodium hydroxide base.
The BCRI Initial test (Duncan and Bruynesteyn, 1979; Bruynesteyn and Hackl, 1984)and Lapakko NP test (Lapakko, 1994) both use sulfuric acid at ambient temperature to determineneutralizing potential; neither test requires a subjective fizz test rating. In both tests, the sampleis suspended in water and acid is titrated into the suspension until a stable, pre-determined pHvalue is achieved. The BCRI Initial test uses a titration endpoint of 3.5, whereas the LapakkoNP procedure uses a titration endpoint of 6.0. The volume of titrated acid is used to compute avalue for acid consumption, which is expressed in units of kilograms per tonne. Neither test isparticularly aggressive in dissolving minerals in addition to the carbonates. Nevertheless, thehigher titration endpoint of the Lapakko procedure makes it the most conservative (lowest NPestimate) of the static NP test procedures. Lapakko (1992) showed that the BCRI testoverestimated NP for samples containing significant siderite (iron carbonate).
Carbonate analysis may be used in conjunction with neutralizing potential tests todetermine the amount of neutralizing potential that is likely to react quickly with acid formedthrough sulfide oxidation. There are several methods to analyze carbonate carbon. In onemethod, a sample is digested in acid in a sealed chamber. Carbon dioxide (CO2) gas evolved byreaction is absorbed into a solution and measured using coulometric titration (Crock et al., 1999).Alternatively, the sample can be combusted, with carbon analyzed using a Leco or similar
EPA and Hardrock Mining: A Source Book for Industry in the Northwest and AlaskaAppendix C: Characterization of Ore, Waste Rock, and Tailings
C-15 January 2003
furnace (e.g., ASTM E-1915-97). In both cases, the carbonate content of the sample isdetermined from the amount of CO2 gas evolved, with the result converted to CaCO3 equivalent. The titration test offers the advantage of determining the carbonate content of samples with awide range of values but can suffer interference if samples contain significant quantities ofsulfide minerals. Combustion tests with Leco analysis should not be used if samples containsignificant pyrrhotite (Fe1-xS), because this mineral will react to form sulfur dioxide gas thatinterferes with the Leco analyzer (BC AMD Task Force, 1989). Combustion tests also provide ameasure of total carbon (including organic carbon) unless pretreatment steps are taken to removethis component.
The alkaline production potential test was developed for use by the coal mining industry. In thismethod, a sample crushed to minus 23 microns is mixed with HCl and allowed to react for twohours at room temperature. The mixture is then titrated to pH 5.0. Although this methodreduces dissolution of less reactive carbonate minerals (e.g., siderite), it may not permit reactionof all of the buffering carbonates present in the sample (Coastech Research, 1989).
4.3.1.2 Static Tests that Produce a Single Indicator Value
Two test procedures have been developed that provide a means for quickly indicatingwhether a sample is likely to have a stoichiometric balance that favors acid production. The netacid generation (NAG) test (Miller et al., 1997) uses a peroxide solution to oxidize sulfideminerals to sulfates. The oxidation process produces acid which reacts with alkaline minerals inthe sample. Upon complete reaction, the solution is titrated to pH 4.5 using NaOH. The volumeof titrated NaOH is used to compute a NAG value, which is expressed in units of kg of H2SO4per metric ton of material.
Paste pH is a simple and inexpensive method to indicate the presence of reactivecarbonate or readily available acidity. In this test, powdered rock and water are mixed in aspecific ratio to form a paste. The pH of the paste is determined using a pH meter and pHreference electrode assembly. The test offers no indication of the relative proportions ofacidifying or neutralizing components in a sample (BC AMD Task Force, 1989).
4.3.1.3 Interpreting Static Test Results
Static test results provide a preliminary indication of whether a sample is likely toproduce acidic drainage in the environment. These tests do not, however, provide any dataregarding when acidification may occur or the rates at which acid generation and neutralizationreactions will proceed. As such, they are useful only for screening samples for their potentialbehavior. It should be kept in mind that most static tests are conducted using crushed orpulverized samples that may have particle sizes significantly smaller than materials as they willbe disposed of. This can significantly change the chemical availabilities of reactive minerals asdescribed in Section 4.2. In addition to these factors, interpretations should incorporateknowledge of sample mineralogy.

EPA and Hardrock Mining: A Source Book for Industry in the Northwest and AlaskaAppendix C: Characterization of Ore, Waste Rock, and Tailings
C-16 January 2003
Static test results are generally interpreted within an empirically developed framework. Interpretations are based on the net neutralization potential and the neutralizing potential. Thenet neutralizing potential (NNP) is defined as the difference between the acid neutralizingpotential (NP) and acid generating potential (AP) of a sample. It is computed by subtracting thelatter from the former (NP-AP) when both are expressed in units of kilograms of CaCO3equivalent per metric ton of material (or metric tons per kiloton). The neutralizing potential ratio(NPR) is the ratio of acid neutralizing potential to acid generating potential (NP/AP) and also iscomputed from static test results when both are expressed in units of kilograms of CaCO3equivalent per metric ton of material (or metric tons per kiloton).
Many static test interpretations use a value for acid generating potential computed fromthe total sulfur content of a sample because it provides the most conservative (highest AP value)measure of acidification potential. In contrast, sulfide sulfur values (or values of total sulfurminus sulfate sulfur) provide more realistic estimates of acid generating capability because theseanalyses do not report sulfur in forms that are not acid generating (e.g., gypsum). The Canadianmetal mining industry has adopted the use of sulfide sulfur as its standard method to computeacid generating potential (Mills, 1998a). It should be recognized that the assumptions inherentin the derivation of the stoichiometric conversion factor lead to additional uncertainty, since thefactor could be significantly greater or less than 31.25 (BC AMD Task Force, 1989; see Section4.3.1.1.1). In fact, some workers advocate using a value of 62.5 (Brady et al., 1990).
The values given in Table C-2 provide general guidelines for interpreting static testresults, but they should not be interpreted as definitive values. Instead, the values should beviewed in light of the sulfur content of the sample, the aggressiveness of the test method used todetermine neutralizing potential, sample mineralogy and expected ambient conditions. Becauseexceptions to these guidelines can and do occur, kinetic tests should be conducted to confirm thestatic test results. As always, operators are encouraged to communicate with state and federalregulators regarding their preferred method to interpret these test results.
In both schemes shown in Table C-2, there are “gray” areas where static acid-baseaccounting tests point to uncertainty. Under the Robertson and Broughton scheme, the gray areaexists where NNP is between -20 and +20 tonnes/kilotonne and NPR is between 1 and 3. In thescheme of Price et al., uncertainty is present where NPR is between 1 and 4. Samples fallinginto the uncertain areas should be tested kinetically (section 4.3.2) to determine their acidgenerating capability. Regardless of their acid generating character, representative samples fromall geochemical groups should be tested for metals mobility using one of the leach testsdescribed in section 4.4.
4.3.1.4 State Recommendations
The States comprising EPA Region 10 presently have not established formal regulatoryguidelines for conducting static tests of mine wastes and materials. The State of Nevada (NVDEP, 1990) recommends use of the Sobek et al. (1978) method to determine neutralizationpotential and either the Sobek et al. (1978) or the peroxide method (presumably O’Shay et al.,
EPA and Hardrock Mining: A Source Book for Industry in the Northwest and AlaskaAppendix C: Characterization of Ore, Waste Rock, and Tailings
C-17 January 2003
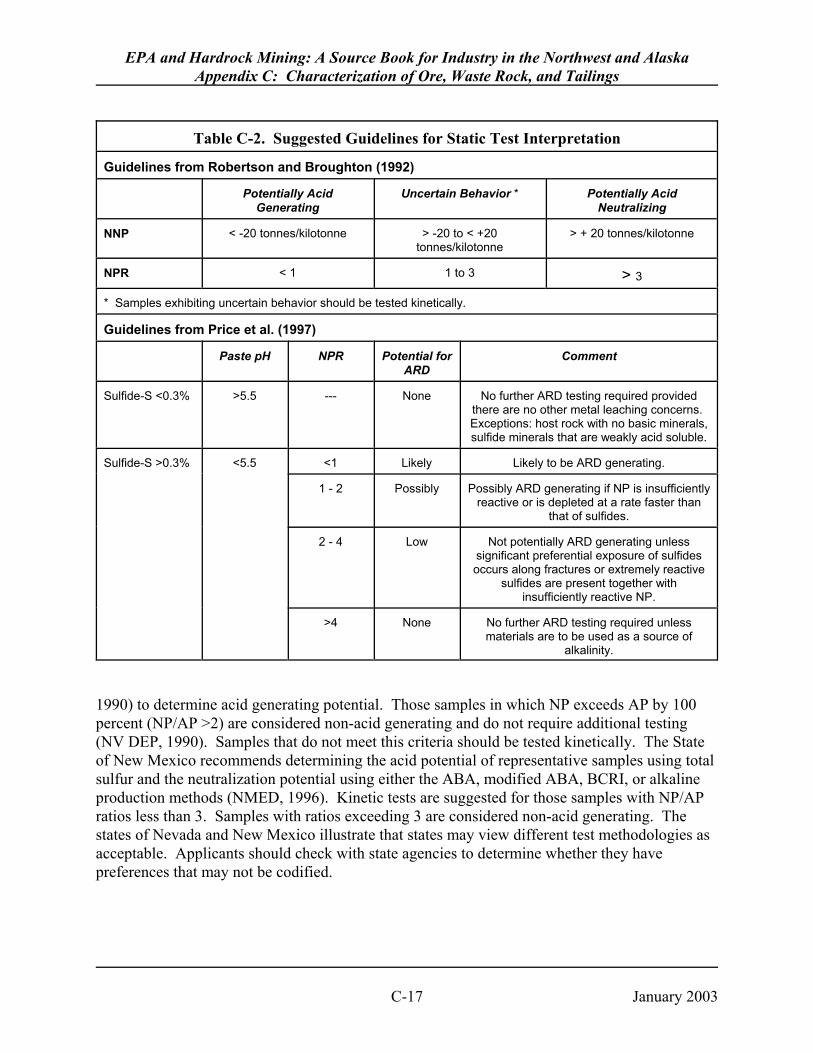
Table C-2. Suggested Guidelines for Static Test Interpretation
Guidelines from Robertson and Broughton (1992)
Potentially AcidGenerating
Uncertain Behavior * Potentially AcidNeutralizing
NNP < -20 tonnes/kilotonne > -20 to < +20tonnes/kilotonne
> + 20 tonnes/kilotonne
NPR < 1 1 to 3 > 3* Samples exhibiting uncertain behavior should be tested kinetically.
Guidelines from Price et al. (1997)
Paste pH NPR Potential forARD
Comment
Sulfide-S <0.3% >5.5 --- None No further ARD testing required providedthere are no other metal leaching concerns. Exceptions: host rock with no basic minerals,sulfide minerals that are weakly acid soluble.
Sulfide-S >0.3% <5.5 <1 Likely Likely to be ARD generating.
1 - 2 Possibly Possibly ARD generating if NP is insufficientlyreactive or is depleted at a rate faster than
that of sulfides.
2 - 4 Low Not potentially ARD generating unlesssignificant preferential exposure of sulfidesoccurs along fractures or extremely reactive
sulfides are present together withinsufficiently reactive NP.
>4 None No further ARD testing required unlessmaterials are to be used as a source of
alkalinity.
1990) to determine acid generating potential. Those samples in which NP exceeds AP by 100percent (NP/AP >2) are considered non-acid generating and do not require additional testing(NV DEP, 1990). Samples that do not meet this criteria should be tested kinetically. The Stateof New Mexico recommends determining the acid potential of representative samples using totalsulfur and the neutralization potential using either the ABA, modified ABA, BCRI, or alkalineproduction methods (NMED, 1996). Kinetic tests are suggested for those samples with NP/APratios less than 3. Samples with ratios exceeding 3 are considered non-acid generating. Thestates of Nevada and New Mexico illustrate that states may view different test methodologies asacceptable. Applicants should check with state agencies to determine whether they havepreferences that may not be codified.
EPA and Hardrock Mining: A Source Book for Industry in the Northwest and AlaskaAppendix C: Characterization of Ore, Waste Rock, and Tailings
C-18 January 2003
4.3.2 Kinetic Tests
Kinetic test procedures are designed to accelerate the natural weathering process in orderto provide information about the rates of acid consumption and acid production over time. Avariety of kinetic test methods are available, including conventional and modified conventionalhumidity cells, SRK humidity cells, soxhlet extractions, column leach tests, shake flaskextractions, modified B.C. Research tests, simulated environment studies, and field lysimetertests; humidity cells and columns are most commonly used by the mining industry. According to Lapakko (1991), there is no single test that produces all of the chemical information needed toevaluate all mine wastes under all conditions of disposal. Most of the kinetic testing proceduresare complex, time-consuming, and require considerable operator skill to produce consistentresults.
4.3.2.1 Kinetic Test Methods
The various kinetic tests described below are similar to one another in that a sample issubjected to periodic leaching, the leachate is collected and analyzed, and rates of acidgeneration, metals release, and neutralization capacity depletion are computed. The methodsdiffer in the amount of sample used in the test, the particle size of the tested material, testconditions (lab vs. field), and test duration. Although not specifically stated in most procedures,it is typical for splits of the starting sample and final leached product to be tested for static acid-base properties and total metals; mineralogical analyses also should be conducted on thesesamples because these data can provide important constraints to assist the interpretation of testresults (Mills, 1998c).
4.3.2.1.1 Conventional and Modified Conventional Humidity Cells
The conventional humidity cell (Sobek et al., 1978) is a bench-scale test that uses acomparatively small amount of sample (200 to 300 g) crushed to particle sizes smaller than 2mm. A split of the sample is analyzed for metals and other constituents to assist in theevaluation of water quality from the tests. The sample is placed in a sealed plastic box and dryair is passed over the sample for 3 days, followed by moist air for 3 days. Every seventh day, thesample is flushed with a specified volume of water. To simulate the composition of regionalacidic rain, the pH of the water may be adjusted to slightly lower pH. The leachant is collectedand analyzed for sulfate, pH, acidity, alkalinity, and electrical conductivity. This 7-day processis repeated for 10 weeks, although some samples may require a longer reaction period (CoastechResearch, 1989). Test durations of 20 weeks are used commonly in the metal mining industry(see discussion in Section 4.3.2.2).
The modified conventional humidity cell designed by Lawrence (1990) uses a biggersample size and larger volume of water for the flush cycles. The test is conducted in a mannergenerally similar to the Sobek method.
ASTM procedure D5744-96 (ASTM, 1998), which was designed specifically for miningwastes and materials, uses a modified column as a humidity cell. The test is conducted on a
EPA and Hardrock Mining: A Source Book for Industry in the Northwest and AlaskaAppendix C: Characterization of Ore, Waste Rock, and Tailings
C-19 January 2003
kilogram of sample crushed to particle sizes smaller than 6.3 mm. The test is run for 20 weeks ina manner similar to the Sobek method, with 3 days of dry air, 3 days of moist air, and a weeklyflush with 0.5 or 1.0 liter of water. The procedure includes provisions for pre-leach and post-leach mineralogical and chemical characterization of the solid sample and directions forpreparation and use of an optional bacterial (T. ferrooxidans) spike.
Few data are available to document the reproducibility of humidity cell data (Mills,1998c). Experiments designed to test the validity of conventional humidity cell results fortailings and waste rock samples are summarized in Lapakko (1991; 1992). In general, theconventional humidity cell is able to indicate many of those samples that become acid producing. However, some validation tests noted indefinite pH trends that were difficult to interpret andsome tests failed to predict acid generation, suggesting that these experiments should havecontinued for longer durations to permit depletion of the neutralizing capacity. Criticisms of theconventional humidity cell are given in Broughton and Robertson (1992). These authors arguethat the small particle size used in the tests masks the influence of particle size on acidgeneration, making them unsuitable for waste rock samples; however, the particle sizes used inthe tests are similar to tailings. Moreover, they point out that the complete sample flush mayaffect the development of local low pH and disrupt the natural storage and flushing of oxidationproducts. Other workers, however, feel that the small particle size is not a limiting factor sincethe most highly reactive products in waste rock piles typically occur in the smaller size fractions(Hinners and SAIC, 1993). For existing waste rock dumps, Price (1997) recommends using onlythe sub-2 mm size fraction of (i.e., crushing larger clasts should be avoided) in humidity celltests. For proposed waste rock dumps, Price (1997) recommends crushing drill core material to80% less than 6 mm. Clay-rich samples can pose problems for humidity cell testing because theclay particles can be easily lost during weekly flushing and they can clog filters used to preventthe loss of fine materials (Mills, 1998c).
4.3.2.1.2 SRK Humidity Cells
Broughton and Robertson (1992) present a modified humidity cell (termed the SRKhumidity cell) designed to test coarse waste rock samples. This test uses material crushed tosizes smaller than 10 cm which is placed into a cylindrical column with a diameter of 30 cm andheight of 45 cm. Humid air is cycled constantly through the cell. Flush water is introduced atseveral points along the upper surface of the waste rock so that it percolates downward alongdiscrete pathways. The volume of flush water approximates (per unit area) conditionsencountered in the field. The cells can be stacked to allow leach water from one test cell to beused as flush water in an underlying cell.
The SRK design eliminates complete flushing of the oxidation products, permitting localareas of low pH to develop within the cell (Broughton and Robertson, 1992). The coarse sizefraction more closely approximates the separation distance between acid-producing and acid-neutralizing minerals in waste rock samples.
EPA and Hardrock Mining: A Source Book for Industry in the Northwest and AlaskaAppendix C: Characterization of Ore, Waste Rock, and Tailings
C-20 January 2003
4.3.2.1.3 Soxhlet Extractions
Soxhlet reactors recirculate water or other fluids through a sample to simulate conditionsof weathering. The method of Sullivan and Sobek (1982) uses distilled water at 25°C to leach asample over a period of six weeks, although the test duration can vary. A technique described byRenton et al. (1988) uses as the leach material a pulverized coal waste sample that has beenoxidized in an oven. The sample is leached in a soxhlet reactor with distilled water at 85°C andthe leachate is analyzed for water quality parameters. The sample is returned to the oven foradditional oxidation prior to the next leach cycle. The oxidation-leaching cycle is repeated 5times.
Soxhlet extractions require sophisticated equipment and considerable operator skill,especially for the Renton et al. procedure. Evaluations of the Sullivan and Sobek (1982) methodby Coastech Research (1989) indicate that it may provide reliable results for tailings samples. The aggressive oxidation of samples and elevated leaching temperatures used in the Renton et al.method tend to overestimate the acid producing capability of a sample by accelerating thedissolution of carbonate minerals (Bradham and Caruccio, 1990).
4.3.2.1.4 Column Tests
Column test procedures have not been standardized (Mills, 1998c). Consequently, theyare highly flexible tests that permit a range of column designs, test material characteristics, andflow rates. Column tests can be conducted in a manner similar to conventional humidity cells,but they can also be run in an “upflow” mode to simulate subaqueous disposal or as subaerialcolumns without forced oxygenation (i.e., the top of the column is open but air is not forcedthrough the sample) (Mills, 1998c). Columns, which typically have diameters of 15 cm andlengths of up to 2 m, can be constructed with larger diameters and lengths to accommodate largersample sizes (10 kg to 3 metric tons; Broughton and Robertson, 1992). Particle sizes up to 2 cmare commonly used in these tests. Materials can be inoculated with bacteria or stratified withneutralizing materials (for example, limestone) to test disposal options.
Subaerial columns are used to simulate the effects of precipitation infiltration into anddrainage from materials that are exposed to the atmosphere. A fixed amount of water may beadded to the column on a regular basis or the amount may be varied and added irregularly tosimulate seasonal variability (Mills, 1998c). Moreover, water may be added to specific portionsof the column surface to promote flow along preferred pathways, which allows oxidationproducts to accumulate on particle surfaces within the column (Mills, 1998c).
Subaqueous columns are used to simulate water infiltration into and drainage frommaterials that are stored under a water cover. To simulate seepage to ground water, columns canbe constructed to permit downward displacement of pore waters by supernatant water (Mills,1998c). They also can be constructed to allow slow upward movement of deoxygenated water ina manner that simulates submarine disposal.
EPA and Hardrock Mining: A Source Book for Industry in the Northwest and AlaskaAppendix C: Characterization of Ore, Waste Rock, and Tailings
C-21 January 2003
Experiments designed to determine the validity of column tests for tailings and wasterock samples are summarized in Lapakko (1991; 1992). Several of these studies (e.g., Doepker,1989) concluded that pyrite oxidized more rapidly in columns that remained unsaturated betweenflushes, producing lower pH leachate than saturated columns. In general, column tests appear todistinguish potentially reactive materials from benign materials, but the leachant compositionsmay not reflect what occurs under natural settings (Doepker and O’Connor, 1990).
4.3.2.1.5 Shake Flask Extractions
Also termed batch reactor tests, shake flask tests utilize a split of powdered sampleimmersed in distilled water that may be inoculated with bacteria. The flask is sealed and placedon a shaker table where it is vibrated for a period of days to weeks. Samples are removedperiodically and analyzed to determine the sulfate content, pH and other water qualityparameters.
The shake flask test is relatively simple and inexpensive. However, for long durationtests, water may need to be added to maintain volume and submersion of the sample may inhibitoxidation of reactive sulfides (BC AMD Task Force, 1989). Interpretation of test results is quitecomplex if water has been added periodically.
4.3.2.1.6 Field Tests
Field lysimeter tests are conducted using sample quantities that vary from barrel-scale topiles. The tests can be conducted for protracted periods (years) under natural climaticconditions. In cases where samples have a small to moderate amount of neutralization potential,long test durations are required to overcome the effects of neutralization and the lag period thatprecedes bacterial oxidation (Lapakko, 1991). Test piles are typically equipped with lysimetersor set atop impermeable liners to facilitate collection of drainage samples and are constructed ina manner similar to actual or proposed waste rock or tailings piles. Drainage volumes andconcentrations can be used to calculate the mass release rates of metals per unit mass of waste.
A major advantage of field tests is their conduct under the environmental conditions atthe disposal site, which provides more realistic estimates of water quality and the rates of acidgeneration and neutralization than bench-scale lab tests (Price, 1997). In addition, they allowcontrol options, such as limestone addition (Humphreys, 1990), to be tested under naturalconditions. However, it is critical that the tests be conducted for durations of sufficient length tosmooth the effects of short-term climatic variations. Consequently, their long duration makesthese tests difficult to use, especially for evaluating proposed actions.
4.3.2.2 Interpreting Kinetic Test Results
The interpretation of kinetic test results, for which accepted criteria are generally lacking,can range from relatively straightforward to extremely difficult (Ferguson and Erickson, 1988;Price, 1997; Mills, 1998d). All interpretations should be based on knowledge of samplemineralogy, static test data, particle size characteristics, and water flow (Mills, 1998d). Scaling
EPA and Hardrock Mining: A Source Book for Industry in the Northwest and AlaskaAppendix C: Characterization of Ore, Waste Rock, and Tailings
C-22 January 2003
issues are a significant obstacle when using bench-scale kinetic test results to quantitativelyestimate acid generation in waste rock and tailings piles. Included are the effects of grain sizeand reactive surface area, infiltration rates, and flushing rates and volumes (see comments inHinners and SAIC, 1993).
Most investigators use temporal trends in leachate quality, including pH, sulfate, acidity,alkalinity, and trace metals, to identify the progression of the acid mine drainage process (e.g.,Ferguson and Erickson, 1988; Lapakko et al., 1995; Price, 1997; Mills, 1998d). Because trendsin leachate composition reflect changing sample mineralogy and geochemical equilibriumconditions, they must be interpreted cautiously. Equilibrium chemical speciation programs,such as MINTEQA2 (Section 5.2.2), can be used to identify the precipitation/dissolutionreactions that are likely to control leachate composition. It is important to keep in mind that lab-scale kinetic tests are specifically designed to accelerate the natural weathering process. Consequently, these tests cannot be used to determine when materials may begin to generate acidin the environment (only that they will or will not), and they generally will produce leachateswith higher metal concentrations than would be produced naturally (Mills, 1998c). For mostbench-scale tests, samples are considered strongly acid generating if leachate pH falls below 3;acid generating with some neutralization occurring if pH is between 3 and 5; and notsignificantly acid generating (or generated acid is overwhelmed by excess alkalinity) if solutionpH exceeds 5 (BC AMD Task Force, 1989; Humphreys, 1990).
Sample mineralogy plays a pivotal role in controlling leachate quality (Mills, 1998d). For samples lacking sulfate minerals, the production of aqueous sulfate may be used to monitorthe sulfide oxidation process. In contrast, when gypsum or other soluble sulfate minerals arepresent, their dissolution will provide aqueous sulfate that can mask sulfate produced by sulfideoxidation. In some cases, high aqueous sulfate concentrations produced by gypsum dissolutionmay delay the onset of sulfide oxidation in kinetic tests (Mills, 1998d). Test samples collectedfrom existing waste piles may contain previously formed oxidation products that dissolve atvarying rates to contribute metals to kinetic test leachates. Hydrolysis of these metals can lead toreduced pH. Depending on reaction kinetics, secondary mineral dissolution is likely to overprintthe effects of sulfide oxidation, which complicates calculations of sulfide oxidation rates (Mills,1998d). Price (1997) provides a list of equations that can be used to interpret laboratory kinetictests.
Whether kinetic test samples may eventually begin to produce acidic leachates dependson the proportions of acid generating and acid neutralizing materials, their relative dissolutionand reaction rates, and the particle size characteristics of the test materials. Kinetic test durationis a critical issue (Price, 1997). Kinetic tests must be conducted for a period of time that issufficient to permit the dissolution of neutralizing minerals and accumulated oxidation productsand to overcome the lag-time that precedes the onset of bacterial oxidation. Although 20-weektest lengths are common in the metal mining industry, there is a growing trend toward longer testtimes. For example, Price (1997) recommended minimum test durations of 40 weeks and Mills(1998c) reported that test lengths commonly exceed 104 weeks in western Canada. In long-termstudies reported by Lapakko et al. (1998), some samples did not begin to produce acidic drainageuntil more than two years into the kinetic tests. Particle size also strongly influences kinetic test
EPA and Hardrock Mining: A Source Book for Industry in the Northwest and AlaskaAppendix C: Characterization of Ore, Waste Rock, and Tailings
C-23 January 2003
results. The reduced particle sizes used in many bench-scale tests enhance reactivity byliberating sulfides enclosed in silicate minerals (e.g., pyrite enclosed in quartz; Broughton andRobertson, 1992; Lapakko et al., 1998; Mills, 1998e). In coarser samples, these sulfides wouldnot be exposed to oxidation. Moreover, smaller particle diameters increase the total surface areaof acid generating and acid neutralizing minerals exposed to reaction which, in turn, affectsreaction rates and drainage quality (Lapakko et al., 1998; Mills, 1998c).
Finally, it is important to consider that differences between lab test conditions and thenatural environment are likely to complicate extrapolation of kinetic test results. Differencesbetween lab and ambient atmospheric temperature, lab wetting cycles and natural precipitationfrequency, and complete flushing flows in the lab vs. incomplete or channelized flow in actualwaste piles are cited by Mills (1998c) as factors that require consideration.
4.3.2.3 State Recommendations
The states comprising EPA Region 10 presently have not promulgated formal guidelinesthat cite specific kinetic procedures. The State of Nevada accepts kinetic testing methods thatinclude shake flask extractions, soxhlet extractions, conventional humidity cells, column tests,and field tests (NV DEP, 1990). Although kinetic tests are required for samples of spent ore,tailings, and waste rock, the State does not provide guidelines for the interpretation of testresults. The State of New Mexico recommends the use of humidity cells and columns for mostkinetic test applications, but will accept soxhlet extraction test results as appropriate (NMED,1996). The State recommends shake flask extractions for simulating closure conditions thatrequire underwater storage (NMED, 1996). The State does not provide criteria by which tointerpret kinetic test results. Applicants should check with state agencies to determine whetherthey have preferences that may not be codified.
4.3.3 Other Methods
In addition to laboratory analysis of environmental samples, insight into the potential forcertain geologic materials to become acid generating can be gained through empirical studies ofpre-mining water quality, alteration history (including weathering), mineralogy, and waterquality in analogous mined terranes. These types of studies may help to overcome issues relatedto sample representativeness and the applicability of laboratory conditions to the naturalenvironment (Plumlee et al., 1999). Plumlee and coworkers have shown that geologic features(e.g., deposit and alteration mineralogy), hydrologic setting, climate (e.g., rainfall andevaporation), and mining methods affect drainage composition at hard rock mines. Althoughempirical field studies can be used to anticipate problems before they occur and to guidelaboratory investigations, they should not be used as a basis for quantitative predictions ofdrainage quality from particular mines, dumps or impoundments.
4.3.4 Mathematical Models
Neither static nor kinetic test results provide the types of data that determineunequivocally the potential for acid generation from waste rock and tailings piles. Instead, test
EPA and Hardrock Mining: A Source Book for Industry in the Northwest and AlaskaAppendix C: Characterization of Ore, Waste Rock, and Tailings
C-24 January 2003
results must be extrapolated to longer time frames and different environmental conditions andscaled to account for the differences in waste volumes, particle sizes, particle separationdistances, infiltration rates, flushing rates, and flushing volumes between laboratory test samplesand waste deposits. Mathematical models can help to bridge this gap and can help plannersdetermine the potential effects of waste rock and tailings piles runoff.
Empirical models of acid generation utilize trends observed in test results to extrapolatefuture conditions, typically using “best-fit lines” through test data points (BC AMD Task Force,1989). The accuracy of an empirical model, which is by definition a site-specific model,depends on the quality of the test data. Major sources of uncertainty include differences inparticle-size distributions between test materials and actual waste materials and lack of modelcalibration to conditions as they will exist in the waste disposal setting (BC AMD Task Force,1989).
Theoretical or deterministic models solve a series of equations that represent differentphysical or chemical aspects of the acid generation process in order to predict the temporalevolution of acid generation (see Perkins et al. [1995] for a review of the application ofgeochemical models to predictions of acid generation). Models include the Reactive AcidTailings Assessment Program (RATAP) model (SENES and Beak, 1986; 1988); the minetailings oxidation (MINTOX) model (MEND, 1997); the sulfide oxidation model of Davis andRitchey (1986); and the MINEWALL model (MEND, 1995). RATAP was developed to assessacid generation and ground water quality in fine-grained pyritic tailings. MINTOX can be usedto predict the kinetic behavior of sulfide oxidation within mine tailings impoundments andsimulate the speciation and transport of oxidation products through tailings and into downstreamaquifers. The Davis and Ritchey model determines an approximate analytical solution thatallows a user to evaluate the amount of time required for oxidation of all material in a mass ofwaste and estimate the amount of time that materials can pose a threat in the environment. TheMINEWALL model can estimate water chemistry continuously through operational and closurephases of a mining operation.
Uncertainty is introduced into theoretical models by an incomplete understanding of thesystem which is being modeled or through use of simplifying assumptions (BC AMD TaskForce, 1989). In general, theoretical models may fail to properly describe fluid transport throughconstructed waste piles, accurately predict thermal gradients that may arise due to the oxidationprocess, and correctly determine the transport of oxygen and reaction products incompositionally and physically heterogeneous wastes (BC AMD Task Force, 1989; Nicholson,1992).
4.4 Leaching Procedures
Spent ore, waste rock, or tailings materials that are exposed to the environment canpotentially contribute metals or other contaminants to the environment. Metals can be leachedfrom geological materials even under neutral conditions, but it is accelerated by materials thatgenerate acid as a consequence of sulfide oxidation. Consequently, a variety of leaching tests are

EPA and Hardrock Mining: A Source Book for Industry in the Northwest and AlaskaAppendix C: Characterization of Ore, Waste Rock, and Tailings
C-25 January 2003
used to determine which constituents in waste materials are potentially mobile under theexpected environmental conditions.
4.4.1 U.S. EPA Procedures
EPA has developed three leach test procedures. Of these, the Synthetic PrecipitationLeaching Procedure (SPLP) test and Toxicity Characteristic Leaching Procedure (TCLP) test arethe most widely applied by the mining industry. The SPLP test is most applicable to metalsremoval from mining wastes and materials.
4.4.1.1 EP Toxicity Test
The Extraction Procedure (EP) Toxicity Test (EPA Method 1310A) was developed todetermine whether a particular waste material exhibits the characteristics of a hazardous waste. The method, which has been replaced by the TCLP test for regulatory purposes, is outlined inU.S. EPA (1986a), with the most recent version of the experimental procedure dated July 1992,revision 1. The method uses an extraction fluid composed of acetic acid diluted to pH 5.0 ± 0.2. Solid samples of approximately 100 g are crushed to sizes smaller than 9.5 mm and placed intoan extraction bottle; special procedures are used for mixed solid/liquid waste. A 16:1 weightratio of extraction fluid:sample solid is added to the bottle, which is agitated for 24 hours. Following extraction, the leachate is filtered and analyzed for metals.
4.4.1.2 Toxicity Characteristic Leaching Procedure Test
The Toxicity Characteristic Leaching Procedure (TCLP) Test (EPA Method 1311;ASTM Method D5233) was designed to evaluate the mobility of inorganic and organicconstituents in liquids, solids, and mixed wastes in a sanitary landfill. The method is outlined inU.S. EPA (1986a), with the most recent version of the experimental procedure dated July 1992,revision 0. For non-alkaline materials, the method uses an extraction fluid composed of aceticacid diluted to pH 4.93 ± 0.05. For alkaline materials, the method uses an extraction fluidcomposed of acetic acid diluted to pH 2.88 ± 0.05. Samples containing volatile organiccomponents are leached using a zero head space tumbler and the pH 4.93 extract fluid. For non-volatile materials, samples of approximately 100 g are crushed to sizes smaller than 9.5 mm andplaced into an extraction bottle. A 20:1 weight ratio of extraction fluid:sample solid is added tothe bottle, which is agitated for 18 ± 2 hours. Following extraction, the leachate is filtered,preserved with nitric acid, and analyzed for metals.
4.4.1.3 Synthetic Precipitation Leaching Procedure Test
The Synthetic Precipitation Leaching Procedure (SPLP) test (EPA Method 1312) wasdesigned to determine the mobility of organic and inorganic analytes in liquids, solids, andmixed wastes using a batch leach technique. The method is outlined in U.S. EPA (1986a), withthe most recent version of the experimental procedure dated September 1994, revision 0. Forareas west of the Mississippi River, the method uses an extraction fluid composed of a 60/40weight percent mix of sulfuric/nitric acid diluted to pH 5.00 ± 0.05 to simulate regional acidic
EPA and Hardrock Mining: A Source Book for Industry in the Northwest and AlaskaAppendix C: Characterization of Ore, Waste Rock, and Tailings
C-26 January 2003
precipitation. Samples containing cyanide or volatile organic components are leached usingspecial procedures and distilled water as the extraction fluid. For non-volatile materials, samplesof approximately 100 g are crushed to sizes smaller than 9.5 mm and placed into an extractionbottle. A 20:1 weight ratio of extraction fluid:sample solid is added to the bottle, which isagitated for 18 ± 2 hours. Following extraction, the leachate is filtered, preserved with nitricacid, and analyzed for metals.
4.4.1.4 Monofilled Waste Extraction Procedure
The Monofilled Waste Extraction Procedure (MWEP) is a sequential batch extraction testdeveloped to predict the composition of leachate produced from solid waste under fieldconditions. The procedure is outlined in U.S. EPA (1986b). Solid materials are crushed to passa 9.5 mm sieve and are combined with extraction fluid in a 10:1 liquid:solid ratio. The mixtureis tumbled at room temperature for 24 hours. The procedure uses reagent grade water as theextraction fluid, however, the test can be conducted using process waters, ground waters, orother fluids that occur at a site. Following extraction, the leachate is filtered and analyzed. Thesolid residue is returned to the extraction vessel and the leach process is conducted using freshextraction fluid. Four leachings per sample are recommended. Not only does this procedureallow single samples to be leached repetitively, but it permits more than one sample to beleached by the same extraction fluid.
4.4.2 State Procedures
The State of Nevada recently developed a leach test specifically for mining wastes. Theprocedure has been broadly accepted by the mining industry and is being used to test wastes thatwould be disposed of in other regions.
The State of Nevada uses a single-pass column leach test termed the Meteoric WaterMobility Procedure (MWMP) to determine the potential for waste rock, spent ore, and tailings torelease certain constituents to the environment. The test is required by guidance documentsissued by the Division of Environmental Protection (NV DEP, 1990; 1996). The procedure isprovided in NV DEP (1996) and available (as of February 1999) on the internet(www.enviromine.com/ard/Acid-Base%20Accounting/metal_leaching.htm).
The MWMP test uses 5 kg of material crushed to particle sizes smaller than 5 cm whichis loaded into an extraction column. A volume of extraction fluid equal to the dry weight of thesample (milliliters of fluid equal to grams of sample) is passed through the sample in a 24 hourperiod. Although the procedure states that the pH of the extraction fluid should “reflect the pHof precipitation in the geographic region in which the mine rock is being evaluated,” theprocedure uses Type II reagent grade water (distilled or deionized as produced by Method 1080in APHA et al., 1992) as the extraction fluid. The pH values of the initial leachate andhomogenized leachate at the end of testing are recorded. The homogenized leachate is filteredand analyzed for dissolved constituents.
EPA and Hardrock Mining: A Source Book for Industry in the Northwest and AlaskaAppendix C: Characterization of Ore, Waste Rock, and Tailings
C-27 January 2003
4.4.3 Other Leaching Procedures
Leach test procedures also have been developed by the Province of British Columbia, theU.S. Army Corps of Engineers, and the American Society for Testing and Materials (ASTM). These tests are not widely used by the American mining industry.
4.4.3.1 British Columbia Procedures
The British Columbia Special Waste Extraction Procedure (SWEP) is a single batchextraction that uses an acetic acid lixiviant, a 16:1 liquid:solid mass ratio, and an extraction timeof 24 hours. According to Mills (1998f), for mine wastes in British Columbia, it is standardpractice to used distilled water or 0.1 N hydrochloric acid as the extract fluid, a liquid:solid massratio of 3:1, and an extraction time of 24 hours.
4.4.3.2 U.S. Army Corps of Engineers Procedures
The U.S. Army Corps of Engineers developed a procedure to conduct sequential batchleaching tests (SBLT) of dredged materials (Brannon et al., 1994). This procedure, whichdetermines changes in the equilibrium distribution of a contaminant between solid material andan aqueous phase, can be used to investigate the quality of water that might be expected to occurduring episodic flushing of mining wastes (for example, during wet winters and dry summers). The SBLT procedure uses a liquid:solid weight ratio of 4:1 and a 24-hour leaching time for eachstep. Samples are placed into a tumbler and tumbled using deoxygenated water as the leachingmedium. The leachate is separated by centrifuge, filtered, preserved with nitric acid, andanalyzed for electrical conductivity and metals. A minimum of four sequential cycles arerecommended. The procedure provides a conservative estimate of leachate concentrations underconditions of anaerobic leaching of freshwater sediments (Brannon et al., 1994). The SBLTprocedure could be applied to analysis of tailings and other fine-grained materials, such asborrow soils used for growth media and covers. However, the procedure does not define the sizefractions that should be tested and its applicability to tests of coarse waste rock has not beendemonstrated.
Myers and Brannon (1988) and Myers et al. (1991) describe a procedure developed bythe U.S. Army Corps of Engineers for column leach testing of dredged freshwater sediments. These tests are recommended to confirm the results of sequential batch leaching tests and can beused if the potential for contamination is high. The Myers et al. (1991) procedure uses animproved column design that increases the number of pore volumes that can be eluted in a givenperiod of time by using a decreased column length and increased column diameter (producingpore water velocities of approximately 10-5 cm/sec). The test, which uses kilogram samples, isconducted using deoxygenated water as the leaching medium.
Graded serial batch tests are described by Houle and Long (1978; 1980). In these tests,solid waste is mixed with an extraction fluid in a liquid:solid ratio of 2:1 and shakenintermittently for 24 hours. The sample is filtered and the leachate analyzed, with residual solidmaterial returned the extraction vessel for subsequent leaching. The liquid:solid ratio is doubled
EPA and Hardrock Mining: A Source Book for Industry in the Northwest and AlaskaAppendix C: Characterization of Ore, Waste Rock, and Tailings
C-28 January 2003
for each succeeding extraction (i.e., 4:1, 8:1, 16:1, etc.), with a total of seven leach cyclesrecommended for each sample. The extraction fluid can be reagent water or any site-specificfluid, thus permitting a determination of the constituents that can be removed from or adsorbedby the solid waste.
4.4.3.3 ASTM Procedures
The American Society for Testing and Materials provides methodologies for conductingshake flask extractions (ASTM Method D3987) and sequential batch extractions of solid wastes(ASTM Methods D4793 and D5284) (ASTM, 1996). The tests use liquid:solid mass ratios of20:1 and extraction times of 18 hours. In the sequential batch tests, 10 leachate samples areproduced from a single solid waste sample. Methods D3987 and D4793 use water for theextraction fluid whereas method D5284 uses an acidic extraction fluid with a pH similar to thatof the average regional precipitation in the disposal area.
4.4.4 State Recommendations
The states comprising EPA Region 10 presently have not promulgated formal guidelinesthat specify use of a particular leaching procedure. The State of Nevada recommends use of theNevada Meteoric Water Mobility Procedure to test representative samples of waste rock, spentore and tailings for their potential to release contaminants (NV DEP, 1996). The State of NewMexico (NMED, 1996) recommends use of EPA method 1312 (SPLP test) to test samples for thepotential to release contaminants. Applicants should check with state agencies to determinewhether they have preferences that may not be codified.
4.4.5 Comparison of Leaching Procedures
Batch leach tests vary significantly in their ability to extract metals from solid materialsdepending on the type of extraction fluid employed. The determination of which leach testmethod should be applied to mining wastes is the subject of continuing regulatory discussionsand there may be differences between state and federal requirements. As such, operators shouldmaintain open lines of communication with all regulatory agencies on this topic.
In 1995, EPA stated its position that EPA Method 1311 (TCLP) tests were applicable toevaluations of mineral processing wastes. In general, Method 1311 is applicable to any mining-related material that is not Bevill-exempt. However, where the materials are Bevill-exempt (e.g.,waste rock), particularly when they will be managed in a monofill, EPA Method 1312 (SPLP)may be the preferred method because it utilizes strong acids similar to those that would begenerated under oxidizing conditions. However, the SPLP test uses a combination of sulfuricand nitric acids as the extraction fluid, which precludes determination of sulfate and nitrateconcentrations in test leachates. Because these constituents may be of interest (sulfates asoxidation products of sulfides or hydrolysis products of acid-sulfate minerals; nitrates as blastingresidue), it may bedesirable to modify the procedure to substitute a strong acid such ashydrochloric acid, which has similar, albeit less oxidizing, qualities, as the extraction fluid. TheSPLP test also can be modified to be more aggressive by decreasing the pH of the extraction
EPA and Hardrock Mining: A Source Book for Industry in the Northwest and AlaskaAppendix C: Characterization of Ore, Waste Rock, and Tailings
C-29 January 2003
fluid. The SPLP test is run under conditions of high fluid to solid ratio (20:1) and short duration(18 hours), which limits the extent to which biological oxidation will breakdown reactive sulfideminerals. States may have their own requirements or preferences, and operators are advised toconsult with their state regulatory authorities.
Sequential leach tests provide data regarding the rate at which constituents could bereleased to the environment. In particular, these tests can show whether the concentrations ofmetals in a leachate exhibit temporal trends. However, extrapolating the results of sequentialleach tests to the expected conditions of waste disposal may not be straightforward since mosttests are conducted on material that may have significantly different reaction kinetics than theactual waste (due to particle size) and because extraction durations and the amount of timebetween extractions do not replicate either natural wet-dry cycles or conditions of atmosphericoxidation.
Many leaching tests use reagent-grade water as the extraction fluid (e.g., NevadaMWMP), which may not simulate the expected natural conditions, for example, whereacidification occurs at depth in a waste pile. To more closely approximate leaching in regionswhere rainfall is acidic or where percolating water contacts oxidation products, reagent watercan be acidified using strong acids to pH values typical of the regional precipitation. A moreacidic extraction fluid makes leaching tests chemically more aggressive; consequently, theirresults provide a more conservative estimate of the potential impacts of mining materials onwater quality.
A recent study by Doyle et al. (1998) leached samples of mining wastes using batch(SPLP) and continuous column procedures. They found that batch tests frequently, but notalways predicted higher metals leachability than the column tests, suggesting that they typicallyprovide a more conservative estimate of environmental behavior. However, the study did notindicate which test methods better represented actual field conditions.
5.0 ANALYSIS OF FATE AND TRANSPORT
Analyzing chemical fate and transport at mine sites is a complex task due to theinteractions between the hydrologic cycle, pollutant cycle, and sedimentation (watershed) cycle(Bonazountas, 1983). Consequently, fate modeling includes processes that occur on the landsurface (soil, atmosphere and water), the unsaturated zone, and the saturated zone (Bonazountas,1983). Anderson and Woessner (1992) describe a modeling protocol for ground water systemsthat can be extended and applied to mine sites. It includes establishing the purpose of the model,developing a conceptual model, selecting governing equations and an appropriate computercode, and designing, verifying and calibrating a numerical model.
5.1 Developing a Conceptual Model
A conceptual model is a pictoral representation of a complex system, frequently in theform of a block diagram or cross-section (Anderson and Woessner, 1992). The conceptual
EPA and Hardrock Mining: A Source Book for Industry in the Northwest and AlaskaAppendix C: Characterization of Ore, Waste Rock, and Tailings
C-30 January 2003
model simplifies a complex field problem and makes it more amenable to modeling. Inparticular, it helps to determine the dimensions of the numerical model and the design of anappropriate grid. An example of a conceptual physical ground water model taken fromAnderson and Woessner (1992) is shown in Figure C-1. A conceptual physicochemical model ofmetal transport in a river, taken from Schnoor (1996), is shown in Figure C-2.
Four information components are needed to develop a conceptual site model (Bedient etal., 1994). Geology provides the physical framework within which subsurface fluids collect andflow and an understanding of the characteristics of the materials and solid wastes that must behandled. Hydrology describes the movement of fluids across the surface and through thephysical framework (subsurface). Chemistry defines the nature of the chemical constituentstransported by the surface and subsurface flow systems, including aspects of biochemistry asthey apply to fluid chemistry. Climate provides data to describe interactions betweenprecipitation, evaporation, surface flow, subsurface flow, and infiltration.
The amount of data required to develop a mine-site conceptual model of fate andtransport are considerable (Schnoor, 1996; Hemond and Fechner, 1994; U.S. EPA, 1989). Themine plan provides information about the locations, character, and volumes of materials andwastes, surface and subsurface disturbances, ground water withdrawals, surface water diversions,and outfall locations and discharges. The solids balance describes the amount and character ofmaterial that will be excavated, processed, and disposed. The water balance characterizes theeffects of climatic variations, drawdown, surface water diversion, and waste water discharge. Surface water hydrology provides information regarding discharges and their seasonal variation, surface waterchemistry, and storm runoff. Ground water hydrology describes flow rates (flux), hydrologicgradients, ground water volumes, ground water chemistry, and flow paths. Geology providesdata on vertical stratigraphy (including aquitards), lateral changes in stratigraphic relations, the locations and density of faults and fractures, and mineralogy. Aquifer characteristics includephysical aspects such as hydraulic conductivity, porosity, and fracture and matrix flow and chemical aspects including adsorptive or neutralizing components and biogeochemicalprocesses. Contaminant characteristics describe the chemistry, density, discharge, volume, andchemical and physical stability of solid and liquid wastes and materials.
5.2 Mathematical Models
Mathematical models that couple physical flow and chemical mass balance equations areused to simulate the flow and transport of contaminants through the environment. Becausemodels used for predictive purposes are only as good as the data input to them, high quality, site-specific data are required to produce confident and realistic model predictions.
5.2.1 Categories of Mathematical Models
Mathematical models can be grouped into three general categories (Knox et al., 1993). Analytical models solve governing equations using simplifying assumptions. They are generallyone- or two-dimensional models that assume steady-state flow. Stochastic models incorporate
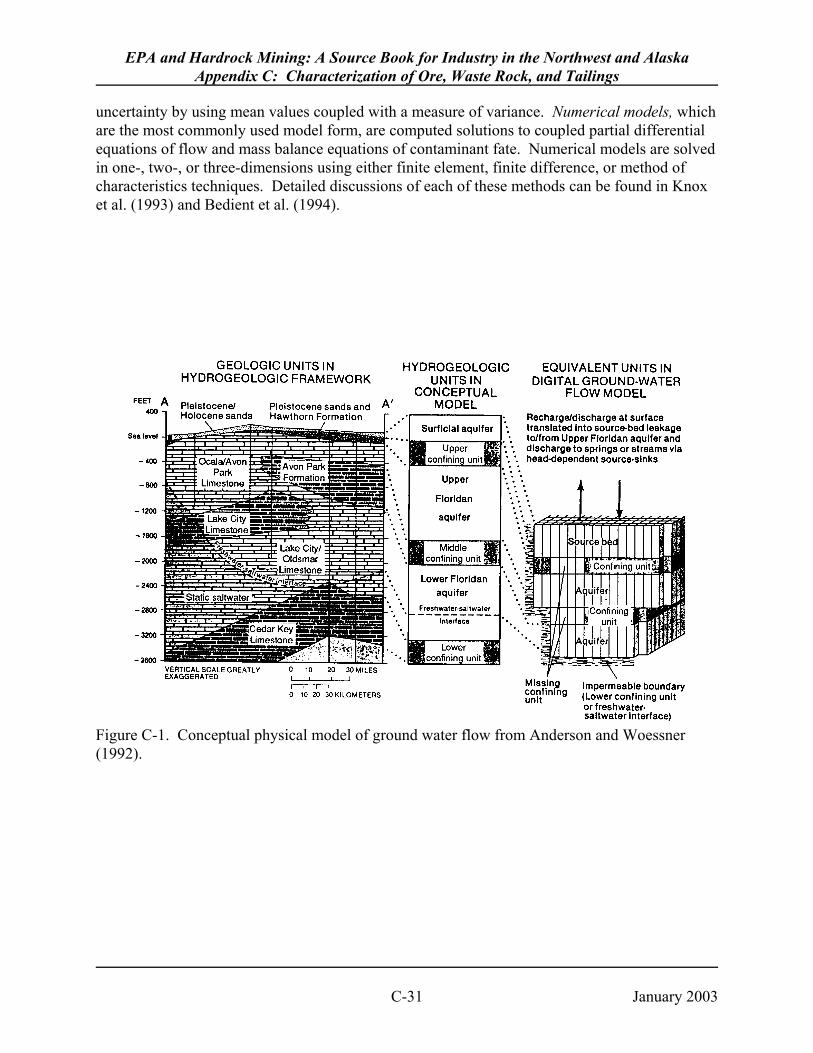
EPA and Hardrock Mining: A Source Book for Industry in the Northwest and AlaskaAppendix C: Characterization of Ore, Waste Rock, and Tailings
C-31 January 2003
Figure C-1. Conceptual physical model of ground water flow from Anderson and Woessner(1992).
uncertainty by using mean values coupled with a measure of variance. Numerical models, whichare the most commonly used model form, are computed solutions to coupled partial differentialequations of flow and mass balance equations of contaminant fate. Numerical models are solvedin one-, two-, or three-dimensions using either finite element, finite difference, or method ofcharacteristics techniques. Detailed discussions of each of these methods can be found in Knoxet al. (1993) and Bedient et al. (1994).
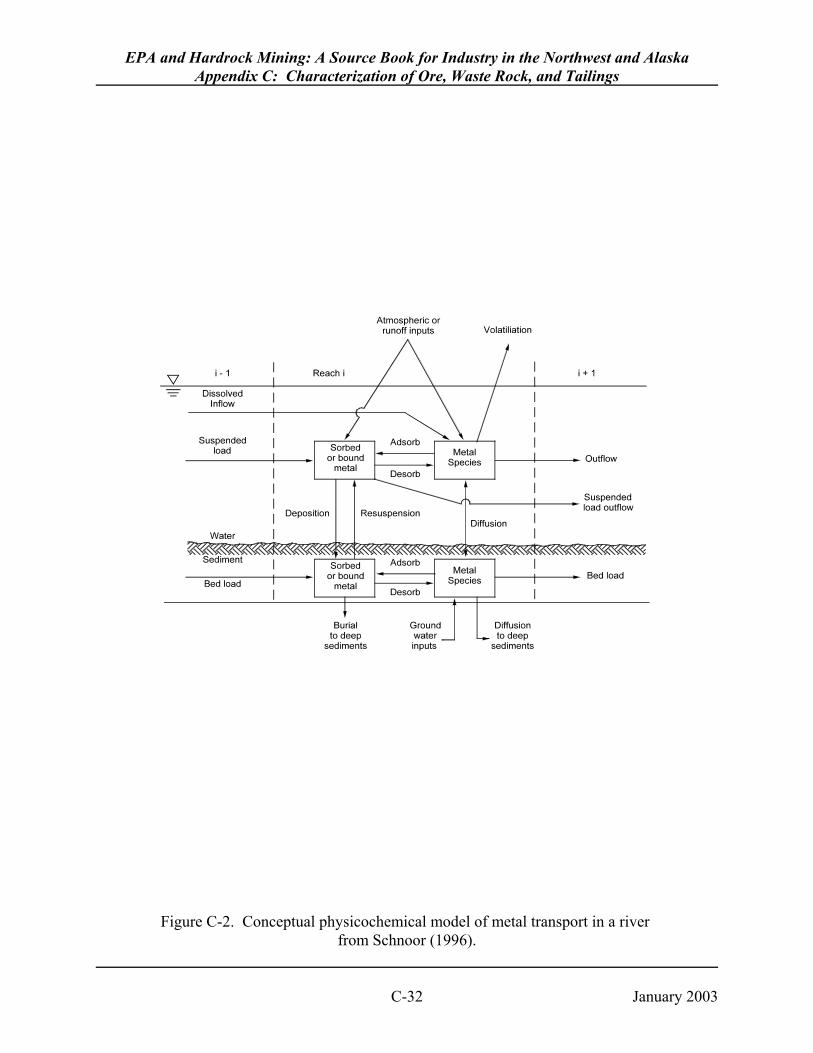
EPA and Hardrock Mining: A Source Book for Industry in the Northwest and AlaskaAppendix C: Characterization of Ore, Waste Rock, and Tailings
C-32 January 2003
Figure C-2. Conceptual physicochemical model of metal transport in a river from Schnoor (1996).
EPA and Hardrock Mining: A Source Book for Industry in the Northwest and AlaskaAppendix C: Characterization of Ore, Waste Rock, and Tailings
C-33 January 2003
5.2.2 Chemical Equilibrium Models
Numerous physical, chemical, and biological processes occurring in surface andsubsurface environments can affect the transport and fate of contaminants. These can be dividedinto abiotic and biotic processes (Keely, 1989a). Abiotic processes are physical and chemicalinteractions that cause contaminants to move at a rate different from than that of surface orground water. They include hydrolysis, sorption, cosolvation, immiscibility, ionization,radionuclide decay, complexation, volatilization, photodegradation, precipitation, dissolution,and reduction-oxidation (Johnson et al., 1989; Schnoor, 1996). Biotic processes are microbiallymediated transformations or adsorbtion of contaminants. They include biodegradation andbioaccumulation. Other physical processes that may affect contaminant concentrations includehydrodynamic dispersion, molecular diffusion, and density stratification (Knox et al., 1993).
Chemical equilibrium models calculate changes in chemical concentrations assumingequilibrium. Aqueous models of trace metal concentrations compute chemical species byaccounting for aqueous-phase complexation (e.g., by naturally occurring humic acids), surfacecomplexation (e.g., by ion-exchange on the surfaces of clays), adsorption and sedimentation byparticles (e.g., lead adsorbed on the surface of ferric hydroxide), mineral precipitation (e.g.,ferric hydroxide), mineral dissolution (e.g., calcite dissolution by acid), aggregation/flocculation(e.g., the formation of colloidal suspensions by electrostatic processes), redox reactions thataffect solubility (e.g., Cr+3 and Cr+6), and adsorption by soil particles (Johnson et al., 1989;Schnoor, 1996). Summary descriptions of three chemical equilibrium models, Mac:QL,MINEQL+, and MINTEQA2, are given in Schnoor (1996).
5.2.3 Physical Flow and Transport Models
Flow and solute (mass) transport models are available for surface water, ground water(saturated zone), and the vadose zone (unsaturated zone). They typically are used in conjunctionwith one of the equilibrium chemical models described above. The mathematical developmentof the governing flow and transport equations used in many of these models is given in Schnoor(1996).
Models commonly used to compute river water quality include QUAL2EU, NONEQUI,and WASP (summary descriptions are given in Schnoor, 1996 and are available via the internet nsites for the U.S. EPA’s Robert S. Kerr Environmental Research Lab and Center for ExposureAssessment Modeling). QUAL2EU is a steady-state model for pollutants in branching streamsand well-mixed lakes that incorporates uncertainty analysis into the model results.
Keely (1989b) points out that many ground water models are inappropriate for use inareas where subsurface flow is controlled by fractures or karst features. Consequently, thechoice of models determines whether realistic model predictions can be computed for theseareas. Bedient et al. (1994) provide summary model descriptions and a listing of modeledprocesses for a variety of unsaturated and saturated flow and solute transport models. Includedare 6 vadose-zone flow models, 11 vadose-zone solute transport models, 12 saturated zone flowmodels, and 9 saturated zone solute transport models. Additional model descriptions are

EPA and Hardrock Mining: A Source Book for Industry in the Northwest and AlaskaAppendix C: Characterization of Ore, Waste Rock, and Tailings
C-34 January 2003
available via the internet from the U.S. EPA’s Robert S. Kerr Environmental Research Lab. Among the more widely used saturated zone models are MODFLOW, a three-dimensional finitedifference model, and USGS-MOC, a two-dimensional finite difference and methods ofcharacteristics model for ground water flow and solute transport. Anderson and Woessner(1992) describe three conceptual models that can be used to approximate flow through afractured system for input to models based on saturated or unsaturated flow. Each of theseconceptual models uses assumptions that oversimplify flow through the fractured system.
6.0 SAMPLING PROGRAMS
The environmental sampling process should follow a sequence of steps to ensure thatcollected samples are representative and adequate (Triegel, 1988). It is important to first identifythe goals of the sampling program and the levels of confidence required. The number ofrequired samples then can be determined by characterizing the sources of variability (e.g.,sample heterogeneity). Using these data, the sample program can be designed. The designshould consider the types of analyses that will be conducted on the samples and include thenumber and distribution of samples and their manner of collection. The following sectionsspecifically address geochemical testing programs.
6.1 Objectives of a Geochemical Sampling Program
Establishing a reliable geochemical testing program is a difficult, but critical, aspect ofmine site development. By indicating whether control technologies or alternative disposalmethods should be added to the existing mine plan, a robust program that uses representativesamples can diminish, perhaps eliminate, the costs of contamination mitigation and control thatwould be encumbered should environmental problems arise in the future (Robertson andBroughton, 1992).
The geologic history and nature of mineralization observed at a mine site is unique to thatparticular location. As a result, geochemical sampling programs will differ from site to site. Nevertheless, all sampling programs should strive to capture the range of variability that occurs,provide an accurate statistical representation of the materials present, and objectively test thefeasibility of the disposal methods described by the proposed mine plan. A geochemicalsampling program should consider several factors that could affect the chemical or physicalcharacter of samples and, consequently, impact test results. Included are the method of samplecollection, the length of time that a sample will be (or has been) stored prior to analysis, and theenvironment in which samples are (or were) stored (U.S. EPA, 1994).
For proposed mines, sampling and testing programs use fresh samples to predict thepotential for acid generating conditions to develop or metals to leach from materials and wastes(Robertson and Broughton, 1992). A sampling program should be developed within the contextof geochemical rock units and be related directly to a mine plan that outlines the area to bemined, the locations of pit walls and benches or underground workings, the locations andamounts of ore and waste rock that will be excavated, and the approximate timing of excavation
EPA and Hardrock Mining: A Source Book for Industry in the Northwest and AlaskaAppendix C: Characterization of Ore, Waste Rock, and Tailings
C-35 January 2003
and final placement of the materials (BC AMD Task Force, 1989; Price, 1997). The latter isespecially important for determining the potential for contaminant release from waste rockdumps and other managed materials because these features can vary in particle size, mineralogy,and chemical composition over short distances and over the life of the mining operation. Thesampling program also should include materials (e.g., tailings) produced during bench-scale orpilot-scale processing tests of samples that encompass the range of materials that will beprocessed over the life of the operation. Geochemical and mineralogical variability can beevaluated using three-dimensional geostatistical techniques similar to those used to characterizethe ore body (Robertson and Broughton, 1992). While these methods are well-developed, theyare beyond the scope of this appendix.
Sampling and testing programs at existing or abandoned mines should address questionsregarding the quantity of acid products stored in the materials and wastes and how contaminationemanating from them is likely to change in the future (Robertson and Broughton, 1992). Forstudies of existing waste rock dumps, spent ore heaps, or tailings piles, a sampling program mustestablish the physical, mineralogical, and chemical variability of the materials and wastes (seeNash et al., 1998).
6.2 Sample Representativeness
Samples used in geochemical tests should be representative of the materials that will bemined and processed. According to Smith et al. (1988), representativeness expresses the degreeto which data accurately and precisely represent a characteristic of a population, parametervariations at a sampling point, or a process or environmental condition. Indeed, the major sourceof uncertainty in a sampling and testing program lies in the samples themselves. In particular,the question of how accurately a sample represents a larger volume of material can only beaddressed by establishing the variation inherent in the geochemical rock unit by taking multiplesamples and examining their frequency distribution (BC AMD Task Force, 1990). In this regard,sampling programs should establish criteria for sample size, the appropriateness of compositingsamples, and collection method to meet data quality objectives related to representativeness.
6.2.1 Proposed Mine Sites
Tests to determine physical and geochemical variability should be conducted initially oneach lithologic unit that will be excavated, exposed or otherwise disrupted in a mine site area. They should use as their basis the mineralogical zonation observed within the ore body and, ifpossible, the mineralogical distinction that separates ore material from waste rock. The results ofinitial tests can be used to define units with similar geochemical and leachate productionattributes (i.e., geochemical rock units; Brodie et al., 1991). In some cases, test results willrequire that a heterogeneous lithologic unit be divided into two or more geochemical rock units,whereas in other cases, two or more homogeneous lithologic units may be grouped together. Each geochemical rock unit should be tested further to define the range of its geochemicalcharacteristics. In essence, a sampling program should use an iterative process to assessvariability and it should be designed to be sufficiently flexible to respond to changes in themining plan (Robertson and Broughton, 1992).
EPA and Hardrock Mining: A Source Book for Industry in the Northwest and AlaskaAppendix C: Characterization of Ore, Waste Rock, and Tailings
C-36 January 2003
Geochemical test samples should be collected from each geochemical rock unit over thefull vertical and areal extent of the mine site or area of interest. Geographical representativenesscan be depicted using maps and cross-sections. The number of samples that should be testeddepends on the volume and variability of the rock unit in question. In general, samplerequirements increase with chemical and mineralogical heterogeneity, but there are no widelyaccepted guidelines. For example, the BC AMD Task Force (1989) recommended a minimumnumber of acid-base accounting test samples appropriate for a rock unit with a given mass. Asshown on Figure C-3, this approach can lead to extensive sampling requirements for largefacilities and result in high sampling costs. Price (1997) also provides minimum samplenumbers based on unit tonnage. Alternatively, Runnells et al. (1997) suggested that the numberof required samples should reflect the heterogeneity of the materials within the facility. Theappropriate number of samples is obtained when statistical variability in sample results is withinacceptable limits. Using this approach, the number of samples needed to characterize a facilitywill vary from one facility to another because each facility is unique. The Runnells et al. (1997)method can be applied easily to existing facilities, but may be difficult to apply to materials thatwould be disposed of in proposed facilities. Nevertheless, sampling programs that use a fixed-frequency sampling approach should be designed to ensure that sample variability can bedescribed with statistical validity (e.g., BC AMD Task Force, 1990).
Geologic materials, which are composed of one or more minerals, are by definitioncomposite materials. For the purposes of geochemical testing, sample sizes should be largeenough to smooth the effects of small-scale heterogeneity, but small enough to reveal thevariations present in the rock unit of interest. The effects of composite sample size on thedistribution of net neutralization potential values obtained from a highly variable rock mass aredescribed by Robertson and Broughton (1992). For waste rock and overburden materials,samples are commonly lengths of drill core or drill cuttings. Robertson and Broughton (1992)suggest restricting drill core lengths to less than 0.5 meters for acid-base accounting tests toensure that the chemical behavior of a waste rock pile can be evaluated on small and large scales.
6.2.2 Existing or Abandoned Mine Sites
Existing or abandoned mine sites can pose special problems for geochemical testsampling because the history of the mine and the detailed composition of materials and wastesmay be unknown or unrecorded. Changes to processing methods and efficiency that may haveoccurred during active production or time gaps when mining did not occur can produce chemicaland physical heterogeneity within piles of materials that are not evident from their exposedsurfaces. Consequently, sampling programs designed for existing or abandoned mine sitesshould determine the variability of all materials disposed of or exposed on the surface (seediscussion of Runnells et al. 1997 in Section 6.2.1 and Nash et al., 1998) or through a well-planned composite sampling program (Smith et al., 2000). For pit walls, this will require

EPA and Hardrock Mining: A Source Book for Industry in the Northwest and AlaskaAppendix C: Characterization of Ore, Waste Rock, and Tailings
C-37 January 2003
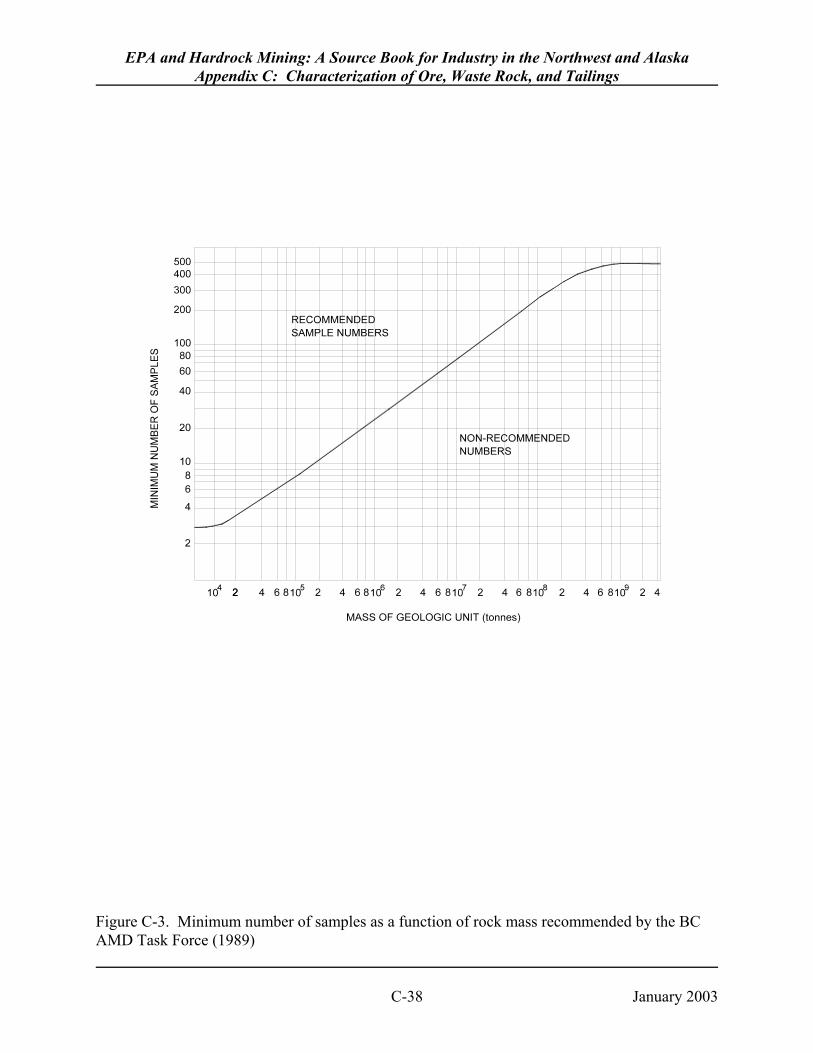
EPA and Hardrock Mining: A Source Book for Industry in the Northwest and AlaskaAppendix C: Characterization of Ore, Waste Rock, and Tailings
C-38 January 2003
Figure C-3. Minimum number of samples as a function of rock mass recommended by the BCAMD Task Force (1989)
EPA and Hardrock Mining: A Source Book for Industry in the Northwest and AlaskaAppendix C: Characterization of Ore, Waste Rock, and Tailings
C-39 January 2003
collecting samples vertically and laterally across the exposed rock faces. For waste rock dumps,spent ore heaps, and tailings impoundments, it will require collecting samples laterally andvertically throughout the deposit (typically by drilling) (Nash et al., 1998). Data gathered fromthese samples can be used to construct a three-dimensional image of the volume and chemicaland physical character of the waste materials. As described in the previous section, the numberof samples required by the program depends on the volume and variability of the materials inquestion, but generally increases with chemical, mineralogical, and physical heterogeneity.
6.3 Quality Control and Quality Assurance
A recent report by Downing and Mills (1998) describes the application of qualityassurance and quality control procedures as they apply to acid rock drainage studies. QA/QCguidance and procedures prepared by EPA are available in Adobe format on the EPA Region 10QA website (www.epa.gov/r10earth/offices/oea/qaindex.htm). New guidance for the preparationof QAPP documents is in review and is scheduled for issue in early 1999.
6.3.1 Quality Control
Taylor (1988) defines quality control as the application of good lab practices, goodmeasurement practices, and standard procedures for sampling. The latter should includespecifications for chain-of custody, storage and preservation, stabilization methods, labeling, andsample containers.
Physical and geochemical tests conducted using approved methods (EPA or otherwise)will produce analytical results with accuracy and precision sufficient for all likely applications,providing that methods are chosen for their ability to meet the data quality objectives describedin the next section. In this regard, it is important for applicants to select analytical methods thathave the necessary detection limits. Applicants should periodically submit replicate samples fortesting and analysis to confirm laboratory assessments of analytical performance.
6.3.2 Quality Assurance
Quality assurance is the process of monitoring for adherence to quality control protocols(Taylor, 1988). Smith et al. (1988) list five data quality objectives of a quality assurance projectplan (QAPP): precision, bias, representativeness, completeness, and comparability (cf. U.S.EPA, 1980; 1998a; 1998b). Precision leads to a measurement of variance (e.g., standarddeviation) and is the mutual agreement among individual measurements under prescribed similarconditions. Bias refers to the degree to which a measurement reflects an accepted true orreference value, commonly expressed as a percentage. Representativeness, as described above,expresses the degree to which data accurately represent a characteristic of a population. Completeness is a measure of the amount of valid data compared to the amount expected to beobtained under normal conditions. Comparability is a measure of confidence that one data setcan be compared to another.

EPA and Hardrock Mining: A Source Book for Industry in the Northwest and AlaskaAppendix C: Characterization of Ore, Waste Rock, and Tailings
C-40 January 2003
A QAPP will ensure that procedures are established prior to the beginning of samplecollection and will help to balance the costs of implementing a quality-assured program againstthe liabilities of a poorly designed and executed sampling program.
7.0 REFERENCES
American Public Health Association, American Water Works Association, and WaterEnvironment Federation (APHA et al.), 1992. Standard Methods for the Examination ofWaters and Wastewaters, 18th edition, American Public Health Association, Washington,D.C..
Anderson, M.P. and Woessner, W.W., 1992. Applied Groundwater Modeling: Simulation ofFlow and Advective Transport, Academic Press, Inc., San Diego, CA, 381 pp.
ASTM, 1996, Annual Book of ASTM Standards, American Society for Testing and Materials,Philadelphia, PA.
ASTM, 1998, Annual Book of ASTM Standards, vol. 11.04, American Society for Testing andMaterials, Philadelphia, PA, pp. 259-271.
BC AMD Task Force, 1989. Draft Acid Rock Drainage Technical Guide, Volume 1, BritishColumbia Acid Mine Drainage Task Force Report prepared by Steffen Robertson andKirsten, Norelco Environmental Consultants, and Gormely Process Engineering, August1989.
BC AMD Task Force, 1990. Monitoring Acid Mine Drainage, British Columbia Acid MineDrainage Task Force Report prepared by E. Robertson in association with Steffen Robertsonand Kirsten, Inc., BiTech Publishers, Ltd., Vancouver, B.C., 66 pp.
Bedient, P.B., Rifai, H.S., and Newell, C.J., 1994. Groundwater Contamination: Transport andRemediation, PTR Prentice-Hall, Inc., Englewood Cliffs, NJ, 542 pp.
Bertin, E.P., 1970. Principles and Practice of X-Ray Spectrometric Analysis, Plenum Press, NY,679 pp.
Bish, D.L. and Post, J.E., eds., 1989. Modern Powder Diffraction, Reviews in Mineralogy,Volume 20, Mineralogical Society of America, Washington, D.C., 369 pp.
Blatt, H., Middleton, G., and Murray, R., 1980. Origin of Sedimentary Rocks, 2nd ed., Prentice-Hall, Englewood Cliffs, NJ, 782 pp.
Bonazountas, M., 1983. Soil and Groundwater Fate Modeling. In: Swann, R.L. andEschenroeder, A., eds., Fate of Chemicals in the Environment, ACS Symposium Series 225,American Chemical Society, Washington, D.C., p. 41-65.
EPA and Hardrock Mining: A Source Book for Industry in the Northwest and AlaskaAppendix C: Characterization of Ore, Waste Rock, and Tailings
C-41 January 2003
Bradham, W.S. and Caruccio, F.T., 1990. A Comparative Study of Tailings Analysis UsingAcid/Base Accounting, Cells, Columns, and Soxhlets, Proceedings of the 1990 Mining andReclamation Conference and Exhibition, Charleston, WV, p. 19-25.
Brady, K.B.C., Smith, M.W., Beam, R.L., and Cravotta III, C.A., 1990. Effectiveness of theAddition of Alkaline Materials at Surface Coal Mines in Preventing or Abating Acid MineDrainage: Part 1 & 2, Proceedings of the 1990 Mining and Reclamation Conference andExhibition, Volume 1.
Brannon, J.M., Myers, T.E., and Tardy, B.A., 1994. Leachate Testing and Evaluation forFreshwater Sediments, U.S. Army Corps of Engineers, Waterways Experiment Station,Miscellaneous Paper D-94-1, 64 pp.
Brodie, M.J., Broughton, L.M., and Robertson, A.M., 1991. A Conceptual Rock ClassificationSystem for Waste Management and a Laboratory Method for ARD Prediction from RockPiles. In: Proceedings of the Second International Conference on the Abatement of AcidicDrainage, Montreal, Quebec, vol. 3, p. 119-136.
Broughton, L.M. and Robertson, A.M., 1992. Acid Rock Drainage from Mines - Where We AreNow. In: Science Applications International Corporation, Predicting Acid Generation fromNon-coal Mining Wastes: Notes of July 1992 Workshop, Draft report prepared for theEnvironmental Monitoring Systems Laboratory, Office of Research and Development, U.S.Environmental Protection Agency, Las Vegas, NV.
Bruynesteyn, A. and Hackl, R.P., 1984. Evaluation of Acid Production Potential of MiningWaste Materials, Minerals and the Environment, vol. 4, p. 5-8.
Carson, C.D., Fanning, D.S., and Dixon, J.B., 1982. Alfisols and Ultisols with Acid SulfateWeathering Features in Texas. In: Kittrick, J.A., Fanning, D.S., and Hossner, L.R., eds.,Acid Sulfate Weathering, SSSA Special Publication No. 10, Soil Science Society ofAmerica, Madison, WI, pp. 127-146.
Caruccio, F.T., Ferm, J.C., Horne, J., Geidel, G., and Baganz, B., 1977. Paleoenvironment ofCoal and its Relation to Drainage Quality, U.S. Environmental Protection Agency ReportEPA 600/7-77-067, 118 p.
Coastech Research, 1989. Investigation of Prediction Techniques for Acid Mine Drainage,MEND Project 1.16.1.a, Canada Centre for Mineral and Energy Technology, Energy Minesand Resources Canada, 61 pp. plus appendices.
Craig, J.R. and Vaughn, D.J., 1994. Ore Microscopy and Ore Petrography, 2nd ed., John Wileyand Sons, NY, 434 pp.
Crock, J.G., Arbogast, B.F., and Lamothe, P.J., 1999. Laboratory Methods for the Analysis ofEnvironmental Samples, In: G.S. Plumlee and M.J. Logsdon, eds., The Environmental
EPA and Hardrock Mining: A Source Book for Industry in the Northwest and AlaskaAppendix C: Characterization of Ore, Waste Rock, and Tailings
C-42 January 2003
Geochemistry of Mineral Deposits, Part A: Processes, Techniques and Health Issues,Reviews in Economic Geology, Vol. 6A, pp. 265-287.
Davis, G.B. and Ritchey, A.I.M., 1986. A Model of Pyrite Oxidation in Pyritic Mine Wastes:Part 1, Equations and Approximate Solution, Applied Mathematical Modeling, vol. 10, pp.314-322.
Deer, W.H., Howie, R.A., and Zussman, J., 1992. An Introduction to the Rock-FormingMinerals, John Wiley & Sons, New York, NY.
Doepker, R.D., 1989. Enhanced Heavy Metal Mobilization from Unsaturated Mine Tailings,AIME Preprint No. 89-104, 1989 SME Annual Meeting, Las Vegas, NV, 7 pp.
Doepker, R.D. and O’Connor, W.K., 1990. Column Leach Study: Heavy Metal DissolutionCharacteristics from Selected Copper Mine Tailings, Symposium on Planning,Rehabilitation, and Treatment of Disturbed Lands, Billings, MT, 1990, 13 pp.
Downing, B.W. and Mills, C., 1998. Quality Assurance/Quality Control for Acid Rock DrainageStudies, Report posted on the Enviromine worldwide website,http://www.enviromine.com/ard/Acid-Base%20Accounting/Quality.htm, viewed 10/14/98.
Doyle, T.A., Murphy, S.F., Klein, S.M., and Runnells, D.D., 1998. A Comparison of Batch andColumn Leaching Tests of Mining Wastes, Society for Mining, Metallurgy, and Exploration,Inc. Preprint 98-103, 5 pp.
Duncan, D.W. and Bruynesteyn, A., 1979. Determination of Acid Production Potential of WasteMaterials, Metallurgical Society AIME Paper A-79-29, 10 pp.
Ferguson, K.D. and Erickson, P.M., 1988. Pre-Mine Prediction of Acid Mine Drainage. In:Salomans, W. and Forstner, U., eds., Environmental Management of Solid Waste, Springer-Verlag, NY, pp. 24-43.
Fishman, M.J. and Friedman, L.C., 1989. Methods for Determination of Inorganic Substances inWater and Fluvial Sediments, Techniques of Water Resources Investigations of the U.S.Geological Survey, Book 5, Chapter A-1.
Goldhaber, M.B., 1983. Experimental Study of the Metastable Sulphur Oxy-Anion Formationduring Pyrite Oxidation at pH 6-9 and 30°C, American Journal of Science, vol. 283, pp.193-217.
Goldstein, J.I., Newbury, D.E., Echlin, P., Joy, D.C., Fiori, C., and Lifshin, E., 1981. ScanningElectron Microscopy and X-Ray Microanalysis, Plenum Press, NY, 673 pp.
Gribble, C.D. and Hall, A.J., 1993. Optical Mineralogy: Principles and Practice, Chapman andHall, NY, 302 pp.
EPA and Hardrock Mining: A Source Book for Industry in the Northwest and AlaskaAppendix C: Characterization of Ore, Waste Rock, and Tailings
C-43 January 2003
Harris, D.C., 1987. Quantitative Chemical Analysis, 2nd edition, W.H. Freeman and Company,New York, 818 pp.
Hemond, H.F. and Fechner, E.J., 1994. Chemical Fate and Transport in the Environment,Academic Press, San Diego, CA, 338 pp.
Hinners, T.A. and Science Applications International Corporation (SAIC), 1993. PredictingAcid Generation from Non-Coal Mining Wastes: Notes of a July, 1992 Workshop,Environmental Monitoring Systems Laboratory, Office of Research and Development, U.S.Environmental Protection Agency, Las Vegas, NV EPA/600/R-93/041.
Houle, M.J. and Long, D.E., 1978. Accelerated Testing of Waste Leachability and ContaminantMovement in Soils. In: Shultz, D.W., ed., Land Disposal of Hazardous Wastes,Proceedings of the Fourth Annual Research Symposium, U.S. Environmental ProtectionAgency, Report EPA-600/9-78-016, August 1978, pp. 152-168.
Houle, M.J. and Long, D.E., 1980. Interpreting Results from Serial Batch Extraction Tests ofWastes and Soils. In: Shultz, D., ed., Disposal of Hazardous Wastes, Proceedings of theSixth Annual Research Symposium, U.S. Environmental Protection Agency, Report EPA-600/9-80-010, March 1980, pp. 60-81.
Humphreys, R.D., 1990. Report to the Legislature on Acid-Generation Potential Tests, WaterResources Control Board, State of California, Report 90-18CWP, 19 pp.
Hutchison, C.S., 1974. Laboratory Handbook of Petrographic Techniques, John Wiley andSons, NY, 527 pp.
Johnson, R.L., Palmer, C.D., and Fish, W., 1989. Subsurface Chemical Processes. In: U.S.Environmental Protection Agency, Seminar Publication: Transport and Fate ofContaminants in the Subsurface, Office of Technology Transfer, Report EPA 625/4-89-019,pp. 41-56.
Johnson, W.M. and Maxwell, J.A., 1981. Rock and Mineral Analysis, 2nd ed., John Wiley andSons, NY, 489 pp.
Keely, J.F., 1989a. Introduction. In: U.S. Environmental Protection Agency, SeminarPublication: Transport and Fate of Contaminants in the Subsurface, Office of TechnologyTransfer, Report EPA 625/4-89-019, pp. 1-4.
Keely, J.F., 1989b. Modeling Subsurface Contaminant Transport and Fate. In: U.S.Environmental Protection Agency, Seminar Publication: Transport and Fate ofContaminants in the Subsurface, Office of Technology Transfer, Report EPA 625/4-89-019,pp. 101-132.
Kerr, P.F., 1977. Optical Mineralogy, 4th ed., McGraw-Hill, NY, 442 pp.
EPA and Hardrock Mining: A Source Book for Industry in the Northwest and AlaskaAppendix C: Characterization of Ore, Waste Rock, and Tailings
C-44 January 2003
Kleinman, R.L.P. and Erickson, P.M., 1983. Control of Acid Drainage from Coal Refuse usingAnionic Surfactants, U.S. Bureau of Mines Report of Investigations 8847.
Knox, R.C., Sabatini, D.A., and Canter, L.W., 1993. Subsurface Transport and Fate Processes,Lewis Publishers, Boca Raton, FL, 430 pp.
Lapakko, K., 1991. Mine Waste Drainage Quality Prediction: A Literature Review, Draft reportto the Minnesota Department of Natural Resources, 50 pp.
Lapakko, K., 1992. Evaluation of Tests for Predicting Mine Waste Drainage pH, Draft report tothe Western Governors’ Association, May 1992, 72 pp.
Lapakko, K., 1994. Evaluation of Neutralization Potential Determinations for Metal Mine Wasteand a Proposed Alternative, Proceedings of the International Land Reclamation and MineDrainage Conference, U.S. Bureau of Mines Report SP-06A-94, pp. 129-137.
Lapakko, K., Wessels, J., and Antonson, D., 1995. Long Term Dissolution Testing of MineWaste, U.S. Environmental Protection Agency Report EPA 530-R-95-040, 85 pp.
Lapakko, K., Haub, J., and Antonson, D., 1998. Effects of Dissolution Time and Particle Size onKinetic Test Results, Society for Mining, Metallurgy, and Exploration, Inc. Preprint, 98-114,9 pp.
Lawrence, R.W., 1990. Laboratory Procedures for the Prediction of Long Term WeatheringCharacteristics of Mining Wastes, Proceedings of the Symposium on Acid Mine Drainage,Annual Meeting of the Geological Association of Canada and Mineralogical Association ofCanada, Vancouver, BC, May 18-18, 1990.
Lawrence, R.W. and Wang, Y., 1996. Determination of Neutralization Potential for Acid RockDrainage Prediction, MEND Report 1.16.3, Ottawa, ON, 149 pp.
Lawrence, R.W. and Wang, Y., 1997. Determination of Neutralization Potential in thePrediction of Acid Rock Drainage, Proceedings of the Fourth International Conference onAcid Rock Drainage, Vancouver, BC, pp. 15-30.
Lawrence, R.W., Jaffe, S., and Broughton, L.M., 1988. In-House Development of the Net AcidProduction Test Method, Coastech Research.
Lundgren, D.G. and Silver, M., 1980. Ore Leaching by Bacteria, Annual Review ofMicrobiology, vol. 34, pp. 263-283.
Miller, S., Robertson, A., and Donahue, T., 1997. Advances in Acid Drainage Prediction usingthe Net Acid Generation (NAG) Test, Proceedings of the Fourth International Conferenceon Acid Rock Drainage, Vancouver, BC, pp. 533-549.
EPA and Hardrock Mining: A Source Book for Industry in the Northwest and AlaskaAppendix C: Characterization of Ore, Waste Rock, and Tailings
C-45 January 2003
Mills, C., 1998a. Acid-Base Accounting (ABA), Report posted on the Enviromine worldwideweb site, http://www.enviromine.com/ard/Acid-Base%20Accounting/ABAdiscussion.htm,viewed 10/14/98.
Mills, C., 1998b. Acid-Base Accounting (ABA) Test Procedures, Report posted on theEnviromine worldwide web site, http://www.enviromine.com/ard/Acid-Base%20Accounting/acidbase.htm, viewed 10/14/98.
Mills, C., 1998c. Kinetic Testwork Procedures, Report posted on the Enviromine worldwideweb site, http://www.enviromine.com/ard/Kinetic%20Tests/kinetic%20procedures.htm,viewed 10/14/98.
Mills, C., 1998d. Kinetic Testwork Interpretation, Report posted on the Enviromine worldwideweb site, http://www.enviromine.com/ard/Kinetic%20Tests/kinetic%20examples.htm,viewed 10/14/98.
Mills, C., 1998e. Particle Size Distribution & Liberation Size, Report posted on the Enviromineworldwide web site,http://www.enviromine.com/ard/Mineralogy/Size%20&%20Liberation.htm, viewed10/14/98.
Mills, C., 1998f. Metal Leaching Test Procedures, Report posted on the Enviromine worldwideweb site, http://www.enviromine.com/ard/Acid-Base%20Accounting/metal_leaching.htm,viewed 10/14/98.
Mine Environment Neutral Drainage (MEND) Program, 1995. MINEWALL 2.0 - LiteratureReview and Conceptual Models, Mine Environment Neutral Drainage Program, Project1.15.2b, Natural Resources Canada, Ottawa, ON, September 1995.
Mine Environment Neutral Drainage (MEND) Program, 1997. Metal Transport andImmobilization at Mine Tailings Impoundments, Mine Environment Neutral DrainageProgram, Report PA-2, Natural Resources Canada, Ottawa, ON, March 1997.
Myers, T.E. and Brannon, J.M., 1988. Synthesis of Leaching Research and Workshop Results,Environmental Effects of Dredging Technical Notes EEDP-02-15, U.S. Army Corps ofEngineers, Waterway Experiment Station.
Myers, T.E., Gambrell, R.P., and Tittlebaum, M.E., 1991. Design of an Improved ColumnLeaching Apparatus for Sediments and Dredged Material, U.S. Army Corps of Engineers,Waterways Experiment Station, Miscellaneous Paper D-91-3.
Nash, J.T., Desborough, G.A., and Fey, D.L., 1998. Geochemical and MineralogicalCharacterization of Mine Dumps on BLM Lands, Upper Animas River Watershed,Colorado: Plans and Preliminary Results, Science for Watershed Decisions on Abandoned
EPA and Hardrock Mining: A Source Book for Industry in the Northwest and AlaskaAppendix C: Characterization of Ore, Waste Rock, and Tailings
C-46 January 2003
Mine Lands: Review of Preliminary Results, Denver, Colorado, February 4-5, 1998, U.S.Geological Survey Open-File Report 98-297, pp. 44-45.
Nevada Department of Environmental Protection (NV DEP), 1990. Waste Rock and OverburdenEvaluation, September 14, 1990, 2 pp. plus attachment.
Nevada Department of Environmental Protection (NV DEP), 1996. Guidance Document —Alternate Use of Mine Waste Solids - Disposal Outside of Containment, January 23, 1996, 7pp.
New Mexico Environment Department (NMED), 1996. Discharge Plan Closure Guidance forMining Sites, Draft report by the Ground Water Pollution Prevention Section, May 30, 1996,10 pp.
Nicholson, R.V., 1992. A Review of Models to Predict Acid Generation Rates in SulphideWaste Rock at Mine Sites, International Workshop of Waste Rock Modeling, September 29to October 1, 1992, Toronto, Canada.
Nicholson, R.V., Gillham, R.W., and Reardon, E.J., 1990. Pyrite Oxidation in Carbonate-Buffered Solution: 2. Rate Control by Oxide Coatings, Geochimica Cosmochimica et Acta,vol. 54, pp. 395-402.
Norrish, K. and Chappell, B.W., 1967. X-Ray Fluorescence Spectrography. In: Zussman, J.(ed.), Physical Methods in Determinative Mineralogy, Academic Press, London, pp. 161-214.
O’Shay, T.O., Hossner, L.R., and Dixon, J.B., 1990. A Modified Hydrogen Peroxide OxidationMethod for Determination of Potential Acidity in Pyritic Overburden, Journal ofEnvironmental Quality, vol. 19, pp. 778-782.
Page, A.L., Miller, R.H., and Keeney, D.R., 1982. Methods of Soil Analysis: Part 2 - Chemicaland Microbiological Properties, 2nd edition, American Society of Agronomy, Inc., SoilScience Society of America, pp. 199-209.
Patniak, P., 1997. Handbook of Environmental Analysis: Chemical Pollutants in Air, Water,Soil, and Solid Wastes, CRC Lewis Publishers, Boca Raton, FL, 584 pp.
Perkins, E.H., Nesbitt, H.W., Gunter, W.D., St-Arnaud, L.C., and Mycroft, J.R., 1995. CriticalReview of Geochemical Processes and Geochemical Models Adaptable for Prediction ofAcidic Drainage from Waste Rock, Mine Environment Neutral Drainage Program Report1.42.1, Natural Resources Canada, Ottawa, ON, April 1995.
Plumlee, G.S., Smith, K.S., Montour, M.R., Ficklin, W.H., and Mosier, E.L., 1999. GeologicControls on the Composition of Natural Waters and Mine Waters Draining Diverse Mineral-Deposit Types, In: G.S. Plumlee and M.J. Logsdon, eds., The Environmental Geochemistry

EPA and Hardrock Mining: A Source Book for Industry in the Northwest and AlaskaAppendix C: Characterization of Ore, Waste Rock, and Tailings
C-47 January 2003
of Mineral Deposits, Part A: Processes, Techniques and Health Issues, Reviews inEconomic Geology, Vol. 6B, pp. 373-432.
Price, W.A., 1997. DRAFT Guidelines and Recommended Methods for the Prediction of MetalLeaching and Acid Rock Drainage at Minesites in British Columbia, British ColumbiaMinistry of Employment and Investment, Energy and Minerals Division, Smithers, BC, 143pp.
Price, W.A., Moran, K., and Hutt, N., 1997. Guidelines for the Prediction of Acid RockDrainage and Metal Leaching for Mines in British Columbia: Part II. RecommendedProcedures for Static and Kinetic Testing, Proceedings Fourth International Conference onAcid Rock Drainage, Vancouver, B.C. Canada, May 31 - June 6, 1997, pp. 15-30.
Renton, J.J., Rhymer, A.H., and Stiller, A.H., 1988. A Laboratory Procedure to Evaluate theAcid Producing Potential of Coal Associated Rocks, Mining Science and Technology, v. 7,pp. 227-235.
Robertson, A.M. and Broughton, L.M., 1992. Reliability of Acid Rock Drainage Testing. In:Science Applications International Corporation, Predicting Acid Generation from Non-CoalMining Wastes: Notes of July 1992 Workshop, Draft report prepared for the EnvironmentalMonitoring Systems Laboratory, Office of Research and Development, U.S. EnvironmentalProtection Agency, Las Vegas, NV.
Robinson, J.W., 1990. Atomic Spectroscopy, Marcel Dekker, Inc., NY, 299 pp.
Runnells, D.D., Shields, M.J., and Jones, R.L., 1997. Methodology for Adequacy of Samplingof Mill Tailings and Mine Waste Rock. In: Tailings and Mine Waste ‘97, Balkema,Rotterdam, pp. 561-563.
Schnoor, J.L., 1996. Environmental Modeling: Fate and Transport of Pollutants in Water, Air,and Soil, John Wiley and Sons, Inc., New York, 682 pp.
SENES Consultants, Ltd. and Beak Consultants, Ltd., 1986. Estimation of the Limits of AcidGeneration by Bacterially-Assisted Oxidation of Uranium Mill Tailings, DSS File#15SQ.23241-5-1712, Research report prepared for the National Uranium TailingsAssessment Program, CANMET, EMR, Ottawa, Ontario.
SENES Consultants, Ltd. and Beak Consultants, Ltd., 1988. Adaptation of the Reactive AcidTailings Assessment Program (RATAP) to Base Metal Tailings — Appendices A-I, Researchreport prepared for Canada Centre for Mineral and Energy Technology, EMR, Ottawa,Ontario.
Sherlock, E.J., Lawrence, R.W., and Poulin, R., 1995. On the Neutralization of Acid RockDrainage by Carbonate and Silicate Minerals, Environmental Geology, vol. 25, pp. 43-54.

EPA and Hardrock Mining: A Source Book for Industry in the Northwest and AlaskaAppendix C: Characterization of Ore, Waste Rock, and Tailings
C-48 January 2003
Skousen, J., Renton, J., Brown, H., Evans, P., Leavitt, B., Brady, K., Cohen, L., andZiemkiewicz, P., 1996. Effect of Digestion Method, Siderite Content, and Fizz Rating onNeutralization Potential of Overburden Samples. In: Skousen, J. and Ziemkiewicz, P., eds.,Acid Mine Drainage: Control and Treatment, 2nd Edition, pp. 47-68.
Skousen, J., Renton, J., Brown, H., Evans, P., Leavitt, B., Brady, K., Cohen, L., andZiemkiewicz, P., 1997. Neutralization Potential of Overburden Samples ContainingSiderite, Journal of Environmental Quality, vol. 26, pp. 673-681.
Smith, F., Kulkarni, S., Myers, L.E., and Messner, M.J., 1988. Evaluating and PresentingQuality Assurance Sampling Data. In: Keith, L.H., ed., Principles of EnvironmentalSampling, American Chemical Society, Salem, MA, pp. 157-170.
Smith, K.S., Plumlee, G.S., and Ficklin, W.H., 1994. Predicting Water Contamination fromMetal Mines and Mining Wastes: Notes, Workshop No. 2, International Land Reclamationand Mine Drainage Conference and Third International Conference on the Abatement ofAcidic Drainage, U.S. Geological Survey Open-File Report 94-264, 112 pp.
Smith, K.S., Ramsey, C.A., and Hageman, P.L., 2000. Sampling Strategy for the RapidScreening of Mine-Waste Dumps on Abandoned Mine Lands, ICARD 2000, Proceedingsfrom the Fifth International Conference on Acid Rock Drainage, pp., 1453-1461.
Sobek, A.A., Schuller, W.A., Freeman, J.R., and Smith, R.M., 1978. Field and LaboratoryMethods Applicable to Overburden and Minesoils, U.S. Environmental Protection AgencyReport EPA-600/2-78-054, 204 pp.
Sullivan, P.J. and Sobek, A.A., 1982. Laboratory Weathering Studies of Coal Refuse, Mineralsand the Environment, vol. 14, pp. 561-568.
Taylor, J.K., 1988. Defining the Accuracy, Precision, and Confidence Limits of Sample Data. In: Keith, L.H., ed., Principles of Environmental Sampling, American Chemical Society,Salem, MA, pp. 101-108.
Triegel, E.K., 1988. Sampling Variability in Soils and Solid Wastes. In: Keith, L.H., ed.,Principles of Environmental Sampling, American Chemical Society, Salem, MA, pp. 385-394.
U.S. Environmental Protection Agency (EPA), 1980. Interim Guidelines and Specifications forPreparing Quality Assurance Project Plans, Office of Monitoring Systems and QualityAssurance, Report QAMS-005/80.
U.S. Environmental Protection Agency (U.S. EPA), 1983. Methods for the Chemical Analysis ofWater and Waste, Report EPA 600/4-79-020, Revised, 1983.
EPA and Hardrock Mining: A Source Book for Industry in the Northwest and AlaskaAppendix C: Characterization of Ore, Waste Rock, and Tailings
C-49 January 2003
U.S. Environmental Protection Agency (U.S. EPA), 1986a. Test Methods for Evaluating SolidWaste, 3rd, edition, Office of Solid Waste and Emergency Response, Report SW-846,volume 1, November 1986 with revisions to January 1995.
U.S. Environmental Protection Agency (U.S. EPA), 1986b. A Procedure for EstimatingMonofilled Solid Waste Leachate Composition, U.S. EPA Technical Resource Document,SW-924, January, 1986.
U.S. Environmental Protection Agency (U.S. EPA), 1989. Seminar Publication: Transport andFate of Contaminants in the Subsurface, Office of Technology Transfer, EPA Report 625/4-89-019.
U.S. Environmental Protection Agency (U.S. EPA), 1994. Acid Mine Drainage Prediction,Special Waste Branch, Office of Solid Waste, U.S. Environmental Protection Agency,Washington, D.C., EPA-530-R-94-036.
U.S. Environmental Protection Agency (U.S. EPA), 1995. Applicability of the ToxicityCharacteristic Leaching Procedure to Mineral Processing Wastes, Office of Solid Waste,U.S. Environmental Protection Agency, Washington, D.C., December 1995.
U.S. Environmental Protection Agency (U.S. EPA), 1996a. Method 1631: Mercury in Water byOxidation, Purge and Trap, and Cold Vapor Atomic Fluorescence Spectrometry, Office ofScience and Technology, Report 821/R-96-012.
U.S. Environmental Protection Agency (U.S. EPA), 1996b. Method 1632: Determination ofInorganic Arsenic in Water by Hydride Generation Flame Atomic Absorption, Office ofScience and Technology, Report 821/R-96-013.
U.S. Environmental Protection Agency (U.S. EPA), 1996c. Method 1636: Determination ofHexavalent Chromium by Ion Chromatography, Office of Science and Technology, Report821/R-96-003.
U.S. Environmental Protection Agency (U.S. EPA), 1996d. Method 1637: Determination ofTrace Elements in Ambient Water by Chelation Preconcentration with Graphite FurnaceAtomic Absorption, Office of Science and Technology, Report 821/R-96-004.
U.S. Environmental Protection Agency (U.S. EPA), 1996e. Method 1638: Determination ofTrace Elements in Ambient Waters by Inductively Coupled Plasma-Mass Spectrometry,Office of Science and Technology, Report 821/R-96-005.
U.S. Environmental Protection Agency (U.S. EPA), 1996f. Method 1639: Determination ofTrace Elements in Ambient Waters by Stabilized Temperature Graphite Furnace AtomicAbsorption, Office of Science and Technology, Report 821/R-96-006.
EPA and Hardrock Mining: A Source Book for Industry in the Northwest and AlaskaAppendix C: Characterization of Ore, Waste Rock, and Tailings
C-50 January 2003
U.S. Environmental Protection Agency (U.S. EPA), 1996g. Method 1640: Determination ofTrace Elements in Ambient Waters by On-Line Chelation Preconcentration and InductivelyCoupled Plasma-Mass Spectrometry, Office of Science and Technology, Report 821/R-96-007.
U.S. Environmental Protection Agency (U.S. EPA), 1996h. Method 1669: Sampling AmbientWater for Trace Metals at EPA Water Quality Criteria Levels, Office of Science andTechnology, Report 821/R-96-011.
U.S. Environmental Protection Agency (U.S. EPA), 1998a. EPA Guidance for QualityAssurance Project Plans, EPA QA/G-5, Office of Research and Development ReportEPA/600/R-98/018, February 1998.
U.S. Environmental Protection Agency (U.S. EPA), 1998b. EPA Requirements for QualityAssurance Project Plans, EPA QA/R-5, Review Draft dated October 1998, available fromhttp://www.epa.gov/r10earth/offices/oea/epaqar5.pdf, viewed 11/13/98.