Embed Size (px)
Citation preview

EPA and Hardrock Mining: A Source Book for Industry in the Northwest and Alaska
January 2003
APPENDIX A
HYDROLOGY

EPA and Hardrock Mining: A Source Book for Industry in the Northwest and AlaskaAppendix A: Hydrology
A-i January 2003
TABLE OF CONTENTS
1.0 GOALS AND PURPOSE OF THE APPENDIX . . . . . . . . . . . . . . . . . . . . . . . . . . . . . . A-1
2.0 HYDROLOGICAL CYCLE . . . . . . . . . . . . . . . . . . . . . . . . . . . . . . . . . . . . . . . . . . . . . . A-1
3.0 HYDROLOGICAL IMPACTS . . . . . . . . . . . . . . . . . . . . . . . . . . . . . . . . . . . . . . . . . . . A-23.1 Surface Impacts . . . . . . . . . . . . . . . . . . . . . . . . . . . . . . . . . . . . . . . . . . . . . . . . . . . A-23.2 Subsurface Impacts . . . . . . . . . . . . . . . . . . . . . . . . . . . . . . . . . . . . . . . . . . . . . . . . A-4
4.0 METHODS TO MEASURE AND PREDICT HYDROLOGICAL PROCESSES . . . . A-64.1 Precipitation . . . . . . . . . . . . . . . . . . . . . . . . . . . . . . . . . . . . . . . . . . . . . . . . . . . . . . A-64.2 Losses from Precipitation . . . . . . . . . . . . . . . . . . . . . . . . . . . . . . . . . . . . . . . . . . A-124.3 Surface Runoff . . . . . . . . . . . . . . . . . . . . . . . . . . . . . . . . . . . . . . . . . . . . . . . . . . . A-134.4 Stream Flow Routing . . . . . . . . . . . . . . . . . . . . . . . . . . . . . . . . . . . . . . . . . . . . . . A-184.5 Ground Water . . . . . . . . . . . . . . . . . . . . . . . . . . . . . . . . . . . . . . . . . . . . . . . . . . . . A-18
5.0 DEVELOPING A SITE WATER BALANCE . . . . . . . . . . . . . . . . . . . . . . . . . . . . . . . A-195.1 Average Water Balance . . . . . . . . . . . . . . . . . . . . . . . . . . . . . . . . . . . . . . . . . . . . A-215.2 Evaluating Pond Capacity . . . . . . . . . . . . . . . . . . . . . . . . . . . . . . . . . . . . . . . . . . A-22
6.0 SURFACE WATER AND GROUND WATER MODELING . . . . . . . . . . . . . . . . . . A-236.1 Developing a Conceptual Site Model . . . . . . . . . . . . . . . . . . . . . . . . . . . . . . . . . A-246.2 Analytical Software for Surface Water Modeling . . . . . . . . . . . . . . . . . . . . . . . . A-256.3 Numerical Modeling of Surface Water . . . . . . . . . . . . . . . . . . . . . . . . . . . . . . . . A-266.4 Analytical and Numerical Modeling of Ground Water . . . . . . . . . . . . . . . . . . . A-28
7.0 DATA REPRESENTATIVENESS . . . . . . . . . . . . . . . . . . . . . . . . . . . . . . . . . . . . . . . A-317.1 Statistical Concepts and Hydrological Variables . . . . . . . . . . . . . . . . . . . . . . . . A-327.2 Development of a Quality Assurance Program with Data Quality Objectives . . A-33
8.0 CITED REFERENCES . . . . . . . . . . . . . . . . . . . . . . . . . . . . . . . . . . . . . . . . . . . . . . . . . A-34
LIST OF FIGURES
A-1. Ground water flow systems affected by mining . . . . . . . . . . . . . . . . . . . . . . . . . . . . . . . A-6A-2. Areal averaging of precipitation by (a) Arithmetic Mean, (b) Thiessen Method,
and (c) Isohyetal Method . . . . . . . . . . . . . . . . . . . . . . . . . . . . . . . . . . . . . . . . . . . . . . . A-10A-3. Typical snowpack frequency curve . . . . . . . . . . . . . . . . . . . . . . . . . . . . . . . . . . . . . . . A-12A-4. Runoff Hydrograph Ordinates (y values) from rainfall Excess of Duration D
Proportional to Ordinates of D-minute Unit Hydrograph . . . . . . . . . . . . . . . . . . . . . . . A-17A-5. Runoff hydrograph from a complex storm is obtained by summing the ordinates
(y-values) of individual hydrographs from D-minute blocks of rainfall excess . . . . . . A-18A-6. Summary of methodologies available in HEC-1 . . . . . . . . . . . . . . . . . . . . . . . . . . . . . A-28
EPA and Hardrock Mining: A Source Book for Industry in the Northwest and AlaskaAppendix A: Hydrology
A-1 January 2003
1.0 GOALS AND PURPOSE OF THE APPENDIX
Developing a mine plan of operations, designing operational procedures, and designinghydrological control structures and other best management practices (BMPs) to preventenvironmental impacts all require accurate knowledge of the variables associated withhydrological conditions at a mine. Of particular importance is proper characterization ofbaseline hydrological and hydrogeological conditions so that the extent of impacts to hydrologicand other related resources can be minimized or avoided. Mining operations must accuratelyconsider two main hydrologic components when planning operations: (1) process system waters,often referred to as the process circuit, and (2) natural system waters or the natural circuit. Theprimary goal of this appendix is to outline the methods and analytical procedures commonlyused to characterize the natural system waters at a mine site. Included are descriptions of therationale and methods for characterizing surface water hydrology, ground water hydrogeology,and surface water-ground water interactions. The characterization, handling, and treatment ofprocess system waters are discussed in Appendix E, Wastewater Management.
Natural system waters are those associated with the natural hydrological cycle, such asground water and meteoric water from precipitation, snowmelt, evaporation, and runoff. Formining operations, important data for establishing baseline hydrological conditions include themeasurement of precipitation, runoff, and losses or abstractions from precipitation (Barfield etal., 1981). Impact evaluations and the proper design of detention structures, diversions, culverts,pregnant ponds and barren ponds, tailings dams, and other facilities depend on accuratecharacterization of hydrological parameters.
2.0 HYDROLOGICAL CYCLE
The term “hydrological cycle” generally is used to describe the continual circulation anddistribution of water through all elements of the environment. The hydrological cycle is aconvenient means for describing the interrelation between six fundamental processes:condensation, precipitation, evapotranspiration, infiltration, surface runoff, and ground waterflow.
The hydrological cycle can be viewed as beginning with the evaporation of water from theocean. Evaporated moisture then collects in the air, and under proper conditions, condenses toform clouds. Ultimately, the clouds may release this water as precipitation which subsequentlycollects on land and is dispersed in one of three ways. The largest part is temporarily retained inthe soil near where it falls. This portion is returned to the atmosphere by evaporation andtranspiration by plants (Linsley et al., 1975). Another portion of this water infiltrates through thesoil and recharges ground water reservoirs. The final portion of the precipitation runs off thesurface and collects in stream channels and lakes. Under the influence of gravity, the oceanreceives portions of both the stream flow and ground water flow and the cycle begins again.

EPA and Hardrock Mining: A Source Book for Industry in the Northwest and AlaskaAppendix A: Hydrology
A-2 January 2003
Obtaining adequate data for predicting and determining hydrological processes at proposedmining operations presents significant challenges. These processes are very complex and havehigh variability, making measurement and characterization for predictive purposes difficult. Understanding the hazards and benefits of the hydrological cycle will assist in proper mineoperations and contribute to environmental protection. In addition, hydrologic processes arerelated to other important resources such as water quality, aquatic life, vegetation, wetlands, andterrestrial wildlife.
3.0 HYDROLOGICAL IMPACTS
Characterizing hydrology at a mine site is necessary to identify the area(s) that would beaffected by mining activities; determine impacts to the related physical, chemical, and biologicalresources; and develop appropriate monitoring programs and mitigation measures. Backgroundhydrological conditions should be characterized in order to provide a baseline from whichchanges can be measured or predicted and to identify environmental conditions that could bepotentially impacted by mining activities. The intent of the characterization is to determine thenature and extent of ecological impacts from mining-related changes in the hydrological system. If past or present mining activities have been underway, then the hydrological effects from thesesources should be examined. It is important that the scope of evaluating hydrological baselineconditions and hydrological effects of a mine extend beyond actual mine site boundaries in orderto place the project in the context of its watershed.
Hydrological studies can be used to predict future impacts from proposed mining activities. Potential mining-related impacts to hydrology can be separated into surface and subsurfacesystems. Surface and subsurface hydrological systems are likely to interact with one another andthey can impact other related resources.
3.1 Surface Impacts
Many surface water hydrological impacts are related to mine construction and the locationof facilities. Road construction, logging, and clearing of areas for buildings, mills, and processfacilities can reduce infiltration and increase the amount of surface runoff to streams and othersurface water bodies. This can increase the peak flow and the total stream discharge associatedwith a given storm event. Unusually high peak flows can erode stream banks, widen primaryflow channels, erode bed materials, deepen and straighten stream channels, and alter channelgrade (slope). In turn, these changes in stream morphology can degrade aquatic habitats. Channelization (i.e. straightening) can increase flow velocities in a stream reach, potentiallyaffecting fish passage to upstream reaches during moderate to high stream flows. Increasederosion upstream and the resulting sedimentation downstream can impact spawning gravels, eggsurvival and emergence of fry, as well as degrade benthic food sources. A detailed discussion oferosion and sedimentation as related to mining is provided in Appendix H, Erosion andSedimentation.
EPA and Hardrock Mining: A Source Book for Industry in the Northwest and AlaskaAppendix A: Hydrology
A-3 January 2003
The location of mining facilities frequently requires the construction of stream diversionsand/or storm water ditches that control and divert runoff from upland watersheds. Typically,these structures are used to prevent unpolluted water from contacting potentially degradingmaterials, such as waste rock, or flooding over disturbed areas and degrading water quality. Drainage control structures also are used to prevent operational difficulties which could occur atthe site. Although these structures may mitigate and control potential impacts from flooding orerosion from disturbed areas, they often alter or change natural drainage patterns in a watershed,which, in turn, can impact vegetation resources, wetlands, and wildlife habitat.
The discharge of process waters potentially can affect water quality and lead to impacts toresources such as aquatic life. Parameters associated with wastewater treatment and dischargeare discussed in Appendix E, Wastewater Management; those associated with the managementof solid wastes, such as waste rock and tailings, are discussed in Appendix F, Solid WasteManagement.
Stream flow effects caused by mining operations relate directly to potential impacts inwater quality. It is common for many water quality constituents to correlate inversely withstream flow (i.e., chemical concentration increases with decreasing stream flow). This is usuallytrue for the concentrations of total and dissolved metals and most chemical constituents thatoccur in higher concentrations in subsurface formations than in surface soils. Some chemicalconstituents, however, correlate positively with stream flow during the beginning stages or “firstflush” of a runoff event (i.e., increasing concentrations with increasing stream flow). Thiscondition is sometimes observed with constituents that are associated with surface soils, such asacid salts, or land applied pollutants such as pesticides, herbicides, and nitrates, and constituentsthat are transported as suspended particles. After this initial increase which is sometimesobserved, constituent concentrations generally decrease with the increasing volume of runoff. As described in Appendix B, Receiving Waters, water quality data must be collected withconsideration given to the varying effects of stream flow at a site.
Withdrawals from streams also can impact aquatic life, particularly fish. Reduced streamflow can potentially affect critical habitat requirements. Fish have different flow requirements atdifferent times of the year and these requirements vary for different species. Specific flows arerequired for spawning, maintenance of fish redds, fry emergence, juvenile rearing habitat, andadult passage. For these reasons, water withdrawals are often mitigated by establishing instream(minimum) flow requirements at critical times of the year. This requires adequate baselinecharacterization of hydrologic flow conditions throughout the year and characterization of theavailable habitat(s) associated with the fishery. Withdrawals of surface water can also reducenaturally occurring high flows that occur during high runoff periods. High flow events are oftenperiodically required within a stream to entrain and transport sediments that were depositedduring low flow periods when low peak velocities caused sediment deposition. These are knownas channel maintenance flows. Channel maintenance flows are periodically required for achannel to maintain sediment transport capacity without aggrading, filling pools, and changingchannel morphology, all of which can also affect aquatic habitat. These impacts are discussed inmore detail in Appendix H, Erosion and Sedimentation.
EPA and Hardrock Mining: A Source Book for Industry in the Northwest and AlaskaAppendix A: Hydrology
A-4 January 2003
3.2 Subsurface Impacts
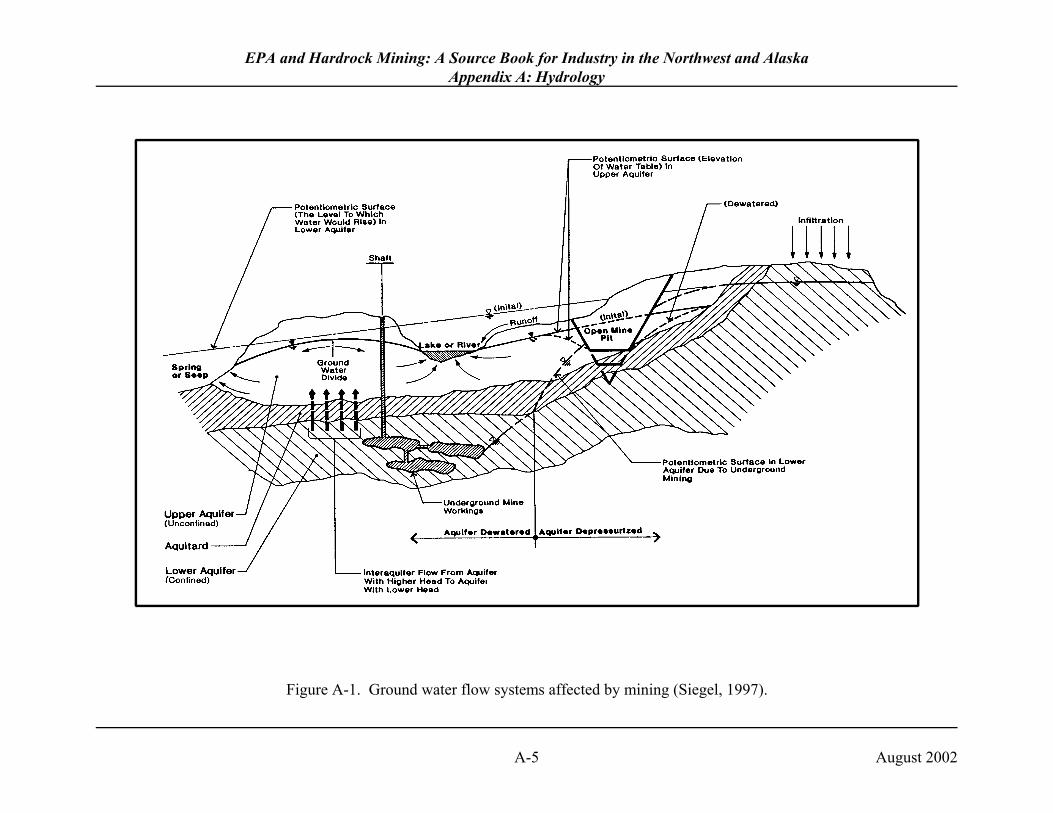
Potential impacts to ground water flow regimes primarily occur from mine dewateringactivities and/or pumping water supply wells (Figure A-1). Dewatering (i.e., pumping groundwater from) mine workings, adits, or open pits is required when the mine elevation extendsbelow the potentiometric surface in confined aquifers or below the water table in an unconfinedaquifer. Pumping ground water lowers the water table in the immediate area of a well, creating a“cone of depression” which extends radially outward from the well. The radius of drawdowndepends on the level that the water table is lowered by the well, the pumping rate, the hydraulicconductivity of the aquifer, and the homogeneity of the aquifer. Water supply wells locatedclose to one another may have cones of depression that overlap, creating a cumulative effect onthe drawdown of the water table. When this occurs, the drawdown at a given point becomes thesum of the drawdowns caused by all of the wells (Linsley et al., 1975). A dewatered mine actsas a large diameter well; consequently the water table in an aquifer can be drawn down for arelatively large radial distance. Drawdown can affect the direction of ground water flow byshifting gradients and lines of flow toward the mine or well field.
Drawdown of an aquifer potentially can lead to reduced spring and seep flows and reducedsurface water flows in streams that are gaining with respect to ground water (Figure A-1). Theseeffects can impact wetlands associated with springs and riparian zones associated with streams. A reduction in stream flows can also affect aquatic habitats and fish populations. A regionallowering of the water table can impact neighboring water supply and irrigation wells. Wateryields from local wells can be reduced or wells may need to be drilled deeper to account for thedecreased elevation of the water table or potentiometric surface. Adequate characterization ofground water and hydrogeology is often difficult, especially for fracture-flow conditions. However, sufficient characterization of hydrogeology is required to predict impacts that couldoccur on local and regional scales.
In areas where ground and surface waters interact due to varying influent and effluentconditions, mining impacts to ground water quality can result in impacts to surface water quality. The factors associated with interacting ground and surface water and resulting impacts to waterquality are discussed in Appendix B, Receiving Waters.
EPA and Hardrock Mining: A Source Book for Industry in the Northwest and AlaskaAppendix A: Hydrology
A-5 August 2002
Figure A-1. Ground water flow systems affected by mining (Siegel, 1997).
EPA and Hardrock Mining: A Source Book for Industry in the Northwest and AlaskaAppendix A: Hydrology
A-6 January 2003
4.0 METHODS TO MEASURE AND PREDICT HYDROLOGICAL PROCESSES
The design of water collection, storage and treatment facilities at mine sites depends onadequately characterizing the hydrologic system in the vicinity of the site. Precipitation, lossesfrom precipitation (i.e., interception, infiltration, and evapotranspiration) runoff, and stream floware perhaps the most important parameters to measure during baseline studies. Estimates of thehydrological inputs to a mine and the design of detention structures, retention ponds, culverts,pregnant and barren solution storage ponds, and diversion channels depend on probabilisticdeterminations of rainfall and runoff events that are developed from historical data. Van Zyl etal. (1988) indicate that short-duration, high-intensity events, large snow-melt events, or extendedwet periods are the most important rainfall-runoff events to consider during heap-leach facilitydesign. Unfortunately, rainfall-runoff parameters and probabilistic determinations of futurerainfall-runoff events are among the most difficult to accurately determine.
Mines often are located in remote areas or in watersheds lacking historical precipitationand runoff data sufficient to accurately develop return-period and flood-frequency relationships. For this reason, it is important for the hydrologist to incorporate the most rigorous estimatespossible given the cost, scope, and data available. Methods for measuring precipitation andrunoff and developing probabilistic distribution functions for these data are briefly outlined andcompared below. For more detailed information, the reader is referred to Barfield et al. (1981),who provide an excellent compendium of hydrological methods and analyses for miningoperations.
4.1 Precipitation
Precipitation depth-duration-frequency information for the United States is available fornumerous, widespread climatological stations managed by the U.S. Weather Service andpublished in atlases by the National Oceanographic and Atmospheric Administration (NOAA). These historical data also are available electronically on magnetic tape and compact disk. Often,these are the only data initially available to mining operations and they serve as the basis fordeveloping probabilistic relationships to use in designing hydrological structures and evaluatinginputs for water balance determinations. Actual measurements of precipitation and runoff withinthe specific watershed of a mine are preferred and should be used whenever possible to developprobabilistic storm frequency relationships and design hydrological structures. Since remotemine areas usually lack the long-term historical data necessary to develop accurate probabilisticrelationships, most mine projects need to establish a network of climatological stations andstream-flow monitoring stations to collect records for their watershed(s).
Mean areal precipitation within a watershed or in sub-basins often is used to developrainfall-runoff probability relationships and for input to other hydrological analyses. Theaccuracy of these values, or of the historical relationships developed from them, depends on thedensity of precipitation gages throughout a basin. Studies conducted to analyze precipitationgage density and the errors associated with using these data for estimating runoff and streamflow conclude that a higher density of gages is required where topography is more complex andwhere convective thunderstorms can be expected to provide significant hydrological input to the

EPA and Hardrock Mining: A Source Book for Industry in the Northwest and AlaskaAppendix A: Hydrology
A-7 January 2003
system (Eagleson, 1967; Johanson, 1971; Bastin et al., 1984). Linsley et al. (1975) provided thefollowing general guidelines for precipitation station density based on climatic conditions andtopography:
C One station per 600 to 900 km2 (230 to 350 mi2) in flat regions of temperate, Mediterranean,and tropical zones with relatively high rainfall;
C One station per 100 to 250 km2 (40 to 100 mi2) for mountainous regions of temperate,Mediterranean, and tropical zones; and
C One station per 25 km2 (10 mi2) for small intricate mountainous regions with irregularprecipitation.
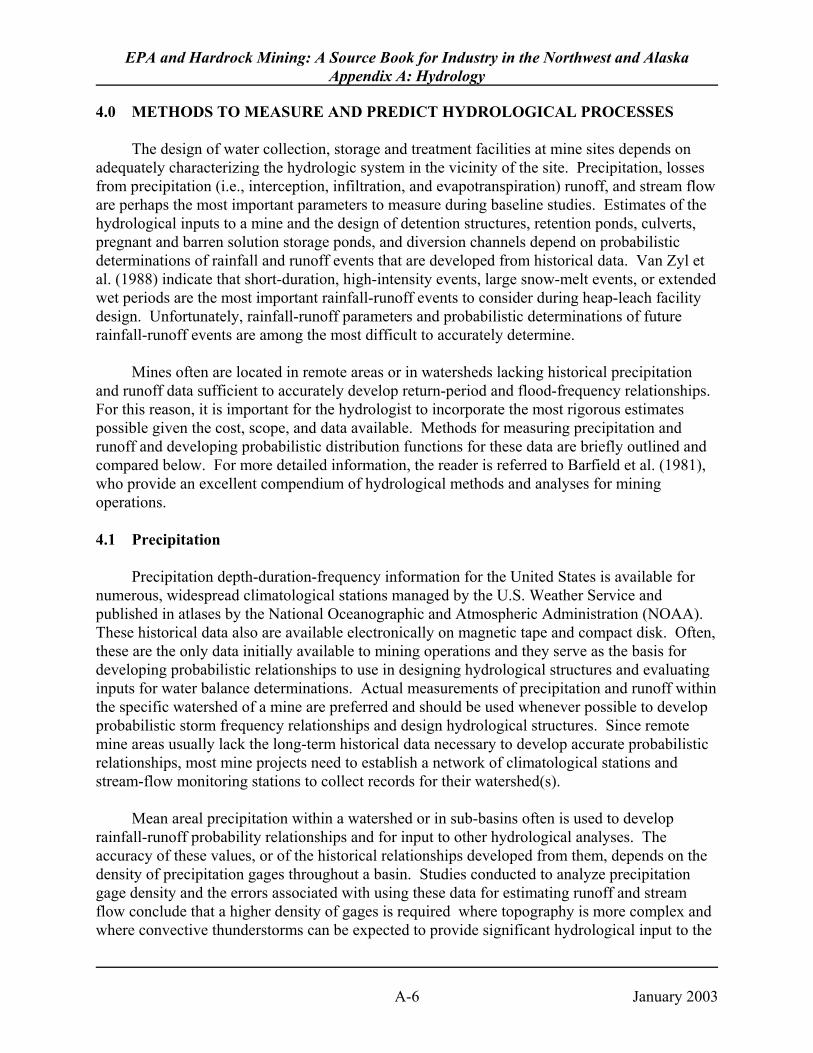
It is important to note that the accuracy of developed probabilistic distribution functionsfor rainfall-runoff events for a specific basin will greatly increase over time as the density ofgages increases. This is particularly true in basins where brief high-intensity rainfall events canoccur in localized areas yet provide significant flow and inputs to a mine operation located lowerin the watershed. Three common methods are used to obtain mean areal precipitation from anetwork of precipitation gages: (1) the arithmetic mean, (2) the Thiessen polygon method, and(3) the isohyetal method. Figure A-2 depicts examples using these methods. The arithmeticmean is a simple average of the stations and is considered the easiest to apply but the leastaccurate. The other methods apply weighting criteria based on the distances between rain gages(Barfield et al., 1981). The Thiessen method determines weighted areas for each gage based onpolygons drawn by perpendicular bisectors between gages. The weighting factor for theisohyetal method is determined by the area of the watershed enclosed between adjacent isohyetesor lines of constant rainfall. The isohyetal method is considered the most accurate of the threemethods; however, the Thiessen method has an advantage in that weighting factors forprecipitation gages remain historically constant as long as the measurement network has notchanged. A detailed discussion of the application of these methodologies is presented by Linsleyet al. (1975) and Barfield et al. (1981).
Mean areal precipitation can be evaluated using kriging techniques. Kriging is actually acollection of methods with which to analyze spatial data. It was originally derived forgeostatistical analyses and prediction. In general, kriging uses linear regression techniques tominimize the error associated with the estimate of a new point. The estimate is made from aprior covariance model developed from the entire network of data points. In effect, krigingstatistically evaluates data from an entire set of spatial data, such as a network of precipitationgages, to make estimates of interspatial data. The output can then be used to develop anisohyetal map similar to that described above. The difference between the two techniques is thatthe standard isohyetal method uses linear interpolation between two precipitation gages toestimate values between two points. Kriging uses statistical methods to estimate values betweentwo points, taking into account data from other nearby gages. Karnieli and Gurion (1990)described the use of kriging to map areal precipitation and applied it to historical precipitationdata for the State of Arizona. Kriging is the most intensive technique to evaluate arealprecipitation and specific software is required. For most mining scenarios, however, it would

EPA and Hardrock Mining: A Source Book for Industry in the Northwest and AlaskaAppendix A: Hydrology
A-8 January 2003
provide better estimates of precipitation inputs, especially in areas with complex topography andin areas where precipitation is spatially more variable. Use of this technique would help tominimize errors associated with rainfall-runoff measurements and to develop more accurateprobabilistic relationships over time.
As previously indicated, historical rainfall data are used to develop probabilisticrelationships for rainfall and/or runoff events. These relationships describe the frequency orprobability of occurrence (i.e., return periods) of rainfall or runoff events. Some commonmethods for developing these relationships are the Log-Pearson Type III distribution, theExtreme Value Type I Distribution, and the Gumbel Distribution. The methods for developingthese relationships are described in various hydrologic manuals and will not be described here(see U.S. Bureau of Reclamation, 1977; Linsley et al., 1975; Barfield et al., 1981). Thehydrologist should consider the ultimate use of the data when choosing the methods to determinemean areal precipitation. The specific method used is not as critical to simply characterize theaverage conditions of a site, such as for a NEPA analysis, as when being applied to hydrologicdesign, such as for sizing a storage pond or runoff control structure.
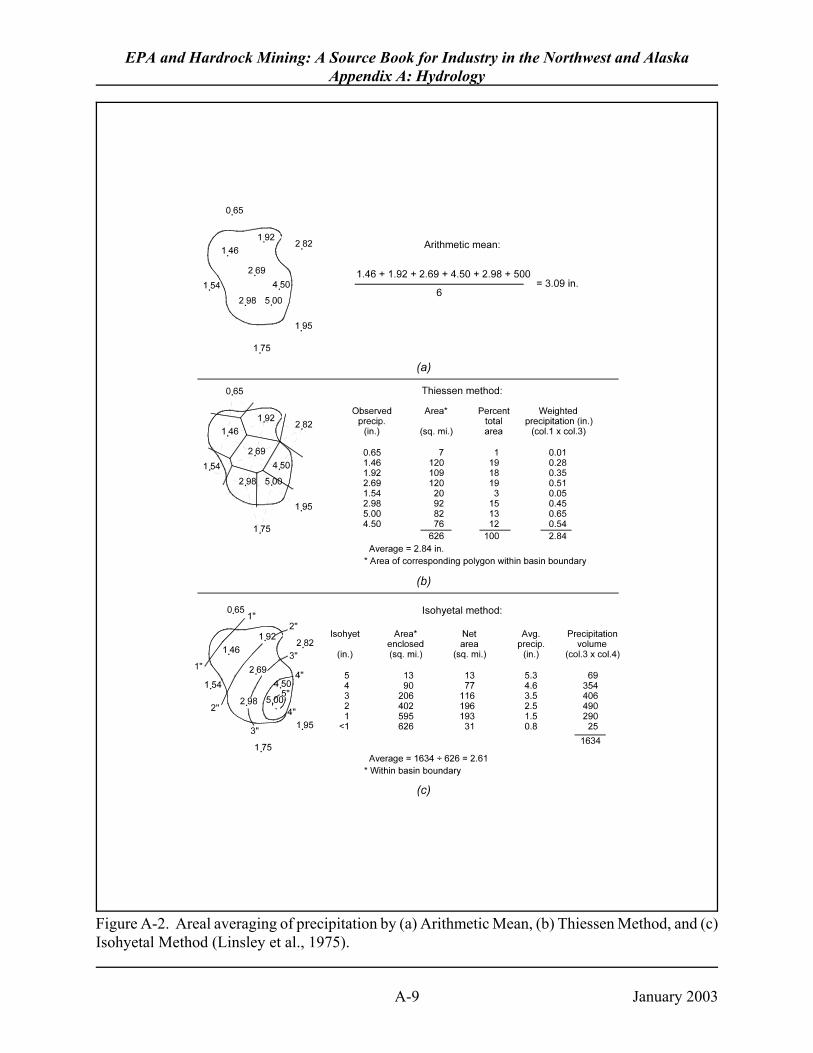
Van Zyl et al. (1988) described an application of the Weibull (1939) formula that utilizesavailable historical snow pack data to develop probabilistic relationships for snow melt. Theyindicated that local snow data often are not available for a particular basin of interest and thathistorical snow course data obtained by the Natural Resource Conservation Service (formerly,the Soil Conservation Service [SCS]) must be used. Figure A-3 shows an example of aprobability/return period relationship developed for a snow pack. These types of relationshipsare similar to those developed for precipitation and runoff events. Linsley et al. (1975) indicatedthat the best methods to estimate runoff from snow pack are based on simple air temperature,rather than more complicated analytical models that incorporate wind speed, relative humidity,solar radiant flux, and other variables. They suggested methods using a degree-day or degree-hour factor and the average probability of occurrence with elevation. These data typically areavailable for specific regions of interest. McManamon et al. (1993) described a GIS method forcombining snow-water equivalent measurements with other watershed physical parameters toprovide better estimates of runoff from snow pack. The design engineer should note, however,that the prediction of runoff from snow-pack analyses is complicated by other hydrologicalfactors such as ground water storage, antecedent soil-moisture deficiency, and the amount ofprecipitation that occurs during runoff periods (Linsley et al., 1975).
EPA and Hardrock Mining: A Source Book for Industry in the Northwest and AlaskaAppendix A: Hydrology
A-9 January 2003
Figure A-2. Areal averaging of precipitation by (a) Arithmetic Mean, (b) Thiessen Method, and (c)Isohyetal Method (Linsley et al., 1975).

EPA and Hardrock Mining: A Source Book for Industry in the Northwest and AlaskaAppendix A: Hydrology
A-10 January 2003
Probabilistic relationships, such as those of Figure A-3 or those published by NOAA,provide maximum precipitation depths or intensities for certain durations and frequencies ofoccurrence. These data can provide peak-flow or runoff estimates for use in designinghydrologic facilities and structures. In addition to peak flow data, modern design criteria oftenrequires more detailed information regarding the runoff hydrograph. Developing runoffhydrographs typically requires temporal information for storm events (i.e., time versusprecipitation intensity relationships) (Barfield et al., 1981).
A plot of the distribution of rainfall intensity versus time is called an hyetograph. Methods to develop design hyetographs (also termed design storms) use theoretical or averagetime distributions that are based on actual storm events (see summaries in Chow et al., 1988 andKoutsoyiannis, 1994). The time distribution of rainfall intensity associated with a storm greatlyaffects the quantity and time distribution of runoff. Design storms are created to study or predicttheoretical storm runoff for the design of structures, drainage, or containment ponds. Themethods commonly used to create design hyetographs can be divided into three categories asdescribed below (Chow et al., 1988; Koutsoyiannis, 1994).
The first category uses pre-selected time distributions such as triangle, bimodal, oruniform distributions. The most commonly used of these methods is that outlined by the NaturalResource Conservation Service (NRCS [formerly SCS]) and is described by SCS (1972). Thismethod uses two theoretical time distributions known as Type I, and Type II distributions. TheType I distribution is recommended for use by NRCS for general application in Alaska andHawaii; however, an additional distribution has been added by the NRCS known as the Type I-A. The Type I-A distribution produces less severe peak runoff rates than the Type I distributionand is more suited to simulate storm patterns associated with the coastal regions in the northwestUnited States. For this reason, the Type I-A distribution is recommended for use in Washingtonand Oregon and should also be considered for use in southeast Alaska. The climate of southeastAlaska differs substantially from that of inland Alaska and is more closely related to that ofBritish Columbia, Washington, and Oregon. The Type II distribution is applicable to theremainder of the United States. A major problem with using these methods is that two or threeaverage distributions are not adequate for all types of storms or for all areas where they arerecommended for use. Another major problem is that the runoff hydrographs produced fromthese methods do not have any real measure of the probability or frequency of occurrence. Thirdly, these distributions base all design events on a 24-hour distribution. Despite theseproblems, average time distributions, particularly the NRCS distributions, are commonly usedfor design studies because of their simplicity.
EPA and Hardrock Mining: A Source Book for Industry in the Northwest and AlaskaAppendix A: Hydrology
A-11 January 2003
Figure A-3. Typical snowpack frequency curve (Barfield et al., 1981).

EPA and Hardrock Mining: A Source Book for Industry in the Northwest and AlaskaAppendix A: Hydrology
A-12 January 2003
The second category of methods is based on regionalized average distributions and theprobabilistic occurrence for that time-intensity distribution. An example of this type ofdistribution is described by Huff (1967). These methods are based on betterprobabilistic/statistical approaches than those described above. However, Koutsoyiannis (1994)indicated that the exact determination of the probability of the resulting runoff hydrograph is stillambiguous for use in design.
The third category of design storms is based on the intensity-duration-frequency (IDF)curves of the Probable Maximum Precipitation (PMP) for the region of interest. These methodsdo not rely on average or probabilistic time-intensity distributions within rainfall events. Instead, hyetographs are designed to apply maximum depths (i.e., worst case scenarios) ofrainfall based only on the frequency of occurrence for that depth and for a particular stormduration. Unfortunately, like the methods discussed in the first category, the probability orfrequency of occurrence of the resulting runoff hydrographs are ambiguous and undefined.
Regardless of the specific method used to calculate runoff, the hydrographs produced bythe IDF design storms are conservative, which makes them the preferred choice for designpurposes. This is because they use PMP to create peak flows without considering the physicalaspects of rainfall, infiltration, and runoff. Although these methods may result in conservativedesigns, they can bet cost effective because they may be more environmentally protective andbecause of their relative ease of use.
Koutsoyiannis (1994) described a fourth method, stochastic disaggregation, for creatingdesign storms for the purposes of hydrological design. This method applies stochastic modelingtechniques (i.e., a Markovian structure) to commonly used design storm methods or to othermethods for determining runoff and flood routing. Stochastic disaggregation computes aprobability distribution function of the outflow peak. This is a statistically more robust methodfor using design storms to provide information for hydrological design, regardless of themethods used to develop runoff hydrographs and route flows. Stochastic methods, such as thosedescribed by Koutsoyiannis (1994), are less likely to produce overly conservative designs, butthey remain realistic in their physical and statistical analyses of precipitation inputs. Severalstochastic models that use the methods outlined by Koutsoyiannis (1994) are available forpersonal computers. These programs typically run in conjunction with spreadsheets.
4.2 Losses from Precipitation
Infiltration, evapotranspiration, and surface storage are considered losses or“abstractions” from precipitation. A review of general procedures and information regardingprecipitation losses is provided below, but a more detailed discussion of the methods used tomeasure each of these parameters is beyond the scope of this appendix. The reader is referred toBarfield et al. (1981) for a more complete discussion of these parameters as they are applied tomining.
Infiltration is the major source of precipitation loss. The physical processes controllinginfiltration are complex and governed by a variety of interrelated factors. Particle-size
EPA and Hardrock Mining: A Source Book for Industry in the Northwest and AlaskaAppendix A: Hydrology
A-13 January 2003
distribution of the soil, porosity, antecedent moisture content, surface roughness, macroporosity,freeze-thaw cycles, and fluid properties all affect infiltration and each responds uniquely tostorm intensity and duration. Field methods that are used to measure infiltration include doublering infiltrometers and rainfall simulators.
Several empirical methods are available to estimate infiltration. The most common ofthese are models by Green and Ampt (1911), Horton (1940), and Holtan (1961), and variationsof these models. The original Green and Ampt model is commonly used by many computerhydrological models when adequate data are available to describe soil hydrological variables andantecedent moisture conditions. Barfield et al. (1981) indicated that for mining applications, theapplication of these methods is limited by the difficulty in measuring the physical parametersnecessary for input. Accurate application also is confounded by the nonuniformity of soils, bothspatially and with depth, and the high variability of all conditions across any watershed. It isimportant, therefore, that a hydrologist apply good professional judgment with well-foundedassumptions when using these methods to estimate loss rates from precipitation. Wright-McLaughlin Engineers (1969) suggested that specific field tests were preferable and highlyuseful when making these estimates or applying professional judgment.
4.3 Surface Runoff
In the conceptual hydrodynamic model, excess precipitation is routed as overland flow toestablished channels and channel flow is routed to a basin outlet or a location of interest where ahydrological structure will be designed. Different methods can be used to develop and analyzethe runoff hydrograph from data about precipitation excess and to route the flow down a channelor through a structure. In some cases, only the analysis of overland flow is required to designstructures to protect or control runon of excess precipitation at a mine site. Methods commonlyused to route flows through channels, detainment basins, or other hydrologic control structuresare summarized in Section 4.4.
The method described by the SCS (1972) is the most common technique for estimatingthe volume of excess precipitation (i.e., runoff) after losses to infiltration and surface storage. The method involves estimating soil-types within a watershed and applying an appropriaterunoff curve number to calculate the volume of excess precipitation for that soil and vegetationcover type. This method was developed for agricultural uses, and Van Zyl et al. (1988)suggested that it usually is not accurate enough for most design purposes at mine sites, primarilybecause the development and classification of runoff curve numbers by the SCS are imprecise. Curve numbers are approximate values that do not adequately distinguish the hydrologicconditions that occur on different range and forest sites and across different land uses for thesesites.
A more appropriate technique for developing and analyzing runoff at mine sites utilizesthe unit hydrograph approach. A unit hydrograph is a hydrograph of runoff resulting from a unitof rainfall excess that is distributed uniformly over a watershed or sub-basin in a specifiedduration of time (Barfield et al., 1981). Unit hydrographs are used to represent the runoffcharacteristics for particular basins. They are identified by the duration of precipitation excess
EPA and Hardrock Mining: A Source Book for Industry in the Northwest and AlaskaAppendix A: Hydrology
A-14 January 2003
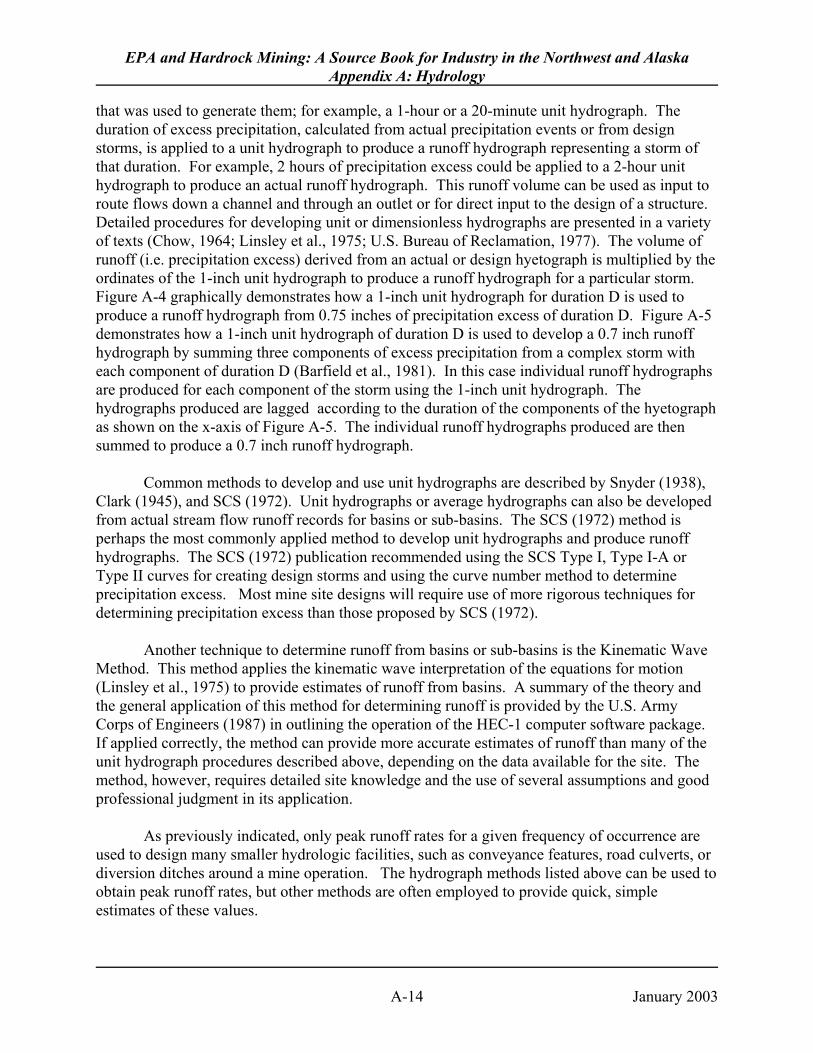
that was used to generate them; for example, a 1-hour or a 20-minute unit hydrograph. Theduration of excess precipitation, calculated from actual precipitation events or from designstorms, is applied to a unit hydrograph to produce a runoff hydrograph representing a storm ofthat duration. For example, 2 hours of precipitation excess could be applied to a 2-hour unithydrograph to produce an actual runoff hydrograph. This runoff volume can be used as input toroute flows down a channel and through an outlet or for direct input to the design of a structure. Detailed procedures for developing unit or dimensionless hydrographs are presented in a varietyof texts (Chow, 1964; Linsley et al., 1975; U.S. Bureau of Reclamation, 1977). The volume ofrunoff (i.e. precipitation excess) derived from an actual or design hyetograph is multiplied by theordinates of the 1-inch unit hydrograph to produce a runoff hydrograph for a particular storm. Figure A-4 graphically demonstrates how a 1-inch unit hydrograph for duration D is used toproduce a runoff hydrograph from 0.75 inches of precipitation excess of duration D. Figure A-5demonstrates how a 1-inch unit hydrograph of duration D is used to develop a 0.7 inch runoffhydrograph by summing three components of excess precipitation from a complex storm witheach component of duration D (Barfield et al., 1981). In this case individual runoff hydrographsare produced for each component of the storm using the 1-inch unit hydrograph. Thehydrographs produced are lagged according to the duration of the components of the hyetographas shown on the x-axis of Figure A-5. The individual runoff hydrographs produced are thensummed to produce a 0.7 inch runoff hydrograph.
Common methods to develop and use unit hydrographs are described by Snyder (1938),Clark (1945), and SCS (1972). Unit hydrographs or average hydrographs can also be developedfrom actual stream flow runoff records for basins or sub-basins. The SCS (1972) method isperhaps the most commonly applied method to develop unit hydrographs and produce runoffhydrographs. The SCS (1972) publication recommended using the SCS Type I, Type I-A orType II curves for creating design storms and using the curve number method to determineprecipitation excess. Most mine site designs will require use of more rigorous techniques fordetermining precipitation excess than those proposed by SCS (1972).
Another technique to determine runoff from basins or sub-basins is the Kinematic WaveMethod. This method applies the kinematic wave interpretation of the equations for motion(Linsley et al., 1975) to provide estimates of runoff from basins. A summary of the theory andthe general application of this method for determining runoff is provided by the U.S. ArmyCorps of Engineers (1987) in outlining the operation of the HEC-1 computer software package. If applied correctly, the method can provide more accurate estimates of runoff than many of theunit hydrograph procedures described above, depending on the data available for the site. Themethod, however, requires detailed site knowledge and the use of several assumptions and goodprofessional judgment in its application.
As previously indicated, only peak runoff rates for a given frequency of occurrence areused to design many smaller hydrologic facilities, such as conveyance features, road culverts, ordiversion ditches around a mine operation. The hydrograph methods listed above can be used toobtain peak runoff rates, but other methods are often employed to provide quick, simpleestimates of these values.
EPA and Hardrock Mining: A Source Book for Industry in the Northwest and AlaskaAppendix A: Hydrology
A-15 January 2003
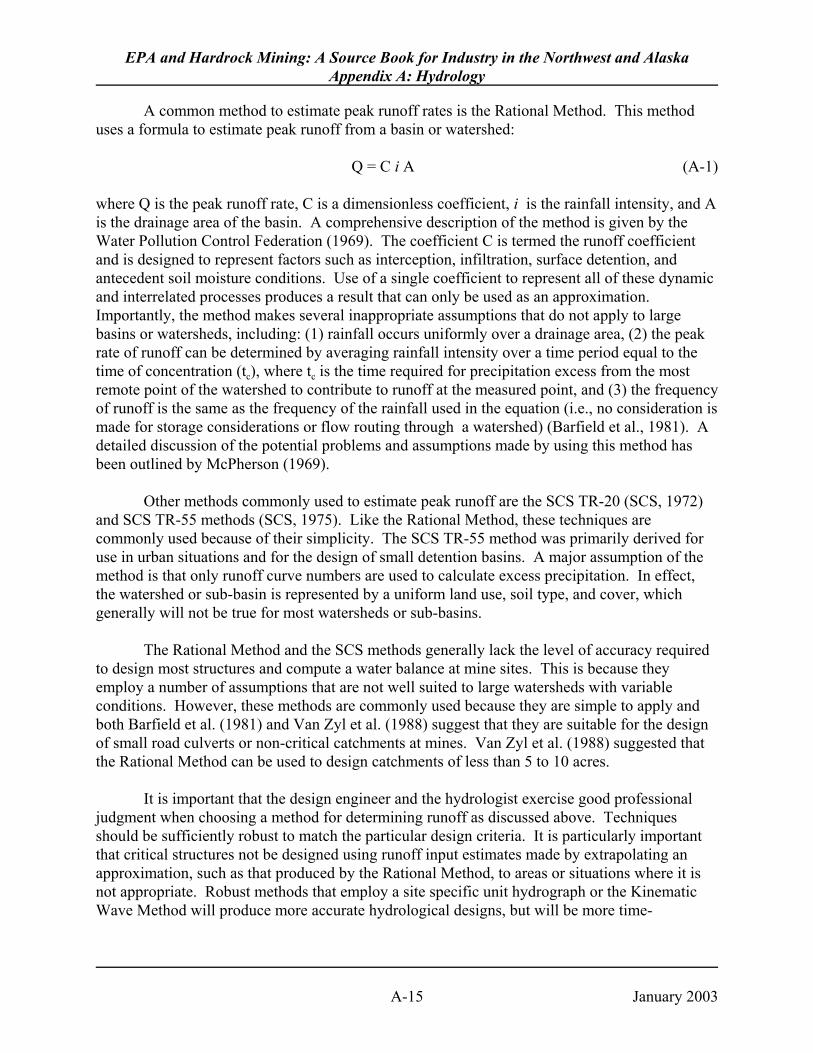
A common method to estimate peak runoff rates is the Rational Method. This methoduses a formula to estimate peak runoff from a basin or watershed:
Q = C i A (A-1)
where Q is the peak runoff rate, C is a dimensionless coefficient, i is the rainfall intensity, and Ais the drainage area of the basin. A comprehensive description of the method is given by theWater Pollution Control Federation (1969). The coefficient C is termed the runoff coefficientand is designed to represent factors such as interception, infiltration, surface detention, andantecedent soil moisture conditions. Use of a single coefficient to represent all of these dynamicand interrelated processes produces a result that can only be used as an approximation. Importantly, the method makes several inappropriate assumptions that do not apply to largebasins or watersheds, including: (1) rainfall occurs uniformly over a drainage area, (2) the peakrate of runoff can be determined by averaging rainfall intensity over a time period equal to thetime of concentration (tc), where tc is the time required for precipitation excess from the mostremote point of the watershed to contribute to runoff at the measured point, and (3) the frequencyof runoff is the same as the frequency of the rainfall used in the equation (i.e., no consideration ismade for storage considerations or flow routing through a watershed) (Barfield et al., 1981). Adetailed discussion of the potential problems and assumptions made by using this method hasbeen outlined by McPherson (1969).
Other methods commonly used to estimate peak runoff are the SCS TR-20 (SCS, 1972)and SCS TR-55 methods (SCS, 1975). Like the Rational Method, these techniques arecommonly used because of their simplicity. The SCS TR-55 method was primarily derived foruse in urban situations and for the design of small detention basins. A major assumption of themethod is that only runoff curve numbers are used to calculate excess precipitation. In effect,the watershed or sub-basin is represented by a uniform land use, soil type, and cover, whichgenerally will not be true for most watersheds or sub-basins.
The Rational Method and the SCS methods generally lack the level of accuracy requiredto design most structures and compute a water balance at mine sites. This is because theyemploy a number of assumptions that are not well suited to large watersheds with variableconditions. However, these methods are commonly used because they are simple to apply andboth Barfield et al. (1981) and Van Zyl et al. (1988) suggest that they are suitable for the designof small road culverts or non-critical catchments at mines. Van Zyl et al. (1988) suggested thatthe Rational Method can be used to design catchments of less than 5 to 10 acres.
It is important that the design engineer and the hydrologist exercise good professionaljudgment when choosing a method for determining runoff as discussed above. Techniquesshould be sufficiently robust to match the particular design criteria. It is particularly importantthat critical structures not be designed using runoff input estimates made by extrapolating anapproximation, such as that produced by the Rational Method, to areas or situations where it isnot appropriate. Robust methods that employ a site specific unit hydrograph or the KinematicWave Method will produce more accurate hydrological designs, but will be more time-

EPA and Hardrock Mining: A Source Book for Industry in the Northwest and AlaskaAppendix A: Hydrology
A-16 January 2003
Figure A-4. Runoff Hydrograph Ordinates (y values) from rainfall Excess of Duration DProportional to Ordinates of D-minute Unit Hydrograph (after Barfield et al.,1981).

EPA and Hardrock Mining: A Source Book for Industry in the Northwest and AlaskaAppendix A: Hydrology
A-17 January 2003
Figure A-5. Runoff hydrograph from a complex storm is obtained by summing the ordinates (y-values) of individual hydrographs from D-minute blocks of rainfall excess (Barfield et al., 1981).The hydrograph from each component of the complex storm of D duration is lagged by duration D,as shown on the x axis.

EPA and Hardrock Mining: A Source Book for Industry in the Northwest and AlaskaAppendix A: Hydrology
A-18 January 2003
consuming to use. Nevertheless, many of the more robust methods have data requirements thatoften cannot be fulfilled because the available data are statistically inadequate. This may force ahydrologist to use their professional judgment to estimate input parameters or to use data that arenot statistically adequate for their designs. Design and planning documents should describe theuncertainties associated with any assumptions or calculations, including those used to provideconservatism to the design. In general, EPA emphasizes that the method selected should be basedon project objectives, and is prescribing no particular method in this document.
4.4 Stream Flow Routing
Designing hydrological structures or conducting water balance studies often requires anevaluation of the hydrologic inputs to the upper reaches or sub-basins of a watershed. As theseflows are conveyed to the mine site, either in natural or constructed channels, their flowhydrographs are modified by travel time, channel storage, and the effects of influent and effluentreaches. Several methods are available to evaluate or study how flood flows are routed througha reservoir, a series of ponds, or an outflow structure. These techniques also can be used todesign constructed channels.
Methods commonly used to route flows in channels are the Muskingum Method, avariant called the Muskingum-Cunge Method, the Modified Puls Method, and the KinematicWave Method. A detailed review of the general theory of flood routing and how each methodsolves or approximates the governing equation for continuity is beyond the scope of thisappendix. The reader is referred to texts by Barfield et al.(1981) and Linsley et al.(1975) formore detailed discussions of how these methods are applied to mining. A summary of the theoryand general application of these methods is also provided by the U.S. Army Corps of Engineers(1987) in their description of the HEC-1 computer software package.
The Kinematic Wave Method is a more robust technique that solves the continuityequation and, if applied correctly with appropriate data, can provide more accurate analyses offlood routing. As previously mentioned, this method requires the use of several assumptions andgood professional judgment in its application.
4.5 Ground Water
Because most mine sites are located in regions with complex hydrogeologic conditions, athorough understanding of the site hydrogeology is required to adequately characterize andevaluate potential impacts. Aquifer pump tests and drawdown tests of wells need to beconducted under steady-state or transient conditions to determine aquifer characteristics. Ifpossible, it is important that these tests be performed at the pumping rates that would be used bya mining operation and for durations adequate to determine regional impacts from drawdown andpotential changes in flow direction. These tests require prior installation of an appropriatenetwork of observation wells. Transmissivities, storage coefficients and vertical and horizontalhydraulic conductivities can be calculated from properly designed pump tests. Thesemeasurements are necessary to determine the volume and rate of ground water dischargeexpected during mining operations and to evaluate environmental impacts. Tests should beperformed for all aquifers at a mine site to ensure adequate characterization of the relationships
EPA and Hardrock Mining: A Source Book for Industry in the Northwest and AlaskaAppendix A: Hydrology
A-19 January 2003
between hydrostratigraphic units. Characterization studies should define the relationshipsbetween ground water and surface water, including identifying springs and seeps. Significantsources or sinks to the surface water system also need to be identified.
Hydrogeological characterizations should include geologic descriptions of the site andthe region. Descriptions of rock types, intensity and depth of weathering, and the abundance andorientation of faults, fractures, and joints provide a basis for impact analysis and monitoring. Although difficult to evaluate, the hydrological effects of fractures, joints, and faults areespecially important to distinguish. Water moves more easily through faults, fractures anddissolution zones, collectively termed secondary permeability, than through rock matrices. Secondary permeability can present significant problems for mining facility designs because itcan result in a greater amount of ground water discharge than originally predicted. For example,faults that juxtapose rocks with greatly different hydrogeological properties can cause abruptchanges in flow characteristics that need to be incorporated into facility designs.
Computer modeling of surface and ground water flows is described in Section 6.0. Theuse of computer models has increased the accuracy of hydrogeological analyses and impactpredictions and speeded solution of the complex mathematical relations through use of numericalsolution methods. However, computer modeling has not changed the fundamental analyticalequations used to characterize aquifers and determine ground water quantities. Traditionalanalytical calculations are briefly discussed below. The application of ground water modelingprograms and analysis are discussed in Section 6.2.
A common method to analyze ground water in relation to a mine relies on a simpleanalytical solution in which the mine pit is approximated as a well. This method uses theconstant-head Jacob-Lowman (1952) equation to calculate flow rates. Although not assophisticated as a numerical (modeling) solution, this method gives a good approximation of therate of water inflow to a proposed mine. It generally yields a conservative overestimate of thepumping rates required to dewater a mine (Hanna et al., 1994). A second method uses thetechnique of interfering wells, where each drift face of the proposed mine is considered to be awell. The cumulative production of the simulated wells is used to estimate the total influx intothe mine and the extent of drawdown.
5.0 DEVELOPING A SITE WATER BALANCE
An accurate understanding of the site water balance is necessary to successfully managestorm runoff, stream flows, and point and non-point source pollutant discharges from a mine site. The water balance for typical mining operations will address process system and natural systemwaters (Van Zyl et al., 1988). Process system waters, which include make-up water, chemicalreagent water, operational start-up water, water stored in waste piles, water retained in tailings,and mine waters (miscellaneous inflows), have reasonably constant and predictable flows overtime. Natural system waters include rainfall, snowmelt, evaporation, and seeps and springs,which have variable and less predictable values (see Section 4.0). An overall site water balancesuperimposes these two systems to account for all waters at the site.
A mine site water balance must recognize that water may be stored in various facilities

EPA and Hardrock Mining: A Source Book for Industry in the Northwest and AlaskaAppendix A: Hydrology
A-20 January 2003
during mine operations. For example, in a heap leach operation, water is stored in the processponds, the heap leach, and the ore itself. Water is lost from the system water throughevaporation; facilities such as spray systems and process ponds may result in significantevaporative losses. Natural precipitation that falls on facilities such as heap leach pads orprocess ponds increases the total amount of water in the system as do any liquid chemicaladditives that are used in the processing of ore. During winter shutdown, or other temporary orpermanent shutdowns, water collected in the facilities, including the ore itself, will drain andmust be stored in the process ponds. In heap leach operations, the ore must be rinsed with wateror chemical solutions to neutralize the environmental impacts of chemical reagents remaining inthe ore (Van Zyl et al., 1988). For a tailings basin/milling type operation, inflows includetailings water, runoff, and other types of waters such as mine water that are often co-managedwith tailings. Losses include water retained in tailings, seepage (to ground water beneath thetailings dam), pond evaporation, and recirculation waters.
A key aspect of the water balance at a site is the long-term variability of precipitationamount, intensity, and duration. Precipitation events can significantly change the estimatedsurface water and ground water volumes used in the water balance assessment. In turn, this canchange the determination of whether a system will have a net gain or loss of water. For a minewith a gaining system, such as those in wetter climates, some type of a water disposal systemmay be required to achieve a balance. Typical disposal systems include evaporation ponds,surface outfalls, and ground water recharge systems. A mining operation with an overall losingsystem, as in dry climates, usually requires the input make-up water over time. A site with anoverall losing system may still have a net gaining system for short times, such as during periodsof high precipitation or snowmelt. Water disposal systems need to be designed to manage thewater balance during these periods.
Process ponds should be sized to contain all water that would be in circulation duringfacility operations and during periods of temporary shutdown or rinsing and closure. A waterbalance is required to determine the sizes of these ponds (Van Zyl et al., 1988). In addition toholding the required volumes of process solutions, ponds must be able to accommodateadditional water that flows into the system during extreme precipitation events.
Brown (1997) describes methods to determine a site water balance using bothdeterministic and probabilistic approaches. Deterministic water balances, similar to thatdescribed in Section 5.1, use set input values (e.g., average annual precipitation) to computeinflow and outflow. To provide insight into the range of conditions that could be expected tooccur, deterministic water balances should be computed for average, wet, and dry conditions. Incontrast, the input values used in probabilistic approaches are sampled from probabilitydistributions (e.g., annual precipitation probability). Computer spreadsheets are used toiteratively calculate inflow and outflow probabilities. According to Brown (1997), probabilisticapproaches result in better facility designs because they can indicate which parameters have themost effect on model results and may reveal potential design weaknesses.
EPA and Hardrock Mining: A Source Book for Industry in the Northwest and AlaskaAppendix A: Hydrology
A-21 January 2003
5.1 Average Water Balance
The concept of an average water balance can be stated with the following mathematicalformula:
S = I - O (A-2)
where S is the total storage requirement, and I and O are the sums of all inflows and outflows,respectively (Broughton and Tape, 1988). Using a cyanide heap leach operation as an example,the components of the average water balance are outlined as follows (Van Zyl et al., 1988):
Water Balance Period (T) - This is the period over which the average water balancecomponents will be evaluated. The period must be long enough to include a complete leachrinse-cycle. On expanding ore pads, this period would equal the actual leach-rinse time. For apermanent pad, which may have several segments of ore that are either being leached, rinsed, orremoved, the period would have to include a number of these cycles.
Precipitation on the Ore and Pad (P) - This is evaluated by multiplying the long-termaverage precipitation over period T by the total area contained within the berms around the leachpad.
Evaporation from the Ore and Pad (E) - Evaporation for the period T can be evaluatedusing either a factor multiplied by the Class A pan evaporation and the irrigated area at aparticular time horizon, or using spray-loss graphs. Only the period during which actualleaching or rinsing occurs should be used when determining the pan evaporation.
Rinse Water (R) - Laboratory tests are usually required to determine the amount ofrinsing water and reagents that must be applied to adequately clean the spent ore before disposal. Rinse-water volume may be as high as seven or eight pore volume displacements.
Soil Storage (S) - Soil moisture conditions vary in the heap during the ore placement,leaching, rinsing, and draindown periods. Each change in ore moisture results in water beingtaken up and stored in the pile or being drained from the pile into the ponds. Some of the waterstored in the heap leach pile will not drain. Various moisture contents in a heap leach pile mustbe taken into consideration, including natural moisture content, agglomerated moisture content,field capacity or specific retention, and moisture content of the heap leach pile during leaching.
Net Evaporation Loss from Pregnant and Barren Ponds (EP) - This is calculated as thearea of the ponds multiplied by the gross lake evaporation, minus the average precipitation overperiod T. In some cases, the evaporation rate may be modified by the water chemistry.
Normal Operating Water Stored in Pregnant and Barren Ponds (SP) - The ponds need tocontain sufficient water to facilitate operation of the pump systems, as well as daily and weeklyfluctuations in operating the system.
EPA and Hardrock Mining: A Source Book for Industry in the Northwest and AlaskaAppendix A: Hydrology
A-22 January 2003
Water Stored in the Process Facility (SPR) - This volume is equal to the capacity ofvessels contained in the process facility. It is generally very small and is included here forthoroughness.
Reagent Addition (RA) - This equals the amount of water added with the reagents usedthroughout the operating period T.
Bleed Water (BL) - This is the amount of barren bleed required to prevent the buildup ofconcentrations of certain constituents to values that are sufficiently high to interfere with mineralextraction.
After the above parameters are determined, the overall average water balance of thesystem, termed the balancing flow (BF), can be calculated as follows:
BF = P - E + R - EP - BL + RA -S (A-3)
Negative values of BF indicate that the system will require additional water, on average,equal to the amount of BF. Positive values indicate that water storage in the system will build upand excess water must be disposed.
5.2 Evaluating Pond Capacity
The water storage facilities at any site must be sized to contain the amount of water thatwould be in the system during a low probability, wet hydrological event (i.e. the worst-casescenario). Pond sizes should take into consideration the conditions that are likely to prevailduring winter and total system shutdown, as appropriate. The conservativeness of the hydrologicevent used in pond design depends on regulatory requirements, economic considerations such asthe cost of additional pond capacity, the value of processed ore, and especially the environmentalconsequences caused by exceeding storage capacity.
During operations, process pond capacity should be evaluated monthly to measurefluctuations caused by changing precipitation and evaporation conditions. Performing monthlyand quarterly evaluations permits close inspection of the operational aspects that may affectwater storage requirements. Moreover, the monthly evaluation gives an indication of the criticalor maximum storage capacity needed during any month.
The storage capacity of process ponds at a site typically is based on the worst-caseclimatic condition (i.e., a low-probability, high-flow event). In drier climates where, on average,the system operates with a large negative water balance, the critical duration of the design stormevent usually is relatively short, varying from 1 to 60 days. During these events, the watersystem will show a net precipitation gain, thereby allowing the system to exceed storagecapacity. In wetter climates, the critical duration is longer and may last over an entire season orover several wet years. Once again, it is prudent to consider a range of durations and choose theworst-case scenario (Van Zyl et al., 1988).
The critical duration design criterion is extremely important and should always be
EPA and Hardrock Mining: A Source Book for Industry in the Northwest and AlaskaAppendix A: Hydrology
A-23 January 2003
considered, even though such evaluations may be beyond the mandate of the regulatoryrequirements. If the critical duration evaluation is not used, the result may be unnecessarilyconservative or dangerously overly optimistic pond sizing. The following two scenarios areexamples from Van Zyl et al. (1988):
Overly Conservative Design - Assume the regulatory requirement prescribes a 6-hourprobable maximum precipitation event (PMP) as the critical event. Water balance calculationsindicate that the critical duration is 15 days. Analysis shows that the return period of the designevent exceeds 1,000 years, which is considered overly conservative. Designing for this eventmeans that there would be less than a 0.1 percent chance of overtopping a pond during any 1year.
Liberal Design - Assume that the regulatory requirement prescribes a 24-hour, 100-yearevent as the critical design event. Furthermore, assume that the operation is located in amoderately wet climate and that the critical duration is actually 60 days. Analysis shows that theactual return period of the design event is less than 25 years. This means the chances that thepond will overtop exceed 4 percent each year. During a 20-year leach operation life, theprobability of overtopping will exceed 80 percent. By most standards, this design would bedeemed unacceptable.
In cases where critical duration analysis produces overly conservative or overly liberaldesigns, applicants should provide to regulatory agencies calculations disclosing the probabilityof overtopping for different critical durations as a part of their impact analysis. Further iterativedesign calculations may be warranted.
6.0 SURFACE WATER AND GROUND WATER MODELING
Mathematical models can be solved analytically or numerically. Either type of solutionmay involve the use of a computer. Analytical solutions are usually simple in concept andassume a homogeneous, porous media. Numerical solutions are usually more appropriate forcomplex, heterogeneous conditions. In general, models become more complex as fewersimplifying assumptions are used to describe a system or approximate a set of governingequations.
Anderson and Woessner (1992) suggest answering the following questions to determinethe type and level of modeling effort needed:
• Is the model to be constructed for prediction or system interpretation, or is it a genericmodeling exercise?
• What should be learned from the model? What questions do you want the model toanswer?
• Is a modeling effort the best way to obtain the information required?
EPA and Hardrock Mining: A Source Book for Industry in the Northwest and AlaskaAppendix A: Hydrology
A-24 January 2003
• Can an analytical model, rather than a more complex and labor intensive numericalmodel, be used to obtain a solution?
Answers to these questions will help the mining hydrologist to determine the methods touse to conduct a water balance study or design hydrological structures at a mine site. Inaddition, they will help to determine whether a solution should be analytical or numerical, steadystate or transient, or, especially for ground water solutions, whether a modeling effort should beconducted in one-, two-, or three-dimensions (Anderson and Woessner, 1992).
Applicants will recognize that many ground water flow models assume porous mediaflow and may not replicate conditions at mines where rocks are intensely fractured. Modelingfracture flow may require applicants to collect additional data on the number, width, andinterconnection of fractures (Anderson and Woessner, 1992). As described in detail in Andersonand Woessner (1992), fractured systems can be modeled by invoking conceptual models ofequivalent porous medium, discrete fractures, or dual porosity. Each of these conceptual modelsuses assumptions that oversimplify flow through the fractured system. Consequently, applicantsshould exercise caution when interpreting the results of models developed in this manner.
6.1 Developing a Conceptual Site Model
A conceptual site model can be used to address the questions and evaluate the parametersdiscussed in Section 6.0. This model is a depiction, descriptive, pictorial, graphical, orotherwise, of the surface and subsurface hydrological systems, how they interact, and how theyare related. The conceptual model should be developed concurrently with site characterizationstudies to determine important geologic formations, hydrostratigraphic units, and surface waterinteractions. A carefully constructed conceptual model will reveal important interrelationshipsthat need to be evaluated, studied, or modeled. In addition, it will provide a basis for developingplans to monitor site conditions, analyze impacts, and construct numerical ground and surfacewater models. The conceptual model is usually simplified to consider only significant surface,subsurface, and interactive components because a complete reconstruction of actual fieldconditions is not feasible (Anderson and Woesner, 1992). It should be sufficiently complex toaccurately depict system behavior and meet study objectives, but simple enough to allow timelyand meaningful development of modeling or other analytical solutions.
The conceptual model provides a tool for identifying the questions to analyze using amathematical model. Comparing the boundaries, dimensions, and input parameters of aparticular mathematical model against the conceptual model, permits a user to evaluate theability of the mathematical model to meet assessment needs. This type of comparison mayindicate that specific components of the surface or subsurface hydrologic system cannot besimulated easily using a mathematical model. In this case, the conceptual model can be used toidentify additional site characterization needs or model codes that are needed to accuratelymodel specific components.
Conceptual model development begins by defining the area of interest and the boundaryconditions of that area. Boundary conditions may include definitions of flow or hydraulicconditions across the boundary. The main steps in developing a conceptual model are to: (1)

EPA and Hardrock Mining: A Source Book for Industry in the Northwest and AlaskaAppendix A: Hydrology
A-25 January 2003
define hydrostratigraphic units (these may or may not correspond to specific geologic units,depending on the degree of complexity required by the project objectives); (2) develop a generalwater budget that identifies sinks and sources to the system; and (3) define the type of flowsystems to be studied or modeled.
6.2 Analytical Software for Surface Water Modeling
Most computer programs available to analyze surface water hydrology, performwatershed studies, and design hydrological structures are considered “analytical” software. Many of these programs use the algorithms discussed in Section 4.0 for analyzing precipitation,runoff, flow routing, and structure design. These programs allow a user to apply differentalgorithms to a particular problem and then compare the solutions. The output from oneanalysis, such as a watershed precipitation or snowmelt analysis, can be easily utilized by otherroutines to analyze runoff and route flows through a structure. One problem that can beassociated with the use of empirical models (whether applied using a computer or by handcalculation) is that they are easy to misapply. As discussed in Section 4.0, it is important that themining hydrologist understand the assumptions and approximations used by different methodsand in what situations different methods are appropriate.
The U.S. Geological Survey has published a compendium on the use of surface watermodels (Burton, 1993). A complete review of this publication is beyond the scope of this report;however, the publication outlines recent research and application of surface water modelingtechniques and the use of interactive spatial data systems, such as the use of satellite imagery andGeographical Information Systems.
Most analytical software used for hydrological analyses and structure design is availablethrough the private sector. Some surface water hydrological, water quality, and groundwatersoftware programs and models are available through the United States Geological Survey(USGS). Many of these programs and their manuals can be accessed and downloaded to acomputer from the USGS via the internet (as of February 1999: water.usgs.gov/software). Briefdescriptions of some of the more commonly used programs are provided below with particularemphasis on those that typically are used in mine settings.
HEC-1 Flood Hydrograph Package
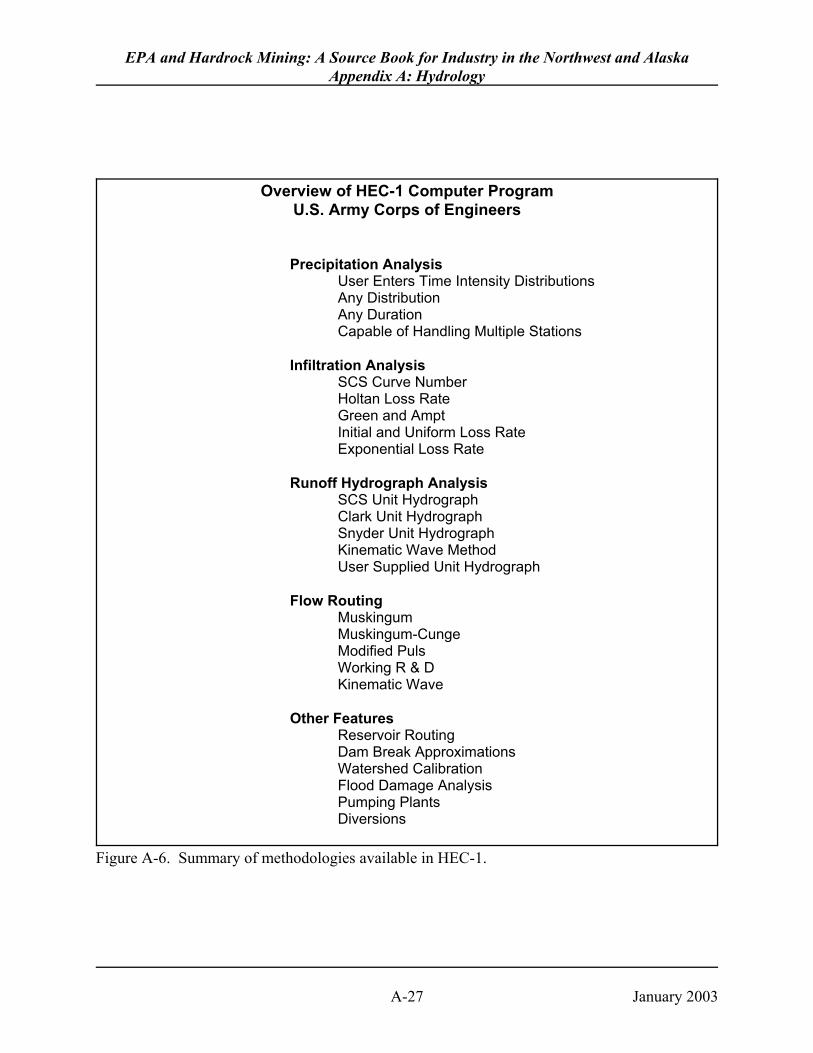
HEC-1 (U.S. Army Corps of Engineers, 1987) is perhaps the most commonly usedsoftware for conducting watershed analyses and performing surface hydrological analyses foruse in structure design and water balance studies. The program was originally developed in1967 by the U.S. Army Corps of Engineers Hydrologic Engineering Center (HEC). Theprogram has been modified and improved throughout the years and a visual (graphical) versionhas recently been released.
HEC-1 generates hydrographs from rainfall and/or snowmelt, adds or diverts them, thenroutes the flow through stream reaches, reservoirs, and detention ponds. It models multiplestream and reservoir networks, and has dam failure simulation capabilities. The program cansimulate level-pool routing for reservoirs and detention ponds. Figure A-6 outlines the
EPA and Hardrock Mining: A Source Book for Industry in the Northwest and AlaskaAppendix A: Hydrology
A-26 January 2003
techniques incorporated into HEC-1, many of which are discussed in Section 4.0.
TR-20 Project Formulation Hydrology
TR-20 (Soil Conservation Service, 1973) performs hydrograph generation, additions, ordiversions, reach routing, or multiple pond network analyses. TR-20 uses the SCS methods togenerate runoff hydrographs based on precipitation amounts specified for any storm duration. Hydrographs are computed using standard SCS Type I , IA, or II rainfall distributions, or otherdesign hyetographs specified by the user.
HMR-52 Probable Maximum Storm
HMR-52 (Hansen et al., 1982) computes basin-average precipitation for ProbableMaximum Storms and finds the spatially averaged Probable Maximum Precipitation (PMP) for awatershed. The PMP can be used directly with HEC-1 to compute runoff hydrographs for theProbable Maximum Flood (PMF) as the basis for dam spillway and failure analyses.
HECWRC Flood Flow Frequency
HECWRC performs a statistical analysis of historical stream flow data and plots theresulting flow-frequency curve. The program places both the observed and computed probabilitycurves on the same plot. HECWRC uses the Log-Pearson Type III distribution as discussed inSection 4.0 to compute the return frequency curve.
HEC-RAS Water Surface Profiles
HEC-RAS (U.S. Army Corps of Engineers, 1991) software employs methods commonlyused in open channel hydraulics and in the design and analysis of hydrologic structures. HEC-RAS computes water surface profiles for steady or gradually varied flow in natural or man-madechannels. It handles subcritical and supercritical flows and can analyze the performance ofculverts, weirs, and floodplain structures. HEC-RAS is used for evaluating flood hazard zonesand designing man-made channels or channel improvements.
6.3 Numerical Modeling of Surface Water
A variety of software is available that combines analytical solutions with numericalmodeling techniques to create watershed models. In general, these models employ finite-difference or finite-element techniques to route hydrographs and pollutants through surface-water systems. These models are particularly useful for evaluating the fate and transport of pointand non-point sources of pollution through a watershed. Studies of this type could be used bymining
EPA and Hardrock Mining: A Source Book for Industry in the Northwest and AlaskaAppendix A: Hydrology
A-27 January 2003
Overview of HEC-1 Computer ProgramU.S. Army Corps of Engineers
Precipitation AnalysisUser Enters Time Intensity DistributionsAny DistributionAny DurationCapable of Handling Multiple Stations
Infiltration AnalysisSCS Curve NumberHoltan Loss RateGreen and AmptInitial and Uniform Loss RateExponential Loss Rate
Runoff Hydrograph AnalysisSCS Unit HydrographClark Unit HydrographSnyder Unit HydrographKinematic Wave MethodUser Supplied Unit Hydrograph
Flow RoutingMuskingumMuskingum-CungeModified PulsWorking R & DKinematic Wave
Other FeaturesReservoir RoutingDam Break ApproximationsWatershed CalibrationFlood Damage AnalysisPumping PlantsDiversions
Figure A-6. Summary of methodologies available in HEC-1.
EPA and Hardrock Mining: A Source Book for Industry in the Northwest and AlaskaAppendix A: Hydrology
A-28 January 2003
operations to evaluate and model potential operational effects and releases in conjunction withthe NPDES permit process. Two of the more commonly used models are described below.
Hydrologic Simulation Program FORTRAN (HSPF)
HSPF (Bicknell et al., 1997) is a set of computer codes that simulates the hydrologic andassociated water quality processes on pervious and impervious land surfaces, in the soil profile,and in streams and well-mixed impoundments. The operational connection between the landsurface and the instream simulation modules is accomplished through a network block ofelements. Time series of runoff, sediment, and pollutant loadings generated on the land surfaceare passed to the receiving stream for subsequent transport and transformation simulation. Waterquality and quantity can be evaluated along different segments or at outflow points within awatershed.
Water Erosion Prediction Project Hydrology Model (WEPP)
WEPP (Foster and Lane, 1987) is designed to use soil physical properties andmeteorological and vegetation data to simulate surface runoff, soil evaporation, planttranspiration, unsaturated flow, and surface and subsurface drainage. The model uses the Greenand Ampt infiltration equation to estimate the rate and volume of excess storm precipitation. Excess precipitation is routed downslope to estimate the overland flow hydrograph using thekinematic wave method. In WEPP, surface runoff is used to calculate rill erosion and runoffsediment transport capacity. The infiltration equation is linked with the evapotranspiration,drainage, and percolation components to maintain a continuous daily water balance for awatershed.
6.4 Analytical and Numerical Modeling of Ground Water
Ground water models are used in water balance studies at mine sites to evaluate andquantify ground water inflow to pits, channels, or other large structures associated with the mine. One-dimensional, vertical models may be used to evaluate situations where pond liners or othercontainment structures may have failed and knowledge of contaminant transport to naturalground water systems is required.
Most ground water modeling software is available through government agencies or theprivate sector. A thorough description of ground water modeling and the assumptions associatedwith its proper application is beyond the scope of this report. Instead, the reader is referred tothe text by Anderson and Woessner (1992) for a detailed discussion of modeling techniques andapplications and to a report produced by EPA in cooperation with the Department of Energy(DOE) and the Nuclear Regulatory Commission (NRC) that provides technical guidanceregarding the development of modeling objectives, the development of site conceptual models,and the choice of models for use in particular problems (EPA, 1994). A brief description ofground water modeling and its application to mining is provided below. A description of someof the more common ground water modeling programs is also provided, with particular emphasison those that are commonly used in mine settings.

EPA and Hardrock Mining: A Source Book for Industry in the Northwest and AlaskaAppendix A: Hydrology
A-29 January 2003
Van der Heijde (1990a) defined a ground water model as the mathematical description ofthe processes active in a ground water system. Models vary in sophistication, with analyticalsolutions being the least complex and numerical methods, such as finite-difference or finite-element methods, being the most complex. A comparison of finite-difference and finite-elementnumerical methods is detailed by Pinder and Gray (1977). Both schemes are widely used tosimulate transient flow in ground water aquifers (Freeze and Cherry, 1979).
Ground water models can be used to simulate heterogeneous systems in which a varietyof coupled processes describe the hydrology, chemical transport, geochemistry, andbiochemistry of near surface and deep aquifer systems. Ground water models may alsoincorporate the mathematical description of fluid flow and solute transport systems for both thesaturated and unsaturated zones and take into consideration the complex nature ofhydrogeological systems.
The predictive capabilities of ground water models depend on the quality of input data. The accuracy and efficiency of the simulation depend on the applicability of the assumptions andsimplifications used in the model, the accurate use of process information, the accuracy of sitecharacterization data, and the subjective decisions made by the modeler. Where precise aquiferand contaminant characteristics have been reasonably well established, ground water modelsmay provide a viable, if not the only, method to adequately predict inflow to a mine pit, evaluatedewatering operations, conduct contaminant fate and transport studies, locate areas of potentialenvironmental risk, identify pollution sources, and assess mining operational variables.
Ground water models can be classified into two broad categories. The first includes flowmodels that describe the hydraulic behavior of single or multiple fluids or fluid phases in porousor fractured media. The second category includes contaminant/chemical fate-and-transportmodels that analyze the movement, transformation, and degradation of chemicals in thesubsurface. A detailed discussion of model classifications is presented by van der Heijde et al.(1985; 1988).
The modeling process consists of defining the problem, creating and calibrating themodel, and conducting an analysis for a particular mining scenario or problem. Analysis of thewater management problem in question is used to formulate modeling objectives and createsimulation scenarios. Key elements of the problem definition step are conceptualizing theground water system and analyzing and interpreting the existing data. Conceptualizing theground water system includes: (1) identifying the hydraulic, thermal, chemical, andhydrogeologic characteristics of the system; (2) determining active factors such as pumpingrates, artificial recharge, injection, or other anthropogenic factors, and passive factors, such asnatural recharge, evaporation, and seep discharge; and (3) analyzing the level of uncertainty inthe system (Kisiel and Duckstein, 1976).
The model calibration phase begins with the design of a computational grid that providesthe basis for discretization of spatial parameters (van der Heijde, 1990a). Model calibration isaccomplished by running iterative simulations, starting with field parameters and systemstresses, followed by improving initial estimates based on the differences noted by comparing

EPA and Hardrock Mining: A Source Book for Industry in the Northwest and AlaskaAppendix A: Hydrology
A-30 January 2003
computed with observed values. As input parameters are continually refined, the model becomesmore precise representation of the physical system.
After the model is calibrated to field conditions, it can be used to make predictiveestimates. In this phase, different engineering designs, system alterations, or failure scenarioscan be evaluated. Van der Heijde (1990a) suggests that uncertainty analyses should beconducted in conjunction with predictive modeling to assess the reliability of the simulationresults.
During any modeling application, a lack of data can impede the efficiency of thesimulation. Insufficient data can result from inadequate spatial data resolution, inadequatetemporal sampling of time-dependent variables, and measurement errors. Van der Heijde(1990b) presents specific guidance on setting up quality assurance (QA) programs for groundwater modeling studies. The major elements which should be incorporated into a QA programfor modeling include:
• Formulate QA objectives and required quality level in terms of validity, uncertainty,accuracy, completeness, and comparability;
• Develop operational procedures and standards for performing adequate modeling studies;and
• Establish QA milestones for internal and external auditing and review procedures.
The QA plan should address collecting data, formulating the model, conductingsensitivity analyses, and pre-establishing guidelines for model calibration criteria. Ground watermodeling for use in hydrologic design or water balance studies should incorporate a QA planthat addresses specific modeling objectives and the above parameters, depending on the riskassociated with the specific design or study.
Commonly used programs for developing ground water models are briefly describedbelow. These models were chosen to demonstrate the capabilities of some of the softwareavailable in the public domain.
AT123D
AT123D (Yeh, undated) uses analytical solutions for transient one-, two-, or three-dimensional transport in a homogeneous, anisotropic aquifer with uniform, stationary regionalflow. The program allows for retardation and first-order decay when evaluating contaminanttransport problems and permits simulation of a variety of source configurations, including pointsource, line source, and areal source inputs. It further allows the use of several boundaryconditions to define flow parameters; longitudinal, horizontal and vertical transverse dispersionvalues can be input independently. The model calculates concentration distributions in spaceand time.
EPA and Hardrock Mining: A Source Book for Industry in the Northwest and AlaskaAppendix A: Hydrology
A-31 January 2003
MODFLOW
MODFLOW (McDonald and Harbaugh, 1988; Harbaugh and McDonald, 1996) isperhaps the most commonly used software for creating ground water models and conductingpredictive studies. MODFLOW is a numerical model that uses a finite-difference solution tosolve the governing equations for ground water flow. It can be used to create two-dimensionalareal or vertical models as well as quasi-three-dimensional or full three-dimensional models. Because of its numerical approach, it can be used to model transient flow or steady-state flowunder anisotropic and layered aquifer conditions. Layers can be simulated as confined,unconfined, or convertible between the two conditions. The model can also handle layers that“pinch out”. The model allows for analysis of external influences such as wells, areal recharge,drains, evapotranspiration, and interaction with surface water bodies such as streams. Thissoftware has been accepted for use by many regulatory programs.
FEMWATER/FEMWASTE
FEMWATER (Yeh, 1987) is a numerical model that uses a finite-element solution tosolve the governing equations for ground water flow. It can be used to create two-dimensionalareal or vertical models as well as full three-dimensional models in both saturated andunsaturated media. Because of its numerical approach, it can be used to model transient flow orsteady-state flow under anisotropic and layered aquifer conditions. FEMWASTE is atwo-dimensional transient model for the transport of dissolved constituents through porousmedia. The transport mechanisms include: convection, hydrodynamic dispersion, chemicalsorption, and first-order decay. The waste transport model is compatible with the water flowmodel (FEMWATER) for predicting convective Darcy velocities in porous media that arepartially saturated.
7.0 DATA REPRESENTATIVENESS
It is critically important to adequately understand the unique hydrology of a particularmine site. Mine sites may be situated in areas where precipitation rates vary significantly over asmall area (e.g., due to orographic effects) or in remote areas for which meteorological recordsare lacking. In mountainous terrains, snowmelt and rain-on-snow events may produce large flowvolumes that are difficult to quantify. These uncertainties make it difficult to characterize theentire hydrologic system.
Because the quality of field data available for mine sites may vary substantially, it iscritical to know the advantages and limitations of the different methods that may be used tocharacterize site hydrology. As discussed in Section 4.3, the standard methods for predictingrunoff must be used cautiously in mine site planning. The unique geographical andmeteorological settings often encountered at mine sites mandate careful consideration of theassumptions used and require model results to be correlated with actual field data and conditions.
EPA and Hardrock Mining: A Source Book for Industry in the Northwest and AlaskaAppendix A: Hydrology
A-32 January 2003
The nature of mining inevitably impacts the hydrology of a site, in terms of both waterquantity and quality. Often, baseline hydrologic conditions are not well characterized becausehistorical data either are unavailable or inadequate, or because the data have not been adequatelyevaluated. Preventing potential environmental impacts requires that a mine site's water system,both the natural and facility systems, be adequately evaluated. Evaluations of and conclusionsconcerning environmental impacts to site hydrology and water quality should be at least asprecise and accurate as those of other economically important aspects of the project. Forexample, the studies, conclusions, and disclosure of potential hydrological and water qualityimpacts should be at least as accurate as those concerning the certainty and extent of theeconomic ore deposit.
The selection of appropriate statistical analysis techniques and the accuracy of theirpredictions are linked to data representativeness. Those statistical procedures whoseassumptions best fit the population characteristics should be identified as the most appropriatedata analysis procedures for use in baseline characterization and for design (Ward and McBride,1986). In initial efforts to design a basic characterization or monitoring system, it is necessary tostatistically analyze existing hydrological data and determine those characteristics that willinfluence the selection of data analysis procedures. If there are no existing data, data from awatershed presumed to be hydrologically similar should be obtained to provide initial estimates.
7.1 Statistical Concepts and Hydrological Variables
Basic descriptive statistical parameters for hydrological data include the mean, variance,skewness, and coefficient of variation. Statistical methods use hypotheses and tests to determinedistributions, differences in parameters between objects, the significance of those differences,and confidence in the estimated values.
For many hydrological variables and environmental contaminants, the basic statisticalassumptions of independent, normally distributed data are not realistic because environmentaldata commonly are correlated and non-normally distributed, with variance that may change overtime (Gilbert, 1987). For hydrological and water quality data in particular, there are threecommonly assumed parameters which may not apply to hydrological studies (Ward and Loftis,1986): (1) independence of observations, including the absence of seasonality or serialdependence; (2) homogeneity of variance over the period of record; and (3) form of theprobability distribution, (e.g., normal or non-normal). For these reasons, the statisticalcharacterization of hydrological data for calculating mine water balances should include timeseries plots and testing for normality.
The many statistical techniques that can be used to characterize hydrological processesare presented in the references cited and will not be discussed herein. However, the followingparagraphs present examples of two commonly used statistical methods for predictingcomponents of a mine site water balance. Statistical techniques used for flood frequencyanalysis are presented in Section 4.0.
EPA and Hardrock Mining: A Source Book for Industry in the Northwest and AlaskaAppendix A: Hydrology
A-33 January 2003
Linear regression is used to define the relationship between two variables whereasmultiple regression is used to explain how one variable varies with changes in several variables. Analysis of Variance (ANOVA) can be used to determine the most or least significant variable. For example, single factor linear regression can determine the relationship of runoff volume torainfall volume while multiple regression can determine the effect of multiple watershedcharacteristics (e.g., basin size or shape, stream length, stream density) on runoff peakdischarges. Regression also can be used to analyze trends, provide information about flow andwater quality differences, measure variance, and extend hydrological records from a gaged basinto an ungaged basin or stream.
Factor analysis can be used to evaluate complex relationships between a large number ofvariables and determine their separate and interactive effects. An example of factor analysis inhydrology would be to determine significant factors of importance in predicting watershedrunoff, such as determining effects of basin size, shape, soil type, aspect, vegetation type, orother geomorphological factors.
7.2 Development of a Quality Assurance Program with Data Quality Objectives
The difference between the true value of a variable and the measured or calculated valueis a measure of data quality. All hydrological data are subject to random errors, systematicerrors including inconsistency and bias, and non-homogeneity. Random errors always arepresent in data. Inconsistency is the difference between observed values and true values whilenon-homogeneity reflects a changed condition that has taken place between sampling events. Predicting stream flows based on past properties of hydrologic variables requires that theconclusions be derived from data that are free of significant inconsistency and non-homogeneity,and with tolerable random errors (Yevjevich, 1972).
The amount of uncertainty that can be tolerated depends on the intended use of the data. The level of uncertainty that is acceptable is a critical part of the monitoring design (i.e., what,where, and how often to sample) and, therefore, must be incorporated into the sampling program. Statistical design criteria should be defined within any monitoring program. These criteria setlimits on the confidence in the data by specifying the acceptable uncertainty in the estimatedvariables.
Gilbert (1987) identifies four categories of data validation procedures that should beperformed:
(1) Routine checks made during the processing of data. Examples include looking for errorsin identification codes (those indicating time, location of sampler, method of sampling,etc.), in computer processing procedures, or in data transmission.
(2) Tests for the internal consistency of a data set. These include plotting data for visualexamination by an experienced analyst and testing for outliers.

EPA and Hardrock Mining: A Source Book for Industry in the Northwest and AlaskaAppendix A: Hydrology
A-34 January 2003
(3) Comparing the current data set with historical data to check for consistency over time.Examples are visually comparing data sets against gross upper limits obtained fromhistorical data sets, or testing for historical consistency using the control chart test.
(4) Tests to check for consistency with parallel data sets, i.e., data sets thought to be from thesame population (i.e., from the same time period or similar stream). Three tests forconsistency are the sign test, the Wilcoxon signed-ranks test, and the Wilcoxon rank sumtest. These tests are discussed by Gilbert (1987).
Data reliability can be assessed using ANOVA to evaluate analytical, sampling (at a site),and regional (between sites) variability. If replicate samples have been collected, then ananalysis of variance can determine whether there is a statistically significant difference betweensources of variation. Basic assumptions for ANOVA tests include random samples, normaldistributions and equal variances. ANOVA methods can help to focus additional sampling andaid data interpretation.
8.0 CITED REFERENCES
Anderson, M.A. and Woessner, W.W., 1992. Applied Ground Water Modeling: Simulation ofFlow and Advective Transport, Academic Press, Inc., New York, NY, 381 pp.
Barfield, B.J., Warner, R.C., and Haan, C.T., 1981. Applied Hydrology and Sedimentology forDisturbed Lands, Oklahoma Technical Press, Stillwater, OK, 603 pp.
Bastin, G., Lorent, B., Duque, C. and Gevers, M., 1984. Optimal Estimation of the AverageAreal Rainfall and Optimal Selection of Rainfall Gauge Location, Water ResourcesResearch, vol. 20, no. 4, pp. 463-470.
Bicknell, B.R., Imhoff, J.C., Kittle, J.L., Jr., Donigian, A.S., Jr., and Johanson, R.C., 1997. Hydrological Simulation Program – Fortran, User’s Manual for Version 11, U.S. Environmental Protection Agency, National Exposure Research Laboratory, Athens, GA,
Report EPA/600/R-97/080, 755 pp.
Broughton, S. and Tape, R., 1988. Managing Heap Leach Solution Storage Requirements. In:C.O. Brawner, ed., Proceedings from the Second International Conference on GoldMining, Society of Mining Engineers, Littleton, CO, pp. 367-379.
Brown, M.L., 1997. Water Balance Evaluations. In: Marcus, J.J., ed., Mining EnvironmentalHandbook, Effects of Mining on the Environment and American Environmental Controls,Imperial College Press, London, pp. 476-496.
Burton, J.S., ed., 1993. Proceedings of the Federal Interagency Workshop on HydrologicModeling Demands for the 90's, U.S. Geological Survey Water-Resources InvestigationsReport 93-4018.
EPA and Hardrock Mining: A Source Book for Industry in the Northwest and AlaskaAppendix A: Hydrology
A-35 January 2003
Chow, V.T., 1964. Handbook of Applied Hydrology, McGraw-Hill, New York, NY.
Chow, V.T., Maidment, D.R., and Mays, L.W., 1988. Applied Hydrology, McGraw-Hill, NewYork, NY.
Clark, C.O., 1945. Storage and the Unit Hydrograph, Transactions of the American Society ofCivil Engineers, vol. 110, pp.1419-1446.
Eagleson, P.S., 1967. Optimum Density for Rainfall Networks, Water Resources Research, vol.3, no. 4, pp. 1021-1033.
Foster, G.R. and Lane, L.J., 1987. User Requirements: USDA-Water Erosion Prediction Project(WEPP), NSERL Report No.1, USDA-ARS, National Soil Erosion Research Laboratory, West Lafayette, IN, 43 pp.
Freeze, A., and Cherry, J., 1979. Groundwater, Prentice-Hall, Inc., Englewood Cliffs, NJ.
Gilbert, R.O, 1987. Statistical Methods for Environmental Pollution Monitoring, Van NostrandReinhold Co., New York, NY.
Green, W.H., and Ampt, G.A., 1911. Studies on Soil Physics: I. Flow of Air and WaterThrough Soils, J. Agronomy Society, vol. 4, pp. 1-24.
Hanna, T., Azrag, E., and Atkinson, L., 1994. Use of an Analytical Solution for PreliminaryEstimates of Ground Water Inflow to a Pit, Mining Engineering, vol. 46, pp. 149-152.
Hansen, E.M., Schreiner, L.C. and Mille, J.F., 1982. Application of Probable Maximum Estimates: United States East of the 105th Meridian, National Weather Service, Hydrometeorological Report No. 52. U.S. Department of Commerce, National Oceanic and Atmospheric Administration, Washington, D.C.
Harbaugh, A.W. and McDonald, M.G., 1996. User’s Documentation for MODFLOW-96, An Update to the U.S. Geological Survey Modular Finite-Difference Ground-Water Flow Model, U.S. Geological Survey Open-File Report 96-485, 56 pp.
Holtan, H.N., 1961. A Concept for Infiltration Estimates in Watershed Engineering, U.S.Department of Agriculture Publication, ARS 41-51.
Horton, R.E., 1940. Approach Toward a Physical Interpretation of Infiltration Capacity, SoilScience Society of America Proceedings, vol. 5, pp. 339-417.
Huff, F. A., 1967. Time Distribution of Rainfall in Heavy Storms, Water Resources Research,vol. 3, no. 4, pp. 1007-1019.
Jacob, C. and Lohman, S., 1952. Nonsteady Flow to a Well of Constant Drawdown in anExtensive Aquifer, Transactions of the American Geophysical Union, vol. 33, no. 4, pp.
EPA and Hardrock Mining: A Source Book for Industry in the Northwest and AlaskaAppendix A: Hydrology
A-36 January 2003
559-569.
Johanson, R.C., 1971. Precipitation Network Requirements for Streamflow Estimation, StanfordUniversity Department of Civil Engineering Technical Report 147, Palo Alto, CA.
Karnieli, A., and Gurion, B., 1990. Application of Kriging Technique to Areal PrecipitationMapping in Arizona, GeoJournal, vol. 22, no. 4, pp. 391-398.
Kisiel, C., and Duckstein, L., 1976. Ground-Water Models. In: A. Biswas, ed., SystemsApproach to Water Management, McGraw-Hill, Inc., New York, NY.
Koutsoyiannis, D., 1994. A Stochastic Disaggregation Method for Design Storm and FloodSynthesis, J. Hydrology, vol. 156, pp. 193-225.
Linsley, R.K., Kohler, M.A., and Paulhus, J.L.H., 1975. Hydrology for Engineers, 2nd edition, McGraw-Hill Series in Water Resources and Environmental Engineering, McGraw–Hill,Inc., New York, NY, 482 pp.
McDonald, M.G. and Harbaugh, A.W., 1988. A Modular Three-Dimensional Finite-Difference Ground-Water Flow Model, U.S. Geological Survey Techniques of Water Resources Investigations, Book 6, Chapter A1, 586 pp.
McManamon, A., Day, G.N., and Carroll, T.R., 1993. Estimating Snow Water Equivalent Usinga GIS. In: J.S. Burton, ed., Proceedings of the Federal Interagency Workshop onHydrologic Modeling Demands for the 90's, U.S. Geological Survey Water ResourcesInvestigations Report 93-4018, pp. 3:18-25.
McPherson, M.B., 1969. Some Notes in the Rational Method of Storm Drain Design, TechnicalMemorandum No. 6, ASCE Urban Water Resources Research Program, AmericanSociety of Civil Engineers, New York, NY.
Pinder, G. and Gray, W., 1977. Finite Element Simulation in Surface and SubsurfaceHydrology, Academic Press, New York, NY.
Siegel, J., 1997. Ground Water Quantity. In: Marcus, J.J., ed., Mining Environmental Handbook, Effects of Mining on the Environment and American Controls on Mining, Imperial College Press, London, pp. 164-168.
Snyder, F.F., 1938. Synthetic Unit Hydrographs, Transactions of the American GeophysicalUnion, vol. 19, no. 1, pp. 447-454.
Soil Conservation Service, 1972. National Engineering Handbook, Section 4, U.S. Departmentof Agriculture, Washington, DC.
Soil Conservation Service, 1973. Computer Program for Project Formulation Hydrology, Technical Release No. 20, Soil Conservation Service, U.S. Department of Agriculture,
EPA and Hardrock Mining: A Source Book for Industry in the Northwest and AlaskaAppendix A: Hydrology
A-37 January 2003
Washington, D.C.
Soil Conservation Service, 1975. Urban Hydrology for Small Watersheds, Technical ReleaseNo. 55, U.S. Department of Agriculture, Washington, DC.
U.S. Army Corps of Engineers, 1987. HEC-1 Flood Hydrograph Package, Haestad Methods,Inc., Waterbury, CT.
U.S. Army Corps of Engineers, 1991. HEC-2 Water Surface Profiles, Haestad Methods, Inc.,Waterbury, CT.
U.S. Bureau of Reclamation, 1977. Design of Small Dams, Catalog No. I 27.19/2:D18/977,United States Government Printing Office, Washington, D.C.
U.S. Environmental Protection Agency, 1994. A Technical Guide to Ground-Water ModelSelection at Sites Contaminated with Radioactive Substances, Interim Final, U.S.Environmental Protection Agency, Office of Solid Waste and Emergency Response;U.S. Department of Energy, Office of Environmental Restoration; and NuclearRegulatory Commission, Office of Nuclear Material Safety and Safeguards, Washington,DC.
Van der Heijde, P., 1990a. Computer Modeling in Groundwater Protection and Remediation,International Ground Water Modeling Center (IGWMS) Groundwater ModelingPublications, Golden, CO.
Van der Heijde, P., 1990b. Quality Assurance in the Application of Groundwater Models,International Ground Water Modeling Center, Report GWMI 90-02, Golden, CO.
Van der Heijde, P., El-Kdai, A., and Williams, S., 1988. Groundwater Modeling: An Overviewand Status Report, U.S. Environmental Protection Agency, R.S. Kerr EnvironmentalResearch Laboratory, Report EPA/600/2-89/028, Ada, OK.
Van der Heijde, P., Bachmat, Y., Bredehoeft, J., Andrews, B., Holtz, D., and Sebastian, S., 1985. Groundwater Management: The Use of Numerical Models, 2nd edition, P. van derHeijde, rev. and ed., American Geophysical Union, Water Resources Monograph 5,Washington, DC.
Van Zyl, D., Hutchison, I., and Kiel, J., 1988. Introduction to Evaluation, Design, andOperation of Precious Metal Heap Leaching Projects, Society of Mining Engineers, Inc.,Littleton, CO.
Ward, R.C. and Loftis, J.C., 1986. Establishing Statistical Design Criteria for Water Quality Monitoring Systems: Review and Synthesis, Water Resources Bulletin, vol. 22, no. 5, pp.759-767.
Ward, R.C., and McBride, G.B., 1986. Design of Water Quality Monitoring Systems in New

EPA and Hardrock Mining: A Source Book for Industry in the Northwest and AlaskaAppendix A: Hydrology
A-38 January 2003
Zealand, Water Quality Centre, Ministry of Works and Development, Publication No. 8,Hamilton, New Zealand.
Water Pollution Control Federation, 1969. Design and Construction of Sanitary and StormSewers, Manual of Practice 9, American Society of Civil Engineers Manual ofEngineering Practice No. 37, Washington, DC.
Weibull, W., 1939. A Statistical Theory of the Strength of Materials, Ing. Vetenskapsakad.Handl., Stockholm, vol. 151, p. 15.
Wright-McLaughlin Engineers, 1969. Urban Storm Drainage Criteria Manual, Revised 1969and 1975, Denver Regional Council of Governments, Denver, CO.
Yeh, G.T. 1987. 3D-FEMWATER: a three dimensional finite element model of water flowthrough saturated-unsaturated media, Oak Ridge National Laboratory, Publication No.2904.
Yeh, G.T., undated. AT123D. Original reference not found; a version of the software isavailable from the International Ground Water Modeling Center, Colorado School ofMines, http://www. mines.colorado.edu/rese...gwmc/software/igwmcsoft/at123d.htm.
Yevjevich, V., 1972. Probability and Statistics in Hydrology, Water Resources Publications,Fort Collins, CO.