Embed Size (px)
Citation preview


Mining Site PrimerMining Site Primer
Tools for Assessment & Cleanup Tools for Assessment & Cleanup of Abandoned Mine Sitesof Abandoned Mine Sites

OverviewOverview
• Types of environmental problems• Objectives• Assessments
– Approaches– Tools
• Cleanup– Approaches– Considerations

NECR Mine U Waste RockNECR Mine U Waste Rock

Personal ObjectivesPersonal Objectives
• Collect data that drives need for action• Select appropriate actions with ecological
restoration in mind• Choose off-site disposal as LAST
RESORT• Collect data that maximizes effectiveness
of on-site technologies
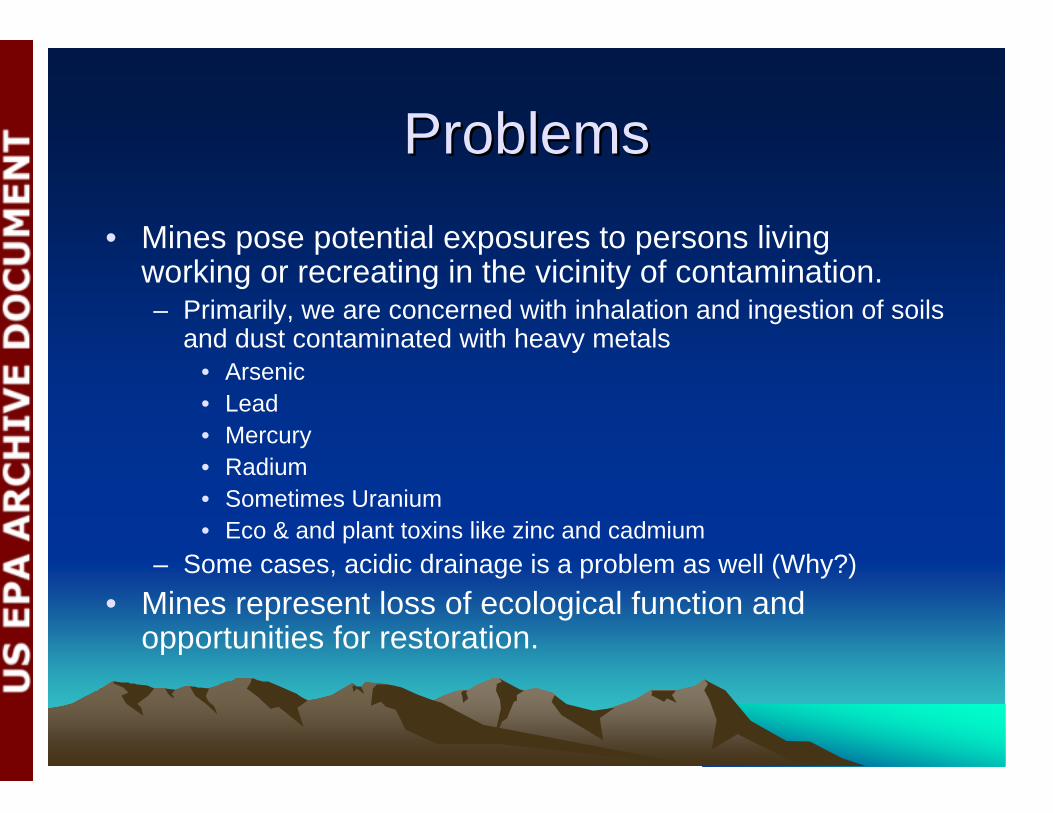
ProblemsProblems• Mines pose potential exposures to persons living
working or recreating in the vicinity of contamination.– Primarily, we are concerned with inhalation and ingestion of soils
and dust contaminated with heavy metals• Arsenic• Lead• Mercury• Radium• Sometimes Uranium• Eco & and plant toxins like zinc and cadmium
– Some cases, acidic drainage is a problem as well (Why?)• Mines represent loss of ecological function and
opportunities for restoration.

Objectives for Mine Cleanup & Objectives for Mine Cleanup & AssessmentAssessment
• Mitigate public health threats posed by heavy metals and/or radiologicals at abandoned mines
• Use the best science to develop protective and cost-effective solutions that are applicable at multiple sites– Re-consider traditional cleanup goals and
techniques based on estimates of material risk (bioavailability), ecological benefit, & and potential environmental costs

Assessment of contaminants in SoilAssessment of contaminants in Soil
• Start with traditional assessment approaches (SW-846 or MARSSIM)
• Use the DQO process…in particular…– Decide what needs to be done – write an “if…then” statement– Define the boundaries of the action (or actions)– Choose sampling approach – Choose statistical tests for each unit (UCLs? t-test? MARSSIM
Sign test or WRS test?)– Determine the no. of samples by unit– Collect data, develop descriptive statistics, test assumptions– Use Visual Sampling Plan – it’s free– Get results and answer the “if…then” statement
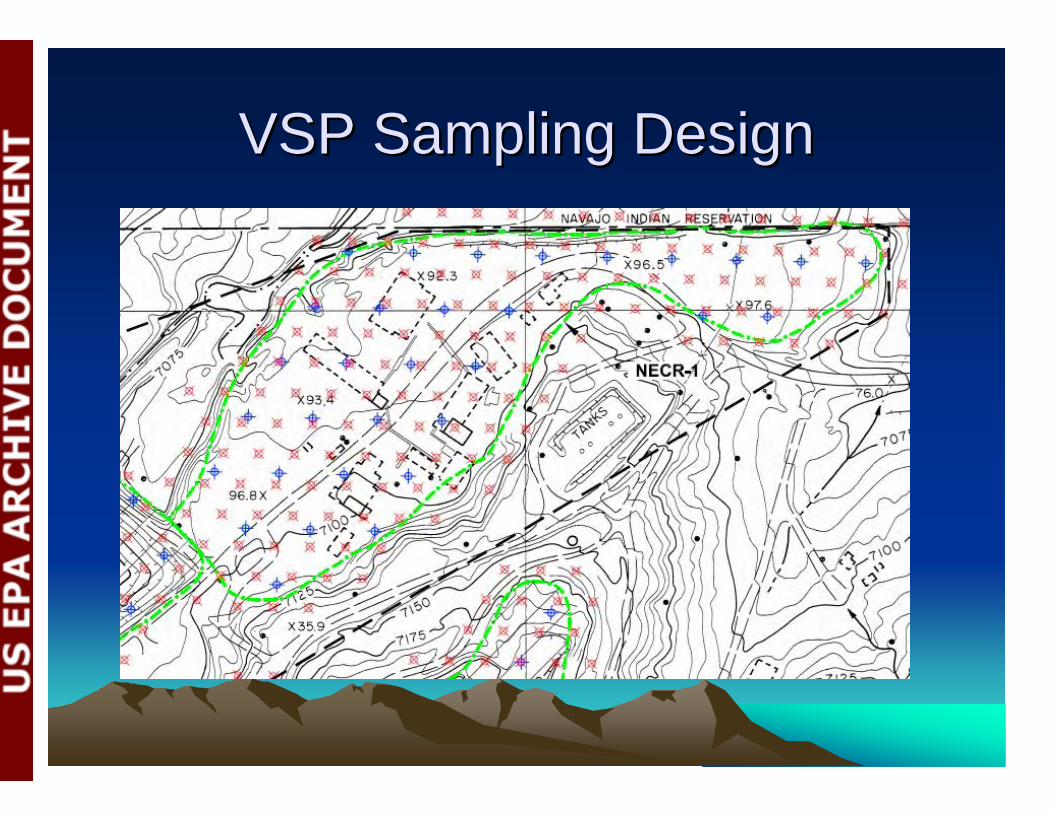
VSP Sampling DesignVSP Sampling Design
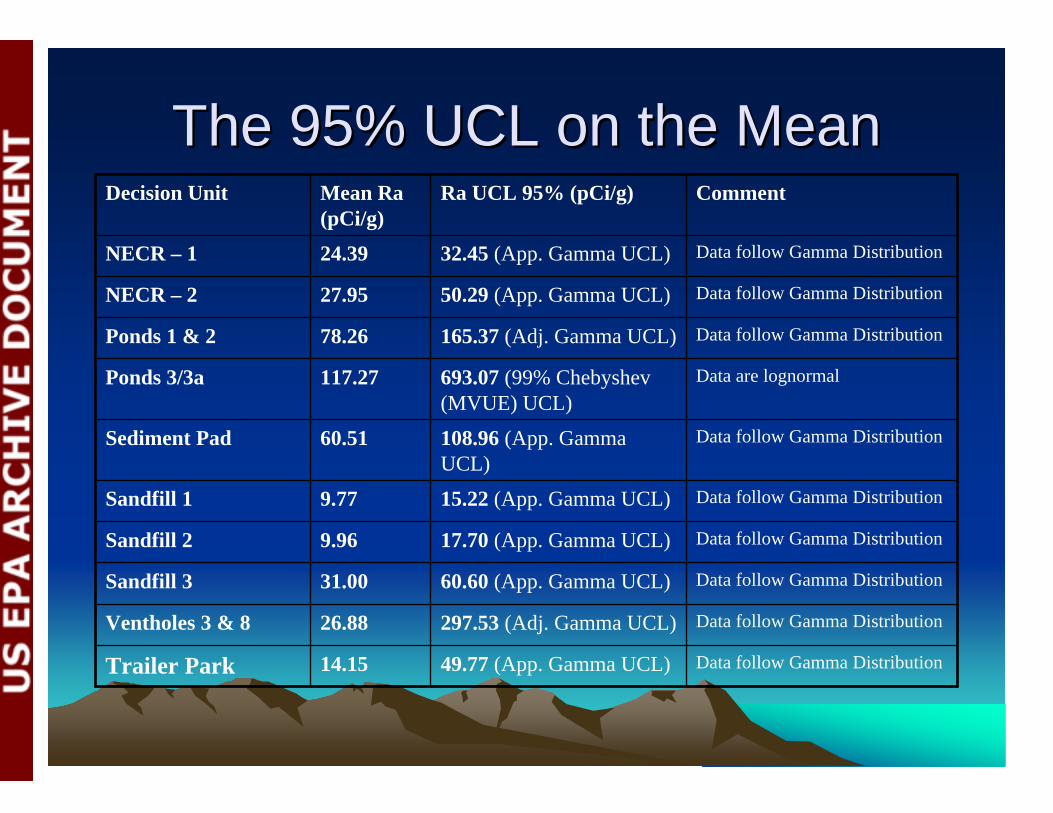
Data follow Gamma Distribution49.77 (App. Gamma UCL)14.15Trailer Park
Data follow Gamma Distribution297.53 (Adj. Gamma UCL)26.88Ventholes 3 & 8
Data follow Gamma Distribution60.60 (App. Gamma UCL)31.00Sandfill 3
Data follow Gamma Distribution17.70 (App. Gamma UCL)9.96Sandfill 2
Data follow Gamma Distribution15.22 (App. Gamma UCL)9.77Sandfill 1
Data follow Gamma Distribution108.96 (App. Gamma UCL)
60.51Sediment Pad
Data are lognormal693.07 (99% Chebyshev(MVUE) UCL)
117.27Ponds 3/3a
Data follow Gamma Distribution165.37 (Adj. Gamma UCL)78.26Ponds 1 & 2
Data follow Gamma Distribution50.29 (App. Gamma UCL)27.95NECR – 2
Data follow Gamma Distribution32.45 (App. Gamma UCL)24.39NECR – 1
CommentRa UCL 95% (pCi/g)Mean Ra (pCi/g)
Decision Unit
The 95% UCL on the Mean The 95% UCL on the Mean
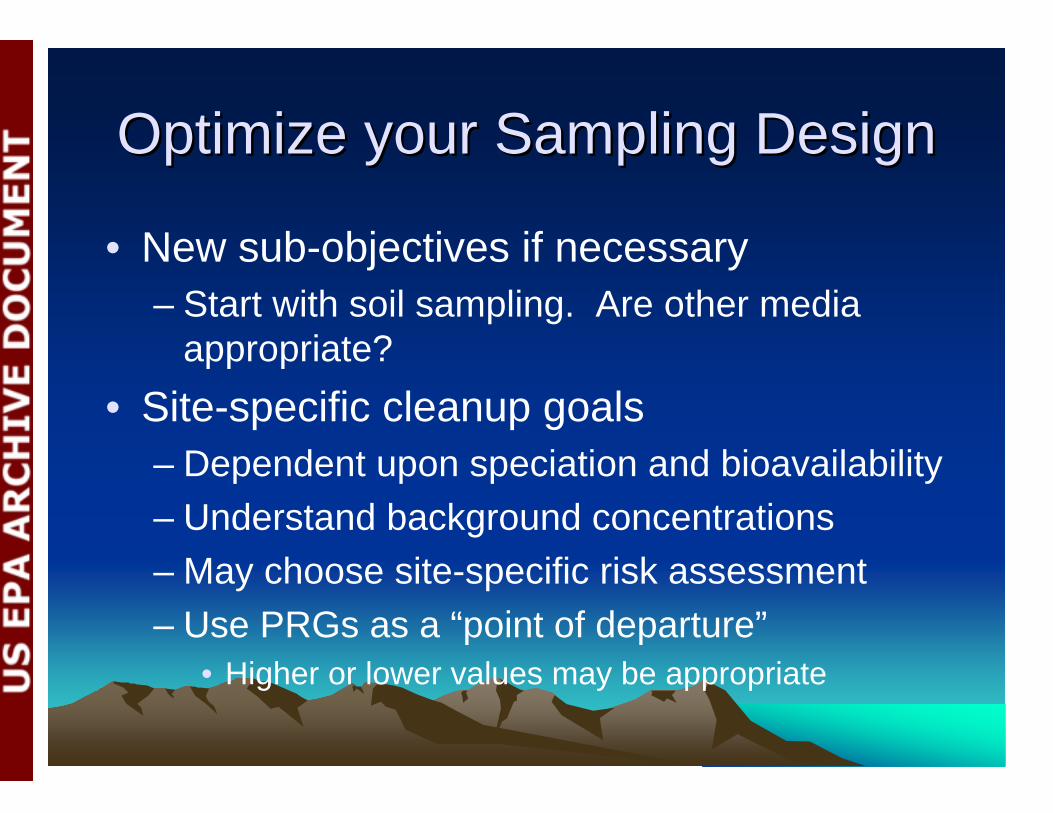
Optimize your Sampling DesignOptimize your Sampling Design
• New sub-objectives if necessary– Start with soil sampling. Are other media
appropriate?• Site-specific cleanup goals
– Dependent upon speciation and bioavailability– Understand background concentrations – May choose site-specific risk assessment – Use PRGs as a “point of departure”
• Higher or lower values may be appropriate
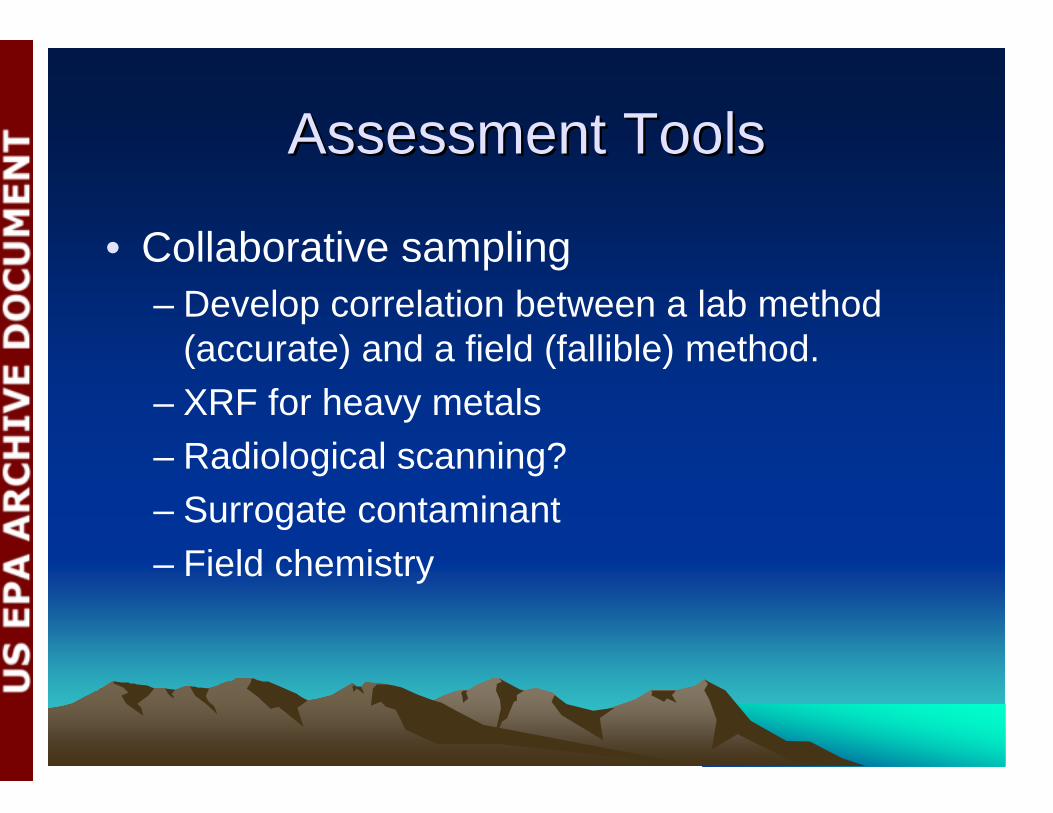
Assessment ToolsAssessment Tools
• Collaborative sampling– Develop correlation between a lab method
(accurate) and a field (fallible) method.– XRF for heavy metals– Radiological scanning?– Surrogate contaminant– Field chemistry

Collaborative SamplingCollaborative Sampling
• May improve cost-effectiveness of sampling require a large number of samples, some may be replaced with less expensive measurements
• Assumes– Lab-based measurements are more expensive (n)– Field-based measurements are less expensive (n/)– A strong-linear relationship exists between the two-
types of measurements (constant residual variance r2
value)– Mean is normally distributed
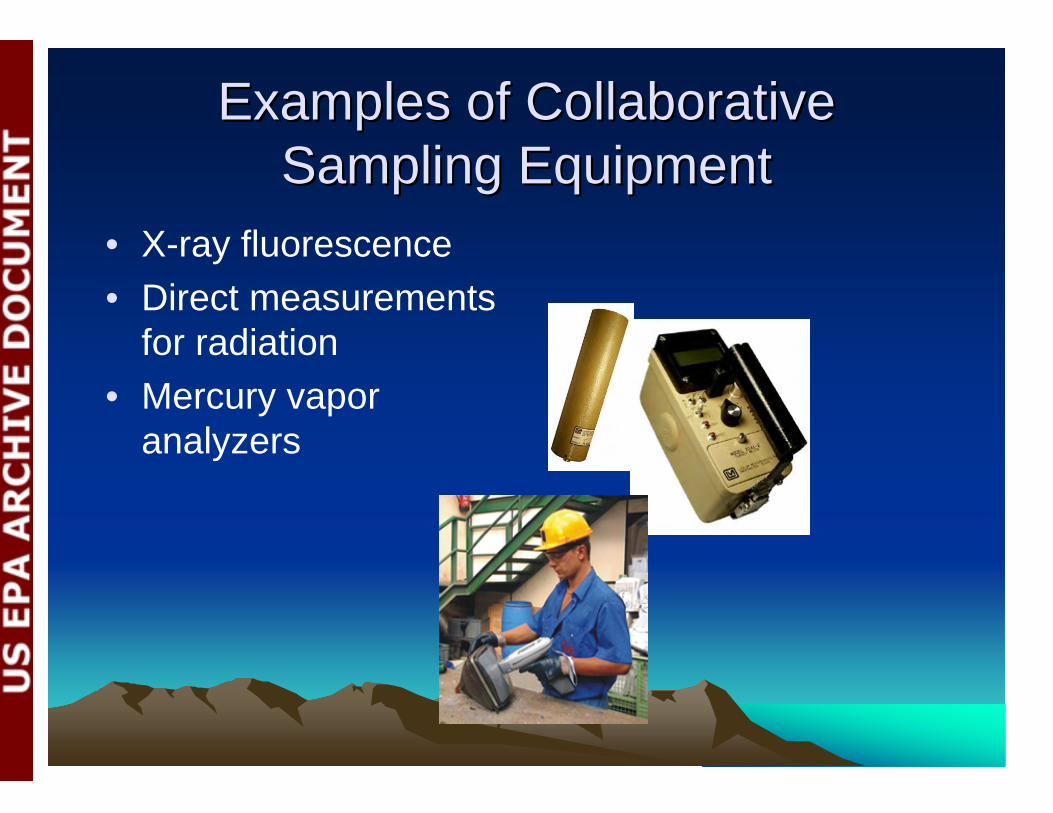
Examples of Collaborative Examples of Collaborative Sampling EquipmentSampling Equipment
• X-ray fluorescence• Direct measurements
for radiation• Mercury vapor
analyzers
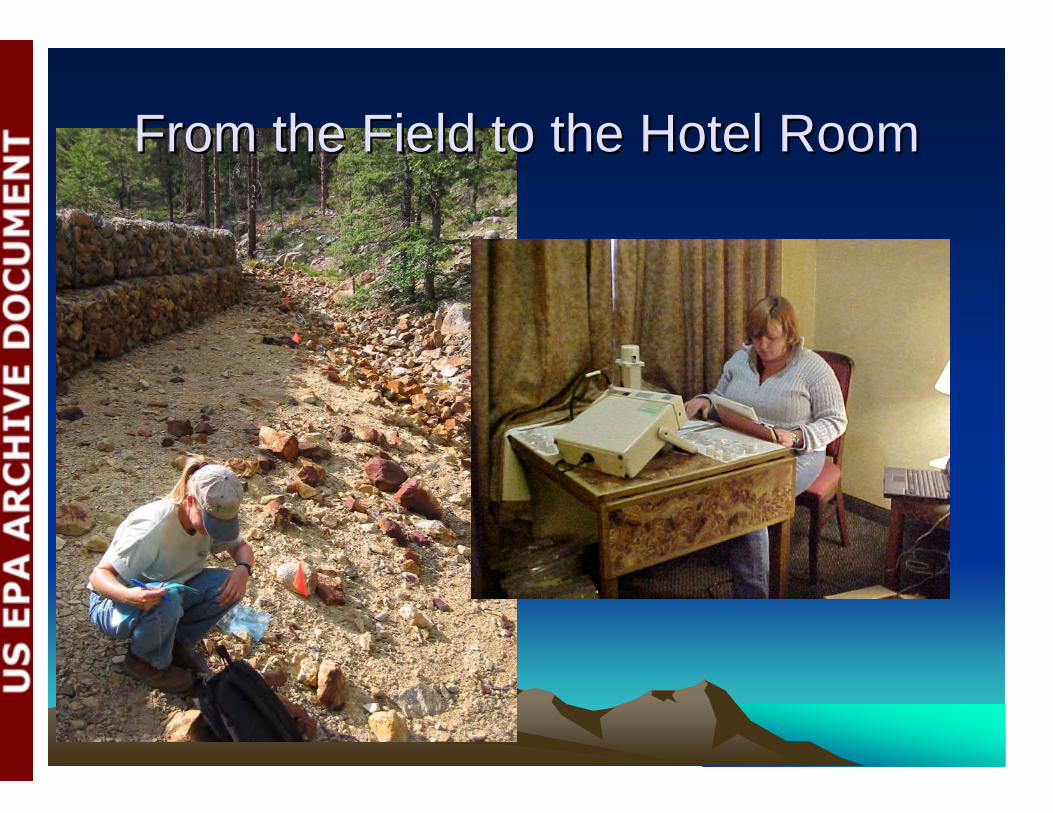
From the Field to the Hotel RoomFrom the Field to the Hotel Room
Assessment Tools ContinuedAssessment Tools Continued
• Specialty sampling and analysis– Consider metal speciation (e- microprobe analysis)– Consider bioavailability (in-vivo literature/in-vitro tests
(PBET))– Consider leachability & or mobility testing (SPLP
tests, Kd values)– Consider soil health, erosion parameters (TOC, bulk
density) & rainfall intensity– Geotechnical testing (compaction, slope)– Treatability testing

Correlation?Correlation?Lead in soil correlation
R2 = 0.9731
020406080
100120140160180200
0 100 200 300 400Field (Fallible) Data
Lab
Dat
a
What is bioavailability?What is bioavailability?
• Bioavailability is the relative absorption of a chemical into the blood.– Risk assessment and cleanup goal
determinations are typically based on animal toxicity data and epidemiological data
– Absorption is dependent on chemical and physical form of the contaminant (e.g., species)

Bioavailability of MineralsBioavailability of Minerals
INCREASING BIOAVAILABILITY
Quartz
FeAsS Quartz
Pb-Asoxides
Slag
Fe-Asoxides
Fe-Pb oxides
PbCO3
SlagPbO
PbAsO4 Pb 0
PbO
Quartz or SilicatePbCO3
PbS
INCREASING BIOAVAILABILITY
Arsenic or lead-containing particles (idealized particle size <1,000µm)
Arsenic minerals
Lead minerals
(modified from Ruby et al. 1999)

Examples of varying risk related to Examples of varying risk related to mine mineralsmine minerals
7 in 100,0006.90E-054 in 1,000,0003.60E-06Total
6 in 100,0005.70E-053 in 1,000,0002.60E-06Inhalation
1 in 100,0001.20E-0510 in 10,000,0009.70E-07IngestionSmelter community
3 in 100,0002.80E-054 in 1,000,0003.60E-06Total
3 in 100,0002.60E-053 in 1,000,0002.60E-06Inhalation
2 in 1,000,0001.90E-0610 in 10,000,000 9.70E-07IngestionMining community
IndoorOutdoor
(Adapted from Murphy et al.1989)
Risk of exposure to 500 mg/kg arsenic in soil and 0.01 mg/m3 arsenic in air over a lifetime
Reconsidering Cleanup GoalsReconsidering Cleanup Goals
• Bioavailability in risk assessment– Removal objectives use Preliminary Remediation
Goals (PRGs) for decision making in the “risk range”of contaminant concentrations
– PRGs may not be an appropriate measure of risk at a mine site
• Total metals may not be bioavailable• Risk assessment modeling traditionally assumes 80 to 100%
absorption
• Consult your toxicologist
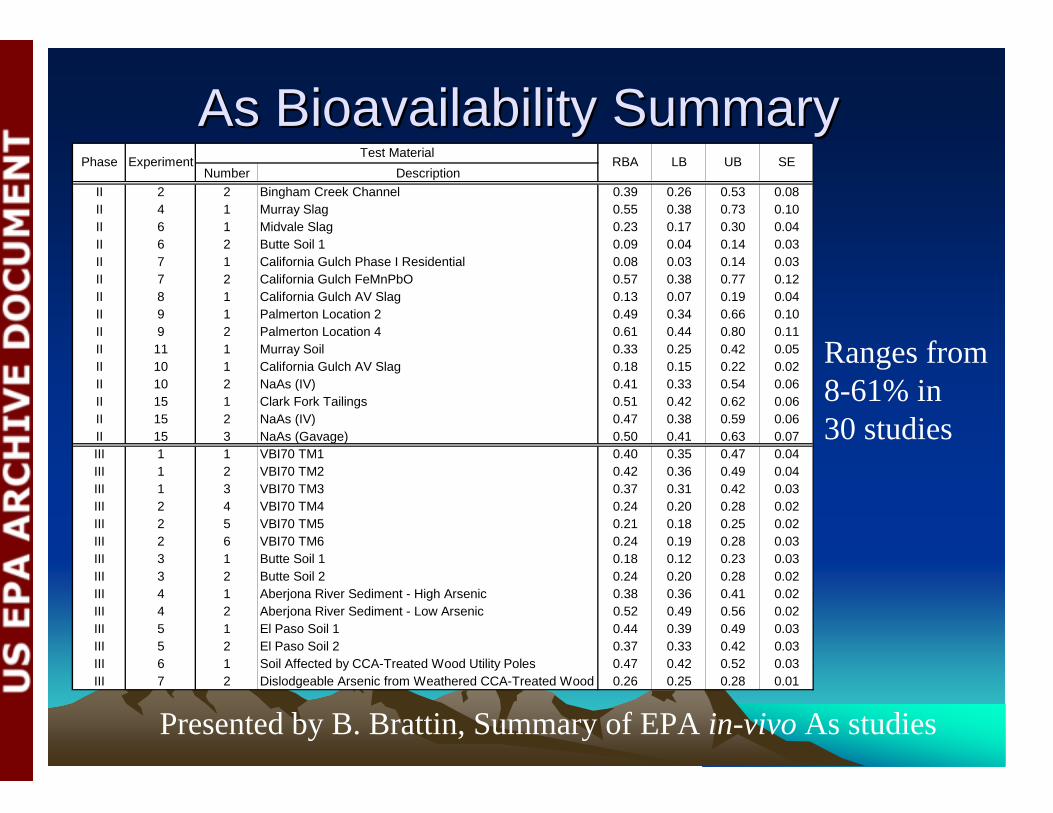
As Bioavailability SummaryAs Bioavailability SummaryNumber Description
II 2 2 Bingham Creek Channel 0.39 0.26 0.53 0.08II 4 1 Murray Slag 0.55 0.38 0.73 0.10II 6 1 Midvale Slag 0.23 0.17 0.30 0.04II 6 2 Butte Soil 1 0.09 0.04 0.14 0.03II 7 1 California Gulch Phase I Residential 0.08 0.03 0.14 0.03II 7 2 California Gulch FeMnPbO 0.57 0.38 0.77 0.12II 8 1 California Gulch AV Slag 0.13 0.07 0.19 0.04II 9 1 Palmerton Location 2 0.49 0.34 0.66 0.10II 9 2 Palmerton Location 4 0.61 0.44 0.80 0.11II 11 1 Murray Soil 0.33 0.25 0.42 0.05II 10 1 California Gulch AV Slag 0.18 0.15 0.22 0.02II 10 2 NaAs (IV) 0.41 0.33 0.54 0.06II 15 1 Clark Fork Tailings 0.51 0.42 0.62 0.06II 15 2 NaAs (IV) 0.47 0.38 0.59 0.06II 15 3 NaAs (Gavage) 0.50 0.41 0.63 0.07III 1 1 VBI70 TM1 0.40 0.35 0.47 0.04III 1 2 VBI70 TM2 0.42 0.36 0.49 0.04III 1 3 VBI70 TM3 0.37 0.31 0.42 0.03III 2 4 VBI70 TM4 0.24 0.20 0.28 0.02III 2 5 VBI70 TM5 0.21 0.18 0.25 0.02III 2 6 VBI70 TM6 0.24 0.19 0.28 0.03III 3 1 Butte Soil 1 0.18 0.12 0.23 0.03III 3 2 Butte Soil 2 0.24 0.20 0.28 0.02III 4 1 Aberjona River Sediment - High Arsenic 0.38 0.36 0.41 0.02III 4 2 Aberjona River Sediment - Low Arsenic 0.52 0.49 0.56 0.02III 5 1 El Paso Soil 1 0.44 0.39 0.49 0.03III 5 2 El Paso Soil 2 0.37 0.33 0.42 0.03III 6 1 Soil Affected by CCA-Treated Wood Utility Poles 0.47 0.42 0.52 0.03III 7 2 Dislodgeable Arsenic from Weathered CCA-Treated Wood 0.26 0.25 0.28 0.01
RBA LB UB SEPhase ExperimentTest Material
Presented by B. Brattin, Summary of EPA in-vivo As studies
Ranges from 8-61% in 30 studies
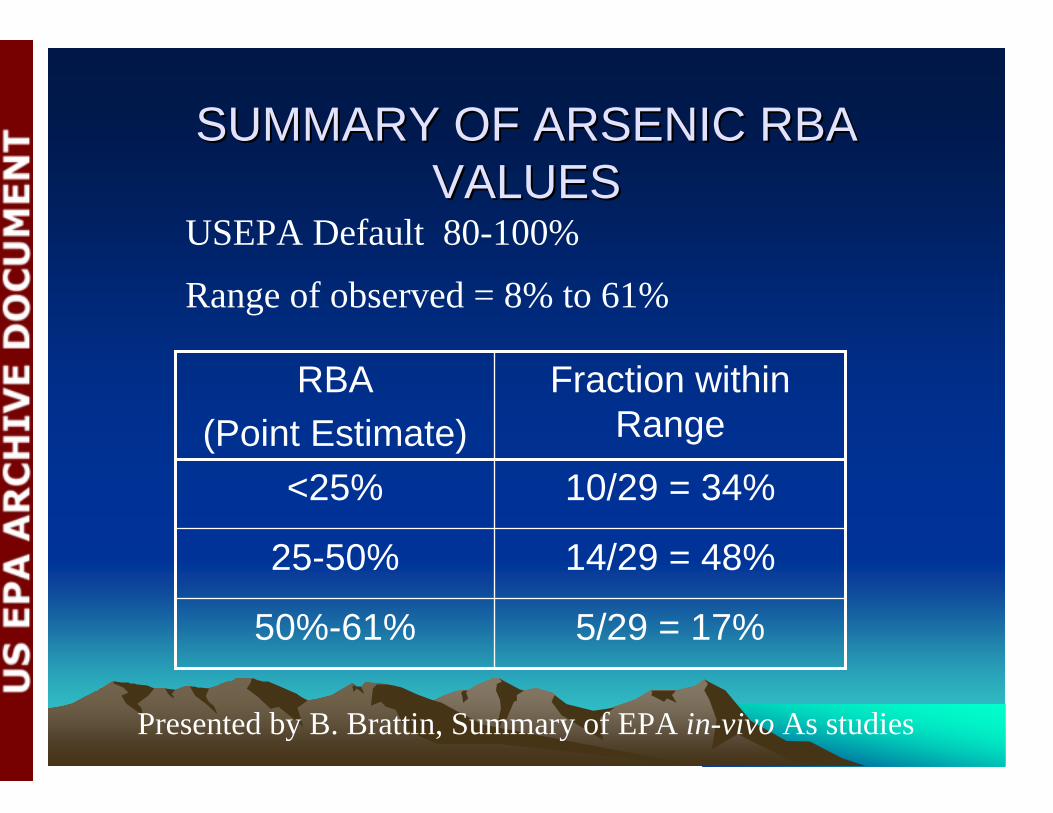
SUMMARY OF ARSENIC RBA SUMMARY OF ARSENIC RBA VALUESVALUES
5/29 = 17%50%-61%
14/29 = 48%25-50%
10/29 = 34%<25%
Fraction within Range
RBA(Point Estimate)
USEPA Default 80-100%
Range of observed = 8% to 61%
Presented by B. Brattin, Summary of EPA in-vivo As studies

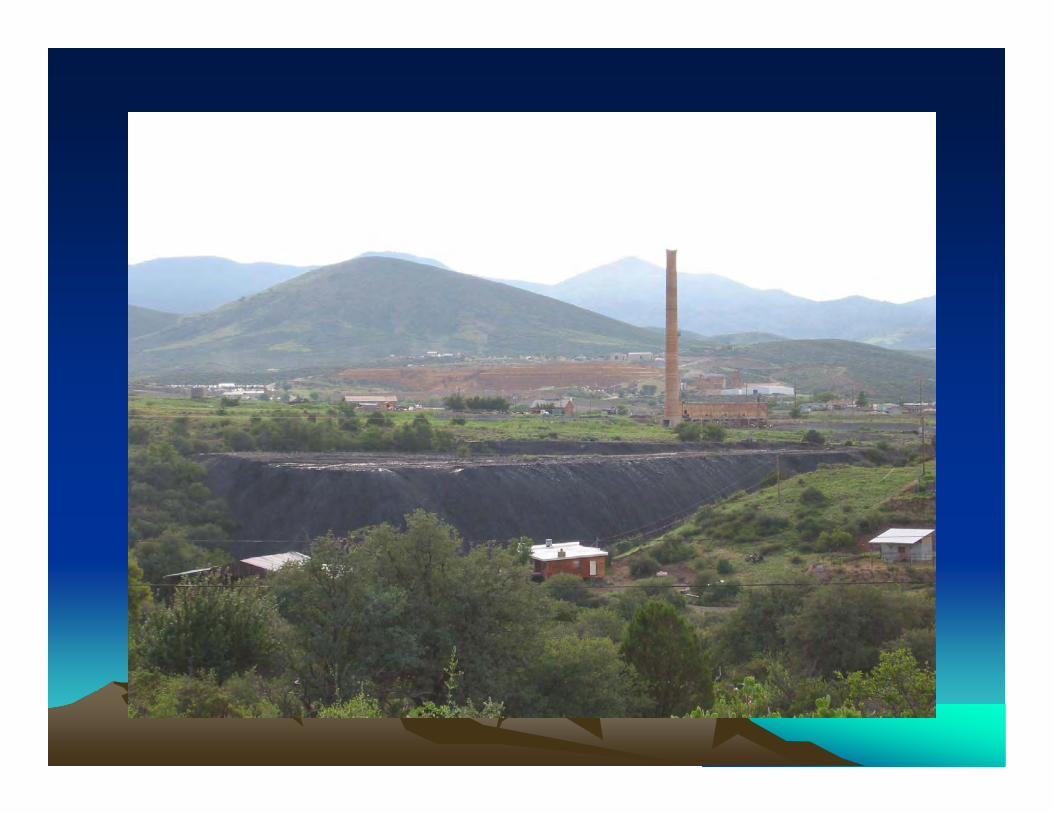
Iron King Mine SiteIron King Mine Site
• Iron King Mine Site is a large mine and smelter in Humboldt, AZ
• Runoff and erosion from the mine contaminated neighboring residences with arsenic– Arsenic is high in the region (above state and
EPA guidelines for cleanup)
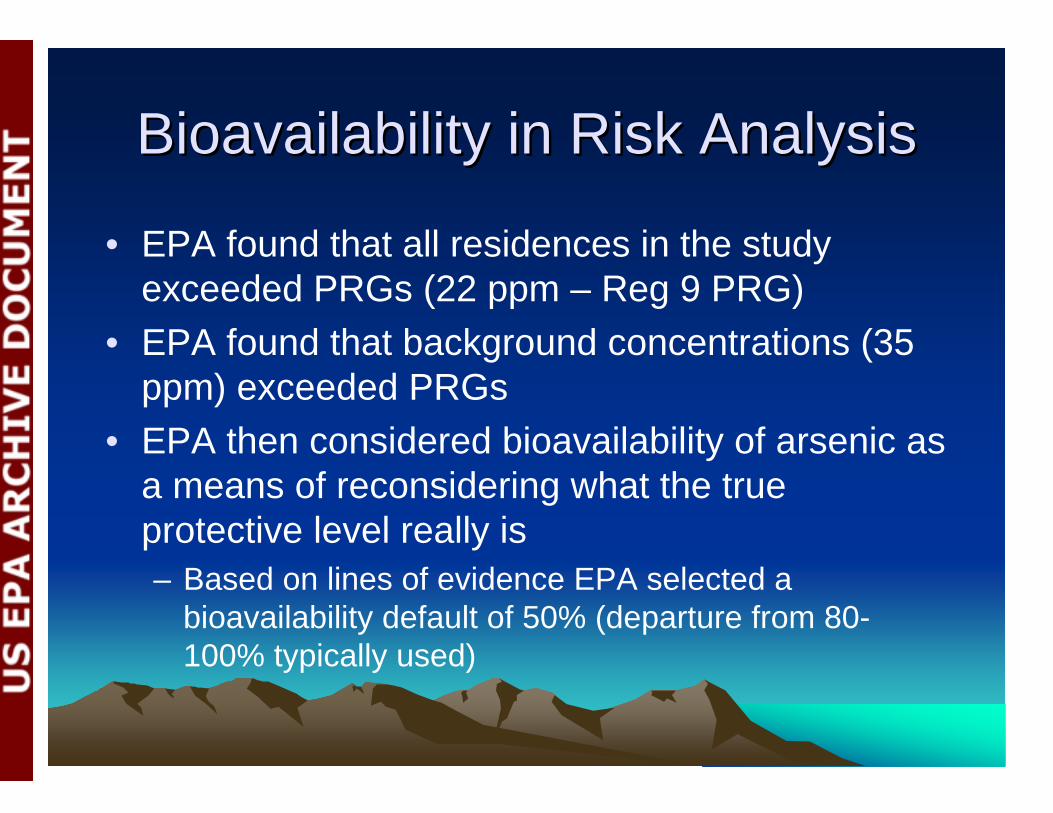
Bioavailability in Risk AnalysisBioavailability in Risk Analysis
• EPA found that all residences in the study exceeded PRGs (22 ppm – Reg 9 PRG)
• EPA found that background concentrations (35 ppm) exceeded PRGs
• EPA then considered bioavailability of arsenic as a means of reconsidering what the true protective level really is– Based on lines of evidence EPA selected a
bioavailability default of 50% (departure from 80-100% typically used)

Arsenic in Arsenic in IroniteIronite??
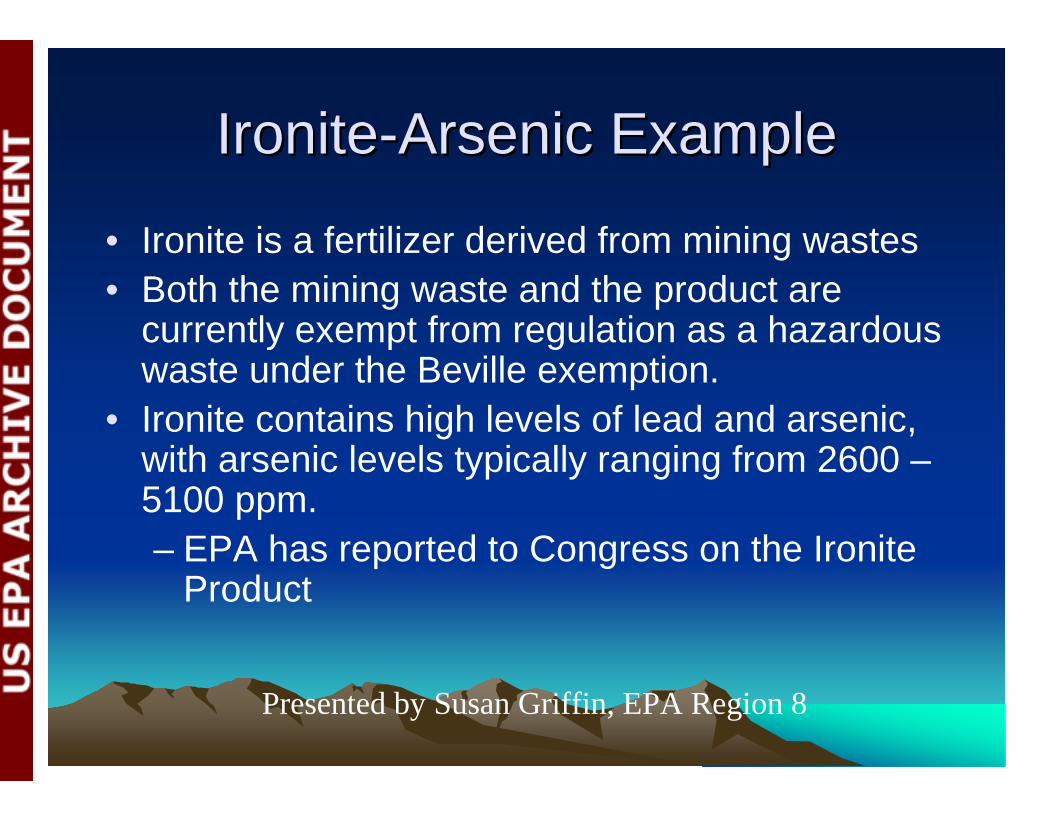
IroniteIronite--Arsenic ExampleArsenic Example
• Ironite is a fertilizer derived from mining wastes• Both the mining waste and the product are
currently exempt from regulation as a hazardous waste under the Beville exemption.
• Ironite contains high levels of lead and arsenic, with arsenic levels typically ranging from 2600 –5100 ppm.– EPA has reported to Congress on the Ironite
Product
Presented by Susan Griffin, EPA Region 8
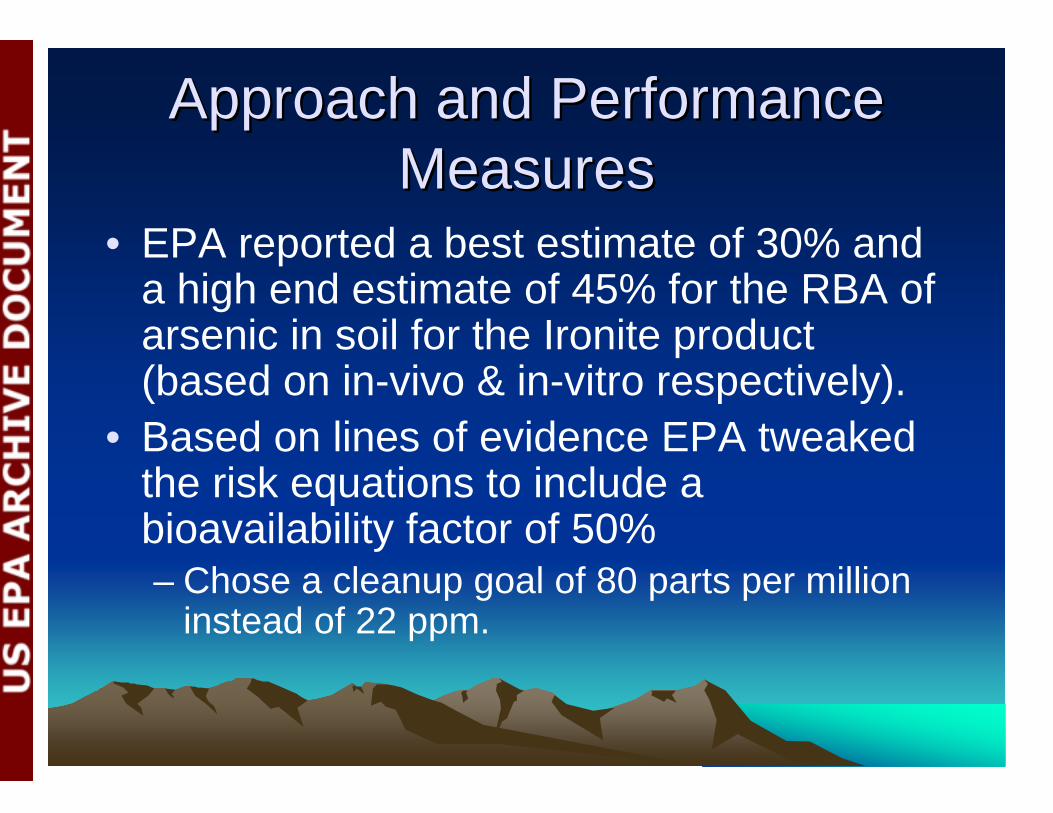
Approach and Performance Approach and Performance MeasuresMeasures
• EPA reported a best estimate of 30% and a high end estimate of 45% for the RBA of arsenic in soil for the Ironite product (based on in-vivo & in-vitro respectively).
• Based on lines of evidence EPA tweaked the risk equations to include a bioavailability factor of 50%– Chose a cleanup goal of 80 parts per million
instead of 22 ppm.
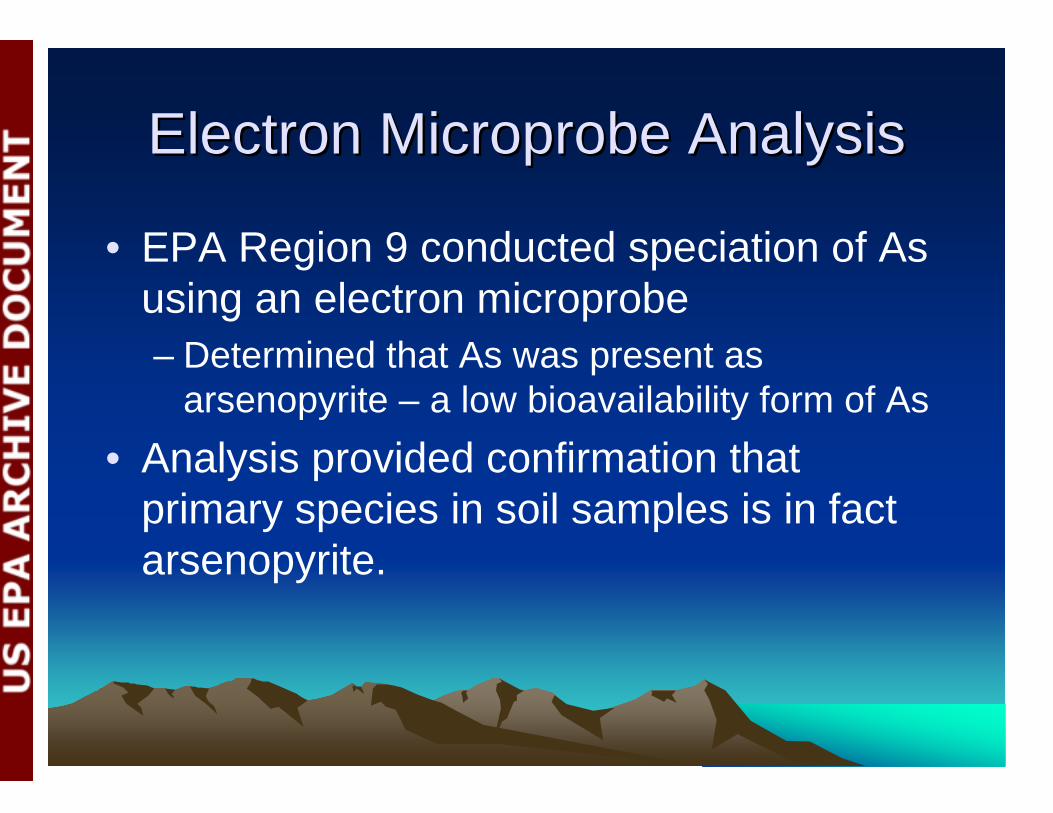
Electron Microprobe AnalysisElectron Microprobe Analysis
• EPA Region 9 conducted speciation of As using an electron microprobe– Determined that As was present as
arsenopyrite – a low bioavailability form of As• Analysis provided confirmation that
primary species in soil samples is in fact arsenopyrite.
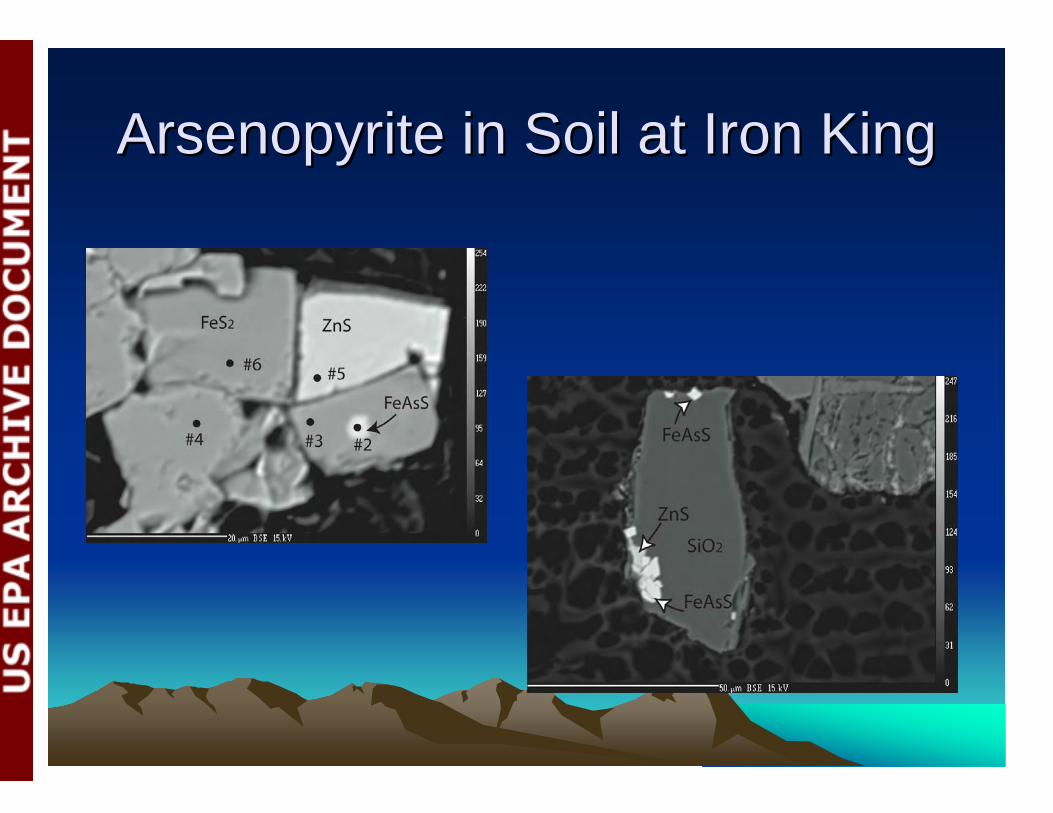
ArsenopyriteArsenopyrite in Soil at Iron Kingin Soil at Iron King