Embed Size (px)
Citation preview
URBANIZATION AND EMERGING POPULATION ISSUESWORKING PAPER 8
Urbanisation and Developmentin South Africa: Economic Imperatives, Spatial Distortions and Strategic Responses
by IVAN TUROK
OCTOBER 2012
POPULATION AND DEVELOPMENT BRANCH
INTERNATIONAL INSTITUTE FOR ENVIRONMENT AND DEVELOPMENT UNITED NATIONS POPULATION FUND
HUMAN SETTLEMENTS GROUP
i
Urbanisation and Development in South Africa: Economic Imperatives, Spatial Distortions and Strategic
Responses
Professor Ivan Turok
October 2012
ii
ABOUT THE AUTHOR Ivan Turok has researched and written extensively on urban and regional development and policy in the global north and south. He is an expert adviser to the United Nations, OECD, European Commission, SA Government, UK Government and African Development Bank, and is a board member of the Regional Studies Association. Ivan was the principal author of the 2011 State of South African Cities Report. Other co-authored and edited books include the State of English Cities (2006), Changing Cities: Rethinking Urban Competitiveness, Cohesion and Governance (2005), Twin Track Cities (2005), The Jobs Gap in Britain’s Cities (1999) and The Coherence of EU Regional Policy (1997). Ivan Turok Deputy Executive Director Human Sciences Research Council Private Bag X9182, Cape Town 8000 Honorary Professor, University of Cape Town, SA Honorary Professor, University of Glasgow, UK [email protected] ACKNOWLEDGEMENTS The paper draws on research undertaken for the 2011 State of South African Cities Report. Considerable thanks are due to the South African Cities Network for supporting that work. I am also grateful to Gerbrand Mans of the CSIR for his generous support in drawing the density maps, and to Rehema Msulwa and Debbie Budlender for assistance with the data analysis. Thanks are also due to the reviewers for their constructive comments on the draft report. © IIED 2012 Human Settlements Group International Institute for Environment and Development (IIED) 80-86 Gray’s Inn Road London WC1X 8NH, UK Tel: 44 20 3463 7399 Fax: 44 20 3514 9055
ISBN: 978-1-84369-890-6 This paper can be downloaded free of charge from http://pubs.iied.org/10621IIED.html. A printed version of this paper is also available from Earthprint for US$20 (www.earthprint.com). Disclaimer: The findings, interpretations and conclusions expressed here do not represent the views of any organisations that have provided institutional, organisational or financial support for the preparation of this paper.
iii
CONTENTS Summary ................................................................................................................................... 1 1. Introduction ............................................................................................................................ 3 2. The history of urbanisation: qualified support, to restraint, to ambiguity .................................. 4 3. Economic drivers of urbanisation ..........................................................................................15 4. The consequences of urbanisation for settlement patterns ....................................................21 5. The consequences of urbanisation for informal settlements ..................................................28 6. The location of planned new housing development ...............................................................32 7. The role of the urban transport system ..................................................................................33 8. The responsiveness of city government ................................................................................36 9. Explanations for the lack of urban integration ........................................................................39 10. Devolving built-environment functions to the metros ...........................................................46 11. An assessment of the prospects for devolution ...................................................................47 12. Conclusion ..........................................................................................................................49 References ...............................................................................................................................51 Recent Publications by IIED’s Human Settlements Group .......... Error! Bookmark not defined. FIGURES and TABLES Table 1: Urban population of South Africa, 1911–2001 ............................................................. 3 Figure 1: Urban share of the national population (%), 1911–2001 ............................................. 4 Figure 2: Total population of urban and rural areas in South Africa, 1950–2050 ......................10 Figure 3: South Africa’s urban population and its growth rate, 1950–2050 ...............................12 Figure 4: Sub-Saharan Africa’s urban population and its growth rate, 1950–2050 ...................13 Figure 5: Population composition of different types of area, 1995 and 2010 .............................14 Figure 6: Share of total GVA in South Africa, 2009 ..................................................................15 Figure 7: Gross Value Added per capita, 2010 (Rand, 2005 prices) .........................................16 Figure 8: Index of employment by type of area, 1995–2010 .....................................................17 Figure 9: Main source of household income, 2002 and 2010 ...................................................18 Table 2: Basic differences in urban form ..................................................................................23 Figure 10: Population density across Cape Town, 2001 ...........................................................24 Figure 11: Population density across eThekwini, 2001 .............................................................26 Figure 12: Population density across Gauteng, 2001 ...............................................................27 Figure 13: Percentage of households living in informal dwellings, 2002 and 2010 ...................29 Figure 14: Percentage of households with access to piped water, 2002 and 2010 ...................30 Figure 15: Percentage of households with bucket toilets or no toilets, 2002 and 2010 .............31 Figure 16: Percentage of households with access to electricity, 2002 and 2010 ......................32 Figure 17: Major service-delivery protests, 2004–2010 ............................................................37 Figure 18: Major service-delivery protests by municipality, 2004–2010 ....................................37 Figure 19: Gini coefficient for urban areas of selected sub-Saharan countries .........................42

1
Summary This paper outlines the experience of urbanisation in South Africa, which is now one of the most populous and urbanised countries in Africa. For over a century, urbanisation has been a source of controversy posing dilemmas for successive governments and resulting in wide-ranging interventions to control it in various ways. In the late 19th and early 20th centuries, a distinctive form of racially segregated urban development was put in place, reflecting the needs of the economy for cheap migrant labour to support rapid industrialisation, but political nervousness about permanent rural-to-urban migration. After the Second World War, political considerations dominated and increasingly draconian controls were imposed to suppress black urbanisation in order to sustain white lifestyles and political domination. Their main effect was to fracture the physical form of cities and disrupt the lives of black residents through forcing them to the periphery. With the demise of apartheid, these repressive controls have been withdrawn, causing a recovery in the rate of urbanisation. The post-1994 government has sought to be even-handed in its treatment of cities, towns and rural areas, with no explicit policy either to support or to discourage migration because of its sensitivity and perceived negative effects on both sending and receiving areas. This neutral stance has avoided the serious social damage of the past, but relatively little has been done positively to overcome the legacy of segregation within urban areas. Similarly, the pursuit of economic investment in cities is not as vigorous as in many other countries. Ambiguity towards urbanisation also translates into a reactive, indifferent and sometimes hostile approach towards informal settlements and backyard shacks. In short, there is no consistent national policy for planning and managing the present and significant process of urbanisation. The low-density, fragmented form of South African cities has harmful social, economic and environmental consequences. It creates poverty traps on the periphery and favours road-based transport – private cars and minibus taxis. Cities are the dominant centres of economic activity and jobs, and continue to attract most foreign investment, but they are not performing to their potential or reaping the benefits of agglomeration because of shortages of energy and water infrastructure, transport congestion and shortfalls in education and skills. The post-1994 government recognises the problems of a distorted urban form, but its policies have been too short term and sector-specific to bring about significant settlement restructuring. Indeed, some of the pro-poor policies have reinforced people’s exclusion by subsidising the cost of living on the periphery, rather than supporting better location decisions. Institutional transformation has resulted in the loss of technical capacity across government, which has affected cities’ ability to manage their growth effectively and to create the conditions for economic expansion. There are several new initiatives emerging that may facilitate more coherent urban development in future. These include a more flexible and responsive housing policy, and a commitment to devolve public transport functions to the cities to facilitate integration with investment in the built environment and more compact forms of development. South Africa’s experience since 1994 holds important lessons for other countries undergoing urban transition. Formulating progressive policies, passing laws and creating city-wide municipal institutions are not enough to harness the potential of urbanisation and to ensure integrated urban development. Broad policy aspirations and sectoral programmes need to be translated into focused city-level strategies that deliberately align housing, transport, land-use and economic decisions within a long-term vision of a better future. Such strategies also need to
2
engage local communities, the private sector and other stakeholders, in order to channel their energies in common and constructive directions. A broader lesson from South Africa’s historic experience is that the processes of urbanisation and industrialisation are politically mediated and may not automatically improve the livelihoods of rural migrants. People moving to cities may have to organise themselves to press for the removal of barriers that prevent them from securing better living and working conditions through access to urban labour markets and well-located land on which to settle. The creation of constitutional rights for the poor can help to promote their cause, especially if backed by political will and sufficient government resources to meet their basic needs. Equally important are determined city-level leadership and investment plans to manage urban development more effectively, to boost jobs and livelihoods, and to work with poorer communities to improve essential services.
3
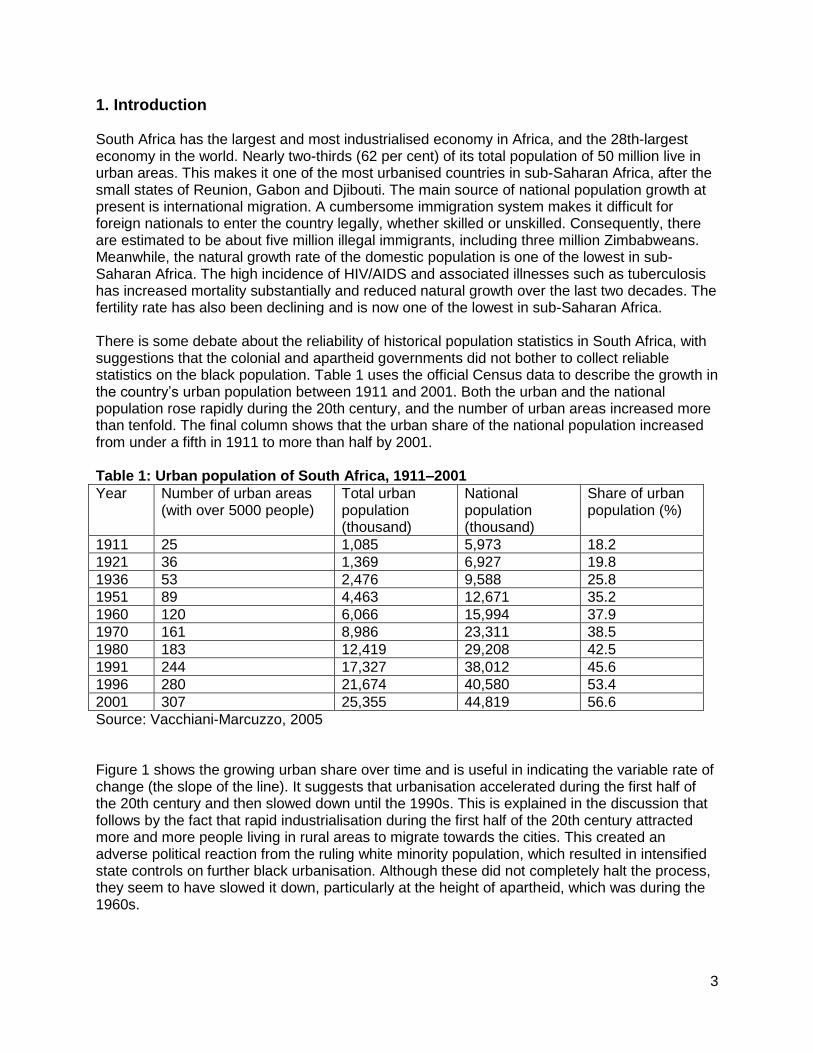
1. Introduction South Africa has the largest and most industrialised economy in Africa, and the 28th-largest economy in the world. Nearly two-thirds (62 per cent) of its total population of 50 million live in urban areas. This makes it one of the most urbanised countries in sub-Saharan Africa, after the small states of Reunion, Gabon and Djibouti. The main source of national population growth at present is international migration. A cumbersome immigration system makes it difficult for foreign nationals to enter the country legally, whether skilled or unskilled. Consequently, there are estimated to be about five million illegal immigrants, including three million Zimbabweans. Meanwhile, the natural growth rate of the domestic population is one of the lowest in sub-Saharan Africa. The high incidence of HIV/AIDS and associated illnesses such as tuberculosis has increased mortality substantially and reduced natural growth over the last two decades. The fertility rate has also been declining and is now one of the lowest in sub-Saharan Africa. There is some debate about the reliability of historical population statistics in South Africa, with suggestions that the colonial and apartheid governments did not bother to collect reliable statistics on the black population. Table 1 uses the official Census data to describe the growth in the country’s urban population between 1911 and 2001. Both the urban and the national population rose rapidly during the 20th century, and the number of urban areas increased more than tenfold. The final column shows that the urban share of the national population increased from under a fifth in 1911 to more than half by 2001. Table 1: Urban population of South Africa, 1911–2001
Year Number of urban areas (with over 5000 people)
Total urban population (thousand)
National population (thousand)
Share of urban population (%)
1911 25 1,085 5,973 18.2
1921 36 1,369 6,927 19.8
1936 53 2,476 9,588 25.8
1951 89 4,463 12,671 35.2
1960 120 6,066 15,994 37.9
1970 161 8,986 23,311 38.5
1980 183 12,419 29,208 42.5
1991 244 17,327 38,012 45.6
1996 280 21,674 40,580 53.4
2001 307 25,355 44,819 56.6
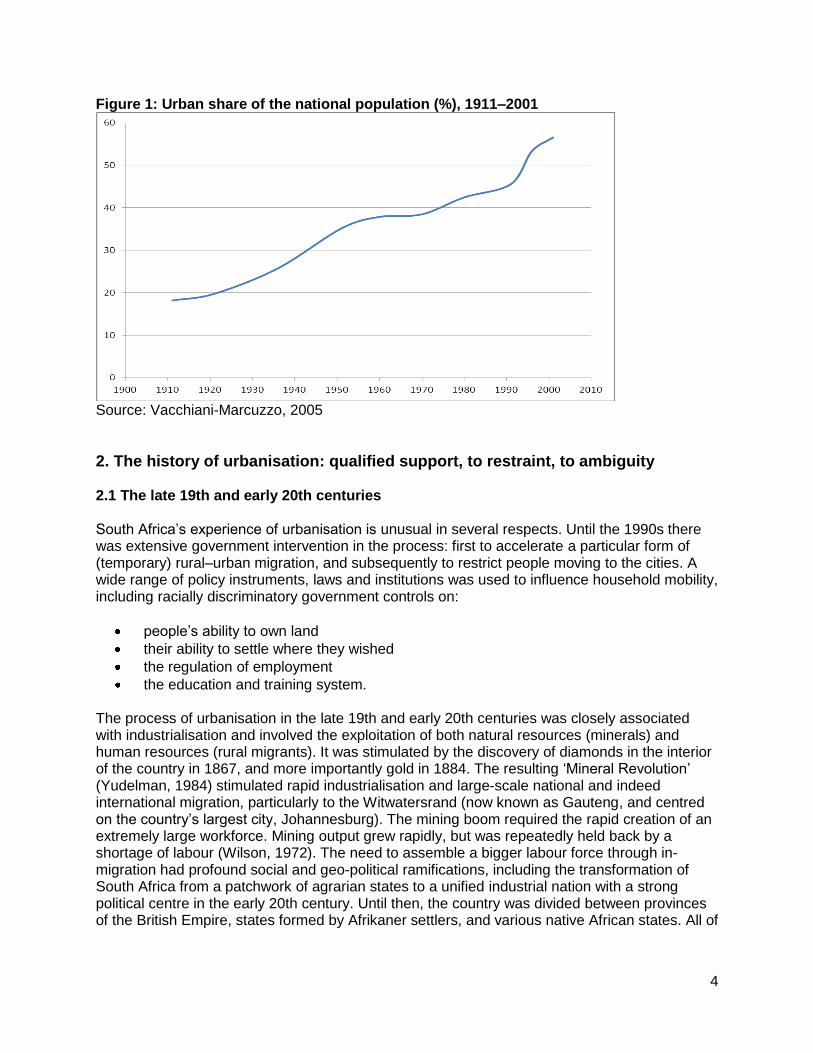
Source: Vacchiani-Marcuzzo, 2005 Figure 1 shows the growing urban share over time and is useful in indicating the variable rate of change (the slope of the line). It suggests that urbanisation accelerated during the first half of the 20th century and then slowed down until the 1990s. This is explained in the discussion that follows by the fact that rapid industrialisation during the first half of the 20th century attracted more and more people living in rural areas to migrate towards the cities. This created an adverse political reaction from the ruling white minority population, which resulted in intensified state controls on further black urbanisation. Although these did not completely halt the process, they seem to have slowed it down, particularly at the height of apartheid, which was during the 1960s.
4
Figure 1: Urban share of the national population (%), 1911–2001
Source: Vacchiani-Marcuzzo, 2005
2. The history of urbanisation: qualified support, to restraint, to ambiguity 2.1 The late 19th and early 20th centuries South Africa’s experience of urbanisation is unusual in several respects. Until the 1990s there was extensive government intervention in the process: first to accelerate a particular form of (temporary) rural–urban migration, and subsequently to restrict people moving to the cities. A wide range of policy instruments, laws and institutions was used to influence household mobility, including racially discriminatory government controls on:
people’s ability to own land
their ability to settle where they wished
the regulation of employment
the education and training system. The process of urbanisation in the late 19th and early 20th centuries was closely associated with industrialisation and involved the exploitation of both natural resources (minerals) and human resources (rural migrants). It was stimulated by the discovery of diamonds in the interior of the country in 1867, and more importantly gold in 1884. The resulting ‘Mineral Revolution’ (Yudelman, 1984) stimulated rapid industrialisation and large-scale national and indeed international migration, particularly to the Witwatersrand (now known as Gauteng, and centred on the country’s largest city, Johannesburg). The mining boom required the rapid creation of an extremely large workforce. Mining output grew rapidly, but was repeatedly held back by a shortage of labour (Wilson, 1972). The need to assemble a bigger labour force through in-migration had profound social and geo-political ramifications, including the transformation of South Africa from a patchwork of agrarian states to a unified industrial nation with a strong political centre in the early 20th century. Until then, the country was divided between provinces of the British Empire, states formed by Afrikaner settlers, and various native African states. All of
5
these territories were dominated by farming cattle or cash crops such as sugar, coffee and wine. During the 19th century, urban areas were few in number and small in size. The mining boom stimulated industrialisation and urbanisation in various ways. Once the surface deposits of diamonds were removed by small diggers, the excavation of deep deposits required machinery (particularly steam engines), credit and a large workforce. Consequently, the diamond mines at Kimberley were quickly taken over by bigger foreign companies with access to these resources, such as De Beers. The discovery of gold in the Witwatersrand greatly escalated this trend and was accompanied by the growth of major corporations, such as Anglo American and Consolidated Gold Fields. Large-scale mining also provoked the development of a wide range of support industries and services, such as chemicals (explosives for mining operations) and civil and mechanical engineering. Gold mining remained the mainstay of the South African economy for decades, and was almost the only source of export revenues. In the 1930s the gold mines were estimated to account for 50 per cent of state tax revenues, and as much as 50 per cent of the country’s population obtained its livelihood directly or indirectly from the mines (Yudelman, 1984). Major demographic shifts were an essential feature of the mining boom. Early on, most labour came from the African states and Mozambique on a temporary basis, establishing a pattern of ‘oscillating’ or ‘circular’ migration that would have huge significance for the country in later years (Wilson, 1972). Young men would travel to the mines during the summer to earn enough wages to buy status symbols, such as cattle or guns, before returning home. Agricultural production (mostly subsistence) remained significant in the sending areas until well into the 1930s, so families had some discretion about whether and when their men went to work in the mines (Yudelman and Jeeves, 1986). This voluntary system was not reliable enough to provide the expanding labour force required by the mining companies. Worker productivity was affected by the journey, and those who disliked the harsh working conditions drifted away. Extracting diamonds from rocks and processing low-quality gold ore were very labour-intensive and required growing armies of cheap unskilled workers. Very low wages were offered to ordinary labourers to sustain the mining profits and high wages of the skilled white workers, resulting in very poor living standards for black migrant workers. The migrant labour system played a vital role in depressing the wages of black workers for the mining corporations. Despite the enormous development of the mining industry between 1889 and 1969, it is remarkable that there was no real growth in black wages over this period (Wilson, 1972). The need to create a stable, growing workforce became the primary objective of the mining companies and the colonial government. They invested in various schemes to attract workers for longer periods and from further afield. Corporate agents travelled throughout the wider region offering fixed contracts and pre-arranged wages to attract young men to the mines. With constrained supplies from within South Africa (partly because of the low wages), increasing numbers of workers were recruited from neighbouring countries such as Mozambique, Malawi, Zimbabwe, Zambia and Botswana. Governments of these countries would release large numbers of their citizens only if the migration arrangement was temporary and if their families stayed at home. Companies also introduced large residential compounds or hostels to keep male migrant workers on site – a development that was to prove highly significant in later years. These closed complexes offered food, accommodation and cheap beer, but were also notorious for disease, malnutrition and cramped, squalid conditions. By 1900 there were 100,000 black workers living in mining compounds and by 1910 their number actually exceeded the entire white population of the Witwatersrand (Yudelman, 1984).
6
Growing rural–urban migration, gold exports and increasing urban demand for rural produce prompted investment in the country’s transport and communications infrastructure. Three railway lines were built in the 1890s to connect the Witwatersrand with commercial ports in Maputo, Durban and Cape Town, based largely on public finance. Other towns were also linked together and to the countryside, and ports such as Durban and Cape Town were expanded to cope with increasing immigration and commercial activity. One wave of immigration involved thousands of indentured workers from China who were needed to alleviate the labour shortage in the gold mines during the first decade of the 1900s. Another wave consisted of thousands of indentured Indian workers required for the sugar-cane plantations established by British settlers around Durban from the 1860s. The rate and dynamics of urbanisation in Cape Town and Durban were different from those in Witwatersrand because their economic bases were distinctive. Durban has always been the largest trans-shipment point for exports and imports to the interior, and developed related manufacturing and ship repair industries. It never had the administrative functions of other South African cities, so its rapid growth in the 20th century was based on transport, manufacturing and commercial activities. As the largest port by far, it was the logical place to establish industries that depended on imported inputs, such as chemicals, food and drink, paper, printing and engineering. Cape Town thrived as the economic and administrative hub of the Cape Colony, and subsequently the legislative capital of the Union and Republic of South Africa, with a diverse range of associated logistics, manufacturing, cultural, media, educational, property, financial and tourism activities. Cape Town also prospered as the home of head offices of important companies in retailing, financial services, business services and oil refining. The Mineral Revolution had a big impact on political developments. In order to secure a regular flow of workers to the mines, the colonial government began to annex neighbouring African states, such as Basutoland, Bechuanaland and Pediland. They introduced laws such as the Hut tax in these territories, which demanded that people paid an annual tax on their dwellings in British currency. The only way to earn this was by working in the mines, which created a steady stream of workers, who were effectively forced to migrate. Some of the wars at the time can also be traced to the mining boom. Britain wanted to control the entire region in order to remove potential threats to the mines and encourage industrial expansion. It sought to replace the slow and inexperienced Afrikaner bureaucracy with British laws and regulations, which led to increasing tension between the British colonies and Afrikaner states, resulting in the Anglo-Boer War in 1899–1902. This united South Africa as a single state under British control. The country was granted independence in 1910. The Mineral Revolution also had a profound impact on social relations, and formed the basis of the draconian apartheid system of legalised racial discrimination and subjugation. This dominated South African society and influenced urbanisation for a century through various forms of social control and ‘spatial engineering’ (Giraut and Vacchiani-Marcuzzo, 2009). One of its features was the ‘pass’ system, a means of registration which required blacks to carry a permit when moving around the country. It was designed to discourage labourers from breaking their employment contracts, and dated back as far as 1760 when slaves were first required to carry passes in moving between urban and rural areas. It was extended to control the movement of unskilled black workers to urban areas (‘influx control’) and to regulate many other aspects of the social relationships and interaction between races. The government’s aspiration was summed up in the 1921 Stallard Commission report as follows:
7
The native should only be allowed to enter the urban areas, which are essentially the white man’s creation, when he is willing to enter and to minister to the needs of the white man and should depart therefrom when he ceases so to minister. (quoted in Wilson, 1972, p3)
The political desire of white leaders to control the mobility of the black population and to restrict rural–urban migration came into increasing conflict with the economic imperative to increase the supply of cheap labour to the mines and expanding urban industries. The system of transient migrant labour was a compromise between these interests, with black workers forced to bear the costs of this arrangement. It benefited the mining corporations because workers’ families were left in the rural areas to carry on farming, which moderated their wage requirements and the employers’ costs of workforce reproduction (Wilson, 1972). Migrant workers received no pensions, welfare allowances or housing subsidies. The vast majority lived in rudimentary bachelor compounds which were much cheaper to provide than family quarters. Companies could adjust their workforce in line with changing production needs more easily than if they were permanent workers. It was also more difficult for migrant workers to organise themselves into trade unions to press for better conditions. And the pass laws constrained black workers from approaching other employers in search of higher wages. During the first half of the 20th century a series of laws were passed that further affected spatial development patterns and denied land and citizenship rights to blacks in urban areas. In retrospect, these were more piecemeal and provisional than the concerted weight of legislation that came after the Second World War. The 1913 Native Land Act prevented blacks from owning land outside rural ‘reserves’ in the former native African states. This punitive Act set aside just 13 per cent of the country’s surface area for the black majority of the population and was designed to force people off the land, partly to expand the supply of cheap labour for the mines and commercial farms. The reserves themselves were in areas with very limited agricultural and mining potential, mostly arid and distant from the main economic centres. In the employment sphere, the 1926 Colour Bar Act prevented blacks from practising skilled trades, thereby protecting skilled white workers from wage competition. This was one of many measures pursued to safeguard the interests of white workers at the expense of blacks. Whites were well organised in trade unions and determined to protect their positions when mining companies were employing increasing numbers of cheaper black workers (Wilson, 1972; Yudelman, 1984). Their organisational strength paid handsomely in later years as their earnings and job security increased steadily, unlike those of black workers. Within the towns and cities, the 1918 Natives in Urban Areas Bill was designed to force blacks into outlying townships or ‘locations’ specifically reserved for them. The 1923 Urban Areas Act introduced the idea of residential segregation of different racial groups. Besides the aim of racial separation and containment of an ‘undesirable tide’ of black urban migration (Maylam, 1990), these laws were also shaped by wider concerns not exclusive to South Africa at the time. These included the need to: improve public health, supply clean water, reduce fire risks, re-develop overcrowded slums, modernise the physical layout of urban areas, and generally manage settlement growth more efficiently in a context of unprecedented industrialisation and urbanisation (Parnell and Mabin, 1995). The process of segregation, slum clearance and township creation also had to be organised and mediated by local municipalities that did not always endorse the government’s objectives – some were more moderate and others were more extreme – resulting in uneven outcomes in different places (Baines, 1995). Therefore, although the official rhetoric identified urban blacks as ‘temporary sojourners’ serving the needs of the white population, government policies were not always neatly translated into practice (Parnell and Mabin, 1995).
8
One of the main reasons why the government’s attempts to control, steer and restrict the scale of black urbanisation were ultimately ineffective was because of the powerful magnetic pull exerted by the massive expansion of gold mining and urban manufacturing during the 1930s and 1940s. Industry demanded more labour power and people living in the rural areas needed the jobs and incomes that were available. The recurrent shortage of cheap unskilled workers in the mines and the value to the mining companies of the migrant labour system in depressing wages outweighed the political pressures to constrain black urbanisation, at least until after the Second World War. Over time, more and more migrants became de facto permanent residents of the urban areas and weakened their ties with the rural reserves. Many urban municipalities had also begun to provide formal housing for black families in the townships, in recognition of industry’s need for a more stable workforce and the appalling conditions in the older inner-city slums and mining compounds. 2.2 Urbanisation after World War II Inter-war segregationist policies intensified after the Second World War, when apartheid became official government policy with wide-ranging consequences, including an extremely hostile, anti-urban regime: ‘After 1950 urban apartheid emerged as a new and powerful, though ultimately massively oppressive, way of approaching the problems of the cities’ (Parnell and Mabin, 1995, p59). Apartheid was partly a reaction to the failure of the inter-war laws to control black urbanisation and a fear that white settlements would be overwhelmed by blacks. The governing National Party was desperate to avoid the black urban population overtaking the white population so that whites could keep ruling for generations. As the rate of black urbanisation continued to rise, government policies became more convoluted, influx controls became more extensive and stringent, and their implementation became increasingly coercive and draconian (Terreblanche, 2002). The National Party argued that South Africa did not comprise a single nation, but was made up of four distinct racial groups – Africans, coloureds, Indians and whites. These groups were split further into 13 nations or racial federations. A welter of new laws and the creation of a large state bureaucracy paved the way for ‘Grand Apartheid’, which was centred on separating races and entrenching segregation by compelling people to live in different places defined by race. This meant both different territories/regions of South Africa, and different suburbs/neighbourhoods within urban areas. The first of these laws was the 1950 Population Registration Act, which formalised racial classification and introduced an identity card for everyone over 18. The second pillar of Grand Apartheid was the 1950 Group Areas Act. This prescribed the racial composition of every residential area, and was used in later years to justify forcibly removing people who lived in the ‘wrong’ areas. In 1951 a law was passed allowing the government to demolish informal settlements. Another law forced white employers to pay for the construction of housing for essential black workers permitted to reside in cities and towns. The 1953 Reservation of Separate Amenities Act resulted in the designation of separate municipal facilities, beaches, buses, hospitals, schools and universities. These laws were driven strongly by the political and ideological motives of racial separation and segregation. Their long-term costs for the urban economy and indeed the state itself were generally played down. As long as the mining corporations and major industrial companies were able to benefit from cheap labour, they did little to oppose these features of apartheid. There was a very heavy price to pay in depriving blacks of access to decent education, training, health and other social amenities, with severe consequences to this day. Blacks were also deprived of access to services that would have helped them to earn a living through self-employment and business formation. The restrictions
9
on black business have left a legacy of low levels of general entrepreneurial activity, low rates of formal business formation and high rates of failure (OECD, 2011). The Bantu Authorities Act of 1951 created separate government structures for black and white citizens and was the first law to support separate development in rural areas, which the state called ‘Bantustans’ or ‘homelands’. These ‘consolidated’ the native reserves inherited from the colonial era. The 1958 Promotion of Black Self-Government Act entrenched the policy of nominally independent Bantustans. They were given some devolved administrative powers and some funds to encourage inward investment and jobs in order to limit migration pressures on the cities. The Bantustans had virtually no resource base of their own and ended up with too few and often poorly qualified educators, police, health workers and other public servants (Makgetla, 2010). They suffered from severe underinvestment in economic and household infrastructure, leaving them with inadequate transport, communications, power and irrigation for agricultural producers and manufacturing companies. In 1967 the government passed legislation allowing it to restrict industrial development in the ‘white’ cities and towns and redirect it to the Bantustans. Once again the intention was to reduce the numbers of black people in rural areas migrating to the cities. The 1970 Black Homeland Citizenship Act removed citizenship from blacks living in South Africa so they became citizens of one of the ten Bantustans, according to their ethnic group. The aim was to ensure the existence of a demographic majority of whites within South Africa and to reinforce the political, economic and spatial exclusion of non-whites. Only blacks with formal jobs were allowed to reside within cities and towns, and they would have to work as foreign migrant labourers on temporary work permits. The government also tightened the pass laws, compelling blacks to carry identity documents in an effort to prevent unwanted migration from the Bantustans and neighbouring countries. Many blacks who had never lived in their designated ‘homeland’ were still forcibly removed from the cities to these territories. Between the 1960s and early 1980s, the government implemented a brutal policy of ‘resettlement’ to force people to move to their designated urban ‘group areas’ and rural ‘homelands’. At least two million people experienced expulsion during this period (Turok, 1976; Terreblanche, 2002). They included people relocated due to slum-clearance programmes, labour tenants on white-owned farms, inhabitants of so-called ‘black spots’ – areas of black-owned land surrounded by white farms, families of workers living in townships close to the homelands, and ‘surplus people’ (or ‘idle blacks’) from urban areas, including thousands of blacks from the Western Cape who were moved to the Transkei and Ciskei homelands in the Eastern Cape. The number of arrests for pass-law offences increased to approximately 750,000 a year by the mid-1960s, indicating how seriously the state sought to prevent urbanisation. The migrant labour and homeland system provided a cheap, controlled workforce for the economy, but the very opposite of a cohesive, contented society. Although historic South African population statistics are unreliable, particularly for rural areas, estimates suggest that the population of the Bantustans increased from 3 million in 1946 to 11 million in 1980 (Terreblanche, 2002). The proportion of the total black population of the country living in the Bantustans also increased from about 40 per cent to 53 per cent over the same period (Terreblanche, 2002). Apart from a high level of natural growth, the increase included very large numbers of farm-workers and labour tenants evicted by white farmers who were developing commercial agriculture with increased mechanisation. The Bantustan economies were only about 20 per cent as productive per person as the economies of the main cities, so poverty was widespread. By the 1990s there were few economic assets, poor natural resources,
10
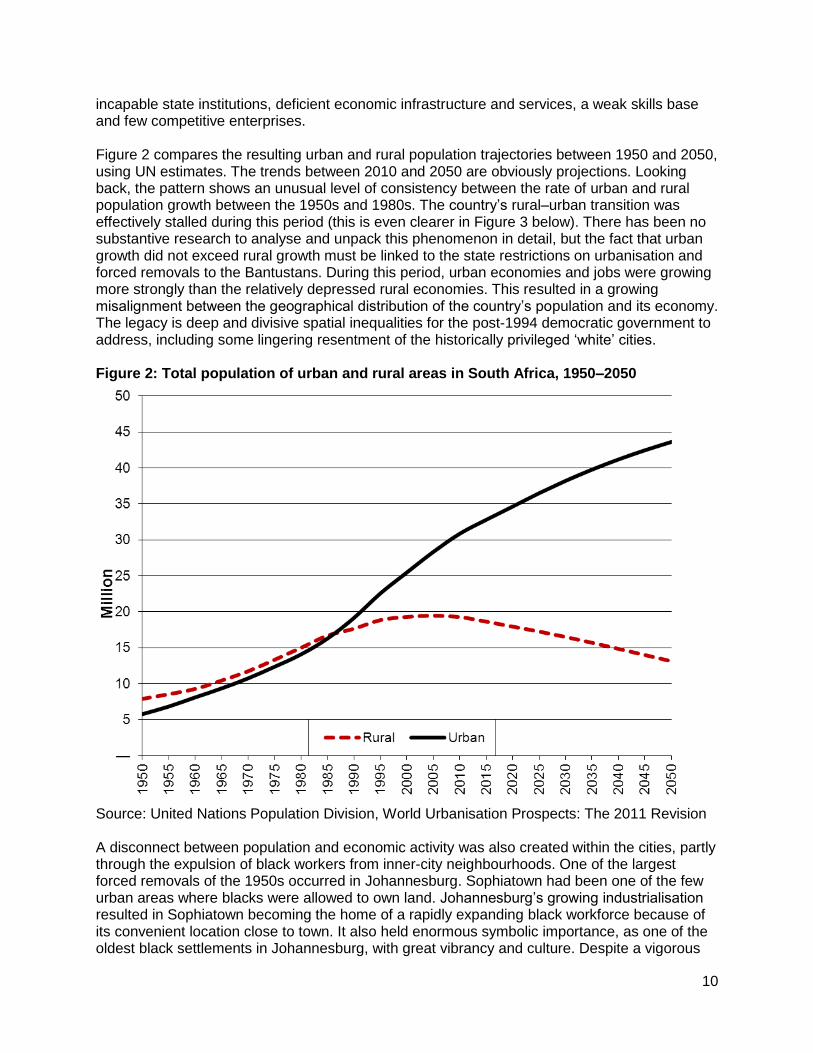
incapable state institutions, deficient economic infrastructure and services, a weak skills base and few competitive enterprises. Figure 2 compares the resulting urban and rural population trajectories between 1950 and 2050, using UN estimates. The trends between 2010 and 2050 are obviously projections. Looking back, the pattern shows an unusual level of consistency between the rate of urban and rural population growth between the 1950s and 1980s. The country’s rural–urban transition was effectively stalled during this period (this is even clearer in Figure 3 below). There has been no substantive research to analyse and unpack this phenomenon in detail, but the fact that urban growth did not exceed rural growth must be linked to the state restrictions on urbanisation and forced removals to the Bantustans. During this period, urban economies and jobs were growing more strongly than the relatively depressed rural economies. This resulted in a growing misalignment between the geographical distribution of the country’s population and its economy. The legacy is deep and divisive spatial inequalities for the post-1994 democratic government to address, including some lingering resentment of the historically privileged ‘white’ cities. Figure 2: Total population of urban and rural areas in South Africa, 1950–2050
Source: United Nations Population Division, World Urbanisation Prospects: The 2011 Revision A disconnect between population and economic activity was also created within the cities, partly through the expulsion of black workers from inner-city neighbourhoods. One of the largest forced removals of the 1950s occurred in Johannesburg. Sophiatown had been one of the few urban areas where blacks were allowed to own land. Johannesburg’s growing industrialisation resulted in Sophiatown becoming the home of a rapidly expanding black workforce because of its convenient location close to town. It also held enormous symbolic importance, as one of the oldest black settlements in Johannesburg, with great vibrancy and culture. Despite a vigorous
11
protest campaign and worldwide publicity, it was destroyed by bulldozers in 1955. Heavily armed police forced 60,000 residents out of their homes and loaded their belongings onto government trucks, to be taken off to a large tract of land 20km away, which subsequently became part of a new township called Soweto. This pattern of forced removal and destruction was repeated over the next few years, affecting areas such as South End in Port Elizabeth, Cato Manor in Durban and District Six in Cape Town, where 55,000 coloured and Indian people were forced to move to new townships on the Cape Flats. Ultimately, nearly 600,000 coloured, Indian and Chinese people were forcibly moved in South Africa under the Group Areas Act. The resulting ‘spatial mismatch’ between jobs and homes was worsened by economic restrictions. Blacks were not allowed to run businesses or professional practices in the cities without a special permit. Instead they were supposed to move to the Bantustans and set up businesses there. Poor public transport for blacks also meant long and costly journeys to work, which affected workforce productivity and wage demands. Blacks could not live or work in the cities unless they had employment, which restricted their ability to travel in search of work, and limited the available labour supply for firms. This also reinforced the process of circular migration, as mentioned above. Spouses and children had to live in the Bantustans, which damaged domestic relationships and responsibilities. People without valid permits were liable to arrest and trial for being illegal migrants, and then deported to the relevant Bantustan. Companies that employed illegal migrants were also prosecuted. Police with sticks and guns patrolled the city streets and smashed down doors in the middle of the night to round up blacks without passes, creating a hostile climate of surveillance and intimidation. The criminalising effects and violence of apartheid urban-influx controls have also had an enduring legacy for social norms and behaviour in the country. During the 1980s, the harsh anti-urban regime began to break down, for a range of economic, social and political reasons. This last phase of apartheid’s demise has been well-documented (see e.g. Swilling et al., 1991; Smith, 1992; Turok, 1994), so there is no need for a detailed exposition here. Employers became increasingly sceptical about many of the workforce restrictions and associated procedures, especially with a growing economic crisis facing the country and a growing international boycott. Firms hired workers without formally registering them because the administrative burden was excessive. Even city councils run by the National Party were caught employing street cleaners illegally because going through the right channels was too complicated. Ordinary people increasingly disregarded the controls on urbanisation, resulting in accelerating migration and burgeoning informal settlements. Hundreds of thousands came to the cities without the right stamps in their passbooks and spent their lives dodging the police. Grassroots political opposition to apartheid also increased, with many of the townships becoming militant and ungovernable during the 1980s. The majority of township residents boycotted their rent and service charges, which created a financial crisis for many black municipalities. Infrastructure began to collapse and physical and social conditions deteriorated. There was growing national and international recognition that the apartheid system was untenable and simply could not work. The economic and social forces bound up with urbanisation and its containment were at the heart of demonstrating that the political project of apartheid was unviable. After the unbanning of the African National Congress (ANC) and other opposition parties in 1990, and the release of Nelson Mandela and other political prisoners, there was a precarious four-year period of negotiated transition marked by escalating civil unrest and political violence, often focused on fast-growing urban townships such as Kathorus (Bonner and Nieftagodien, 2001). Democratic elections were eventually held in 1994, which
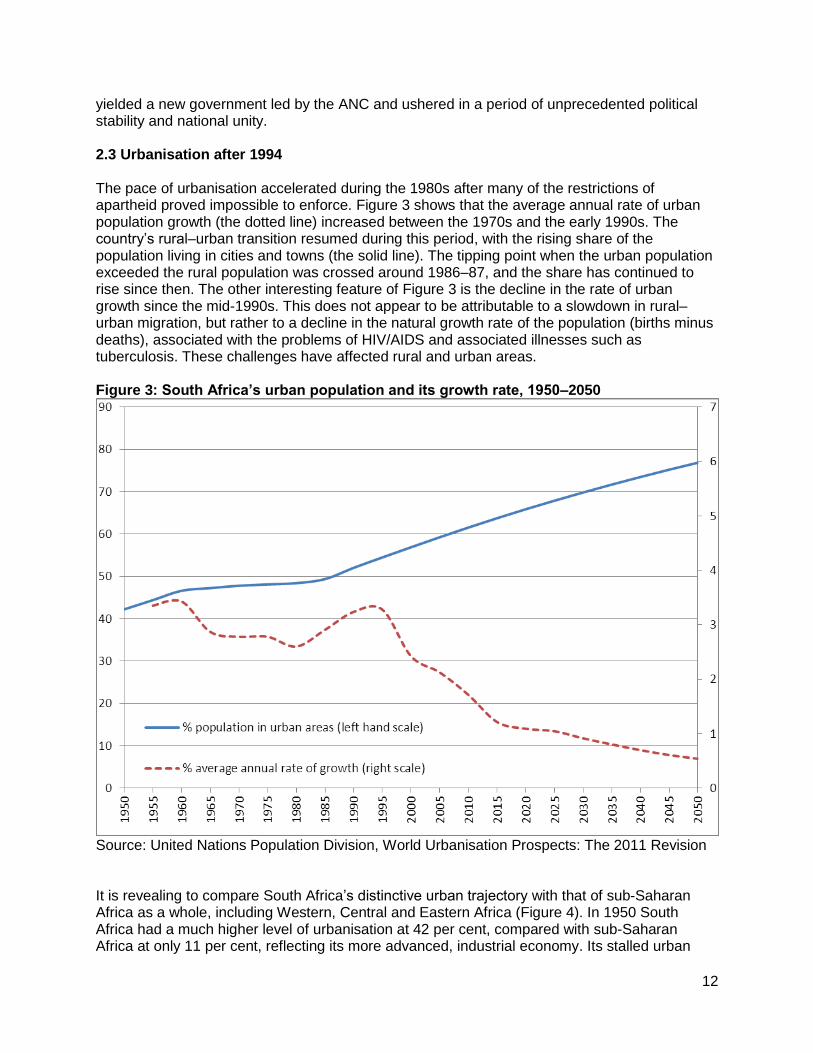
12
yielded a new government led by the ANC and ushered in a period of unprecedented political stability and national unity. 2.3 Urbanisation after 1994 The pace of urbanisation accelerated during the 1980s after many of the restrictions of apartheid proved impossible to enforce. Figure 3 shows that the average annual rate of urban population growth (the dotted line) increased between the 1970s and the early 1990s. The country’s rural–urban transition resumed during this period, with the rising share of the population living in cities and towns (the solid line). The tipping point when the urban population exceeded the rural population was crossed around 1986–87, and the share has continued to rise since then. The other interesting feature of Figure 3 is the decline in the rate of urban growth since the mid-1990s. This does not appear to be attributable to a slowdown in rural–urban migration, but rather to a decline in the natural growth rate of the population (births minus deaths), associated with the problems of HIV/AIDS and associated illnesses such as tuberculosis. These challenges have affected rural and urban areas. Figure 3: South Africa’s urban population and its growth rate, 1950–2050
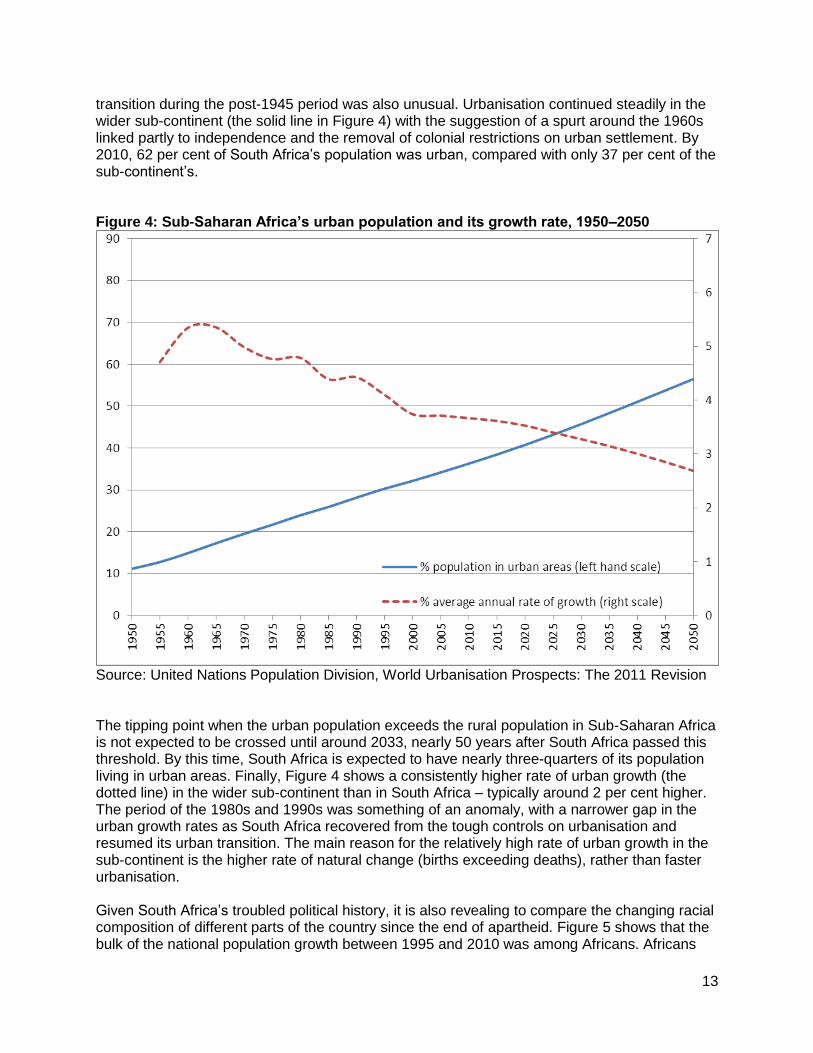
Source: United Nations Population Division, World Urbanisation Prospects: The 2011 Revision It is revealing to compare South Africa’s distinctive urban trajectory with that of sub-Saharan Africa as a whole, including Western, Central and Eastern Africa (Figure 4). In 1950 South Africa had a much higher level of urbanisation at 42 per cent, compared with sub-Saharan Africa at only 11 per cent, reflecting its more advanced, industrial economy. Its stalled urban
13
transition during the post-1945 period was also unusual. Urbanisation continued steadily in the wider sub-continent (the solid line in Figure 4) with the suggestion of a spurt around the 1960s linked partly to independence and the removal of colonial restrictions on urban settlement. By 2010, 62 per cent of South Africa’s population was urban, compared with only 37 per cent of the sub-continent’s. Figure 4: Sub-Saharan Africa’s urban population and its growth rate, 1950–2050
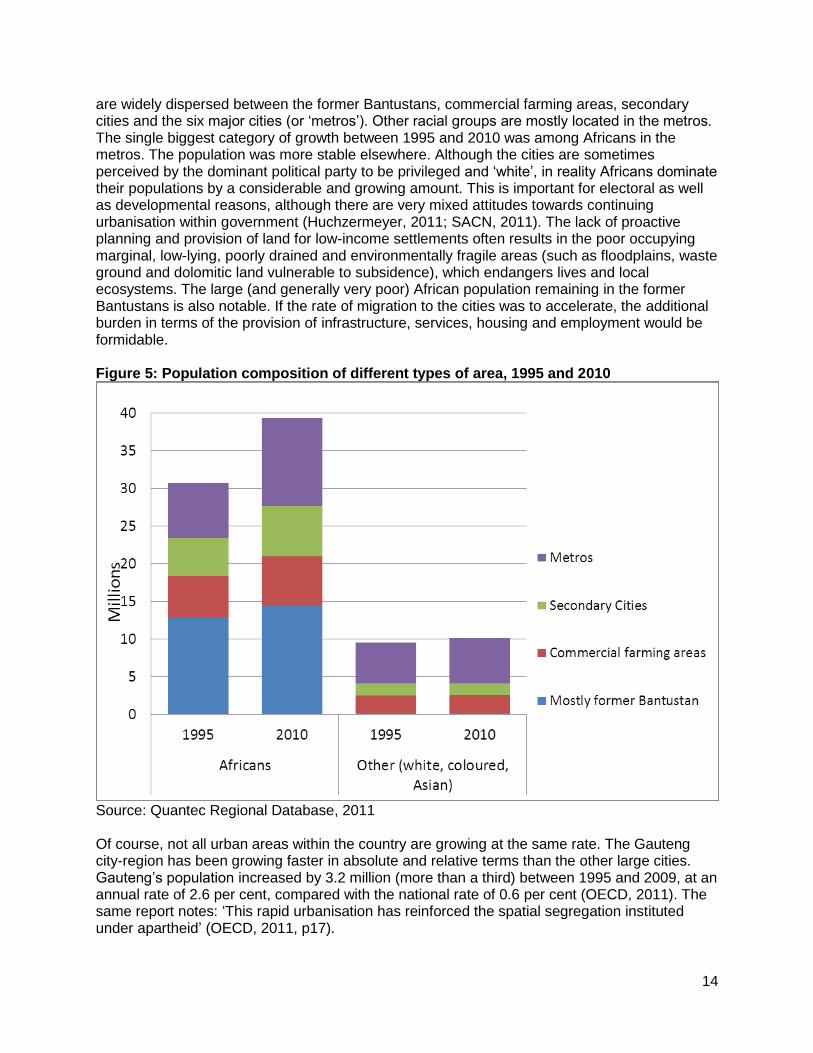
Source: United Nations Population Division, World Urbanisation Prospects: The 2011 Revision The tipping point when the urban population exceeds the rural population in Sub-Saharan Africa is not expected to be crossed until around 2033, nearly 50 years after South Africa passed this threshold. By this time, South Africa is expected to have nearly three-quarters of its population living in urban areas. Finally, Figure 4 shows a consistently higher rate of urban growth (the dotted line) in the wider sub-continent than in South Africa – typically around 2 per cent higher. The period of the 1980s and 1990s was something of an anomaly, with a narrower gap in the urban growth rates as South Africa recovered from the tough controls on urbanisation and resumed its urban transition. The main reason for the relatively high rate of urban growth in the sub-continent is the higher rate of natural change (births exceeding deaths), rather than faster urbanisation. Given South Africa’s troubled political history, it is also revealing to compare the changing racial composition of different parts of the country since the end of apartheid. Figure 5 shows that the bulk of the national population growth between 1995 and 2010 was among Africans. Africans
14
are widely dispersed between the former Bantustans, commercial farming areas, secondary cities and the six major cities (or ‘metros’). Other racial groups are mostly located in the metros. The single biggest category of growth between 1995 and 2010 was among Africans in the metros. The population was more stable elsewhere. Although the cities are sometimes perceived by the dominant political party to be privileged and ‘white’, in reality Africans dominate their populations by a considerable and growing amount. This is important for electoral as well as developmental reasons, although there are very mixed attitudes towards continuing urbanisation within government (Huchzermeyer, 2011; SACN, 2011). The lack of proactive planning and provision of land for low-income settlements often results in the poor occupying marginal, low-lying, poorly drained and environmentally fragile areas (such as floodplains, waste ground and dolomitic land vulnerable to subsidence), which endangers lives and local ecosystems. The large (and generally very poor) African population remaining in the former Bantustans is also notable. If the rate of migration to the cities was to accelerate, the additional burden in terms of the provision of infrastructure, services, housing and employment would be formidable. Figure 5: Population composition of different types of area, 1995 and 2010
Source: Quantec Regional Database, 2011 Of course, not all urban areas within the country are growing at the same rate. The Gauteng city-region has been growing faster in absolute and relative terms than the other large cities. Gauteng’s population increased by 3.2 million (more than a third) between 1995 and 2009, at an annual rate of 2.6 per cent, compared with the national rate of 0.6 per cent (OECD, 2011). The same report notes: ‘This rapid urbanisation has reinforced the spatial segregation instituted under apartheid’ (OECD, 2011, p17).
15
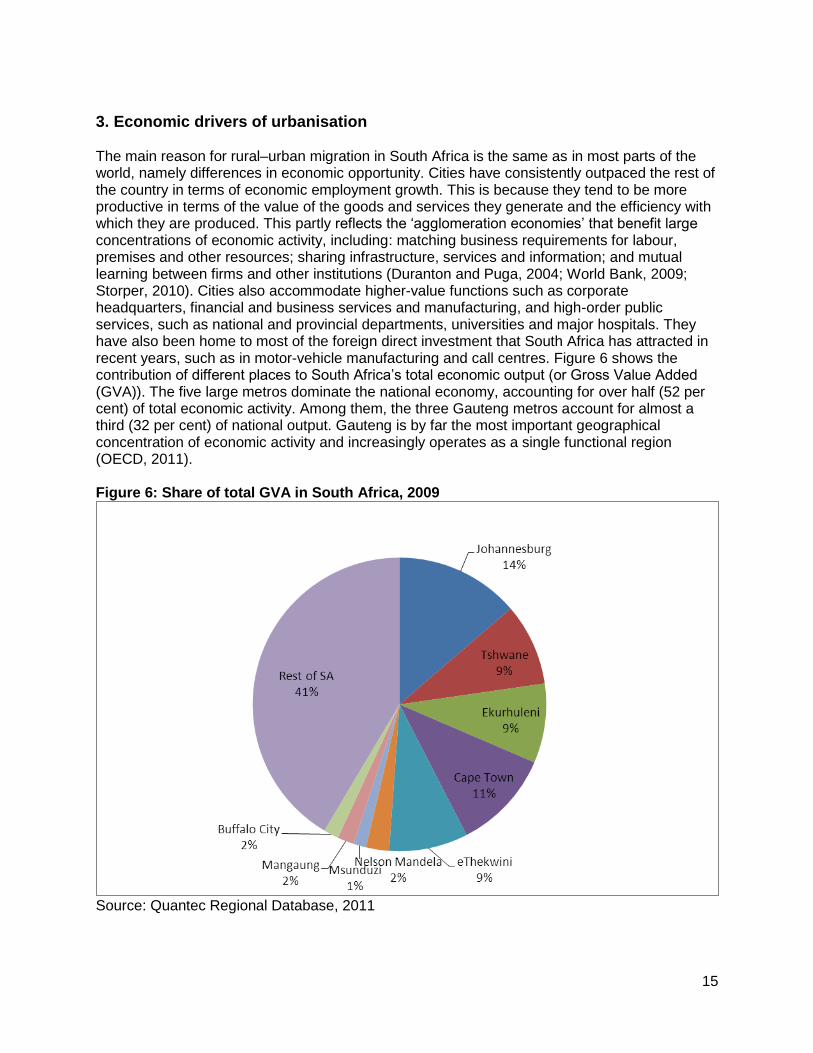
3. Economic drivers of urbanisation The main reason for rural–urban migration in South Africa is the same as in most parts of the world, namely differences in economic opportunity. Cities have consistently outpaced the rest of the country in terms of economic employment growth. This is because they tend to be more productive in terms of the value of the goods and services they generate and the efficiency with which they are produced. This partly reflects the ‘agglomeration economies’ that benefit large concentrations of economic activity, including: matching business requirements for labour, premises and other resources; sharing infrastructure, services and information; and mutual learning between firms and other institutions (Duranton and Puga, 2004; World Bank, 2009; Storper, 2010). Cities also accommodate higher-value functions such as corporate headquarters, financial and business services and manufacturing, and high-order public services, such as national and provincial departments, universities and major hospitals. They have also been home to most of the foreign direct investment that South Africa has attracted in recent years, such as in motor-vehicle manufacturing and call centres. Figure 6 shows the contribution of different places to South Africa’s total economic output (or Gross Value Added (GVA)). The five large metros dominate the national economy, accounting for over half (52 per cent) of total economic activity. Among them, the three Gauteng metros account for almost a third (32 per cent) of national output. Gauteng is by far the most important geographical concentration of economic activity and increasingly operates as a single functional region (OECD, 2011). Figure 6: Share of total GVA in South Africa, 2009
Source: Quantec Regional Database, 2011
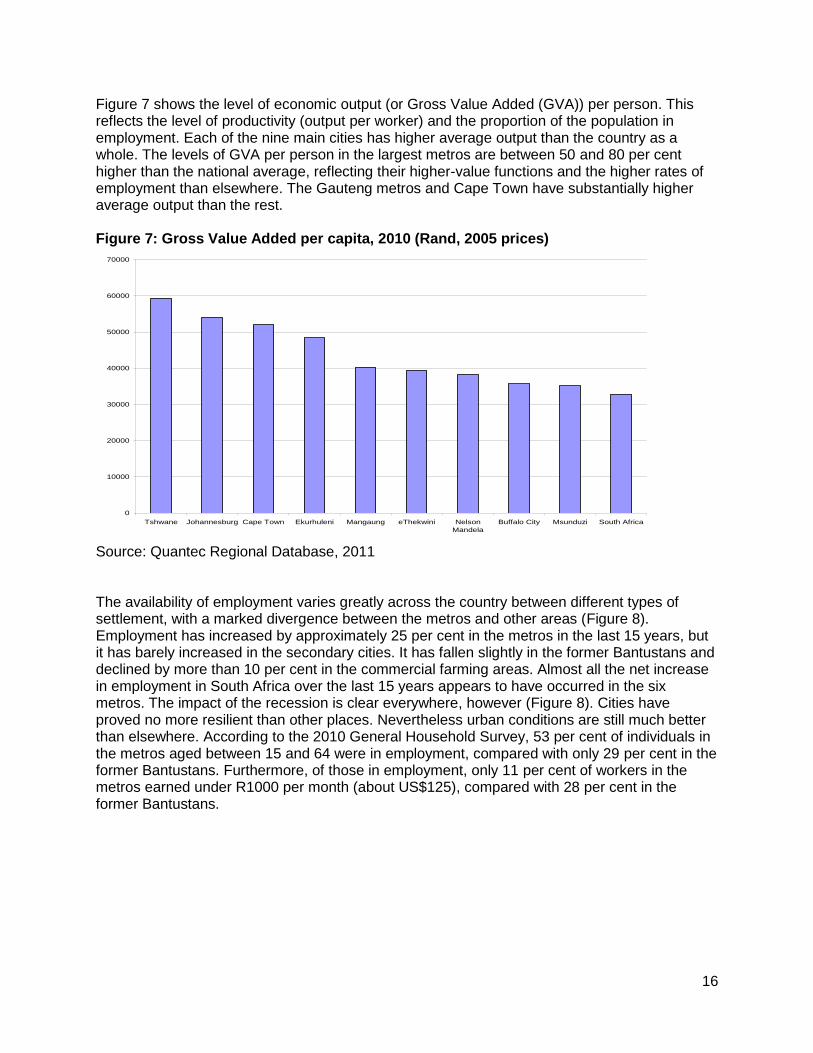
16
Figure 7 shows the level of economic output (or Gross Value Added (GVA)) per person. This reflects the level of productivity (output per worker) and the proportion of the population in employment. Each of the nine main cities has higher average output than the country as a whole. The levels of GVA per person in the largest metros are between 50 and 80 per cent higher than the national average, reflecting their higher-value functions and the higher rates of employment than elsewhere. The Gauteng metros and Cape Town have substantially higher average output than the rest. Figure 7: Gross Value Added per capita, 2010 (Rand, 2005 prices)
0
10000
20000
30000
40000
50000
60000
70000
Tshwane Johannesburg Cape Town Ekurhuleni Mangaung eThekwini Nelson
Mandela
Buffalo City Msunduzi South Africa
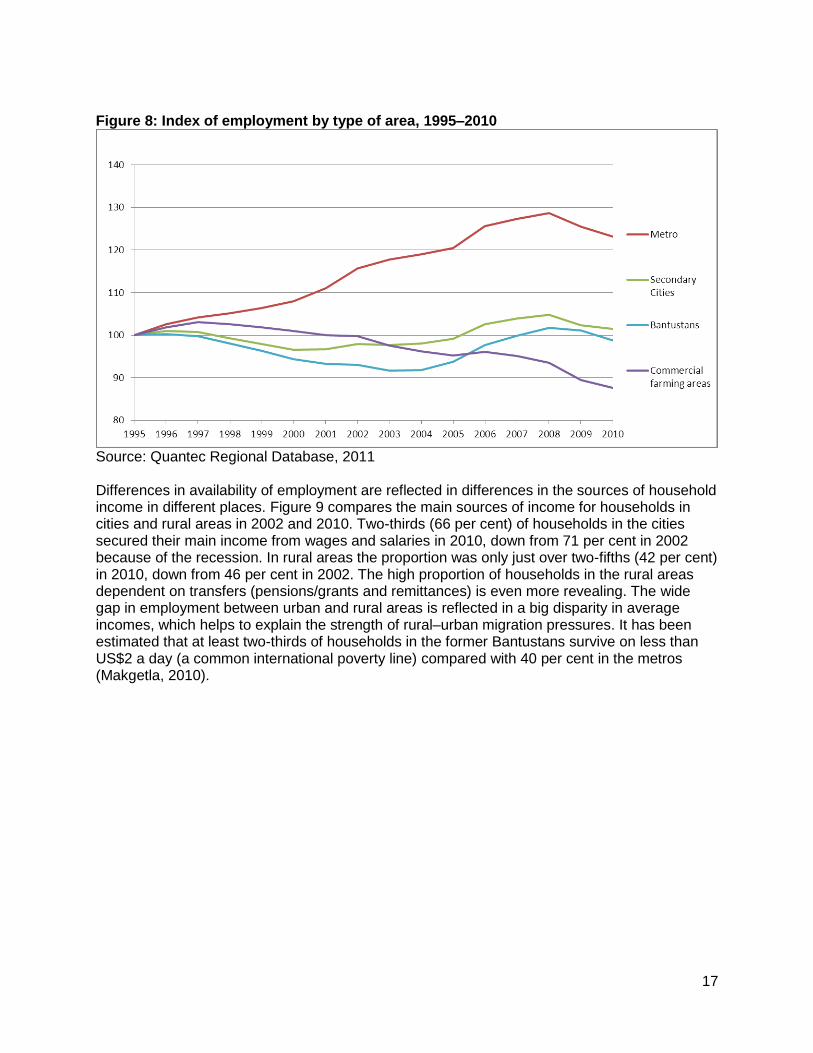
Source: Quantec Regional Database, 2011 The availability of employment varies greatly across the country between different types of settlement, with a marked divergence between the metros and other areas (Figure 8). Employment has increased by approximately 25 per cent in the metros in the last 15 years, but it has barely increased in the secondary cities. It has fallen slightly in the former Bantustans and declined by more than 10 per cent in the commercial farming areas. Almost all the net increase in employment in South Africa over the last 15 years appears to have occurred in the six metros. The impact of the recession is clear everywhere, however (Figure 8). Cities have proved no more resilient than other places. Nevertheless urban conditions are still much better than elsewhere. According to the 2010 General Household Survey, 53 per cent of individuals in the metros aged between 15 and 64 were in employment, compared with only 29 per cent in the former Bantustans. Furthermore, of those in employment, only 11 per cent of workers in the metros earned under R1000 per month (about US$125), compared with 28 per cent in the former Bantustans.
17
Figure 8: Index of employment by type of area, 1995–2010
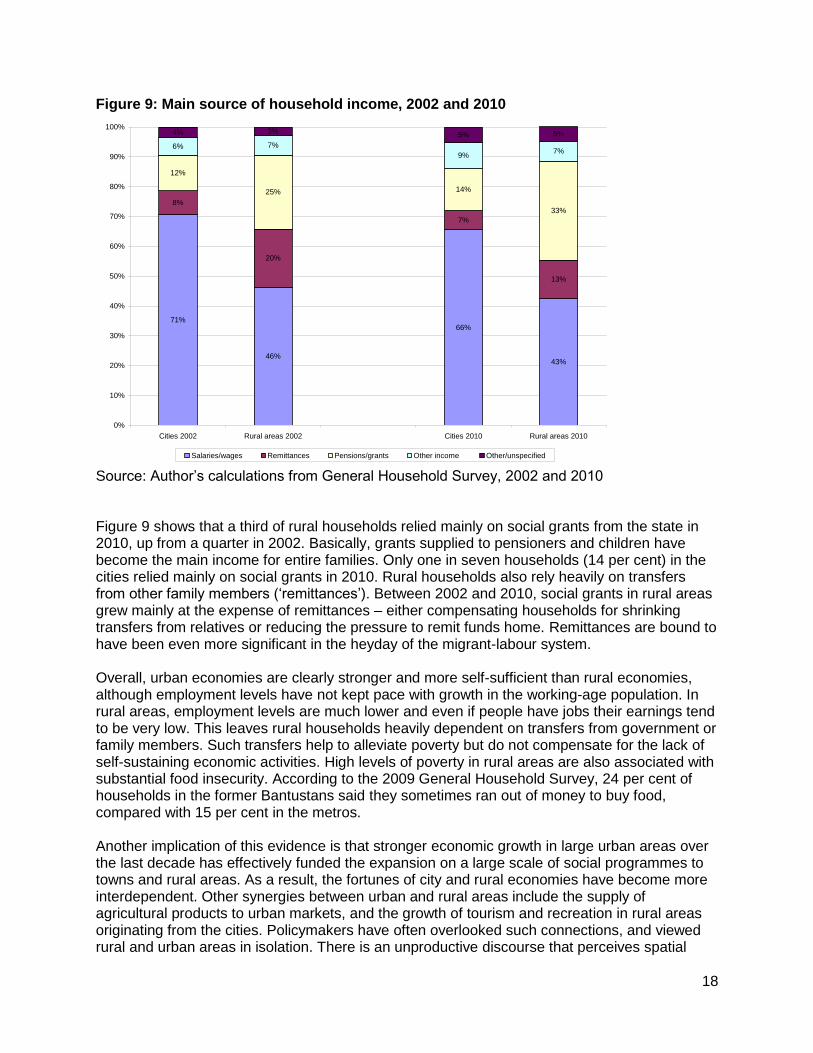
Source: Quantec Regional Database, 2011 Differences in availability of employment are reflected in differences in the sources of household income in different places. Figure 9 compares the main sources of income for households in cities and rural areas in 2002 and 2010. Two-thirds (66 per cent) of households in the cities secured their main income from wages and salaries in 2010, down from 71 per cent in 2002 because of the recession. In rural areas the proportion was only just over two-fifths (42 per cent) in 2010, down from 46 per cent in 2002. The high proportion of households in the rural areas dependent on transfers (pensions/grants and remittances) is even more revealing. The wide gap in employment between urban and rural areas is reflected in a big disparity in average incomes, which helps to explain the strength of rural–urban migration pressures. It has been estimated that at least two-thirds of households in the former Bantustans survive on less than US$2 a day (a common international poverty line) compared with 40 per cent in the metros (Makgetla, 2010).
18
Figure 9: Main source of household income, 2002 and 2010
71%
46%
66%
43%
8%
20%
7%
13%
12%
25% 14%
33%
6% 7%
9%7%
4% 3% 5% 5%
0%
10%
20%
30%
40%
50%
60%
70%
80%
90%
100%
Cities 2002 Rural areas 2002 Cities 2010 Rural areas 2010
Salaries/wages Remittances Pensions/grants Other income Other/unspecified
Source: Author’s calculations from General Household Survey, 2002 and 2010 Figure 9 shows that a third of rural households relied mainly on social grants from the state in 2010, up from a quarter in 2002. Basically, grants supplied to pensioners and children have become the main income for entire families. Only one in seven households (14 per cent) in the cities relied mainly on social grants in 2010. Rural households also rely heavily on transfers from other family members (‘remittances’). Between 2002 and 2010, social grants in rural areas grew mainly at the expense of remittances – either compensating households for shrinking transfers from relatives or reducing the pressure to remit funds home. Remittances are bound to have been even more significant in the heyday of the migrant-labour system. Overall, urban economies are clearly stronger and more self-sufficient than rural economies, although employment levels have not kept pace with growth in the working-age population. In rural areas, employment levels are much lower and even if people have jobs their earnings tend to be very low. This leaves rural households heavily dependent on transfers from government or family members. Such transfers help to alleviate poverty but do not compensate for the lack of self-sustaining economic activities. High levels of poverty in rural areas are also associated with substantial food insecurity. According to the 2009 General Household Survey, 24 per cent of households in the former Bantustans said they sometimes ran out of money to buy food, compared with 15 per cent in the metros. Another implication of this evidence is that stronger economic growth in large urban areas over the last decade has effectively funded the expansion on a large scale of social programmes to towns and rural areas. As a result, the fortunes of city and rural economies have become more interdependent. Other synergies between urban and rural areas include the supply of agricultural products to urban markets, and the growth of tourism and recreation in rural areas originating from the cities. Policymakers have often overlooked such connections, and viewed rural and urban areas in isolation. There is an unproductive discourse that perceives spatial
19
issues in either rural or urban terms, and ignores their interdependence. This diverts attention from the bigger picture of a national territory that is becoming increasingly integrated, and in which different places perform different roles and functions that complement each other and support the expansion and development of the overall economy. Rural areas have potential for increased tourism, mining and alternative energy generation, in addition to agriculture and agro-processing. The geography of the economy has not featured prominently in mainstream policy since 1994. Macro-economic concerns with inflation targeting, fiscal prudence and stability have taken precedence over micro-economic measures to stimulate investment and growth, including industrial policy and spatial economic policy (Turok and Parnell, 2009). Centralised systems of government planning, coordination and negotiation have been supported over regional and local institutions. The notion of a developmental state has begun to feature more in the policy discourse, but generally as a centralised entity without much sensitivity to diverse regional and local circumstances and relationships with business and other stakeholders (Turok, 2010). A range of ad hoc national projects have been introduced over the years targeted at different types of area (such as particular rural localities and urban townships). This is based on an understandable tendency to focus on socio-economic need, but little apparent recognition of the need to support distinctive economic strengths and potential as well, especially if national employment growth, competitiveness and employment are to be maximised. Meanwhile, in many parts of the world there has been a sea change in attitudes towards cities. Many national governments are vigorously supporting investment in their major economic centres on the basis that they offer the best returns in terms of productivity, enterprise, innovation and the solution to many of their greatest social and environmental problems (Glaeser, 2011; Turok, forthcoming). These ideas have been slower to gain traction in South Africa. Towards the end of 2010, for example, a New Growth Path was introduced, signalling a greater commitment to tackling unemployment, poverty and inequality, and promising a more active, interventionist approach to economic policy and much greater investment in economic and social infrastructure. It devoted particular emphasis to the rural problem:
Apartheid left South Africa with an extraordinary spatial divergence between the economic centres of the country… and the densely settled rural areas of the former Bantustans, which have very limited economic resources and investments. (EDD, 2010, p45)
This report of the Economic Development Department (EDD) mentioned the word ‘rural’ 35 times, ‘urban’ four times, ‘metros’ three times and ‘cities’ once. There appeared to be some reluctance to acknowledge the economic role of cities and their potential for accelerated job creation:
While urbanisation will continue, a significant share of the population will remain in rural areas, engaged in the rural economy. Government will step up its efforts to provide public infrastructure and housing in rural areas, both to lower the costs of economic activity and to foster sustainable communities. (EDD, 2010, p14)
The document also mentioned skewing other funds towards rural areas: ‘reprioritising budgets for housing and social services to address rural backlogs’. There was no mention of the growing housing and service backlogs in urban areas as a result of migration and natural population growth.
20
From this and related policies, we can sum up the new conventional wisdom about spatial inequalities in South Africa in simple terms as follows. First, the issue is mainly seen as a divide between urban and rural areas. Colonial and apartheid policies forced people into peripheral and infertile areas that functioned as labour reserves for the urban economy. The historic urban–rural divide was reinforced by the decline in commercial agriculture and small-scale farming in many parts of the countryside. The resulting gap in life chances encourages people to migrate towards economic centres. They are forced into backyard shacks and overcrowded squatter settlements which do not meet expected urban standards. Incomers struggle to access the formal urban labour markets because of their limited skills. Public services cannot keep pace with expanding ‘slums’, causing insanitary and overcrowded conditions, which worsens social problems, disenchantment, crime and other anti-social activities. Therefore it is believed that migration should be discouraged because it is harmful and unmanageable, and that people would be better off back in rural areas engaged in subsistence farming and protected from negative urban influences. Second, the gap between urban and rural areas is more significant for policy purposes than between (former white) suburbs and (former black) townships because it is largely responsible for driving urbanisation. The burgeoning of poor urban communities is seen as a consequence of over-urbanisation driven by rural poverty which government should be capable of doing something about. Rural development should take precedence over urban support because it can help to safeguard rural culture and traditions, stem out-migration and curb the growth of problematic urban slums. Cities have been privileged historically, have inherited stronger municipal institutions and can generally look after themselves financially because of their stronger tax base. Rural support should take the form of improved public infrastructure, schools, hospitals and physical connectivity to help rural farmers and producers of other goods and services to access urban markets. Third, spatial disparities are seen as essentially issues of equity and distribution rather than production and efficiency. Geographical matters are not considered significant in relation to economic growth and development. Places are passive containers for economic activity, as if firms can make unconstrained location choices. The idea that physical situation can affect business productivity and performance is not widely understood. There is also an assumption that government can readily influence business location decisions through incentives. This is supported by a long history of government inducements for factory relocation to the Bantustans. There is also a sense that transport can take up the slack and absorb physical mismatches between population and jobs. Sizeable operating subsidies to transport providers are seen as legitimate to support people in low-paid employment who were or are forced to endure long journeys to work. There is little recognition of their perverse effect in maintaining fragmented urban settlement patterns, rather than encouraging people to move close to where the jobs are and creating more efficient spatial arrangements. Fourth, there is little awareness shown that economic concentration and spatial proximity may contribute to development by supporting value creation, productivity and innovation. The word ‘city’ featured only once in 134 pages in the Fifteen Year Presidency Review of South Africa (Presidency, 2008), and that had a negative association with crime. Spatial inequalities are explained by historical factors alone, with no recognition that contemporary forces may be reinforcing spatial gaps. Rural development is designed to rectify historic injustices, with little awareness of the opportunity costs involved, or of the economic costs of fragmented cities. Ambiguity towards rural–urban migration also means that policymakers react to informal settlements, and often negatively, rather than anticipating this movement and making suitable

21
land available on which people can settle. Indifference to informal settlements and backyard shacks is sometimes justified in terms of not encouraging further rural–urban migration.
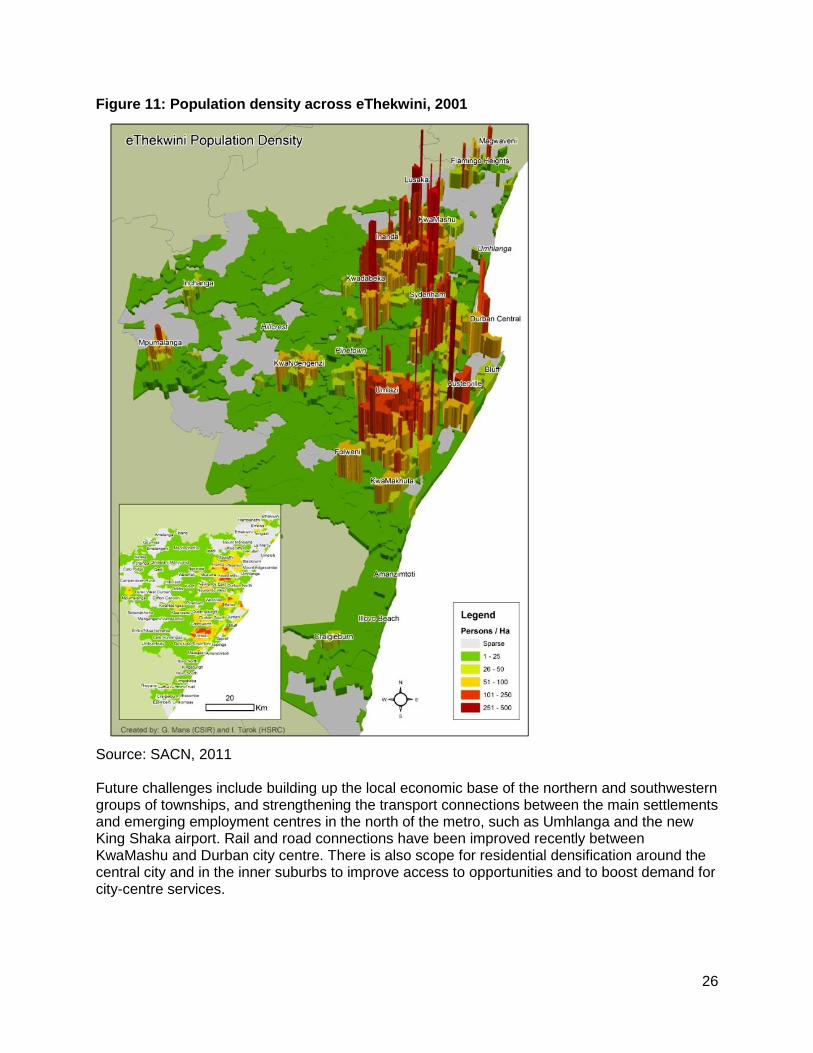
4. The consequences of urbanisation for settlement patterns Colonial and apartheid policies of racial segregation have left a daunting legacy – a fragmented urban form with unequal access to jobs, amenities and public services. The legacy has not disappeared in the aftermath of apartheid because of the durability of the built form, the power of vested interests, persistent income inequalities between races and lack of upward mobility. The dispersed built environment demands long journeys, raises carbon emissions, reduces city productivity, and undermines the financial viability of municipalities because of the high servicing costs. Population densities within each city are also extraordinarily uneven. Cape Town’s average density is 39 persons per hectare, but this varies between 100–150 in the informal settlements and 4–12 in the former white suburbs (City of Cape Town, 2009). This enormous imbalance poses major challenges for urban management and social integration, especially as different neighbourhoods are often separated by physical barriers and buffer zones. Uneven density is a source of inefficiency and injustice because it obstructs the workings of the labour and housing markets, makes it difficult to distribute public services such as schools, libraries and recreational amenities fairly across the city, and undermines the provision of efficient transport systems. Middle- and high-income households live in low-density suburbs that are costly to service with public transport and bulk infrastructure, and are heavily geared to car-based commuting. Major highway construction since the 1960s has reinforced the separation of work, leisure and home life. Elsewhere, the poor majority of households are confined to townships and informal settlements that tend to be overcrowded, with over-burdened schools, clinics and community facilities, and vulnerable to the spread of shack fires and communicable diseases. Land constraints within these areas complicate the installation of storm-water systems, sewers, electricity and other infrastructure, as well as municipal facilities, public spaces and formal economic activity. Because of the pressure on well-located land more generally within the city, many shack areas are poorly sited in relation to flood hazards, waste ground and unstable dolomitic land. They are also isolated from livelihood opportunities and amenities, which compounds people’s disadvantage. A national survey found that workers in the lowest income bracket have to spend no less than 35 per cent of their earnings on commuting on average (Department of Transport, 2004). This is likely to be one of the highest shares in the world of income spent on travel to work (OECD, 2011). Informal settlements have expanded in size and multiplied in number, with the latest government estimates indicating around 2700 shack areas countrywide accommodating about 1.2 million households (SACN, 2011). Many urban shack areas serve an important function as reception areas or gateways for migrant populations, offering cheap entry points to gain a toehold in the urban labour market – a low-cost, accessible location from which to search for work (Cross, 2010). A sensitive approach by policymakers would recognise these places as ‘escalator areas’ that enable migrants to acquire relevant skills and contacts, to increase their earnings, and in due course to move on to better housing elsewhere. Cities that are dynamic and inclusive need such areas to accommodate population growth and enable social mobility. Policies should recognise that such places need incremental upgrading to improve their capacity to serve this role, to strengthen the social fabric of nascent communities, and to provide cleaner and safer living conditions for incoming residents. Policies should also
22
recognise the need to plan further ahead by taking a proactive stance in relation to the land and shelter needs resulting from inevitable future population growth. Instead, most municipalities take a tough stance in trying to prevent land invasions and containing the growth of existing settlements. There have also been many cases of existing shack areas being demolished, people being evicted from land intended for other purposes, and removed to ‘temporary relocation areas’ or ‘transit camps’ pending eventual provision of formal housing (Huchzermeyer, 2011). The hosting of the World Cup in 2010 and more general pursuit of external investment and tourism are among the reasons given by government for opposing unsightly informal settlements. Such restrictions make it more difficult for people to move to cities, and often result in poor people occupying ‘hidden spaces’ such as backyard shacks in the existing townships and derelict buildings in the inner cities, which lack sanitation, water, electricity and waste collection. The unintended consequence of government actions is to increase overcrowding in existing settlements, while taking no action to reduce peoples’ vulnerability to the spread of disease, fire and exploitation by unscrupulous ‘slumlords’. In recent years, the courts have challenged municipal evictions of people occupying informal settlements and inner-city buildings on the grounds of basic human rights. Section 26 of the South African Constitution states that:
Everyone has the right to have access to adequate housing… No one may be evicted from their home, or have their home demolished, without an order of court made after considering all the relevant circumstances. No legislation may permit arbitrary evictions.
The courts have insisted that municipalities must obtain court approval before they proceed with an eviction, and that they must provide alternative accommodation of a comparable or higher standard if the court gives the go-ahead. A recent court ruling also ordered one of the metros to provide temporary accommodation for people who were legally evicted by private landowners too. These decisions are clearly beneficial for the households directly affected, who are bound to be among the poorest in society. However, there must be a concern that they could encourage ‘queue-jumping’ as people at the bottom of housing waiting lists invade all kinds of other property in the hope of gaining preferential treatment. The cost of providing alternative housing adds to the burden on municipalities and diverts resources from providing permanent housing solutions for others who deserve priority treatment according to established criteria. Although upholding the rights of the poor to the city, the court process also seems somewhat unsatisfactory because of its ad hoc character based on individual cases. It is symptomatic of a wider problem that policy is reacting to urbanisation after the event, instead of planning ahead and managing the process more systematically, such as through the provision of serviced land to accommodate household growth. This is one cost of not having an explicit, forward-looking urban policy. South Africa’s dispersed urban configuration also differs between cities. The varied spatial form reflects their unique physical topographies, major transport axes, social and cultural composition, and the rate and character of economic development and demographic growth. Historical policies are also important, including how strictly apartheid planning principles were applied, and what other planning ideas were influential, such as the separation of land-uses associated with ‘modernist’ ideas. Some cities have a reasonably compact core, built-up area, while others are much more fragmented. Some have one or more poor townships located well beyond the urban periphery, imposed through forced removals or ‘displaced urbanisation’ to neighbouring Bantustans. Others have a range of outlying informal settlements which have
23
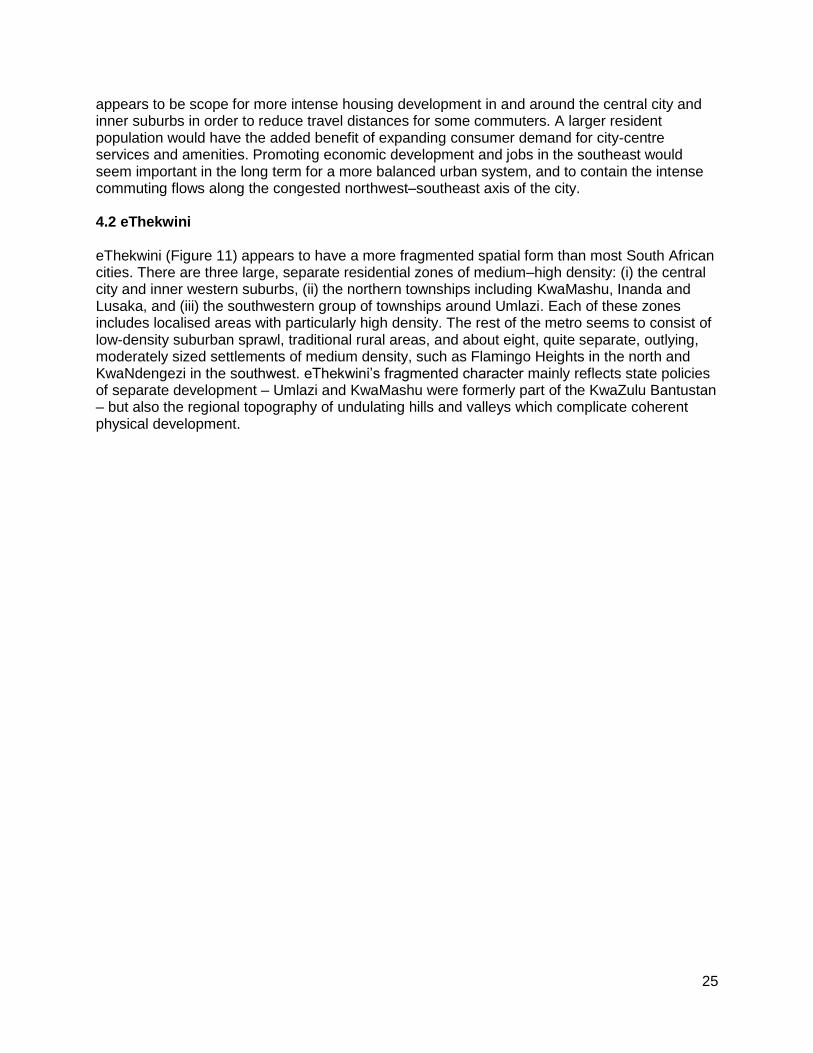
grown without approval as a result of in-migration, often since the demise of apartheid, such as Diepsloot north of Johannesburg (Harber, 2011). It is vital to understand these differences in order to tailor settlement policies appropriately once general principles of sound urban planning and in situ upgrading have been established. A useful way to start thinking about city differences is through three-dimensional density maps. There are three examples provided in this paper (see Figures 10–12). They convey a powerful sense of the socio-spatial inequalities of each city. The height of each column on the map represents the population density of that particular zone of the city. The area of the base (or ‘footprint’) of each column is the geographical extent of that zone. Consequently, the volume of each column reflects the total number of people living in the zone. The colour coding reflects different density levels – green is very low while red is very high.1
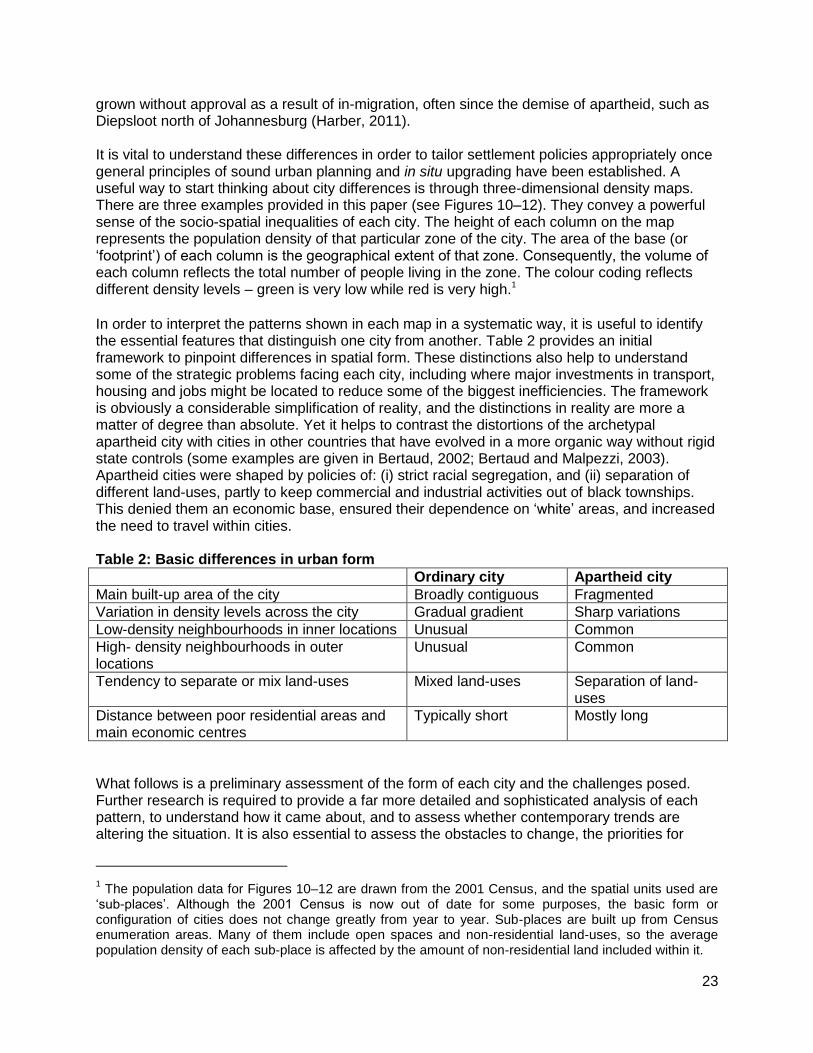
In order to interpret the patterns shown in each map in a systematic way, it is useful to identify the essential features that distinguish one city from another. Table 2 provides an initial framework to pinpoint differences in spatial form. These distinctions also help to understand some of the strategic problems facing each city, including where major investments in transport, housing and jobs might be located to reduce some of the biggest inefficiencies. The framework is obviously a considerable simplification of reality, and the distinctions in reality are more a matter of degree than absolute. Yet it helps to contrast the distortions of the archetypal apartheid city with cities in other countries that have evolved in a more organic way without rigid state controls (some examples are given in Bertaud, 2002; Bertaud and Malpezzi, 2003). Apartheid cities were shaped by policies of: (i) strict racial segregation, and (ii) separation of different land-uses, partly to keep commercial and industrial activities out of black townships. This denied them an economic base, ensured their dependence on ‘white’ areas, and increased the need to travel within cities. Table 2: Basic differences in urban form
Ordinary city Apartheid city
Main built-up area of the city Broadly contiguous Fragmented
Variation in density levels across the city Gradual gradient Sharp variations
Low-density neighbourhoods in inner locations Unusual Common
High- density neighbourhoods in outer locations
Unusual Common
Tendency to separate or mix land-uses Mixed land-uses Separation of land-uses
Distance between poor residential areas and main economic centres
Typically short Mostly long
What follows is a preliminary assessment of the form of each city and the challenges posed. Further research is required to provide a far more detailed and sophisticated analysis of each pattern, to understand how it came about, and to assess whether contemporary trends are altering the situation. It is also essential to assess the obstacles to change, the priorities for
1 The population data for Figures 10–12 are drawn from the 2001 Census, and the spatial units used are
‘sub-places’. Although the 2001 Census is now out of date for some purposes, the basic form or configuration of cities does not change greatly from year to year. Sub-places are built up from Census enumeration areas. Many of them include open spaces and non-residential land-uses, so the average population density of each sub-place is affected by the amount of non-residential land included within it.
24
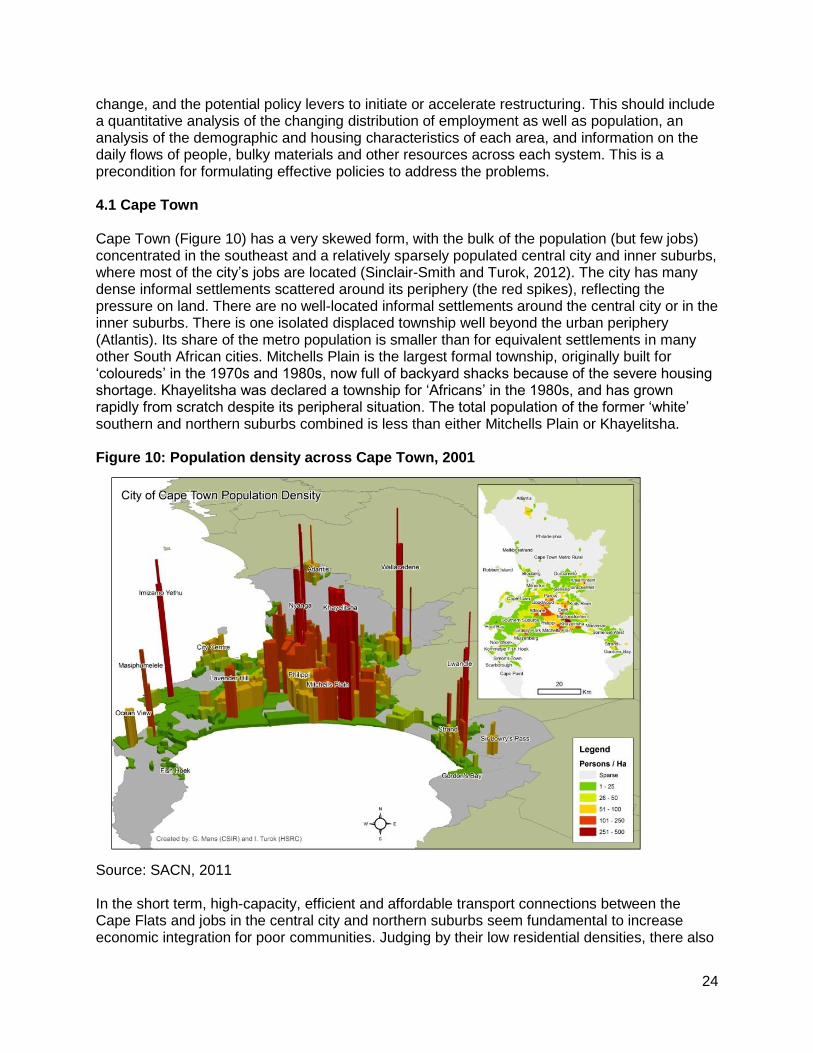
change, and the potential policy levers to initiate or accelerate restructuring. This should include a quantitative analysis of the changing distribution of employment as well as population, an analysis of the demographic and housing characteristics of each area, and information on the daily flows of people, bulky materials and other resources across each system. This is a precondition for formulating effective policies to address the problems. 4.1 Cape Town Cape Town (Figure 10) has a very skewed form, with the bulk of the population (but few jobs) concentrated in the southeast and a relatively sparsely populated central city and inner suburbs, where most of the city’s jobs are located (Sinclair-Smith and Turok, 2012). The city has many dense informal settlements scattered around its periphery (the red spikes), reflecting the pressure on land. There are no well-located informal settlements around the central city or in the inner suburbs. There is one isolated displaced township well beyond the urban periphery (Atlantis). Its share of the metro population is smaller than for equivalent settlements in many other South African cities. Mitchells Plain is the largest formal township, originally built for ‘coloureds’ in the 1970s and 1980s, now full of backyard shacks because of the severe housing shortage. Khayelitsha was declared a township for ‘Africans’ in the 1980s, and has grown rapidly from scratch despite its peripheral situation. The total population of the former ‘white’ southern and northern suburbs combined is less than either Mitchells Plain or Khayelitsha. Figure 10: Population density across Cape Town, 2001
Source: SACN, 2011 In the short term, high-capacity, efficient and affordable transport connections between the Cape Flats and jobs in the central city and northern suburbs seem fundamental to increase economic integration for poor communities. Judging by their low residential densities, there also
25
appears to be scope for more intense housing development in and around the central city and inner suburbs in order to reduce travel distances for some commuters. A larger resident population would have the added benefit of expanding consumer demand for city-centre services and amenities. Promoting economic development and jobs in the southeast would seem important in the long term for a more balanced urban system, and to contain the intense commuting flows along the congested northwest–southeast axis of the city. 4.2 eThekwini eThekwini (Figure 11) appears to have a more fragmented spatial form than most South African cities. There are three large, separate residential zones of medium–high density: (i) the central city and inner western suburbs, (ii) the northern townships including KwaMashu, Inanda and Lusaka, and (iii) the southwestern group of townships around Umlazi. Each of these zones includes localised areas with particularly high density. The rest of the metro seems to consist of low-density suburban sprawl, traditional rural areas, and about eight, quite separate, outlying, moderately sized settlements of medium density, such as Flamingo Heights in the north and KwaNdengezi in the southwest. eThekwini’s fragmented character mainly reflects state policies of separate development – Umlazi and KwaMashu were formerly part of the KwaZulu Bantustan – but also the regional topography of undulating hills and valleys which complicate coherent physical development.
26
Figure 11: Population density across eThekwini, 2001
Source: SACN, 2011 Future challenges include building up the local economic base of the northern and southwestern groups of townships, and strengthening the transport connections between the main settlements and emerging employment centres in the north of the metro, such as Umhlanga and the new King Shaka airport. Rail and road connections have been improved recently between KwaMashu and Durban city centre. There is also scope for residential densification around the central city and in the inner suburbs to improve access to opportunities and to boost demand for city-centre services.
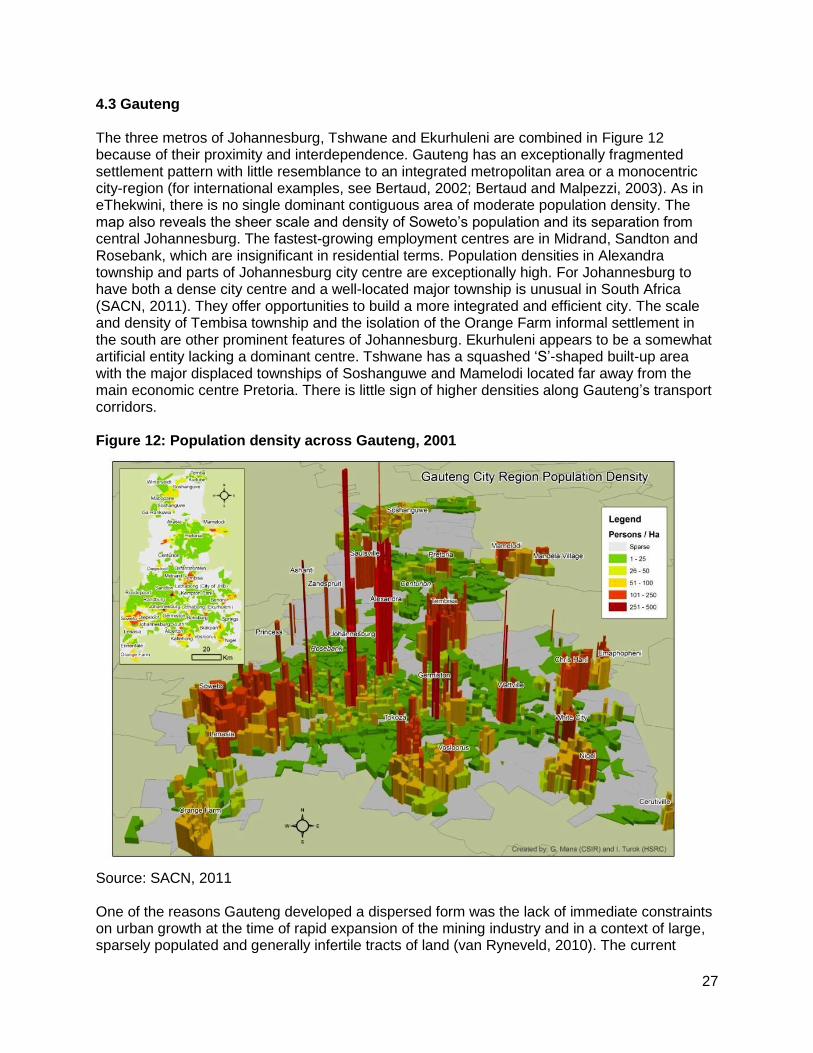
27
4.3 Gauteng The three metros of Johannesburg, Tshwane and Ekurhuleni are combined in Figure 12 because of their proximity and interdependence. Gauteng has an exceptionally fragmented settlement pattern with little resemblance to an integrated metropolitan area or a monocentric city-region (for international examples, see Bertaud, 2002; Bertaud and Malpezzi, 2003). As in eThekwini, there is no single dominant contiguous area of moderate population density. The map also reveals the sheer scale and density of Soweto’s population and its separation from central Johannesburg. The fastest-growing employment centres are in Midrand, Sandton and Rosebank, which are insignificant in residential terms. Population densities in Alexandra township and parts of Johannesburg city centre are exceptionally high. For Johannesburg to have both a dense city centre and a well-located major township is unusual in South Africa (SACN, 2011). They offer opportunities to build a more integrated and efficient city. The scale and density of Tembisa township and the isolation of the Orange Farm informal settlement in the south are other prominent features of Johannesburg. Ekurhuleni appears to be a somewhat artificial entity lacking a dominant centre. Tshwane has a squashed ‘S’-shaped built-up area with the major displaced townships of Soshanguwe and Mamelodi located far away from the main economic centre Pretoria. There is little sign of higher densities along Gauteng’s transport corridors. Figure 12: Population density across Gauteng, 2001
Source: SACN, 2011 One of the reasons Gauteng developed a dispersed form was the lack of immediate constraints on urban growth at the time of rapid expansion of the mining industry and in a context of large, sparsely populated and generally infertile tracts of land (van Ryneveld, 2010). The current
28
splintered structure of Gauteng and the separation between residential areas and employment nodes implies a need for high levels of movement across the region. There is a compelling case for efficient public transport connections between the largest low-income settlements (which tend to be in the south) and the areas of employment growth and private investment (which are mostly north of Johannesburg). This is one of the objectives of the Bus Rapid Transit scheme being introduced in Johannesburg (SACN, 2011). Improved connectivity should improve the region’s agglomeration potential, increase labour-market efficiency and reduce congestion. Over time, the spatial form would also be improved through carefully targeted residential development, infilling and densification. Some of the undeveloped parts of Johannesburg and Ekurhuleni visible on the map are former mining and dolomite areas and probably unsuitable for housing, but there is scope for densification elsewhere, such as the Johannesburg–Pretoria–Ekurhuleni transport corridors and the core city and inner suburbs of Pretoria. Within Ekurhuleni there must be scope for infill development to connect the separate centres and develop a more integrated urban form, perhaps along the old transport links between the East Rand towns and townships. The Gautrain project linking Johannesburg, Pretoria and OR Tambo airport is beginning to spur higher density (re)development around the stations along the route, although it has been criticised for avoiding all existing high-density residential areas in Gauteng (Cronin, 2006). Major outlying settlements such as Tokoza, Vosloorus, Nigel, Chris Hani, Tembisa, Mamelodi, Soshanguwe and Soweto are likely to be capable of supporting stronger local economies given their scale and distance from established economic centres. To summarise, promoting greater integration of each city is important to improve efficiency and fairness. Fragmented settlements need to be knitted together more effectively through strategic investments in transport, housing and economic development. There is scope for residential densification and employment growth in and around most central cities. Bringing more people to live in well-located areas would be beneficial for accessing work and social amenities, strengthening city-centre economies, improving social cohesion and reducing transport congestion. It is likely to require a combination of state-sponsored redevelopment, incentives and controls on private house-builders, and more creativity and innovation on the part of developers and planners.
5. The consequences of urbanisation for informal settlements The pace of urbanisation and inherited backlogs have made it impossible to provide everyone with a permanent residential structure. Protection from the elements, privacy and security are vital for human survival, dignity and community stability. Figure 13 shows that almost a quarter of households in South Africa live in informal dwellings or traditional housing. This amounts to approximately 3.4 million households. Other evidence shows that residents of such dwellings are more likely to experience overcrowding, poor access to services, and vulnerability to hunger (Statistics SA, 2010). Shack areas are also more vulnerable to flooding, fires, soil instability and water-borne pollution.
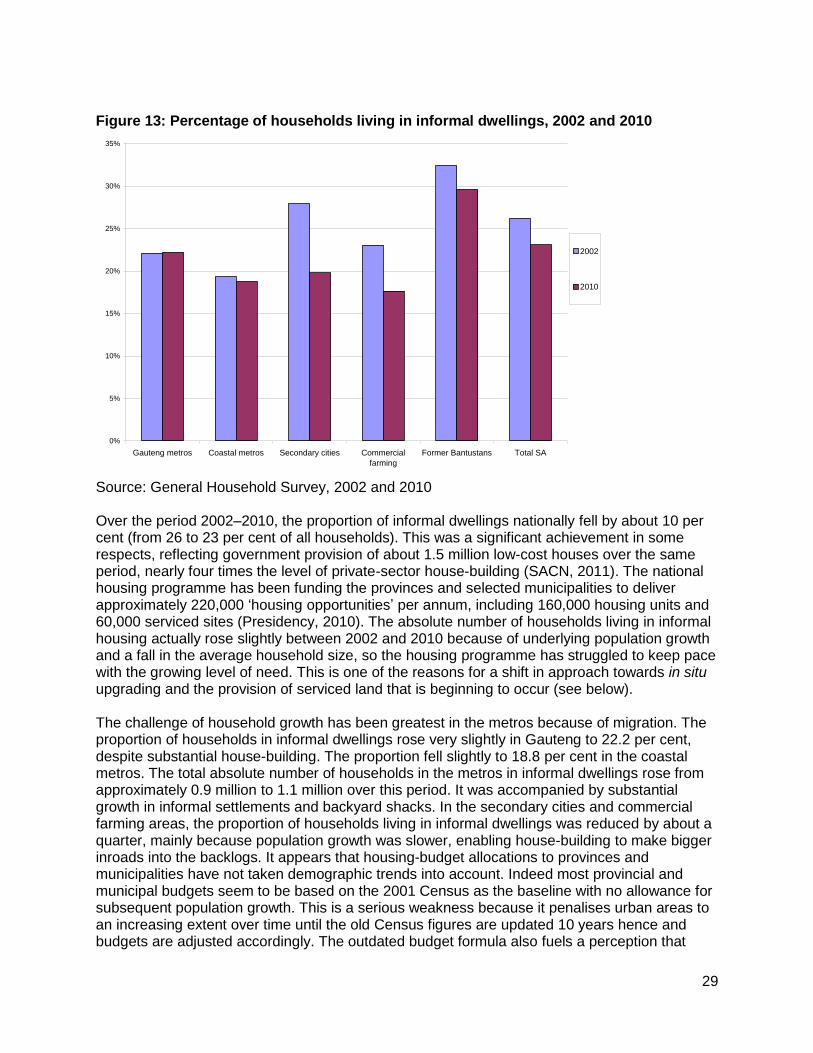
29
Figure 13: Percentage of households living in informal dwellings, 2002 and 2010
0%
5%
10%
15%
20%
25%
30%
35%
Gauteng metros Coastal metros Secondary cities Commercial
farming
Former Bantustans Total SA
2002
2010
Source: General Household Survey, 2002 and 2010 Over the period 2002–2010, the proportion of informal dwellings nationally fell by about 10 per cent (from 26 to 23 per cent of all households). This was a significant achievement in some respects, reflecting government provision of about 1.5 million low-cost houses over the same period, nearly four times the level of private-sector house-building (SACN, 2011). The national housing programme has been funding the provinces and selected municipalities to deliver approximately 220,000 ‘housing opportunities’ per annum, including 160,000 housing units and 60,000 serviced sites (Presidency, 2010). The absolute number of households living in informal housing actually rose slightly between 2002 and 2010 because of underlying population growth and a fall in the average household size, so the housing programme has struggled to keep pace with the growing level of need. This is one of the reasons for a shift in approach towards in situ upgrading and the provision of serviced land that is beginning to occur (see below). The challenge of household growth has been greatest in the metros because of migration. The proportion of households in informal dwellings rose very slightly in Gauteng to 22.2 per cent, despite substantial house-building. The proportion fell slightly to 18.8 per cent in the coastal metros. The total absolute number of households in the metros in informal dwellings rose from approximately 0.9 million to 1.1 million over this period. It was accompanied by substantial growth in informal settlements and backyard shacks. In the secondary cities and commercial farming areas, the proportion of households living in informal dwellings was reduced by about a quarter, mainly because population growth was slower, enabling house-building to make bigger inroads into the backlogs. It appears that housing-budget allocations to provinces and municipalities have not taken demographic trends into account. Indeed most provincial and municipal budgets seem to be based on the 2001 Census as the baseline with no allowance for subsequent population growth. This is a serious weakness because it penalises urban areas to an increasing extent over time until the old Census figures are updated 10 years hence and budgets are adjusted accordingly. The outdated budget formula also fuels a perception that
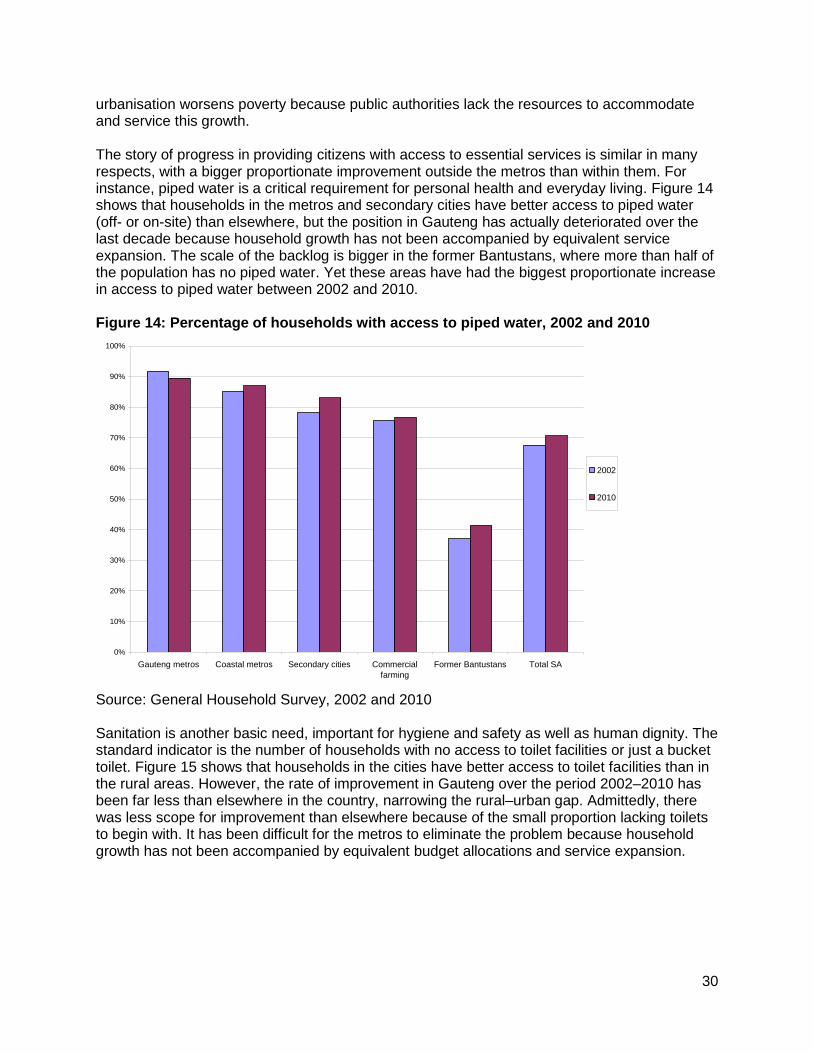
30
urbanisation worsens poverty because public authorities lack the resources to accommodate and service this growth. The story of progress in providing citizens with access to essential services is similar in many respects, with a bigger proportionate improvement outside the metros than within them. For instance, piped water is a critical requirement for personal health and everyday living. Figure 14 shows that households in the metros and secondary cities have better access to piped water (off- or on-site) than elsewhere, but the position in Gauteng has actually deteriorated over the last decade because household growth has not been accompanied by equivalent service expansion. The scale of the backlog is bigger in the former Bantustans, where more than half of the population has no piped water. Yet these areas have had the biggest proportionate increase in access to piped water between 2002 and 2010. Figure 14: Percentage of households with access to piped water, 2002 and 2010
0%
10%
20%
30%
40%
50%
60%
70%
80%
90%
100%
Gauteng metros Coastal metros Secondary cities Commercial
farming
Former Bantustans Total SA
2002
2010
Source: General Household Survey, 2002 and 2010 Sanitation is another basic need, important for hygiene and safety as well as human dignity. The standard indicator is the number of households with no access to toilet facilities or just a bucket toilet. Figure 15 shows that households in the cities have better access to toilet facilities than in the rural areas. However, the rate of improvement in Gauteng over the period 2002–2010 has been far less than elsewhere in the country, narrowing the rural–urban gap. Admittedly, there was less scope for improvement than elsewhere because of the small proportion lacking toilets to begin with. It has been difficult for the metros to eliminate the problem because household growth has not been accompanied by equivalent budget allocations and service expansion.
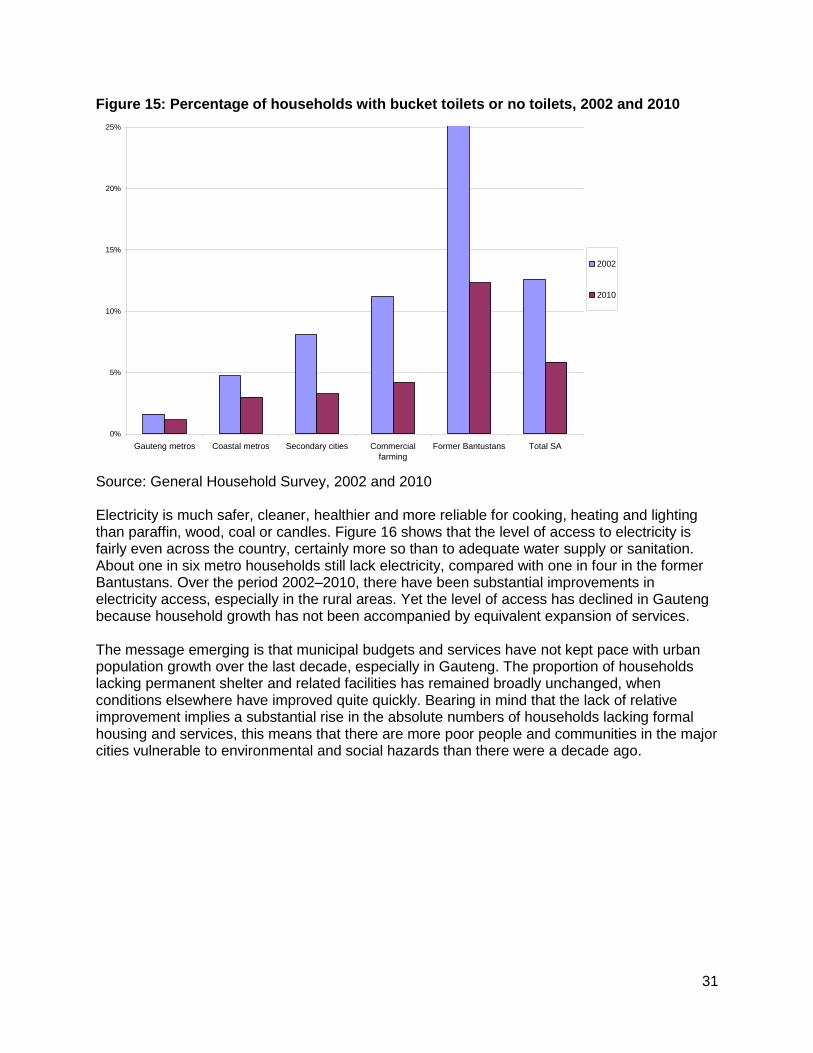
31
Figure 15: Percentage of households with bucket toilets or no toilets, 2002 and 2010
0%
5%
10%
15%
20%
25%
Gauteng metros Coastal metros Secondary cities Commercial
farming
Former Bantustans Total SA
2002
2010
Source: General Household Survey, 2002 and 2010 Electricity is much safer, cleaner, healthier and more reliable for cooking, heating and lighting than paraffin, wood, coal or candles. Figure 16 shows that the level of access to electricity is fairly even across the country, certainly more so than to adequate water supply or sanitation. About one in six metro households still lack electricity, compared with one in four in the former Bantustans. Over the period 2002–2010, there have been substantial improvements in electricity access, especially in the rural areas. Yet the level of access has declined in Gauteng because household growth has not been accompanied by equivalent expansion of services. The message emerging is that municipal budgets and services have not kept pace with urban population growth over the last decade, especially in Gauteng. The proportion of households lacking permanent shelter and related facilities has remained broadly unchanged, when conditions elsewhere have improved quite quickly. Bearing in mind that the lack of relative improvement implies a substantial rise in the absolute numbers of households lacking formal housing and services, this means that there are more poor people and communities in the major cities vulnerable to environmental and social hazards than there were a decade ago.
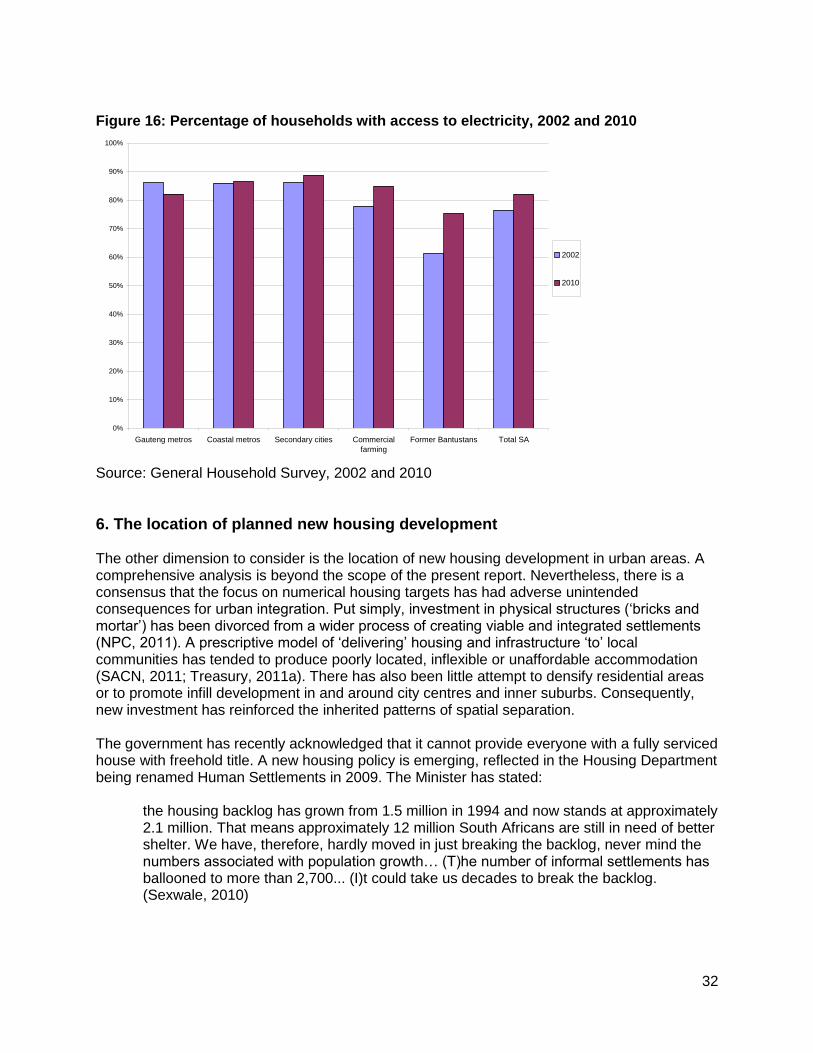
32
Figure 16: Percentage of households with access to electricity, 2002 and 2010
0%
10%
20%
30%
40%
50%
60%
70%
80%
90%
100%
Gauteng metros Coastal metros Secondary cities Commercial
farming
Former Bantustans Total SA
2002
2010
Source: General Household Survey, 2002 and 2010
6. The location of planned new housing development The other dimension to consider is the location of new housing development in urban areas. A comprehensive analysis is beyond the scope of the present report. Nevertheless, there is a consensus that the focus on numerical housing targets has had adverse unintended consequences for urban integration. Put simply, investment in physical structures (‘bricks and mortar’) has been divorced from a wider process of creating viable and integrated settlements (NPC, 2011). A prescriptive model of ‘delivering’ housing and infrastructure ‘to’ local communities has tended to produce poorly located, inflexible or unaffordable accommodation (SACN, 2011; Treasury, 2011a). There has also been little attempt to densify residential areas or to promote infill development in and around city centres and inner suburbs. Consequently, new investment has reinforced the inherited patterns of spatial separation. The government has recently acknowledged that it cannot provide everyone with a fully serviced house with freehold title. A new housing policy is emerging, reflected in the Housing Department being renamed Human Settlements in 2009. The Minister has stated:
the housing backlog has grown from 1.5 million in 1994 and now stands at approximately 2.1 million. That means approximately 12 million South Africans are still in need of better shelter. We have, therefore, hardly moved in just breaking the backlog, never mind the numbers associated with population growth… (T)he number of informal settlements has ballooned to more than 2,700... (I)t could take us decades to break the backlog. (Sexwale, 2010)
33
President Zuma recognised the problem when he called for a genuine ‘paradigm shift’ from housing to human settlements at a President’s Coordinating Council of the three spheres of government, convened specially for this purpose:
The concept of human settlements is not just about building houses. We have to change apartheid spatial patterns and ensure that low income households in rural or urban areas have easy access to economic centres. They must also have access to social amenities and key services such as water, electricity, recreational facilities, schools, clinics and a host of others. (Zuma, 2010)
This acknowledged that most new subsidy housing has been built on cheap land on the outskirts of cities and at low densities that inhibit the provision of public transport and other services. This has reduced its asset value that might have enabled people to launch home-based enterprises or to transfer their house to someone else and move on when their circumstances change. It may not be too emotive to say it has ‘fixed’ or ‘trapped’ people in isolated places that perpetuate disadvantage through exclusion from jobs and amenities. The ‘Delivery Agreement’ between the Presidency and Human Settlements stated that a more varied housing policy would be developed:
The current approach with a focus on the provision of state subsidised houses will not be able to meet the current and future backlog and there are questions related to its financial sustainability. We need to diversify our approach to include alternative development and delivery strategies, methodologies and products including upgrading of informal settlements. (Presidency, 2010)
There was also a commitment to enable competent municipalities to become housing authorities in their own right. This could prove highly significant in accelerating progress on the ground and facilitating spatial integration in future. We discuss this in Section 10 below.
7. The role of the urban transport system With little settlement restructuring taking place, the transport system has been under pressure to accommodate rising demand for travel and long-distance commuter flows from peripheral townships and informal settlements. Transport is crucial to creating more functional cities, and it needs to adapt to continuing urbanisation, growth in car ownership and rising congestion. Transport affects people’s access to opportunities and could help knit together the patchwork form of South African cities by encouraging higher-density development around transport hubs and along transport corridors. To be instruments of urban change, transport decisions need to be integrated with spatial planning, land and other infrastructure policies. In practice, transport policy is centralised and has been unresponsive to these challenges (Wilkinson, 2008; van Ryneveld, 2010; SACN, 2011). It has been dominated by the concerns of private motorists for efficient roads. The synergies between transport and built environment have been missed because of disconnected decision-making in administrative silos. Over 90 per cent of government funding is allocated to the provinces and to separate national entities such as the Passenger Rail Agency of SA and the SA National Roads Agency. There are many examples of these transport entities proving
34
unresponsive to local needs, most clearly in the case of the commuter rail networks, which are universally criticised for being overcrowded and unreliable. With disjointed institutions and separate funding streams, transport responses to urban sprawl have been piecemeal. There has been no attempt to reorganise urban transport systems post-1994, or to align transport and land-use policies to raise densities around transport hubs and corridors. The role of municipalities has been marginal, despite their responsibilities for land-use planning and the fact that travel patterns are predominantly local. The chairman of the Parliamentary Transport Committee stated:
More and more we are convinced that the secret to unlocking many of the problems lies in the municipal sphere. This is not to say that national does not have a role, which is to force national transport entities to work more closely with metros and align their policies. (Cronin, 2006)
The 2009 National Land Transport Act was the government’s initial response to this situation. It is designed to start an incremental process of devolving responsibilities for commuter rail and bus services to the metros. They will need to build up their capabilities for planning, financing, contracting and regulating such systems. In due course, this should help to create a more integrated and efficient public transport network, especially if accompanied by a substantial increase in public investment. In the meantime, the gap in public transport has been filled by the proliferation of informal minibus taxis. Although flexible and convenient, they are more costly to passengers, and more disorganised and dangerous than rail and bus services (Wilkinson, 2008; SACN, 2011). Taxis operate in a contested environment with fierce competition for passengers on the lucrative routes, resulting in a tendency to speed, disregard the highway code, and overload their vehicles. Overt power struggles between operators have been a recurring source of conflict. A ‘taxi recapitalisation programme’, launched by national government to replace worn-out, unsafe taxis with more efficient, modern vehicles, has had limited impact to date. Therefore, the somewhat anarchic, unregulated structure of the taxi industry remains (van Ryneveld, 2010; SACN, 2011). Commuter rail is important in several metros, offering advantages of fuel efficiency, lower operating costs and greater safety than other transport modes, particularly for high-volume corridors. The infrastructure and rolling stock have suffered long-standing neglect and under-investment (Wilkinson, 2008). A national agency is in charge, which means local management is weak and has ignored opportunities for property development in and around rail stations to boost revenues and enable people to live closer to work. The quality of rail services is poor and capacity has not kept pace with population growth. Poor maintenance and outdated signalling systems have prompted rumours that the networks are close to collapse. The 2010 football World Cup brought some cosmetic improvements to the main stations and rolling stock. Modernisation plans are currently being put in place, but the process will apparently take 20 years to complete. Bus services are much cheaper to establish and more flexible to operate than trains. The government provides large operating subsidies through the provinces to support commuter bus services run by private companies. The system was created under apartheid to enable poor blacks to commute long distances to work from outlying townships. The subsidies were calculated to ensure people paid an affordable fare, which meant longer trips received a larger subsidy per kilometre. This arrangement is inefficient and reinforces peripheral development
35
(Behrens and Wilkinson, 2003). On some longer routes, people commute to jobs that pay considerably less than the cost of the subsidy (Muller, 2010). It is bound to be more cost-effective in the long term to invest the subsidies in well-located housing. Since 1994, the government has struggled to renegotiate the subsidies and introduce competition because existing bus operators are so well established. Growing bus travel has increased the total subsidy paid out by 10 per cent a year on average (van Ryneveld, 2010). In summary, there has been little or no qualitative change in mainstream commuter rail, buses and minibus taxis over the last decade. Yet there have been new initiatives in other transport spheres: Gautrain, Bus Rapid Transit and road improvements. Public investment has been the catalyst, with spending increasing by more than 20 per cent a year between 2007/08 and 2010/11 (van Ryneveld, 2010). This was partly because improved transport services were identified as a key legacy of the World Cup. Much of the increase in expenditure occurred in the cities. The flagship was Gautrain, a fast train service linking Pretoria, Johannesburg and OR Tambo airport. This was a bold provincial initiative to shift middle-income perceptions of public transport and to relieve congestion on the main freeways. The chief concerns have been its high cost (a full third of total national spending on public transport over the last five years), its stand-alone character (not integrated into the existing transport system and urban fabric), and its focus on affluent travellers rather than poorer users of public transport. The Parliamentary Transport Committee advised against the project and advocated instead a more comprehensive public transport network integrating the three metros. Road improvements featured strongly prior to the World Cup. The pressure for road investment stems from growing traffic congestion and longer travel times, backed by a powerful lobby of private motoring interests and the car industry. Urban sprawl and the poor quality of public transport encourage private cars. Between 1997 and 2006, new car sales almost doubled from 367,000 to 647,000. The country’s largest road scheme is the Gauteng Freeway Improvement Project (GFIP), which aims to upgrade and expand the provincial road network through freeway widening, building new roads, upgrading interchanges, installing traffic-management systems (cameras and electronic signs) and an automated toll system. The first phase was completed in 2011. There is concern that continued investment in new and wider roads will boost road travel and bring congestion levels back to where they were within a few years. New freeways could also encourage further dispersal of employment from central nodes to outlying areas poorly served by public transport. Much will depend on the level at which road tolls are set and whether they cover the external costs of congestion and help pay for improved public transport. Given the powerful forces behind private transport, it will be very difficult for the government to use the full potential of the tolls to deter car use and to cross-subsidise public transport. Indeed the very introduction of the tolls was delayed during 2011–12 because of vociferous opposition from road users, and alternative funding mechanisms are now being examined. The main public transport initiative has been the launch of Bus Rapid Transit (BRT) systems in five cities, funded generously by national government but delivered by the metros. They are designed to be more transformative and scale-able, with modern buses running on dedicated lanes in the middle of the main roads (van Ryneveld, 2010). The system can penetrate the existing urban fabric through a mixture of trunk and feeder services. Dedicated bus-ways mean BRT vehicles travel relatively fast, especially during rush hour. Rising road congestion should make BRT increasingly attractive. Working with the minibus taxi industry to provide the feeder
36
services is beginning to help regularise taxi activities after several years of fraught negotiations. On the basis of Latin American experience, it is hoped that the BRT system will form a good basis for an integrated transport network offering safety, reliability, efficiency and affordability. Continued government support and careful handling of the taxi industry will determine the speed and extent to which the service can be rolled out, because the first phase has proved more expensive than anticipated. To summarise, there has not been a great deal of progress to change the spatial structure of South African cities in recent years. Government spheres have not worked well together to manage urban growth, and public investment in infrastructure has not met the level of need. As a result, the inherited patterns have been reproduced, with new settlements located far from opportunities. However, prospects are brighter following recent policy initiatives which lay the basis for a more integrated approach to the built environment, driven by the cities themselves.
8. The responsiveness of city government Effective planning and management of urbanisation depends on the strategic capabilities of city governments, defined in political, technical and administrative terms. These need to be balanced with local responsiveness and popular support in order to manage complex tensions and trade-offs and make the right choices. In December 2000, South Africa put in place a bold vision for metropolitan government, recognising that cities were integral to solving many of the country’s biggest problems. Disparate administrations originally created to serve separate racial communities were amalgamated to form large, fully democratic municipalities covering wide territories. Three compelling reasons were given for the creation of ‘developmental local government’ (DPLG, 1998), to:
1. distribute municipal resources more equitably across each city 2. promote spatial integration through careful planning and investment in infrastructure 3. strengthen the economies of cities in view of their national significance.
The 1996 Constitution recognised municipalities as a distinct sphere of government, with the right to govern on their own initiative (Boraine et al., 2006; Schmidt, 2008). They had a leading role in providing essential household services (water, electricity, sanitation, roads, etc) as the ‘hands and feet’ of the state. They were expected to be largely self-financing by charging for services and levying property rates. Supplementary government funding would meet historic disparities and pay for free-to-use services for the poor. The principle of ‘cooperative government’ required the three spheres to work together in good faith (Patel and Powell, 2008). This was essential for national sectoral programmes (housing, transport, schools, health, etc) to align with municipal spatial plans, regulatory functions and basic infrastructure. There have been many good examples of innovative practice and services being extended to marginalised communities (SACN, 2011). However, after a decade of local democracy, it has become apparent that: ‘local government is struggling to fulfil this developmental mandate’ (COGTA, 2009). The Delivery Agreement between the Presidency and COGTA during 2010 stated bluntly that:
There are many municipalities that are in deep distress. This distress refers to their faltering ability to deliver services, to manage their institutions, and to engage with communities… Municipalities were envisioned as sites where our commitment to participatory governance would achieve meaning and content. Instead communities feel alienated and disconnected from decision-making processes.
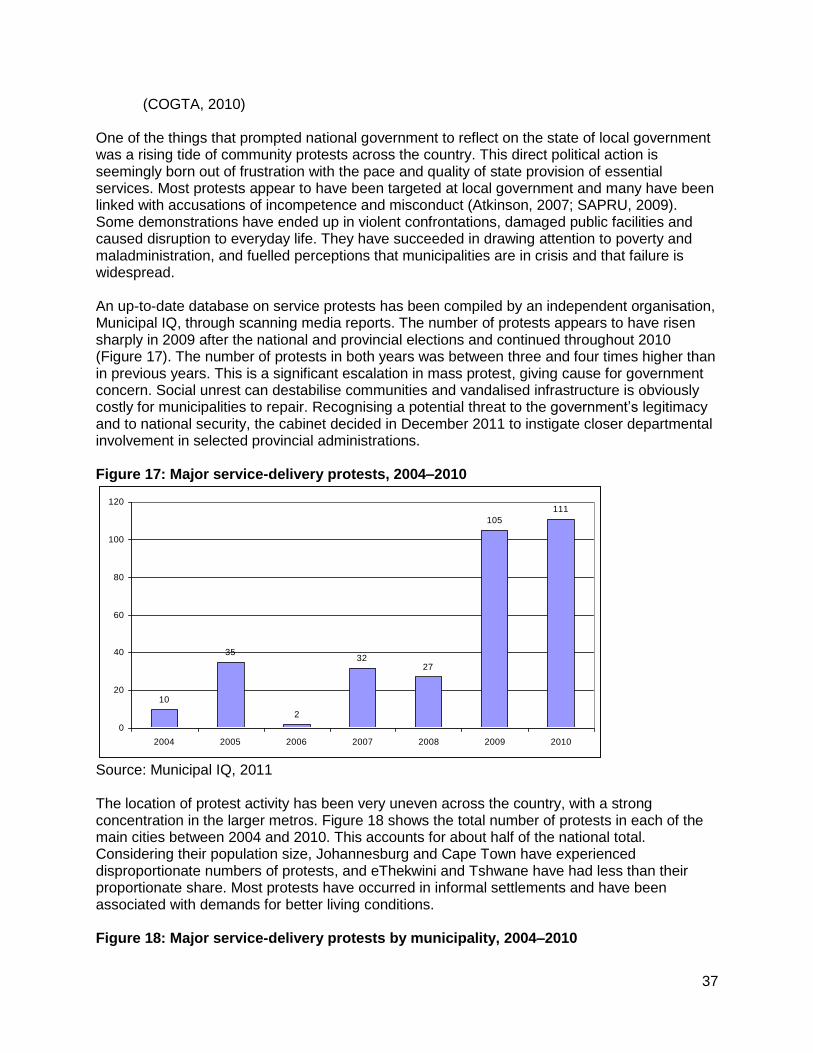
37
(COGTA, 2010) One of the things that prompted national government to reflect on the state of local government was a rising tide of community protests across the country. This direct political action is seemingly born out of frustration with the pace and quality of state provision of essential services. Most protests appear to have been targeted at local government and many have been linked with accusations of incompetence and misconduct (Atkinson, 2007; SAPRU, 2009). Some demonstrations have ended up in violent confrontations, damaged public facilities and caused disruption to everyday life. They have succeeded in drawing attention to poverty and maladministration, and fuelled perceptions that municipalities are in crisis and that failure is widespread. An up-to-date database on service protests has been compiled by an independent organisation, Municipal IQ, through scanning media reports. The number of protests appears to have risen sharply in 2009 after the national and provincial elections and continued throughout 2010 (Figure 17). The number of protests in both years was between three and four times higher than in previous years. This is a significant escalation in mass protest, giving cause for government concern. Social unrest can destabilise communities and vandalised infrastructure is obviously costly for municipalities to repair. Recognising a potential threat to the government’s legitimacy and to national security, the cabinet decided in December 2011 to instigate closer departmental involvement in selected provincial administrations. Figure 17: Major service-delivery protests, 2004–2010
10
35
2
3227
105
111
0
20
40
60
80
100
120
2004 2005 2006 2007 2008 2009 2010
Source: Municipal IQ, 2011 The location of protest activity has been very uneven across the country, with a strong concentration in the larger metros. Figure 18 shows the total number of protests in each of the main cities between 2004 and 2010. This accounts for about half of the national total. Considering their population size, Johannesburg and Cape Town have experienced disproportionate numbers of protests, and eThekwini and Tshwane have had less than their proportionate share. Most protests have occurred in informal settlements and have been associated with demands for better living conditions. Figure 18: Major service-delivery protests by municipality, 2004–2010
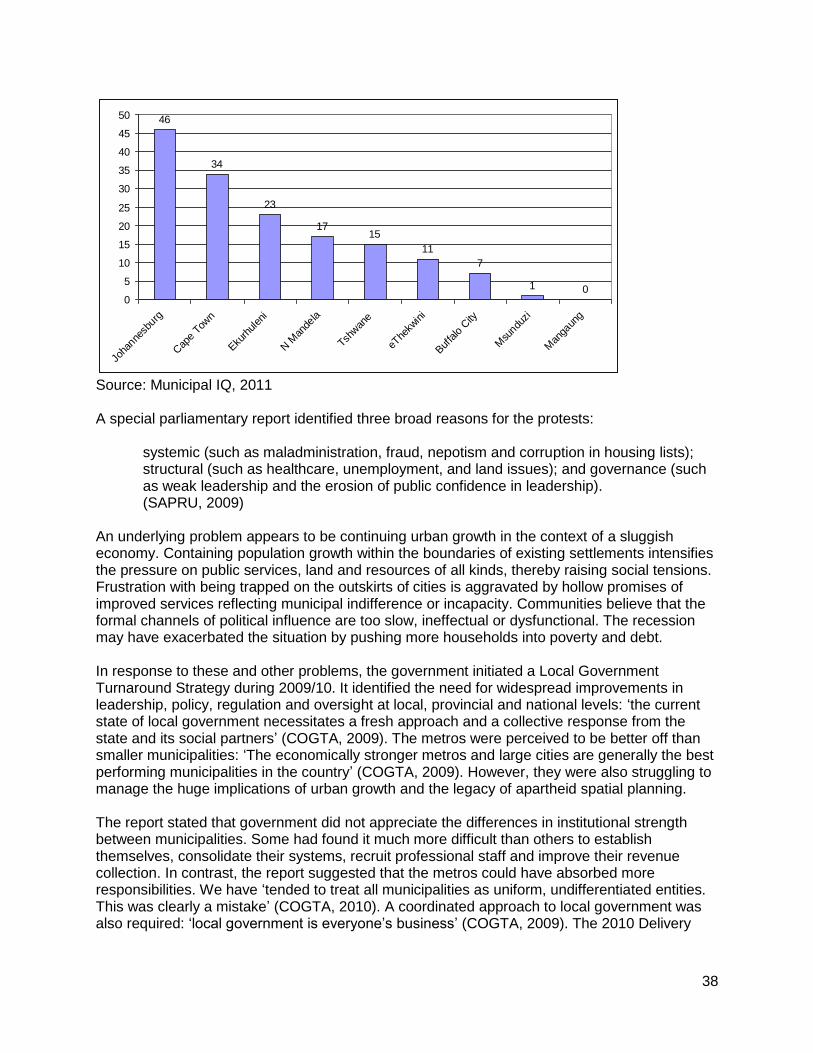
38
46
34
23
1715
11
7
1 00
5
10
15
20
25
30
35
40
45
50
Joha
nnesb
urg
Cap
e Tow
n
Eku
rhul
eni
N M
ande
la
Tshwan
e
eThe
kwin
i
Buf
falo
City
Msu
nduzi
Man
gaun
g
Source: Municipal IQ, 2011 A special parliamentary report identified three broad reasons for the protests:
systemic (such as maladministration, fraud, nepotism and corruption in housing lists); structural (such as healthcare, unemployment, and land issues); and governance (such as weak leadership and the erosion of public confidence in leadership). (SAPRU, 2009)
An underlying problem appears to be continuing urban growth in the context of a sluggish economy. Containing population growth within the boundaries of existing settlements intensifies the pressure on public services, land and resources of all kinds, thereby raising social tensions. Frustration with being trapped on the outskirts of cities is aggravated by hollow promises of improved services reflecting municipal indifference or incapacity. Communities believe that the formal channels of political influence are too slow, ineffectual or dysfunctional. The recession may have exacerbated the situation by pushing more households into poverty and debt. In response to these and other problems, the government initiated a Local Government Turnaround Strategy during 2009/10. It identified the need for widespread improvements in leadership, policy, regulation and oversight at local, provincial and national levels: ‘the current state of local government necessitates a fresh approach and a collective response from the state and its social partners’ (COGTA, 2009). The metros were perceived to be better off than smaller municipalities: ‘The economically stronger metros and large cities are generally the best performing municipalities in the country’ (COGTA, 2009). However, they were also struggling to manage the huge implications of urban growth and the legacy of apartheid spatial planning. The report stated that government did not appreciate the differences in institutional strength between municipalities. Some had found it much more difficult than others to establish themselves, consolidate their systems, recruit professional staff and improve their revenue collection. In contrast, the report suggested that the metros could have absorbed more responsibilities. We have ‘tended to treat all municipalities as uniform, undifferentiated entities. This was clearly a mistake’ (COGTA, 2010). A coordinated approach to local government was also required: ‘local government is everyone’s business’ (COGTA, 2009). The 2010 Delivery
39
Agreement reiterated that many government departments and agencies ignored the needs of municipalities (COGTA, 2010). The government clearly finds it difficult to treat municipalities differently. Some require more practical support than others because of simple administrative weaknesses or staff shortages. Others require additional financial assistance because of their fragile economies or growing populations. Some require closer oversight because of the risk of malpractice. The heightened negativity surrounding local government has prompted national government to introduce more stringent procedures for managing the affairs of all municipalities. More prescriptive rules and regulations are reducing the discretion available to the big metros, restricting their scope for creativity and innovation, and limiting their flexibility to respond to distinctive local needs. Greater procedural complexity in contracting and executing capital projects is also making it slower and more difficult for municipalities to invest in infrastructure. It is unsurprising that under-spending on municipal capital budgets rose from 14 per cent in 2008/09 to 25 per cent in 2010/11 (Treasury, 2011b).
9. Explanations for the lack of urban integration The creation of large metropolitan authorities a decade ago was intended to tackle the structural weaknesses of South African cities and reposition them on a new trajectory. They were to bring fundamental improvements to the quality of people’s lives and to the urban physical and social fabric. More than 11 years on, there is little doubt that less has been achieved than anticipated. Quantitative changes have been more significant than qualitative improvements. Economic opportunities have increased, only to be set back by the recession. Basic services have been extended to poor communities, but not at the rate required to keep pace with growing needs. Most important for this report, progress on spatial integration has proved elusive. The responsiveness of local government to community needs has also been found wanting in many places. All things considered, the country’s cities may be more vulnerable now to social unrest, environmental hazards and economic shocks than they were a decade ago. The full explanation for the continuing urban polarisation is undoubtedly complex, and the relative importance of different causes will differ between cities. At the risk of oversimplification, there appear to be three broad reasons for the limited progress on transformation since 1994: historical inertia (or path dependence), economic forces and governance shortcomings. 9.1 Path dependence Shifting the physical-development trajectory of a city is inevitably a slow process, unless the rate of growth and new development is exceptional, or there is a radical change in the approach to spatial management. Inertia is partly a reflection of inherent characteristics of the built environment, including the durability of fixed capital investment and the high cost of property transactions. It typically takes decades for infrastructure and buildings to become obsolete and to warrant the considerable expense of redevelopment and replacement. The processes involved in assembling fragmented parcels of land and organising property (re)development through market mechanisms can also be very long and drawn out. This is particularly evident in societies with strong private property rights and well-established mechanisms for landowners and other vested interests to contest development proposals going through the systems of planning and environmental regulation. One of the distinctive outcomes of South Africa’s negotiated political transition was the commitment given in the Constitution to safeguard private property rights by limiting the ability of
40
the state to restrict how landowners can use or develop their land. This has proved controversial because current landownership patterns reflect the history of dispossession and segregation. Land was confiscated from black people, while the value of white-owned land was enhanced by the state confirming use and development rights, and investing in quality infrastructure. There are at least two important urban consequences of the constitutional protection of private property rights (Berrisford, 2011). First, it is difficult for public authorities to develop land for low-income housing in well-located areas because neighbouring landowners complain that this limits their use and enjoyment of their land through reduced amenity, lower property values, increased crime, water pollution, and so on. Bremner (2000) describes the enormous frustrations and failures experienced with Gauteng’s Rapid Land Development Programme in the late 1990s as a result of these kinds of NIMBY (‘not in my backyard’) objections. Berrisford et al. (2008) describe similar problems with a different scheme in Ethembalethu. Building state housing on outlying greenfield sites has proved to be much simpler and less contentious. Second, municipalities are inhibited from trying to restrict private investment in well-off areas in order to steer development towards deprived areas (by curtailing unused development rights) because property owners can demand compensation, in accordance with the constitution. Another source of continuity is the fact that land-use planning is still governed by a raft of pre-democratic laws that were designed for social control and segregation rather than promoting integration:
The same laws that were used to implement apartheid’s grand plan of segregation and inequality remain the tools used by planners across the country to determine whether or not… land development projects should proceed. (Berrisford, 2011, p248)
Planning legislation has grown organically and incrementally over decades, and never been simplified or streamlined. This makes it very open to legal challenge and ill suited to the proactive purpose of stimulating urban restructuring. Spatial planning frameworks and zoning schemes are also often outdated and not designed to encourage densification and mixed-use development. It is essentially a reactive system that responds to development proposals on a site-by-site basis. It is poor at considering the cumulative effects of such decisions (e.g. in reinforcing historic patterns) or strategically steering development in different directions. Consequently, spatial planning tends to have little positive influence on development patterns on the ground. Furthermore, much of the housing built by government since 1994 has been on peripheral land originally bought and/or zoned by the apartheid government for township development, or located adjacent to or beyond existing townships (Harrison et al., 2003; Khan and Thring, 2003; Todes, 2003). This has occurred for straightforward pragmatic reasons that the land was available or could be developed more quickly than starting the whole process from scratch. The model of housing delivery followed since 1994 is also structured in a similar way to the one-off capital subsidy used by the previous government to provide serviced sites in planned townships (Harrison et al., 2003; Khan and Thring, 2003). There is considerable inertia, if not conservatism, among private property developers and investors in terms of their location preferences and established building practices. House-builders remain wedded to greenfield sites and struggle with the creative challenges of higher-density and mixed-income developments (Swilling, 2010). There has been no attempt to trigger a shift in paradigm whereby urban designers, architects, engineers, financiers and developers
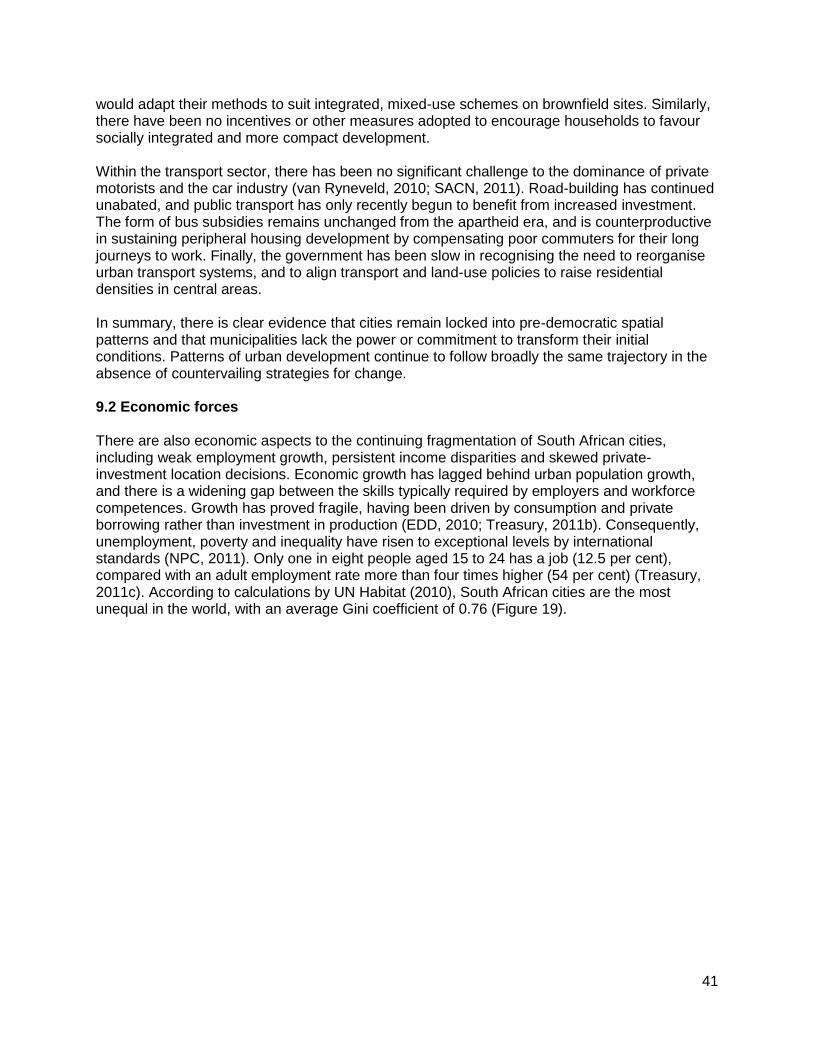
41
would adapt their methods to suit integrated, mixed-use schemes on brownfield sites. Similarly, there have been no incentives or other measures adopted to encourage households to favour socially integrated and more compact development. Within the transport sector, there has been no significant challenge to the dominance of private motorists and the car industry (van Ryneveld, 2010; SACN, 2011). Road-building has continued unabated, and public transport has only recently begun to benefit from increased investment. The form of bus subsidies remains unchanged from the apartheid era, and is counterproductive in sustaining peripheral housing development by compensating poor commuters for their long journeys to work. Finally, the government has been slow in recognising the need to reorganise urban transport systems, and to align transport and land-use policies to raise residential densities in central areas. In summary, there is clear evidence that cities remain locked into pre-democratic spatial patterns and that municipalities lack the power or commitment to transform their initial conditions. Patterns of urban development continue to follow broadly the same trajectory in the absence of countervailing strategies for change. 9.2 Economic forces There are also economic aspects to the continuing fragmentation of South African cities, including weak employment growth, persistent income disparities and skewed private-investment location decisions. Economic growth has lagged behind urban population growth, and there is a widening gap between the skills typically required by employers and workforce competences. Growth has proved fragile, having been driven by consumption and private borrowing rather than investment in production (EDD, 2010; Treasury, 2011b). Consequently, unemployment, poverty and inequality have risen to exceptional levels by international standards (NPC, 2011). Only one in eight people aged 15 to 24 has a job (12.5 per cent), compared with an adult employment rate more than four times higher (54 per cent) (Treasury, 2011c). According to calculations by UN Habitat (2010), South African cities are the most unequal in the world, with an average Gini coefficient of 0.76 (Figure 19).
42
Figure 19: Gini coefficient for urban areas of selected sub-Saharan countries
0.76
0.66
0.60.58
0.540.52
0.50.48
0.450.44
0.43
0.4
0
0.1
0.2
0.3
0.4
0.5
0.6
0.7
0.8
South
Afri
ca
Zambia
Zimba
bwe
Nam
ibia
Niger
ia
Malaw
i
Botsw
ana
Moz
ambiqu
e
Kenya
Ethiopia
Uga
nda
DR C
ongo
Source: UN Habitat, 2010, State of the World’s Cities 2010/11 Extreme income inequality is translated into spatial segregation through the ‘sorting’ process of the housing market. This has replaced the administrative processes of racial separation under apartheid. Households end up living in particular places according to their ability to pay for the quality of the location and its amenities. The high levels of income inequality and spatial segregation are reinforced by big disparities in the quality of schools, infrastructure and useful social networks, with the result that socio-economic status, race and space overlap and compound each other. Poor households cannot afford to buy or rent even small properties or land parcels in well-located areas, except perhaps through some informal arrangement. Many are forced into poverty traps on the margins of the city as a result of inequality generated in the labour market and reflected in the land market. The poorest of the poor are forced to occupy ‘leftover’ land that is vulnerable to natural and human hazards. According to this logic, the potential for state provision of low-income housing in more accessible locations may also be limited because the impact would be undermined by developers and households able to pay more for the property buying out poorer occupiers, a phenomenon known as ‘downward raiding’. Much would depend on the design of the housing, local planning regulations, rules governing re-sales and the incentives for developers to engage in such practices. Income inequality and unemployment are also reflected in the behaviour of property investors and developers. Major private house-builders and their financiers prefer to supply households with steady jobs and higher incomes because this is more secure and profitable. As a result, better-off areas of the city are favoured by the private sector for both greenfield and infill development projects (Todes, 2012). Although there are some notable exceptions, house-builders have generally resisted municipal efforts to secure a certain proportion of affordable or ‘inclusive’ housing within their developments on the grounds that this will reduce their prices and
43
saleability. Meanwhile, low-income areas of the city generally struggle to attract private investment, except for developers who specialise in building low-cost housing within the Reconstruction and Development Programme (RDP) on government contracts. The divergent spatial trajectories of private and public residential development have not been researched systematically, but evidence of this can be gleaned from the property pages of weekly newspapers and interviews with senior planners in the major cities. The segmentation of the city by income is also reflected in the location decisions of many established private employers and industrial and commercial property developers. The vast majority of new commercial and business park developments have located in and around high-income suburbs, reflecting confidence, herd-instinct behaviour and less congestion perhaps (SACN, 2011; Sinclair-Smith and Turok, 2012; Todes, 2012). Many inner-city areas seem to have been written off and abandoned by mainstream private investors, reinforcing a spiral of decline and decay. In some cases, the main activities remaining are municipal offices, some low-end retailers and informal street traders. In Port Elizabeth, East London, Johannesburg, Pretoria and Durban there is a striking contrast between the character of the inner cities and their affluent suburban commercial centres. In Johannesburg, Durban and Cape Town, new private investment is predominantly in and around the northern suburbs, rather than poorer areas to the south of these cities. One explanation given is the need for proximity to skilled professional, technical and managerial labour. Another is the uncertain operating environment for business in and around the townships, even for industrial and logistics companies that might benefit from proximity to a manual workforce. The gap between mainstream investor perceptions and reality on the ground is certainly worthy of further research. The townships do not seem to have attracted much private investment from domestic (South African) sources. On average, residents have low disposable incomes and insecure jobs. Subjective views of risk and insecurity reinforce doubts about these places as locations for commercial and industrial development. Electricity and water supply are sometimes less reliable than elsewhere because network capacity is limited or unauthorised connections make them more vulnerable to failure. The potential contributions of informal enterprises and township economic development have not received much government attention (NPC, 2011). A Neighbourhood Development Partnership Grant was introduced in 2006 to support new infrastructure and services in the townships in partnership with the private sector. However, take-up has been slow to date, with substantial under-spending (Treasury, 2011a). There is a risk of townships being stuck in a kind of low-level equilibrium with little economic dynamism. Yet there is an argument that their negative external reputation is exaggerated and their potential is actually significant. It might be possible to counteract the image and fear of the unknown through sustained municipal leadership and astute support. Steady population growth means rising consumer spending power (the ‘black Rand’), an expanding labour supply and growing capacity to pay municipal taxes. Although residents cannot afford as much as in affluent areas, in aggregate they can pay enough to sustain better public and private services, and should not be seen as an indefinite drag on state resources. Improved liveability would help to retain the skills and purchasing power of upwardly mobile households. Stimulating the informal economy could also spur dynamic new enterprises. Indeed, in many townships there is already evidence of novel forms of investment, ranging from networked Somalian, Ethiopian and Pakistani micro-enterprises, to branches of Chinese and American multinational retailers. This is in addition to the steady growth in township shopping malls over the last decade. The challenge is clearly to attract, nurture and develop more value-added activities in these places.
44
In summary, South African cities remain polarised because of persistent inequality and unemployment. Poor households cannot afford to live in well-located areas, and private investors tend to follow affluent consumers and highly skilled workers. Inequalities in the labour market are reinforced by a stratified housing market, which constrains upward social mobility and spatial change. 9.3 Governance shortcomings It was argued above that the national housing programme contributes to the continuing fragmentation of South African cities. A major review in 2004 acknowledged that the policy was extending ‘existing housing areas, often on the urban periphery, thereby achieving limited integration’ (Department of Housing, 2004). The bold promise to provide everyone with a free, fully serviced house has been part of the problem. Pressure to deliver large volumes within a finite budget has necessitated economising on the land costs and building on the urban outskirts. The focus on providing a physical structure also means that housing has not been embedded in a broader process to create viable communities. The resulting mono-functional settlements lack vitality and tie people to fixed assets that they are not permitted to sell or rent out even if their circumstances change. This risks creating poverty traps rather than upward mobility (Behrens and Wilkinson, 2003; NPC, 2011; SACN, 2011). The problems are multiplied by the occupants now having to pay electricity and water charges, which can cause indebtedness for people without jobs and incomes and result in disconnections. The prescriptive model of housing delivery to communities has tended to produce inflexible and unaffordable accommodation, rather than vibrant places where people can access the opportunities and amenities required to thrive. Transport policy has also failed to fulfil its potential to promote integration. Local rail and bus infrastructure is worn out and has failed to accommodate rising demand for travel from outlying settlements. Transport responses to urban sprawl have been piecemeal and perhaps even counterproductive. The major new transport initiatives since 1997 – Gautrain, Bus Rapid Transit schemes and freeway improvements – do not complement each other and have not been designed to support residential densification and urban restructuring. They also tend to serve contradictory purposes and population groups, having originated in different institutions. A third weakness has been a failure to develop stable and effective city leadership capable of formulating a coherent vision of spatial transformation, balancing the various considerations involved, putting the vision into practice through a coordinated approach, and standing up to vested interests when necessary. Overlapping responsibilities between government spheres and interference from above have confused lines of accountability. The provinces have prime responsibilities for housing and transport, and for environmental regulation, but municipalities have to bear the costs of poor location decisions in extended infrastructure (Treasury, 2011a). Government departments and agencies that own well-located vacant land have not cooperated in making it available for housing and other forms of necessary development. Political factionalism and cadre deployment have compounded friction between government spheres and destabilised many municipalities (COGTA, 2009; 2010). Turnover of senior politicians and officials has meant a lack of continuity and institutional memory. Instability also seems to have weakened appetites for long-term structural change in favour of short-term initiatives. It has hampered the development of trusting relationships with external stakeholders and the creation of a shared sense of purpose for urban restructuring. Political volatility has also diverted municipal efforts from engaging communities in settlement upgrading and channelling their energies in constructive directions (SACN, 2011).
45
Fourth, city governments have suffered from constrained technical and administrative capacity, including shortages of skilled professionals (COGTA, 2009; 2010; SAPRU, 2009). The metros were formed from complex amalgamations of separate administrations and incorporated large areas that lacked essential services. Their ambitious new mandates stretched their capabilities to the limit, yet they also had to transform their staff profile to be more representative of the wider population. Subsequent organisational restructuring and affirmative action have resulted in widespread loss of specialised expertise, especially in engineering, finance, planning and management. Political shifts have been accompanied by the replacement of senior officials and raised concerns about nepotism and excessive interference in technical decision making. Resulting operational problems have distracted attention from the major structural challenges faced (COGTA, 2009; 2010; SAPRU, 2009). Municipalities have also lacked the skills required for positive planning to make things happen on the ground, to strengthen their local economies, and to work with communities to revitalise townships and informal settlements. Conventional ways of providing public services (top-down and in silos) are wholly inadequate for urban regeneration and transformation (SACN, 2011). Municipal financial constraints are a fifth problem. The metros face many competing demands for expenditure: (i) to maintain and upgrade services to existing household ratepayers, (ii) to provide and sustain infrastructure to business ratepayers and inward investors, and (iii) to extend services to hitherto neglected townships and expanding informal settlements, many of which are not ratepayers. The first two categories are generally expected to be self-financing by charging for services and levying property rates (Treasury, 2011b). The government accepts the need for special support to fund free basic services for poor households, through a national ‘equitable share’ allocation based on population adjusted for the level of poverty. However, the baseline is the 2001 Census with no allowance for subsequent growth, which penalises urban areas and reinforces the misconception that urbanisation worsens poverty. Political pressures to extend free services to new, low-density settlements (based partly on an understandable sense of entitlement for historic reasons) tend to crowd out support for economic growth, and threaten the viability of many municipalities (Treasury, 2011a). The Treasury is also concerned that the increase in national grants to municipalities is reducing its own efforts to collect revenues due from local service users and ratepayers. It has been wary of either being perceived to be generous in municipal funding, or of giving municipalities undue discretion in how they spend their resources. With a few exceptions (such as transport), the financial environment has been quite tight, especially with the recession affecting municipal revenues since 2008 and the debts incurred with the World Cup in 2010. There have been few discretionary resources available in recent years to launch bold experiments in urban restructuring. Finally, many national programmes have inhibited municipal flexibility to tailor policies to local circumstances. The standardised RDP housing policy is an obvious example. Stringent conditions have also been introduced to regulate all sorts of municipal procedures, including procurement and staff recruitment. These have emerged in response to concerns about mismanagement in selected municipalities, but they have reduced the discretion available to all municipalities to respond appropriately to local conditions. A growing culture of auditing, scrutiny and compliance has also diverted resources from front-line delivery into back-office administration. Pressure to avoid negative audits has promoted risk-averse, backward-looking behaviour and restricted the creativity required to tackle complicated spatial problems. Greater procedural complexity in planning, contracting and executing capital projects has made it slower and more difficult for municipalities to invest in infrastructure. It is unsurprising that municipal
46
capital budgets have consistently been under-spent by between 20–30 per cent over the last six years (Treasury, 2011b). There are connections between these three explanations for the failure to disrupt historical patterns of development. Inertia partly reflects the lack of government focus and coordination at the city level, and government weakness is partly a function of powerful economic forces. Economic inequality has been compounded by under-resourced municipalities lacking strategic capabilities. Cities have been caught in something of a vicious cycle, which it has been difficult to break out of.
10. Devolving built-environment functions to the metros Within the last few years, several new policy initiatives have emerged that create the possibility for city governments to manage urban growth more effectively in future. The built environment fits squarely within the domain of appropriate municipal competences. Transferring additional responsibilities to municipalities could make it easier to start reshaping the urban landscape and knit together fragmented settlements through strategic interventions in transport, housing and land:
As housing and transport play such a vital role in land use patterns, the consolidation of these functions at the local level will provide both the leverage to change spatial patterns as well as improve accountability at the level of delivery. (Treasury, 2011a, p229)
In the housing field, a commitment has been made to speed up the accreditation of metro municipalities to plan and manage public housing programmes without needing provincial approval. Bypassing the provinces should give them greater control over the location of new projects, and help to align and embed housing within broader spatial planning and urban design processes. These will take considerations of settlement viability, sustainability and the availability of land and infrastructure into account. Municipalities should also have scope to support more varied forms of housing in line with local needs and community preferences, depending on the discretion they get from national government. The government has also created a new Urban Settlements Development Grant, which provides funds directly to municipalities to acquire, service and release land for low-income housing. One of the factors influencing the selection of areas receiving support is their access to economic opportunities. Subsidising the cost of buying and servicing land should help to bring about a shift in focus from providing complete houses in peripheral areas, towards upgrading informal settlements in better locations. This is an incentive for municipalities to get more directly involved in shack areas and should remove much of the policy ambiguity that has existed hitherto, provided the political will exists at the local level. They will need to develop new skills in working hand-in-hand with communities and NGOs to agree priorities and develop schemes of incremental improvement. Upgrading the infrastructure and living conditions in these areas will mean that many poor people become more secure and less vulnerable to environmental and social hazards. In the transport field, the government has indicated a commitment to devolve the planning, regulation and management of public transport services to local municipalities through the 2009 National Land Transport Act. This will give them greater control over the level, quality and geographical extent of bus and taxi services and the fares paid by passengers. Municipalities will be able to negotiate new, more efficient arrangements with bus operators, and influence taxi
47
services by controlling their licensing. They will be given a say too in the planning and operation of commuter rail services. A Public Transport Integration Committee will be set up in each city to organise the incremental transfer of responsibilities from existing transport authorities. Devolution should therefore create the means to coordinate and integrate different modes of public transport. It should also help connect transport decisions to housing investment and land-use decisions, and thereby promote more coherent spatial patterns through densification, mixed-use development and public transport. In spatial planning, there have been long-running disputes between municipalities and provinces over who determines the use and development of land. However, a Constitutional Court judgment in 2010 established that municipalities have principal responsibility for land-use planning and management. This clarification should help to reduce the duplication and confusion between the two spheres that has existed hitherto. Revisions are in the process of being made to the land-use planning legislation to reinforce this judgment and to strengthen the role of municipal spatial planning (NPC, 2011). This further improves the prospects of aligning land-use planning with housing and transport in pursuit of more integrated and sustainable urban development. A new Cities Support Programme involving several government departments has been initiated to help municipalities to develop the capacity to manage the built environment in ways that promote economic growth, access to jobs and services, and environmental sustainability. It will incorporate elements of coaching, peer review, improved monitoring and learning from international good practice. This could in due course lead to a change in the system of fiscal transfers to municipalities to reward performance on the basis of quality outcomes rather than crude numerical outputs (Treasury, 2011a). There are many uncertainties about the financial implications of devolution. This is the main reservation municipalities have about the process, and it could make or break its success. They are concerned that an unreasonable burden for upgrading and maintaining public transport and housing programmes will fall on local ratepayers. Although Treasury documents indicate that substantial government support will continue, it is clear that the local burden is also expected to increase: ‘Most funding for infrastructure investment must ultimately come from within city administrations’ (Treasury, 2011a, p228); and ‘Cities need to take greater responsibility for operational costs of integrated public transport networks’ (Treasury, 2011b, p39). Municipal officials harbour doubts about these claims based on the investment backlogs they face and the fact that in many other countries central government incurs a larger share of the cost of local services. It is possible that, with a recovery in macro-economic circumstances from their current malaise, additional funds will be forthcoming from the Treasury, especially if the quality of municipal plans and performance improves in the meantime.
11. An assessment of the prospects for devolution With the honeymoon of the political transition from apartheid now over, there is greater recognition of the practical difficulties of achieving economic and social transformation. It has become clear that formulating progressive policies, passing laws and creating city-wide municipal institutions may have little impact on entrenched spatial patterns. In response to growing urban problems, a new agenda is emerging, focused on devolving additional built-environment powers and functions to city authorities. It is to be hoped that this will encourage more integrated urban planning and growth management, and thereby help to make cities more functional by stitching together the fragmented spatial form and improving the prospects for poor communities.
48
There are various reasons why devolution could help, at least in principle. Better alignment of institutional planning, fiscal responsibilities and regulatory functions should generate efficiencies and reduce administrative duplication and delay. Being closer to communities and firms, policies are more likely to be designed in accordance with local needs, and greater transparency should mean wasteful expenditure is less likely to be tolerated (Treasury, 2011a). Democratic accountability and pressure to improve conditions on the ground for the majority of the population may be greater. Coordination of sectoral policies should be simpler, smoother and speedier in a municipality than in a large provincial or national institution, and it may be easier to balance economic, social and environmental considerations in the light of local realities. Decentralisation makes collaboration with civil society and the private sector more manageable, which should help to make the task of shifting attitudes and investment patterns slightly simpler. There are several immediate benefits that one might anticipate from devolution. Municipalities could stop building free-standing RDP houses in marginal locations. They could shift funding towards settlement upgrading for the many instead of new houses for the few. In the course of becoming more directly involved in informal settlements, they could seek opportunities to work with communities and channel their energies into constructive activities. Local control over public transport systems should permit improvements in reliability, safety and through-ticketing between trains, buses and taxis. Being in control of the policy levers of transport and housing – as well as basic infrastructure – could strengthen municipal negotiations with investors and make it easier to prevent piecemeal development on the periphery in favour of a shift towards mixed-use, mixed-income schemes around transport hubs and corridors. Of course, devolution is only the first step in formulating and implementing improved urban growth strategies. Without other necessary changes, there are risks involved in transferring responsibilities in this way. Some municipalities may be overwhelmed by the scale of the challenges and unable to develop the expertise required to respond effectively. Policies are bound to develop differently between cities, which may give rise to criticisms of inconsistency and unfairness from civil society and the private sector. Some metros may make mistakes that could otherwise have been avoided – failing to spend their budgets or investing inappropriately as a result of technical inadequacies or political interference. Municipalities may succumb more easily than provincial or national departments to pressure from vested interests. They may continue to operate in silos and ignore the need to work in partnership with local communities. Policies may become inward-looking and neglect the position of the city within the wider region and its relationships with cities in other regions and nations. For devolution to prove effective, it is likely to require a series of other changes, beginning with improvements in municipal leadership and organisational capabilities. A long-term vision and determination will be required to push through the changes needed for spatial transformation. This will require greater continuity among senior politicians and officials to acquire experience, confidence and credibility, and less external interference in municipal affairs. The metros will also need to develop the knowledge and assemble the teams of skilled planners, surveyors, engineers, architects, environmentalists and other professionals who can work together creatively to reconfigure urban infrastructure networks and start shifting physical development patterns in desired directions. Improved skills and competences will be required to create partnerships and negotiate deals with landowners, investors and developers to bring forward imaginative projects that can help connect the urban fabric and create viable and valued places where people want to live, work and socialise.
49
Active cooperation from national government is also vital. Central departments may be tempted to shift all responsibility for built-environment functions to the metros in order to curtail their own obligations, but this will not help. National government has unique strategic, financial and regulatory powers and legitimacy required for urban restructuring. These include control over the substantial underutilised land holdings of government departments and state-owned enterprises. Unlocking these assets could catalyse the integration process. National legislation governing spatial planning and land-use management also needs modernisation to create a system that plays a constructive role in designing new possibilities for urban development through positive plans, frameworks and principles for improved design. The metros may need wider powers to acquire and swap scarce land parcels, and to capitalise on the rise in land values that results from public investment in infrastructure. Central influence over the investment decisions of state entities responsible for electricity, water, transport and telecommunications is important in developing the economic dimension of sustainable settlements. Employment and economic development should be integral features of improved urban planning and growth management. An explicit, national urban-policy framework would help secure support across government for integrated planning and place-making. Metros with proven capabilities could be given new freedoms and flexibilities to develop this challenging agenda through experimentation and innovation. Above all, national government needs to work hand-in-hand with the metros to find ways of funding the high levels of investment required to develop, maintain and upgrade the infrastructure needed for urban transformation.
12. Conclusion South Africa has a troubled history of extreme policies aimed at spatial engineering – first to accelerate forcibly a peculiar form of urbanisation and then to resist and reverse it. This has created a situation in which there is now great sensitivity towards spatial policies and a general reluctance to be seen to be giving overt preference to urban areas or to be encouraging rural-to-urban migration. Consequently, there has been no explicit urban policy framework or strategy to manage urbanisation since the democratic government came to power in 1994, much to the surprise of many observers. Nevertheless, the relative economic success of the cities and the fragility of rural economies have further widened spatial inequalities and reinforced the misalignment between jobs and population. People have continued to move towards the cities on their own accord in search of better livelihoods or improved public services. This is a difficult and risky process for individuals and families because of the costs of travel, the challenge of finding somewhere to live, and the highly competitive urban labour market. The government at different levels has done little to support urbanisation directly, partly because it is ambivalent about rural–urban migration and sensitive to the short-term costs of accommodating more and more people in the big cities. Consequently, the destination for many incoming migrants has been unauthorised or informal settlements, often on the outskirts of cities. Many of these places are overcrowded and lack essential services such as water, sanitation, electricity and refuse removal, let alone schools and health clinics. Many shack areas are exposed to flooding, subsidence and the spread of fire and disease. Hence they are often unhealthy, unsafe, hazardous and generally dangerous places to live. The lack of proper drainage and sewerage systems also means they pollute watercourses and damage regional ecosystems. Illegal electricity and water connections can also make regional infrastructure networks more vulnerable to failure.
50
A series of other urban environmental concerns looms large, including water scarcity, energy shortages and overloaded sewage treatment facilities. Inadequate capacity and poor maintenance mean that these ageing infrastructure systems are often buckling under the pressures of population and economic growth. Meanwhile, climate-change obligations require more vigorous efforts to develop alternative energy sources, reduce energy consumption, promote public transport, and recycle waste and water. South African cities have unusually large carbon footprints because of the country’s heavy reliance on coal-generated electricity and private transport. The history of gold mining in Gauteng has also created a unique ‘acid mine drainage’ problem. This stems from rising water levels in old mine shafts that are polluted by acid and metals. Unless the water is pumped out and treated, it will apparently flow out and contaminate various parts of the region within a few years, including Johannesburg city centre and various informal settlements. The physical and social exclusion of people migrating to the cities has not helped to spread the benefits of concentrated economic growth more widely. It is also difficult for people to generate their own livelihoods through trade or providing local services when they are confined to outlying areas where average disposable incomes are low. Where public services have been provided, the costs of bulk infrastructure or transport subsidies have been relatively high because of the long distances involved, adding to the burden on municipal taxpayers. Over-stretched municipalities struggle with the competing demands of different communities to reduce the backlogs, maintain existing services in better-off areas, and accommodate new population growth. The government’s approach to urbanisation has been mainly reactive and sometimes indifferent to date. Municipalities have tried to prevent informal settlements emerging and to contain the growth of existing settlements. They have periodically evicted people from state-owned land intended for other uses, although the courts have sometimes stood in the way. One of the negative effects of controlling informal settlements has been to increase population densities within existing areas through backyard shacks. This has created intense pressure in terms of social tensions, overcrowding and competition for scarce resources. People have migrated to the cities in search of better lives, but are then frustrated by the poor conditions and lack of opportunities. More positively, municipalities have set up disaster-management units to help communities cope with the consequences of shack fires, flooding and other hazards. Some have invested in improved infrastructure and services to improve the quality of life for residents. A new government grant supports the upgrading of existing settlements and the creation of new housing opportunities in better locations by subsidising the acquisition, servicing and release of land for low-income housing. Combined with the devolution of built-environment functions to the metros, this could just become the foundation for a step change in urban policy towards a more positive, forward-looking and integrated approach.
51
References Atkinson, D. 2007. Taking to the streets: Has developmental local government failed in South Africa? In: Buhlungu, S. et al. (eds). State of the Nation: South Africa 2007. HSRC Press, Cape Town.
Baines, G. 1995. The politics of welfare: The provision of housing and services in New Brighton, Port Elizabeth. Kronos 22 87–114.
Behrens, R. and Wilkinson, P. 2003. Housing and urban passenger transport policy and planning in South African cities: A problematic relationship? In: Harrison, P. et al. (eds). Confronting Fragmentation: Housing and urban development in a democratising society. Cape Town University Press, Cape Town, pp154–174.
Berrisford, S. 2011. Unravelling apartheid spatial planning legislation in South Africa: A case study. Urban Forum 22 247–263.
Berrisford, S., DeGroot, D., Kihato, M. et al. 2008. In Search of Land and Housing in the New South Africa: The case of Ethembalethu. World Bank Working Paper 130. World Bank, Washington DC.
Bertaud, A. 2002. The spatial organisation of cities: Deliberate outcome or unforeseen consequence? World Bank, Washington DC. See www.alain-bertaud.com.
Bertaud, A. and Malpezzi, S. 2003. The spatial distribution of population in 48 world cities: Implications for economies in transition. See www.alain-bertaud.com.
Bonner, P. and Nieftagodien, N. 2001. Kathorus: A history. Maskew Miller Longman, Cape Town.
Boraine, A. et al. 2006. The state of South African cities a decade after democracy. Urban Studies 43(2) 259–284.
Bremner, L. 2000. Post-apartheid urban geography: A case study of Greater Johannesburg’s Rapid Land Development Programme. Development Southern Africa 17(1) 87–104.
City of Cape Town. 2009. Cape Town densification strategy. Technical report. Cape Town: City of Cape Town. www.capetown.gov.za/en/sdf
COGTA (Department of Cooperative Government and Traditional Affairs) (2009) State of Local Government in South Africa. COGTA, Pretoria.
COGTA (Department of Cooperative Government and Traditional Affairs) (2010) Delivery Agreement for Outcome 9: A responsive, accountable, effective and efficient local government system. COGTA, Pretoria.
Cronin, J. 2006. Interview with Jeremy Cronin. Delivery Magazine pp16–18.
Cross, C. 2010. Shack settlements as entry to the labour market: Towards testing upgrading paradigms. Paper to Urban Landmark Conference, September.
Department of Housing. 2004. Breaking New Ground, Pretoria: Department of Housing
Department of Provincial and Local Government (DPLG). 1998. Local Government White Paper, Pretoria: DPLG
Department of Transport. 2004. The First South African National Household Travel Survey 2003: Key results, Pretoria: Department of Transport

52
Duranton, G. and Puga, D. 2004. Micro-foundations of urban agglomeration economies. In: Henderson, V. and Thisse, J. (eds). Handbook of Urban and Regional Economics, Vol 4. North Holland, Amsterdam, pp2063–2117.
EDD (Economic Development Department) 2010. New Growth Path. EDD, Pretoria.
Giraut, F. and Vacchiani-Marcuzzo, C. 2009. Territories and Urbanisation in South Africa: Atlas and geo-historical information system. Institut de Recherche Pour le Developpement, Paris.
Glaeser, E. 2011. Triumph of the City. Macmillan, London.
Harber, A. 2011. Diepsloot. Jonathan Ball Publishers, Johannesburg.
Harrison, P., Huchzermeyer, M. and Mayekiso, M. (eds) 2003. Confronting Fragmentation: Housing and urban development in a democratising society. Cape Town University Press, Cape Town.
Huchzermeyer, M. 2011. Cities with ‘Slums’: From informal settlement eradication to a right to the city in Africa. UCT Press, Cape Town.
Khan, F. and Thring, P. (eds) 2003. Housing Policy and Practice in Post-Apartheid South Africa. Heinemann, Sandown.
Makgetla, N. 2010. Rural Development: Synthesis paper. Development Bank of Southern Africa, Midrand.
Maylam, P. 1990. The rise and decline of urban apartheid. African Affairs 89 57–84.
Muller, M. 2010. Setting apartheid in concrete: Lessons from the Moloto Road. The Thinker 12 18–20.
Municipal IQ 2011. Municipal Hotspots Monitor. See www.municipaliq.co.za.
NPC (National Planning Commission) 2011. National Development Plan. NPC, Pretoria.
OECD 2011. OECD Territorial Reviews: The Gauteng city-region, South Africa 2011. OECD Publishing, Paris.
Parnell, S. and Mabin, A. 1995. Rethinking urban South Africa. Journal of Southern African Studies 21(1) 39–61.
Patel, Y. and Powell, D. 1998 ‘Intergovernmental delivery in municipal areas: reflections on current practice’, chapter in van Donk, M., Swilling, M., Pieterse, E. and Parnell, S. (eds) (2008) Consolidating Developmental Local Government: Lessons from the South African Experience, Cape Town: UCT Press
Presidency 2008. Towards a Fifteen Year Review: Synthesis report. Pretoria.
Presidency 2010. Outcome 8 Delivery Agreement: Sustainable human settlements. Pretoria.
van Ryneveld, P. 2010. Assessment of Public Transport in SA Cities. Institute for Transportation and Development Policy, New York.
SACN (South African Cities Network) 2011. 2011 State of SA Cities Report. SACN, Johannesburg.
SAPRU (South African Parliament Research Unit) 2009. A Report on the Current Service Delivery Protests in SA. SAPRU, Cape Town.
Schmidt, D. 2008. From spheres to tiers: Conceptions of local government in South Africa in the period 1994–2006. In: van Donk, M. et al. Consolidating Developmental Local Government. UCT Press, Cape Town, pp109–130.
53
Sexwale, T. 21 April 2010. Human Settlements Budget Vote Address to the National Assembly, Cape Town. See www.dhs.gov.za.
Sinclair-Smith, K. and Turok, I. 2012. The changing spatial economy of Cape Town. Development Southern Africa.
Smith, D.M. (ed.) 1992. The Apartheid City and Beyond. Routledge, London.
Statistics SA 2010. GHS Series Volume II: Housing 2002–2009. Report 03-18-01. Statistics SA, Pretoria.
Storper, M. 2010. Agglomeration, trade and spatial development: Bringing dynamics back in. Journal of Regional Science 50 313–342.
Swilling, M. 2010. Dealing with sustainability. In: Pieterse, E. (ed.). Counter-Currents: Experiments in sustainability in the Cape Town region. Jacana Media, Cape Town.
Swilling, M. et al. (eds) 1991. Apartheid City in Transition. Oxford University Press, Cape Town.
Terreblanche, S. 2002. A History of Inequality in South Africa. University of Natal Press, Scottsville.
Todes, A. 2003. Housing, integrated urban development and the compact city debate. In: Harrison, P. et al. (eds). Confronting Fragmentation: Housing and urban development in a democratising society. Cape Town University Press, Cape Town.
Todes, A. 2012. Urban growth and strategic spatial planning in Johannesburg. Cities 29 158–169.
Treasury 2011a. Local Government Budgets and Expenditure Review 2006/7–2012/13. National Treasury, Pretoria.
Treasury 2011b. Medium Term Budget Policy Statement. National Treasury, Pretoria.
Treasury 2011c. Confronting Youth Unemployment: Policy options for South Africa. National Treasury, Pretoria.
Turok, B. 1976. Inequality as State Policy: The South African case. Open University, Milton Keynes.
Turok, I. 1994. Urban planning in the transition from Apartheid: The legacy of social control. Town Planning Review 65 243–259.
Turok, I. 2010. Towards a Developmental State? Provincial economic policies in South Africa. Development Southern Africa 27(4) 497–515.
Turok, I. (forthcoming) Unleashing the Economic Potential of African Cities. UN-Habitat, Nairobi.
Turok, I. and Parnell, S. 2009. Reshaping cities, rebuilding nations: The role of national urban policies. Urban Forum 20(2) 157–174.
UN Habitat. 2010. State of the World’s Cities 2010/11
United Nations, Department of Economic and Social Affairs, Population Division. 2012. World Urbanization Prospects: The 2011 Revision, CD-ROM Edition
Vacchiani-Marcuzzo, C. 2005. Mondialisation et Systeme de Villes (unpublished PhD thesis). University of Paris, Paris.
Wilkinson, P. 2008. Reframing urban passenger transport as a strategic priority for developmental local government. In: van Donk, M. et al. (eds). Consolidating Developmental Local Government. UCT Press, Cape Town, pp203–221.
54
Wilson, F. 1972. Labour in the South African Gold Mines, 1911–1969. Cambridge University Press, Cambridge.
World Bank 2009. World Development Report 2009: Shaping economic geography. World Bank, Washington DC.
Yudelman, D. 1984. The emergence of modern South Africa: State, capital, and the
incorporation of organised labour on the South African gold fields, 1902–1939. David Philip, Cape Town.
Yudelman, D. and Jeeves, A. 1986. New labour frontiers for old: black migrants to the South African gold mines, 1920–51. Journal of Southern African Studies 13(1) 101–124.
Zuma, J. 18 May 2010. Address to the special President’s Coordinating Council on Human Settlements. Pretoria.
55
Recent Publications by IIED’s Human Settlements Group
WORKING PAPER SERIES
All working papers can be downloaded at no charge. For a complete list, see http://www.iied.org/human-settlements/group-publications/publications
URBAN POVERTY Urbanization, gender and urban poverty: paid work and unpaid carework in the city – Cecilia Tacoli (2012) Engaging with the urban poor and their organizations for poverty reduction and urban governance: An issues paper for the United Nations Development Programme - David Satterthwaite, Diana Mitlin and Sheela Patel (2011) Appropriateness of the Sri Lanka poverty line for measuring urban poverty: The case of Colombo - Kulasabanathan Romeshun and Geetha Mayadunne (2011)
Capital, capacities and collaboration: the multiple roles of community savings in addressing urban poverty – Diana Mitlin, David Satterthwaite and Sheridan Bartlett (2011) Understanding pro-poor housing finance in Malawi - Mtafu A.Z. Manda, Siku Nkhoma and Diana Mitlin (2011) Interrogating Urban Poverty Lines – the Case of Zambia - Miniva Chibuye (2011) Assessing the Scale and Nature of Urban Poverty in Buenos Aires – Jorgelina Hardoy with Florencia Almansi (2011) Broadening Poverty Definitions in India: Basic Needs in Urban Housing - S. Chandrasekhar and Mark R. Montgomery (2010) Poverty lines in Greater Cairo: Underestimating and Misrepresenting Poverty –Sarah Sabry (2009) Poverty Lines and Lives of the Poor: Underestimation of Urban Poverty, the case of India –Meera Bapat (2009) Community Finance: the News from Asia and Africa. Report of a workshop held in November 2007 – Asian Coalition for Housing Rights (2008) Urban Poor Funds; Development by the People for the People – Diana Mitlin (2008) Building Homes, Changing Official Approaches: the Work of Urban Poor Federations and their Contributions to Meeting the Millennium Development Goals in Urban Areas – Celine D’Cruz and David Satterthwaite (2005) Catalysing Pro-Poor Development; the Role of Savings and Savings Organizations: Key Issues arising from an International Workshop on Housing Finance and Poverty – Diana Mitlin (2005)
56
The Under-estimation of Urban Poverty in Low- and Middle-income Nations – David Satterthwaite (2004) RURAL–URBAN International migration and over-indebtedness: the case of Filipino workers in Italy - Charito Basa, Violeta De Guzman and Sabrina Marchetti (2012) Climate change, adaptation strategies and mobility: evidence from four settlements in Senegal / Changements climatiques, stratégies d’adaptation et mobilités. Evidence à partir de quatre sites au Sénégal- Mohamadou Sall, Al Assane Samb, Serigne Mansour Tall and Aly Tandian (2011) Rural migration in Bolivia: the impact of climate change, economic crisis and state policy - Carlos Balderrama Mariscal, Nico Tassi, Ana Rubena Miranda, Lucía Aramayo Canedo, Iván Cazorla (2011) Not only climate change: mobility, vulnerability and socio-economic transformations in environmentally fragile areas in Bolivia, Senegal and Tanzania – Cecilia Tacoli (2011) International Migration, Social Change and Local Governance in Ourossogui and Louga, Two Small Urban Centres in Senegal – Mohamadou Sall, Serigne Mansour Tall, Aly Tandian, Al Assane Samb, Abdou Khadre Sano and Souleymane Sylla (2010) Migration, Local Development and Governance in Small Towns: Two Examples from the Philippines – Charito Basa and Lorna Villamil with Violeta de Guzman (2009) Migration and Small Towns in China: Power Hierarchy and Resource Allocation – Bingqin Li and Xiangsheng An (2009) Migration and Small Towns in Pakistan – Arif Hasan and Mansoor Raza (2009) Urbanization and Rural Development in Viet Nam's Mekong Delta: Livelihood Transformations in Three Fruit Growing Settlements - Hoang Xuan Thanh, Thi Thu Phuong Dinh, Thu Huong Nguyen and Cecilia Tacoli (2008) Toward Synergistic Rural–Urban Development: the Experience of the Rural–Urban Partnership Programme (RUPP) in Nepal – S.F. Momen (2006) Rural-Urban Migration in China: Policy Options for Economic Growth, Environmental Sustainability and Equity – Gordon McGranahan and Cecilia Tacoli (2006) Livelihood Diversification and Rural–Urban Linkages in Vietnam’s Red River Delta – Anh, Dang Nguyen, Hoang Xuan Thanh and Cecilia Tacoli (2005) Rural–Urban Change, Boundary Problems and Environmental Burdens – Gordon McGranahan, David Satterthwaite and Cecilia Tacoli (2004)
57
WATER AND SANITATION Groundwater, Self-supply and Poor Urban Dwellers: A Review with Case studies of Bangalore and Lusaka – Jenny T. Gronwall, Martin Mulenga and Gordon McGranahan (2010) Urban Water and Sanitation in Ghana: How Local Action is Making a Difference - Kanton I. Osumanu, Lukman Abdul-Rahim, Jacob Songsore and Farouk R. Braimah with Martin Mulenga (2010) Improving Water and Sanitation Provision in Buenos Aires: What can a Research-oriented NGO do? – Florencia Almansi, Ana Hardoy and Jorgelina Hardoy (2010) Water Service Provision for the Peri-urban Poor in Post-conflict Angola – Allan Cain and Martin Mulenga (2009) Water and Sanitation in Urban Malawi: can the Millennium Development Goals be Met? A Study of Informal Settlements in Three Cities – Mtafu A. Zeleza Manda (2009) Lessons from Karachi: The role of Demonstration, Documentation, Mapping and Relationship Building in Advocacy for Improved Urban Sanitation and Water Services – Arif Pervaiz, Perween Rahman and Arif Hasan (2008) Local Water and Sanitation Companies and the Urban Poor – Gordon McGranahan and David Lloyd Owen (2006) Informal Water Vendors and the Urban Poor – Marianne Kjellén and Gordon McGranahan (2006) Governance and Getting the Private Sector to Provide Better Water and Sanitation Services to the Urban Poor – Gordon McGranahan and David Satterthwaite (2006) URBAN CHANGE Africa’s Urban Transition and the Role of Regional Collaboration – Gordon McGranahan, Diana Mitlin, David Satterthwaite, Cecilia Tacoli and Ivan Turok (2009) The Transition to a Predominantly Urban World and its Underpinnings – David Satterthwaite (2007) Urban Environments, Wealth and Health: Shifting Burdens and Possible Responses in Low and Middle-income Nations – Gordon McGranahan (2007) Outside the Large Cities: the Demographic Importance of Small Urban Centres and Large Villages in Africa, Asia and Latin America – David Satterthwaite (2006) A Pro-poor Urban Agenda for Africa; Clarifying Ecological and Development Issues for Poor and Vulnerable Populations. A Report for the Ford Foundation - Joel Bolnick, Happy M Kayuni , Richard Mabala, Gordon McGranahan, Diana Mitlin, Sikhulile Nkhoma, John Oucho, Amal Sabri, Sarah Sabry, David Satterthwaite, Mark Swilling, Cecilia Tacoli, Richard I C Tambulasi and Mirjam van Donk (2006)
58
CLIMATE CHANGE AND CITIES Community-driven Disaster Intervention: Experiences of the Homeless People’s Federation Philippines, Incorporated (HPFPI) – Jason Christopher Rayos Co (2010) Towards Pro-poor Adaptation to Climate Change in the Urban Centres of Low and Middle-income Countries – Caroline Moser and David Satterthwaite (2008) Climate Change and Urban Children: Impacts and Implications for Adaptation in Low and Middle-Income Nations – Sheridan Bartlett (2008) Adapting to Climate Change in Urban Areas: the Possibilities and Constraints in Low- and Middle-income Nations – David Satterthwaite, Saleemul Huq, Hannah Reid, Mark Pelling and Patricia Romero Lankao (2007) URBANIZATION & EMERGING POPULATION (Joint series with the United Nations Population Fund) Urbanization, gender and urban poverty: paid work and unpaid carework in the city – Cecilia Tacoli (2012) Trends and Processes of Urbanisation in India - Amitabh Kundu (2011) China’s Post-Reform Urbanization: Retrospect, Policies and Trends - Anthony G.O. Yeh, Jiang Xu and Kaizhi Liu (2011) Brazil’s Early Urban Transition: What can it Teach Urbanizing Countries? – George Martine and Gordon McGranahan (2010) Planning for High Density in Low-income Settlements: Four Case Studies from Karachi – Arif Hasan, Asiya Sadiq and Suneela Ahmed (2010) The Food Price Crisis and Urban Food (in)security – Marc J. Cohen and James L. Garrett (2009) Is Urbanization Contributing to Higher Food Prices? – Jesper Stage, Jørn Stage and Gordon McGranahan (2009) OTHER HUMAN SETTLEMENTS PUBLICATIONS Assessing the Costs of Adaptation to Climate Change. A Review of the UNFCCC and Other Estimates - Martin Parry, Nigel Arnell, Pam Berry, David Dodman, Samuel Fankhauser, Chris Hope, Sari Kovats, Robert Nicholls, David Satterthwaite, Richard Tiffin and Tim Wheeler (2009) Population Dynamics and Climate Change edited by José Miguel Guzmán, George Martine, Gordon McGranahan, Daniel Schensul and Cecilia Tacoli (2009) (A joint UNFPA-IIED publication)
59
EARTHSCAN BOOKS Adapting Cities to Climate Change: Understanding and Addressing the Development Challenges, edited by Jane Bicknell, David Dodman and David Satterthwaite (2009) The New Global Frontier: Urbanization, Poverty and Environment in the 21st Century, edited by George Martine, Gordon McGranahan, Mark Montgomery and Rogelio Fernández-Castilla (2008) Scaling Urban Environmental Challenges; From Local to Global and Back, edited by Peter J Marcotullio and Gordon McGranahan (2007) The Earthscan Reader on Rural–Urban Linkages, edited by Cecilia Tacoli (2006) Water and Sanitation in the World’s Cities 2006; Meeting Development Goals in Small Urban Centres, prepared for UN–Habitat by IIED (2006) Empowering Squatter Citizen: Local Government, Civil Society and Urban Poverty Reduction, edited by Diana Mitlin and David Satterthwaite (2004) Water and Sanitation in the World’s Cities: Local Action for Global Goals, UN–Habitat Report prepared by Gordon McGranahan and David Satterthwaite (2003) Air Pollution and Health in Rapidly Developing Countries, edited by Gordon McGranahan and Frank Murray (2003) The Citizens at Risk: From Urban Sanitation to Sustainable Cities – Gordon McGranahan, Pedro Jacobi, Jacob Songsore, Charles Surjadi and Marianne Kjellén (2001) Environmental Problems in an Urbanizing World: Finding Solutions for Cities in Africa, Asia and Latin America – Jorge E Hardoy, Diana Mitlin and David Satterthwaite (2001) Cities for Children: Children’s Rights, Poverty and Urban Management – Sheridan Bartlett, Roger Hart, David Satterthwaite, Ximena de la Barra and Alfredo Missair (1999) The Earthscan Reader in Sustainable Cities, edited by David Satterthwaite (1999) The Environment for Children – David Satterthwaite, Roger Hart, Caren Levy, Diana Mitlin, David Ross, Jac Smit and Carolyn Stephens (1996) Squatter Citizen: Life in the Urban Third World – Jorge E Hardoy and David Satterthwaite (1989) ENVIRONMENT AND URBANIZATION A twice-yearly journal published since 1989, this is one of the most cited and widely distributed international journals on urban issues. Each issue has a special theme and includes 9–14 papers and some include a guide to the literature on that theme. It also has a special section of papers on climate change and cities (since 2007), profiles of innovative NGOs (in some issues)
60
and Book Notes – which includes summaries of new books, research reports and newsletters and how these can be obtained (including those in Spanish, French and Portuguese). For more details, see http://www.environmentandurbanization.org/ The on-line edition is at http://eandu.sagepub.com/ The full text of all papers in all issues (from the first issue in 1989) are available on-line at this site and all but the issues from the last two years are available at no charge. From this site, subscriptions and back issues can be purchased and searches made. There is also a list with the theme of each issue. Environment and Urbanization Briefs: A five page summary of each issue of Environment and Urbanization is available in print and electronically; to receive this, e-mail [email protected]. All Briefs can be downloaded from http://pubs.iied.org/search.php?s=EUB HOW TO OBTAIN WORKING PAPERS: Printed versions can be obtained from Earthprint Ltd, PO Box 119, Stevenage, Hertfordshire SG1 4TP, UK; T: +44 1438 748 111; F: +44 1438 748 844; E-mail: [email protected]; Web: www.earthprint.com for US$ 20 each plus postage and packing. All working papers are free to download at www.iied.org. HOW TO OBTAIN BOOKS: These are available from Earthscan Publications, 8–12 Camden High Street, London NW1 0JH, UK; E-mail: [email protected]; Web: www.earthscan.co.uk; also available in bookstores. In the USA, available from Earthscan, 22883 Quicksilver Drive, Sterling, VA 20166-2012, USA. The Earthscan website also has details of Earthscan representatives and agents in all other countries. HOW TO OBTAIN ENVIRONMENT AND URBANIZATION: Since 2006, Environment and Urbanization has been published by Sage Publications, and subscriptions and back issues can be ordered from them at: http://eau.sagepub.com/ Order on-line for: The Americas: http://www.sagepub.com/journalsSubscribe.nav?prodId=Journal201733 Rest of the world: http://www.sagepub.co.uk/journalsSubscribe.nav?prodId=Journal201733 Free subscriptions are available to NGOs and teaching/training institutions in Africa and in low- and middle-income countries in Asia and Latin America that have difficulty obtaining foreign exchange; contact IIED ([email protected]).
IIED is an independent, non-profit organizationpromoting sustainable patterns of worlddevelopment through collaborative research,policy studies, networking and knowledgedissemination. The Human Settlements Groupworks with partners to help establish bettergoverned, more sustainable cities in low- andmiddle-income nations, able to offer secure shelter,access to services, and reduced vulnerability toenvironmental hazards. The Group publishes theinternational journal Environment andUrbanization, Working Paper Series and books onurban environment and development issues, aswell as a wide variety of articles in academic andother journals.
UNFPA, the United Nations Population Fund, isan international development agency thatpromotes the right of every woman, man and childto enjoy a life of health and equal opportunity.UNFPA supports countries in using populationdata for policies and programmes to reducepoverty and to ensure that every pregnancy iswanted, every birth is safe, every young person isfree of HIV/AIDS, and every girl and woman istreated with dignity and respect.
This working paper has been produced as part of acooperative work programme between UNFPAand IIED on urbanization and emergingpopulation issues.
Urbanisation and D
evelopment in South A
frica: E
conomic Im
peratives, Spatial Distortions and Strategic R
esponsesC
over
des
ign:
Sm
ith+B
ellw
ww
.sm
ithpl
usbe
ll.co
m
IIED – HUMAN SETTLEMENTS GROUPUNFPA – POPULATION AND DEVELOPMENT BRANCH
International Institutefor Environment and
Development3 Endsleigh Street
London WC1H 0DDUnited Kingdom
Tel: +44 207 388 2117Fax: +44 207 388 2826Email: [email protected]
http://www.iied.org