Embed Size (px)
Citation preview
Research ArticleUrban Motion Planning Framework Based on N-Beacutezier CurvesConsidering Comfort and Safety
Ray Lattarulo 1 Leonardo Gonzaacutelez2 Enrique Martiacute1 Joseacute Matute 1
Mauricio Marcano 1 and Joshue Peacuterez1
1Department of Automotive Industry and Transportation Division Tecnalia Research and Innovation 48160 Derio Vizcaya Spain2Department of Cyber-Security ICT Division Tecnalia Research and Innovation 48160 Derio Vizcaya Spain
Correspondence should be addressed to Ray Lattarulo rayalejandrolattarulotecnaliacom
Received 11 May 2018 Accepted 2 July 2018 Published 15 July 2018
Academic Editor Irena I Otkovic
Copyright copy 2018 Ray Lattarulo et al This is an open access article distributed under the Creative Commons Attribution Licensewhich permits unrestricted use distribution and reproduction in any medium provided the original work is properly cited
In last decades great technology advances have been done related to the automotive sector especially inAdvancedDriverAssistanceSystems (ADAS) developed to improve mobility in terms of comfort and safety during driving process hence automated drivingis presented as an evolution of those systems in the present and upcoming years The aim of this work is to present a completeframework of motion planning for automated vehicles considering different constraints with parametric curves for lateral andlongitudinal planners Parametric Bezier curves are used as the core approach for trajectory design in intersections roundaboutsand lane change maneuvers Additionally a speed planner algorithm is presented using the same parametric curve approachconsidering comfort and safety A simulation environment is used for testing the planning method in urban conditions Finallytests with the real platform in automated mode have been performed showing goods results
1 Introduction
Every year 12 million people die in road related accidentsThe NHTSA conducted a study concluding that 94 ofaccidents are due to human errors where a great amountof these crashes (33) is related to wrong decisions duringdriving process [1] In 2009 24 of fatalities in the UnitedStates were related to a common problem for drivers iedrowsiness [2] Considering these points automated drivingtechnology promises a great reduction in crash incidentsadding efficiency in fuel consumption reduction of parkingspaces (ride-sharing) and inclusion of elderly and peoplewith disabilities [3]
In last decades a considerable amount of institutionsresearch centers and companies is seeking to improve thistechnology faster [4] to make automated driving a reality inpublic roads as soon as possible [5] Lateral and longitudinalcontrollers [6ndash8] as well as perception (sensors) [9 10] andcommunications [11] are some of the topics mostly studied
There are some other topics those have received lessattention than the ones named before ie vehicle decision
algorithm This area is one of the most challenging topicsin automated driving because it must deal with a greatnumber of task as generation of smooth trajectories [12]speed profiles based on fuel consumption and comfort [13]obstacles avoidance [14] and even doing coordination amongother participants to execute a maneuver [15]
Some methods explored in automated vehicle decisionare in [16] the authors have studied a novel method forautonomous vehicles decision taskThey considered dynamicmaneuvers satisfying trafficnorms and road limitations basedon a data-driven vehicle dynamic model and an optimizationprocess using curve arcs Other authors have explored meth-ods based on generation of multiple curves ie clothoidssetting a possible group of tentacles (possible trajectories)to be tracked by the vehicle and the optimal solution isobtained using aMarkovDecision Process (MDP) [17] Otherapproaches are related to Partially Observable Markov Deci-sion Process (POMDP) for generation of high level decisionpolicies (following the lane lane change parking etc) [18]Rapidly exploring Random Tree (RRT) is another methodcurrently used for trajectory planning some authors as [19]
HindawiJournal of Advanced TransportationVolume 2018 Article ID 6060924 13 pageshttpsdoiorg10115520186060924
2 Journal of Advanced Transportation
are testing the integration of RRT and visual driver behaviorin driving to improve the decision process The problem isthat those methods have been developed to support specificscenarios considering a bunch of specific conditions some-times they did not even consider online deployment [20]
Other authors as [21] are tackling the problem consid-ering the importance of dealing with the general case ofdriving (especially in urban scenarios) The idea is handlingsituations that goes from for example cruise control to beingable of respecting traffic lights or signs among other thingsThe problem with this approach was that the authors onlyconsidered the longitudinal part of the vehicles decision Onthe other hand [22 23] have presented works about generalmethods for trajectory generation considering intersectionsand roundabouts but the speed profile generation was con-sidered later on [24]
In [25] a method combining parametric curves of Bezieris presented the goal is to deal with the general case of trajec-tory planning (in urban environments) combining this witha speed profile generation based onModel PredictiveControlThe problem with the approach is basically considerablymore difficult for using two different techniques to resolve theplanning problem (they are not unified)
In such a way this work presents a unified motionplanning framework (trajectory planning and speed profile)based on 4th and 5th degree parametric Bezier curves Itspecially focuses on urban scenarios and their geometricaldesign It leans on the construction of two-dimensionalcurves for both (lateral and longitudinal) planning methodssimplifying the possible designing parameters to the mostconsiderable ones without degrading the curve capacitiesThe work specially focuses on giving a tool-set for trajectorydesigning under typical scenarios as intersections and lanechanges and to a more specific and complex scenario asroundabouts This last scenario is especially interesting forits set of possible parameters and conditions it is relevantto consider that the roundabout complexity has not beensufficiently studied for other authors in the past [26]
Finally the contribution will be organize as follows Sec-tion 2 has the detailed explanation of three urban scenariosconsidered intersections roundabout and lane changes (therest can be modeled as straight line or arcs) A definition ofrelevant Bezier curve properties is carried on then a globalplanning approach is developed to satisfy some requirementsof the local planning approach (reducing the total amountof map points) these concepts will be followed by thetrajectory and speed planning approach Section 3 presentsthe general components used in the software architecture (allmodules considered for simulation and real vehicle tests)In the following it presented an urban test case based onsimulation (Section 4) and a real case of study (Section 5)both specially focus on roundabout considerations FinallySection 6 contains the conclusions of this article summarizingthe contributions and future works
2 Motion Planning Framework
This section explains all the information related to thetrajectory planning approach based on real-time parametric
4th and 5th degree Bezier curves The approachrsquos core will befocused on using these curves in path planning generationfor urban scenarios (intersections roundabouts and lanechanging) and speed planning for comfortable and safebehaviors This approach is not limited to urban scenariosalthough it is the main target of this work
The planning framework explanation will be divided intothree parts (i) global planning using a global map (basedon a point to define the structure of intersections lanechange or roundabouts) describing the route with reducedamount of points (ii) local planning approach based onBezier and specially focus on intersections lane changes androundabouts (the straight and arc segment can be resolved assequences of points) and (iii) the speed planning approachbased on the same type of curves
21 N-Bezier Curve Basis Bezier is a type of parametriccurve which has been commonly used for computer graph-ics animations and path generation in robotics [27] Ingeneral they are good for real-time implementation and thecomputational cost of designing them is lower than clothoidsand splines curves [28] Bezier curves are described by
B (119905 | 119899 1198750 119875119899) = 119899sum119894=0119887119894P119894 119887119894 = (119899119894) 119905119894 (1 minus 119905)119899minus119894 (1)
where 119887119894 isin R is the Bernstein polynomial P119894 isin R2 arethe control points used to generate the curve 119899 isin N+ is theBezier order and 119905 isin R 119905 = [0 1] is the parameter for curveconstruction
These curves have several properties relevant for thepurpose of the current work
(i) The starting point of the Bezier curve correspondswith control point P0 and the ending point corre-sponds with P119899
(ii) The first point tangent vector (at 119905 = 0) will be givenby 997888997888997888rarr11987501198751 and the last point tangent vector (at t = 1) willbe given by 997888997888997888997888997888rarr119875119899minus1119875119899
(iii) The curve will lie into the convex hull formed by thecontrol points
(iv) Bezier curves are continuous geometrically and incurvature 119862119899 amp 119866119899 forall119899 isin N+ and this continuitycan be preserved in joints of two different curves
(v) Bezier curves are symmetric and the generated curvefor 119905 0 997888rarr 1 is equal to the one for 119905 1 997888rarr 0
This work uses 4th and 5th grade Bezier curves (someconsiderations with 3rd degree will be done) Higher ordercurves are not considered because they do not have additionalbenefits within current approach but increase the complexity[29]
Rewriting the general Bezier equation (see (1)) a morecompact representation is obtained
B (119905) = K0 + K1119905 + K21199052 + sdot sdot sdot + K119899119905119899 (2)
where each K119894 will be a function of the control points (fixedposition) and curve order The values of K119894 coefficients are
Journal of Advanced Transportation 3
Table 1 Compact Bezier polynomial Coefficients ldquoCrdquo
C Bezier curve order3rd Order 4th Order 5th Order
K0 P0 P0 P0K1 minus3P0 + 3P1 minus4P0 + 4P1 minus5P0 + 5P1K2 3P0 minus 6P1 + 3P2 6P0 minus 12P1 + 6P2 10P0 minus 20P1 + 10P2K3 minusP0 + 3P1 minus 3P2 + P3 minus4P0 + 12P1 minus 12P2 + 4P3 minus10P0 + 30P1 minus 30P2 + 10P3K4 minus P0 minus 4P1 + 6P2 minus 4P3 + P4 5P0 minus 20P1 + 30P2 minus 20P3 + 5P4K5 minus minus minusP0 + 5P1 minus 10P2 + 10P3 minus 5P4 + P5
given in Table 1 K1 and K2 determine curvature at startingand ending points of the curve this property is going to beused repeatedly on explanations Using the information from3rd to 5th degree Bezier K1 and K2 are defined as follows
K1 = 119899997888rarrV1K2 = 119899 (119899 minus 1)2 (997888rarrV2 minus 997888rarrV1) (3)
where 997888rarrV1 = P1 minus P0 and997888rarrV2 = P2 minus P1 are introduced and 119899 is
the degree of the curveIn general terms the curvature in R2 is defined as [30]
119896 (119905) = 119909 (119905) 119910 (119905) minus 119909 (119905) 119910 (119905)radic(119909 (119905)2 + 119910 (119905)2)3= B (119905) times B (119905)10038171003817100381710038171003817B (119905)100381710038171003817100381710038173 (4)
and in this case function 119861 is the Bezier equation Evaluatingat 119905 = 0 it is obtained
119896 (119905 = 0) = 2K1 times K21003817100381710038171003817K110038171003817100381710038173 = (119899 minus 1)119899997888rarrV1 times 997888rarrV210038171003817100381710038171003817997888rarrV1100381710038171003817100381710038173 (5)
The previous equation explicitly shows that if the threestarting points in a curve are colinear generated Beziercurve will have zero curvature at its starting point (119896(119905 =0) = 0) this can be extended to the three ending pointsdue to symmetry This property is useful for designing theintersections and lane changes and for the entrance and exitpart of the roundabout
22 Global Planning Environment Used for the Approach Inthis work global planning is used as base route to applythe local planning approach using Bezier A simple mapcontaining a point to define intersections roundabouts orlane changes (point with ldquoxrdquo in Figures 1 2 and 3) is the inputof the global method decreasing the amount of points andkeeping geometric qualities of road
221 Intersections Figure 1 depicts the description of anintersection using a single point (junction of 2 or more
DD2D
D
D
2D
04
03
0201
0Int
000b ub
ua
05
0
Figure 1 Trajectory planning on intersection
straight paths) The unitary vectors defining the road (inintersection case) are given by
997888rarr119906119887 = P119887 minus P1198941003817100381710038171003817P119887 minus P1198941003817100381710038171003817
997888rarr119906119886 = P119886 minus P1198941003817100381710038171003817P119886 minus P1198941003817100381710038171003817
(6)
where 997888rarr119906119886 is an unitary vector that goes from intersection P119894to past global point P119887 and
997888rarr119906119887 is other unitary vector formedwith the next global points P119886 and P119894 It is relevant to see thatthe angle 120572 (Figure 1) can be different from 90∘ modeling agreat variety of intersections The parameter 119863 will be usedlater in local planning and for the definition of P119894
222 Lane Changes In this case the approach considersstraight segments during the maneuver (Figure 2) Thevectors for path description defined in (6) can be used for lanechange and they have the following relation
997888rarr119906119887 = minus997888rarr119906119886 (7)
4 Journal of Advanced Transportation
Pb
PLCD
Pa
W
D 2D
2D D D
P0 P1 P2
P3
PrsquoLC ua
ub
0504
Figure 2 Trajectory planning on lane change
ai
ao
Pr
P0
P1
P2
P3
P4
Pa
Pb
Pe
uP4
ue
uex
Pex
R
Figure 3 Trajectory planning on roundabouts
Additionally in this type of curve a new point P1015840119871119862 isintroduced to handle the maneuver in local planning Thispoint is defined by
P1015840119871119862 = P119871119862 + 119908[[[[[cos(tanminus1 (119906119886119910119906119886119909 ) plusmn
1205872)sin(tanminus1 (119906119886119910119906119886119909 ) plusmn
1205872)]]]]]
(8)
where 119908 is the road width and 997888rarr119906119886 is the vector presented in(7)The symbol plusmn is negative when the lane change is done tothe right side and positive to the left side
223 Roundabouts Figure 3 shows the definition of a round-about using a simple point It uses roundabout center pointP119903 its radius 119877 entrance angle 119886119894 and exit angle 119886119900 Usingthese parameters the roundabouts can be modeled with anapproximated circular shape
Roundabout entrance and exit points are defined by
P119890 = P119903 + 119877[[[[[cos(tanminus1 (119906119887119910119906119887119909 ) plusmn 119886119894)sin(tanminus1 (119906119887119910119906119887119909 ) plusmn 119886119894)
]]]]]P119890119909 = P119903 + 119877[[[[[
cos(tanminus1 (119906119886119910119906119886119909 ) ∓ 119886119900)sin(tanminus1 (119906119886119910119906119886119909 ) ∓ 119886119900)
]]]]]
(9)
where P119890 is roundabout entrance coordinates P119890119909 is round-about exit coordinates values of 997888rarr119906119886 and 997888rarr119906119887 are defined by(6) but the intersection point P119894 is substituted by roundaboutpoints P119890119909 and P119890 respectively In these equations the uppersign is used when traffic is defined counter clockwise andlower one for clockwise traffic [31]
In addition to these two points 119899119903 points will be included(points with square shape in Figure 3) defining the routeinside the roundabout Following this procedure the totalamount of points substituting basic center point P119903 will begiven by 119899119903 + 223 Local Planning Method Based on Curvature The maincontribution of the current paper is in the generation ofsmooth and continued curvature trajectories by definition inautomatic vehicles The principal goal is urban scenarios butit is not limited to them hence the sectionwill be divided intothree scenarios intersections roundabout and lane changes
231 Intersections Figure 1 shows an intersection definedusing a single pointThis configuration reduces the amount ofpoint inmap but demands a trajectorymethod to connect thetwo straight segments smoothly Bezier curves of 5th orderwill be used to solved this problem
As it is shown in (5) three Bezier control points (from P0to P2) set over the same line will ensure curvature zero in thestarting point of the curve 119870(119905 = 0) = 0 119875119910012 = 119898119875119909012+119887thismeans that the segment starts as a straight pathThe sameequation can be used to define curvature 0 in the ending partof the curve (119905 = 1) with control points P119899 to P119899minus2 (symmetrycriteria)
Using this definition is inferred that the minimum Bezierorder that can be used in an intersection is 4th (5 controlpoints) but in this case control point P2 will be set in theposition of the intersection point P119894 Hence the 5th orderis picked as a solution without the addition of many controlpoints and less restrictive than 4th order The position of thecontrol points is shown in Table 2 where the vectors 997888rarr119906119887 and997888rarr119906119886 are given by (6)
The distance of control points has been set to ensurethat maximum curvature of Bezier curve is reached inmiddle point of the trajectory in order to know if peakcurvature is under the vehicles mechanical limits Figure 4shows the normalized curvature 119870119870max (curvature of thegenerated segment divided by themaximumcurvature value)with respect to normalized trajectory distance 119889119889max (total
Journal of Advanced Transportation 5
Table 2 Bezier control points for lateral and longitudinal approach for intersections ldquoIntrdquo roundabout entrance ldquoRErdquo roundabout exit ldquoRexrdquolane change maneuver ldquoLCrdquo and speed planning
Planning Control points n-order Bezier1198750 1198751 1198752 1198753 1198754 1198755
Lateral
Int 4119863997888rarr119906119887 + P119894 2119863997888rarr119906119887 + P119894 119863997888rarr119906119887 + P119894 119863997888rarr119906119886 + P119894 2119863997888rarr119906119886 + P119894 4119863997888rarr119906119886 + P119894RE 31198632 997888rarr119906119890 + P119890
1198632 997888rarr119906119890 + P119890 P119890 1198631198753997888997888rarr1199061198754 + P4 P119903 + 119877997888rarr119906120579119890 lowast -
REx P119903 + 119877997888997888rarr119906120579119890119909 lowastlowast 1198631198751997888997888rarr1199061198750 + P0 P1198901199091198632 997888997888rarr119906119890119909 + P119890119909
31198632 997888997888rarr119906119890119909 + P119890119909 -
LC5997888rarr1199061198871198632 + P119871119862
3997888rarr1199061198871198632 + P119871119862997888rarr1199061198871198632 + P119871119862
997888rarr1199061198861198632 + P10158401198711198623997888rarr1199061198861198632 + P1015840119871119862
5997888rarr1199061198861198632 + P1015840119871119862
Longitudinal Speed [[1199040V0
]] [[1199040 + 119863V0
]] [[1199040 + 2119863
V0
]] [[1199040 + 3119863V0 +119882]] [[
1199040 + 4119863V0 +119882]] [[
1199040 + 5119863V0 +119882]]
lowast 120579119890 = tanminus1((119875119890119910 minus 119875119903119910 )(119875119890119909 minus 119875119903119909 ))997888997888rarr119906120579119890 = [cos(120579119890 + 119863119877) sin(120579119890 + 119863119877)]
lowastlowast 120579119890119909 = tanminus1((119875119890119909119910 minus 119875119903119910 )(119875119890119909119909 minus 119875119903119909 ))997888997888rarr119906120579119890119909 = [cos(120579119890119909 minus 119863119877) sin(120579119890119909 minus 119863119877)]
0 02 04 06 08 1Normalized distance ddmax
0
02
04
06
08
1
Nor
mal
ized
curv
atur
e Kk
max
20∘
45∘
70∘
95∘
120∘
145∘
Figure 4 Curvature analysis for different intersection angles
distance of the generated segment divided by the maximumone) considering angles between straight segments 120572 from20 degrees to 145 degrees
With the purpose of finding the position of maximumcurvature it is applied derivative to (4)
119889119889119905119870 (119905) = (B times B) (B sdot B) minus 3 (B times B) (B sdot B)10038171003817100381710038171003817B100381710038171003817100381710038175 (10)
evaluating the derivative of Bezier curve in 119905 = 05B (119905 = 05) = 154 119863 (997888rarr1199062 minus 997888rarr1199061)B (119905 = 05) = 10119863 (997888rarr1199062 + 997888rarr1199061)B (119905 = 05) = 0
(11)
where 119863 is the design parameter for trajectory and 997888997888rarr11990612 areunitary vectors defined by (3) From this set of equations it isobtained that B times
B = B sdot B = 0 resulting in curvature equalto 0 in 119905 = 05 (maximum value)
232 Roundabouts Figure 3 shows the roundabout usingsimple point description In such a way roundabouts aremodeled using two Bezier curves each one is used to connectthe straight road with the inner part and the roundaboutmiddle part is modeled as a circle with constant radius Thecriteria used for design roundabouts trajectory have threeconsiderations
(i) The curvature at entrance in 119905 = 0 or at exit in 119905 = 1points must be 0 (straight paths)
(ii) Generated segments at the entrance and exit ofroundabout must fit its inner part with a curvatureequal to the inverse of the radius
(iii) Bezier joining point angle must be the same of thecircle arc angle (continuous trajectory)
In order to follow the aforementioned criteria 3 colinearcontrol points are designed to ensure the first considerationanother 2 points are selected to form a tangent segment tothe circle which assures curvature and direction continuity(second and third criteria) along the roundabout (threecolineal points will generate curvature 0 and not119877minus1) Hencea Bezier curve 4th order is used to ensure curvature zero instraight path side and different of 0 in the inner roundaboutside for entrance and exit segments (Figure 3)
Table 2 shows the control points used for trajectorygeneration at entrance (RE) and exit (REx) of roundaboutsControl points from P0 to P2 in the case of entrance (P2 to P4for exit) are designed using similar criteria as in intersectionswith119863 as a designing parameterThe points P4 at entrance orP0 at exit are selected using the distance 119863 in the arc of thecircle from entrance or exit depending on the case
6 Journal of Advanced Transportation
minus40 minus30 minus20 minus10 0 10 20 30x axis [m]
minus20
minus10
0
10
y ax
is [m
]Trajectory generation roundabout
D = 4 [m]D = 6 [m]D = 10 [m]
(a) Generated trajectories
0 10 20 30 40 50 60 70Distance [m]
minus04
minus02
0
02
Curv
atur
e [m
]
Curvature vs distance
(b) Curvature of the different trajectories
Figure 5 Examples of roundabout trajectories for different D values
The point P3 in entrance trajectory is separated of pointP4 a distance given by
1198631198753 = radic 3410038171003817100381710038171003817997888997888rarr1199061198754 times (P2 minus P4)10038171003817100381710038171003817119870119903 (12)
where 997888997888rarr1199061198754 is the tangent vector (with the circle) in the pointP4 and119870119903 is the roundabout curvature In the case of exit thepoint P4 is substitute by P0 and P3 by P1
Figure 5 shows the behavior of trajectory generation andits curvature using the specifications given in the planningmethod Figure 5(a) depicts 3 different trajectories generatedfor different distances 119863 and Figure 5(b) shows the trajecto-ries curvature fitting perfectly the curvature radius 01[119898minus1]233 Lane Change The approach is done using similarcriteria as intersections but control points are aligned withlane axis and equidistant by a distance 119863 (Figure 2) Wherethe unitary vectors 119906119887 and 119906119886 are explained in (7) 119908 is thewidth of the road and 119863 is the separation in 119906119886 axis betweeneach pair of control points 119863 isin R 119863 = 119875119899minus1 minus 119875119899119906119886
The location of control points is given in Table 2 (LC)Theminimum value of 119863 is set to 119908 in our design these criteriayield to a maximum curvature in 119905 asymp 020 and 119905 asymp 080 inthe curve definition If a vehicle is capable of dealing withthis curvature considering dynamic limitations in steeringwheel angle and lateral acceleration it will be also capable ofhandling any trajectory with119863 gt 119882
The overtaking is considered as a special case composedby two lane changes a first lane change is using the proposedmethod and when the first lane change is finished thislane will be kept until the overtaking process is done Thereturning will be done applying symmetry criteria and samepropositions used in first lane change
24 Speed Planning Based on Comfort andVehicle ConstraintsThe speed control is directly affected by sudden changesin reference speed and if these changes are smooth andcontinuous the reference speed tracking will be done with
a better performance In such a way a speed planner isproposed based on Bezier curves that permits
(i) Anticipate future conditions in the speed of the road(ii) Applying physical constraints in vehicle acceleration
and deceleration(iii) Keeping safely the vehicle velocity under speed limits(iv) Incorporating comfort of passengers
The speed planner approach uses 5th order Bezier curveto keep advantages of a higher degree and symmetry Figure 7depicts the location of control points for a speed profile curvethat is function of distance in the pathThe formula related toeach control point is presented in Table 2
Define the separation between consecutive control points119875119894minus1 and 119875119894 as 119863 isin R 119863 = 119889119894119904119905119886119899119888119890119909(119875119894minus1 119875119894) forall119894 =1 2 3 4 5These conditions generate Bezier curve x-coordi-nates proportional to the parameter 119905 given by the equation
119861119909 (119905) = 5119863119905 = 119904 (13)
with this equation is seeing that the distance in x-axis andthe parameter 119905 isin [0 1] have a proportional relationship It isintroduced 119904 isin [1199040 1199040 + 5119863] to make the calculation easier(total distance of the speed curve)
The physical constraints of the vehicle (acceleration anddeceleration process) will have a direct relation with thegenerated curve In this case it is considered the generalequation that relates speed to acceleration and doing avariable change V119897 = 119889119904119889119905 the resulting equation will be
119886119897 (119905) = 119889V119897 (119905)119889119905 997904rArr 119886119897 (119904) = V119897 (119904) 119889V119897 (119904)119889119904 (14)
where the variable 119886119897 is longitudinal acceleration V119897 is longi-tudinal speed 119905 is time and 119904 position Doing a nomenclaturechange from V119897 = 119861119910 and 119889119904 = 119889119861119909 = 5119863119889119905 will result in theequation
119886119897 (119904) = 119861119910 119889119861119910119889119861119909 = 119861119910119889119861119910119889119904 119904 isin [1199040 1199040 + 5119863] (15)
Journal of Advanced Transportation 7
0 50 100 150Distance [m]
0
5
10
Spee
d [m
s-1]
Overlapped speed planning
Reference speedSpeed planning
(a) Speed planning with overlapped intersections
Spee
d [m
s-1]
0 50 100 150Distance [m]
0
5
10Speed planning
Reference speedCorrected speed planning
(b) Speed planning without overlapped parts
Figure 6 Stages for speed planning approach
Spee
dSp
eed
Path distance
After Beacutezierintersection
W
D D D D D Reference speed
Speed curves
3 4 5
0 1 2
Figure 7 Speed planning designing method
Applying derivative to (15) maximum points of accelera-tion can be found The resulting equation is
119889119886119897119889119904 = (119889119861119910119889119904 )2 + 119861119910 11988921198611199101198891199042 (16)
From (16) introducing the 5th order Bezier equationand doing some approximations the following roots can beobtained
119904119886119898119886119909 = 5119863049 (V119900119882) + 088
V119900119882 + 141 ifV0119882 gt 0
052 (V119900119882) minus 003V119900119882 minus 046 if
V0119882 lt minus1 (17)
providing a direct solution for the maximum acceleration ina speed curve
The first step in the speed planning method is applyingthe comfort speed limitation (reference speed) presented in[32] with the equation
119886120596 = radic(14119886119909)2 + (14V1198972119870)2 + 1198861199112 (18)
where 119886120596 is the total acceleration felt by passengers (comfortcriteria given by ISO2631-1) longitudinal acceleration 119886119909 andvertical acceleration 119886119911 contributions are approximated tozero (small changes asymp 0) V119897 is longitudinal speed and 119870 iscurvature in each point of the path
Figure 6(a) depicts speed planning approach with somesegments overlapped one with the other In this stage Beziercurves will be generated using the maximum accelerationcriteria for each upward and downward (ensured to beunder the speed limit) reference speed stepThe intersectionsbetween curves will be calculated In the example theseintersections appeared three times Calculating the Beziercurve for each speed step (current segment is independentof the segment before) will ensure that numerical instabilities(accumulation of numerical errors by concatenated curves)will not be present a long time
Finally Figure 6(b) depicts the last stage in the speedplanning calculation that will regenerate all the Bezier curvesconsidering the intersections in speed profile generating asmoother profile This behavior can be easily understoodlooking at Figure 7 The profile will be constrained to theacceleration limits of the vehicle considering comfort duringdriving process and keeping speed safely under road limits
3 Integration on AutomatedVehicle Architecture
The architecture presented in [22] is a versatile and modularframework composed by six abstraction blocks which definesthe major areas of influence in automated driving appli-cations acquisition perception communication decisioncontrol and actuation This section gives an introductionto the aforementioned architecture combined with details ofsimulated and experimental platforms used in this approachFor further general details refer to [33]
Figure 8 shows a brief summary of each block that iscontained within the architecture Acquisition is in chargeof gathering raw input data coming from real or simulatedsensors in the vehicle and obtaining information such asposition velocity acceleration obstacles around driver sta-tus actuators position and others Perception has the goal
8 Journal of Advanced Transportation
Acquisition
Simulation Simulatedsensors and odometry
Real VehicleSensors (GPS IMUCameras RadarsLiDARs) and odometry(steering position etc)
Actuation
Simulation Actuatorcommands (steeringWheel throttle brake)
Real VehicleActuator commands tolow level control(steering brake throttlecontrollers)
Perception
bull Sensor data fusion(improvingmeasurements)bull Dynamic descriptionof the scenario(camera LiDAR Radar)bull Ego Vehicle completedescription
Communicationbull Reception of datafrom vehiclespedestrians andinfrastructurebull Broadcastinginformation of egovehicle to otherparticipants
Decision
ControlLateral control Trajectory tracking considering comfortand safety behavioursLongitudinal control Speed tracking considering comfortand safety behaviours
Global PlanningRough approximation of the route tobe followedLocal planningSmooth trajectory to be followed Itconsiders smooth changes in lateralbehaviours (related with steeringWheel action) and smooth change inspeed actions (related with throttleand brake actions)Behavioral planningPlanning under unexpected actionsDynamic trajectory generation forovertaking dealing with cooperativeintersections crossings roundaboutscooperation lane changes etc
Figure 8 Control architecture of automated vehicles
of postprocessing the information coming from acquisitiongenerating descriptions on physical unit of the environmentand the ego-vehicle Communication refers to the capacitiesof exchanging information with other participants duringdriving (infrastructure pedestrians or other vehicles) tocooperate or knowing current states of other participantsControl is constituted for the lateral (steering) and longitu-dinal (throttle and brake) tracking controllers of the vehicleand actuation contains the low level controllers of eachactuator
The decision module is the main target of the currentwork (grey coloured module in Figure 8) and it is dividedinto 3 main subtasks those are as follows (i) the globalplanning is in charge of doing a first approximation ofthe route in the current work one general simple pointfor each roundabout intersection or lane change willbe used (ii) the local planning generates smooth andcontinues trajectories to be tracked by the vehicle themajor contributions of this work are done in this block withthe Bezier trajectory designing conditions and the speedprofile based on the same type of curves finally (iii) the
behavioral planning deals with all the unexpected conditionsoccurring while driving eg obstacle avoidance overtakingetc
4 Simulation Test Case
The current section explains the approach with a numericalexample using the simulation tool Dynacar [34] The testlocation corresponds with an urban scenario of the BasqueCountry in Spain This is depicted in Figure 9(a) and itis constituted by 2 roundabouts 3 right turns and 6 leftturns
The total amount of points used in the map definitionwill be divided among 1 starting point 1 ending point9 intersections and 2 roundabouts resulting in 13 pointsdefining all the route Table 3 shows the x-y coordinates inmeters (simulator absolute coordinate system) the referencespeed in [119898119904] and the type of point (1 for intersectionsand 2 for roundabouts) For roundabout global planningadditional information for its description is required theradius (meters) and the angles of entrance and exit (radians)
Journal of Advanced Transportation 9
minus50 0 50 100 150 200X coordinates [m]
0
50
100
150
200
250
300
350
400
Y co
ordi
nate
s [m
]Reference trajectory with planning approach
Simple mapGlobal mapLocal map
(a) Trajectory generated with the approach
0 200 400 600 800 1000 1200Distance [m]
minus4
minus2
0
2
Acce
lera
tion
[ms-2
]
Acceleration in the speed planning
ax planningax vehax bounds
(b) Comparison of the longitudinal acceleration
0
05
8
1
15
||Aw
|| [m
s-2] 2
6
25
Vref [ms-1]
4
Acceleration behaviour for different comfort levels
2
||K|| [m-1]
0150100500
05
1
15
2
25
Com
fort
leve
l dur
ing
desig
ning
(c) Comparison of the path curvature and simulated vehicle one
Figure 9 Simulated results based on real urban scenario
The previously described points are shown in Figure 9(a)witha cross marker
From this map a global plan is generated which givesa better description of roundabouts in the bend segment(completion of the circle arc) In case of intersections pointsin global planner coincide with those used to define the route
in the scenario All the global planner points are depicted ascircles in Figure 9(a)
The soft and continuous black line represents the trajec-tory generated using the Bezier approach The values of 119863(designing parameter of the approach) are set by hand butthey can be selected using optimization algorithmas in [31 35]
10 Journal of Advanced Transportation
Table 3 Point description of the map used for global planning
119883 119884 119881 Type 119877 119886119894 119886119900[119898] [119898] [119898119904] [] [1119898] [119903119886119889] [119903119886119889]000 000 1111 1 minus minus minus8048 9709 1111 2 1729 052 0098804 17790 1111 1 minus minus minus19621 17289 1111 1 minus minus minus20372 26616 1111 1 minus minus minus5655 27846 1111 1 minus minus minus8624 37134 1111 1 minus minus minusminus4930 39761 1111 2 1776 000 000508 28116 1111 1 minus minus minusminus2937 28373 1111 1 minus minus minusminus3917 18734 1111 1 minus minus minus5016 18036 1111 1 minus minus minus5319 22794 1111 1 minus minus minusAn interesting example of the entranceexit angle in the
roundabouts is the one located in the absolute coordinates[8048 9709] This point is an entrance of a roundabout andit uses the definition of the entrance angle for its description(see (9))
119875119890 = [80489709] + 1729 [cos (minus226)sin (minus226)] = [694838] (19)
The entrance point to present a numerical example is shownbut the exit point can be calculated using the same data and(9)
The speed planning defined for that trajectory is shown inFigure 9(b) The continuous line is the reference accelerationgiven by the speed profile of the urban scenario and theapplication of a comfort parameter 119886120596 = 05[1198981199042] based on[32] this amount of acceleration 119886119908 corresponds with a valuebetween ldquonot uncomfortablerdquo and ldquoa little uncomfortablerdquofor vehicle passengers Results show that vehicle succeedon tracking the generated speed profile (by tracking theacceleration profile shown in dashed line) One major causewas the consideration of the maximum acceleration anddeceleration (red bounds of Figure 9(b))
Figure 9(c) shows a surface plot representing the differentvalues of acceleration 119886119908 with respect to the speed profilegenerated and the curvature of the path Five different valuesof 119886120596 were used 05 10 15 20 and 25[1198981199042] to generate thesurface Its objective is verifying the smooth and continuedrelationship with the Bezier speed profile and the level ofcomfort of the passenger
5 Real Circuit Tests
The current section shows the trajectory planning approachused with the real vehicle In this sense two possible def-initions of the route were implemented (Figure 10(a)) Forboth the center of the lane is used (taken from a manualdriving record using GPS) as guide for the implementationof trajectories
The first case is shown in the left side of Figure 10(a)where the trajectory described by the manual driving ismodeled using intersection points in the 180[∘] turn (round-about) In this case the error in the turning points (top andbottomof the circuit) is greater than using roundabout for thedefinition of the curve (right side Figure 10(a))
The trajectory in the right side was tested with 5 differentspeed profiles and the behavior of the vehicle was analyzedwith the curvature Figure 10(b) depicts the results for thesetests Curvature of the vehicle in the trajectory is representedwith a grey line and calculated according to the formula
119870 (119905) = 120596 (119905) cos (Φ (119905))119881119897 (119905) (20)
where 119870 is the curvature 120596 is the rate of change of yaw Φ isthe roll angle of the vehicle and 119881119897 is the longitudinal speedCurvature of the path is depicted in black and the vehicle isable to replicate the behavior of the planned curvature (theovershoots in curvature are caused by controllers)
Figure 10(c) shows vehicle lateral acceleration (as func-tion of the vehicle speed and the curvature of the circuit)using different speed profiles generated with 119886119908 equal to05 10 15 20 and 25[1198981199042] Values of total accelerationslightly overpass the limit of 25 at some points because theactuators delay is not considered for longitudinal control andthe consideration of 119886119909 asymp 0 in speed planning Additionallythis figure shows the lateral acceleration in relationship withthe curvature and the speed but without considering thetotal acceleration because in the speed planner those areassumed as zero The lack of data taken considerationsover longitudinal acceleration and controllers delay duringtracking generate some surface holes without data Table 4shows themaximumacceleration obtainedwith the approachafter filtering all the values 119886119909 gt 0005[1198981199042] (the approachconsiders 119886119909 asymp 0) It is relevant to understand that thosevalues must be filtered because actions like control behaviordelay of the controllers or even the longitudinal accelerationare not considered and the magnitudes can differ In general
Journal of Advanced Transportation 11
minus20 minus10 0 10X coordinates [m]
minus20
minus10
0
10
20
30
40
50
60
70Y
coor
dina
tes [
m]
Trajectory case 1
minus20 minus10 0 10X coordinates [m]
Trajectory case 2
GPS center laneLocal trajectory
IntersectionRoundaboutLane changing
(a) Comparison in trajectory definition
0 50 100 150Distance [m]
minus01
0
01
02
03
Curv
atur
e [m
-1]
Curvature of the trajectory case 2
(b) Comparison in trajectory definition
020
05
Lateral acceleration behaviour for different comfort levels
1
15
2
||Ay||
[ms-2
]
25
015
3
4
||K|| [m-1]3 01
Vx [ms-1]]2 0051
0
05
1
15
2
25
3
Com
fort
leve
l dur
ing
desig
ning
(c) Comparison in curvature for the trajectory definition case 2
Figure 10 Real life validation of the Bezier planning approach
the results obtained are close to proposed values with param-eter 119886120596 (designing)6 Conclusion and Future Works
This work presents a trajectory and speed planning approachbased on Bezier curves used in the decision module ofan automated vehicle control architecture The approachconsiders urban scenarios with intersections roundaboutsand lane changes but it is not limited to those the approachcould also be used in scenarios such as highways In thecase of the speed planner a parametric curve approach to
adapt future changes in the speed limit considering physicalconstraints of the vehicle and traffic rules is presented (ieconsidering the maximum speed limit of the road)
Simplified mathematical models for trajectory planningusing Bezier curves on intersections roundabouts and lanechanges are presented reducing the time of calculation andallowing the use of these definitions for other applica-tions ie trajectory optimization processwith computationalefficiency Additionally the approach is evaluated using asimulated urban scenario based on a location of BasqueCountry showing that a great variety of urban scenario canbe managed using this approach
12 Journal of Advanced Transportation
Table 4 Maximum lateral acceleration obtained in the real experiment using speed profile
Uncomfortable levels Not A little Fairly Very ExtremeUncomfortable magnitudes 119886120596[1198981199042] 05 10 15 20 25Filtered max values [1198981199042] 045 103 154 200 302
The trajectory planner was tested for automated drivingusing a comparison of the trajectory with the Bezier curvesand the one generated using a manual GPS recording inmanual driving Additionally the generated curvature inthe vehicle for different conditions (variations in the speedprofile) was compared with the curvature of the trajectoryplanned showing that it is feasible to be tracked by the vehicle
The speed planning approach shows the capability ofusing parametric curves to generate a profile to be trackedcorrectly by the vehicle giving a prediction of future behav-iors Consideration of longitudinal acceleration in curvesegments is one of the future improvements related to thespeed planner of this work
This approach is considered better than others due tothe fact that it includes comfort and safety criteria duringtrajectory and speed planning For comfort the ISO2631-1 standard to generate speed profiles based on geometricinformation given by the trajectory planning was consideredComfortable speed profiles are related to trajectories andthis can be associated with safety during driving (vehiclelateral forces are related to possible dangerous situations) andadditionally a continuous curvature of the trajectory plannedcan reduce possible unexpected situations given by vehicleautomatic control (increasing safety)
Some of the future works are related to using thepresented method to generate possible optimal solutionsin terms of the parameter 119863 road geometry and vehicledynamics and in suchway substituting the definition by handof parameter119863 during trajectory planning
Data Availability
The datasets generated during andor analyzed during thecurrent study are available from the corresponding author onreasonable request
Conflicts of Interest
The authors declare that they have no conflicts of interest
Acknowledgments
This work was partly supported by ECSEL Project ENABLE-S3 with Grant Agreement no 692455-2 and the AutoDriveECSEL Project with Grant Agreement no 737469
References
[1] J-w Choi R E Curry and G H Elkaim ldquoPath planningbased on Bezier curve for autonomous ground vehiclesrdquo inProceedings of the IEEE Advances in Electrical and ElectronicsEngineeringmdashIAENG Special Edition of the World Congress on
Engineering and Computer Science 2008 WCECS 08 pp 158ndash166 October 2008
[2] LHanH YashiroH TNNejadQHDo and SMita ldquoBeziercurve based path planning for autonomous vehicle in urbanenvironmentrdquo inProceedings of the 2010 IEEE Intelligent VehiclesSymposium IV 2010 pp 1036ndash1042 USA June 2010
[3] L Labakhua U Nunes R Rodrigues and F S Leite ldquoSmoothtrajectory planning for fully automated passengers vehiclesSpline and clothoid based methods and its simulationrdquo Infor-matics in control automation and robotics pp 169ndash182 2008
[4] R Lattarulo J Perez and M Dendaluce ldquoA complete frame-work for developing and testing automated driving controllersrdquoIFAC-PapersOnLine vol 50 no 1 pp 258ndash263 2017
[5] R Lattarulo M Marcano and J Perez ldquoOvertaking maneuverfor automated driving using virtual environmentsrdquo in Proceed-ings of the Springer International Conference on Computer AidedSystems Theory pp 446ndash453 2018
[6] J P Rastelli R Lattarulo and F Nashashibi ldquoDynamic tra-jectory generation using continuous-curvature algorithms fordoor to door assistance vehiclesrdquo in Proceedings of the 25th IEEEIntelligent Vehicles Symposium IV 2014 pp 510ndash515 IEEE June2014
[7] D Gonzalez J Perez R Lattarulo V Milanes and F Nasha-shibi ldquoContinuous curvature planning with obstacle avoidancecapabilities in urban scenariosrdquo in Proceedings of the 201417th IEEE International Conference on Intelligent TransportationSystems ITSC 2014 pp 1430ndash1435 China October 2014
[8] R Lattarulo E Marti M Marcano J Matute and J Perez ldquoASpeed PlannerApproach BasedOnBezier CurvesUsingVehicleDynamicConstrains andPassengersComfortrdquo inProceedings ofthe 2018 IEEE International Symposium on Circuits and Systems(ISCAS) pp 1ndash5 Florence Italy May 2018
[9] D Gonzalez J Perez V Milanes and F Nashashibi ldquoA Reviewof Motion Planning Techniques for Automated Vehiclesrdquo IEEETransactions on Intelligent Transportation Systems vol 17 no 4pp 1135ndash1145 2016
[10] US Department of Transportation Critical Reasons for CrashesInvestigated in the National Motor Vehicle Crash CausationSurvey NHTSA Traffic Safety Facts Crash Stats February 2015
[11] J Dokic B Muller and G Meyer ldquoEuropean roadmap smartsystems for automated drivingrdquo European Technology Platformon Smart Systems Integration January 2015
[12] G Meyer and S Deix ldquoResearch and innovation for automateddriving in germany and europerdquo pp 71ndash81 Springer RoadVehicle Automation 2014
[13] E Adell A Varhelyi andM D Fontana ldquoThe effects of a driverassistance system for safe speed and safe distance - A real-lifefield studyrdquo Transportation Research Part C Emerging Techno-logies vol 19 no 1 pp 145ndash155 2011
[14] J Ni and J Hu ldquoDynamics control of autonomous vehicleat driving limits and experiment on an autonomous formularacing carrdquo Mechanical Systems and Signal Processing vol 90pp 154ndash174 2017
Journal of Advanced Transportation 13
[15] M Zhu H Chen and G Xiong ldquoA model predictive speedtracking control approach for autonomous ground vehiclesrdquoMechanical Systems and Signal Processing vol 87 pp 138ndash1522017
[16] R Domınguez E Onieva J Alonso J Villagra and CGonzalez ldquoLIDAR based perception solution for autonomousvehiclesrdquo in Proceedings of the 2011 11th International Conferenceon Intelligent Systems Design and Applications ISDArsquo11 pp 790ndash795 Spain November 2011
[17] J-P Jodoin G-A Bilodeau and N Saunier ldquoUrban TrackerMultiple object tracking in urban mixed trafficrdquo in Proceedingsof the 2014 IEEEWinter Conference on Applications of ComputerVision WACV 2014 pp 885ndash892 USA March 2014
[18] L Li D Wen and D Yao ldquoA survey of traffic control withvehicular communicationsrdquo IEEE Transactions on IntelligentTransportation Systems vol 15 no 1 pp 425ndash432 2014
[19] D J Fagnant and K Kockelman ldquoPreparing a nation forautonomous vehicles Opportunities barriers and policy rec-ommendationsrdquo Transportation Research Part A Policy andPractice vol 77 pp 167ndash181 2015
[20] NWan A Vahidi and A Luckow ldquoOptimal speed advisory forconnected vehicles in arterial roads and the impact on mixedtrafficrdquo Transportation Research Part C Emerging Technologiesvol 69 pp 548ndash563 2016
[21] W Cao M Mukai T Kawabe H Nishira and N FujikildquoCooperative vehicle path generation during merging usingmodel predictive control with real-time optimizationrdquo ControlEngineering Practice vol 34 pp 98ndash105 2015
[22] T Shim G Adireddy and H Yuan ldquoAutonomous vehiclecollision avoidance system using path planning and model-predictive-control-based active front steering and wheel torquecontrolrdquo Proceedings of the Institution of Mechanical EngineersPart D Journal of Automobile Engineering vol 226 no 6 pp767ndash778 2012
[23] T Gu J Snider J M Dolan and J-W Lee ldquoFocused TrajectoryPlanning for autonomous on-road drivingrdquo inProceedings of the2013 IEEE Intelligent Vehicles Symposium IEEE IV 2013 pp 547ndash552 Australia June 2013
[24] A Best S Narang D Barber and D Manocha ldquoAutonoViAutonomous vehicle planning with dynamic maneuvers andtraffic constraintsrdquo in Proceedings of the 2017 IEEERSJ Interna-tional Conference on Intelligent Robots and Systems (IROS) pp2629ndash2636 Vancouver BC September 2017
[25] HMouhagir R Talj V Cherfaoui F Guillemard and F AiounldquoA Markov Decision Process-based approach for trajectoryplanning with clothoid tentaclesrdquo in Proceedings of the 2016IEEE Intelligent Vehicles Symposium IV 2016 pp 1254ndash1259Sweden June 2016
[26] M Du T Mei H Liang J Chen R Huang and P ZhaoldquoDriversrsquo Visual Behavior-Guided RRT Motion Planner forAutonomous On-Road Drivingrdquo Sensors vol 16 no 1 p 1022016
[27] US Department of Transportation A Brief Statistical SummaryDrowsyDriving NHTSATraffic Safety FactsCrash StatsMarch2011
[28] A G Cunningham E Galceran R M Eustice and E OlsonldquoMPDM multipolicy decision-making in dynamic uncertainenvironments for autonomous drivingrdquo in Proceedings of theIEEE International Conference on Robotics and Automation(ICRA rsquo15) pp 1670ndash1677 Seattle Wash USA May 2015
[29] K Zhou L Yu Z Long and S Mo ldquoLocal path planning ofdriverless car navigation based on jump point search methodunder urban environmentrdquo Future Internet vol 9 no 3 2017
[30] C Hubmann M Aeberhard and C Stiller ldquoA generic drivingstrategy for urban environmentsrdquo in Proceedings of the 19thIEEE International Conference on Intelligent TransportationSystems ITSC 2016 pp 1010ndash1016 Brazil November 2016
[31] X Qian I Navarro A De La Fortelle and FMoutarde ldquoMotionplanning for urban autonomous driving using bezier curves andMPCrdquo in Proceedings of the 19th IEEE International Conferenceon Intelligent Transportation Systems ITSC 2016 pp 826ndash833Brazil November 2016
[32] V Desaraju H C Ro M Yang E Tay S Roth and D DelVecchio ldquoPartial order techniques for vehicle collision avoid-ance Application to an autonomous roundabout test-bedrdquo inProceedings of the 2009 IEEE International Conference on Robo-tics and Automation ICRA rsquo09 pp 82ndash87 Japan May 2009
[33] S Glaser B Vanholme S Mammar D Gruyer and L Nou-veliere ldquoManeuver-based trajectory planning for highly auto-nomous vehicles on real road with traffic and driver interac-tionrdquo IEEE Transactions on Intelligent Transportation Systemsvol 11 no 3 pp 589ndash606 2010
[34] H Delingette M Herbert and K Ikeluchi ldquoTrajectory genera-tion with curvature constraint based on energy minimizationrdquoin Proceedings of the IEEERSJ International Workshop onIntelligent Robots and Systems (IROS rsquo91) vol 1 pp 206ndash211Osaka Japan November 1991
[35] J Cuadrado D Vilela I Iglesias A Martın and A Pena ldquoAmultibody model to assess the effect of automotive motor in-wheel configuration on vehicle stability and comfortrdquo in Pro-ceedings of the ECCOMAS Thematic Conference on MultibodyDynamics pp 1083ndash1092 2013
International Journal of
AerospaceEngineeringHindawiwwwhindawicom Volume 2018
RoboticsJournal of
Hindawiwwwhindawicom Volume 2018
Hindawiwwwhindawicom Volume 2018
Active and Passive Electronic Components
VLSI Design
Hindawiwwwhindawicom Volume 2018
Hindawiwwwhindawicom Volume 2018
Shock and Vibration
Hindawiwwwhindawicom Volume 2018
Civil EngineeringAdvances in
Acoustics and VibrationAdvances in
Hindawiwwwhindawicom Volume 2018
Hindawiwwwhindawicom Volume 2018
Electrical and Computer Engineering
Journal of
Advances inOptoElectronics
Hindawiwwwhindawicom
Volume 2018
Hindawi Publishing Corporation httpwwwhindawicom Volume 2013Hindawiwwwhindawicom
The Scientific World Journal
Volume 2018
Control Scienceand Engineering
Journal of
Hindawiwwwhindawicom Volume 2018
Hindawiwwwhindawicom
Journal ofEngineeringVolume 2018
SensorsJournal of
Hindawiwwwhindawicom Volume 2018
International Journal of
RotatingMachinery
Hindawiwwwhindawicom Volume 2018
Modelling ampSimulationin EngineeringHindawiwwwhindawicom Volume 2018
Hindawiwwwhindawicom Volume 2018
Chemical EngineeringInternational Journal of Antennas and
Propagation
International Journal of
Hindawiwwwhindawicom Volume 2018
Hindawiwwwhindawicom Volume 2018
Navigation and Observation
International Journal of
Hindawi
wwwhindawicom Volume 2018
Advances in
Multimedia
Submit your manuscripts atwwwhindawicom
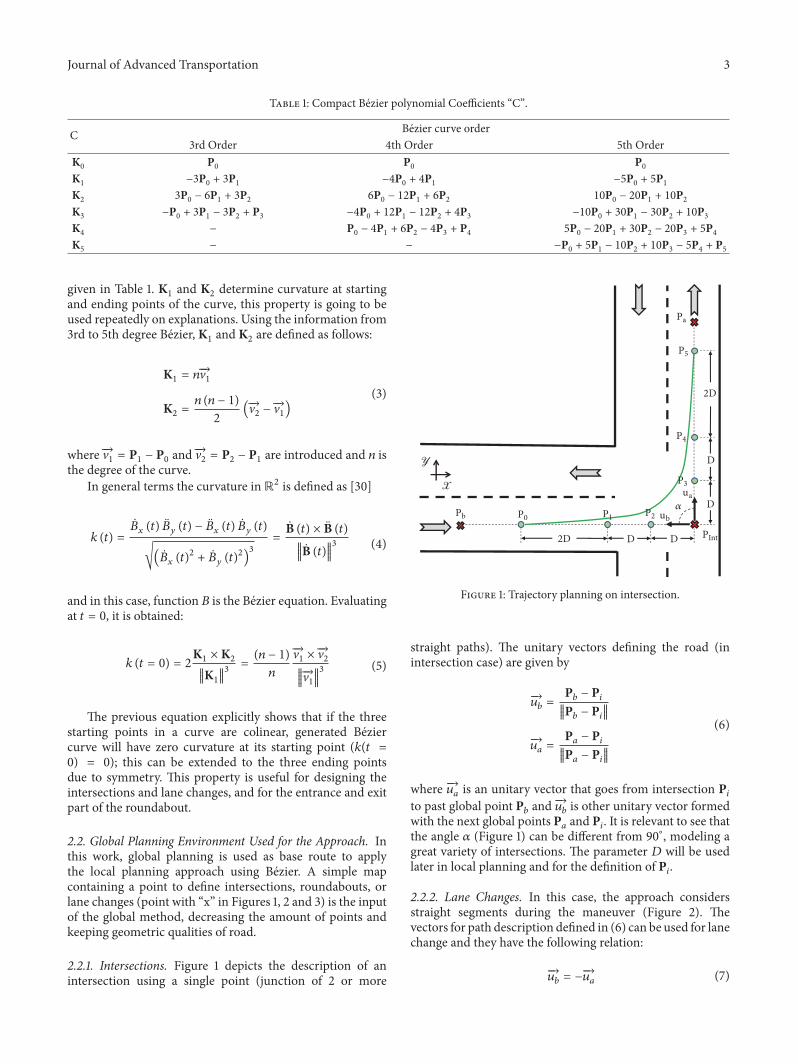
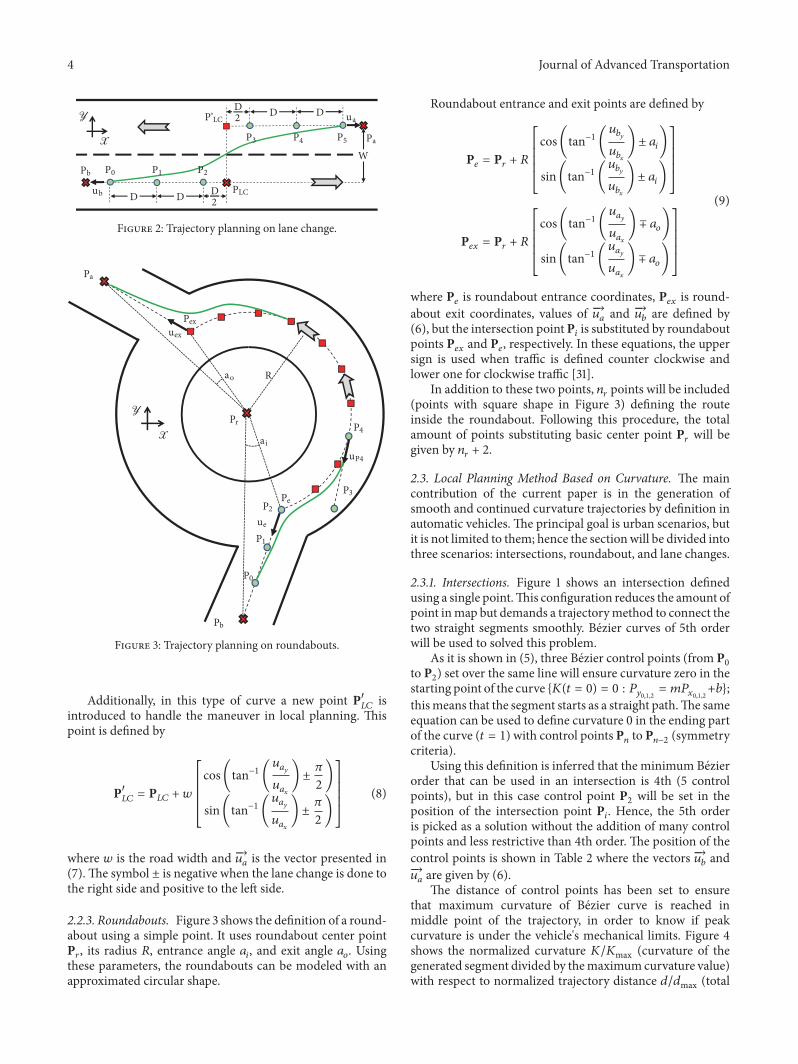
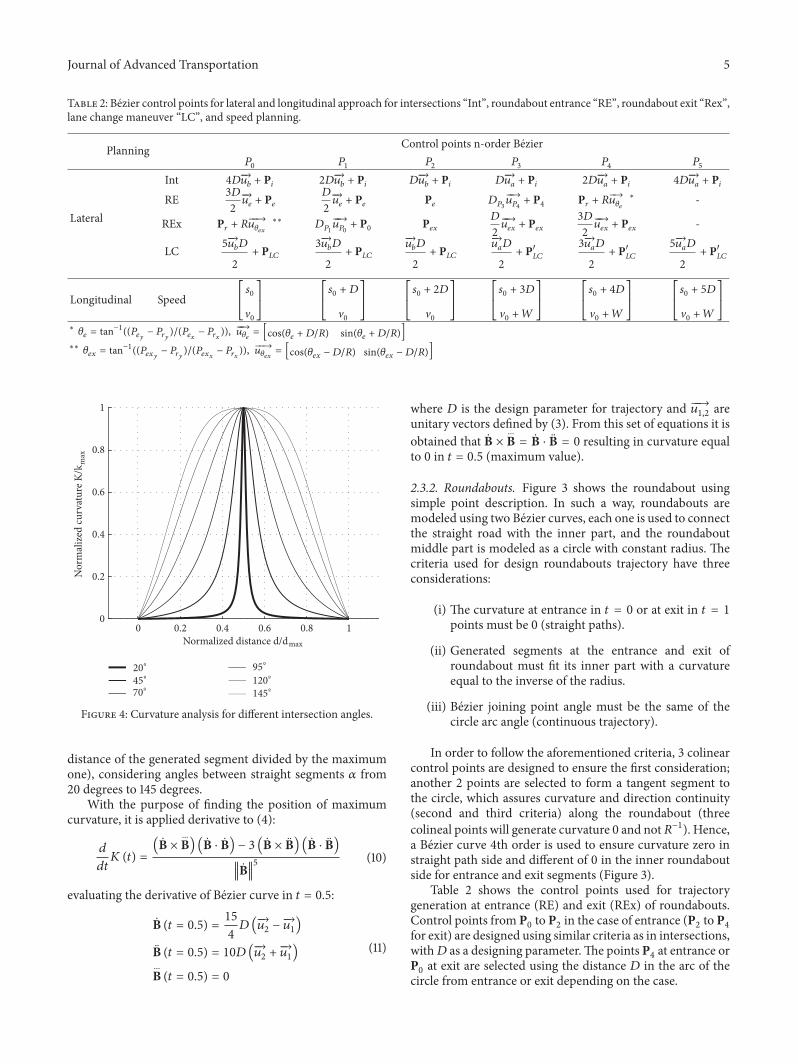
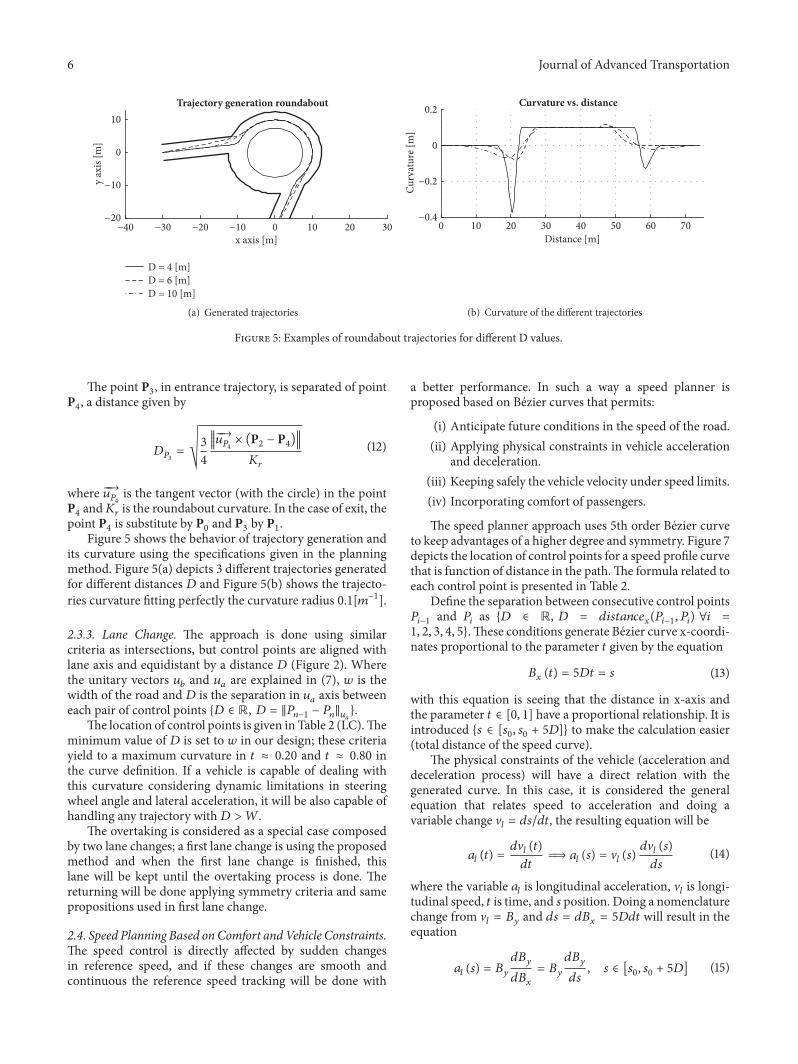
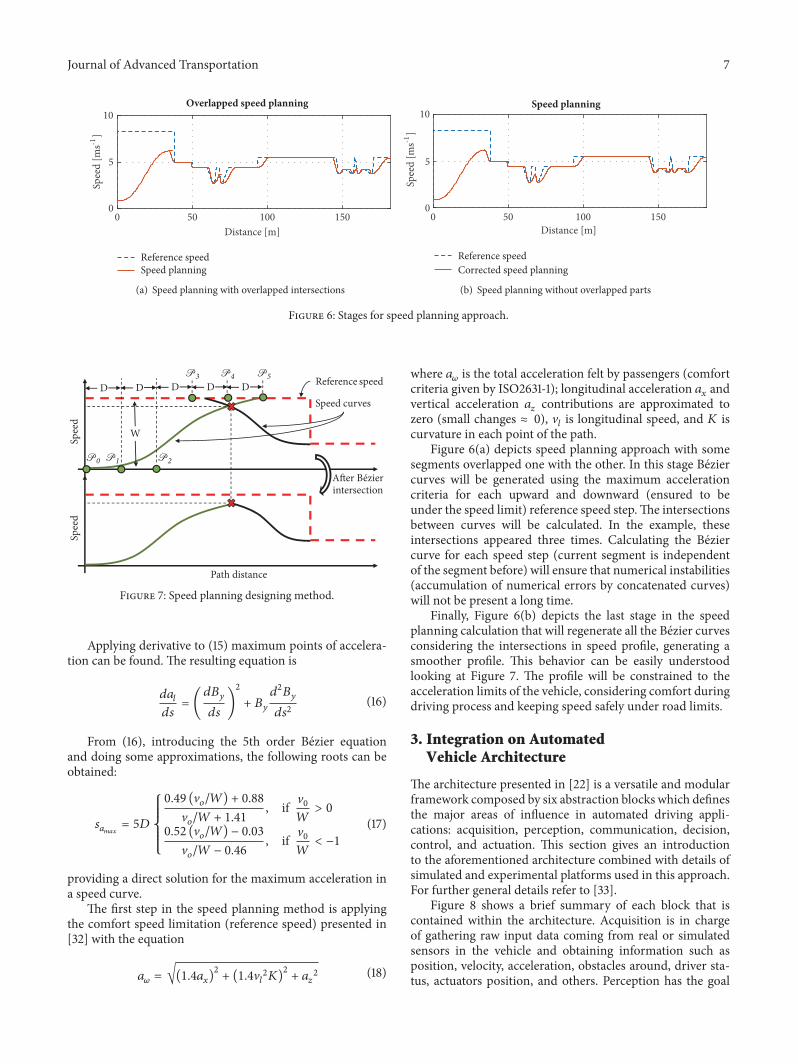
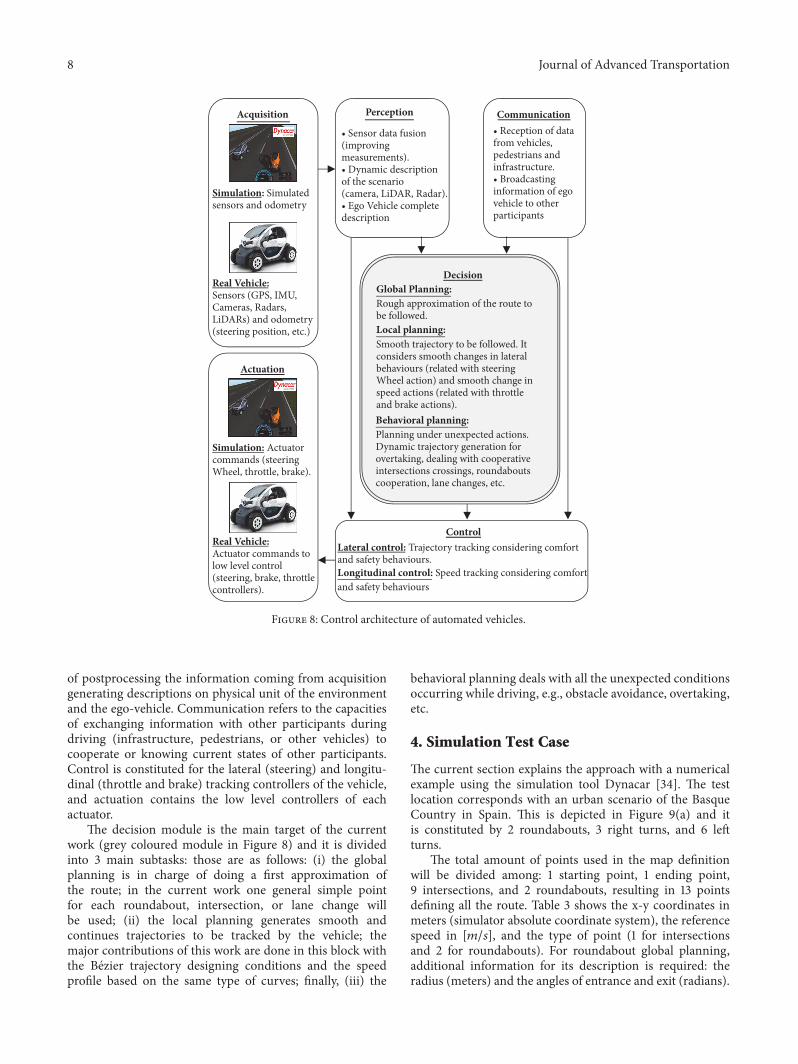
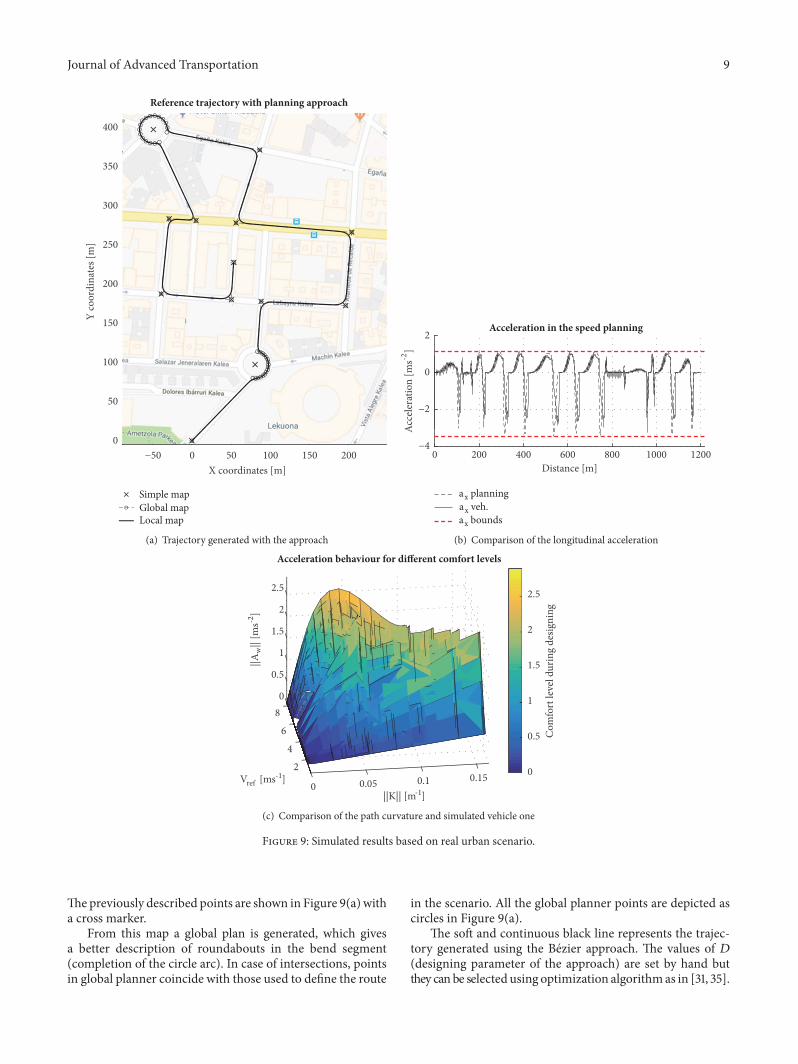
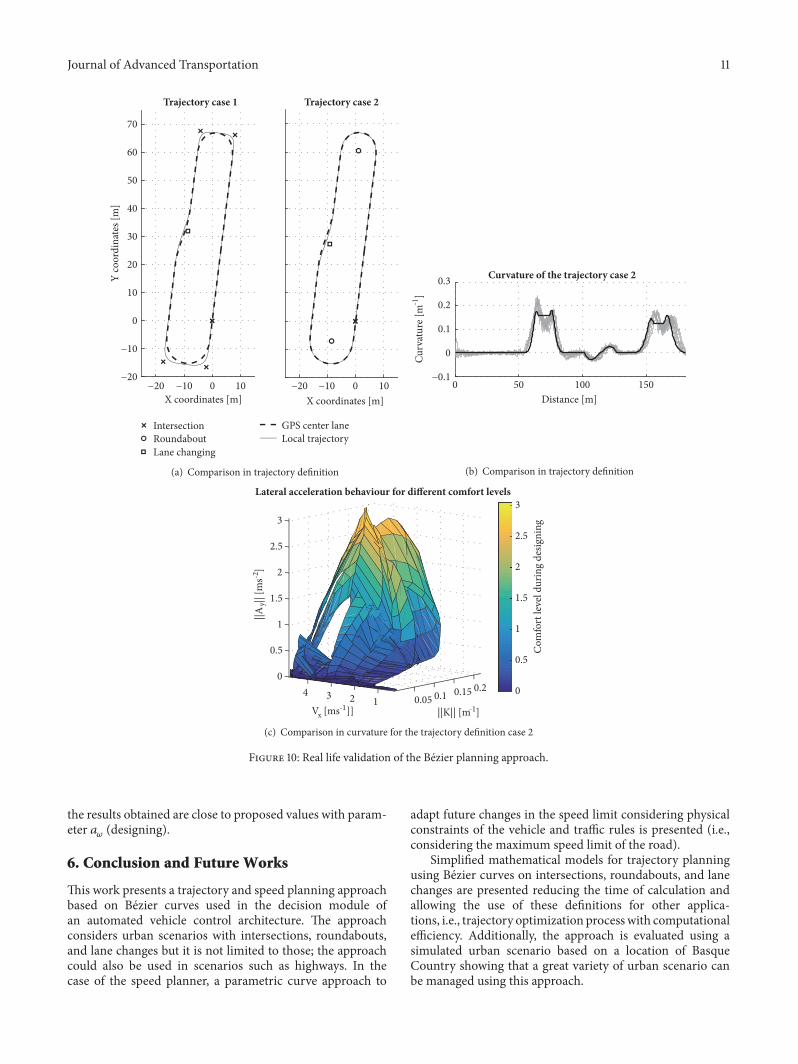
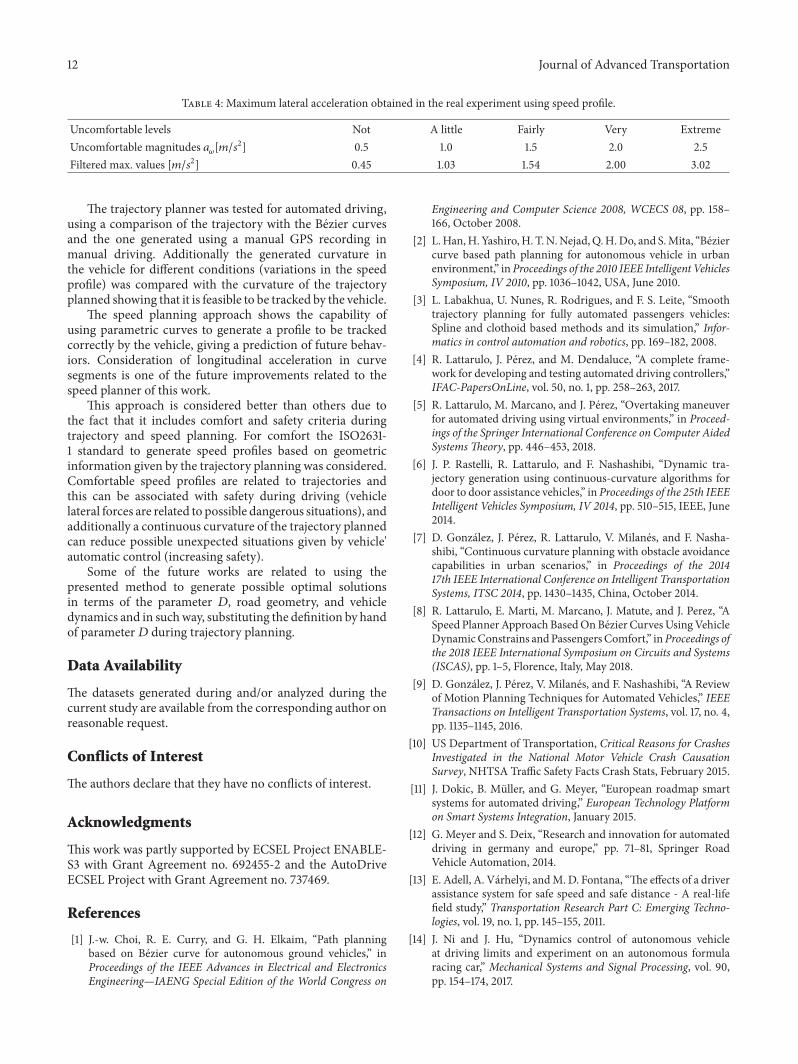

International Journal of
AerospaceEngineeringHindawiwwwhindawicom Volume 2018
RoboticsJournal of
Hindawiwwwhindawicom Volume 2018
Hindawiwwwhindawicom Volume 2018
Active and Passive Electronic Components
VLSI Design
Hindawiwwwhindawicom Volume 2018
Hindawiwwwhindawicom Volume 2018
Shock and Vibration
Hindawiwwwhindawicom Volume 2018
Civil EngineeringAdvances in
Acoustics and VibrationAdvances in
Hindawiwwwhindawicom Volume 2018
Hindawiwwwhindawicom Volume 2018
Electrical and Computer Engineering
Journal of
Advances inOptoElectronics
Hindawiwwwhindawicom
Volume 2018
Hindawi Publishing Corporation httpwwwhindawicom Volume 2013Hindawiwwwhindawicom
The Scientific World Journal
Volume 2018
Control Scienceand Engineering
Journal of
Hindawiwwwhindawicom Volume 2018
Hindawiwwwhindawicom
Journal ofEngineeringVolume 2018
SensorsJournal of
Hindawiwwwhindawicom Volume 2018
International Journal of
RotatingMachinery
Hindawiwwwhindawicom Volume 2018
Modelling ampSimulationin EngineeringHindawiwwwhindawicom Volume 2018
Hindawiwwwhindawicom Volume 2018
Chemical EngineeringInternational Journal of Antennas and
Propagation
International Journal of
Hindawiwwwhindawicom Volume 2018
Hindawiwwwhindawicom Volume 2018
Navigation and Observation
International Journal of
Hindawi
wwwhindawicom Volume 2018
Advances in
Multimedia
Submit your manuscripts atwwwhindawicom