Embed Size (px)
Citation preview
TURUN YLIOPISTON JULKAISUJAANNALES UNIVERSITATIS TURKUENSIS
SARJA - SER. A I OSA - TOM. 427
ASTRONOMICA - CHEMICA - PHYSICA - MATHEMATICA
TURUN YLIOPISTOUNIVERSITY OF TURKU
Turku 2011
UPCONVERTING PHOSPHOR TECHNOLOGY:
Exceptional Photoluminescent Properties Light Up Homogeneous
Bioanalytical Assays
by
Terhi Riuttamäki(née Rantanen)

From the Department of Biochemistry and Food Chemistry / BiotechnologyUniversity of TurkuTurku, Finland
Supervised by
Professor Tero Soukka, Ph.D.Department of Biochemistry and Food Chemistry / BiotechnologyUniversity of TurkuTurku, Finland
and
Professor Emeritus Timo Lövgren, Ph.D.Department of Biochemistry and Food Chemistry / BiotechnologyUniversity of TurkuTurku, Finland
Reviewed by
Professor Sakari Kulmala, Ph.D.Analytical ChemistryAalto UniversitySchool of Chemical TechnologyEspoo, Finland
and
Professor Emeritus Ulf-Håkan Stenman, M.D., Ph.D.Department of Clinical ChemistryHelsinki University and Helsinki University Central HospitalHelsinki, Finland
Opponent
Professor Stefan Andersson-Engels, Ph.D.Department of PhysicsLund UniversityLund, Sweden
ISBN 978-951-29-4742-3 (PRINT)ISBN 978-951-29-4743-0 (PDF)ISSN 0082-7002Painosalama Oy – Turku, Finland 2011

Knowing is not enough, we must apply.Willing is not enough, we must do.
– Goethe
Contents
4
CONTENTS
LIST OF ORIGINAL PUBLICATIONS .......................................................................6ABBREVIATIONS ..........................................................................................................7ABSTRACT......................................................................................................................81 INTRODUCTION.....................................................................................................92 REVIEW OF THE LITERATURE .......................................................................10
2.1 Photon upconversion mechanisms ..................................................................102.2 Upconverting phosphors ..................................................................................12
2.2.1 Composition .............................................................................................122.2.2 Recent development trends in upconverting materials.............................152.2.3 Upconversion efficiency...........................................................................192.2.4 Advantages as bioanalytical labels...........................................................192.2.5 Challenges in bioanalytical applications ..................................................21
2.3 Bioconjugates of UCPs .....................................................................................222.3.1 Surface functionalization..........................................................................222.3.2 Bioconjugation .........................................................................................25
2.4 Bioanalytical applications ................................................................................252.4.1 Heterogeneous bioaffinity assays .............................................................262.4.2 Array-type multiplexed assays .................................................................282.4.3 Lateral flow tests ......................................................................................292.4.4 Proximity-based homogeneous assays .....................................................332.4.5 Optical sensors .........................................................................................39
2.5 Instrumentation for detecting the UCP emission...........................................403 AIMS OF THE STUDY ..........................................................................................434 SUMMARY OF MATERIALS AND METHODS ...............................................44
4.1 Upconverting materials....................................................................................444.1.1 Origin of the UCPs...................................................................................444.1.2 Surface functionalization of the UCPs .....................................................454.1.3 Conjugation of the UCPs..........................................................................46
4.2 Acceptor dyes ....................................................................................................464.3 Instrumentation for anti-Stokes photoluminescence measurements ...........48
4.3.1 Plate reader...............................................................................................484.3.2 Fluorescence spectrophotometer ..............................................................494.3.3 Frequency-domain luminometer ..............................................................49
4.4 Homogeneous assays based on upconversion resonance energy transfer....504.4.1 Biotin assay utilizing a tandem dye acceptor (I) ......................................524.4.2 Enzyme-activity assay (II)........................................................................534.4.3 Dual-parameter sandwich hybridization assay (III) .................................54
4.5 Energy transfer from UCPs (IV).....................................................................56
Contents
5
5 SUMMARY OF RESULTS AND DISCUSSION .................................................575.1 Colloidal UCPs for biocompatible applications .............................................57
5.1.1 UCP material ............................................................................................575.1.2 Surface functionalization of the UCPs .....................................................595.1.3 Conjugation of the UCPs..........................................................................61
5.2 Homogeneous assays based on upconversion resonance energy transfer....625.2.1 Energy transfer acceptors .........................................................................625.2.2 Model assay designs based on upconversion RET...................................675.2.3 Near-infrared excitation ...........................................................................71
5.3 Energy transfer from UCPs.............................................................................745.3.1 Distance consideration .............................................................................745.3.2 Energy transfer mechanisms (IV).............................................................75
6 CONCLUSIONS......................................................................................................78ACKNOWLEDGEMENTS...........................................................................................80REFERENCES...............................................................................................................83ORIGINAL PUBLICATIONS......................................................................................95
List of original publications
6
LIST OF ORIGINAL PUBLICATIONS
This thesis is based on the following original publications, referred to in the text by theirRoman numerals (I-IV)
I Terhi Rantanen, Henna Päkkilä, Laura Jämsen, Katri Kuningas, Telle Ukonaho,Timo Lövgren & Tero Soukka (2007). Tandem dye acceptor used to enhanceupconversion fluorescence resonance energy transfer in homogeneous assays. AnalChem 79(16):6312–6318.
II Terhi Rantanen, Marja-Leena Järvenpää, Johanna Vuojola, Katri Kuningas & TeroSoukka (2008) Fluorescence-quenching-based enzyme-activity assay by usingphoton upconversion. Angew Chem Int Ed 47:3811–3813.
III Terhi Rantanen, Marja-Leena Järvenpää, Johanna Vuojola, Riikka Arppe, KatriKuningas & Tero Soukka (2009) Upconverting phosphors in a dual-parameterLRET-based hybridization assay. Analyst 134:1713–1716.
IV Terhi Riuttamäki, Iko Hyppänen, Jouko Kankare & Tero Soukka (2011) Decreasein luminescence lifetime indicating nonradiative energy transfer from upconvertingphosphors to fluorescent acceptors in aqueous suspensions. J Phys Chem C115:17736–17742.
In addition, some unpublished data is presented.
The original publications have been reproduced with the permission from the copyrightholders.
Abbreviations
7
ABBREVIATIONS
1D one-dimensional2D two-dimensionalAF… Alexa Fluor fluorophoreAPTE addition of photons by transfer of energy (upconversion mechanism)APTS 3-aminopropyltriethoxysilane (organosilane)BBQ650 BlackBerry Quencher 650BPE B-phycoerythrin (fluorescent protein)BSA bovine serum albuminCCD charge-coupled device (light detector)CR cross-relaxationCTAB cetyltrimethylammonium bromide (cationic surfactant)EDC 1-ethyl-3-(3-dimethylaminopropyl) carbodiimideEDTA ethylenediaminetetraacetic acid (chelating agent)ELISA enzyme-linked immunosorbent assayEr erbium (rare earth element)ESA excited-state absorption (upconversion mechanism)ETU energy transfer upconversion (upconversion mechanism)FD frequency-domainf-PSA free prostate-specific antigen (prostate cancer marker)GSA ground-state absorptionhCG human chorionic gonadotropin (pregnancy hormone)HLA-B27 human leukocyte antigen B27 (genetic marker for certain autoimmune disorders)Ho holmium (rare earth element)LbL layer-by-layer (coating method)LD laser diode (excitation source)LED light emitting diode (excitation source)LF lateral flow (assay format)LOD limit of detectionLOQ limit of quantificationLRET lanthanide resonance energy transferNHS N-hydroxysuccinimideNIR near-infrared radiation (wavelength 750–1400 nm)PA photon avalanche (upconversion mechanism)PAA poly(acrylic acid)PAH poly(allylamine hydrochloride)PCR polymerase chain reactionPEG polyethylene glycolPEI polyethyleneiminePMT photomultiplier tube (light detector)POCT point-of-care testingPSS poly(styrene sulfonate)PVP polyvinylpyrrolidoneR0 Förster radius (the distance at which energy transfer efficiency is 50%)RET resonance energy transfer (nonradiative energy transfer mechanism)SEB Staphylococcal enterotoxin BSET surface energy transfersulfo-NHS N-hydroxysulfo-succinimideTEM transmission electron microscopyTEOS tetraethyl orthosilicateTm thulium (rare earth element)UCP upconverting phosphor (photoluminescent inorganic compound)UC-RET upconversion resonance energy transferUV ultraviolet radiation (wavelength <380 nm)Yb ytterbium (rare earth element)
Abstract
8
ABSTRACT
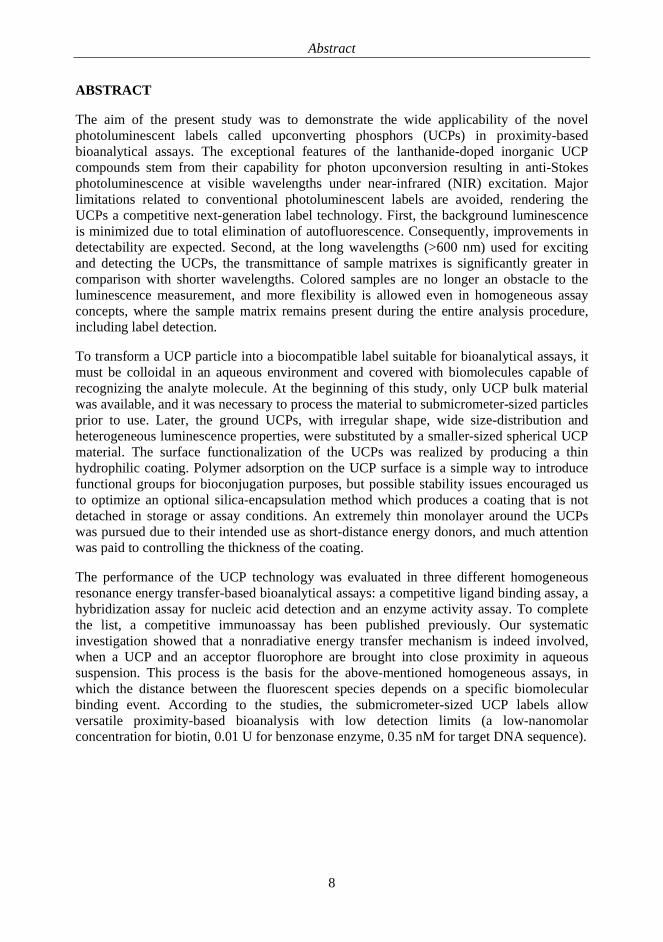
The aim of the present study was to demonstrate the wide applicability of the novelphotoluminescent labels called upconverting phosphors (UCPs) in proximity-basedbioanalytical assays. The exceptional features of the lanthanide-doped inorganic UCPcompounds stem from their capability for photon upconversion resulting in anti-Stokesphotoluminescence at visible wavelengths under near-infrared (NIR) excitation. Majorlimitations related to conventional photoluminescent labels are avoided, rendering theUCPs a competitive next-generation label technology. First, the background luminescenceis minimized due to total elimination of autofluorescence. Consequently, improvements indetectability are expected. Second, at the long wavelengths (>600 nm) used for excitingand detecting the UCPs, the transmittance of sample matrixes is significantly greater incomparison with shorter wavelengths. Colored samples are no longer an obstacle to theluminescence measurement, and more flexibility is allowed even in homogeneous assayconcepts, where the sample matrix remains present during the entire analysis procedure,including label detection.
To transform a UCP particle into a biocompatible label suitable for bioanalytical assays, itmust be colloidal in an aqueous environment and covered with biomolecules capable ofrecognizing the analyte molecule. At the beginning of this study, only UCP bulk materialwas available, and it was necessary to process the material to submicrometer-sized particlesprior to use. Later, the ground UCPs, with irregular shape, wide size-distribution andheterogeneous luminescence properties, were substituted by a smaller-sized spherical UCPmaterial. The surface functionalization of the UCPs was realized by producing a thinhydrophilic coating. Polymer adsorption on the UCP surface is a simple way to introducefunctional groups for bioconjugation purposes, but possible stability issues encouraged usto optimize an optional silica-encapsulation method which produces a coating that is notdetached in storage or assay conditions. An extremely thin monolayer around the UCPswas pursued due to their intended use as short-distance energy donors, and much attentionwas paid to controlling the thickness of the coating.
The performance of the UCP technology was evaluated in three different homogeneousresonance energy transfer-based bioanalytical assays: a competitive ligand binding assay, ahybridization assay for nucleic acid detection and an enzyme activity assay. To completethe list, a competitive immunoassay has been published previously. Our systematicinvestigation showed that a nonradiative energy transfer mechanism is indeed involved,when a UCP and an acceptor fluorophore are brought into close proximity in aqueoussuspension. This process is the basis for the above-mentioned homogeneous assays, inwhich the distance between the fluorescent species depends on a specific biomolecularbinding event. According to the studies, the submicrometer-sized UCP labels allowversatile proximity-based bioanalysis with low detection limits (a low-nanomolarconcentration for biotin, 0.01 U for benzonase enzyme, 0.35 nM for target DNA sequence).
Introduction
9
1 INTRODUCTION
Bioanalytical assays are used in medical diagnostics as well as in food safety assurance andenvironmental monitoring to determine the concentration of analytes, such as proteins,nucleic acids, carbohydrates, hormones, toxins, drugs and whole cells. The specificrecognition capabilities of biomolecules are exploited to capture the analytes from complexsample matrixes and the analyte concentration is translated into a detectable signal byutilizing a selected label technology. In addition to the binder molecule quality and thelabel properties, the assay design is also a key element in a bioaffinity assay. The recenttrend in assay development has been towards point-of-care testing (POCT) (Junker et al.,2010), which aims at fast-performing and ready-to-use solutions with low equipmentdemand. Nonetheless, the testing should be precise, accurate, cost-effective and highlysensitive. POCT does not replace the huge capacities of centralized laboratory testing butwill reshape the conventions of the sample analysis. In the future, an increasing number oftests will be available near the patient or on the site of the food and environmentalsampling locations.
The bioanalytical assays are classified as heterogeneous or homogeneous assays based onwhether they use a washing step or not (Davies, 2005). Heterogeneous assays provide themost sensitive results, but the washing step separating the unbound fraction of the labeledcomponent before signal measurement requires extra time and additional instrumentation.Even though the detection limit is usually compromised in separation-free homogeneousassays, where the binding event itself modulates the signal, the format is superior for fasterand simpler solutions, such as POCT.
To keep the detection limits of homogeneous assays at a satisfactory level, the labeltechnology used for quantification plays an important role. The first labels, introduced backin 1960, were radioisotopes (Yalow and Berson, 1960; Ekins, 1960), but the disadvantages(e.g., limited shelf-life, low specific activity and health risks) motivated scientists to seeknon-isotopic options. Presently, photoluminescent labels have accelerated the performancetime, and the sensitivities achieved with the radiolabels have been exceeded (Ekins, 1998).However, other problems related to photoluminescence measurements need to be overcometo further improve the performance of bioanalytical assays. First, autofluorescenceoriginating mainly from biological material increases the background fluorescence, limitingthe assay sensitivity. Second, absorption properties of the non-transparent and coloredsample matrixes severely interfere at ultraviolet (UV) and visible wavelengths, and onlyheterogeneous assays are normally feasible if absorption coincides with either theexcitation or the measurement wavelength. Time-resolved fluorometry, exploiting the longemission lifetime of lanthanide labels, has provided a partial solution since the late 1970sby eliminating the short-lived autofluorescence with time-gated measurement (Soini andHemmilä, 1979; Soini et al., 1987). However, excitation at the UV region restricts the useof optically non-transparent samples. A comprehensive solution can be realized with labeltechnologies based on near-infrared-to-visible photon upconversion. Simultaneous orsequential absorption of multiple low-energy near-infrared (NIR) photons results in anti-Stokes emission detectable at visible wavelengths, and autofluorescence is totally avoided(He et al., 2008; Hänninen et al., 2008; Auzel, 2004). Inorganic upconverting phosphorcompounds show the most efficient upconversion capabilities (Auzel, 2004), renderingthem highly promising luminescent labels for ultrasensitive homogeneous assays (Haaseand Schäfer, 2011).
Review of the Literature
10
a) b)
2 REVIEW OF THE LITERATURE
2.1 Photon upconversion mechanisms
Photon upconversion is a process generating higher-energy emission from low-energyradiation. The increase in energy is achieved by absorbing multiple (usually two or three)photons per single emitted photon. The transition from the excited electronic state back tothe ground state, or to another lower-lying energy level, produces luminescence atwavelengths shorter than the original excitation wavelength. This nonlinear optical process,also called anti-Stokes photoluminescence, involves intermediate excited states, which canbe either virtual or real electronic states. Utilization of non-existing virtual intermediatestates requires an extremely high excitation power density (106–109 W/cm2) becausemultiple photons need to be absorbed simultaneously (Auzel, 2004). To avoid thermaldecomposition of the sample under intense radiation, expensive ultrafast pulse lasers areemployed as excitation sources, for example in multi-photon microscopy (Denk et al.,1990). An affordable continuous wave laser diode with ~106 times lower output power issufficient to promote the photon upconversion in certain inorganic compounds having realmetastable intermediate states because the photons can be absorbed one after the otherinstead of simultaneously. This thesis concentrates only on those exceptional inorganicmaterials, while mechanisms based on, for example, multiphoton absorption (Kaiser andGarrett, 1961) and second-harmonic generation (i.e., frequency doubling) (Franken et al.,1961; Armstrong et al., 1962), both of which lack the intermediate energy state, areexcluded.
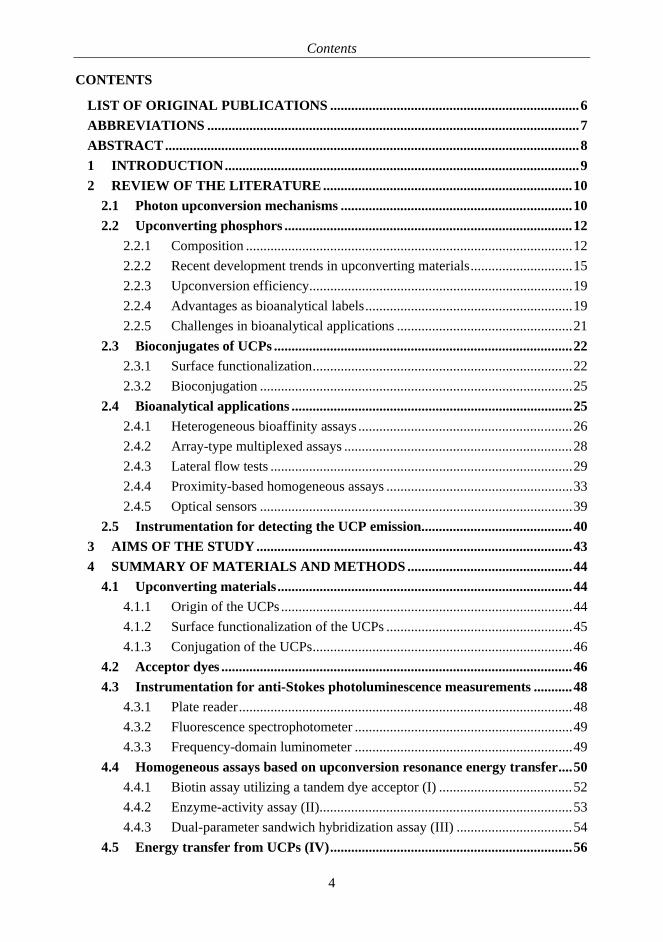
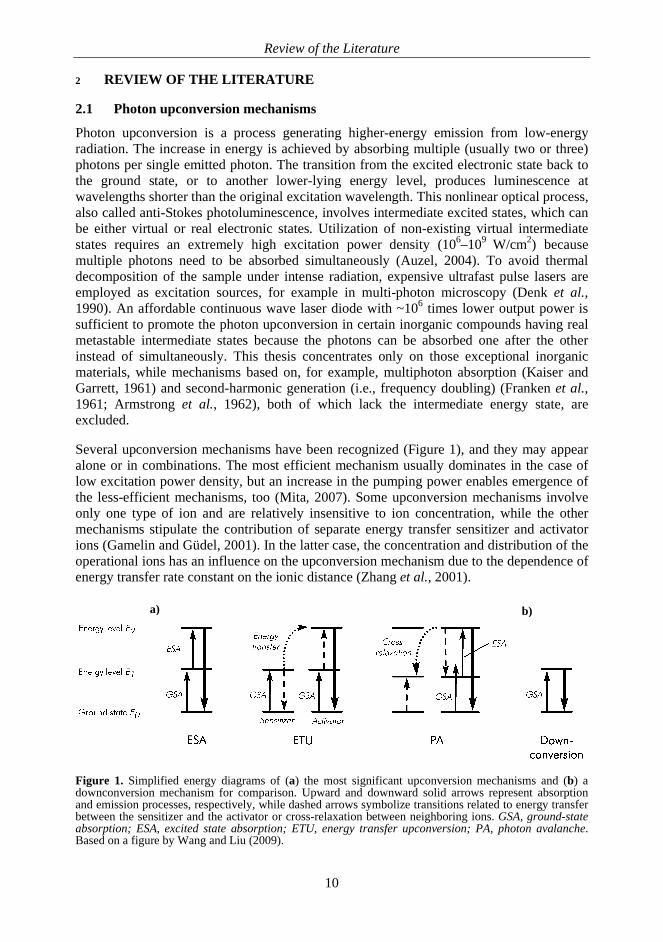
Several upconversion mechanisms have been recognized (Figure 1), and they may appearalone or in combinations. The most efficient mechanism usually dominates in the case oflow excitation power density, but an increase in the pumping power enables emergence ofthe less-efficient mechanisms, too (Mita, 2007). Some upconversion mechanisms involveonly one type of ion and are relatively insensitive to ion concentration, while the othermechanisms stipulate the contribution of separate energy transfer sensitizer and activatorions (Gamelin and Güdel, 2001). In the latter case, the concentration and distribution of theoperational ions has an influence on the upconversion mechanism due to the dependence ofenergy transfer rate constant on the ionic distance (Zhang et al., 2001).
Figure 1. Simplified energy diagrams of (a) the most significant upconversion mechanisms and (b) adownconversion mechanism for comparison. Upward and downward solid arrows represent absorptionand emission processes, respectively, while dashed arrows symbolize transitions related to energy transferbetween the sensitizer and the activator or cross-relaxation between neighboring ions. GSA, ground-stateabsorption; ESA, excited state absorption; ETU, energy transfer upconversion; PA, photon avalanche.Based on a figure by Wang and Liu (2009).
Review of the Literature
11
The simplest upconversion process involving only a single ion is excited-state absorption(ESA), which was the mechanism responsible for the near-infrared-to-visible photonupconversion discovered first by Bloembergen (1959). The first pump photon populates theintermediate excited state E1 (ground-state absorption, GSA), followed by a secondabsorption (ESA) triggering the upconversion emission from the higher E2 state. Anupconversion mechanism featuring two different neighboring ions (a sensitizer and anactivator) is referred to as an energy transfer upconversion (ETU) or alternatively asaddition of photons by transfer of energy (APTE) (Auzel, 1966b; Auzel, 1966a). In thismechanism, the GSA is followed by a nonradiative resonant energy transfer from thesensitizer ion to the activator ion, which leads to population of the higher excited state E2of the latter. A good sensitizer ion has no resonant energy states above state E1 of its own,which makes the energy transfer process more efficient due to the lack of competingprocesses. This mechanism is about 100 times more efficient than the ESA mechanism.Photon avalanche (PA), involving cross-relaxation energy transfer between neighboringions, is a more complex mechanism observed when the pump flux exceeds a certain criticalthreshold (Chivian et al., 1979; Joubert et al., 1993). The cross-relaxation step assists inpopulation of the intermediate excited state E1 because the excitation energy is not resonantwith the GSA transition directly but only with the following ESA transition. The GSA stepin the beginning is eminently inefficient, but subsequently the ESA step populates thehigher excited state E2 very effectively. The cross-relaxation step results in population ofthe intermediate state E1 of both neighboring ions, and the avalanche process is boosted.Even though PA is eventually a highly efficient upconversion mechanism, it is poorlyexploitable due to the slow response to the excitation (up to seconds). Cooperativemechanisms with lower upconversion efficiencies were omitted from Figure 1 in order tofocus attention on the more significant upconversion mechanisms. These mechanisms sumup the photon energy of multiple sensitizer ions by sensitization or by emission (Snitzerand Woodcock, 1965; Ovsyankin and Feofilov, 1966; Nakazawa and Shionoya, 1970).
The likelihood of populating the higher luminescent energy level E2 by re-excitationdepends on the lifetime of the lower intermediate state E1 acting as “an energy store”(Gamelin and Güdel, 2001). Excited molecules can relax to the ground state (or anotherlower-lying electronic state) either through a radiative or a nonradiative path. The formerinvolves the emission of a photon with energy determined by the energy difference of thetwo states. Nonradiative relaxations comprise all alternative relaxations but those leading toluminescence. In like manner to the quantum of light called a photon, the quantum oflattice vibrational energy in solid state is termed a phonon. If the energy gap to the nextlower energy level is small, the number of phonons required to match the gap is low,resulting in an elevated probability for a multiphonon decay, which represents oneprevalent form of nonradiative relaxation. A third relaxation option is to transfer the energyin a nonradiative manner to a suitable energy acceptor in close proximity. All the threeabove-mentioned depopulation paths of the intermediate state E1 should be minimized inorder to increase the excited state lifetime and, consequently, the upconversion efficiency.The lifetime defines the power density needed for generation of photon upconversion(Morgan et al., 2008). The upconversion processes are not limited to two absorbed photons(as illustrated in Figure 1), but three or even more photons can be involved to reach evenhigher energy levels.
From the 1960s when research began in this area, it was known that the upconversionluminescence intensity I is proportional to the nth power of the absorbed pump power P
Review of the Literature
12
(I Pn), where n denotes the number of pump photons absorbed per upconversion photonemitted. In other words, when I versus P is plotted in a double-logarithmic representation,the slope is n. As more powerful NIR excitation sources became available, saturation of theupconversion-induced luminescence was observed, and it was realized that the power-dependence of upconversion emission bands changes with excitation power (Suyver et al.,2005b; Pollnau et al., 2000). In reality, the dependence decreases from Pn down to P1 withincreasing excitation power and, accordingly, the above-mentioned slope will approach 1(regardless of the number of photons involved). However, it is crucial to note that theexcitation power has a higher impact on the luminescence intensity in the case of photonupconversion (n >1) than in the case of common photon downconversion (n = 1).
2.2 Upconverting phosphors
2.2.1 Composition
Photon upconversion can be exploited in bioanalytical assays in the form of labels calledupconverting phosphors (UCPs). They are inorganic crystals composed of a transparenthost lattice doped with certain trivalent lanthanide ions or transition metals. In order to tunethe photophysical properties (emission wavelength and intensity) of upconvertingmaterials, the role of each element needs to be understood.
Host material
The host material forms a crystalline lattice that maintains the correct arrangement of thehybrid material. Suitable inorganic compounds comprise trivalent rare earth ions (Y3+,La3+, Gd3+, Sc3+), alkaline earth ions (Ca2+, Sr2+, Ba2+) or certain transition metals (Zr4+,Ti4+) (Wang and Liu, 2009). A low phonon energy lattice is essential in order to reduce themultiphonon relaxation (minimized energy losses) and to increase the lifetime of theintermediate states involved in upconversion (maximized radiative emission) (Riedener etal., 1995; Suyver et al., 2005a). The most practical hosts are halides (e.g., NaYF4, YF3,LaF3), oxides (e.g., Y2O3, ZrO2) and oxysulfides (e.g., Y2O2S, La2O2S) (Suyver et al.,2005a; Zarling et al., 1994; Güdel, 1998). The lowest phonon energies are typical for thehalide-based lattices (<400 cm–1), but only the lightest halide, fluoride, is practical in actualuse due to the hygroscopic nature of the heavier ones (Ong et al., 2010). Oxide-basedlattices have better chemical stability, but they suffer from relatively high phonon energies(>500 cm–1) (Wang and Liu, 2009; Ong et al., 2010).
Dopant ions
The dopant ions play a central role by actually absorbing and emitting the photons. Theydetermine, for example, the color of the emitted light. Many trivalent lanthanide ions havemetastable intermediate electronic states (“energy stores”) that are suitable for generationof the upconversion emission. The favorable photoluminescent properties of lanthanidesare predominated by the 4f electrons, which are well shielded by the lower-energy 5s and5p electrons spatially locating outside of the 4f orbital (Cotton, 2006; Bünzli and Piguet,2005). Electron–phonon coupling to f–f transitions is reduced, making the multiphononrelaxation processes less competitive, and forbidden f–f transitions result in long-livedexcited states (up to 100 ms). Energy levels having sufficiently large gaps to the nextlowest level are more likely relaxed radiatively (triggering photon emission) than throughmultiphonon relaxation. Appropriately spaced ladder-like energy levels of Er3+, Tm3+,
Review of the Literature
13
Ho3+, and less frequently also Pr3+, Nd3+ and Dy3+, render these ions suitable dopants inupconverting materials. The dopant ion occupies part of the cation sites in the host latticeand the similar size of the dopants and host lattice cations can be regarded as an advantage.
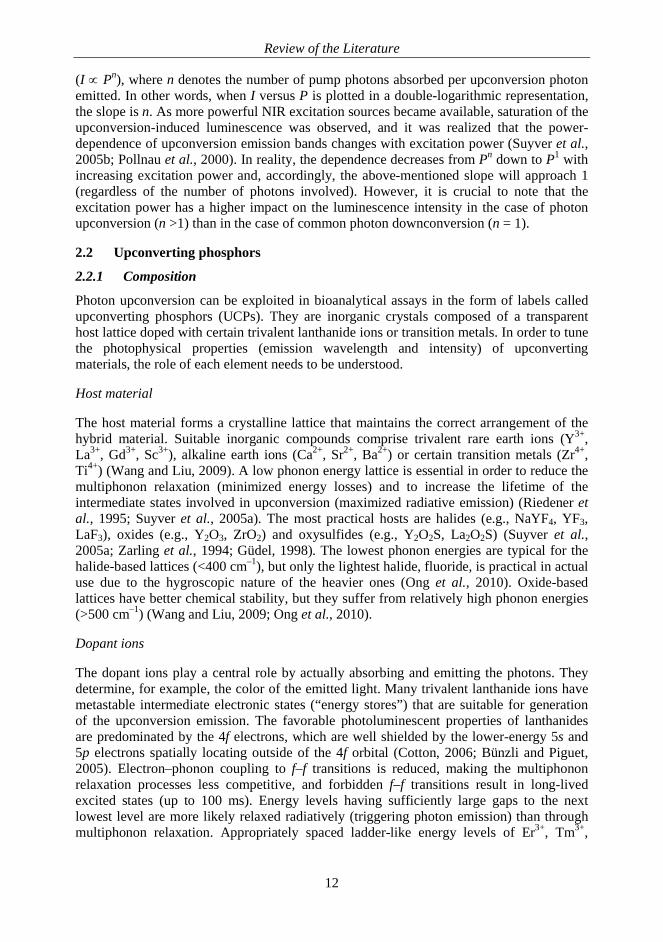
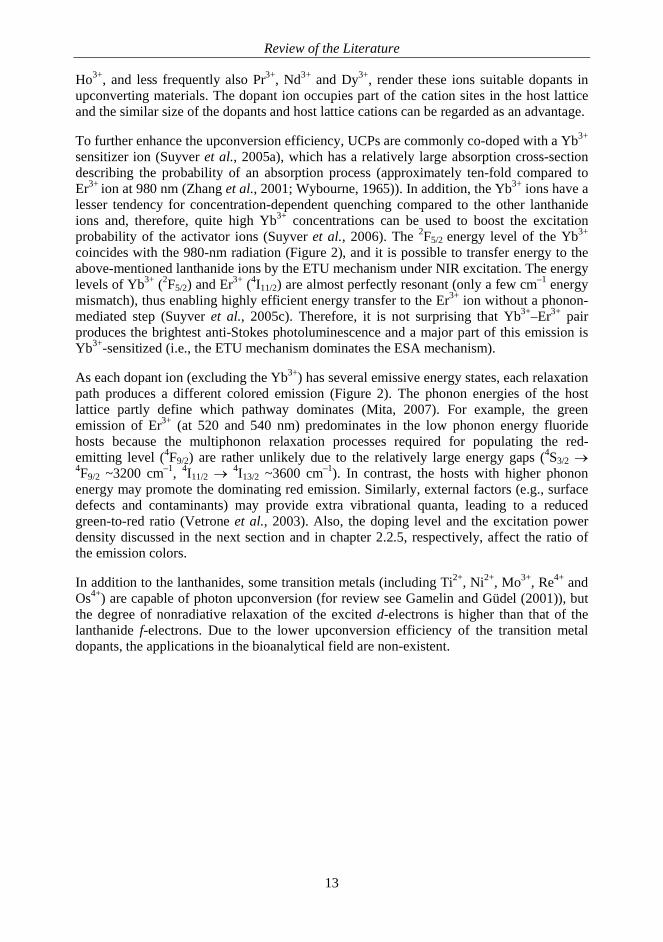
To further enhance the upconversion efficiency, UCPs are commonly co-doped with a Yb3+
sensitizer ion (Suyver et al., 2005a), which has a relatively large absorption cross-sectiondescribing the probability of an absorption process (approximately ten-fold compared toEr3+ ion at 980 nm (Zhang et al., 2001; Wybourne, 1965)). In addition, the Yb3+ ions have alesser tendency for concentration-dependent quenching compared to the other lanthanideions and, therefore, quite high Yb3+ concentrations can be used to boost the excitationprobability of the activator ions (Suyver et al., 2006). The 2F5/2 energy level of the Yb3+
coincides with the 980-nm radiation (Figure 2), and it is possible to transfer energy to theabove-mentioned lanthanide ions by the ETU mechanism under NIR excitation. The energylevels of Yb3+ (2F5/2) and Er3+ (4I11/2) are almost perfectly resonant (only a few cm–1 energymismatch), thus enabling highly efficient energy transfer to the Er3+ ion without a phonon-mediated step (Suyver et al., 2005c). Therefore, it is not surprising that Yb3+–Er3+ pairproduces the brightest anti-Stokes photoluminescence and a major part of this emission isYb3+-sensitized (i.e., the ETU mechanism dominates the ESA mechanism).
As each dopant ion (excluding the Yb3+) has several emissive energy states, each relaxationpath produces a different colored emission (Figure 2). The phonon energies of the hostlattice partly define which pathway dominates (Mita, 2007). For example, the greenemission of Er3+ (at 520 and 540 nm) predominates in the low phonon energy fluoridehosts because the multiphonon relaxation processes required for populating the red-emitting level (4F9/2) are rather unlikely due to the relatively large energy gaps (4S3/24F9/2 ~3200 cm–1, 4I11/2
4I13/2 ~3600 cm–1). In contrast, the hosts with higher phononenergy may promote the dominating red emission. Similarly, external factors (e.g., surfacedefects and contaminants) may provide extra vibrational quanta, leading to a reducedgreen-to-red ratio (Vetrone et al., 2003). Also, the doping level and the excitation powerdensity discussed in the next section and in chapter 2.2.5, respectively, affect the ratio ofthe emission colors.
In addition to the lanthanides, some transition metals (including Ti2+, Ni2+, Mo3+, Re4+ andOs4+) are capable of photon upconversion (for review see Gamelin and Güdel (2001)), butthe degree of nonradiative relaxation of the excited d-electrons is higher than that of thelanthanide f-electrons. Due to the lower upconversion efficiency of the transition metaldopants, the applications in the bioanalytical field are non-existent.
Review of the Literature
14
b)a)
c)
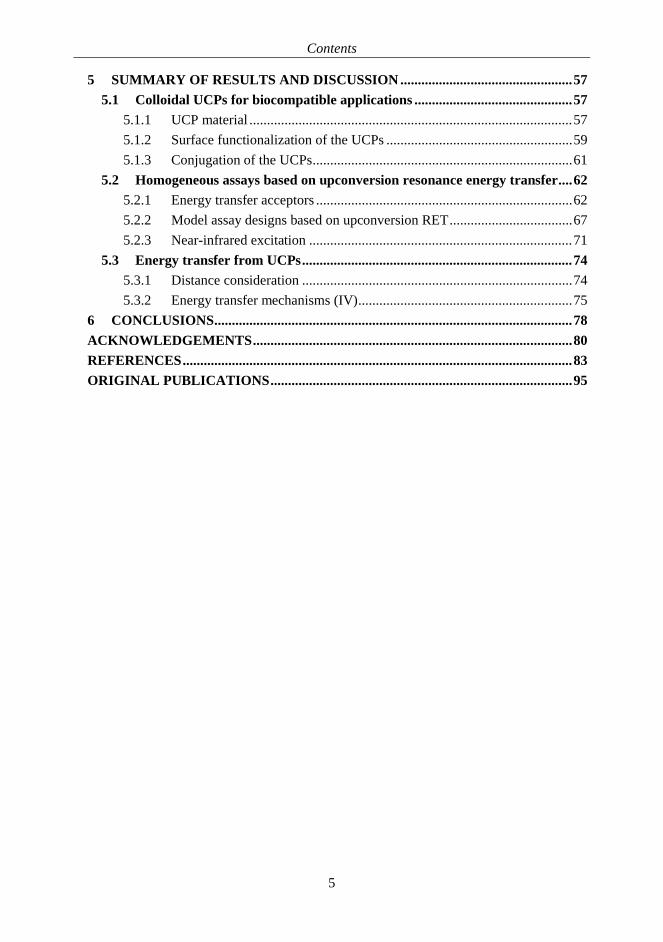
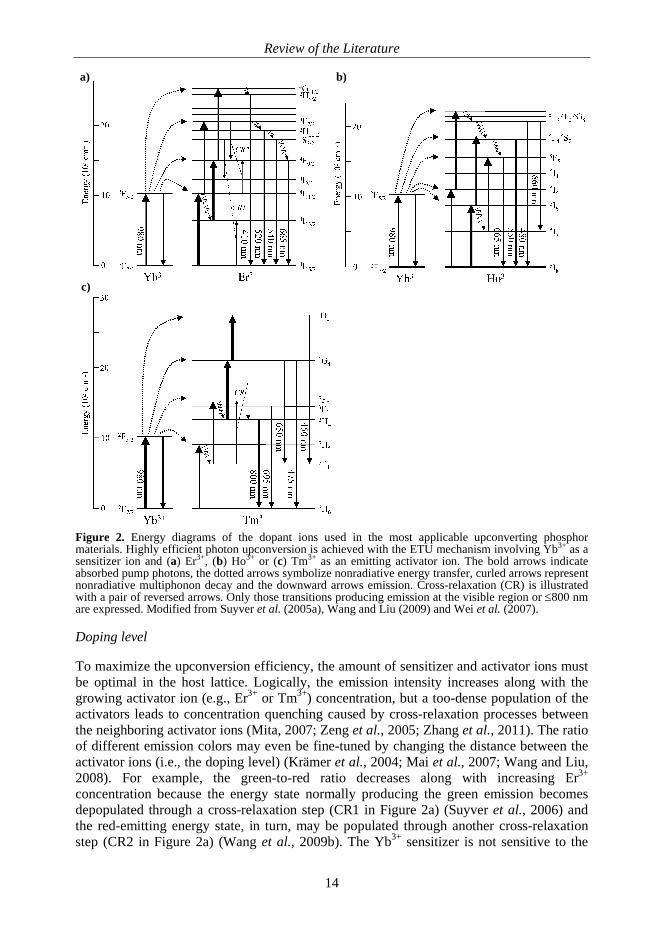
Figure 2. Energy diagrams of the dopant ions used in the most applicable upconverting phosphormaterials. Highly efficient photon upconversion is achieved with the ETU mechanism involving Yb3+ as asensitizer ion and (a) Er3+, (b) Ho3+ or (c) Tm3+ as an emitting activator ion. The bold arrows indicateabsorbed pump photons, the dotted arrows symbolize nonradiative energy transfer, curled arrows representnonradiative multiphonon decay and the downward arrows emission. Cross-relaxation (CR) is illustratedwith a pair of reversed arrows. Only those transitions producing emission at the visible region or 800 nmare expressed. Modified from Suyver et al. (2005a), Wang and Liu (2009) and Wei et al. (2007).
Doping level
To maximize the upconversion efficiency, the amount of sensitizer and activator ions mustbe optimal in the host lattice. Logically, the emission intensity increases along with thegrowing activator ion (e.g., Er3+ or Tm3+) concentration, but a too-dense population of theactivators leads to concentration quenching caused by cross-relaxation processes betweenthe neighboring activator ions (Mita, 2007; Zeng et al., 2005; Zhang et al., 2011). The ratioof different emission colors may even be fine-tuned by changing the distance between theactivator ions (i.e., the doping level) (Krämer et al., 2004; Mai et al., 2007; Wang and Liu,2008). For example, the green-to-red ratio decreases along with increasing Er3+
concentration because the energy state normally producing the green emission becomesdepopulated through a cross-relaxation step (CR1 in Figure 2a) (Suyver et al., 2006) andthe red-emitting energy state, in turn, may be populated through another cross-relaxationstep (CR2 in Figure 2a) (Wang et al., 2009b). The Yb3+ sensitizer is not sensitive to the
Review of the Literature
15
concentration quenching as mentioned earlier; therefore, the concentration may bemultifold compared to the activator ion. In the optimal case, the activator ions should besurrounded by as many Yb3+ neighbors as possible to enable an efficient ETU process(Zhang et al., 2001; Lu et al., 2010; Chen et al., 2010b). However, the dopant ions must bediluted with a sufficient number of “inactive” ions (such as Y3+ or La3+ in the host material)to limit the energy migration from the activator ions to killer traps, which cause quenchingof the desired luminescence (Zeng et al., 2005; Krämer et al., 2004). In addition, extremelyhigh Yb3+ concentrations promote energy back-transfer from the activator ions to the Yb3+.The back-transfer results in a suppressed population of certain emitting energy levels of theactivator and may, therefore, also be utilized in fine-tuning the emission color of a UCP(Wang and Liu, 2008; Liang et al., 2004).
To summarize, the molar percentages of rare earth dopants are in the range of 5–30%(generally 18% or 25%) for Yb3+ in combination with either 1–3% (generally 2%) Er3+ or0.1–0.6% (generally 0.3%) Tm3+ or Ho3+ (Zarling et al., 1994; Liang et al., 2004).
2.2.2 Recent development trends in upconverting materials
Phase-purity of NaYF4-based UCPs
The most efficient upconverting materials known today are hexagonal ( -phase)NaYF4:Yb3+,Er3+ and NaYF4:Yb3+,Tm3+ (Suyver et al., 2006; Krämer et al., 2004; Liang etal., 2004; Aebischer et al., 2006). The crystallographic phase is absolutely essential as thecubic ( -phase) structure produces approximately an order of magnitude less anti-Stokesphotoluminescence than the hexagonal one (Krämer et al., 2004; Yi and Chow, 2007;Hyppänen et al., 2009; Schäfer et al., 2009). Harju et al. (2011) anticipated that there are atleast two reasons causing the differences between the - and -phases. The more denselypacked -phase allows more efficient energy transfer between the lanthanide ions, and theclose-to-stoichiometric structure of the -phase contains fewer defects than the -phase,which needs additional F– ions to balance the charge of the enriched rare earth ions. Muchresearch has lately been carried out to identify controlled ways to produce phase-purehexagonal NaYF4:Yb3+,Er3+/Tm3+, and constantly diminishing attention has been addressedto the other UCP materials intended for bioanalytical applications. Despite expandedknowledge of UCPs, it remains unclear why this particular fluoride host material is sosuperior compared to others. The extraordinary low phonon energies naturally play animportant role (Suyver et al., 2006), but further research is required to clarify thephenomenon in detail.
Factors affecting the upconversion efficiency and phase-purity of the fluorides include thedopant concentrations, the ratio of sodium to rare earth ions, the impurities, the crystalgrowth temperature and time (Suyver et al., 2005a; Krämer et al., 2004; Liang et al., 2011;Li and Lin, 2010). Phase transitions follow the temperature, so at low synthesistemperatures the -phase is formed while higher temperatures favor -phase formationuntil certain point where the -phase begins to predominate again (Krämer et al., 2004;Hyppänen et al., 2009; Yi et al., 2004; Mathews et al., 2004). The exact transitiontemperatures depend on the UCP synthesis method.
Upconverting NaYF4:Yb3+,Er3+ bulk material was first introduced in the 1970s (Menyuk etal., 1972; Kano et al., 1972; Sommerdijk, 1973; Bril et al., 1975). The hexagonal phaseusually dominates in bulk materials (Yi and Chow, 2006), but it must be taken into account
Review of the Literature
16
while examining the literature that some studies of the NaYF4-based materials may havesuffered from impure structure in terms of the crystallographic phase. UCP bulk material isapplicable to areas such as NIR sensors, lasers and displays, but is unsuitable forapplications in the bioanalytical field due to its large size, which impedes colloidaldispersions. Krämer et al. (2004) succeeded in optimizing the reproducible solid-statesynthesis of micrometer-sized -phase NaYF4 powders. However, in order to reduce thelight scattering in UCP suspensions, the trend has more recently been towards nano-sizedUCPs with a uniform size and shape. As a consequence, other parameters in addition to thecrystallographic phase need to be simultaneously controlled.
Down to nano-sized UCP particles
Variables affecting the crystal size during the synthesis step comprise the concentration ofthe metal precursors, the nature of the solvent, the reaction time and the temperature (Wanget al., 2010). When the physical dimensions of the UCP particle are reduced to the nano-scale (<50 nm), different kinds of problems causing decreased upconversion efficiency areencountered (Wang and Liu, 2009). First, as the surface area-to-volume ratio increases, arelatively larger proportion of the emitting ions are situated close to the surface, exposed toquenchers and surface defects. Second, high surface tension triggers the phasetransformation from hexagonal to less efficient cubic form (Wang et al., 2010).
Several shielding options have been proposed to protect the near-surface dopant ions fromnonradiative relaxation processes induced by the surrounding high-energy vibrationaloscillators such as the OH- and CH-groups of organic ligands and solvents (Suyver et al.,2005a; Heer et al., 2004). The quantum yield of nanocrystalline UCPs has been increasedmultifold by growing an inert, undoped NaYF4 shell (with a thickness of a few nanometers)around an Yb3+–Er3+-doped NaYF4 core (Yi and Chow, 2007; Boyer and van Veggel,2010). The addition of an inorganic shell also lengthens the decay time constant and affectsthe green-to-red emission intensity ratio (Wang et al., 2009b). Dominating red emissionfrom NaYF4:Yb3+,Er3+ nanocrystals is a clear indication of nearby oscillators as the red-emitting energy level (4F9/2) is not efficiently populated without assistance of high-energyphonons (Bogdan et al., 2011). An inorganic shell provides better protection for the near-surface dopants than organic shells as possible interactions between UCPs and organicmolecules may still cause quenching (Yi and Chow, 2007). However, an organic coatinghas other advantages related to direct biofunctionalization discussed in chapter 2.3.1.
To promote the hexagonal phase in nano-sized UCPs, different synthesis methods havebeen developed (see next section), and also doping with Gd3+ ions has been suggested tofavor the desired phase. Wang et al. (2010) studied systematically how the addition of lightlanthanides with a large ionic radii affects the physical and photophysical properties ofNaYF4:Yb3+,Er3+/Tm3+. Partial substitution of Y3+ ions with larger Gd3+ (molar percentage30%) leads to expansion in unit-cell volume, and no traces of -phase were observed eventhough a lower synthesis temperature (200 C instead of 300 C) was used. Based on thecalculations, it was stated that NaGdF4 is energetically more stable than NaYF4 in -phase.The particle size of Gd3+-doped UCPs was decreased (from 25 nm to 10 nm) due to aslowed crystal growth rate, which was explained by an increased electron charge density.Phase transition to the -phase increased the upconversion efficiency, but the reduction inparticle size had the opposite effect. Gd3+ itself is not involved in the upconversion processas the lowest excited state lies in the UV region and is therefore out of reach. In brief, the
Review of the Literature
17
Gd3+ doping solved one problem but another complication led to an outcome similar to theinitial state with reduced luminescence intensity.
The nano-sized UCPs have not generally been available, but research groups have mainlybeen synthesizing the nanocrystals themselves or have acquired them throughcollaboration. Commercial activities have started lately, and, for example, IntelligentMaterial Solutions Inc. (Princeton, NJ, USA) provides custom-made nano-sized UCPs. Thesize category smaller than nanoparticles is unlikely. There seems to be a minimum particlesize capable of supporting efficient upconversion luminescence. Boyer and van Veggel(2010) observed a 95% decrease in quantum yield when the particle size was reduced from30 nm to 10 nm. Apparently, it is impossible to produce upconverting lanthanide-comprising organic ligand complexes that generate anti-Stokes photoluminescence with thesame efficient mechanisms as the inorganic UCPs. It is likely that the high-energy C–H andC–C vibrational oscillations of the organic ligands would effectively quench theluminescence of nearby lanthanide ions (Reinhard and Güdel, 2002). Xiao et al. (2005)prepared lanthanide chelates producing anti-Stokes photoluminescence in aqueous solution,but the power densities required for excitation were enormous compared to those used withinorganic UCPs.
From solid-state synthesis to solution-phase methods
The UCP synthesis (for bioanalytical applications) aims at the following characteristics:monodisperse, well-shaped, water-dispersible and phase-pure nanocrystals with a uniformsize (preferably <50 nm) and high luminescence yield. The nano-sized UCPs have beensynthesized using several methods, from which the most commonly used processes are co-precipitation, thermal decomposition, crystallization in high-boiling-point organic solvent,hydro- and solvothermal methods (for review see Wang and Liu (2009) or Li and Lin(2010)).
The co-precipitation method involves a particle growth step in aqueous environment (atroom temperature) followed by precipitation of the precursor material and finally anannealing step in which the lattice structure of the dried UCP material is rearranged underhigh temperature (typically ~400 C) to reduce the number of lattice defects (Wei et al.,2007; Yi et al., 2004). Unfortunately, the resulting particles sinter together in the final step,which is crucial for activating the optical properties of the UCP material (Wei et al., 2007).Smaller-sized material was pursued by milling and crushing (Zarling et al., 1994), butfractured crystalline lattice structure results in decreased emission intensity. Kuningas et al.(2005c) reported that the ground UCP material ( 200–400 nm) produced a considerablylower luminescence intensity (only 15%) than an equal mass of the original micrometer-sized bulk material, although there were several issues of uncertainty (e.g., sedimentationof large particles during the measurement and contaminating non-fluorescent material fromthe grinding balls). A synthesis procedure directly leading to non-sintered UCPs wasdeveloped and patented by Sanjuro et al. (2000). The fluidized-bed process maintained theparticle size and the monodispersity of the precursor material as the particles were kept inconstant movement relative to one another by utilizing either inert or reactive gases (Li etal., 2002).
The following synthetic routes do not include a post-annealing step at all as the growth ofthe crystals already takes place at elevated temperature. Metal trifluoroacetates thermally
Review of the Literature
18
decompose to give the corresponding metal fluorides at relatively low temperatures(~300°C). The thermal decomposition method in ambient pressure utilizes high-boilingorganic solvents (e.g., 1-octadecene, oleylamine) in combination with organic additivescontaining polar capping groups and long hydrocarbon chains (e.g., oleic acid, oleylamine)(Yi and Chow, 2006; Mai et al., 2006; Boyer et al., 2006; Boyer et al., 2007; Ye et al.,2010; Cheng et al., 2011). The precursors are toxic, and the experimental conditions arevery rigorous as they demand a water- and oxygen-free environment protected with an inertgas. However, the quality of the resulting UCP crystals is excellent. Similar reactionconditions have also been exploited to crystallize other precursors than trifluoroacetates(e.g., rare earth chlorides) in high-boiling organic solvents (Liang et al., 2011; Wang et al.,2010; Heer et al., 2004; Rufaihah and Zhang, 2008), but no generic name for this route hasbeen established.
Even lower reaction temperatures (<250 C) are used in hydro- and solvothermal synthesis.Elevated pressure combined with the heat is exploited to alleviate the crystallization ofprecursor components (typically containing rare earth chlorides or nitrates) either inaqueous environment (hydrothermal route (Zhang et al., 2009b; Ma et al., 2009; Kumarand Zhang, 2009) or in organic solvent (e.g., alcohol; solvothermal route (Wang and Liu,2008; Vetrone et al., 2010a)) supplemented with organic additives (e.g., oleic acid,ethylenediaminetetraacetic acid (EDTA), cetyltrimethylammonium bromide (CTAB) orsodium citrate). The reaction conditions are easily controllable, the yields are high, and thecosts are lower than those of thermal decomposition method. However, the reaction timesare long (up to days) and due to the high pressure, a specialized Teflon-lined reactionvessel (i.e., an autoclave) is required.
Additives in the synthesis reactions are essential to control the morphology and especiallythe size of the UCPs. A chelating agent, EDTA, is known to reduce the particle size. It isanticipated that the controlled release of rare earth cations from the EDTA complex helpsto separate the nucleation and the growth stages (Zeng et al., 2005), which is the primaryrequisite for the formation of uniform particles according to the LaMer model (LaMer andDinegar, 1950). In addition, the prepared nanoparticles are capped with EDTA on thesurface, which prevents further aggregation (Zeng et al., 2005). However, EDTA seems tosuppress the phase transition of NaYF4 material from - to -phase, and a higher reactiontemperature is required in presence of EDTA (Wei et al., 2007; Yi et al., 2004). As aconsequence, it may be difficult to produce phase-pure -NaYF4 materials in presence ofEDTA. Similarly, oleic acid has been used to stabilize the nanoparticles, but the resultingUCPs are dispersible only to non-polar solvents and manipulation of the surface chemistryis required to realize a transformation to a hydrophilic form (Li and Lin, 2010). Othercapping ligands include, for example, polyethyleneimine (PEI) (Wang and Liu, 2008),which directly functionalizes the surface with amine groups, and a water-solublepolyvinylpyrrolidone (PVP) (Li and Zhang, 2006). The addition of a cationic surfactant,CTAB, promotes formation of rod-shaped UCPs (Zeng et al., 2005), but this morphologyhas less use in bioanalytical applications than spherical monodispersed crystals.
The first nano-sized UCPs (phosphate host lattice) prepared by the solvothermal method(Haase et al., 2002) were published in 2003 (Lehmann et al., 2003; Heer et al., 2003), andtwo years later NaYF4 nanocrystals with purely hexagonal crystallographic phase werereported (Zeng et al., 2005; Wang et al., 2005). In future, the development of UCPsynthesis may be directed towards low-cost and low-temperature pathways, and methods
Review of the Literature
19
avoiding toxic organic solvents (Li and Lin, 2010). Safety concerns are also related toexcessive fluoride reagents having low decomposition temperatures, thus possibly resultingin the production of HF gas and fluorinated species at elevated temperatures (Li et al.,2008). The reproducibility and scale-up of UCP nanocrystal synthesis are limited bysensitive kinetics related to solution-phase synthesis methods (Chan et al., 2010). Variationin synthesis may be caused due to alteration in heating and cooling rates, side reactions andthe presence of impurities. Operations difficult to control (such as the rapid injection ofprecursors) hinder the scale-up attempts and automated systems with precisely controlledreaction parameters might be an attractive choice in future. Chan et al. (2010) have alreadytaken the first step by introducing an automated platform for inorganic nanoparticlesynthesis.
2.2.3 Upconversion efficiency
Controversial upconversion efficiencies have been reported for micrometer-sized bulkmaterials, and it is impossible to estimate if the discrepancy is caused by the differences inexcitation power density, crystallographic phase or some other reason. These parametersare not always reported at all, and the present study conditions differ from those availablein the 1970s. The modern powerful laser diodes enable excitation power densities leadingto the saturation of the anti-Stokes photoluminescence, and the progress in the UCPsynthesis methods has probably increased the phase-purity of the studied samples. Somesources claim that the upconversion efficiency value for Yb3+–Er3+ doped NaYF4 ismaximally 3–6% (Bril et al., 1975; Boyer and van Veggel, 2010; Page et al., 1998), whileSuyver et al. (2005a) reported values up to 50% for a phase-pure hexagonal material. Foranother dopant ion pair, Yb3+–Tm3+, the studies have been more congruent, stating that 1–2% of the absorbed NIR photons were upconverted and emitted at visible wavelengths nomatter whether phase-purity was confirmed or not (Suyver et al., 2005a; Page et al., 1998).The Tm3+-doped material involves a higher order process (3 or 4 absorbed photons)compared to the 2-photon system characteristic to the Er3+-doped material, which explainsthe lower efficiency. However, the infrared emission of Tm3+ at 800 nm (2 absorbedphotons) has an efficiency of 35% in purely hexagonal material according to Suyver et al.(2005a). This NIR-to-NIR upconversion might open up additional applications for theTm3+-doped UCPs in future (e.g., high contrast imaging or deep tissue imaging (Nyk et al.,2008) and diffuse optical tomography (Xu et al., 2009)). The upconversion efficiency ofother activator ions has not been extensively studied.
2.2.4 Advantages as bioanalytical labels
Excitation with near-infrared radiation
NIR excitation provides a basis for several advantageous features that make the UCPs suchinteresting labels for bioanalytical applications. The main merit of the UCP-based assaytechnology is the absence of autofluorescence at visible wavelengths, which commonlydeteriorates the detection limits of assays involving biological components. Theautofluorescence originates from endogenous fluorophores of biological material and isobserved at wavelengths longer than the excitation radiation, just like the fluorescence ofdownconverting labels utilized in the bioanalytical tests. However, under NIR excitationthe possible autofluorescence is observed at the NIR region several hundred nanometersaway from the visible wavelengths where the emission of UCPs is collected (anti-Stokes’shift up to 500 nm). This advantage enables, at least in theory, more sensitive bioanalytical
Review of the Literature
20
assays as the background fluorescence can be minimized. Another way to eliminate theautofluorescence is to use a pulsed excitation source and time-gated measurement incombination with labels having a long emission lifetime (Siitari et al., 1983; Siitari et al.,1983; Hemmilä et al., 1984). However, time-resolution requires more sophisticatedinstrumentation than the technology based on photon upconversion, which relies onspectral separation of the autofluorescence.
UV radiation is recognized as harmful for several different reasons in bioanalytical assays,but is commonly used for exciting the conventional downconverting labels, while thelower-energy NIR excitation would be a convenient substitute. The absorption band ofYb3+ at 980 nm lies on the wavelength region of 600–1200 nm, where tissues have thelowest absorption (originating mainly from water, blood and pigments) (Waynant et al.,2001; Simpson et al., 1998). The penetration depth of NIR excitation in biological tissue ismuch greater compared to the highly absorptive UV region. In addition, NIR radiation doesnot cause damage to the biological specimen. This issue is more prominent in applicationsinvolving long illumination times (e.g., imaging). Straightforward reading of theluminescence intensity (e.g., from a reaction vessel) is usually a quite rapid one-time event,and the damage is negligible. Not only the specimen but also the label itself may be harmedby the high-energy UV radiation causing photodegradation, especially to organicfluorophores (Gaigalas et al., 2007; Eggeling et al., 1998). The NIR-excitable inorganicUCPs show extremely high photochemical stability in repeated excitation cycles (Krämeret al., 2004; Ukonaho et al., 2007), although some diverging data has also been published.An inexplicable photobleaching that takes place during the first minute of continuousexcitation was reported by Morgan and Mitchell (2007), but an external cause such as atemperature change (Vetrone et al., 2010b) might be more probable than actualphotobleaching of the UCP emission. As high excitation intensities may be utilized withoutphotodegradation of the UCPs, high signal levels are expected even from a relatively smallnumber of UCPs. Weak emission can be collected and integrated over a longer time periodunder continuous excitation (Zarling et al., 1994).
If energy transfer from one fluorophore to another is exploited (e.g., in proximity-basedbioanalytical assays), the excitation should be perfectly selective to avoid direct excitationof the acceptor fluorophores. Exceptionally, NIR radiation allows exclusive excitation ofthe UCP donor, and background fluorescence originating from the acceptor is eliminated.
Photophysical properties of lanthanides
Highly structured emission is characteristic to lanthanides (Cotton, 2006), which in practicemeans that between the sharp emission bands (bandwidths ~20–50 nm) there is nodetectable emission at all. Those wavelengths can be exploited to accurately measure theemission of other fluorescent labels without spectral contamination, which is important inapplications concerning energy transfer to another fluorophore or in multiplexed assayswith several fluorophores involved. Conventional organic fluorophores have much widerexcitation and emission bands, which results in unwanted spectral overlap and unselectivedetection in systems comprising more than one such fluorophore.
UCPs with different compositions each produce different emissions (blue, green, red orNIR), and this enables detection of at least two targets or analytes simultaneously based ondiscriminating emission colors (Corstjens et al., 2005). One excitation source is compatible
Review of the Literature
21
with all these materials as the Yb3+ ion acts as a sensitizer in all UCP materials favoredpresently. Similarly, quantum dots producing multiple emission colors depending on theirdiameter are well-known for their wide excitation band at the UV region, which suitsperfectly multiplexed assays requiring only one excitation source (Hu et al., 2010; Peng etal., 2009). However, the UV excitation has certain drawbacks, discussed above.
Lanthanide chelates and cryptates have been utilized in the time-resolved fluorometryexploiting the long excited state lifetimes of lanthanides (Soini and Kojola, 1983; Bazin etal., 2002; Selvin, 2002; Eliseeva and Bünzli, 2010). The UCPs based on lanthanide dopantsshare this feature (Sun et al., 2009a; Bednarkiewicz et al., 2010), but no applications basedon the time-gated measurement has been published. There is no practical motivation tocomplicate the collection of the emission by waiting until the short-lived endogenousfluorescence has faded because all autofluorescence is already eliminated due to the photonupconversion.
Several emitting centers are incorporated into each UCP particle leading to high specificactivity. In combination with all above-mentioned advantageous characteristics reducingthe background fluorescence, this feature results in the high signal-to-background ratiosappreciated in ultrasensitive bioanalytical assays.
2.2.5 Challenges in bioanalytical applications
The UCPs are inorganic hydrophobic crystals originally bearing no functional groups at all.Surface modification is used to transform the particles into a more hydrophilic form and tointroduce useful functional groups on the surface. Production of a stable, reproduciblecoating with a desired thickness is quite challenging as such, but also the agglomeration ofUCP particles during (or due to) the modification procedure must be avoided. Varioussolutions for surface modification are discussed in the next chapter.
The findings presented in the literature are not directly comparable because the spectralproperties of the UCPs (e.g., the ratio between the emission colors (Suyver et al., 2005c;Wang et al., 2009b)) depend on the excitation power density. The green emission ofNaYF4:Yb3+,Er3+ predominates at low power density occasions, while the intensity of thered emission increases more rapidly along with the power density followed by theemergence of a violet emission (Suyver et al., 2005c; Morgan and Mitchell, 2007; Morganand Mitchell, 2006). Suyver et al. (2005c) showed that population of the 4I13/2 energy statebecomes a two-photon process (possibly through a cross-relaxation CR1 in Figure 2) athigh excitation power, while it otherwise is populated through a multiphonon relaxationfrom the state 4I11/2 (one-photon process). Increased population of 4I13/2 further enhances thepopulation of the red-emitting state. The power density used is seldom reported in researchpapers. The power of the excitation source is easily available, but no straightforwardstandard method for determining the cross-section of the laser beam reaching the UCPs hasbeen presented, and the situation remains unsolved. In addition, the results from the sameset-up are not completely comparable in all cases. An increase in the sample turbidity maylead to an increased scattering of the excitation radiation. A broadened excitation arearesults in a lower power density and, thus, may bias the result. For example, the volume ofblood cells (i.e., hematocrit) in a sample varies between patients (Zeng et al., 2001),resulting in dissimilar scattering properties and unequal power densities. However,significant problems are not expected due to the scattering as the effects are mostlymarginal.
Review of the Literature
22
Heterogeneous composition of the UCPs resulting in non-uniform spectroscopic propertiesmay produce anomalous results in bioanalytical tests. Morgan and Mitchell (2008) foundthat one particular commercial UCP bulk material contained differing UCP particles, fromwhich part produced a dominantly red emission while the others were mainly emitting atgreen wavelengths.
2.3 Bioconjugates of UCPs
2.3.1 Surface functionalization
After the surface modification step, UCPs are conjugated with vulnerable biomolecules,which tend to lose their functionality and three-dimensional structure at extremeconditions. Therefore, UCPs must be compatible with a water-based environment having apH close to the physiological value (pH 7.4). A hydrophilic coating with uniformfunctional groups is preferred.
The modification step itself or the final result must not induce agglomeration of theindividual UCP particles. Repulsion between the UCPs may be evoked by introducingeither negatively or positively charged groups favoring the even distribution of the separateparticles. The coating should be sufficiently transparent at excitation and emissionwavelengths and stable in storage and assay conditions. The thickness of the coating layerbecomes extremely relevant in the applications based on resonance energy transfer fromthe UCP donors to acceptor molecules, and a very thin monolayer is preferred in this case.
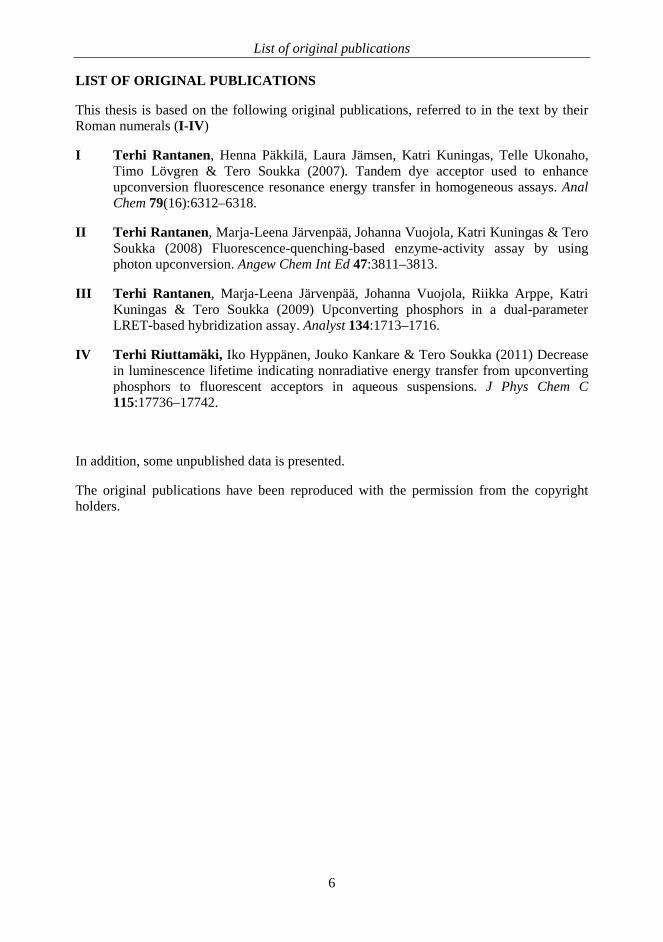
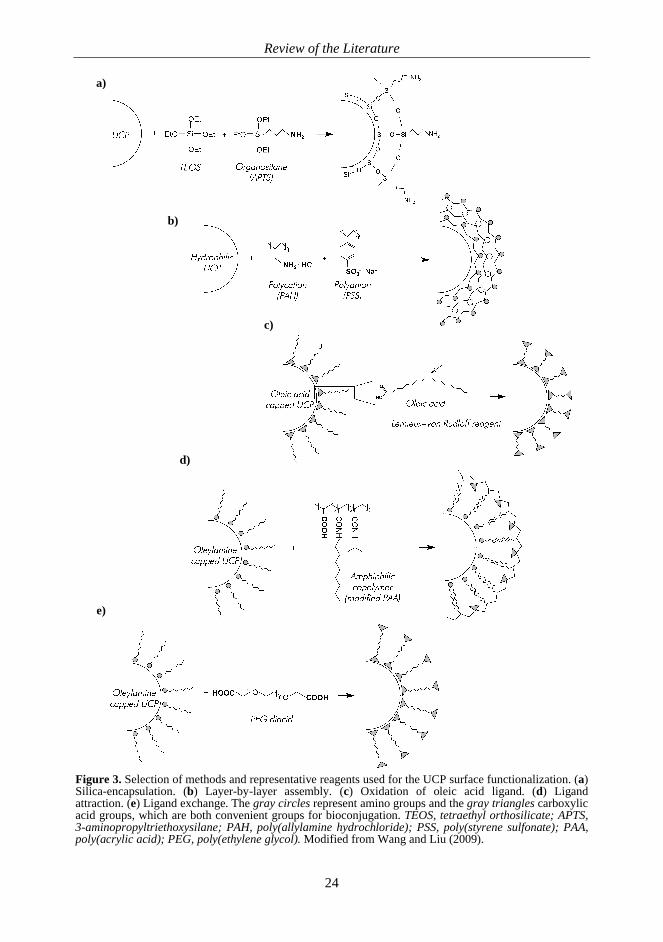
A universal route to functionalize an inorganic particle is to grow an amorphous silica shellaround the particles (Figure 3a) (Graf et al., 2003; Yi et al., 2005; Selvan et al., 2005;Darbandi et al., 2005). The chemistry of silica is well known, and the properties of silicaare very advantageous. It is nontoxic, chemically inert and optically transparent at visiblewavelengths. In addition, a silica layer increases the negative charge of the surface andtherefore enhances the dispersibility of particles in polar solvents. Hydrolysis reaction ofmonomeric tetraethyl orthosilicate (TEOS) followed by a condensation step generates ahydrophilic polymer that encloses UCPs while growing 3-dimensionally. The type offunctionalization (e.g., amino, thiol or carboxyl group) is easily tuned by adding anappropriate organosilane (e.g., 3-aminopropyltriethoxysilane (APTS), 3-mercaptopropyl-triethoxysilane or 11-dimethylchlorosilyl undecanoyl chloride) to copolymerize withTEOS. The polymerization reaction may be carried out in alcohol (modified Stöber method(Li et al., 2002; Stöber et al., 1968; Ohmori and Matijevic, 1992)) in the case of UCPsalready dispersible to polar solvents (Li and Zhang, 2006; Lu et al., 2004; Sivakumar et al.,2006; Kumar et al., 2009). Hydrophobic UCPs must be coated in reverse microemulsion(Rufaihah and Zhang, 2008; Li et al., 2008; Jiang and Zhang, 2010; Ylihärsilä et al., 2011).Either an acid or a base catalyst (usually ammonium hydroxide) can be chosen to acceleratethe reaction. The thickness of the silica shell can be adjusted from only few nanometers totens of nanometers (Ohmori and Matijevic, 1992). In the microemulsion route, the amountof surfactant plays an important role in determining the morphology of the formed silicashell. Other critical parameters are the reaction time, temperature, concentration of reagentsand the speed of stirring (Darbandi et al., 2005).
Hydrophilic UCPs may be coated with a multilayer film by consecutive adsorption ofpolyanions (e.g., poly(styrene sulfonate); PSS) and polycations (e.g., poly(allylaminehydrochloride); PAH) (Wang et al., 2005; Decher, 1997). The layer-by-layer (LbL)
Review of the Literature
23
assembly (Figure 3b) based on electrostatic attraction between the oppositely chargedpolymers is highly universal, allowing the use of large variety of polyelectrolytes. Thethickness of the coating is controlled by limiting the number of deposited layers (one layer~1.5 nm thick (Caruso et al., 1999)). Repeated washing steps in between the depositioncycles complicate the process, but technical solutions may alleviate this inconvenience.Alternatively, adsorption of poly(acrylic acid) (PAA) without any addition of polycationshas been exploited to introduce carboxylic acid groups on the UCP surface (Ukonaho et al.,2007; Kuningas et al., 2005a). In general, polymeric molecules build a more stable coatingcompared to small molecular weight monomers in adsorption-based methods as severalbonds are formed simultaneously.
If a capping additive was used during the UCP synthesis, these coordinated ligands may betransformed into a functionalized coating trough oxidation, ligand attraction or ligandexchange (Figure 3c–e). Oleic acid contains a double bond in the middle of the carbonchain that can be oxidized into two azelaic acid molecules with the Lemieux–von Rudloffreagent containing periodate and permanganate (Lemieux and von Rudloff, 1955). Theresulting particles are water dispersible and functionalized with carboxylic acid groups(Chen et al., 2008). In the case of some other hydrophobic ligand not bearing a suitabledouble bond to oxidize, the UCP may be converted into a hydrophilic form by adding anamphiphilic copolymer (e.g., modified PAA (Yi and Chow, 2007) or modifiedpolyethylene glycol (PEG) (Cheng et al., 2011)). The original capping ligand binds thepolymer by attracting their hydrophobic alkyl chains, and consequently the ligand ismasked while hydrophilic segments of the copolymer bearing the selected functionalgroups cover the outer surface. Alternatively, the capping ligand may be exchanged toanother one (e.g., to PEG diacid (Yi and Chow, 2006), dendrimer (Bogdan et al., 2010),hexanedioic acid (Zhang et al., 2009a) or PEG-phosphonate (Boyer et al., 2010)) thatcoordinates more tightly on the UCP surface and provides the desired properties.
The protective inorganic shells described in the context of the nanocrystalline UCPs (seechapter 2.2.2) are not suitable for the surface functionalization, because they do not containany functional groups. Even though several practical methods are used for surfacefunctionalization of inorganic crystals (including quantum dots, downconvertingphosphors, metallic and magnetic particles), controlled coating of colloids still remains atrue technical challenge. The monomer polymerization may encapsulate several particles ina single shell and reproducible control over the thickness is challenging. The coatingmethods relying on the adsorption of polymers or on the coordination of ligands may sufferfrom stability problems during storage or in variable environments as no irreversible bondis formed between the inorganic particle and the coating. For example, Bogdan et al.(2011) discovered that oleate ligand protonates around pH 4 resulting in the release of oleicacid from the surface.
Review of the Literature
24
b)
c)
d)
e)
a)
Figure 3. Selection of methods and representative reagents used for the UCP surface functionalization. (a)Silica-encapsulation. (b) Layer-by-layer assembly. (c) Oxidation of oleic acid ligand. (d) Ligandattraction. (e) Ligand exchange. The gray circles represent amino groups and the gray triangles carboxylicacid groups, which are both convenient groups for bioconjugation. TEOS, tetraethyl orthosilicate; APTS,3-aminopropyltriethoxysilane; PAH, poly(allylamine hydrochloride); PSS, poly(styrene sulfonate); PAA,poly(acrylic acid); PEG, poly(ethylene glycol). Modified from Wang and Liu (2009).
Review of the Literature
25
No dramatic changes in luminescence intensity have been reported due to the UCPfunctionalization. The absorption properties of coating molecules are assumed to benegligible as no conjugated systems are involved. The possible effects are more likelyrelated to the multiphonon decays of the near-surface emitting ions promoted by vibrationaloscillators (e.g., OH and CH groups). A slight decrease (around 20%) in the luminescenceintensity after silica-encapsulation has been discovered by a few groups (Yi et al., 2004; Liand Zhang, 2006; Li et al., 2008). Most of the studies involving ligand-capped UCPs havenot paid any attention to the effects of functionalization, and some papers (Yi and Chow,2006; Chen et al., 2008) have stated that there are no noticeable differences in theluminescence intensity.
2.3.2 Bioconjugation
The combination of an easily-detectable UCP and a biomolecule with highly specificbinding properties forms an excellent pair to be utilized in bioanalytical applications. Bothparties, the biomolecule and the UCP, must bear suitable functional groups that react witheach other, forming a covalent bond. Physical adsorption of biomolecules on the surface ofUCP may also be exploited, but the stability of the conjugate in assay and storageconditions cannot be assured, which renders the covalent bioconjugation a more favorablemethod. Commonly used chemistries involve carboxylic acid, amino and thiol groups(Hermanson, 2008), which can be found in natural biomolecules composed of amino acids.Abundance of these functional groups in biomolecules is considered as an advantage, but itbecomes a disadvantage if selective conjugation is targeted. Modifications including N-hydroxysuccinimide (NHS), maleimide and isothiocyanate groups can also be exploitedespecially as part of the non-biological party (e.g., UCPs or fluorophores). Anotherselective conjugation method known as click-chemistry involves Cu+-catalyzedcycloaddition of an azido group to a terminal alkyne group (Rostovtsev et al., 2002; Tornoeet al., 2002). Mader et al. (2010) recently introduced a simple one-step click-chemistryprotocol suitable for bioconjugation of the UCPs in an aqueous solution at roomtemperature.
The challenge in bioconjugation is to maintain the functionality of the biomolecule. Inaddition, the orientation of the attached molecule is critical to ensure the access to theanalyte recognition site. Favorable binding orientation affects the assay performancesignificantly (Zhang and Meyerhoff, 2006). After the conjugation step, the excessbiomolecules should be removed thoroughly without losing the UCP conjugates, and thesuccess of the bioconjugation needs to be confirmed.
2.4 Bioanalytical applications
The various bioanalytical applications utilizing UCP labels are here divided based on thetype of assay concept. The number of publications in this field has grown enormouslyduring the last five years, expressing the ample interest among the scientists. The criticalfeatures of bioanalytical assays include limit of detection (LOD) and limit of quantification(LOQ), selectivity (effects of interferents, such as structurally similar molecules), dynamicrange (the range from lowest to highest reliably measurable concentration), precision(reproducibility, repeatability) and accuracy (trueness of the measured concentration)(Davies, 2005; www.clinchem.org). Sometimes also other completely different properties,such as the time required for the final result, overall costs, portability of the analyzer orease of use, play an important role. Depending on the analyte, its clinically relevant levels
Review of the Literature
26
b)
a)
and the intended application, some characteristics of the test are more important thanothers, influencing the choice of the assay type.
Photodynamic therapy exploiting the UCPs is part of the biological sciences but isexcluded from this thesis, which is concentrating solely on the diagnostic applications.More borderline cases are the microscopy applications based on the UCP labels, becauseimaging may be regarded as a tool for pathology, drug delivery follow-up and so forth butis also used for diagnostic purposes. Although the UCPs are an extremely hot topic in thein vivo imaging field, it lies outside of the scope of this thesis.
2.4.1 Heterogeneous bioaffinity assays
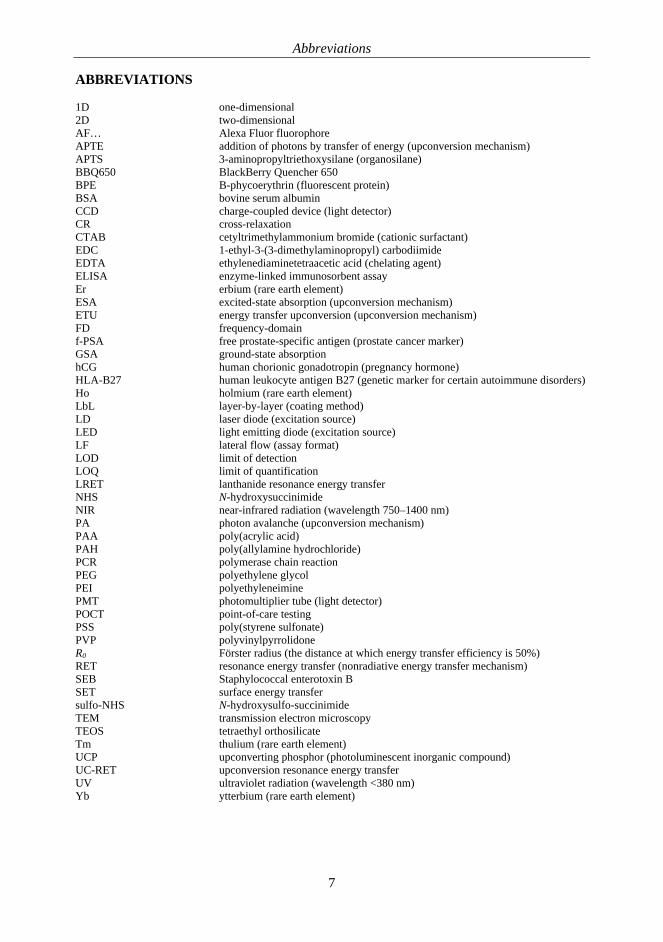
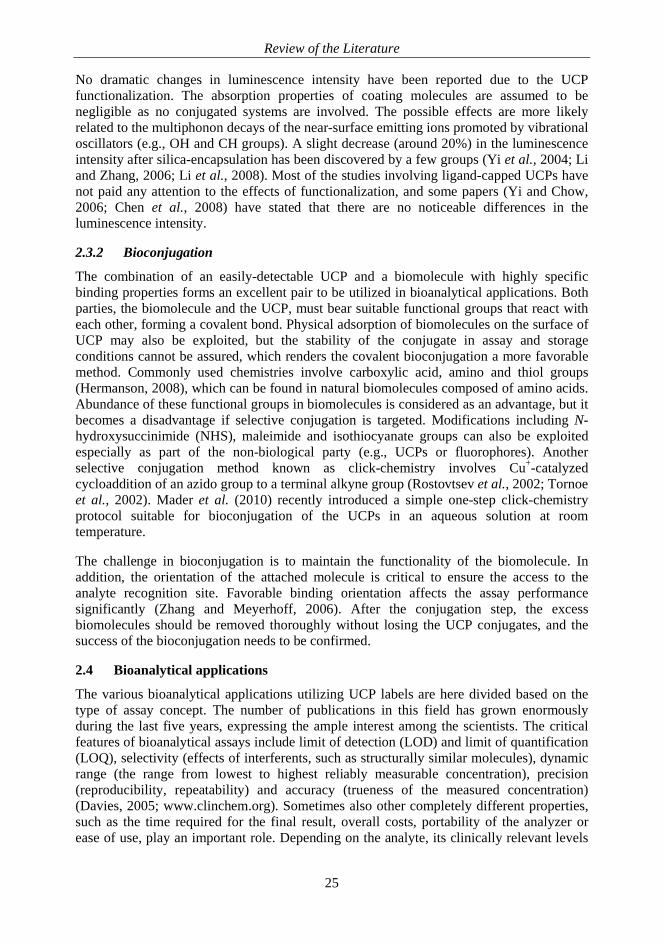
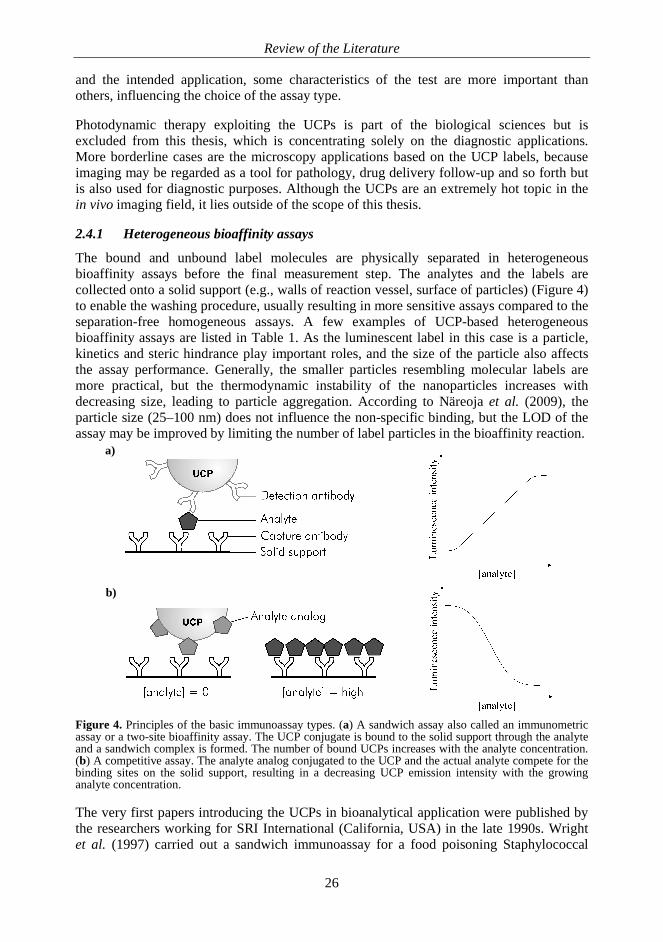
The bound and unbound label molecules are physically separated in heterogeneousbioaffinity assays before the final measurement step. The analytes and the labels arecollected onto a solid support (e.g., walls of reaction vessel, surface of particles) (Figure 4)to enable the washing procedure, usually resulting in more sensitive assays compared to theseparation-free homogeneous assays. A few examples of UCP-based heterogeneousbioaffinity assays are listed in Table 1. As the luminescent label in this case is a particle,kinetics and steric hindrance play important roles, and the size of the particle also affectsthe assay performance. Generally, the smaller particles resembling molecular labels aremore practical, but the thermodynamic instability of the nanoparticles increases withdecreasing size, leading to particle aggregation. According to Näreoja et al. (2009), theparticle size (25–100 nm) does not influence the non-specific binding, but the LOD of theassay may be improved by limiting the number of label particles in the bioaffinity reaction.
Figure 4. Principles of the basic immunoassay types. (a) A sandwich assay also called an immunometricassay or a two-site bioaffinity assay. The UCP conjugate is bound to the solid support through the analyteand a sandwich complex is formed. The number of bound UCPs increases with the analyte concentration.(b) A competitive assay. The analyte analog conjugated to the UCP and the actual analyte compete for thebinding sites on the solid support, resulting in a decreasing UCP emission intensity with the growinganalyte concentration.
The very first papers introducing the UCPs in bioanalytical application were published bythe researchers working for SRI International (California, USA) in the late 1990s. Wrightet al. (1997) carried out a sandwich immunoassay for a food poisoning Staphylococcal
Review of the Literature
27
enterotoxin B (SEB) both in a glass capillary providing miniature binding regions and onmagnetic glass beads. The washing steps in capillary were realized with a peristaltic pumpcreating a liquid flow. Magnetic beads, in turn, are easy to control with a magnetic field,which enabled repeated replacement of the surrounding liquid to remove the unboundcomponents. It was documented that the LOD of the SEB assay (35 fmol in capillary or180 fmol on beads) was limited only by the non-specific binding of the UCPs. A sandwichimmunoassay in a microtiter plate format has been reported for free prostate-specificantigen (f-PSA) (Ukonaho et al., 2007), which is widely used as a prostate cancer marker.The dynamic range of this relatively sensitive assay (LOD 20 fM for f-PSA) extended overthree orders of magnitude, after which there were no more UCP conjugates left to form thesandwich complexes. An increased number of UCPs in the reaction vessel would enabledetection of even greater concentrations of f-PSA, but the LOD would consequently becompromised due to increased non-specific binding of the label. A similar sandwich assayin dual-parametric format was constructed to recognize both IgM and IgG antibodiesagainst cytomegalovirus in order to differentiate the early and the secondary immuneresponse (Corstjens et al., 2005). Green-emitting Yb3+–Er3+ doped UCPs and blue-emittingYb3+–Tm3+ doped UCPs were utilized to discriminate between the two analytes in the samereaction. In addition to the protein analytes, single-stranded DNA has also been detected inthe femtomole range. Wollenberg et al. (1997) and Wang and Li (2006) have reportedsandwich hybridization assays utilizing magnetic beads as a solid support.
The features of the ground UCP bulk material (NaYF4:Yb3+,Er3+, 280 nm) inheterogeneous model assays carried out in standard microtiter wells were studied byKuningas et al. (2005a). The lowest detectable amount of these UCPs bound to a microtiterwell through a strong biotin–streptavidin interaction was determined to be 0.75 ng.Actually, the focused laser beam excited only less than 1% of the surface area of the welland probably only few picograms of UCPs were bound to that area, corresponding roughlyto tens of individual particles. According to this result, the UCPs should enable highlysensitive assays if non-specific binding is minimal. The luminescence intensity of theUCPs increased linearly over 4 orders of magnitude, demonstrating the high specificactivity of the UCP labels, which allows a wide dynamic range in heterogeneous assays. Areflective solid surface (white-colored microtiter well) appears to enhance the anti-Stokesphotoluminescence by about 100 times, from which only a 5-fold increase can be explainedby the reflections, while the basis of the phenomenon leading to the remaining 20-foldincrease remains unclear (Kuningas et al., 2005b). The effect was discovered both influoride and oxysulfide hosts doped with Yb3+–Er3+ pair and was even more pronounced atthe red emission wavelengths compared to the green ones. Unfortunately, the LOD (1.5fmol) of the model sandwich assay for biotinylated protein was not improved in whitewells compared to the transparent ones as the luminescence arising from the non-specifically bound UCPs was enhanced equally.
The major obstacle limiting the LOD of the heterogeneous assays is the non-specificbinding of the UCPs, which is a problem shared by particle labels collectively. The factthat the UCP technology avoids all the other sources of background luminescenceespecially highlights the importance of minimizing this problem.
Review of the Literature
28
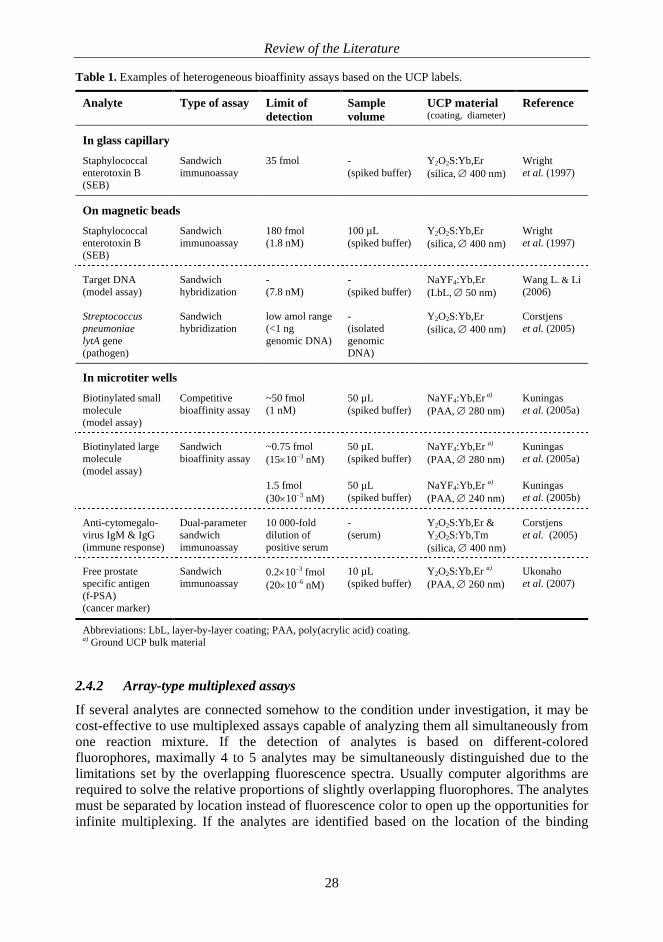
Table 1. Examples of heterogeneous bioaffinity assays based on the UCP labels.
Analyte Type of assay Limit ofdetection
Samplevolume
UCP material(coating, diameter)
Reference
In glass capillaryStaphylococcalenterotoxin B(SEB)
Sandwichimmunoassay
35 fmol -(spiked buffer)
Y2O2S:Yb,Er(silica, 400 nm)
Wrightet al. (1997)
On magnetic beadsStaphylococcalenterotoxin B(SEB)
Sandwichimmunoassay
180 fmol(1.8 nM)
100 µL(spiked buffer)
Y2O2S:Yb,Er(silica, 400 nm)
Wrightet al. (1997)
Target DNA(model assay)
Sandwichhybridization
-(7.8 nM)
-(spiked buffer)
NaYF4:Yb,Er(LbL, 50 nm)
Wang L. & Li(2006)
StreptococcuspneumoniaelytA gene(pathogen)
Sandwichhybridization
low amol range(<1 nggenomic DNA)
-(isolatedgenomicDNA)
Y2O2S:Yb,Er(silica, 400 nm)
Corstjenset al. (2005)
In microtiter wells
Biotinylated smallmolecule(model assay)
Competitivebioaffinity assay
~50 fmol(1 nM)
50 µL(spiked buffer)
NaYF4:Yb,Er a)
(PAA, 280 nm)Kuningaset al. (2005a)
Sandwichbioaffinity assay
~0.75 fmol(15 10–3 nM)
50 µL(spiked buffer)
NaYF4:Yb,Er a)
(PAA, 280 nm)Kuningaset al. (2005a)
Biotinylated largemolecule(model assay)
1.5 fmol(30 10–3 nM)
50 µL(spiked buffer)
NaYF4:Yb,Er a)
(PAA, 240 nm)Kuningaset al. (2005b)
Anti-cytomegalo-virus IgM & IgG(immune response)
Dual-parametersandwichimmunoassay
10 000-folddilution ofpositive serum
-(serum)
Y2O2S:Yb,Er &Y2O2S:Yb,Tm(silica, 400 nm)
Corstjenset al. (2005)
Free prostatespecific antigen(f-PSA)(cancer marker)
Sandwichimmunoassay
0.2 10–3 fmol(20 10–6 nM)
10 µL(spiked buffer)
Y2O2S:Yb,Er a)
(PAA, 260 nm)Ukonahoet al. (2007)
Abbreviations: LbL, layer-by-layer coating; PAA, poly(acrylic acid) coating.a) Ground UCP bulk material
2.4.2 Array-type multiplexed assays
If several analytes are connected somehow to the condition under investigation, it may becost-effective to use multiplexed assays capable of analyzing them all simultaneously fromone reaction mixture. If the detection of analytes is based on different-coloredfluorophores, maximally 4 to 5 analytes may be simultaneously distinguished due to thelimitations set by the overlapping fluorescence spectra. Usually computer algorithms arerequired to solve the relative proportions of slightly overlapping fluorophores. The analytesmust be separated by location instead of fluorescence color to open up the opportunities forinfinite multiplexing. If the analytes are identified based on the location of the binding
Review of the Literature
29
region at the array, all bound analytes can be visualized with the same fluorescent labelmolecule (e.g., UCP).
Both oligonucleotides and proteins have been spotted on glass slides and detected withUCP conjugates. The simplest test involved spotting of biotinylated immunoglobulins onthe slides and direct visualization of the spots (diameter 900 µm) with streptavidin-conjugated UCPs (NaYF4:Yb3+,Er3+ with magnetic core, 68 nm) (Lu et al., 2004). Amore practical nucleic acid microarray (spot diameter 150 µm) was constructed to measurethe expression levels of 24 housekeeping genes of bladder carcinoma cells (van de Rijke etal., 2001). UCPs were detected with a modified fluorescence microscope, which had aXenon lamp as an excitation source instead of more optimal laser diode. Nonetheless, thebright emission of UCPs (Y2O2S:Yb3+,Er3+, ~400 nm) allowed 4 times better LOD thanan organic cyanine dye Cy5, which is in common use in microarray applications.
The high-content capacity of microarrays has been transferred from glass slides tomicrotiter wells, which are widely used reaction vessels in high-throughput concepts.Ylihärsilä et al. (2011) demonstrated genotyping of ten common adenovirus genotypeswith an array-in-well platform and validated the assay successfully with clinical samples.Eleven selective probe spots (diameter 375 µm) in three replicas and positive controloligonucleotide spots were printed on the bottom of standard 96-well plates. ExtractedDNA was amplified using generic biotinylated primers, which allowed the detection of alladenovirus genotypes with streptavidin-conjugated UCPs (NaYF4:Yb3+,Er3+, 55 nm).Cross-hybridization of similar sequences creates a challenge when a large number ofprobes is combined in one array. Therefore, the identification of the genotype was based ona hybridization pattern rather than hybridization with only one type of probe. The UCPswere detected with a special imaging device, which is simpler and the acquisition costslower compared to a confocal microscope scanner.
The repetitive scanning and long-lasting imaging of microarrays expose the fluorescentlabels to the excitation radiation for an extended period of time and the stability of the labelbecomes relevant. The organic fluorophores tend to lose their fluorescent propertiesgradually under intense excitation. As the emitting ions of the UCPs are located in aprotective inorganic crystal lattice, no photodegradation is expected. In addition to theoutstanding photostability of the UCPs, the high emission intensity renders the UCPs anattractive label option for microarray applications. Now that nano-sized UCPs areavailable, the dynamic range in the compact binding region is less limited by the size ofUCPs and the diameter of the spots may be reduced to allow larger amounts of informationper certain area of solid support.
2.4.3 Lateral flow tests
Lateral flow (LF) tests, also known as immunochromatographic tests, are typically carriedout on nitrocellulose-based strips or other polymeric materials allowing capillary flow ofthe solution containing the sample and labels (Figure 5). The LF platform is attractive dueto its suitability for low-resource situations such as point-of-care and on-site testing. Thesimple home pregnancy test is a well-known example of a qualitative LF test providing avisual result evaluated with the naked eye. Colored particle labels (e.g., colloidal gold,latex beads) are used for applications utilizing visual readout. More sensitive and alsoquantitative results are obtained if an optical reader is used for detecting the label inquestion.
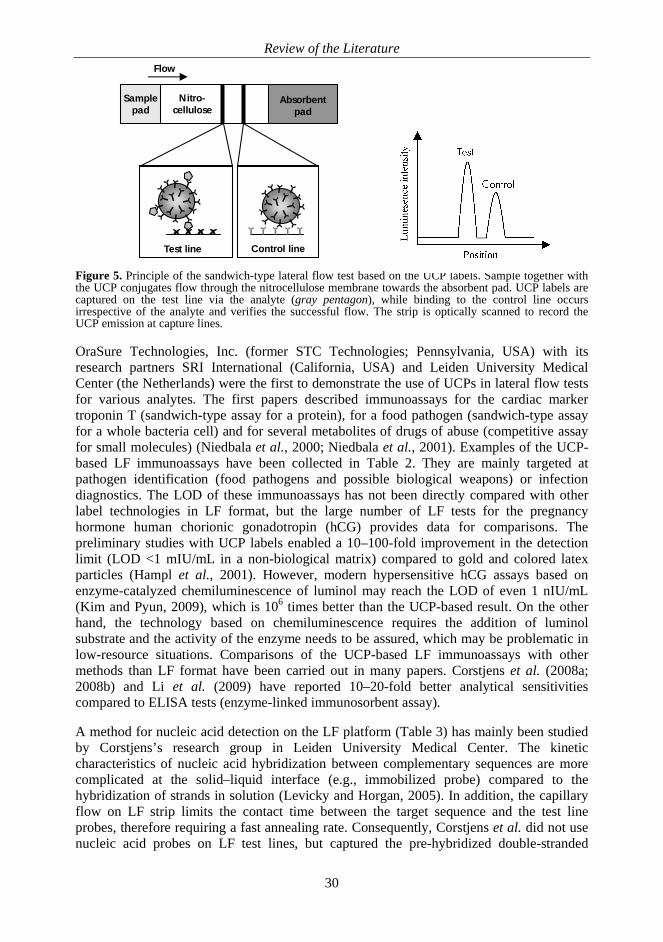
Review of the Literature
30
Figure 5. Principle of the sandwich-type lateral flow test based on the UCP labels. Sample together withthe UCP conjugates flow through the nitrocellulose membrane towards the absorbent pad. UCP labels arecaptured on the test line via the analyte (gray pentagon), while binding to the control line occursirrespective of the analyte and verifies the successful flow. The strip is optically scanned to record theUCP emission at capture lines.
OraSure Technologies, Inc. (former STC Technologies; Pennsylvania, USA) with itsresearch partners SRI International (California, USA) and Leiden University MedicalCenter (the Netherlands) were the first to demonstrate the use of UCPs in lateral flow testsfor various analytes. The first papers described immunoassays for the cardiac markertroponin T (sandwich-type assay for a protein), for a food pathogen (sandwich-type assayfor a whole bacteria cell) and for several metabolites of drugs of abuse (competitive assayfor small molecules) (Niedbala et al., 2000; Niedbala et al., 2001). Examples of the UCP-based LF immunoassays have been collected in Table 2. They are mainly targeted atpathogen identification (food pathogens and possible biological weapons) or infectiondiagnostics. The LOD of these immunoassays has not been directly compared with otherlabel technologies in LF format, but the large number of LF tests for the pregnancyhormone human chorionic gonadotropin (hCG) provides data for comparisons. Thepreliminary studies with UCP labels enabled a 10–100-fold improvement in the detectionlimit (LOD <1 mIU/mL in a non-biological matrix) compared to gold and colored latexparticles (Hampl et al., 2001). However, modern hypersensitive hCG assays based onenzyme-catalyzed chemiluminescence of luminol may reach the LOD of even 1 nIU/mL(Kim and Pyun, 2009), which is 106 times better than the UCP-based result. On the otherhand, the technology based on chemiluminescence requires the addition of luminolsubstrate and the activity of the enzyme needs to be assured, which may be problematic inlow-resource situations. Comparisons of the UCP-based LF immunoassays with othermethods than LF format have been carried out in many papers. Corstjens et al. (2008a;2008b) and Li et al. (2009) have reported 10–20-fold better analytical sensitivitiescompared to ELISA tests (enzyme-linked immunosorbent assay).
A method for nucleic acid detection on the LF platform (Table 3) has mainly been studiedby Corstjens’s research group in Leiden University Medical Center. The kineticcharacteristics of nucleic acid hybridization between complementary sequences are morecomplicated at the solid–liquid interface (e.g., immobilized probe) compared to thehybridization of strands in solution (Levicky and Horgan, 2005). In addition, the capillaryflow on LF strip limits the contact time between the target sequence and the test lineprobes, therefore requiring a fast annealing rate. Consequently, Corstjens et al. did not usenucleic acid probes on LF test lines, but captured the pre-hybridized double-stranded
Test line Control line
Absorbentpad
Samplepad
Nitro-cellulose
Flow
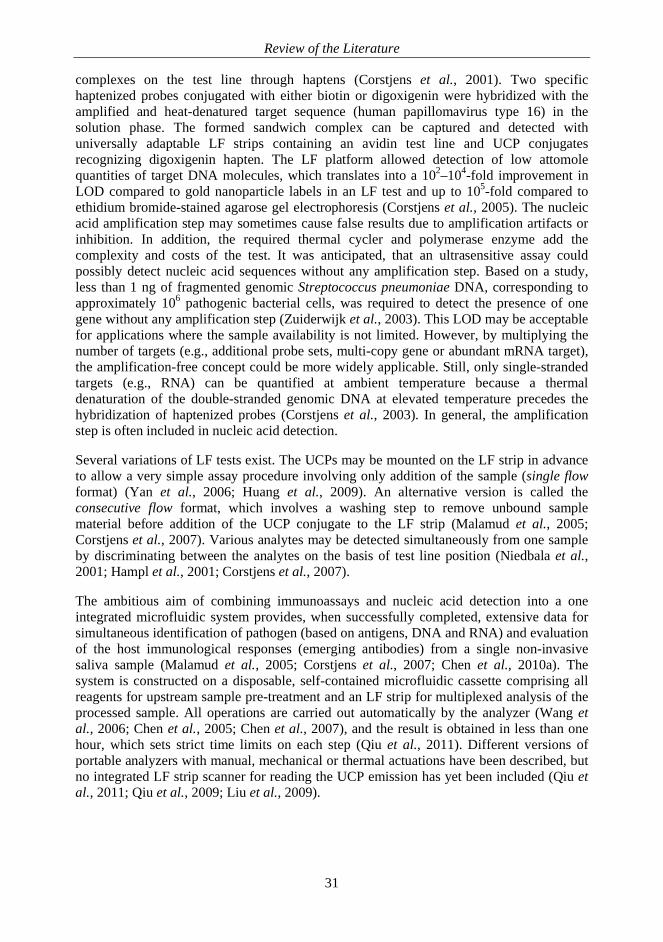
Review of the Literature
31
complexes on the test line through haptens (Corstjens et al., 2001). Two specifichaptenized probes conjugated with either biotin or digoxigenin were hybridized with theamplified and heat-denatured target sequence (human papillomavirus type 16) in thesolution phase. The formed sandwich complex can be captured and detected withuniversally adaptable LF strips containing an avidin test line and UCP conjugatesrecognizing digoxigenin hapten. The LF platform allowed detection of low attomolequantities of target DNA molecules, which translates into a 102–104-fold improvement inLOD compared to gold nanoparticle labels in an LF test and up to 105-fold compared toethidium bromide-stained agarose gel electrophoresis (Corstjens et al., 2005). The nucleicacid amplification step may sometimes cause false results due to amplification artifacts orinhibition. In addition, the required thermal cycler and polymerase enzyme add thecomplexity and costs of the test. It was anticipated, that an ultrasensitive assay couldpossibly detect nucleic acid sequences without any amplification step. Based on a study,less than 1 ng of fragmented genomic Streptococcus pneumoniae DNA, corresponding toapproximately 106 pathogenic bacterial cells, was required to detect the presence of onegene without any amplification step (Zuiderwijk et al., 2003). This LOD may be acceptablefor applications where the sample availability is not limited. However, by multiplying thenumber of targets (e.g., additional probe sets, multi-copy gene or abundant mRNA target),the amplification-free concept could be more widely applicable. Still, only single-strandedtargets (e.g., RNA) can be quantified at ambient temperature because a thermaldenaturation of the double-stranded genomic DNA at elevated temperature precedes thehybridization of haptenized probes (Corstjens et al., 2003). In general, the amplificationstep is often included in nucleic acid detection.
Several variations of LF tests exist. The UCPs may be mounted on the LF strip in advanceto allow a very simple assay procedure involving only addition of the sample (single flowformat) (Yan et al., 2006; Huang et al., 2009). An alternative version is called theconsecutive flow format, which involves a washing step to remove unbound samplematerial before addition of the UCP conjugate to the LF strip (Malamud et al., 2005;Corstjens et al., 2007). Various analytes may be detected simultaneously from one sampleby discriminating between the analytes on the basis of test line position (Niedbala et al.,2001; Hampl et al., 2001; Corstjens et al., 2007).
The ambitious aim of combining immunoassays and nucleic acid detection into a oneintegrated microfluidic system provides, when successfully completed, extensive data forsimultaneous identification of pathogen (based on antigens, DNA and RNA) and evaluationof the host immunological responses (emerging antibodies) from a single non-invasivesaliva sample (Malamud et al., 2005; Corstjens et al., 2007; Chen et al., 2010a). Thesystem is constructed on a disposable, self-contained microfluidic cassette comprising allreagents for upstream sample pre-treatment and an LF strip for multiplexed analysis of theprocessed sample. All operations are carried out automatically by the analyzer (Wang etal., 2006; Chen et al., 2005; Chen et al., 2007), and the result is obtained in less than onehour, which sets strict time limits on each step (Qiu et al., 2011). Different versions ofportable analyzers with manual, mechanical or thermal actuations have been described, butno integrated LF strip scanner for reading the UCP emission has yet been included (Qiu etal., 2011; Qiu et al., 2009; Liu et al., 2009).
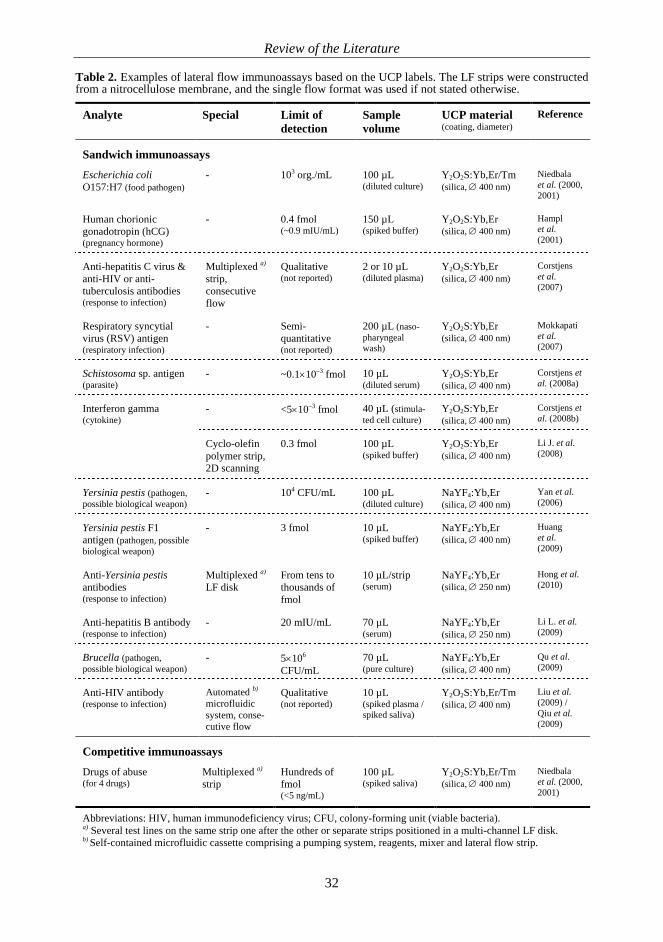
Review of the Literature
32
Table 2. Examples of lateral flow immunoassays based on the UCP labels. The LF strips were constructedfrom a nitrocellulose membrane, and the single flow format was used if not stated otherwise.
Analyte Special Limit ofdetection
Samplevolume
UCP material(coating, diameter)
Reference
Sandwich immunoassaysEscherichia coliO157:H7 (food pathogen)
- 103 org./mL 100 µL(diluted culture)
Y2O2S:Yb,Er/Tm(silica, 400 nm)
Niedbalaet al. (2000,2001)
Human chorionicgonadotropin (hCG)(pregnancy hormone)
- 0.4 fmol(~0.9 mIU/mL)
150 µL(spiked buffer)
Y2O2S:Yb,Er(silica, 400 nm)
Hamplet al.(2001)
Anti-hepatitis C virus &anti-HIV or anti-tuberculosis antibodies(response to infection)
Multiplexed a)
strip,consecutiveflow
Qualitative(not reported)
2 or 10 µL(diluted plasma)
Y2O2S:Yb,Er(silica, 400 nm)
Corstjenset al.(2007)
Respiratory syncytialvirus (RSV) antigen(respiratory infection)
- Semi-quantitative(not reported)
200 µL (naso-pharyngealwash)
Y2O2S:Yb,Er(silica, 400 nm)
Mokkapatiet al.(2007)
Schistosoma sp. antigen(parasite)
- ~0.1 10–3 fmol 10 µL(diluted serum)
Y2O2S:Yb,Er(silica, 400 nm)
Corstjens etal. (2008a)
- <5 10–3 fmol 40 µL (stimula-ted cell culture)
Y2O2S:Yb,Er(silica, 400 nm)
Corstjens etal. (2008b)
Interferon gamma(cytokine)
Cyclo-olefinpolymer strip,2D scanning
0.3 fmol 100 µL(spiked buffer)
Y2O2S:Yb,Er(silica, 400 nm)
Li J. et al.(2008)
Yersinia pestis (pathogen,possible biological weapon)
- 104 CFU/mL 100 µL(diluted culture)
NaYF4:Yb,Er(silica, 400 nm)
Yan et al.(2006)
Yersinia pestis F1antigen (pathogen, possiblebiological weapon)
- 3 fmol 10 µL(spiked buffer)
NaYF4:Yb,Er(silica, 400 nm)
Huanget al.(2009)
Anti-Yersinia pestisantibodies(response to infection)
Multiplexed a)
LF diskFrom tens tothousands offmol
10 µL/strip(serum)
NaYF4:Yb,Er(silica, 250 nm)
Hong et al.(2010)
Anti-hepatitis B antibody(response to infection)
- 20 mIU/mL 70 µL(serum)
NaYF4:Yb,Er(silica, 250 nm)
Li L. et al.(2009)
Brucella (pathogen,possible biological weapon)
- 5 106
CFU/mL70 µL(pure culture)
NaYF4:Yb,Er(silica, 400 nm)
Qu et al.(2009)
Anti-HIV antibody(response to infection)
Automated b)
microfluidicsystem, conse-cutive flow
Qualitative(not reported)
10 µL(spiked plasma /spiked saliva)
Y2O2S:Yb,Er/Tm(silica, 400 nm)
Liu et al.(2009) /Qiu et al.(2009)
Competitive immunoassaysDrugs of abuse(for 4 drugs)
Multiplexed a)
stripHundreds offmol(<5 ng/mL)
100 µL(spiked saliva)
Y2O2S:Yb,Er/Tm(silica, 400 nm)
Niedbalaet al. (2000,2001)
Abbreviations: HIV, human immunodeficiency virus; CFU, colony-forming unit (viable bacteria).a) Several test lines on the same strip one after the other or separate strips positioned in a multi-channel LF disk.b) Self-contained microfluidic cassette comprising a pumping system, reagents, mixer and lateral flow strip.
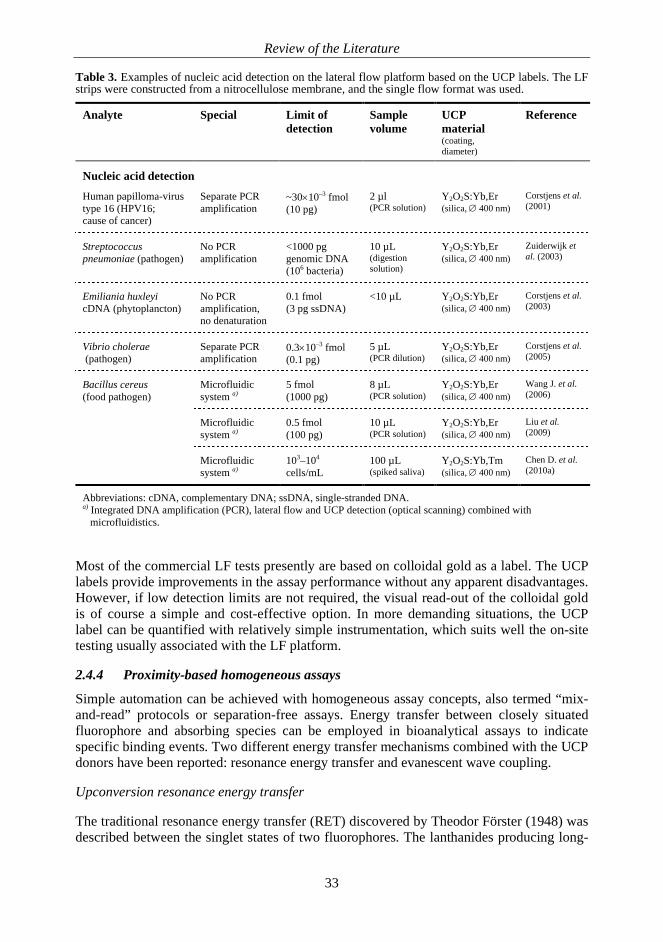
Review of the Literature
33
Table 3. Examples of nucleic acid detection on the lateral flow platform based on the UCP labels. The LFstrips were constructed from a nitrocellulose membrane, and the single flow format was used.
Analyte Special Limit ofdetection
Samplevolume
UCPmaterial(coating,diameter)
Reference
Nucleic acid detectionHuman papilloma-virustype 16 (HPV16;cause of cancer)
Separate PCRamplification
~30 10–3 fmol(10 pg)
2 µl(PCR solution)
Y2O2S:Yb,Er(silica, 400 nm)
Corstjens et al.(2001)
Streptococcuspneumoniae (pathogen)
No PCRamplification
<1000 pggenomic DNA(106 bacteria)
10 µL(digestionsolution)
Y2O2S:Yb,Er(silica, 400 nm)
Zuiderwijk etal. (2003)
Emiliania huxleyicDNA (phytoplancton)
No PCRamplification,no denaturation
0.1 fmol(3 pg ssDNA)
<10 µL Y2O2S:Yb,Er(silica, 400 nm)
Corstjens et al.(2003)
Vibrio cholerae(pathogen)
Separate PCRamplification
0.3 10–3 fmol(0.1 pg)
5 µL(PCR dilution)
Y2O2S:Yb,Er(silica, 400 nm)
Corstjens et al.(2005)
Bacillus cereus(food pathogen)
Microfluidicsystem a)
5 fmol(1000 pg)
8 µL(PCR solution)
Y2O2S:Yb,Er(silica, 400 nm)
Wang J. et al.(2006)
Microfluidicsystem a)
0.5 fmol(100 pg)
10 µL(PCR solution)
Y2O2S:Yb,Er(silica, 400 nm)
Liu et al.(2009)
Microfluidicsystem a)
103–104
cells/mL100 µL(spiked saliva)
Y2O2S:Yb,Tm(silica, 400 nm)
Chen D. et al.(2010a)
Abbreviations: cDNA, complementary DNA; ssDNA, single-stranded DNA.a) Integrated DNA amplification (PCR), lateral flow and UCP detection (optical scanning) combined with
microfluidistics.
Most of the commercial LF tests presently are based on colloidal gold as a label. The UCPlabels provide improvements in the assay performance without any apparent disadvantages.However, if low detection limits are not required, the visual read-out of the colloidal goldis of course a simple and cost-effective option. In more demanding situations, the UCPlabel can be quantified with relatively simple instrumentation, which suits well the on-sitetesting usually associated with the LF platform.
2.4.4 Proximity-based homogeneous assays
Simple automation can be achieved with homogeneous assay concepts, also termed “mix-and-read” protocols or separation-free assays. Energy transfer between closely situatedfluorophore and absorbing species can be employed in bioanalytical assays to indicatespecific binding events. Two different energy transfer mechanisms combined with the UCPdonors have been reported: resonance energy transfer and evanescent wave coupling.
Upconversion resonance energy transfer
The traditional resonance energy transfer (RET) discovered by Theodor Förster (1948) wasdescribed between the singlet states of two fluorophores. The lanthanides producing long-
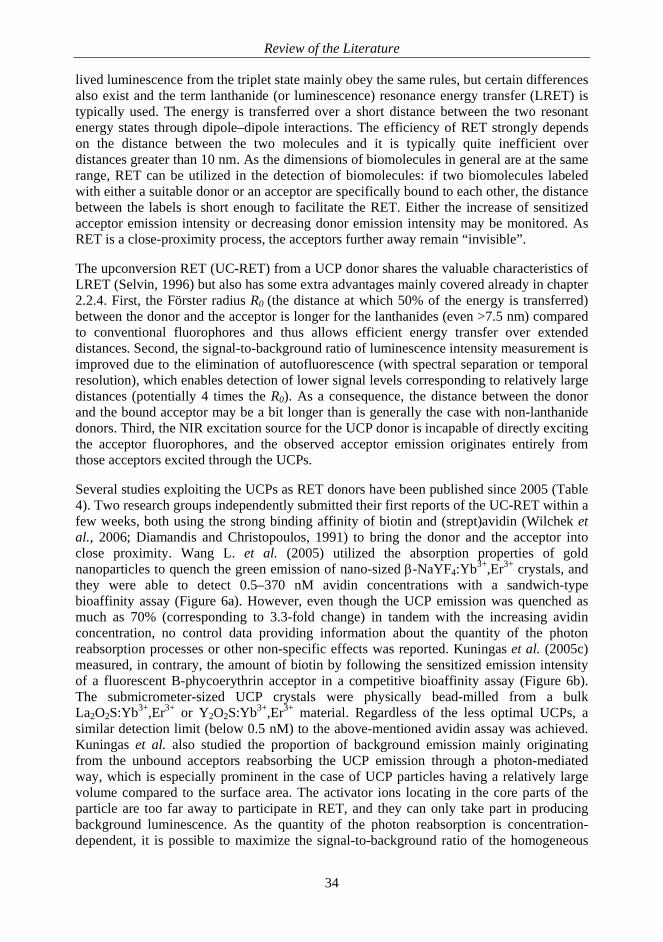
Review of the Literature
34
lived luminescence from the triplet state mainly obey the same rules, but certain differencesalso exist and the term lanthanide (or luminescence) resonance energy transfer (LRET) istypically used. The energy is transferred over a short distance between the two resonantenergy states through dipole–dipole interactions. The efficiency of RET strongly dependson the distance between the two molecules and it is typically quite inefficient overdistances greater than 10 nm. As the dimensions of biomolecules in general are at the samerange, RET can be utilized in the detection of biomolecules: if two biomolecules labeledwith either a suitable donor or an acceptor are specifically bound to each other, the distancebetween the labels is short enough to facilitate the RET. Either the increase of sensitizedacceptor emission intensity or decreasing donor emission intensity may be monitored. AsRET is a close-proximity process, the acceptors further away remain “invisible”.
The upconversion RET (UC-RET) from a UCP donor shares the valuable characteristics ofLRET (Selvin, 1996) but also has some extra advantages mainly covered already in chapter2.2.4. First, the Förster radius R0 (the distance at which 50% of the energy is transferred)between the donor and the acceptor is longer for the lanthanides (even >7.5 nm) comparedto conventional fluorophores and thus allows efficient energy transfer over extendeddistances. Second, the signal-to-background ratio of luminescence intensity measurement isimproved due to the elimination of autofluorescence (with spectral separation or temporalresolution), which enables detection of lower signal levels corresponding to relatively largedistances (potentially 4 times the R0). As a consequence, the distance between the donorand the bound acceptor may be a bit longer than is generally the case with non-lanthanidedonors. Third, the NIR excitation source for the UCP donor is incapable of directly excitingthe acceptor fluorophores, and the observed acceptor emission originates entirely fromthose acceptors excited through the UCPs.
Several studies exploiting the UCPs as RET donors have been published since 2005 (Table4). Two research groups independently submitted their first reports of the UC-RET within afew weeks, both using the strong binding affinity of biotin and (strept)avidin (Wilchek etal., 2006; Diamandis and Christopoulos, 1991) to bring the donor and the acceptor intoclose proximity. Wang L. et al. (2005) utilized the absorption properties of goldnanoparticles to quench the green emission of nano-sized -NaYF4:Yb3+,Er3+ crystals, andthey were able to detect 0.5–370 nM avidin concentrations with a sandwich-typebioaffinity assay (Figure 6a). However, even though the UCP emission was quenched asmuch as 70% (corresponding to 3.3-fold change) in tandem with the increasing avidinconcentration, no control data providing information about the quantity of the photonreabsorption processes or other non-specific effects was reported. Kuningas et al. (2005c)measured, in contrary, the amount of biotin by following the sensitized emission intensityof a fluorescent B-phycoerythrin acceptor in a competitive bioaffinity assay (Figure 6b).The submicrometer-sized UCP crystals were physically bead-milled from a bulkLa2O2S:Yb3+,Er3+ or Y2O2S:Yb3+,Er3+ material. Regardless of the less optimal UCPs, asimilar detection limit (below 0.5 nM) to the above-mentioned avidin assay was achieved.Kuningas et al. also studied the proportion of background emission mainly originatingfrom the unbound acceptors reabsorbing the UCP emission through a photon-mediatedway, which is especially prominent in the case of UCP particles having a relatively largevolume compared to the surface area. The activator ions locating in the core parts of theparticle are too far away to participate in RET, and they can only take part in producingbackground luminescence. As the quantity of the photon reabsorption is concentration-dependent, it is possible to maximize the signal-to-background ratio of the homogeneous
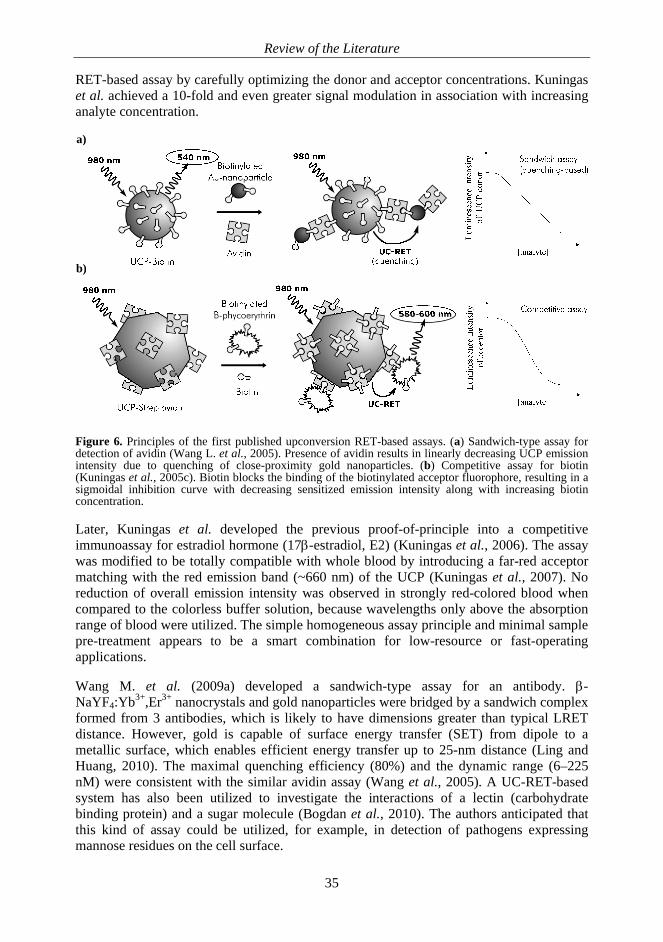
Review of the Literature
35
b)
a)
RET-based assay by carefully optimizing the donor and acceptor concentrations. Kuningaset al. achieved a 10-fold and even greater signal modulation in association with increasinganalyte concentration.
Figure 6. Principles of the first published upconversion RET-based assays. (a) Sandwich-type assay fordetection of avidin (Wang L. et al., 2005). Presence of avidin results in linearly decreasing UCP emissionintensity due to quenching of close-proximity gold nanoparticles. (b) Competitive assay for biotin(Kuningas et al., 2005c). Biotin blocks the binding of the biotinylated acceptor fluorophore, resulting in asigmoidal inhibition curve with decreasing sensitized emission intensity along with increasing biotinconcentration.
Later, Kuningas et al. developed the previous proof-of-principle into a competitiveimmunoassay for estradiol hormone (17 -estradiol, E2) (Kuningas et al., 2006). The assaywas modified to be totally compatible with whole blood by introducing a far-red acceptormatching with the red emission band (~660 nm) of the UCP (Kuningas et al., 2007). Noreduction of overall emission intensity was observed in strongly red-colored blood whencompared to the colorless buffer solution, because wavelengths only above the absorptionrange of blood were utilized. The simple homogeneous assay principle and minimal samplepre-treatment appears to be a smart combination for low-resource or fast-operatingapplications.
Wang M. et al. (2009a) developed a sandwich-type assay for an antibody. -NaYF4:Yb3+,Er3+ nanocrystals and gold nanoparticles were bridged by a sandwich complexformed from 3 antibodies, which is likely to have dimensions greater than typical LRETdistance. However, gold is capable of surface energy transfer (SET) from dipole to ametallic surface, which enables efficient energy transfer up to 25-nm distance (Ling andHuang, 2010). The maximal quenching efficiency (80%) and the dynamic range (6–225nM) were consistent with the similar avidin assay (Wang et al., 2005). A UC-RET-basedsystem has also been utilized to investigate the interactions of a lectin (carbohydratebinding protein) and a sugar molecule (Bogdan et al., 2010). The authors anticipated thatthis kind of assay could be utilized, for example, in detection of pathogens expressingmannose residues on the cell surface.
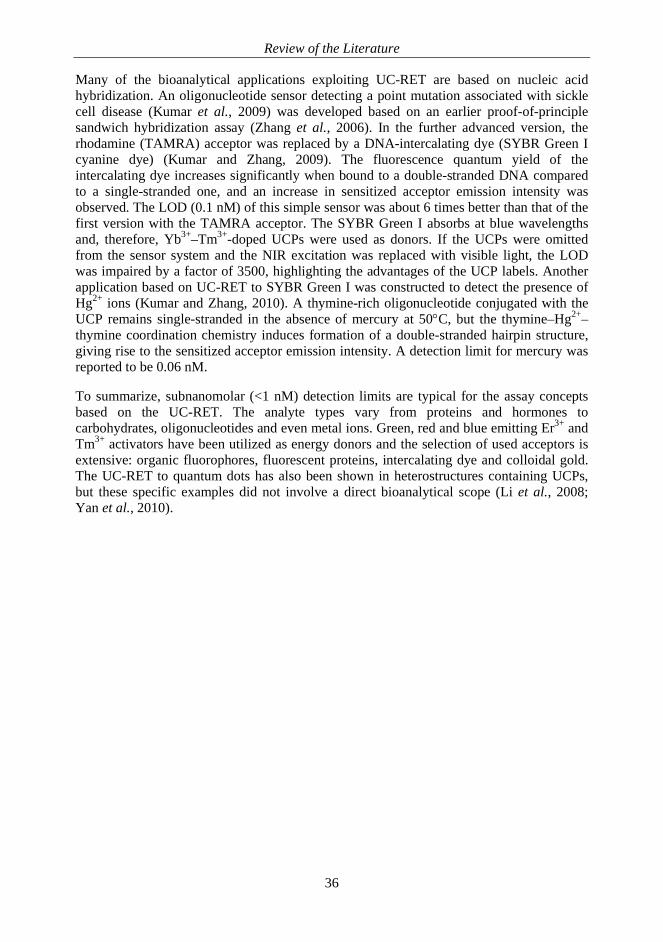
Review of the Literature
36
Many of the bioanalytical applications exploiting UC-RET are based on nucleic acidhybridization. An oligonucleotide sensor detecting a point mutation associated with sicklecell disease (Kumar et al., 2009) was developed based on an earlier proof-of-principlesandwich hybridization assay (Zhang et al., 2006). In the further advanced version, therhodamine (TAMRA) acceptor was replaced by a DNA-intercalating dye (SYBR Green Icyanine dye) (Kumar and Zhang, 2009). The fluorescence quantum yield of theintercalating dye increases significantly when bound to a double-stranded DNA comparedto a single-stranded one, and an increase in sensitized acceptor emission intensity wasobserved. The LOD (0.1 nM) of this simple sensor was about 6 times better than that of thefirst version with the TAMRA acceptor. The SYBR Green I absorbs at blue wavelengthsand, therefore, Yb3+–Tm3+-doped UCPs were used as donors. If the UCPs were omittedfrom the sensor system and the NIR excitation was replaced with visible light, the LODwas impaired by a factor of 3500, highlighting the advantages of the UCP labels. Anotherapplication based on UC-RET to SYBR Green I was constructed to detect the presence ofHg2+ ions (Kumar and Zhang, 2010). A thymine-rich oligonucleotide conjugated with theUCP remains single-stranded in the absence of mercury at 50 C, but the thymine–Hg2+–thymine coordination chemistry induces formation of a double-stranded hairpin structure,giving rise to the sensitized acceptor emission intensity. A detection limit for mercury wasreported to be 0.06 nM.
To summarize, subnanomolar (<1 nM) detection limits are typical for the assay conceptsbased on the UC-RET. The analyte types vary from proteins and hormones tocarbohydrates, oligonucleotides and even metal ions. Green, red and blue emitting Er3+ andTm3+ activators have been utilized as energy donors and the selection of used acceptors isextensive: organic fluorophores, fluorescent proteins, intercalating dye and colloidal gold.The UC-RET to quantum dots has also been shown in heterostructures containing UCPs,but these specific examples did not involve a direct bioanalytical scope (Li et al., 2008;Yan et al., 2010).
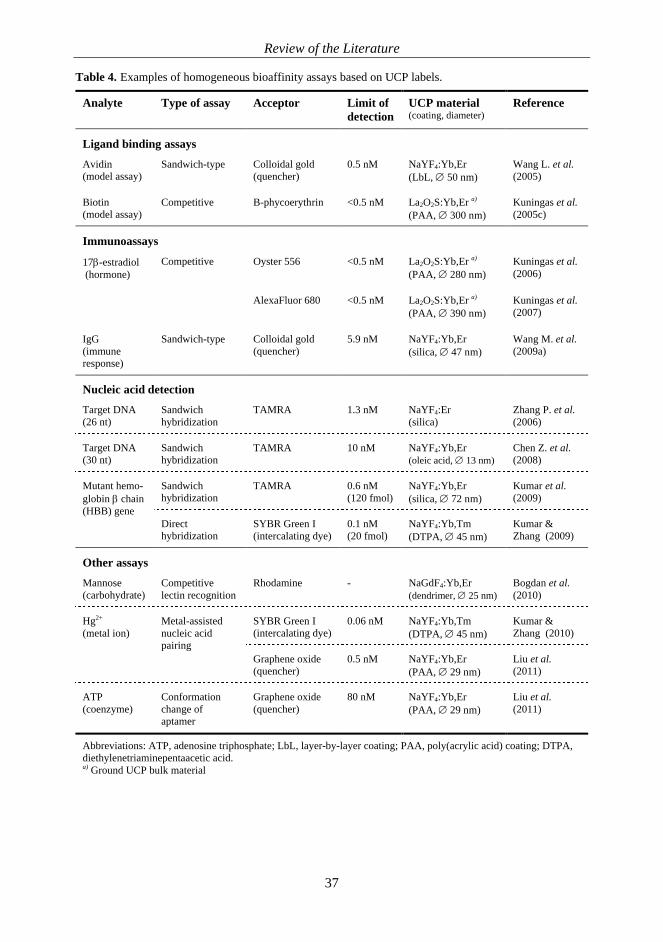
Review of the Literature
37
Table 4. Examples of homogeneous bioaffinity assays based on UCP labels.
Analyte Type of assay Acceptor Limit ofdetection
UCP material(coating, diameter)
Reference
Ligand binding assaysAvidin(model assay)
Sandwich-type Colloidal gold(quencher)
0.5 nM NaYF4:Yb,Er(LbL, 50 nm)
Wang L. et al.(2005)
Biotin(model assay)
Competitive B-phycoerythrin <0.5 nM La2O2S:Yb,Er a)
(PAA, 300 nm)Kuningas et al.(2005c)
ImmunoassaysCompetitive Oyster 556 <0.5 nM La2O2S:Yb,Er a)
(PAA, 280 nm)Kuningas et al.(2006)
17 -estradiol (hormone)
AlexaFluor 680 <0.5 nM La2O2S:Yb,Er a)
(PAA, 390 nm)Kuningas et al.(2007)
IgG(immuneresponse)
Sandwich-type Colloidal gold(quencher)
5.9 nM NaYF4:Yb,Er(silica, 47 nm)
Wang M. et al.(2009a)
Nucleic acid detectionTarget DNA(26 nt)
Sandwichhybridization
TAMRA 1.3 nM NaYF4:Er(silica)
Zhang P. et al.(2006)
Target DNA(30 nt)
Sandwichhybridization
TAMRA 10 nM NaYF4:Yb,Er(oleic acid, 13 nm)
Chen Z. et al.(2008)
Sandwichhybridization
TAMRA 0.6 nM(120 fmol)
NaYF4:Yb,Er(silica, 72 nm)
Kumar et al.(2009)
Mutant hemo-globin chain(HBB) gene
Directhybridization
SYBR Green I(intercalating dye)
0.1 nM(20 fmol)
NaYF4:Yb,Tm(DTPA, 45 nm)
Kumar &Zhang (2009)
Other assaysMannose(carbohydrate)
Competitivelectin recognition
Rhodamine - NaGdF4:Yb,Er(dendrimer, 25 nm)
Bogdan et al.(2010)
SYBR Green I(intercalating dye)
0.06 nM NaYF4:Yb,Tm(DTPA, 45 nm)
Kumar &Zhang (2010)
Hg2+
(metal ion)Metal-assistednucleic acidpairing
Graphene oxide(quencher)
0.5 nM NaYF4:Yb,Er(PAA, 29 nm)
Liu et al.(2011)
ATP(coenzyme)
Conformationchange ofaptamer
Graphene oxide(quencher)
80 nM NaYF4:Yb,Er(PAA, 29 nm)
Liu et al.(2011)
Abbreviations: ATP, adenosine triphosphate; LbL, layer-by-layer coating; PAA, poly(acrylic acid) coating; DTPA,diethylenetriaminepentaacetic acid.a) Ground UCP bulk material
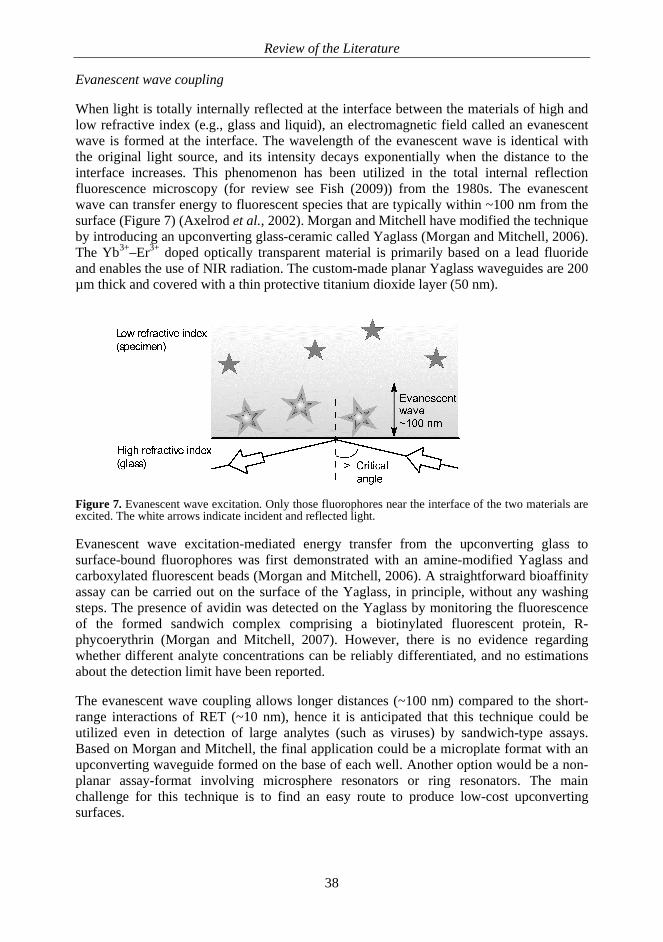
Review of the Literature
38
Evanescent wave coupling
When light is totally internally reflected at the interface between the materials of high andlow refractive index (e.g., glass and liquid), an electromagnetic field called an evanescentwave is formed at the interface. The wavelength of the evanescent wave is identical withthe original light source, and its intensity decays exponentially when the distance to theinterface increases. This phenomenon has been utilized in the total internal reflectionfluorescence microscopy (for review see Fish (2009)) from the 1980s. The evanescentwave can transfer energy to fluorescent species that are typically within ~100 nm from thesurface (Figure 7) (Axelrod et al., 2002). Morgan and Mitchell have modified the techniqueby introducing an upconverting glass-ceramic called Yaglass (Morgan and Mitchell, 2006).The Yb3+–Er3+ doped optically transparent material is primarily based on a lead fluorideand enables the use of NIR radiation. The custom-made planar Yaglass waveguides are 200µm thick and covered with a thin protective titanium dioxide layer (50 nm).
Figure 7. Evanescent wave excitation. Only those fluorophores near the interface of the two materials areexcited. The white arrows indicate incident and reflected light.
Evanescent wave excitation-mediated energy transfer from the upconverting glass tosurface-bound fluorophores was first demonstrated with an amine-modified Yaglass andcarboxylated fluorescent beads (Morgan and Mitchell, 2006). A straightforward bioaffinityassay can be carried out on the surface of the Yaglass, in principle, without any washingsteps. The presence of avidin was detected on the Yaglass by monitoring the fluorescenceof the formed sandwich complex comprising a biotinylated fluorescent protein, R-phycoerythrin (Morgan and Mitchell, 2007). However, there is no evidence regardingwhether different analyte concentrations can be reliably differentiated, and no estimationsabout the detection limit have been reported.
The evanescent wave coupling allows longer distances (~100 nm) compared to the short-range interactions of RET (~10 nm), hence it is anticipated that this technique could beutilized even in detection of large analytes (such as viruses) by sandwich-type assays.Based on Morgan and Mitchell, the final application could be a microplate format with anupconverting waveguide formed on the base of each well. Another option would be a non-planar assay-format involving microsphere resonators or ring resonators. The mainchallenge for this technique is to find an easy route to produce low-cost upconvertingsurfaces.
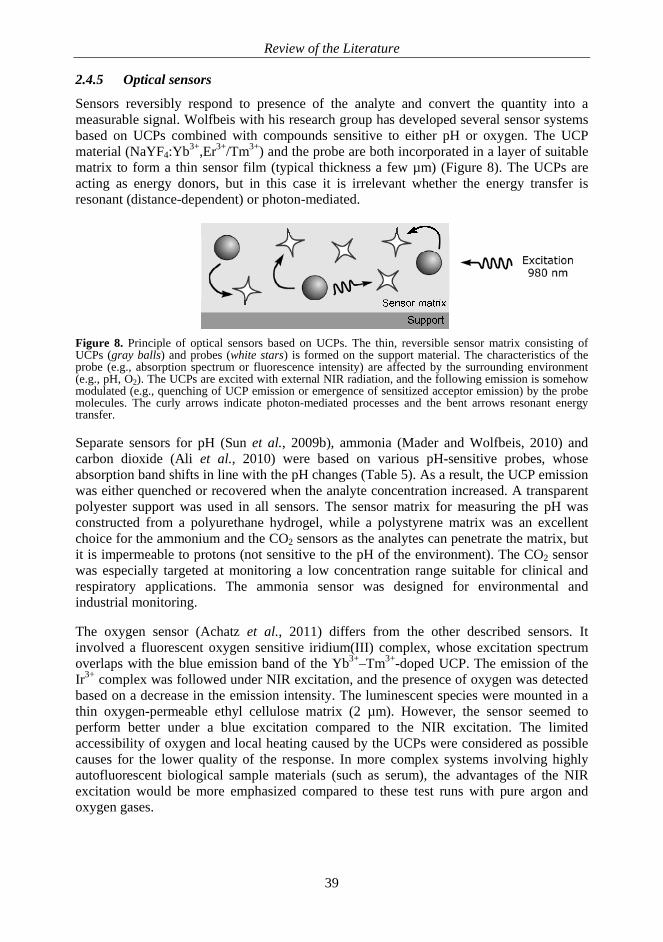
Review of the Literature
39
2.4.5 Optical sensors
Sensors reversibly respond to presence of the analyte and convert the quantity into ameasurable signal. Wolfbeis with his research group has developed several sensor systemsbased on UCPs combined with compounds sensitive to either pH or oxygen. The UCPmaterial (NaYF4:Yb3+,Er3+/Tm3+) and the probe are both incorporated in a layer of suitablematrix to form a thin sensor film (typical thickness a few µm) (Figure 8). The UCPs areacting as energy donors, but in this case it is irrelevant whether the energy transfer isresonant (distance-dependent) or photon-mediated.
Figure 8. Principle of optical sensors based on UCPs. The thin, reversible sensor matrix consisting ofUCPs (gray balls) and probes (white stars) is formed on the support material. The characteristics of theprobe (e.g., absorption spectrum or fluorescence intensity) are affected by the surrounding environment(e.g., pH, O2). The UCPs are excited with external NIR radiation, and the following emission is somehowmodulated (e.g., quenching of UCP emission or emergence of sensitized acceptor emission) by the probemolecules. The curly arrows indicate photon-mediated processes and the bent arrows resonant energytransfer.
Separate sensors for pH (Sun et al., 2009b), ammonia (Mader and Wolfbeis, 2010) andcarbon dioxide (Ali et al., 2010) were based on various pH-sensitive probes, whoseabsorption band shifts in line with the pH changes (Table 5). As a result, the UCP emissionwas either quenched or recovered when the analyte concentration increased. A transparentpolyester support was used in all sensors. The sensor matrix for measuring the pH wasconstructed from a polyurethane hydrogel, while a polystyrene matrix was an excellentchoice for the ammonium and the CO2 sensors as the analytes can penetrate the matrix, butit is impermeable to protons (not sensitive to the pH of the environment). The CO2 sensorwas especially targeted at monitoring a low concentration range suitable for clinical andrespiratory applications. The ammonia sensor was designed for environmental andindustrial monitoring.
The oxygen sensor (Achatz et al., 2011) differs from the other described sensors. Itinvolved a fluorescent oxygen sensitive iridium(III) complex, whose excitation spectrumoverlaps with the blue emission band of the Yb3+–Tm3+-doped UCP. The emission of theIr3+ complex was followed under NIR excitation, and the presence of oxygen was detectedbased on a decrease in the emission intensity. The luminescent species were mounted in athin oxygen-permeable ethyl cellulose matrix (2 µm). However, the sensor seemed toperform better under a blue excitation compared to the NIR excitation. The limitedaccessibility of oxygen and local heating caused by the UCPs were considered as possiblecauses for the lower quality of the response. In more complex systems involving highlyautofluorescent biological sample materials (such as serum), the advantages of the NIRexcitation would be more emphasized compared to these test runs with pure argon andoxygen gases.
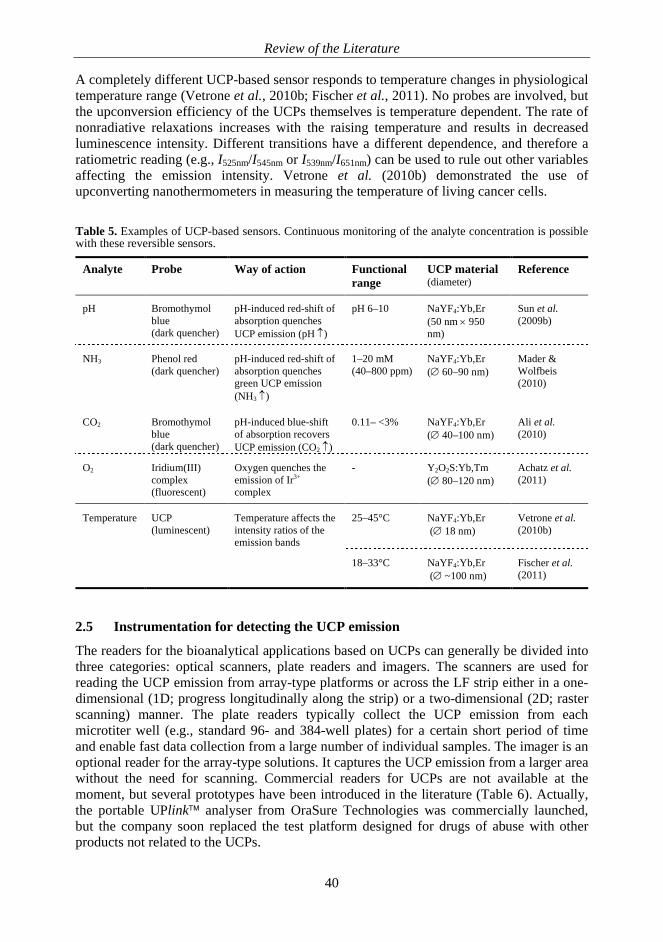
Review of the Literature
40
A completely different UCP-based sensor responds to temperature changes in physiologicaltemperature range (Vetrone et al., 2010b; Fischer et al., 2011). No probes are involved, butthe upconversion efficiency of the UCPs themselves is temperature dependent. The rate ofnonradiative relaxations increases with the raising temperature and results in decreasedluminescence intensity. Different transitions have a different dependence, and therefore aratiometric reading (e.g., I525nm/I545nm or I539nm/I651nm) can be used to rule out other variablesaffecting the emission intensity. Vetrone et al. (2010b) demonstrated the use ofupconverting nanothermometers in measuring the temperature of living cancer cells.
Table 5. Examples of UCP-based sensors. Continuous monitoring of the analyte concentration is possiblewith these reversible sensors.
Analyte Probe Way of action Functionalrange
UCP material(diameter)
Reference
pH Bromothymolblue(dark quencher)
pH-induced red-shift ofabsorption quenchesUCP emission (pH )
pH 6–10 NaYF4:Yb,Er(50 nm 950nm)
Sun et al.(2009b)
NH3 Phenol red(dark quencher)
pH-induced red-shift ofabsorption quenchesgreen UCP emission(NH3 )
1–20 mM(40–800 ppm)
NaYF4:Yb,Er( 60–90 nm)
Mader &Wolfbeis(2010)
CO2 Bromothymolblue(dark quencher)
pH-induced blue-shiftof absorption recoversUCP emission (CO2 )
0.11– <3% NaYF4:Yb,Er( 40–100 nm)
Ali et al.(2010)
O2 Iridium(III)complex(fluorescent)
Oxygen quenches theemission of Ir3+
complex
- Y2O2S:Yb,Tm( 80–120 nm)
Achatz et al.(2011)
Temperature UCP(luminescent)
Temperature affects theintensity ratios of theemission bands
25–45°C NaYF4:Yb,Er ( 18 nm)
Vetrone et al.(2010b)
18–33°C NaYF4:Yb,Er ( ~100 nm)
Fischer et al.(2011)
2.5 Instrumentation for detecting the UCP emission
The readers for the bioanalytical applications based on UCPs can generally be divided intothree categories: optical scanners, plate readers and imagers. The scanners are used forreading the UCP emission from array-type platforms or across the LF strip either in a one-dimensional (1D; progress longitudinally along the strip) or a two-dimensional (2D; rasterscanning) manner. The plate readers typically collect the UCP emission from eachmicrotiter well (e.g., standard 96- and 384-well plates) for a certain short period of timeand enable fast data collection from a large number of individual samples. The imager is anoptional reader for the array-type solutions. It captures the UCP emission from a larger areawithout the need for scanning. Commercial readers for UCPs are not available at themoment, but several prototypes have been introduced in the literature (Table 6). Actually,the portable UPlink analyser from OraSure Technologies was commercially launched,but the company soon replaced the test platform designed for drugs of abuse with otherproducts not related to the UCPs.
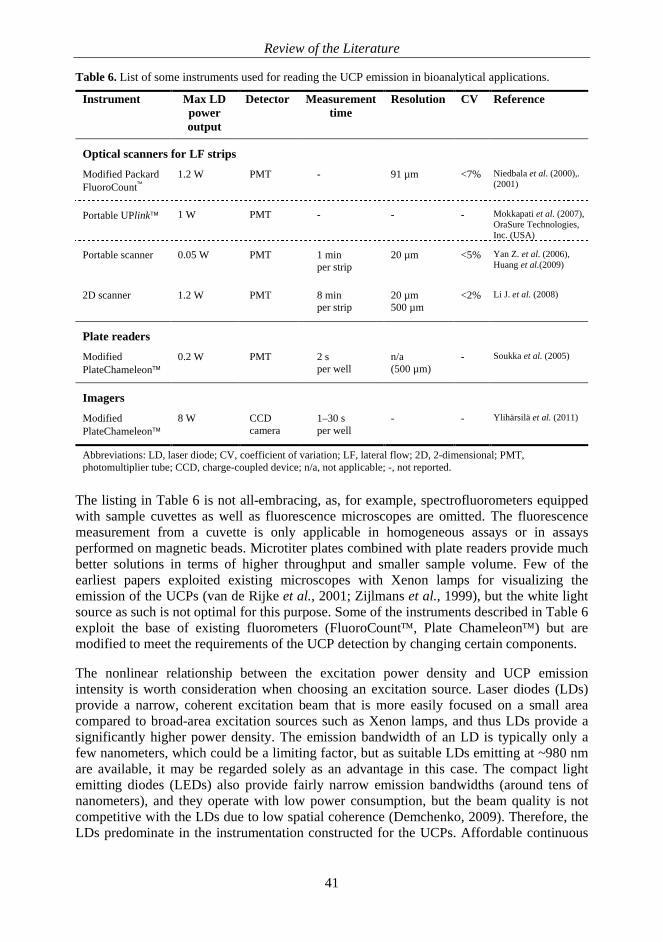
Review of the Literature
41
Table 6. List of some instruments used for reading the UCP emission in bioanalytical applications.
Instrument Max LDpoweroutput
Detector Measurementtime
Resolution CV Reference
Optical scanners for LF stripsModified PackardFluoroCount
1.2 W PMT - 91 µm <7% Niedbala et al. (2000),.(2001)
Portable UPlink 1 W PMT - - - Mokkapati et al. (2007),OraSure Technologies,Inc. (USA)
Portable scanner 0.05 W PMT 1 minper strip
20 µm <5% Yan Z. et al. (2006),Huang et al.(2009)
2D scanner 1.2 W PMT 8 minper strip
20 µm500 µm
<2% Li J. et al. (2008)
Plate readersModifiedPlateChameleon
0.2 W PMT 2 sper well
n/a(500 µm)
- Soukka et al. (2005)
ImagersModifiedPlateChameleon
8 W CCDcamera
1–30 sper well
- - Ylihärsilä et al. (2011)
Abbreviations: LD, laser diode; CV, coefficient of variation; LF, lateral flow; 2D, 2-dimensional; PMT,photomultiplier tube; CCD, charge-coupled device; n/a, not applicable; -, not reported.
The listing in Table 6 is not all-embracing, as, for example, spectrofluorometers equippedwith sample cuvettes as well as fluorescence microscopes are omitted. The fluorescencemeasurement from a cuvette is only applicable in homogeneous assays or in assaysperformed on magnetic beads. Microtiter plates combined with plate readers provide muchbetter solutions in terms of higher throughput and smaller sample volume. Few of theearliest papers exploited existing microscopes with Xenon lamps for visualizing theemission of the UCPs (van de Rijke et al., 2001; Zijlmans et al., 1999), but the white lightsource as such is not optimal for this purpose. Some of the instruments described in Table 6exploit the base of existing fluorometers (FluoroCount , Plate Chameleon ) but aremodified to meet the requirements of the UCP detection by changing certain components.
The nonlinear relationship between the excitation power density and UCP emissionintensity is worth consideration when choosing an excitation source. Laser diodes (LDs)provide a narrow, coherent excitation beam that is more easily focused on a small areacompared to broad-area excitation sources such as Xenon lamps, and thus LDs provide asignificantly higher power density. The emission bandwidth of an LD is typically only afew nanometers, which could be a limiting factor, but as suitable LDs emitting at ~980 nmare available, it may be regarded solely as an advantage in this case. The compact lightemitting diodes (LEDs) also provide fairly narrow emission bandwidths (around tens ofnanometers), and they operate with low power consumption, but the beam quality is notcompetitive with the LDs due to low spatial coherence (Demchenko, 2009). Therefore, theLDs predominate in the instrumentation constructed for the UCPs. Affordable continuous
Review of the Literature
42
wave LDs are commonly available from various commercial suppliers. They are offeredwith different output powers, and one may also choose a fiber-coupled diode or a diodeequipped with a cooler (e.g., peltier element). A respectable LD for the UCP-basedbioanalytical applications can be purchased with only a few hundred euros, and portablelaser pointers for the on-site applications are in the same price category. The costs of aninstrument become a focal issue in context of commercialization, and economical solutionsnaturally attract the end-users. The decentralized analyzers intended for POCT are a specialmarket segment particularly calling for reasonable pricing.
The detector for the UCP emission is more commonly a photomultiplier tube (PMT) than asilicon-based detector (e.g., a charge-coupled device (CCD) or photodiode), due to itssuperior sensitivity, marginal noise level and lower response towards NIR radiation(Demchenko, 2009; Li et al., 2008). The continuous NIR excitation is much more intensecompared to the visible emission of the UCPs, and although optical filters are used forblocking the NIR radiation from the detector, it is an advantageous feature that the detectoritself naturally filters out unwanted wavelengths originating from the excitation source. Thesilicon-based detectors are approximately 100 times more responsive to NIR photons thanthe PMTs. However, the most significant feature of the PMT is the signal amplification,which allows detection of minute amounts of photons. A 2D image may be produced eitherby scanning the desired area point by point or by utilizing a 2-dimensional matrix ofdetectors (e.g., CCD cameras), of which the latter usually operates quicker.
The PlateChameleon™-based imager differs from the other instruments in two ways. First,it is the only instrument discussed here that uses a CCD-camera as a detector. That is alogical choice as a 2D image is required. Second, the imager has a significantly morepowerful LD compared to the other instruments in Table 6. However, the laser beam isspread over a relatively large area (a square of several millimeters), while in otherinstruments the beam is, on the contrary, focused on a small area. A more valid value inTable 6 would be the power density instead of the laser output power, but unfortunatelythat information is not available.
The measurement time per single sample varies according to the number of data pointscollected. Scanning the LF strips takes some time, rendering the LF assays therefore moresuitable for individual testing, while the microtiter plate-based assays fit well with the high-throughput applications providing results rapidly. The substantially long time required for2D raster scanning of the LF strips provides a large number of data points and allowstherefore more sophisticated data analysis for the subtraction of the background signal andfor the reduction of the random errors resulting from an inhomogeneous UCP distributionon each strip (Li et al., 2008). However, the 8-minute data acquisition time for one LF stripis acceptable only for occasional testing; it is inconvenient for other applications.
The technological solutions for the anti-Stokes photoluminescence readers have beenexisting for a long time. It provides a lead over the other merging labels producingconventional fluorescence upon NIR excitation (e.g., molecular Yb3+ complexes andinorganic Yb3+-doped nanocrystals (Zhang and Petoud, 2008; Zucchi et al., 2009; Zhang etal., 2007)), because good detectors for such high wavelengths are still in the developmentstage. Solid-state NIR-detectors are available, but the sensitivity of, for example, PMTs isnot adequate at NIR wavelengths.
Aims of the Study
43
3 AIMS OF THE STUDY
The overall aim of this thesis was to evaluate the performance of upconverting phosphorsin different bioanalytical assay concepts as an NIR-excitable energy donor. The separation-free UCP technology based on energy transfer was previously demonstrated to enablesensitive determination of an estradiol hormone even in the presence of whole blood. Thepurpose of the present study was to show the potential of the UCP technology also inhomogeneous applications other than immunoassays, and to further develop the methodsrequired for functionalization and bioconjugation of the UCPs. Finally, the energy transfermechanisms between the UCP donor and an acceptor fluorophore were investigated todefine the presence of the distance-dependent resonance energy transfer process, which isthe basis for the homogeneous assays presented in this thesis.
More specifically the aims were:
I To enhance the performance of the bioaffinity assay based on upconversionresonance energy transfer by utilizing a tandem dye acceptor having a largepseudo-Stokes shift.
II To demonstrate a fluorescence quenching-based high-throughput screening conceptfor measuring the activity of hydrolyzing enzymes.
To compare the NIR-excitable photon upconversion-based technology with aconventional fluorescence method both in colorless buffer solution and in deeplyred-colored whole blood dilution.
III To study the feasibility of a UCP donor in a homogeneous upconversion resonanceenergy transfer-based multiparametric hybridization assay utilizing only a singleexcitation wavelength.
To show that silica-encapsulation instead of poly(acrylic acid) adsorption as afunctionalization method for UCPs is applicable to UC-RET-based homogeneousassays.
IV To characterize the nature of the energy transfer from UCPs to conventionalfluorophores and fluorescent proteins.
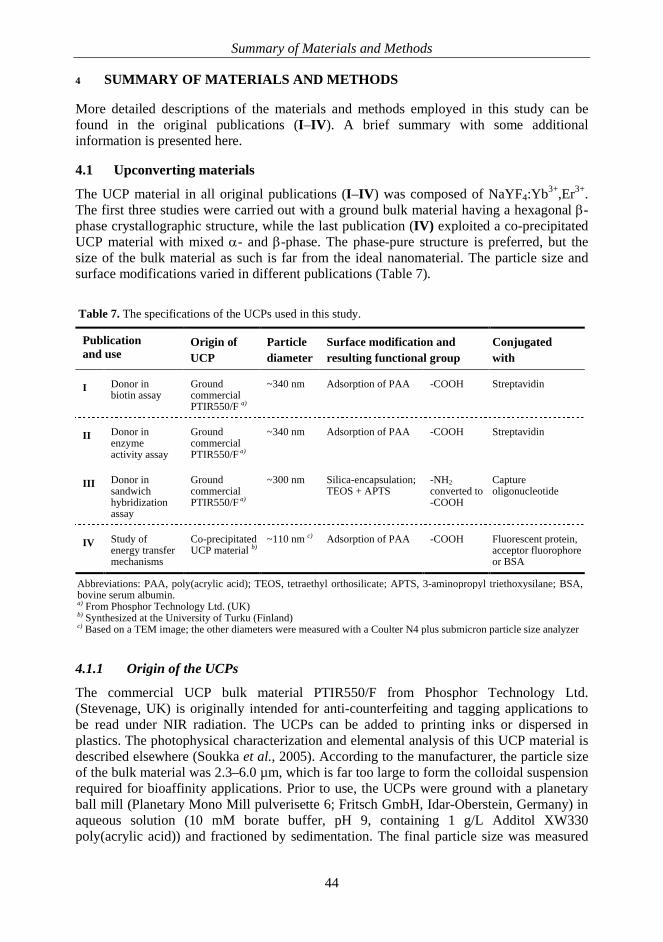
Summary of Materials and Methods
44
4 SUMMARY OF MATERIALS AND METHODS
More detailed descriptions of the materials and methods employed in this study can befound in the original publications (I–IV). A brief summary with some additionalinformation is presented here.
4.1 Upconverting materials
The UCP material in all original publications (I–IV) was composed of NaYF4:Yb3+,Er3+.The first three studies were carried out with a ground bulk material having a hexagonal -phase crystallographic structure, while the last publication (IV) exploited a co-precipitatedUCP material with mixed - and -phase. The phase-pure structure is preferred, but thesize of the bulk material as such is far from the ideal nanomaterial. The particle size andsurface modifications varied in different publications (Table 7).
Table 7. The specifications of the UCPs used in this study.
Publicationand use
Origin ofUCP
Particlediameter
Surface modification andresulting functional group
Conjugatedwith
I Donor inbiotin assay
GroundcommercialPTIR550/F a)
~340 nm Adsorption of PAA -COOH Streptavidin
II Donor inenzymeactivity assay
GroundcommercialPTIR550/F a)
~340 nm Adsorption of PAA -COOH Streptavidin
III Donor insandwichhybridizationassay
GroundcommercialPTIR550/F a)
~300 nm Silica-encapsulation;TEOS + APTS
-NH2converted to-COOH
Captureoligonucleotide
IV Study ofenergy transfermechanisms
Co-precipitatedUCP material b)
~110 nm c) Adsorption of PAA -COOH Fluorescent protein,acceptor fluorophoreor BSA
Abbreviations: PAA, poly(acrylic acid); TEOS, tetraethyl orthosilicate; APTS, 3-aminopropyl triethoxysilane; BSA,bovine serum albumin.a) From Phosphor Technology Ltd. (UK)b) Synthesized at the University of Turku (Finland)c) Based on a TEM image; the other diameters were measured with a Coulter N4 plus submicron particle size analyzer
4.1.1 Origin of the UCPs
The commercial UCP bulk material PTIR550/F from Phosphor Technology Ltd.(Stevenage, UK) is originally intended for anti-counterfeiting and tagging applications tobe read under NIR radiation. The UCPs can be added to printing inks or dispersed inplastics. The photophysical characterization and elemental analysis of this UCP material isdescribed elsewhere (Soukka et al., 2005). According to the manufacturer, the particle sizeof the bulk material was 2.3–6.0 µm, which is far too large to form the colloidal suspensionrequired for bioaffinity applications. Prior to use, the UCPs were ground with a planetaryball mill (Planetary Mono Mill pulverisette 6; Fritsch GmbH, Idar-Oberstein, Germany) inaqueous solution (10 mM borate buffer, pH 9, containing 1 g/L Additol XW330poly(acrylic acid)) and fractioned by sedimentation. The final particle size was measured
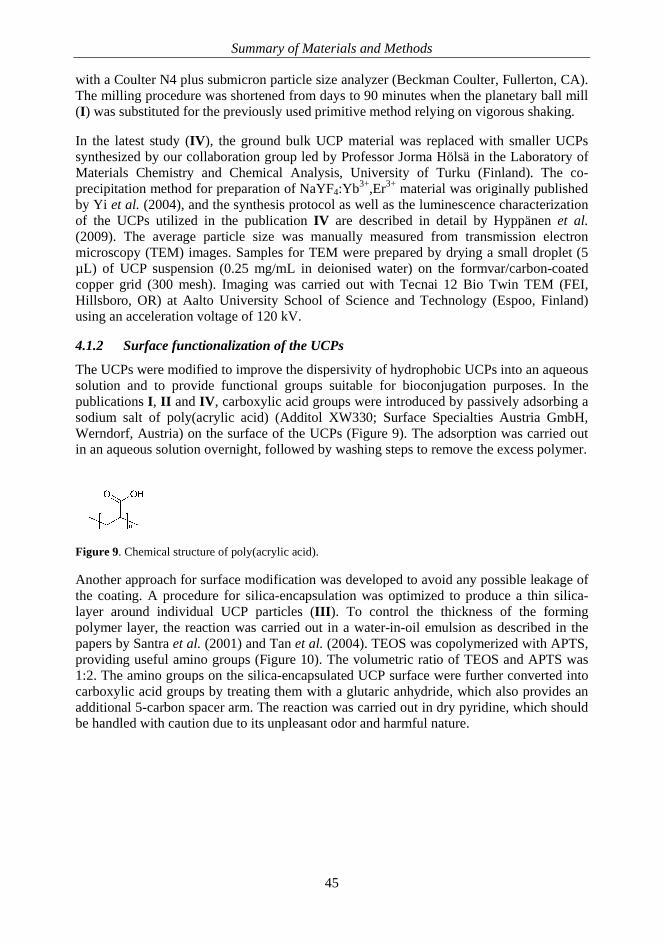
Summary of Materials and Methods
45
with a Coulter N4 plus submicron particle size analyzer (Beckman Coulter, Fullerton, CA).The milling procedure was shortened from days to 90 minutes when the planetary ball mill(I) was substituted for the previously used primitive method relying on vigorous shaking.
In the latest study (IV), the ground bulk UCP material was replaced with smaller UCPssynthesized by our collaboration group led by Professor Jorma Hölsä in the Laboratory ofMaterials Chemistry and Chemical Analysis, University of Turku (Finland). The co-precipitation method for preparation of NaYF4:Yb3+,Er3+ material was originally publishedby Yi et al. (2004), and the synthesis protocol as well as the luminescence characterizationof the UCPs utilized in the publication IV are described in detail by Hyppänen et al.(2009). The average particle size was manually measured from transmission electronmicroscopy (TEM) images. Samples for TEM were prepared by drying a small droplet (5µL) of UCP suspension (0.25 mg/mL in deionised water) on the formvar/carbon-coatedcopper grid (300 mesh). Imaging was carried out with Tecnai 12 Bio Twin TEM (FEI,Hillsboro, OR) at Aalto University School of Science and Technology (Espoo, Finland)using an acceleration voltage of 120 kV.
4.1.2 Surface functionalization of the UCPs
The UCPs were modified to improve the dispersivity of hydrophobic UCPs into an aqueoussolution and to provide functional groups suitable for bioconjugation purposes. In thepublications I, II and IV, carboxylic acid groups were introduced by passively adsorbing asodium salt of poly(acrylic acid) (Additol XW330; Surface Specialties Austria GmbH,Werndorf, Austria) on the surface of the UCPs (Figure 9). The adsorption was carried outin an aqueous solution overnight, followed by washing steps to remove the excess polymer.
Figure 9. Chemical structure of poly(acrylic acid).
Another approach for surface modification was developed to avoid any possible leakage ofthe coating. A procedure for silica-encapsulation was optimized to produce a thin silica-layer around individual UCP particles (III). To control the thickness of the formingpolymer layer, the reaction was carried out in a water-in-oil emulsion as described in thepapers by Santra et al. (2001) and Tan et al. (2004). TEOS was copolymerized with APTS,providing useful amino groups (Figure 10). The volumetric ratio of TEOS and APTS was1:2. The amino groups on the silica-encapsulated UCP surface were further converted intocarboxylic acid groups by treating them with a glutaric anhydride, which also provides anadditional 5-carbon spacer arm. The reaction was carried out in dry pyridine, which shouldbe handled with caution due to its unpleasant odor and harmful nature.
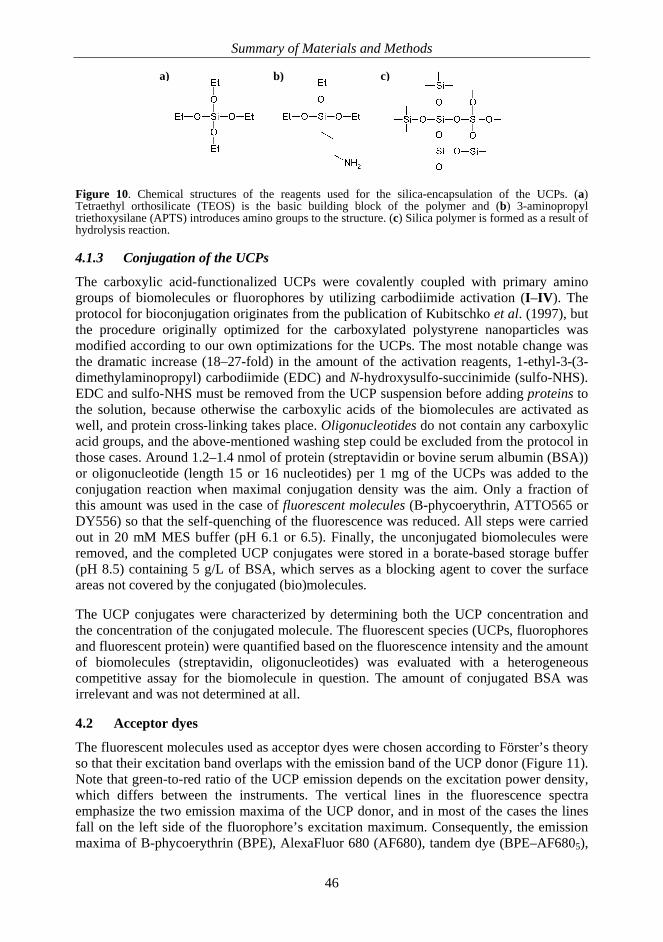
Summary of Materials and Methods
46
c)b)a)
Figure 10. Chemical structures of the reagents used for the silica-encapsulation of the UCPs. (a)Tetraethyl orthosilicate (TEOS) is the basic building block of the polymer and (b) 3-aminopropyltriethoxysilane (APTS) introduces amino groups to the structure. (c) Silica polymer is formed as a result ofhydrolysis reaction.
4.1.3 Conjugation of the UCPs
The carboxylic acid-functionalized UCPs were covalently coupled with primary aminogroups of biomolecules or fluorophores by utilizing carbodiimide activation (I–IV). Theprotocol for bioconjugation originates from the publication of Kubitschko et al. (1997), butthe procedure originally optimized for the carboxylated polystyrene nanoparticles wasmodified according to our own optimizations for the UCPs. The most notable change wasthe dramatic increase (18–27-fold) in the amount of the activation reagents, 1-ethyl-3-(3-dimethylaminopropyl) carbodiimide (EDC) and N-hydroxysulfo-succinimide (sulfo-NHS).EDC and sulfo-NHS must be removed from the UCP suspension before adding proteins tothe solution, because otherwise the carboxylic acids of the biomolecules are activated aswell, and protein cross-linking takes place. Oligonucleotides do not contain any carboxylicacid groups, and the above-mentioned washing step could be excluded from the protocol inthose cases. Around 1.2–1.4 nmol of protein (streptavidin or bovine serum albumin (BSA))or oligonucleotide (length 15 or 16 nucleotides) per 1 mg of the UCPs was added to theconjugation reaction when maximal conjugation density was the aim. Only a fraction ofthis amount was used in the case of fluorescent molecules (B-phycoerythrin, ATTO565 orDY556) so that the self-quenching of the fluorescence was reduced. All steps were carriedout in 20 mM MES buffer (pH 6.1 or 6.5). Finally, the unconjugated biomolecules wereremoved, and the completed UCP conjugates were stored in a borate-based storage buffer(pH 8.5) containing 5 g/L of BSA, which serves as a blocking agent to cover the surfaceareas not covered by the conjugated (bio)molecules.
The UCP conjugates were characterized by determining both the UCP concentration andthe concentration of the conjugated molecule. The fluorescent species (UCPs, fluorophoresand fluorescent protein) were quantified based on the fluorescence intensity and the amountof biomolecules (streptavidin, oligonucleotides) was evaluated with a heterogeneouscompetitive assay for the biomolecule in question. The amount of conjugated BSA wasirrelevant and was not determined at all.
4.2 Acceptor dyes
The fluorescent molecules used as acceptor dyes were chosen according to Förster’s theoryso that their excitation band overlaps with the emission band of the UCP donor (Figure 11).Note that green-to-red ratio of the UCP emission depends on the excitation power density,which differs between the instruments. The vertical lines in the fluorescence spectraemphasize the two emission maxima of the UCP donor, and in most of the cases the linesfall on the left side of the fluorophore’s excitation maximum. Consequently, the emissionmaxima of B-phycoerythrin (BPE), AlexaFluor 680 (AF680), tandem dye (BPE–AF6805),
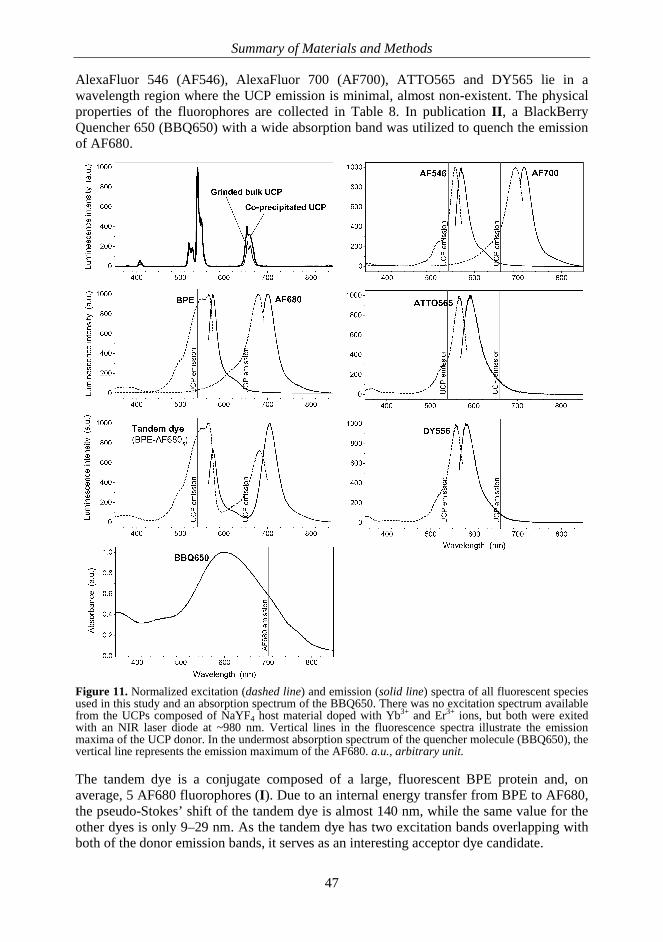
Summary of Materials and Methods
47
AlexaFluor 546 (AF546), AlexaFluor 700 (AF700), ATTO565 and DY565 lie in awavelength region where the UCP emission is minimal, almost non-existent. The physicalproperties of the fluorophores are collected in Table 8. In publication II, a BlackBerryQuencher 650 (BBQ650) with a wide absorption band was utilized to quench the emissionof AF680.
Figure 11. Normalized excitation (dashed line) and emission (solid line) spectra of all fluorescent speciesused in this study and an absorption spectrum of the BBQ650. There was no excitation spectrum availablefrom the UCPs composed of NaYF4 host material doped with Yb3+ and Er3+ ions, but both were exitedwith an NIR laser diode at ~980 nm. Vertical lines in the fluorescence spectra illustrate the emissionmaxima of the UCP donor. In the undermost absorption spectrum of the quencher molecule (BBQ650), thevertical line represents the emission maximum of the AF680. a.u., arbitrary unit.
The tandem dye is a conjugate composed of a large, fluorescent BPE protein and, onaverage, 5 AF680 fluorophores (I). Due to an internal energy transfer from BPE to AF680,the pseudo-Stokes’ shift of the tandem dye is almost 140 nm, while the same value for theother dyes is only 9–29 nm. As the tandem dye has two excitation bands overlapping withboth of the donor emission bands, it serves as an interesting acceptor dye candidate.
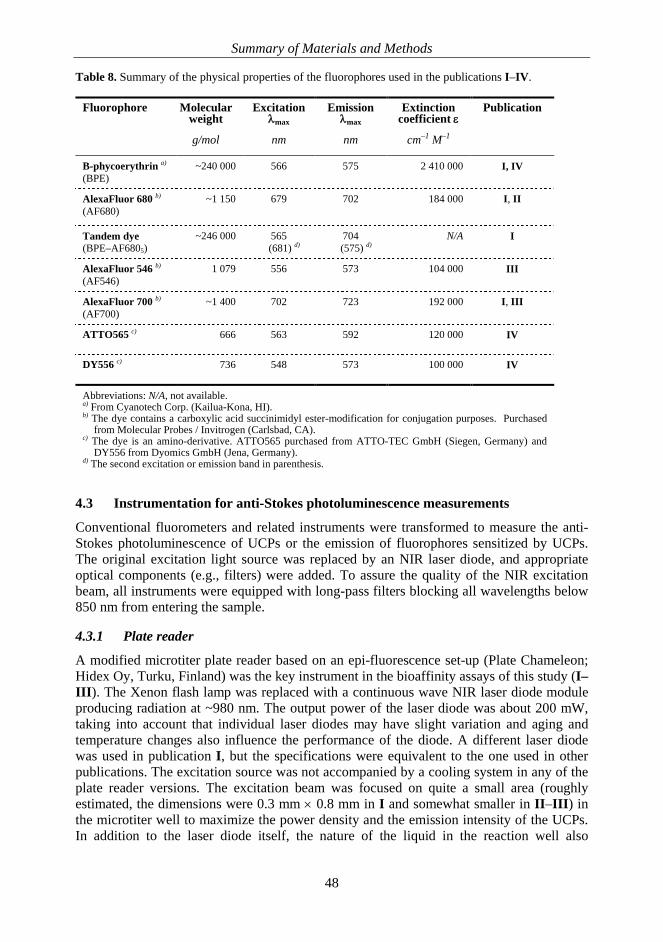
Summary of Materials and Methods
48
Table 8. Summary of the physical properties of the fluorophores used in the publications I–IV.
Fluorophore Molecularweight
g/mol
Excitationmax
nm
Emissionmax
nm
Extinctioncoefficient
cm–1 M–1
Publication
B-phycoerythrin a)
(BPE)~240 000 566 575 2 410 000 I, IV
AlexaFluor 680 b)
(AF680)~1 150 679 702 184 000 I, II
Tandem dye(BPE–AF6805)
~246 000 565 (681) d)
704 (575) d)
N/A I
AlexaFluor 546 b)
(AF546)1 079 556 573 104 000 III
AlexaFluor 700 b)
(AF700)~1 400 702 723 192 000 I, III
ATTO565 c) 666 563 592 120 000 IV
DY556 c) 736 548 573 100 000 IV
Abbreviations: N/A, not available.a) From Cyanotech Corp. (Kailua-Kona, HI).b) The dye contains a carboxylic acid succinimidyl ester-modification for conjugation purposes. Purchased
from Molecular Probes / Invitrogen (Carlsbad, CA).c) The dye is an amino-derivative. ATTO565 purchased from ATTO-TEC GmbH (Siegen, Germany) and
DY556 from Dyomics GmbH (Jena, Germany).d) The second excitation or emission band in parenthesis.
4.3 Instrumentation for anti-Stokes photoluminescence measurements
Conventional fluorometers and related instruments were transformed to measure the anti-Stokes photoluminescence of UCPs or the emission of fluorophores sensitized by UCPs.The original excitation light source was replaced by an NIR laser diode, and appropriateoptical components (e.g., filters) were added. To assure the quality of the NIR excitationbeam, all instruments were equipped with long-pass filters blocking all wavelengths below850 nm from entering the sample.
4.3.1 Plate reader
A modified microtiter plate reader based on an epi-fluorescence set-up (Plate Chameleon;Hidex Oy, Turku, Finland) was the key instrument in the bioaffinity assays of this study (I–III). The Xenon flash lamp was replaced with a continuous wave NIR laser diode moduleproducing radiation at ~980 nm. The output power of the laser diode was about 200 mW,taking into account that individual laser diodes may have slight variation and aging andtemperature changes also influence the performance of the diode. A different laser diodewas used in publication I, but the specifications were equivalent to the one used in otherpublications. The excitation source was not accompanied by a cooling system in any of theplate reader versions. The excitation beam was focused on quite a small area (roughlyestimated, the dimensions were 0.3 mm 0.8 mm in I and somewhat smaller in II–III) inthe microtiter well to maximize the power density and the emission intensity of the UCPs.In addition to the laser diode itself, the nature of the liquid in the reaction well also
Summary of Materials and Methods
49
certainly has some effects on the excitation power density (e.g., scattering of the excitationradiation due to blood cells). The emission light was collected for 2000 ms with a R4632PMT (Hamamatsu Photonics, Hamamatsu City, Japan), which is also sensitive to red lightproduced by certain acceptor fluorophores used in this study. The first version of themodified plate reader has been described in a paper by Soukka et al. (2005). Sometechnological evolution related to component positioning, optics and PMT has taken placesubsequently, but the platform has remained the same.
Optical filters play an especially important role in RET-based assays as well as inmultiparametric assays, in which emissions from different fluorescent species must beseparated from each other. A band-pass filter of 600/40 nm (center wavelength 600 nm,band half-width 40 nm) was used for measuring the sensitized emission of BPE andAF546, and the 740/40-nm band-pass filter was used for the tandem dye (BPE–AF6805),AF680 and AF700. The emission intensity of the UCPs was also monitored either toconfirm the equal amount of the donor in all reaction wells (II–III) or to normalize theintensity of sensitized emission of the acceptor in an early version of the modified PlateChameleon (I), where signals were fluctuating for some reason (e.g., due to variation inexcitation intensity) more than in the later versions. The green UCP emission was selectedwith an emission band-pass filter of 535/50 nm and the red UCP emission with a filter of660/25 nm or 665/10 nm. Due to the highly intense anti-Stokes photoluminescence of theUCPs, absorptive neutral density filters with optical densities of 1.0 or 2.0 (i.e., averagetransmittance 10% or 1%) were used to limit the number of photons entering the PMT. Allthe selective emission band-pass filters were combined with a filter set preventing theexcitation radiation from entering the PMT.
4.3.2 Fluorescence spectrophotometer
The emission spectra of the UCPs could be measured by modifying a Varian Cary Eclipsefluorescence spectrophotometer (Varian Scientific Instruments, Mulgrave, Australia). Anexternal continuous wave laser diode module, which provides about 200 mW output powerat ~980 nm, was added in the wide sample compartment of the instrument, while the unitcomprising the original Xenon flash lamp was closed with an additional wall. The emissionwas recorded with a standard red-sensitive PMT (up to 900 nm). Measurements werecarried out in a quartz fluorescence macro cell (inner dimensions 10 10 mm; Hellma,Müllheim, Germany).
Due to the lack of a good NIR excitation source with selectable wavelengths, themeasurement of UCP excitation spectra was not possible, but from the literature it isknown that the Yb3+ ion absorbs at around 980 nm (DeLoach et al., 1993).
4.3.3 Frequency-domain luminometer
The luminescence lifetimes of UCPs were measured with an in-laboratory-made modularfrequency-domain (FD) luminometer. The FD technique is a more efficient option fordeconvolution of overlapping decay processes than the time-domain measurements, and itis especially suitable for lanthanide labels (Hyppänen et al., 2010). The instrument isintroduced in greater detail in publication IV. An NIR laser diode providing maximally1200 mW power at 976 nm served as an excitation source. The modulation degree of thelaser diode current was 10%. The sensitized emission of the fluorophores or the anti-Stokesemission of the UCP was collected by using a 600/40-nm or 544/10-nm band-pass filter,
Summary of Materials and Methods
50
respectively. Both emission filters were combined with a short-pass filter (goodtransmission at visible wavelengths) to block the NIR radiation. Aqueous samples wereplaced in short-cut quartz NMR tubes for measurements. A computer program written inVisual Fortran 90 equipped with the DISLIN graphics package was used to fit the collecteddata for analyzing the luminescence lifetimes.
4.4 Homogeneous assays based on upconversion resonance energy transfer
Specifications of all the three different homogeneous assays (I–III) are summarized inTable 9. All reactions were carried out in black half-area microtiter wells (Corning Inc,Corning, NY) covered with a plastic plate closure tape, and all dilutions were prepared inthe assay buffer (50 mM Tris-HCl, pH 7.8, 9 g/L NaCl, 0.5 g/L NaN3, 5 g/L BSA, 0.1 g/LTween 40, 0.5 g/L bovine -globulin, and 20 µM diethylenetriamine pentaacetic acid;Innotrac Buffer or Kaivogen Buffer; Innotrac Diagnostics Oy or Kaivogen Oy, Turku,Finland). The plates were shaken during the incubations with a speed of 900 rpm, and theincubation temperature was +23 C if not otherwise stated.
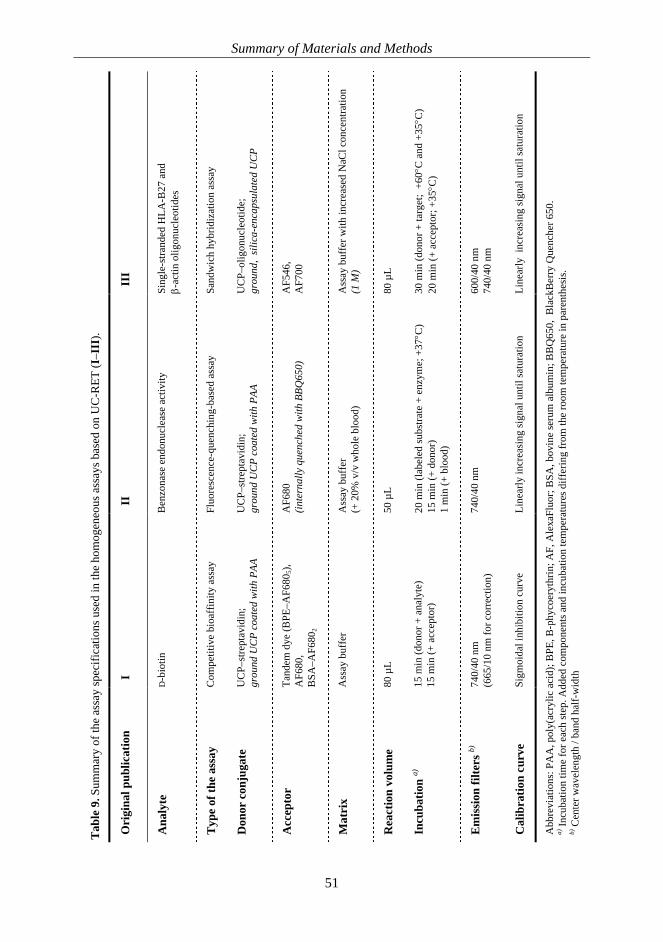
Summary of Materials and Methods
51
III
Sing
le-s
trand
ed H
LA-B
27 a
nd-a
ctin
olig
onuc
leot
ides
Sand
wic
h hy
brid
izat
ion
assa
y
UC
P–ol
igon
ucle
otid
e;gr
ound
, si
lica-
enca
psul
ated
UC
P
AF5
46,
AF7
00
Ass
ay b
uffe
r with
incr
ease
d N
aCl c
once
ntra
tion
(1 M
)
80 µ
L
30 m
in (d
onor
+ ta
rget
; +6
0C
and
+35
C)
20 m
in (+
acc
epto
r; +3
5C
)
600/
40 n
m74
0/40
nm
Line
arly
inc
reas
ing
sign
al u
ntil
satu
ratio
n
II
Ben
zona
se e
ndon
ucle
ase
activ
ity
Fluo
resc
ence
-que
nchi
ng-b
ased
ass
ay
UC
P–st
rept
avid
in;
grou
nd U
CP
coat
ed w
ith P
AA
AF6
80(in
tern
ally
que
nche
d w
ith B
BQ65
0)
Ass
ay b
uffe
r(+
20%
v/v
who
le b
lood
)
50 µ
L
20 m
in (l
abel
ed su
bstra
te +
enz
yme;
+37
C)
15 m
in (+
don
or)
1 m
in (+
blo
od)
740/
40 n
m
Line
arly
incr
easi
ng si
gnal
unt
il sa
tura
tion
I
D-b
iotin
Com
petit
ive
bioa
ffin
ity a
ssay
UC
P–st
rept
avid
in;
grou
nd U
CP
coat
ed w
ith P
AA
Tand
em d
ye (B
PE–A
F680
5),A
F680
,B
SA–A
F680
2
Ass
ay b
uffe
r
80 µ
L
15 m
in (d
onor
+ a
naly
te)
15 m
in (+
acc
epto
r)
740/
40 n
m(6
65/1
0 nm
for c
orre
ctio
n)
Sigm
oida
l inh
ibiti
on c
urve
Ori
gina
l pub
licat
ion
Ana
lyte
Typ
e of
the
assa
y
Don
or c
onju
gate
Acc
epto
r
Mat
rix
Rea
ctio
n vo
lum
e
Incu
batio
na)
Em
issi
on fi
lters
b)
Cal
ibra
tion
curv
e
Abb
revi
atio
ns: P
AA
, pol
y(ac
rylic
aci
d); B
PE, B
-phy
coer
ythr
in; A
F, A
lexa
Fluo
r; B
SA, b
ovin
e se
rum
alb
umin
; BB
Q65
0, B
lack
Ber
ry Q
uenc
her 6
50.
a)In
cuba
tion
time
for e
ach
step
. Add
ed c
ompo
nent
s and
incu
batio
n te
mpe
ratu
res d
iffer
ing
from
the
room
tem
pera
ture
in p
aren
thes
is.
b) C
ente
r wav
elen
gth
/ ban
d ha
lf-w
idth
Tab
le 9
. Sum
mar
y of
the
assa
y sp
ecifi
catio
ns u
sed
in th
e ho
mog
eneo
us a
ssay
s bas
ed o
n U
C-R
ET (I
–III
).
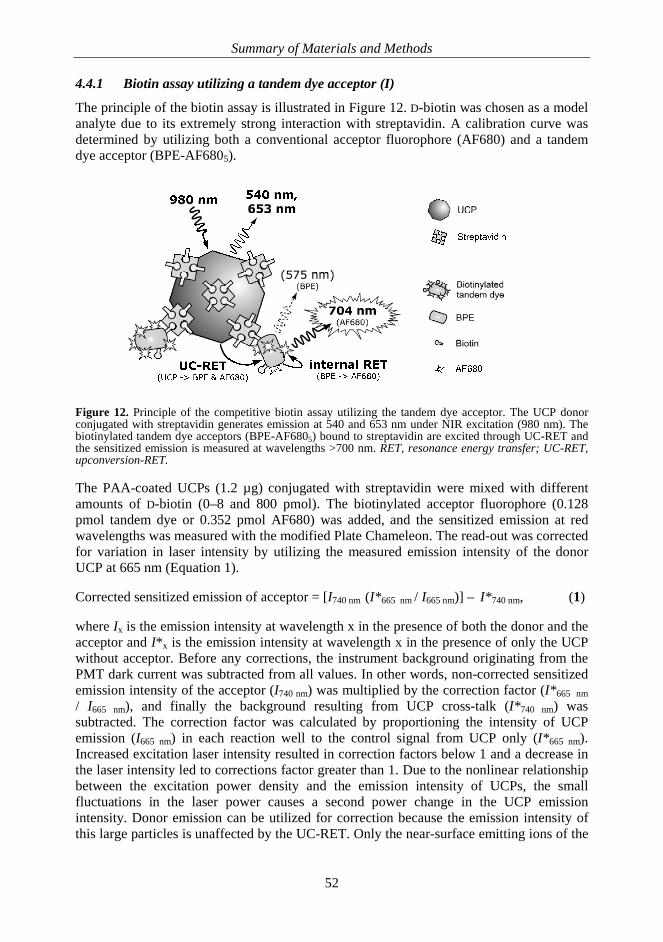
Summary of Materials and Methods
52
4.4.1 Biotin assay utilizing a tandem dye acceptor (I)
The principle of the biotin assay is illustrated in Figure 12. D-biotin was chosen as a modelanalyte due to its extremely strong interaction with streptavidin. A calibration curve wasdetermined by utilizing both a conventional acceptor fluorophore (AF680) and a tandemdye acceptor (BPE-AF6805).
Figure 12. Principle of the competitive biotin assay utilizing the tandem dye acceptor. The UCP donorconjugated with streptavidin generates emission at 540 and 653 nm under NIR excitation (980 nm). Thebiotinylated tandem dye acceptors (BPE-AF6805) bound to streptavidin are excited through UC-RET andthe sensitized emission is measured at wavelengths >700 nm. RET, resonance energy transfer; UC-RET,upconversion-RET.
The PAA-coated UCPs (1.2 µg) conjugated with streptavidin were mixed with differentamounts of D-biotin (0–8 and 800 pmol). The biotinylated acceptor fluorophore (0.128pmol tandem dye or 0.352 pmol AF680) was added, and the sensitized emission at redwavelengths was measured with the modified Plate Chameleon. The read-out was correctedfor variation in laser intensity by utilizing the measured emission intensity of the donorUCP at 665 nm (Equation 1).
Corrected sensitized emission of acceptor = [I740 nm (I*665 nm / I665 nm)] – I*740 nm, (1)
where Ix is the emission intensity at wavelength x in the presence of both the donor and theacceptor and I*x is the emission intensity at wavelength x in the presence of only the UCPwithout acceptor. Before any corrections, the instrument background originating from thePMT dark current was subtracted from all values. In other words, non-corrected sensitizedemission intensity of the acceptor (I740 nm) was multiplied by the correction factor (I*665 nm/ I665 nm), and finally the background resulting from UCP cross-talk (I*740 nm) wassubtracted. The correction factor was calculated by proportioning the intensity of UCPemission (I665 nm) in each reaction well to the control signal from UCP only (I*665 nm).Increased excitation laser intensity resulted in correction factors below 1 and a decrease inthe laser intensity led to corrections factor greater than 1. Due to the nonlinear relationshipbetween the excitation power density and the emission intensity of UCPs, the smallfluctuations in the laser power causes a second power change in the UCP emissionintensity. Donor emission can be utilized for correction because the emission intensity ofthis large particles is unaffected by the UC-RET. Only the near-surface emitting ions of the
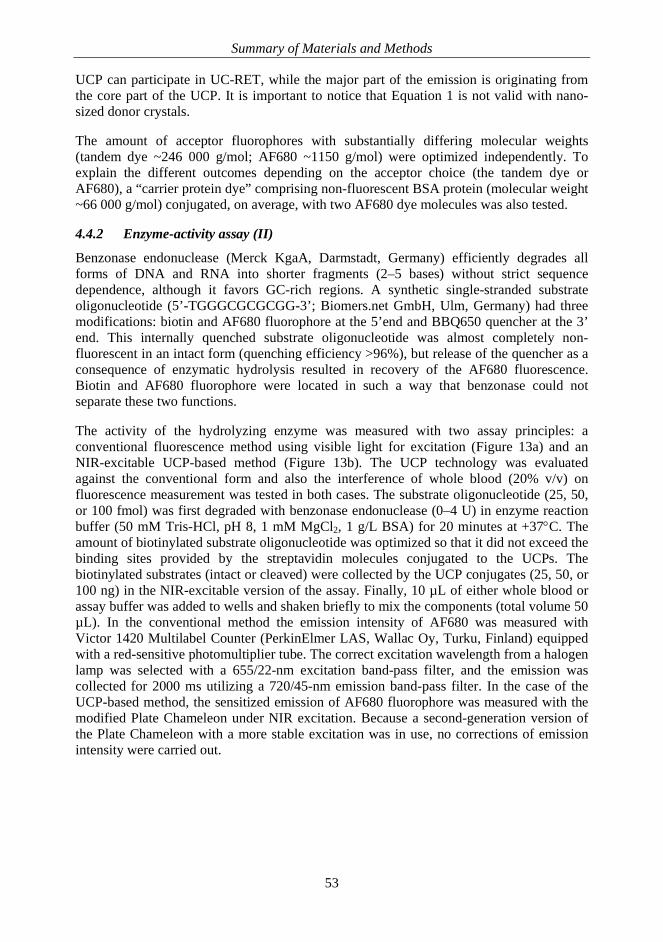
Summary of Materials and Methods
53
UCP can participate in UC-RET, while the major part of the emission is originating fromthe core part of the UCP. It is important to notice that Equation 1 is not valid with nano-sized donor crystals.
The amount of acceptor fluorophores with substantially differing molecular weights(tandem dye ~246 000 g/mol; AF680 ~1150 g/mol) were optimized independently. Toexplain the different outcomes depending on the acceptor choice (the tandem dye orAF680), a “carrier protein dye” comprising non-fluorescent BSA protein (molecular weight~66 000 g/mol) conjugated, on average, with two AF680 dye molecules was also tested.
4.4.2 Enzyme-activity assay (II)
Benzonase endonuclease (Merck KgaA, Darmstadt, Germany) efficiently degrades allforms of DNA and RNA into shorter fragments (2–5 bases) without strict sequencedependence, although it favors GC-rich regions. A synthetic single-stranded substrateoligonucleotide (5’-TGGGCGCGCGG-3’; Biomers.net GmbH, Ulm, Germany) had threemodifications: biotin and AF680 fluorophore at the 5’end and BBQ650 quencher at the 3’end. This internally quenched substrate oligonucleotide was almost completely non-fluorescent in an intact form (quenching efficiency >96%), but release of the quencher as aconsequence of enzymatic hydrolysis resulted in recovery of the AF680 fluorescence.Biotin and AF680 fluorophore were located in such a way that benzonase could notseparate these two functions.
The activity of the hydrolyzing enzyme was measured with two assay principles: aconventional fluorescence method using visible light for excitation (Figure 13a) and anNIR-excitable UCP-based method (Figure 13b). The UCP technology was evaluatedagainst the conventional form and also the interference of whole blood (20% v/v) onfluorescence measurement was tested in both cases. The substrate oligonucleotide (25, 50,or 100 fmol) was first degraded with benzonase endonuclease (0–4 U) in enzyme reactionbuffer (50 mM Tris-HCl, pH 8, 1 mM MgCl2, 1 g/L BSA) for 20 minutes at +37 C. Theamount of biotinylated substrate oligonucleotide was optimized so that it did not exceed thebinding sites provided by the streptavidin molecules conjugated to the UCPs. Thebiotinylated substrates (intact or cleaved) were collected by the UCP conjugates (25, 50, or100 ng) in the NIR-excitable version of the assay. Finally, 10 µL of either whole blood orassay buffer was added to wells and shaken briefly to mix the components (total volume 50µL). In the conventional method the emission intensity of AF680 was measured withVictor 1420 Multilabel Counter (PerkinElmer LAS, Wallac Oy, Turku, Finland) equippedwith a red-sensitive photomultiplier tube. The correct excitation wavelength from a halogenlamp was selected with a 655/22-nm excitation band-pass filter, and the emission wascollected for 2000 ms utilizing a 720/45-nm emission band-pass filter. In the case of theUCP-based method, the sensitized emission of AF680 fluorophore was measured with themodified Plate Chameleon under NIR excitation. Because a second-generation version ofthe Plate Chameleon with a more stable excitation was in use, no corrections of emissionintensity were carried out.
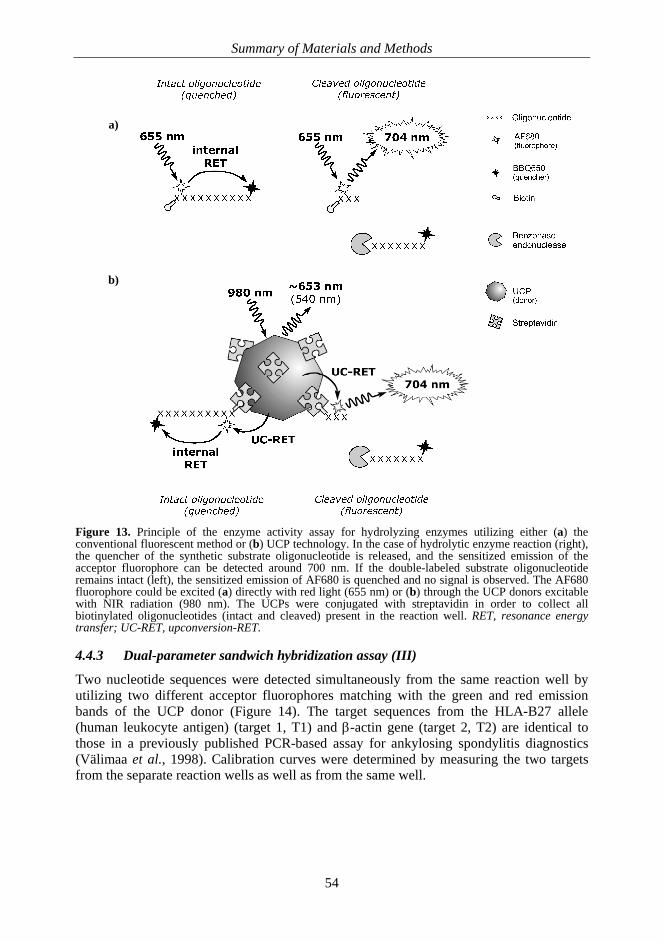
Summary of Materials and Methods
54
b)
a)
Figure 13. Principle of the enzyme activity assay for hydrolyzing enzymes utilizing either (a) theconventional fluorescent method or (b) UCP technology. In the case of hydrolytic enzyme reaction (right),the quencher of the synthetic substrate oligonucleotide is released, and the sensitized emission of theacceptor fluorophore can be detected around 700 nm. If the double-labeled substrate oligonucleotideremains intact (left), the sensitized emission of AF680 is quenched and no signal is observed. The AF680fluorophore could be excited (a) directly with red light (655 nm) or (b) through the UCP donors excitablewith NIR radiation (980 nm). The UCPs were conjugated with streptavidin in order to collect allbiotinylated oligonucleotides (intact and cleaved) present in the reaction well. RET, resonance energytransfer; UC-RET, upconversion-RET.
4.4.3 Dual-parameter sandwich hybridization assay (III)
Two nucleotide sequences were detected simultaneously from the same reaction well byutilizing two different acceptor fluorophores matching with the green and red emissionbands of the UCP donor (Figure 14). The target sequences from the HLA-B27 allele(human leukocyte antigen) (target 1, T1) and -actin gene (target 2, T2) are identical tothose in a previously published PCR-based assay for ankylosing spondylitis diagnostics(Välimaa et al., 1998). Calibration curves were determined by measuring the two targetsfrom the separate reaction wells as well as from the same well.
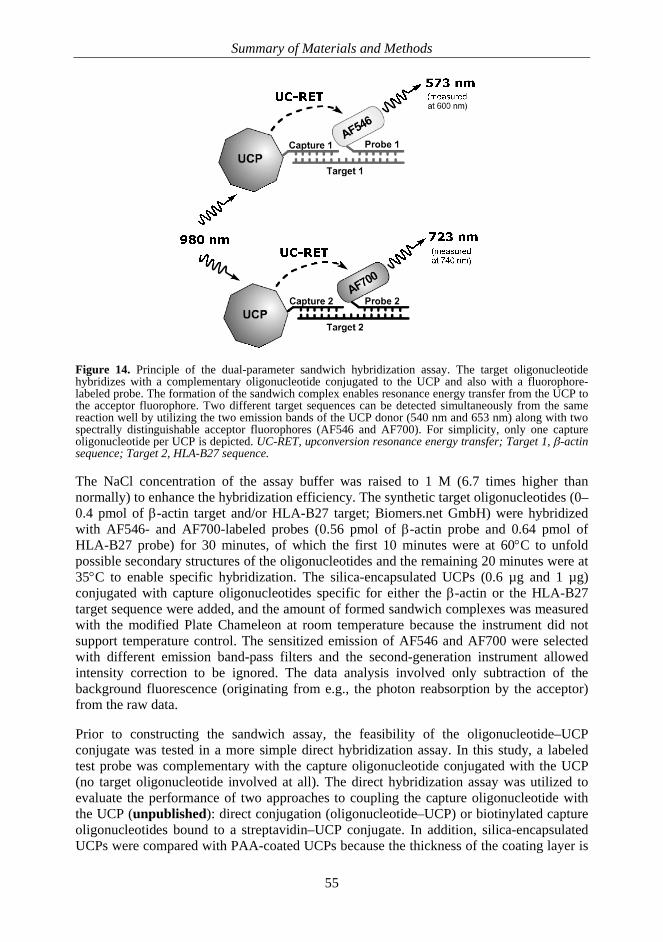
Summary of Materials and Methods
55
Figure 14. Principle of the dual-parameter sandwich hybridization assay. The target oligonucleotidehybridizes with a complementary oligonucleotide conjugated to the UCP and also with a fluorophore-labeled probe. The formation of the sandwich complex enables resonance energy transfer from the UCP tothe acceptor fluorophore. Two different target sequences can be detected simultaneously from the samereaction well by utilizing the two emission bands of the UCP donor (540 nm and 653 nm) along with twospectrally distinguishable acceptor fluorophores (AF546 and AF700). For simplicity, only one captureoligonucleotide per UCP is depicted. UC-RET, upconversion resonance energy transfer; Target 1, -actinsequence; Target 2, HLA-B27 sequence.
The NaCl concentration of the assay buffer was raised to 1 M (6.7 times higher thannormally) to enhance the hybridization efficiency. The synthetic target oligonucleotides (0–0.4 pmol of -actin target and/or HLA-B27 target; Biomers.net GmbH) were hybridizedwith AF546- and AF700-labeled probes (0.56 pmol of -actin probe and 0.64 pmol ofHLA-B27 probe) for 30 minutes, of which the first 10 minutes were at 60 C to unfoldpossible secondary structures of the oligonucleotides and the remaining 20 minutes were at35 C to enable specific hybridization. The silica-encapsulated UCPs (0.6 µg and 1 µg)conjugated with capture oligonucleotides specific for either the -actin or the HLA-B27target sequence were added, and the amount of formed sandwich complexes was measuredwith the modified Plate Chameleon at room temperature because the instrument did notsupport temperature control. The sensitized emission of AF546 and AF700 were selectedwith different emission band-pass filters and the second-generation instrument allowedintensity correction to be ignored. The data analysis involved only subtraction of thebackground fluorescence (originating from e.g., the photon reabsorption by the acceptor)from the raw data.
Prior to constructing the sandwich assay, the feasibility of the oligonucleotide–UCPconjugate was tested in a more simple direct hybridization assay. In this study, a labeledtest probe was complementary with the capture oligonucleotide conjugated with the UCP(no target oligonucleotide involved at all). The direct hybridization assay was utilized toevaluate the performance of two approaches to coupling the capture oligonucleotide withthe UCP (unpublished): direct conjugation (oligonucleotide–UCP) or biotinylated captureoligonucleotides bound to a streptavidin–UCP conjugate. In addition, silica-encapsulatedUCPs were compared with PAA-coated UCPs because the thickness of the coating layer is
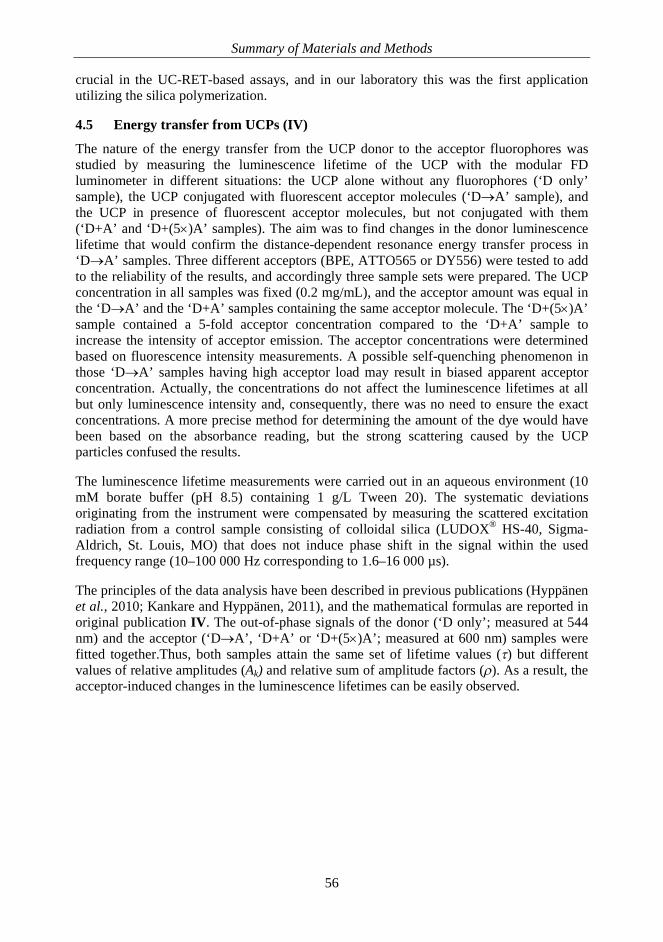
Summary of Materials and Methods
56
crucial in the UC-RET-based assays, and in our laboratory this was the first applicationutilizing the silica polymerization.
4.5 Energy transfer from UCPs (IV)
The nature of the energy transfer from the UCP donor to the acceptor fluorophores wasstudied by measuring the luminescence lifetime of the UCP with the modular FDluminometer in different situations: the UCP alone without any fluorophores (‘D only’sample), the UCP conjugated with fluorescent acceptor molecules (‘D A’ sample), andthe UCP in presence of fluorescent acceptor molecules, but not conjugated with them(‘D+A’ and ‘D+(5 )A’ samples). The aim was to find changes in the donor luminescencelifetime that would confirm the distance-dependent resonance energy transfer process in‘D A’ samples. Three different acceptors (BPE, ATTO565 or DY556) were tested to addto the reliability of the results, and accordingly three sample sets were prepared. The UCPconcentration in all samples was fixed (0.2 mg/mL), and the acceptor amount was equal inthe ‘D A’ and the ‘D+A’ samples containing the same acceptor molecule. The ‘D+(5 )A’sample contained a 5-fold acceptor concentration compared to the ‘D+A’ sample toincrease the intensity of acceptor emission. The acceptor concentrations were determinedbased on fluorescence intensity measurements. A possible self-quenching phenomenon inthose ‘D A’ samples having high acceptor load may result in biased apparent acceptorconcentration. Actually, the concentrations do not affect the luminescence lifetimes at allbut only luminescence intensity and, consequently, there was no need to ensure the exactconcentrations. A more precise method for determining the amount of the dye would havebeen based on the absorbance reading, but the strong scattering caused by the UCPparticles confused the results.
The luminescence lifetime measurements were carried out in an aqueous environment (10mM borate buffer (pH 8.5) containing 1 g/L Tween 20). The systematic deviationsoriginating from the instrument were compensated by measuring the scattered excitationradiation from a control sample consisting of colloidal silica (LUDOX® HS-40, Sigma-Aldrich, St. Louis, MO) that does not induce phase shift in the signal within the usedfrequency range (10–100 000 Hz corresponding to 1.6–16 000 µs).
The principles of the data analysis have been described in previous publications (Hyppänenet al., 2010; Kankare and Hyppänen, 2011), and the mathematical formulas are reported inoriginal publication IV. The out-of-phase signals of the donor (‘D only’; measured at 544nm) and the acceptor (‘D A’, ‘D+A’ or ‘D+(5 )A’; measured at 600 nm) samples werefitted together.Thus, both samples attain the same set of lifetime values ( ) but differentvalues of relative amplitudes (Ak) and relative sum of amplitude factors ( ). As a result, theacceptor-induced changes in the luminescence lifetimes can be easily observed.
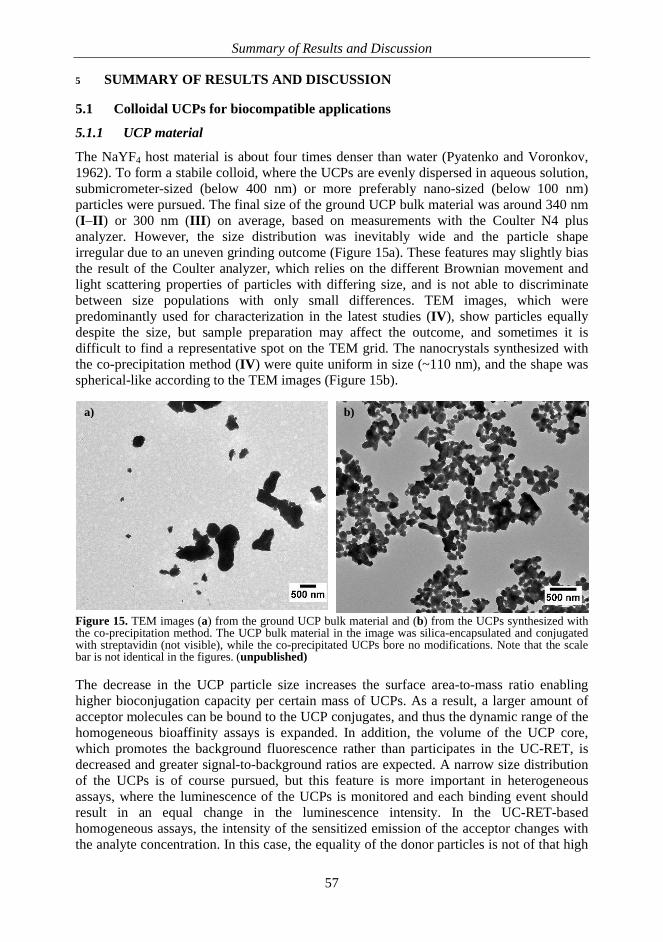
Summary of Results and Discussion
57
b)a)
5 SUMMARY OF RESULTS AND DISCUSSION
5.1 Colloidal UCPs for biocompatible applications
5.1.1 UCP material
The NaYF4 host material is about four times denser than water (Pyatenko and Voronkov,1962). To form a stabile colloid, where the UCPs are evenly dispersed in aqueous solution,submicrometer-sized (below 400 nm) or more preferably nano-sized (below 100 nm)particles were pursued. The final size of the ground UCP bulk material was around 340 nm(I–II) or 300 nm (III) on average, based on measurements with the Coulter N4 plusanalyzer. However, the size distribution was inevitably wide and the particle shapeirregular due to an uneven grinding outcome (Figure 15a). These features may slightly biasthe result of the Coulter analyzer, which relies on the different Brownian movement andlight scattering properties of particles with differing size, and is not able to discriminatebetween size populations with only small differences. TEM images, which werepredominantly used for characterization in the latest studies (IV), show particles equallydespite the size, but sample preparation may affect the outcome, and sometimes it isdifficult to find a representative spot on the TEM grid. The nanocrystals synthesized withthe co-precipitation method (IV) were quite uniform in size (~110 nm), and the shape wasspherical-like according to the TEM images (Figure 15b).
Figure 15. TEM images (a) from the ground UCP bulk material and (b) from the UCPs synthesized withthe co-precipitation method. The UCP bulk material in the image was silica-encapsulated and conjugatedwith streptavidin (not visible), while the co-precipitated UCPs bore no modifications. Note that the scalebar is not identical in the figures. (unpublished)
The decrease in the UCP particle size increases the surface area-to-mass ratio enablinghigher bioconjugation capacity per certain mass of UCPs. As a result, a larger amount ofacceptor molecules can be bound to the UCP conjugates, and thus the dynamic range of thehomogeneous bioaffinity assays is expanded. In addition, the volume of the UCP core,which promotes the background fluorescence rather than participates in the UC-RET, isdecreased and greater signal-to-background ratios are expected. A narrow size distributionof the UCPs is of course pursued, but this feature is more important in heterogeneousassays, where the luminescence of the UCPs is monitored and each binding event shouldresult in an equal change in the luminescence intensity. In the UC-RET-basedhomogeneous assays, the intensity of the sensitized emission of the acceptor changes withthe analyte concentration. In this case, the equality of the donor particles is not of that high
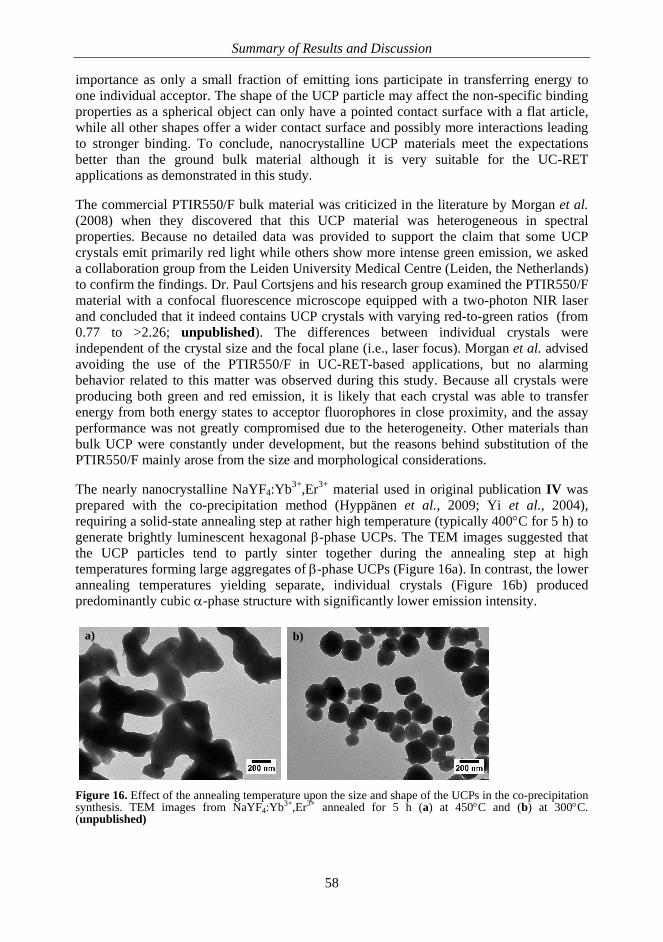
Summary of Results and Discussion
58
b)a)
importance as only a small fraction of emitting ions participate in transferring energy toone individual acceptor. The shape of the UCP particle may affect the non-specific bindingproperties as a spherical object can only have a pointed contact surface with a flat article,while all other shapes offer a wider contact surface and possibly more interactions leadingto stronger binding. To conclude, nanocrystalline UCP materials meet the expectationsbetter than the ground bulk material although it is very suitable for the UC-RETapplications as demonstrated in this study.
The commercial PTIR550/F bulk material was criticized in the literature by Morgan et al.(2008) when they discovered that this UCP material was heterogeneous in spectralproperties. Because no detailed data was provided to support the claim that some UCPcrystals emit primarily red light while others show more intense green emission, we askeda collaboration group from the Leiden University Medical Centre (Leiden, the Netherlands)to confirm the findings. Dr. Paul Cortsjens and his research group examined the PTIR550/Fmaterial with a confocal fluorescence microscope equipped with a two-photon NIR laserand concluded that it indeed contains UCP crystals with varying red-to-green ratios (from0.77 to >2.26; unpublished). The differences between individual crystals wereindependent of the crystal size and the focal plane (i.e., laser focus). Morgan et al. advisedavoiding the use of the PTIR550/F in UC-RET-based applications, but no alarmingbehavior related to this matter was observed during this study. Because all crystals wereproducing both green and red emission, it is likely that each crystal was able to transferenergy from both energy states to acceptor fluorophores in close proximity, and the assayperformance was not greatly compromised due to the heterogeneity. Other materials thanbulk UCP were constantly under development, but the reasons behind substitution of thePTIR550/F mainly arose from the size and morphological considerations.
The nearly nanocrystalline NaYF4:Yb3+,Er3+ material used in original publication IV wasprepared with the co-precipitation method (Hyppänen et al., 2009; Yi et al., 2004),requiring a solid-state annealing step at rather high temperature (typically 400 C for 5 h) togenerate brightly luminescent hexagonal -phase UCPs. The TEM images suggested thatthe UCP particles tend to partly sinter together during the annealing step at hightemperatures forming large aggregates of -phase UCPs (Figure 16a). In contrast, the lowerannealing temperatures yielding separate, individual crystals (Figure 16b) producedpredominantly cubic -phase structure with significantly lower emission intensity.
Figure 16. Effect of the annealing temperature upon the size and shape of the UCPs in the co-precipitationsynthesis. TEM images from NaYF4:Yb3+,Er3+ annealed for 5 h (a) at 450 C and (b) at 300 C.(unpublished)
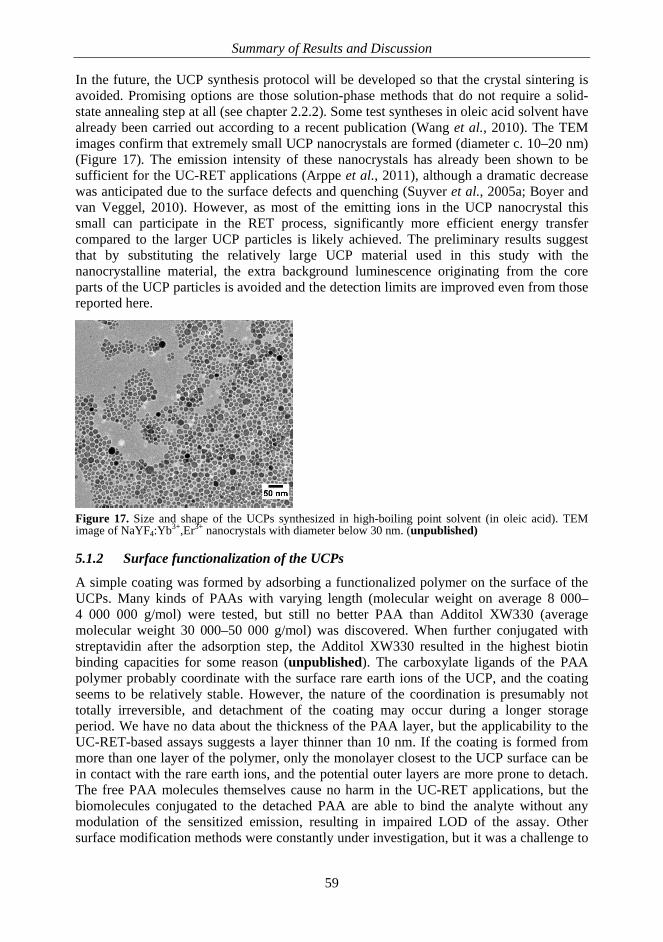
Summary of Results and Discussion
59
In the future, the UCP synthesis protocol will be developed so that the crystal sintering isavoided. Promising options are those solution-phase methods that do not require a solid-state annealing step at all (see chapter 2.2.2). Some test syntheses in oleic acid solvent havealready been carried out according to a recent publication (Wang et al., 2010). The TEMimages confirm that extremely small UCP nanocrystals are formed (diameter c. 10–20 nm)(Figure 17). The emission intensity of these nanocrystals has already been shown to besufficient for the UC-RET applications (Arppe et al., 2011), although a dramatic decreasewas anticipated due to the surface defects and quenching (Suyver et al., 2005a; Boyer andvan Veggel, 2010). However, as most of the emitting ions in the UCP nanocrystal thissmall can participate in the RET process, significantly more efficient energy transfercompared to the larger UCP particles is likely achieved. The preliminary results suggestthat by substituting the relatively large UCP material used in this study with thenanocrystalline material, the extra background luminescence originating from the coreparts of the UCP particles is avoided and the detection limits are improved even from thosereported here.
Figure 17. Size and shape of the UCPs synthesized in high-boiling point solvent (in oleic acid). TEMimage of NaYF4:Yb3+,Er3+ nanocrystals with diameter below 30 nm. (unpublished)
5.1.2 Surface functionalization of the UCPs
A simple coating was formed by adsorbing a functionalized polymer on the surface of theUCPs. Many kinds of PAAs with varying length (molecular weight on average 8 000–4 000 000 g/mol) were tested, but still no better PAA than Additol XW330 (averagemolecular weight 30 000–50 000 g/mol) was discovered. When further conjugated withstreptavidin after the adsorption step, the Additol XW330 resulted in the highest biotinbinding capacities for some reason (unpublished). The carboxylate ligands of the PAApolymer probably coordinate with the surface rare earth ions of the UCP, and the coatingseems to be relatively stable. However, the nature of the coordination is presumably nottotally irreversible, and detachment of the coating may occur during a longer storageperiod. We have no data about the thickness of the PAA layer, but the applicability to theUC-RET-based assays suggests a layer thinner than 10 nm. If the coating is formed frommore than one layer of the polymer, only the monolayer closest to the UCP surface can bein contact with the rare earth ions, and the potential outer layers are more prone to detach.The free PAA molecules themselves cause no harm in the UC-RET applications, but thebiomolecules conjugated to the detached PAA are able to bind the analyte without anymodulation of the sensitized emission, resulting in impaired LOD of the assay. Othersurface modification methods were constantly under investigation, but it was a challenge to
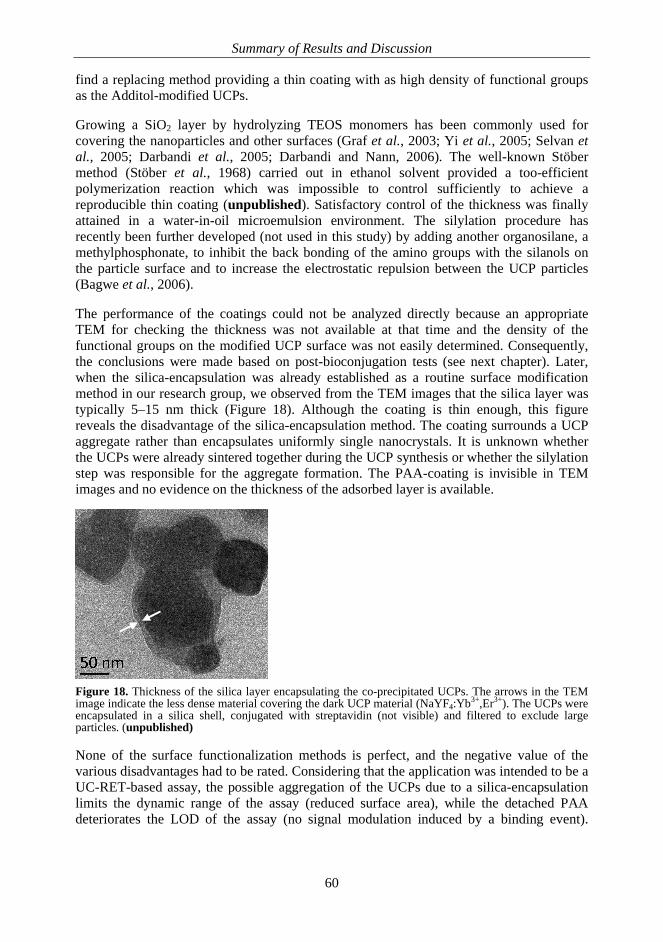
Summary of Results and Discussion
60
find a replacing method providing a thin coating with as high density of functional groupsas the Additol-modified UCPs.
Growing a SiO2 layer by hydrolyzing TEOS monomers has been commonly used forcovering the nanoparticles and other surfaces (Graf et al., 2003; Yi et al., 2005; Selvan etal., 2005; Darbandi et al., 2005; Darbandi and Nann, 2006). The well-known Stöbermethod (Stöber et al., 1968) carried out in ethanol solvent provided a too-efficientpolymerization reaction which was impossible to control sufficiently to achieve areproducible thin coating (unpublished). Satisfactory control of the thickness was finallyattained in a water-in-oil microemulsion environment. The silylation procedure hasrecently been further developed (not used in this study) by adding another organosilane, amethylphosphonate, to inhibit the back bonding of the amino groups with the silanols onthe particle surface and to increase the electrostatic repulsion between the UCP particles(Bagwe et al., 2006).
The performance of the coatings could not be analyzed directly because an appropriateTEM for checking the thickness was not available at that time and the density of thefunctional groups on the modified UCP surface was not easily determined. Consequently,the conclusions were made based on post-bioconjugation tests (see next chapter). Later,when the silica-encapsulation was already established as a routine surface modificationmethod in our research group, we observed from the TEM images that the silica layer wastypically 5–15 nm thick (Figure 18). Although the coating is thin enough, this figurereveals the disadvantage of the silica-encapsulation method. The coating surrounds a UCPaggregate rather than encapsulates uniformly single nanocrystals. It is unknown whetherthe UCPs were already sintered together during the UCP synthesis or whether the silylationstep was responsible for the aggregate formation. The PAA-coating is invisible in TEMimages and no evidence on the thickness of the adsorbed layer is available.
Figure 18. Thickness of the silica layer encapsulating the co-precipitated UCPs. The arrows in the TEMimage indicate the less dense material covering the dark UCP material (NaYF4:Yb3+,Er3+). The UCPs wereencapsulated in a silica shell, conjugated with streptavidin (not visible) and filtered to exclude largeparticles. (unpublished)
None of the surface functionalization methods is perfect, and the negative value of thevarious disadvantages had to be rated. Considering that the application was intended to be aUC-RET-based assay, the possible aggregation of the UCPs due to a silica-encapsulationlimits the dynamic range of the assay (reduced surface area), while the detached PAAdeteriorates the LOD of the assay (no signal modulation induced by a binding event).
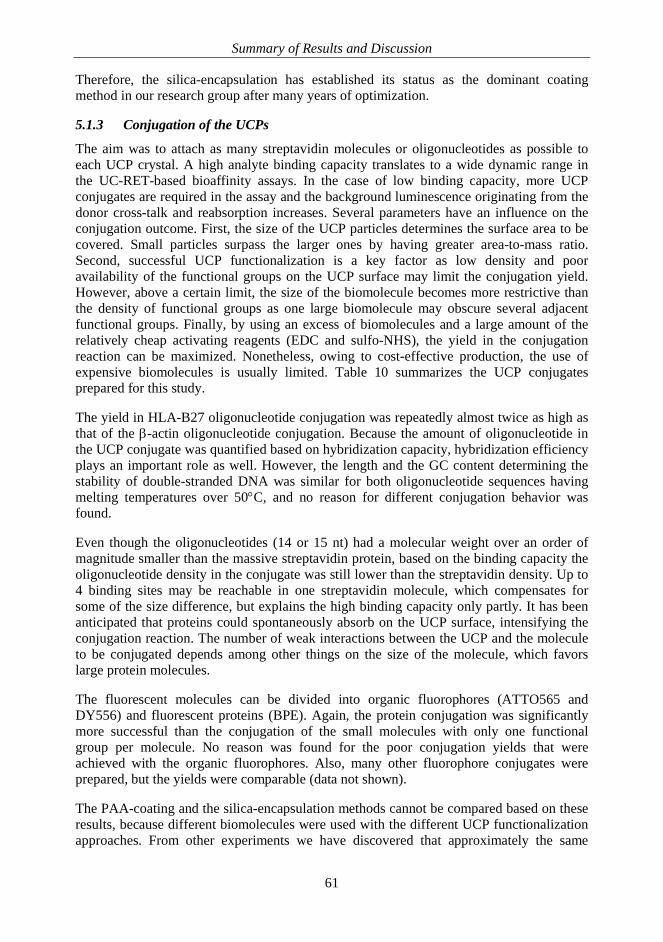
Summary of Results and Discussion
61
Therefore, the silica-encapsulation has established its status as the dominant coatingmethod in our research group after many years of optimization.
5.1.3 Conjugation of the UCPs
The aim was to attach as many streptavidin molecules or oligonucleotides as possible toeach UCP crystal. A high analyte binding capacity translates to a wide dynamic range inthe UC-RET-based bioaffinity assays. In the case of low binding capacity, more UCPconjugates are required in the assay and the background luminescence originating from thedonor cross-talk and reabsorption increases. Several parameters have an influence on theconjugation outcome. First, the size of the UCP particles determines the surface area to becovered. Small particles surpass the larger ones by having greater area-to-mass ratio.Second, successful UCP functionalization is a key factor as low density and pooravailability of the functional groups on the UCP surface may limit the conjugation yield.However, above a certain limit, the size of the biomolecule becomes more restrictive thanthe density of functional groups as one large biomolecule may obscure several adjacentfunctional groups. Finally, by using an excess of biomolecules and a large amount of therelatively cheap activating reagents (EDC and sulfo-NHS), the yield in the conjugationreaction can be maximized. Nonetheless, owing to cost-effective production, the use ofexpensive biomolecules is usually limited. Table 10 summarizes the UCP conjugatesprepared for this study.
The yield in HLA-B27 oligonucleotide conjugation was repeatedly almost twice as high asthat of the -actin oligonucleotide conjugation. Because the amount of oligonucleotide inthe UCP conjugate was quantified based on hybridization capacity, hybridization efficiencyplays an important role as well. However, the length and the GC content determining thestability of double-stranded DNA was similar for both oligonucleotide sequences havingmelting temperatures over 50 C, and no reason for different conjugation behavior wasfound.
Even though the oligonucleotides (14 or 15 nt) had a molecular weight over an order ofmagnitude smaller than the massive streptavidin protein, based on the binding capacity theoligonucleotide density in the conjugate was still lower than the streptavidin density. Up to4 binding sites may be reachable in one streptavidin molecule, which compensates forsome of the size difference, but explains the high binding capacity only partly. It has beenanticipated that proteins could spontaneously absorb on the UCP surface, intensifying theconjugation reaction. The number of weak interactions between the UCP and the moleculeto be conjugated depends among other things on the size of the molecule, which favorslarge protein molecules.
The fluorescent molecules can be divided into organic fluorophores (ATTO565 andDY556) and fluorescent proteins (BPE). Again, the protein conjugation was significantlymore successful than the conjugation of the small molecules with only one functionalgroup per molecule. No reason was found for the poor conjugation yields that wereachieved with the organic fluorophores. Also, many other fluorophore conjugates wereprepared, but the yields were comparable (data not shown).
The PAA-coating and the silica-encapsulation methods cannot be compared based on theseresults, because different biomolecules were used with the different UCP functionalizationapproaches. From other experiments we have discovered that approximately the same
Summary of Results and Discussion
62
binding capacities may be achieved with both methods, and sometimes the silica-layerprovides even better bioconjugation yields (data not shown).
Table 10. Summary of the UCP conjugates used in this study.
Conjugation reactionBiomoleculeoracceptor dye In a)
nmol / (mg UCP)Out b)
nmol / (mg UCP)Yield
%
Relativesurface/volume
ratioof the UCP c)
Publication
Streptavidin(biotin binder)
1.4 0.34 24 1.0 I, II
Oligonucleotide(complementaryhybridization)
1.2 (HLA-B27) 1.2 ( -actin)
0.12 d)
0.063 d)10 d)
5.3 d)1.11.1
IIIIII
BSA(no specificinteractions)
1.2 N/A N/A 3.1 IV
BPE e) 0.025 0.013 52 3.1 IV
ATTO565 e) 12 0.141 1.2 3.1 IV
DY556 e) 67 0.241 0.36 3.1 IV
Abbreviations: BSA, bovine serum albumin; BPE, B-phycoerythrin; N/A, not availablea) Amount of biomolecule or acceptor dye in the conjugation reaction per 1 mg of UCPb) Amount of biomolecule or acceptor dye in the UCP conjugate per 1 mg of UCP based on binding capacitydetermination or fluorescence intensity, respectivelyc) Surface-to-volume ratio of each UCP particle is proportioned to the largest UCPs used in publications I–IId) Silica-encapsulated UCPs, while the other conjugates were constructed from PAA-coated UCPse) To avoid self-quenching, the density of fluorescent molecules was kept low
5.2 Homogeneous assays based on upconversion resonance energy transfer
One issue that differentiates the UC-RET-based applications constructed in the Universityof Turku from the others is that quite low concentrations of the UCP donor and acceptorsare used. Another difference has been the utilization of the ground UCP bulk materialinstead of nanocrystalline UCPs. A commonly-shared feature in the UC-RET-basedbioanalytical assays has been the detection limits at sub-nanomolar range.
5.2.1 Energy transfer acceptors
There is a very large selection of commercial organic fluorophores and fluorescent proteinsspanning the entire visible wavelength range. In addition, particulate fluorescent labels areavailable, but they are less suitable for UC-RET acceptors because of steric issues and theformation of particle aggregates due to multiple binding sites. An ideal acceptorfluorophore would have an optimally overlapping excitation band with the donor emissionband, allowing efficient energy transfer. The emission band of the acceptor, in turn, shouldmatch the emission minimum of the donor. Finally, acceptors with bright emission andhigh stability against photobleaching facilitate the reading of the assay result.
Summary of Results and Discussion
63
Another choice for an energy transfer acceptor is a dark quencher that gives the energy offvia molecular vibrations (i.e., heat) without any fluorescence. In this case, the decreasingdonor emission is monitored instead of the increasing sensitized emission of the acceptor,but an ultimate detection limit is difficult to achieve with this concept as distinguishing asmall reduction in intense emission caused by a tiny amount of analyte is notstraightforward. Two different variations of energy transfer acceptors aiming to betterperformance in bioaffinity assays were studied in this thesis.
Spectral tuning: Tandem dye (I)
The conventional fluorophores have characteristically broad excitation and emission bandswith a small Stokes shift around 20 nm (the difference between the excitation and emissionmaxima) and possibly a red tail in the emission band extending to the longer wavelengths.A larger Stokes shift would facilitate the spectral separation by allowing the measurementof the sensitized emission intensity of the acceptor fluorophore without any cross-talk fromthe donor. A fluorescent molecule with tunable excitation and emission maxima far apartfrom each other would alleviate the limitations generally confronted when usingconventional fluorophores. Usually, either the excitation wavelength or the readingwavelength is a compromise from the ideal situation. Quantum dots have an eminentlybroad excitation band at UV region, and the position of the narrower emission banddepends on the size of the dot (Xing and Rao, 2008; Medintz and Mattoussi, 2009).Polystyrene microspheres loaded with two or more fluorescent dyes capable of transferringenergy to the fluorophore with the longest emission wavelength (TransFluoSpheres ;Molecular Probes Inc., Eugene, OR) are another option to widen the Stokes shift (Robertset al., 1998; Bhalgat et al., 1998). A similar relay approach is exploited in tandem dyes,where the compatible fluorophores are covalently conjugated to each other. Tandem dyesare not particles like the two other versions of tunable acceptors, and they are already ingeneral use, for example in flow cytometry applications (Hulspas et al., 2009).
A biotinylated tandem dye composed of a large phycobiliprotein BPE (absorber) andseveral AF680 fluorophores (emitters) was constructed. The tandem dye, BPE–AF6805,had a pseudo-Stokes shift of 139 nm, which is significantly greater than the Stokes shifts ofindividual BPE (9 nm) and AF680 (23 nm). The molar ratio between the absorber dye andthe emitter dye was optimized by preparing various trial versions of the tandem dye. Theoverlap of the fluorescence spectra was limited (Figure 19a), but still adequate for the RETbetween the closely conjugated fluorophores. No energy transfer was observed in solutioncontaining the same components unattached to each other. The quantity of the emittermolecule in the tandem dye was extremely critical: two AF680 fluorophores per BPE wastoo few and nine too much. The former trial version was spectrally emphasizing theabsorber rather than showing an efficient internal energy transfer to the emitter (Figure19b), and the latter version with effective energy transfer showed reduced emissionintensity at 704 nm due to a self-quenching phenomenon (not evident from the figure dueto the normalization of the fluorescence intensity) (Figure 19c). Instead, around five AF680dyes conjugated with BPE produced a tandem dye with an excitation maximum at greenwavelengths (characteristic to the absorber) and an emission maximum at red(characteristic to the emitter) (Figure 19d). However, a remarkable part of the BPEemission (at 575 nm) was unattenuated, revealing non-complete internal energy transfer.The BPE molecule has several chromophores (38 phycoerythrobilins and at least 2phycourobilins), and the outer dimensions of this disc-shaped phycobiliprotein are 12 nm
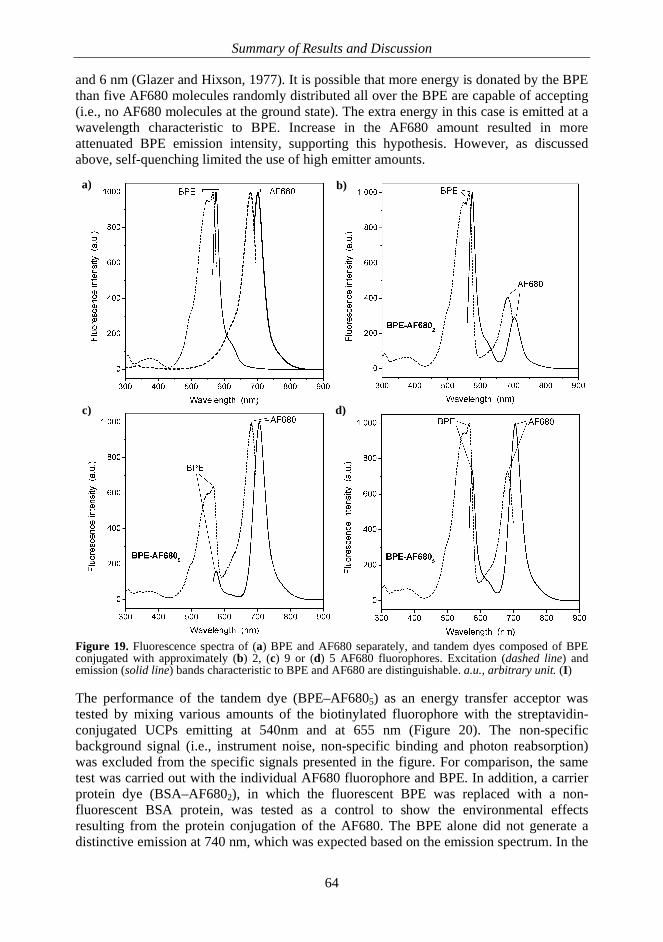
Summary of Results and Discussion
64
b)
c)
a)
d)
and 6 nm (Glazer and Hixson, 1977). It is possible that more energy is donated by the BPEthan five AF680 molecules randomly distributed all over the BPE are capable of accepting(i.e., no AF680 molecules at the ground state). The extra energy in this case is emitted at awavelength characteristic to BPE. Increase in the AF680 amount resulted in moreattenuated BPE emission intensity, supporting this hypothesis. However, as discussedabove, self-quenching limited the use of high emitter amounts.
Figure 19. Fluorescence spectra of (a) BPE and AF680 separately, and tandem dyes composed of BPEconjugated with approximately (b) 2, (c) 9 or (d) 5 AF680 fluorophores. Excitation (dashed line) andemission (solid line) bands characteristic to BPE and AF680 are distinguishable. a.u., arbitrary unit. (I)
The performance of the tandem dye (BPE–AF6805) as an energy transfer acceptor wastested by mixing various amounts of the biotinylated fluorophore with the streptavidin-conjugated UCPs emitting at 540nm and at 655 nm (Figure 20). The non-specificbackground signal (i.e., instrument noise, non-specific binding and photon reabsorption)was excluded from the specific signals presented in the figure. For comparison, the sametest was carried out with the individual AF680 fluorophore and BPE. In addition, a carrierprotein dye (BSA–AF6802), in which the fluorescent BPE was replaced with a non-fluorescent BSA protein, was tested as a control to show the environmental effectsresulting from the protein conjugation of the AF680. The BPE alone did not generate adistinctive emission at 740 nm, which was expected based on the emission spectrum. In the
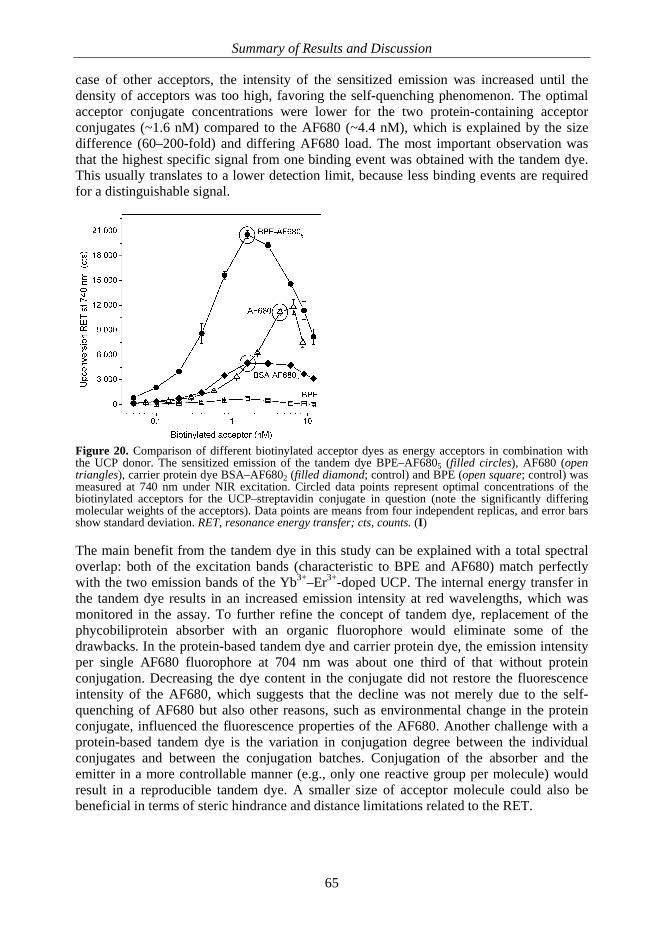
Summary of Results and Discussion
65
case of other acceptors, the intensity of the sensitized emission was increased until thedensity of acceptors was too high, favoring the self-quenching phenomenon. The optimalacceptor conjugate concentrations were lower for the two protein-containing acceptorconjugates (~1.6 nM) compared to the AF680 (~4.4 nM), which is explained by the sizedifference (60–200-fold) and differing AF680 load. The most important observation wasthat the highest specific signal from one binding event was obtained with the tandem dye.This usually translates to a lower detection limit, because less binding events are requiredfor a distinguishable signal.
Figure 20. Comparison of different biotinylated acceptor dyes as energy acceptors in combination withthe UCP donor. The sensitized emission of the tandem dye BPE–AF6805 (filled circles), AF680 (opentriangles), carrier protein dye BSA–AF6802 (filled diamond; control) and BPE (open square; control) wasmeasured at 740 nm under NIR excitation. Circled data points represent optimal concentrations of thebiotinylated acceptors for the UCP–streptavidin conjugate in question (note the significantly differingmolecular weights of the acceptors). Data points are means from four independent replicas, and error barsshow standard deviation. RET, resonance energy transfer; cts, counts. (I)
The main benefit from the tandem dye in this study can be explained with a total spectraloverlap: both of the excitation bands (characteristic to BPE and AF680) match perfectlywith the two emission bands of the Yb3+–Er3+-doped UCP. The internal energy transfer inthe tandem dye results in an increased emission intensity at red wavelengths, which wasmonitored in the assay. To further refine the concept of tandem dye, replacement of thephycobiliprotein absorber with an organic fluorophore would eliminate some of thedrawbacks. In the protein-based tandem dye and carrier protein dye, the emission intensityper single AF680 fluorophore at 704 nm was about one third of that without proteinconjugation. Decreasing the dye content in the conjugate did not restore the fluorescenceintensity of the AF680, which suggests that the decline was not merely due to the self-quenching of AF680 but also other reasons, such as environmental change in the proteinconjugate, influenced the fluorescence properties of the AF680. Another challenge with aprotein-based tandem dye is the variation in conjugation degree between the individualconjugates and between the conjugation batches. Conjugation of the absorber and theemitter in a more controllable manner (e.g., only one reactive group per molecule) wouldresult in a reproducible tandem dye. A smaller size of acceptor molecule could also bebeneficial in terms of steric hindrance and distance limitations related to the RET.
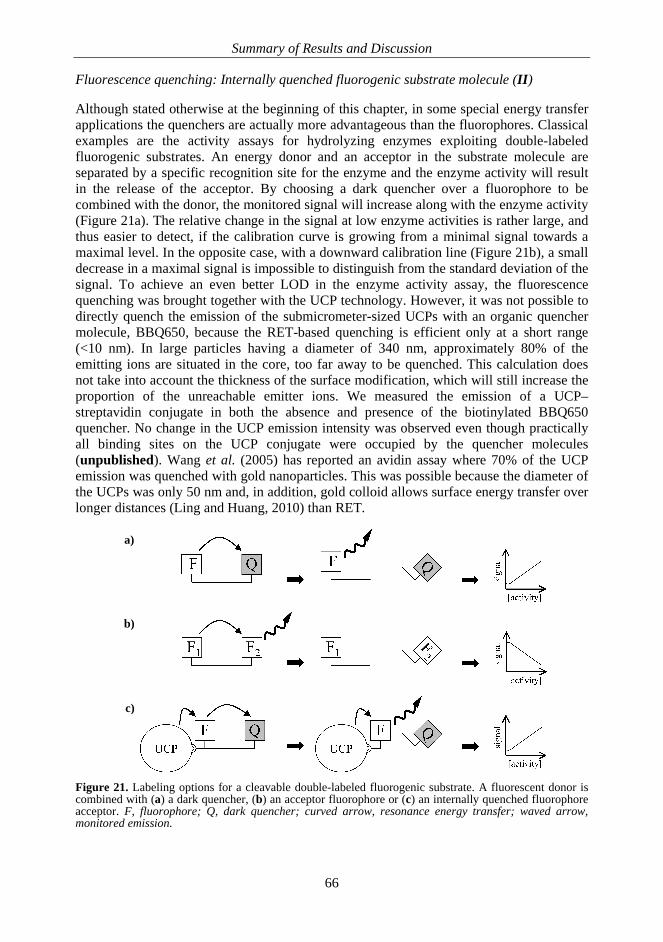
Summary of Results and Discussion
66
c)
b)
a)
Fluorescence quenching: Internally quenched fluorogenic substrate molecule (II)
Although stated otherwise at the beginning of this chapter, in some special energy transferapplications the quenchers are actually more advantageous than the fluorophores. Classicalexamples are the activity assays for hydrolyzing enzymes exploiting double-labeledfluorogenic substrates. An energy donor and an acceptor in the substrate molecule areseparated by a specific recognition site for the enzyme and the enzyme activity will resultin the release of the acceptor. By choosing a dark quencher over a fluorophore to becombined with the donor, the monitored signal will increase along with the enzyme activity(Figure 21a). The relative change in the signal at low enzyme activities is rather large, andthus easier to detect, if the calibration curve is growing from a minimal signal towards amaximal level. In the opposite case, with a downward calibration line (Figure 21b), a smalldecrease in a maximal signal is impossible to distinguish from the standard deviation of thesignal. To achieve an even better LOD in the enzyme activity assay, the fluorescencequenching was brought together with the UCP technology. However, it was not possible todirectly quench the emission of the submicrometer-sized UCPs with an organic quenchermolecule, BBQ650, because the RET-based quenching is efficient only at a short range(<10 nm). In large particles having a diameter of 340 nm, approximately 80% of theemitting ions are situated in the core, too far away to be quenched. This calculation doesnot take into account the thickness of the surface modification, which will still increase theproportion of the unreachable emitter ions. We measured the emission of a UCP–streptavidin conjugate in both the absence and presence of the biotinylated BBQ650quencher. No change in the UCP emission intensity was observed even though practicallyall binding sites on the UCP conjugate were occupied by the quencher molecules(unpublished). Wang et al. (2005) has reported an avidin assay where 70% of the UCPemission was quenched with gold nanoparticles. This was possible because the diameter ofthe UCPs was only 50 nm and, in addition, gold colloid allows surface energy transfer overlonger distances (Ling and Huang, 2010) than RET.
Figure 21. Labeling options for a cleavable double-labeled fluorogenic substrate. A fluorescent donor iscombined with (a) a dark quencher, (b) an acceptor fluorophore or (c) an internally quenched fluorophoreacceptor. F, fluorophore; Q, dark quencher; curved arrow, resonance energy transfer; waved arrow,monitored emission.
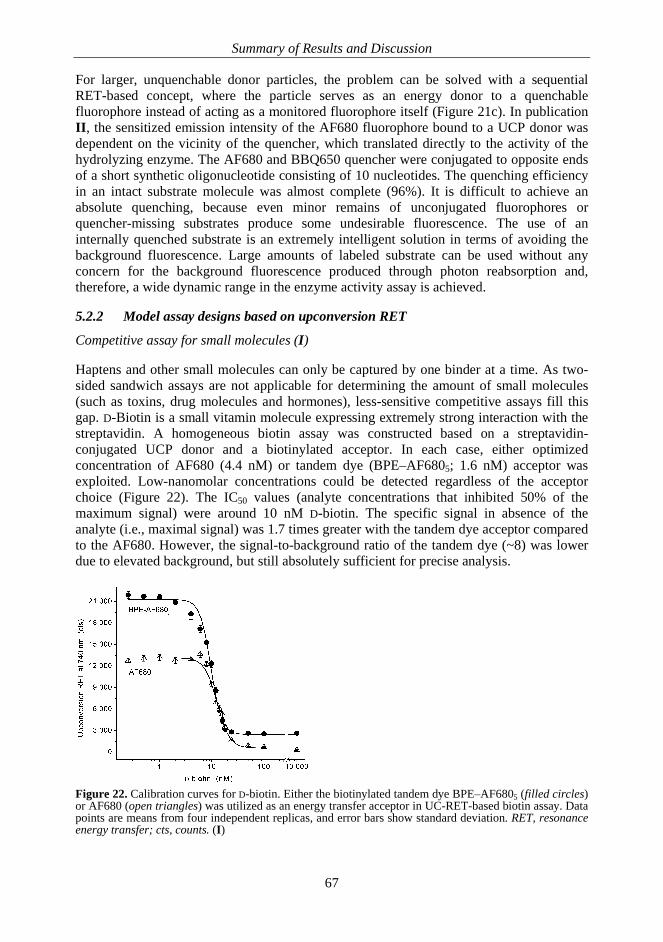
Summary of Results and Discussion
67
For larger, unquenchable donor particles, the problem can be solved with a sequentialRET-based concept, where the particle serves as an energy donor to a quenchablefluorophore instead of acting as a monitored fluorophore itself (Figure 21c). In publicationII, the sensitized emission intensity of the AF680 fluorophore bound to a UCP donor wasdependent on the vicinity of the quencher, which translated directly to the activity of thehydrolyzing enzyme. The AF680 and BBQ650 quencher were conjugated to opposite endsof a short synthetic oligonucleotide consisting of 10 nucleotides. The quenching efficiencyin an intact substrate molecule was almost complete (96%). It is difficult to achieve anabsolute quenching, because even minor remains of unconjugated fluorophores orquencher-missing substrates produce some undesirable fluorescence. The use of aninternally quenched substrate is an extremely intelligent solution in terms of avoiding thebackground fluorescence. Large amounts of labeled substrate can be used without anyconcern for the background fluorescence produced through photon reabsorption and,therefore, a wide dynamic range in the enzyme activity assay is achieved.
5.2.2 Model assay designs based on upconversion RET
Competitive assay for small molecules (I)
Haptens and other small molecules can only be captured by one binder at a time. As two-sided sandwich assays are not applicable for determining the amount of small molecules(such as toxins, drug molecules and hormones), less-sensitive competitive assays fill thisgap. D-Biotin is a small vitamin molecule expressing extremely strong interaction with thestreptavidin. A homogeneous biotin assay was constructed based on a streptavidin-conjugated UCP donor and a biotinylated acceptor. In each case, either optimizedconcentration of AF680 (4.4 nM) or tandem dye (BPE–AF6805; 1.6 nM) acceptor wasexploited. Low-nanomolar concentrations could be detected regardless of the acceptorchoice (Figure 22). The IC50 values (analyte concentrations that inhibited 50% of themaximum signal) were around 10 nM D-biotin. The specific signal in absence of theanalyte (i.e., maximal signal) was 1.7 times greater with the tandem dye acceptor comparedto the AF680. However, the signal-to-background ratio of the tandem dye (~8) was lowerdue to elevated background, but still absolutely sufficient for precise analysis.
Figure 22. Calibration curves for D-biotin. Either the biotinylated tandem dye BPE–AF6805 (filled circles)or AF680 (open triangles) was utilized as an energy transfer acceptor in UC-RET-based biotin assay. Datapoints are means from four independent replicas, and error bars show standard deviation. RET, resonanceenergy transfer; cts, counts. (I)
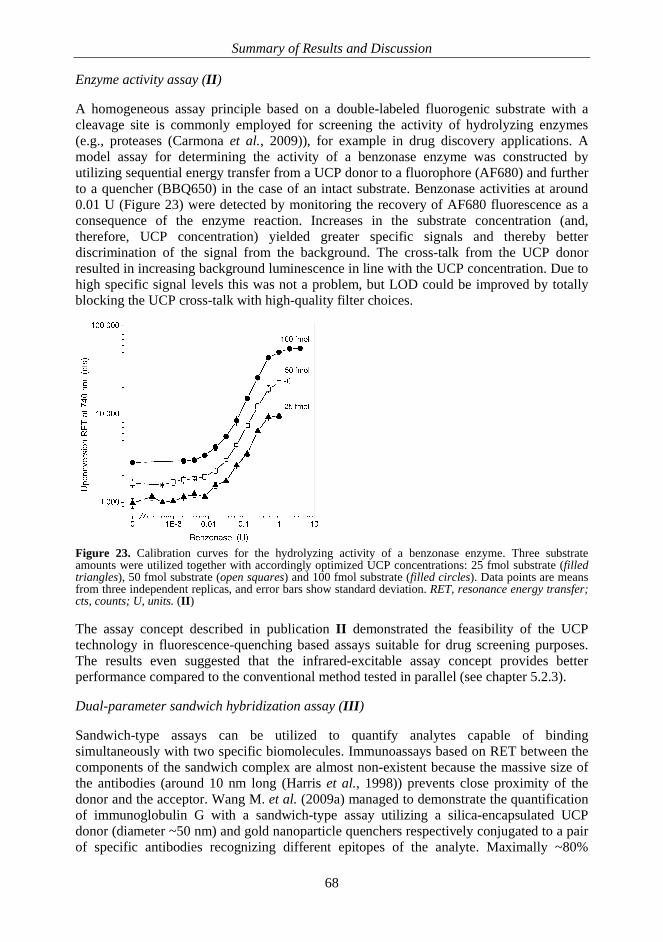
Summary of Results and Discussion
68
Enzyme activity assay (II)
A homogeneous assay principle based on a double-labeled fluorogenic substrate with acleavage site is commonly employed for screening the activity of hydrolyzing enzymes(e.g., proteases (Carmona et al., 2009)), for example in drug discovery applications. Amodel assay for determining the activity of a benzonase enzyme was constructed byutilizing sequential energy transfer from a UCP donor to a fluorophore (AF680) and furtherto a quencher (BBQ650) in the case of an intact substrate. Benzonase activities at around0.01 U (Figure 23) were detected by monitoring the recovery of AF680 fluorescence as aconsequence of the enzyme reaction. Increases in the substrate concentration (and,therefore, UCP concentration) yielded greater specific signals and thereby betterdiscrimination of the signal from the background. The cross-talk from the UCP donorresulted in increasing background luminescence in line with the UCP concentration. Due tohigh specific signal levels this was not a problem, but LOD could be improved by totallyblocking the UCP cross-talk with high-quality filter choices.
Figure 23. Calibration curves for the hydrolyzing activity of a benzonase enzyme. Three substrateamounts were utilized together with accordingly optimized UCP concentrations: 25 fmol substrate (filledtriangles), 50 fmol substrate (open squares) and 100 fmol substrate (filled circles). Data points are meansfrom three independent replicas, and error bars show standard deviation. RET, resonance energy transfer;cts, counts; U, units. (II)
The assay concept described in publication II demonstrated the feasibility of the UCPtechnology in fluorescence-quenching based assays suitable for drug screening purposes.The results even suggested that the infrared-excitable assay concept provides betterperformance compared to the conventional method tested in parallel (see chapter 5.2.3).
Dual-parameter sandwich hybridization assay (III)
Sandwich-type assays can be utilized to quantify analytes capable of bindingsimultaneously with two specific biomolecules. Immunoassays based on RET between thecomponents of the sandwich complex are almost non-existent because the massive size ofthe antibodies (around 10 nm long (Harris et al., 1998)) prevents close proximity of thedonor and the acceptor. Wang M. et al. (2009a) managed to demonstrate the quantificationof immunoglobulin G with a sandwich-type assay utilizing a silica-encapsulated UCPdonor (diameter ~50 nm) and gold nanoparticle quenchers respectively conjugated to a pairof specific antibodies recognizing different epitopes of the analyte. Maximally ~80%
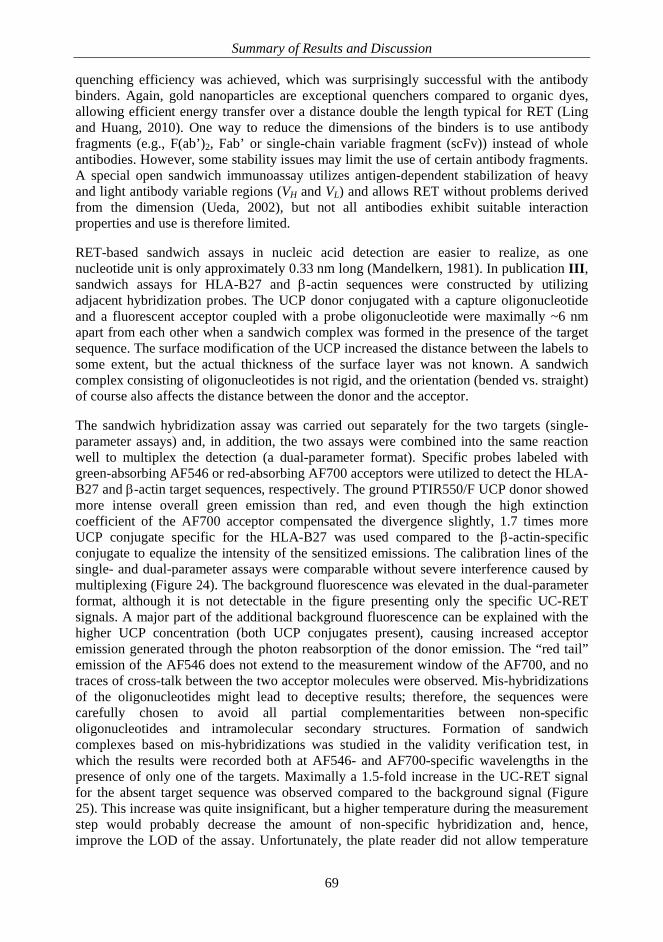
Summary of Results and Discussion
69
quenching efficiency was achieved, which was surprisingly successful with the antibodybinders. Again, gold nanoparticles are exceptional quenchers compared to organic dyes,allowing efficient energy transfer over a distance double the length typical for RET (Lingand Huang, 2010). One way to reduce the dimensions of the binders is to use antibodyfragments (e.g., F(ab’)2, Fab’ or single-chain variable fragment (scFv)) instead of wholeantibodies. However, some stability issues may limit the use of certain antibody fragments.A special open sandwich immunoassay utilizes antigen-dependent stabilization of heavyand light antibody variable regions (VH and VL) and allows RET without problems derivedfrom the dimension (Ueda, 2002), but not all antibodies exhibit suitable interactionproperties and use is therefore limited.
RET-based sandwich assays in nucleic acid detection are easier to realize, as onenucleotide unit is only approximately 0.33 nm long (Mandelkern, 1981). In publication III,sandwich assays for HLA-B27 and -actin sequences were constructed by utilizingadjacent hybridization probes. The UCP donor conjugated with a capture oligonucleotideand a fluorescent acceptor coupled with a probe oligonucleotide were maximally ~6 nmapart from each other when a sandwich complex was formed in the presence of the targetsequence. The surface modification of the UCP increased the distance between the labels tosome extent, but the actual thickness of the surface layer was not known. A sandwichcomplex consisting of oligonucleotides is not rigid, and the orientation (bended vs. straight)of course also affects the distance between the donor and the acceptor.
The sandwich hybridization assay was carried out separately for the two targets (single-parameter assays) and, in addition, the two assays were combined into the same reactionwell to multiplex the detection (a dual-parameter format). Specific probes labeled withgreen-absorbing AF546 or red-absorbing AF700 acceptors were utilized to detect the HLA-B27 and -actin target sequences, respectively. The ground PTIR550/F UCP donor showedmore intense overall green emission than red, and even though the high extinctioncoefficient of the AF700 acceptor compensated the divergence slightly, 1.7 times moreUCP conjugate specific for the HLA-B27 was used compared to the -actin-specificconjugate to equalize the intensity of the sensitized emissions. The calibration lines of thesingle- and dual-parameter assays were comparable without severe interference caused bymultiplexing (Figure 24). The background fluorescence was elevated in the dual-parameterformat, although it is not detectable in the figure presenting only the specific UC-RETsignals. A major part of the additional background fluorescence can be explained with thehigher UCP concentration (both UCP conjugates present), causing increased acceptoremission generated through the photon reabsorption of the donor emission. The “red tail”emission of the AF546 does not extend to the measurement window of the AF700, and notraces of cross-talk between the two acceptor molecules were observed. Mis-hybridizationsof the oligonucleotides might lead to deceptive results; therefore, the sequences werecarefully chosen to avoid all partial complementarities between non-specificoligonucleotides and intramolecular secondary structures. Formation of sandwichcomplexes based on mis-hybridizations was studied in the validity verification test, inwhich the results were recorded both at AF546- and AF700-specific wavelengths in thepresence of only one of the targets. Maximally a 1.5-fold increase in the UC-RET signalfor the absent target sequence was observed compared to the background signal (Figure25). This increase was quite insignificant, but a higher temperature during the measurementstep would probably decrease the amount of non-specific hybridization and, hence,improve the LOD of the assay. Unfortunately, the plate reader did not allow temperature
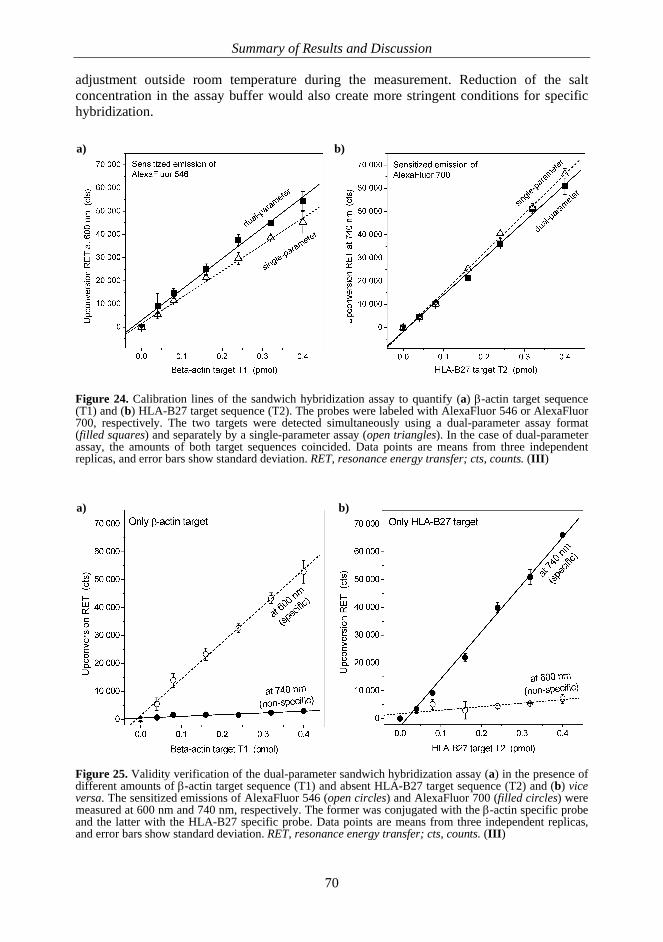
Summary of Results and Discussion
70
b)a)
b)a)
adjustment outside room temperature during the measurement. Reduction of the saltconcentration in the assay buffer would also create more stringent conditions for specifichybridization.
Figure 24. Calibration lines of the sandwich hybridization assay to quantify (a) -actin target sequence(T1) and (b) HLA-B27 target sequence (T2). The probes were labeled with AlexaFluor 546 or AlexaFluor700, respectively. The two targets were detected simultaneously using a dual-parameter assay format(filled squares) and separately by a single-parameter assay (open triangles). In the case of dual-parameterassay, the amounts of both target sequences coincided. Data points are means from three independentreplicas, and error bars show standard deviation. RET, resonance energy transfer; cts, counts. (III)
Figure 25. Validity verification of the dual-parameter sandwich hybridization assay (a) in the presence ofdifferent amounts of -actin target sequence (T1) and absent HLA-B27 target sequence (T2) and (b) viceversa. The sensitized emissions of AlexaFluor 546 (open circles) and AlexaFluor 700 (filled circles) weremeasured at 600 nm and 740 nm, respectively. The former was conjugated with the -actin specific probeand the latter with the HLA-B27 specific probe. Data points are means from three independent replicas,and error bars show standard deviation. RET, resonance energy transfer; cts, counts. (III)
Summary of Results and Discussion
71
The LOD for both target sequences was below 0.028 pmol (corresponding to 0.35 nM) inthe dual-parameter assay, and the dynamic range extended up to 0.4 pmol (5.4 nM). TheLODs were calculated using the definition of three times the standard deviation above thesignal measured in the absence of the target. Zhang et al. (2006) has described a similarsingle-parameter assay with a detection limit of 1.3 nM. Thus, there is agreement thatUCP-based sandwich hybridization assays are capable of detecting low-nanomolar targetconcentrations. That is not a physiological concentration, but nucleic acid detectionmethods generally exploit a preceding amplification step, such as PCR. The dual-parameterhybridization assay described in publication III is applicable to the screening of a disease-inducing gene together with an internal housekeeping control sequence used for reportingon the success of the PCR amplification. Multiplexing is also convenient in the case of tworelated diagnostic markers providing extra information together or when a heterozygouscarrier of a genetic disorder needs to be identified.
In this dual-parameter assay, only one wavelength was used for excitation, which simplifiesthe requirements for instrumentation. Addition of a third parameter is theoretically possibleby introducing a blue-emitting UCP doped with Yb3+ and Tm3+ ions. More complexmultiplexing is not possible with homogeneous RET-based assays, because cross-talkbetween the labels becomes a limiting factor.
5.2.3 Near-infrared excitation
The strength of the UCP-based bioaffinity assays is the NIR excitation, but at the sametime the variation in the spectral properties of the UCPs depending on the excitation powerdensity can be considered as a weakness of the UCP labels. In this section, the observationsand phenomena related to excitation are discussed.
Autofluorescence and sample absorption (II)
Autofluorescence at visible wavelengths is one of the major sources of backgroundfluorescence. In original publication II, the UC-RET-based technology was compared witha method relying on a conventional fluorescent label. The emission intensity (at ~700 nm)of AF680 fluorophore was modulated by the activity of a hydrolyzing enzyme. Thefluorophore was excited either directly with red light (at 644–666 nm) or through energytransfer from the UCP donor under NIR (980 nm) excitation. The LOD of the assay inbuffer solution containing no biological matrix was about three times better in the lattercase utilizing the UCP technology. A more remarkable difference between the two methodswas discovered in the signal-to-background ratios. The UCP technology reached a ratio of20:1, while the specific signals measured with the conventional method remained low andthe signal-to-background ratio was maximally only 3:1. One must take into account, thatthe type of the excitation source was different for the two methods, and the signal levels assuch are not directly comparable. The UCPs were excited with an NIR laser diode (0.20 W)providing a narrow excitation band, while the conventional method utilized a tungsten-halogen lamp (75 W) producing a continuous spectrum from near-UV to infrared of whichonly a small band (~20 nm) was selected with a band-pass filter. However, the excitationpower density affects the intensity of the specific and the non-specific signal equally;therefore, the signal-to-background ratios are totally comparable measures. It is possible toconclude that the proportion of the background fluorescence was significantly lower in thecase of the UCP technology because the autofluorescence was totally excluded due to thephoton upconversion.
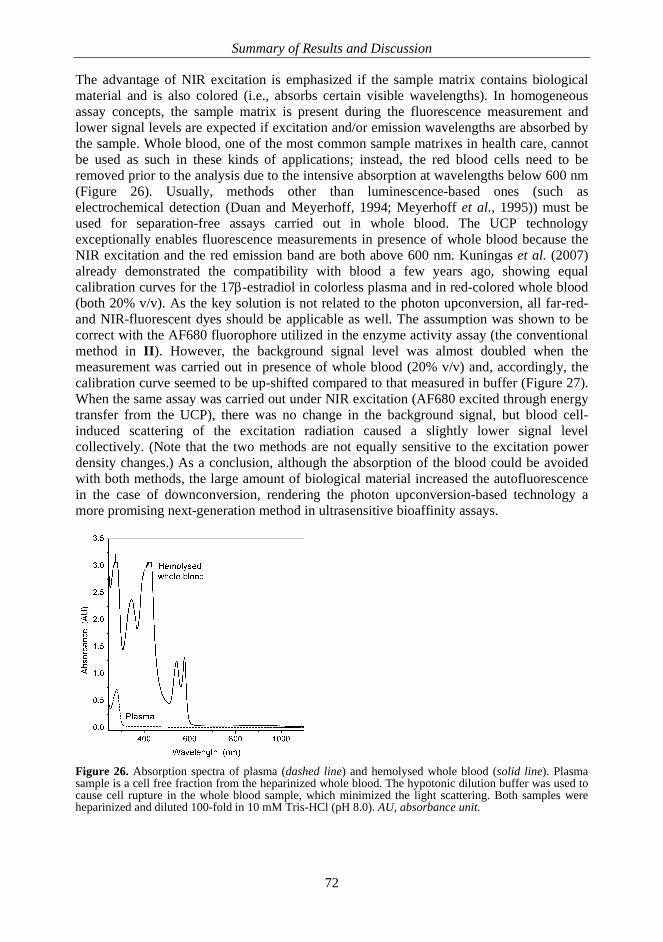
Summary of Results and Discussion
72
The advantage of NIR excitation is emphasized if the sample matrix contains biologicalmaterial and is also colored (i.e., absorbs certain visible wavelengths). In homogeneousassay concepts, the sample matrix is present during the fluorescence measurement andlower signal levels are expected if excitation and/or emission wavelengths are absorbed bythe sample. Whole blood, one of the most common sample matrixes in health care, cannotbe used as such in these kinds of applications; instead, the red blood cells need to beremoved prior to the analysis due to the intensive absorption at wavelengths below 600 nm(Figure 26). Usually, methods other than luminescence-based ones (such aselectrochemical detection (Duan and Meyerhoff, 1994; Meyerhoff et al., 1995)) must beused for separation-free assays carried out in whole blood. The UCP technologyexceptionally enables fluorescence measurements in presence of whole blood because theNIR excitation and the red emission band are both above 600 nm. Kuningas et al. (2007)already demonstrated the compatibility with blood a few years ago, showing equalcalibration curves for the 17 -estradiol in colorless plasma and in red-colored whole blood(both 20% v/v). As the key solution is not related to the photon upconversion, all far-red-and NIR-fluorescent dyes should be applicable as well. The assumption was shown to becorrect with the AF680 fluorophore utilized in the enzyme activity assay (the conventionalmethod in II). However, the background signal level was almost doubled when themeasurement was carried out in presence of whole blood (20% v/v) and, accordingly, thecalibration curve seemed to be up-shifted compared to that measured in buffer (Figure 27).When the same assay was carried out under NIR excitation (AF680 excited through energytransfer from the UCP), there was no change in the background signal, but blood cell-induced scattering of the excitation radiation caused a slightly lower signal levelcollectively. (Note that the two methods are not equally sensitive to the excitation powerdensity changes.) As a conclusion, although the absorption of the blood could be avoidedwith both methods, the large amount of biological material increased the autofluorescencein the case of downconversion, rendering the photon upconversion-based technology amore promising next-generation method in ultrasensitive bioaffinity assays.
Figure 26. Absorption spectra of plasma (dashed line) and hemolysed whole blood (solid line). Plasmasample is a cell free fraction from the heparinized whole blood. The hypotonic dilution buffer was used tocause cell rupture in the whole blood sample, which minimized the light scattering. Both samples wereheparinized and diluted 100-fold in 10 mM Tris-HCl (pH 8.0). AU, absorbance unit.
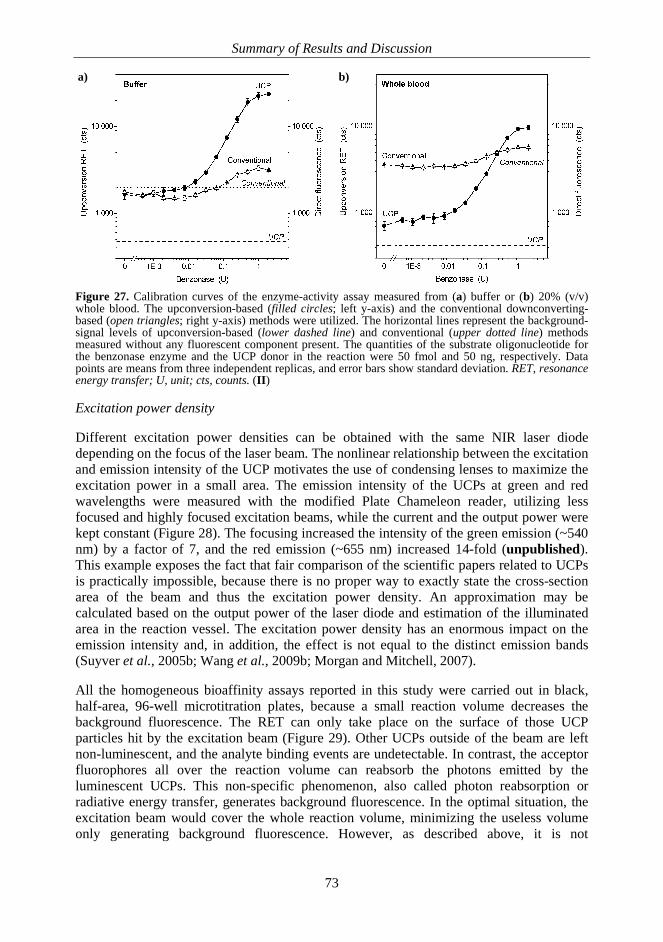
Summary of Results and Discussion
73
b)a)
Figure 27. Calibration curves of the enzyme-activity assay measured from (a) buffer or (b) 20% (v/v)whole blood. The upconversion-based (filled circles; left y-axis) and the conventional downconverting-based (open triangles; right y-axis) methods were utilized. The horizontal lines represent the background-signal levels of upconversion-based (lower dashed line) and conventional (upper dotted line) methodsmeasured without any fluorescent component present. The quantities of the substrate oligonucleotide forthe benzonase enzyme and the UCP donor in the reaction were 50 fmol and 50 ng, respectively. Datapoints are means from three independent replicas, and error bars show standard deviation. RET, resonanceenergy transfer; U, unit; cts, counts. (II)
Excitation power density
Different excitation power densities can be obtained with the same NIR laser diodedepending on the focus of the laser beam. The nonlinear relationship between the excitationand emission intensity of the UCP motivates the use of condensing lenses to maximize theexcitation power in a small area. The emission intensity of the UCPs at green and redwavelengths were measured with the modified Plate Chameleon reader, utilizing lessfocused and highly focused excitation beams, while the current and the output power werekept constant (Figure 28). The focusing increased the intensity of the green emission (~540nm) by a factor of 7, and the red emission (~655 nm) increased 14-fold (unpublished).This example exposes the fact that fair comparison of the scientific papers related to UCPsis practically impossible, because there is no proper way to exactly state the cross-sectionarea of the beam and thus the excitation power density. An approximation may becalculated based on the output power of the laser diode and estimation of the illuminatedarea in the reaction vessel. The excitation power density has an enormous impact on theemission intensity and, in addition, the effect is not equal to the distinct emission bands(Suyver et al., 2005b; Wang et al., 2009b; Morgan and Mitchell, 2007).
All the homogeneous bioaffinity assays reported in this study were carried out in black,half-area, 96-well microtitration plates, because a small reaction volume decreases thebackground fluorescence. The RET can only take place on the surface of those UCPparticles hit by the excitation beam (Figure 29). Other UCPs outside of the beam are leftnon-luminescent, and the analyte binding events are undetectable. In contrast, the acceptorfluorophores all over the reaction volume can reabsorb the photons emitted by theluminescent UCPs. This non-specific phenomenon, also called photon reabsorption orradiative energy transfer, generates background fluorescence. In the optimal situation, theexcitation beam would cover the whole reaction volume, minimizing the useless volumeonly generating background fluorescence. However, as described above, it is not
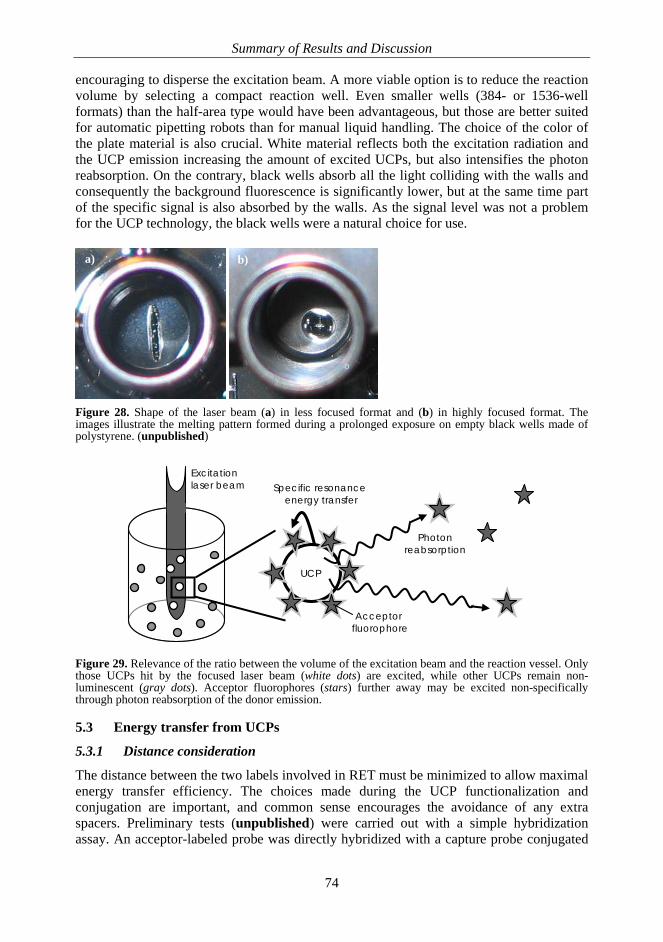
Summary of Results and Discussion
74
Specific resonance energy transfer
UCP
Acceptor fluorophore
Photonreabsorption
Excitationlaser beam
b)a)
encouraging to disperse the excitation beam. A more viable option is to reduce the reactionvolume by selecting a compact reaction well. Even smaller wells (384- or 1536-wellformats) than the half-area type would have been advantageous, but those are better suitedfor automatic pipetting robots than for manual liquid handling. The choice of the color ofthe plate material is also crucial. White material reflects both the excitation radiation andthe UCP emission increasing the amount of excited UCPs, but also intensifies the photonreabsorption. On the contrary, black wells absorb all the light colliding with the walls andconsequently the background fluorescence is significantly lower, but at the same time partof the specific signal is also absorbed by the walls. As the signal level was not a problemfor the UCP technology, the black wells were a natural choice for use.
Figure 28. Shape of the laser beam (a) in less focused format and (b) in highly focused format. Theimages illustrate the melting pattern formed during a prolonged exposure on empty black wells made ofpolystyrene. (unpublished)
Figure 29. Relevance of the ratio between the volume of the excitation beam and the reaction vessel. Onlythose UCPs hit by the focused laser beam (white dots) are excited, while other UCPs remain non-luminescent (gray dots). Acceptor fluorophores (stars) further away may be excited non-specificallythrough photon reabsorption of the donor emission.
5.3 Energy transfer from UCPs
5.3.1 Distance consideration
The distance between the two labels involved in RET must be minimized to allow maximalenergy transfer efficiency. The choices made during the UCP functionalization andconjugation are important, and common sense encourages the avoidance of any extraspacers. Preliminary tests (unpublished) were carried out with a simple hybridizationassay. An acceptor-labeled probe was directly hybridized with a capture probe conjugated
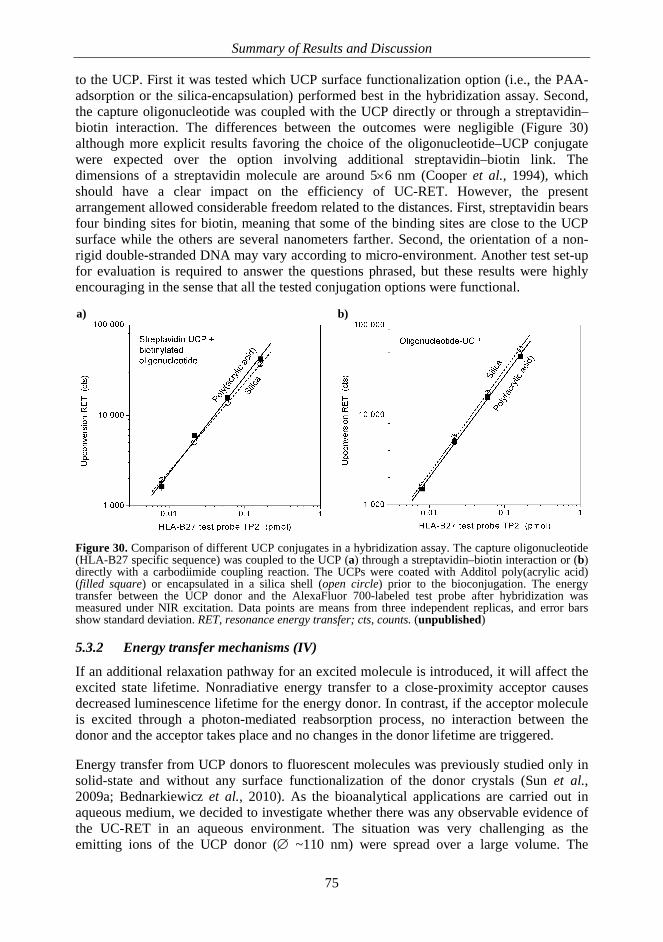
Summary of Results and Discussion
75
b)a)
to the UCP. First it was tested which UCP surface functionalization option (i.e., the PAA-adsorption or the silica-encapsulation) performed best in the hybridization assay. Second,the capture oligonucleotide was coupled with the UCP directly or through a streptavidin–biotin interaction. The differences between the outcomes were negligible (Figure 30)although more explicit results favoring the choice of the oligonucleotide–UCP conjugatewere expected over the option involving additional streptavidin–biotin link. Thedimensions of a streptavidin molecule are around 5 6 nm (Cooper et al., 1994), whichshould have a clear impact on the efficiency of UC-RET. However, the presentarrangement allowed considerable freedom related to the distances. First, streptavidin bearsfour binding sites for biotin, meaning that some of the binding sites are close to the UCPsurface while the others are several nanometers farther. Second, the orientation of a non-rigid double-stranded DNA may vary according to micro-environment. Another test set-upfor evaluation is required to answer the questions phrased, but these results were highlyencouraging in the sense that all the tested conjugation options were functional.
Figure 30. Comparison of different UCP conjugates in a hybridization assay. The capture oligonucleotide(HLA-B27 specific sequence) was coupled to the UCP (a) through a streptavidin–biotin interaction or (b)directly with a carbodiimide coupling reaction. The UCPs were coated with Additol poly(acrylic acid)(filled square) or encapsulated in a silica shell (open circle) prior to the bioconjugation. The energytransfer between the UCP donor and the AlexaFluor 700-labeled test probe after hybridization wasmeasured under NIR excitation. Data points are means from three independent replicas, and error barsshow standard deviation. RET, resonance energy transfer; cts, counts. (unpublished)
5.3.2 Energy transfer mechanisms (IV)
If an additional relaxation pathway for an excited molecule is introduced, it will affect theexcited state lifetime. Nonradiative energy transfer to a close-proximity acceptor causesdecreased luminescence lifetime for the energy donor. In contrast, if the acceptor moleculeis excited through a photon-mediated reabsorption process, no interaction between thedonor and the acceptor takes place and no changes in the donor lifetime are triggered.
Energy transfer from UCP donors to fluorescent molecules was previously studied only insolid-state and without any surface functionalization of the donor crystals (Sun et al.,2009a; Bednarkiewicz et al., 2010). As the bioanalytical applications are carried out inaqueous medium, we decided to investigate whether there was any observable evidence ofthe UC-RET in an aqueous environment. The situation was very challenging as theemitting ions of the UCP donor ( ~110 nm) were spread over a large volume. The
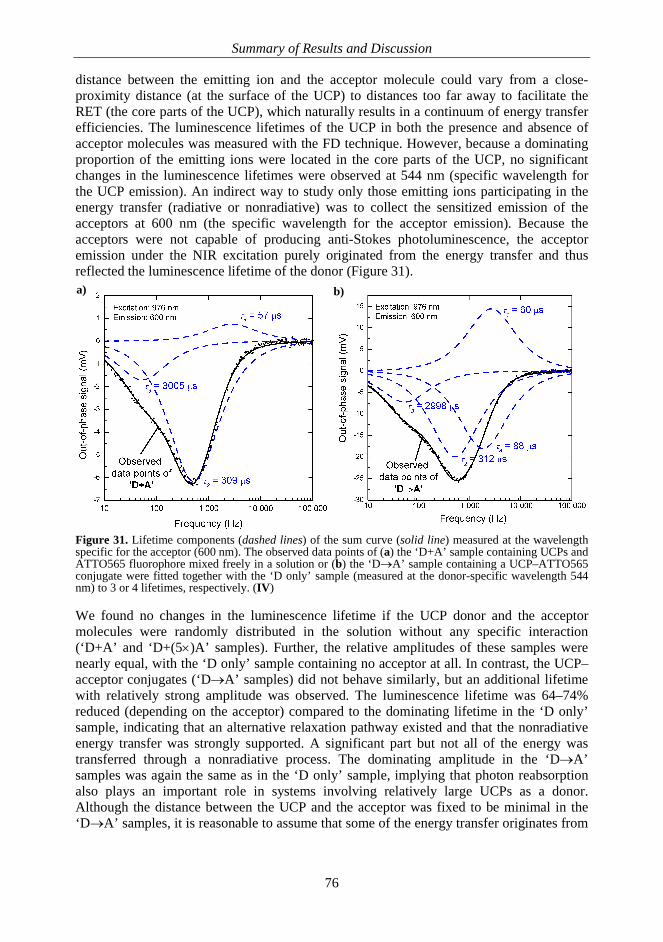
Summary of Results and Discussion
76
a) b)
distance between the emitting ion and the acceptor molecule could vary from a close-proximity distance (at the surface of the UCP) to distances too far away to facilitate theRET (the core parts of the UCP), which naturally results in a continuum of energy transferefficiencies. The luminescence lifetimes of the UCP in both the presence and absence ofacceptor molecules was measured with the FD technique. However, because a dominatingproportion of the emitting ions were located in the core parts of the UCP, no significantchanges in the luminescence lifetimes were observed at 544 nm (specific wavelength forthe UCP emission). An indirect way to study only those emitting ions participating in theenergy transfer (radiative or nonradiative) was to collect the sensitized emission of theacceptors at 600 nm (the specific wavelength for the acceptor emission). Because theacceptors were not capable of producing anti-Stokes photoluminescence, the acceptoremission under the NIR excitation purely originated from the energy transfer and thusreflected the luminescence lifetime of the donor (Figure 31).
Figure 31. Lifetime components (dashed lines) of the sum curve (solid line) measured at the wavelengthspecific for the acceptor (600 nm). The observed data points of (a) the ‘D+A’ sample containing UCPs andATTO565 fluorophore mixed freely in a solution or (b) the ‘D A’ sample containing a UCP–ATTO565conjugate were fitted together with the ‘D only’ sample (measured at the donor-specific wavelength 544nm) to 3 or 4 lifetimes, respectively. (IV)
We found no changes in the luminescence lifetime if the UCP donor and the acceptormolecules were randomly distributed in the solution without any specific interaction(‘D+A’ and ‘D+(5 )A’ samples). Further, the relative amplitudes of these samples werenearly equal, with the ‘D only’ sample containing no acceptor at all. In contrast, the UCP–acceptor conjugates (‘D A’ samples) did not behave similarly, but an additional lifetimewith relatively strong amplitude was observed. The luminescence lifetime was 64–74%reduced (depending on the acceptor) compared to the dominating lifetime in the ‘D only’sample, indicating that an alternative relaxation pathway existed and that the nonradiativeenergy transfer was strongly supported. A significant part but not all of the energy wastransferred through a nonradiative process. The dominating amplitude in the ‘D A’samples was again the same as in the ‘D only’ sample, implying that photon reabsorptionalso plays an important role in systems involving relatively large UCPs as a donor.Although the distance between the UCP and the acceptor was fixed to be minimal in the‘D A’ samples, it is reasonable to assume that some of the energy transfer originates from
Summary of Results and Discussion
77
the emitting ions located in the UCP core, thus the reabsorption mechanism inevitably isalways present to some extent.
The proportion of the reabsorption is likely minimized if nano-sized UCP donors (diameterbelow 20 nm) are exploited and the amount of the fluorescent species (the donor and thefluorescent acceptor) is limited to low concentrations. These actions will add theprobability of UC-RET as the excess of emitters is removed. This hypothesis seems to becorrect based on the preliminary evaluation of UC-RET applications with nanocrystallineUCP material producing less background luminescence, but confirmation for the deductioncan be attained by repeating these luminescence lifetime experiments with the nanocrystals.The method is now straightforward as the instrumentation and the data analysis have beendeveloped and tested.
Conclusions
78
6 CONCLUSIONS
Photoluminescent label techniques have established their position in analyte detection dueto their low detection limits, relatively easy handling (no stability problems) and possibilityfor direct measurement (no addition of enhancers or substrates). The luminescence-basedassays are ideal for testing the abundant analytes, but autofluorescence limits the detectionof sparse molecules. Optically challenging sample matrixes (e.g., high absorptivity atcertain wavelengths, strong scattering of radiation) complicate the photoluminescencemeasurement, and a pretreatment step prior the analysis or removal of the sample matrixbefore reading the emission intensity may be required. These extra steps are inconvenientin rapid and simplified on-site testing, which is one of the focal development trends in thebioanalytical field. The limitations can be avoided by exploiting photon upconversion andNIR excitation.
In this study, the performance of a novel label technology relying on photon upconversionwas evaluated in various homogeneous assay concepts based on energy transfer from theUCPs to acceptor fluorophores. The bioanalytical model assays for detecting a haptenmolecule, enzyme activity or oligonucleotide sequences utilized NIR radiation to excite theUCP donors, and the read-out of the sensitized emission of the acceptor was carried out atvisible wavelengths. The distance-dependent signal modulation of the acceptor fluorophorewas studied in detail by monitoring the luminescence lifetime changes.
The main conclusions based on the original publications are:
I The excitation and emission wavelengths of the acceptor may be fine tuned byutilizing a tandem dye composed of two fluorophores capable of internal energytransfer. In RET-based applications, the tandem dyes can improve the spectraloverlap between the donor and the acceptor fluorophore and facilitate the separationof the sensitized acceptor emission. Fluorescent protein as a part of a tandem dyeprovides an exceptionally high extinction coefficient, ensuring high emissionintensity. However, this kind of acceptor entity has large dimensions and is difficultto produce in a reproducible way.
II The bright anti-Stokes photoluminescence of a submicrometer-sized UCP isimpossible to quench efficiently with an organic dark quencher, as the emitter ionslocated in the core parts of the UCP are too far away for distance-dependentprocesses such as RET. The problem can be solved by a sequential energy-transfer-based system where the UCP donor transfers energy to an acceptor fluorophorewhose sensitized emission intensity is further modulated by a near-proximityquencher. This system may be utilized in bioanalytical assays in which a biologicalevent (e.g., hydrolyzing enzyme reaction) releases the quencher and restores thesensitized emission.
III Lanthanide-based UCPs have typically at least two emission bands that can both beutilized simultaneously to report the concentration of two different analytes. A UC-RET-based dual-parameter assay utilizing a single excitation wavelength can beconstructed by combining one type of UCP donor with two different acceptorfluorophores matching with the separate UCP emission bands. In the sandwichhybridization assay, there was no cross-talk between the two acceptor fluorophores,
Conclusions
79
and two oligonucleotide sequences could be quantitatively detected from the samereaction vessel with high confidence.
IV The energy transfer between a UCP donor and a close-proximity acceptorfluorophore occurs at least partly by means of a nonradiative mechanism (i.e., RET),although reabsorption of the donor emission always causes some of the sensitizedacceptor emission. A decreased luminescence lifetime of the UCP donor in thepresence of acceptor fluorophores within close proximity proved the presence of theRET process. The frequency-domain technique proved to be well suited todetermine the luminescence lifetime changes of the relatively large UCPs (diameter110 nm), which dominantly produced unaffected emission from the emitting ionslocated in the core parts of the particle.
The methods for handling and modifying the UCP material were developed alongside theassay development. The procedure for grinding the commercial UCP bulk material intosubmicrometer-sized colloidal particles was significantly accelerated by a planetary ballmill that completes the task within 90 minutes. The grinding step could be excluded whenmorphologically more favorable and highly luminescent UCP material (spherical particleswith a diameter below 150 nm) was directly synthesized with a solid-state co-precipitationmethod. Similar modification procedures (i.e., functionalization and bioconjugation) couldbe successfully carried out with both ground and synthesized UCP material. An optionalfunctionalization method was developed and optimized to substitute for the previouspolymer adsorption-based procedure. The density of the functional groups in the optimizedsilica coating was sufficient, and the layer was thin enough to enable efficient RET fromthe UCP emitter ions to an acceptor fluorophore.
In conclusion, UCP technology with its special photoluminescent features theoreticallyprovides an opportunity for ultrasensitive detection of analyte molecules with simpleinstrumentation. The potential of the UCPs has been shown in various proof-of-principlebioanalytical assays, and the natural extension would be to test the operation in real clinicalsituations and to evaluate the performance of this label technology against other labels.Today, the major problem related to UCP technology has been solved, as the recentdevelopment in the synthesis of the nanocrystalline UCPs has enabled the replacement ofthe ground bulk materials. Although the surface functionalization of the UCPs remains achallenge, as with other inorganic labels (e.g., quantum dots), several optional coatingmethods have been reported and a suitable version may be chosen depending on theapplication. Instrumentation for reading the UCP emission is not yet commonly available,but the elements and the technological solutions exist to enable the potential commercialexploitation of UCP technology.
Acknowledgements
80
ACKNOWLEDGEMENTS
This study was carried out at the Department of Biotechnology, University of Turku,during the years 2006–2011. Financial support from the Finnish Funding Agency forTechnology and Innovation (Tekes), the Academy of Finland (Grant numbers 209417,114903, 119497, 140758) and the industrial companies involved is gratefullyacknowledged as well as the technological support from Hidex Oy in the anti-Stokesphotoluminescence measurements.
I wish to thank Professor Emeritus Timo Lövgren, former head of the department, forgiving me the opportunity to carry out my PhD studies at the Department ofBiotechnology, providing high quality of teaching and wide selection of researchinstrumentation. Together with Professor Kim Pettersson and Professor Tero Soukka, hehas created a unique cluster of knowledge and team spirit. The professors have offered meencouragement and support in research challenges, but also attractive opportunities in theform of teaching positions and other responsibilities. Soon after my recent knee operation, Irealized that I actually enjoy my job quite a lot, and not even an expert orthopedist couldmake me stay at home for the full recovery time! Not all workplaces are as appealing, I wastold…
One of the most essential pieces of the puzzle has been my supervisor Professor TeroSoukka. I want to express my deepest gratitude and respect to him for his brilliant andunique ideas, never-ending enthusiasm, unbelievable technical expertise, helpful adviceand valuable guidance. I feel really fortunate for being a member of his research group thathas an excellent reputation. Tero’s fair actions and ability to listen (not only to hear) makehim an exceptionally good boss. Additionally, despite his busy schedule, he saved mythesis several times from my evil computer that was not always cooperative.
The esteemed pre-examiners Professor Emeritus Ulf-Håkan Stenman (Helsinki Universityand Helsinki University Central Hospital) and Professor Sakari Kulmala (Aalto Univeristy)sacrificed their summer holidays to review my thesis, and I am very grateful for theirvaluable comments. I found this learning experience and future coaching extremelypositive. I also want to thank Damon Tringham who checked the English language of thethesis and guided me through “the tricks and traps of grammar”.
Then it is time to thank the ladies. A hard-working and skilful team of co-workers hassupported my way to this point. It is Dr. Katri Kuningas who is to blame for this thesis. Shewas my role model, my mentor and my everything at the beginning of my researchercareer. Soon our team was strengthened by extra girl-power from Jaana Rosenberg, TelleUkonaho, Henna Päkkilä, Johanna Vuojola, Marja-Leena Järvenpää, Riikka Arppe, MinnaYlihärsilä and Marika Nummela. The estrogen domination was afterwards diluted by SamiBlom and Timo Valta, the pioneering males in “Tero’s ompelukerho”. The students LauraJämsen, Maija Karp, Marika Ibrahim, Lumi Jaakkola, Satu Lahtinen, Kari Kopra, EssiKulta, Leena Mattsson, Anna Ahomaa and Mikko Pyykkö have also contributed to theresearch with diligence. Special thanks I owe to Henna, who reviewed the thesis before itwas handed to the pre-examiners, and who has lately shared the every-day ups and downsrelated both to work and personal life. I also owe thanks to Johanna who solved so manyWord formatting problems that I hugged her spontaneously at least three times (always onstressful deadline days).

Acknowledgements
81
I want to express my warmest thanks to Professor Emeritus Jouko Kankare and IkoHyppänen (Laboratory of Materials Chemistry and Chemical Analysis) for interestingcooperation, especially related to the publication IV. I learned a lot from these twogentlemen, who are experts with all kinds of formulas and fitting parameters. I am verygrateful also to Professor Jorma Hölsä, Dr. Mika Lastusaari, Laura Pihlgren and EmiliaHarju (Laboratory of Materials Chemistry and Chemical Analysis) for personal backuprelated to inorganic materials and photoluminescence properties. The UCP synthesis, acrucial component in my studies, would not have been possible without the valuable inputof the chemists.
International collaboration has been one part of my studies and enriched my life in so manyways. I want to thank Professor Hans Tanke, Dr. Paul Corstjens, Claudia de Dood,Annelies van der Laan, Karien Wiesmeijer, Christian Bertholle and Jan Slats (LeidenUniversity Medical Center) who provided a unique experience by welcoming me sowarmly to the Netherlands, by sharing their expertise and by introducing new analyticalmethods to me. The 3-month stay in Leiden increased my self-confidence as a researcher,but also added extra value to my free time in terms of boxing, running and musicals.Afterwards, Paul and Jan also provided important data for my thesis that I was not able tomeasure at my home university. In Turku, the visits of international students, Juan Godoy-Navajas, Heike Mader, Daniela Achatz and Raphaela Liebherr, have also been educationaland included many nice events for which I want to thank you.
I wish to express my warmest thanks to all the present and former colleagues who haveworked at the Department of Biotechnology. The input of technical and administrativepersonnel Mirja Jaala, Martti Sointusalo, Marja Maula, Marja-Liisa Knuuti, KaisaLinderborg, Görel Salomaa and Marika Silvennoinen, has been indispensable. I am alsograteful to Pirjo Laaksonen for the numerous blood samples she has collected and also forthe pleasant exercise moments along with Lambada and other “hits”. I have been fortunateto have a teaching position at the department and the other teachers, past and present, areacknowledged for their cooperation and support. Mari Peltola, Tiina Myyryläinen and theprevious PhDs, especially Dr. Katri Kuningas, Dr. Saara Wittfooth, Dr. Eeva-ChristineBrockmann and Dr. Gaurav Batra, are acknowledged for their practical advice andencouragement in the final phase of my studies. In the middle of the haste, extra energy isalways welcome and I owe my thanks to the “lunch team” including Henna Päkkilä, Dr.Saara Wittfooth, Ulla Karhunen, Noora Ristiniemi, Susanne Nuorti and some occasionallyvisiting stars, who have turned the lunch time into a social event that recharges my batteriesday after day.
I used to have more free time for friends before I started the writing process, and Iapologize for the lost moments that we could have shared during the past year. I amextremely grateful to Antti, Elisa, Janne, Johanna, Juuso, Kaisa, Maarit, Pauliina, Teija,Tytti, Virpi and their spouses, for the journey that began 10 years ago at the university andfor all the entertaining and relaxing get-togethers after that. Additionally, I want to thankTeija and Elisa for taking me to the first dancing lesson in Turku. All those countlessworkout hours and shows with the fantastic fellow “ballerinas” (e.g., Leena and Tiina!) andjazz dancers have balanced the scientific side of my life. Despite my present home inTurku, my roots are still in Pori as well as many dear friends who year after year share thejoys of Midsummer, Pori Jazz festival and other events. The New Year has been removed

Acknowledgements
82
from the list for a special reason. I am glad that friendship ignores even the physicaldistances between people.
Valtavat kiitokset teille, äiti ja isä. Rakkaus, huolenpito, kasvatus, kannustus jataloudellinen tuki ovat luoneet edellytykset kaikelle sille, mitä olen tänään jatulevaisuudessa. In addition to my parents, I want to express my gratitude to the othermembers of the family and also to Tuula, Jouni and Paula who have warmly welcomed meas a part of their family. Your confidence in me has been a strong motivator.
Finally, there are no words to express how much I value the support of my belovedhusband Riku. It was 12 years ago when you stole my heart and since then you haveguaranteed my happiness. I appreciate how you saw the limitations set by the hours in aday and the energy packed into one girl. You took full responsibility at home letting meconcentrate on finalizing the thesis. I can never forget the sandwiches on the kitchen tablewaiting for the hungry wife returning from work around midnight. Among other things,those sandwiches were spelling out your love and care – the love that means everything tome. Guess what, my best friend, lover and soul-mate, this is it: the thesis is ready and thewife is back at home. Take my hand and show me the way to the future.
This thesis is a huge milestone in my life – I will be “Doctor Riuttamäki” every single dayfor the rest of my life. You cannot imagine how grateful I am to all of you who made itpossible!
Turku, October 2011
Terhi Riuttamäki
References
83
REFERENCES
www.clinchem.org/info_ar/info_authors.dtl#standards (2011) Description of analytical methods andresults. Clinical Chemistry editorial office, (Accessed 08/302011).
Achatz DE, Meier RJ, Fischer LH & Wolfbeis OS (2011) Luminescent sensing of oxygen using aquenchable probe and upconverting nanoparticles. Angew Chem Int Ed 50:260–263.
Aebischer A, Hostettler M, Hauser J, Krämer K, Weber T, Güdel HU & Bürgi HB (2006) Structural andspectroscopic characterization of active sites in a family of light-emitting sodium lanthanidetetrafluorides. Angew Chem Int Ed 45:2802–2806.
Ali R, Saleh SM, Meier RJ, Azab HA, Abdelgawad II & Wolfbeis OS (2010) Upconverting nanoparticlebased optical sensor for carbon dioxide. Sensors Actuators B: Chem 150:126–131.
Armstrong J, Bloembergen N, Ducuing J & Pershan P (1962) Interactions between light waves in anonlinear dielectric [Review]. Physical Review 127:1918–1939.
Arppe R, Harju E, Valta T, Lahtinen S, Lastusaari M, Hölsä J & Soukka T (2011) Biofunctionalizednanosized upconverting phosphors for bioanalytical applications [Poster] #1082. Clin Chem LabMed 49:S747.
Auzel F (1966a) Compteur quantique par transfert d'energie entre deux ions de terres reres dans untungstate mixte et dans un verre. Compt Rend Acad Sci (Paris) 262:1016–1019.
Auzel F (1966b) Compteur quantique par transfert d'energie entre de Yb3+ a Tm3+ dans un tungstate mixteet dans verre germanate. Compt Rend Acad Sci (Paris) 163:819–821.
Auzel F (2004) Upconversion and anti-Stokes processes with f and d ions in solids [Review]. Chem Rev104:139–173.
Axelrod D, Hellen EH & Fulbright RM (2002) Total internal reflection fluorescence in Topics influorescence spectroscopy. Plenum Press, New York. pp. 289–343.
Bagwe RP, Hilliard LR & Tan W (2006) Surface modification of silica nanoparticles to reduceaggregation and nonspecific binding. Langmuir 22:4357–4362.
Bazin H, Trinquet E & Mathis G (2002) Time resolved amplification of cryptate emission: a versatiletechnology to trace biomolecular interactions. J Biotechnol 82:233–250.
Bednarkiewicz A, Nyk M, Samoc M & Strek W (2010) Up-conversion FRET from Er3+/Yb3+:NaYF4nanophosphor to CdSe quantum dots. J Phys Chem C 114:17535–17541.
Bhalgat MK, Haugland RP, Pollack JS, Swan S & Haugland RP (1998) Green- and red-fluorescentnanospheres for the detection of cell surface receptors by flow cytometry. J Immunol Methods219:57–68.
Bloembergen N (1959) Solid-state infrared quantum counters. Phys Rev Lett 2:84–85.Bogdan N, Vetrone F, Roy R & Capobianco JA (2010) Carbohydrate-coated lanthanide-doped
upconverting nanoparticles for lectin recognition. J Mater Chem 20:7543–7550.Bogdan N, Vetrone F, Ozin GA & Capobianco JA (2011) Synthesis of ligand-free colloidally stable water
dispersible brightly luminescent lanthanide-doped upconverting nanoparticles. Nano Lett11:835–840.
Boyer JC, Vetrone F, Cuccia LA & Capobianco JA (2006) Synthesis of colloidal upconverting NaYF4nanocrystals doped with Er3+, Yb3+ and Tm3+, Yb3+ via thermal decomposition of lanthanidetrifluoroacetate precursors. J Am Chem Soc 128:7444–7445.
Boyer JC, Cuccia LA & Capobianco JA (2007) Synthesis of colloidal upconverting NaYF4: Er3+/Yb3+andTm3+/Yb3+ monodisperse nanocrystals. Nano Lett 7:847–852.
Boyer JC, Manseau MP, Murray JI & van Veggel FC (2010) Surface modification of upconverting NaYF4nanoparticles with PEG-phosphate ligands for NIR (800 nm) biolabeling within the biologicalwindow. Langmuir 26:1157–1164.
Boyer JC & van Veggel FC (2010) Absolute quantum yield measurements of colloidal NaYF4: Er3+, Yb3+
upconverting nanoparticles. Nanoscale 2:1417–1419.
References
84
Bril A, Sommerdijk JL & de Jager AW (1975) On the efficiency of Yb3+-Er3+ activated up-conversionphosphors. J Electrochem Soc 122:660–663.
Bünzli JC & Piguet C (2005) Taking advantage of luminescent lanthanide ions [Review]. Chem Soc Rev34:1048–1077.
Carmona AK, Juliano MA & Juliano L (2009) The use of fluorescence resonance energy transfer (FRET)peptides for measurement of clinically important proteolytic enzymes. An Acad Bras Cienc81:381–392.
Caruso F, Lichtenfeld H, Donath E & Möhwald H (1999) Investigation of electrostatic interactions inpolyelectrolyte multilayer films: Binding of anionic fluorescent probes to layers assembled ontocolloids. Macromolecules 32:2317–2328.
Chan EM, Xu C, Mao AW, Han G, Owen JS, Cohen BE & Milliron DJ (2010) Reproducible, high-throughput synthesis of colloidal nanocrystals for optimization in multidimensional parameterspace. Nano Lett 10:1874–1885.
Chen D, Mauk M, Qiu X, Liu C, Kim J, Ramprasad S, Ongagna S, Abrams WR, Malamud D, CorstjensPL & Bau HH (2010a) An integrated, self-contained microfluidic cassette for isolation,amplification, and detection of nucleic acids. Biomed Microdevices 12:705–719.
Chen G, Ohulchanskyy TY, Kumar R, Ågren H & Prasad PN (2010b) Ultrasmall monodisperseNaYF4:Yb3+/Tm3+ nanocrystals with enhanced near-infrared to near-infrared upconversionphotoluminescence. ACS Nano 4:3163–3168.
Chen Z, Wang J, Qian S & Bau HH (2005) Thermally-actuated, phase change flow control formicrofluidic systems. Lab Chip 5:1277–1285.
Chen Z, Mauk MG, Wang J, Abrams WR, Corstjens PL, Niedbala RS, Malamud D & Bau HH (2007) Amicrofluidic system for saliva-based detection of infectious diseases. Ann N Y Acad Sci1098:429–436.
Chen Z, Chen H, Hu H, Yu M, Li F, Zhang Q, Zhou Z, Yi T & Huang C (2008) Versatile synthesisstrategy for carboxylic acid-functionalized upconverting nanophosphors as biological labels. JAm Chem Soc 130:3023–3029.
Cheng L, Yang K, Shao M, Lee ST & Liu Z (2011) Multicolor in vivo imaging of upconversionnanoparticles with emissions tuned by luminescence resonance energy transfer. J Phys Chem C115:2686–2692.
Chivian JS, Case WE & Eden DD (1979) The photon avalanche: a new phenomenon in Pr3+-based infraredquantum counters. Appl Phys Lett 35:124–125.
Cooper JM, Shen J, Young FM, Connolly P, Barker JR & Moores G (1994) The imaging of streptavidinand avidin using scanning tunnelling microscopy. J Mater Sci: Mater Electron 5:106–110.
Corstjens PL, Zuiderwijk M, Brink A, Li S, Feindt H, Niedbala RS & Tanke H (2001) Use of up-converting phosphor reporters in lateral-flow assays to detect specific nucleic acid sequences: arapid, sensitive DNA test to identify human papillomavirus type 16 infection. Clin Chem47:1885–1893.
Corstjens PL, Zuiderwijk M, Nilsson M, Feindt H, Niedbala RS & Tanke HJ (2003) Lateral-flow and up-converting phosphor reporters to detect single-stranded nucleic acids in a sandwich-hybridization assay. Anal Biochem 312:191–200.
Corstjens PL, Li S, Zuiderwijk M, Kardos K, Abrams WR, Niedbala RS & Tanke HJ (2005) Infrared up-converting phosphors for bioassays [Review]. IEE Proc Nanobiotechnol 152:64–72.
Corstjens PL, Chen Z, Zuiderwijk M, Bau HH, Abrams WR, Malamud D, Niedbala RS & Tanke HJ(2007) Rapid assay format for multiplex detection of humoral immune responses to infectiousdisease pathogens (HIV, HCV, and TB). Ann N Y Acad Sci 1098:437–445.
Corstjens PL, van Lieshout L, Zuiderwijk M, Kornelis D, Tanke HJ, Deelder AM & van Dam GJ (2008a)Up-converting phosphor technology-based lateral flow assay for detection of Schistosomacirculating anodic antigen in serum. J Clin Microbiol 46:171–176.
References
85
Corstjens PL, Zuiderwijk M, Tanke HJ, van der Ploeg-van Schip JJ, Ottenhoff TH & Geluk A (2008b) Auser-friendly, highly sensitive assay to detect the IFN-gamma secretion by T cells. Clin Biochem41:440–444.
Cotton S (2006) Lanthanide and actinide chemistry. Wiley, West Sussex, UK. pp. 263.Darbandi M, Thomann R & Nann T (2005) Single quantum dots in silica spheres by microemulsion
synthesis. Chem Mater 17:5720–5725.Darbandi M & Nann T (2006) One-pot synthesis of YF3@silica core/shell nanoparticles. Chem Commun
776–778.Davies C (2005) Introduction to immunoassay principles in The Immunoassay Handbook. Elsevier Ltd.,
Oxford, UK. pp. 3–40.Decher G (1997) Fuzzy nanoassemblies: Toward layered polymeric multicomposites. Science 277:1232–
1237.DeLoach LD, Payne SA, Chase LL, Smith LK, Kway WL & Krupke WF (1993) Evaluation of absorption
and emission properties of Yb3+ doped crystals for laser applications. IEEE J Quant Electron29:1179–1191.
Demchenko AP (2009) Introduction to Fluorescence Sensing. Springer, New York. pp. 590.Denk W, Strickler JH & Webb WW (1990) Two-photon laser scanning fluorescence microscopy. Science
248:73–76.Diamandis EP & Christopoulos TK (1991) The biotin-(strept)avidin system: principles and applications in
biotechnology [Review]. Clin Chem 37:625–636.Duan C & Meyerhoff ME (1994) Separation-free sandwich enzyme immunoassays using microporous
gold electrodes and self-assembled monolayer/immobilized capture antibodies. Anal Chem66:1369–1377.
Eggeling C, Widengren J, Rigler R & Seidel CAM (1998) Photobleaching of fluorescent dyes underconditions used for single-molecule detection: Evidence of two-step photolysis. Anal Chem70:2651–2659.
Ekins R (1960) The estimation of thyroxine in human plasma by an electrophoretic technique. Clin ChimActa 5:453–459.
Ekins R (1998) Ligand assays: from electrophoresis to miniaturized microarrays [Review]. Clin Chem44:2015–2030.
Eliseeva SV & Bünzli JC (2010) Lanthanide luminescence for functional materials and bio-sciences[Review]. Chem Soc Rev 39:189–227.
Fischer LH, Harms GS & Wolfbeis OS (2011) Upconverting nanoparticles for nanoscale thermometry[Review]. Angew Chem Int Ed 50:4546–4551.
Fish KN (2009) Total internal reflection fluorescence (TIRF) microscopy. Curr Protoc Cytom 50:12.18.1–12.18.13.
Förster T (1948) Zwischenmoleculare energiewanderung und fluoreszenz. Ann Phys 2:55–75.Franken P, Hill A, Peters C & Weinreich G (1961) Generation of optical harmonics. Phys Rev Lett 7:118–
119.Gaigalas AK, Wang L & Vogt RF (2007) Frequency-domain measurement of the photodegradation
process of fluorescein. Photochem Photobiol 76:22–28.Gamelin DR & Güdel HU (2001) Upconversion processes in transition metal and rare earth metal systems
[Review]. Top Curr Chem 214:1–56.Glazer AN & Hixson CS (1977) Subunit structure and chromophore composition of rhodophytan
phycoerythrins. Porphyridium cruentum B-phycoerythrin and b-phycoerythrin. J Biol Chem252:32–42.
Graf C, Vossen DLJ, Imhof A & van Blaaderen A (2003) A general method to coat colloidal particles withsilica. Langmuir 19:6693–6700.
Güdel HU (1998) New light-emitting inorganic materials. Chimia 52:561–565.
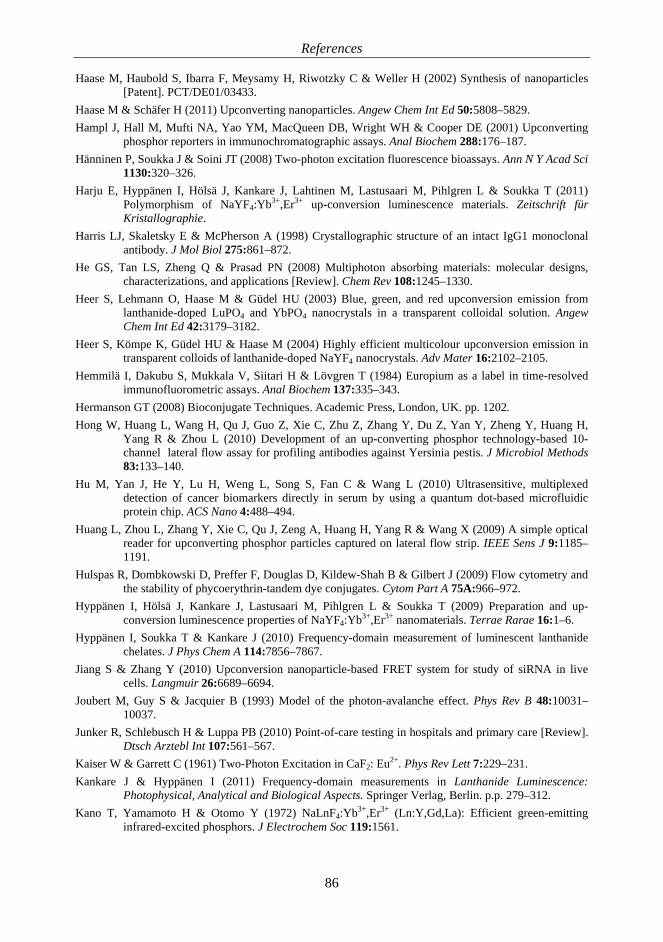
References
86
Haase M, Haubold S, Ibarra F, Meysamy H, Riwotzky C & Weller H (2002) Synthesis of nanoparticles[Patent]. PCT/DE01/03433.
Haase M & Schäfer H (2011) Upconverting nanoparticles. Angew Chem Int Ed 50:5808–5829.Hampl J, Hall M, Mufti NA, Yao YM, MacQueen DB, Wright WH & Cooper DE (2001) Upconverting
phosphor reporters in immunochromatographic assays. Anal Biochem 288:176–187.Hänninen P, Soukka J & Soini JT (2008) Two-photon excitation fluorescence bioassays. Ann N Y Acad Sci
1130:320–326.Harju E, Hyppänen I, Hölsä J, Kankare J, Lahtinen M, Lastusaari M, Pihlgren L & Soukka T (2011)
Polymorphism of NaYF4:Yb3+,Er3+ up-conversion luminescence materials. Zeitschrift fürKristallographie.
Harris LJ, Skaletsky E & McPherson A (1998) Crystallographic structure of an intact IgG1 monoclonalantibody. J Mol Biol 275:861–872.
He GS, Tan LS, Zheng Q & Prasad PN (2008) Multiphoton absorbing materials: molecular designs,characterizations, and applications [Review]. Chem Rev 108:1245–1330.
Heer S, Lehmann O, Haase M & Güdel HU (2003) Blue, green, and red upconversion emission fromlanthanide-doped LuPO4 and YbPO4 nanocrystals in a transparent colloidal solution. AngewChem Int Ed 42:3179–3182.
Heer S, Kömpe K, Güdel HU & Haase M (2004) Highly efficient multicolour upconversion emission intransparent colloids of lanthanide-doped NaYF4 nanocrystals. Adv Mater 16:2102–2105.
Hemmilä I, Dakubu S, Mukkala V, Siitari H & Lövgren T (1984) Europium as a label in time-resolvedimmunofluorometric assays. Anal Biochem 137:335–343.
Hermanson GT (2008) Bioconjugate Techniques. Academic Press, London, UK. pp. 1202.Hong W, Huang L, Wang H, Qu J, Guo Z, Xie C, Zhu Z, Zhang Y, Du Z, Yan Y, Zheng Y, Huang H,
Yang R & Zhou L (2010) Development of an up-converting phosphor technology-based 10-channel lateral flow assay for profiling antibodies against Yersinia pestis. J Microbiol Methods83:133–140.
Hu M, Yan J, He Y, Lu H, Weng L, Song S, Fan C & Wang L (2010) Ultrasensitive, multiplexeddetection of cancer biomarkers directly in serum by using a quantum dot-based microfluidicprotein chip. ACS Nano 4:488–494.
Huang L, Zhou L, Zhang Y, Xie C, Qu J, Zeng A, Huang H, Yang R & Wang X (2009) A simple opticalreader for upconverting phosphor particles captured on lateral flow strip. IEEE Sens J 9:1185–1191.
Hulspas R, Dombkowski D, Preffer F, Douglas D, Kildew-Shah B & Gilbert J (2009) Flow cytometry andthe stability of phycoerythrin-tandem dye conjugates. Cytom Part A 75A:966–972.
Hyppänen I, Hölsä J, Kankare J, Lastusaari M, Pihlgren L & Soukka T (2009) Preparation and up-conversion luminescence properties of NaYF4:Yb3+,Er3+ nanomaterials. Terrae Rarae 16:1–6.
Hyppänen I, Soukka T & Kankare J (2010) Frequency-domain measurement of luminescent lanthanidechelates. J Phys Chem A 114:7856–7867.
Jiang S & Zhang Y (2010) Upconversion nanoparticle-based FRET system for study of siRNA in livecells. Langmuir 26:6689–6694.
Joubert M, Guy S & Jacquier B (1993) Model of the photon-avalanche effect. Phys Rev B 48:10031–10037.
Junker R, Schlebusch H & Luppa PB (2010) Point-of-care testing in hospitals and primary care [Review].Dtsch Arztebl Int 107:561–567.
Kaiser W & Garrett C (1961) Two-Photon Excitation in CaF2: Eu2+. Phys Rev Lett 7:229–231.Kankare J & Hyppänen I (2011) Frequency-domain measurements in Lanthanide Luminescence:
Photophysical, Analytical and Biological Aspects. Springer Verlag, Berlin. p.p. 279–312.Kano T, Yamamoto H & Otomo Y (1972) NaLnF4:Yb3+,Er3+ (Ln:Y,Gd,La): Efficient green-emitting
infrared-excited phosphors. J Electrochem Soc 119:1561.
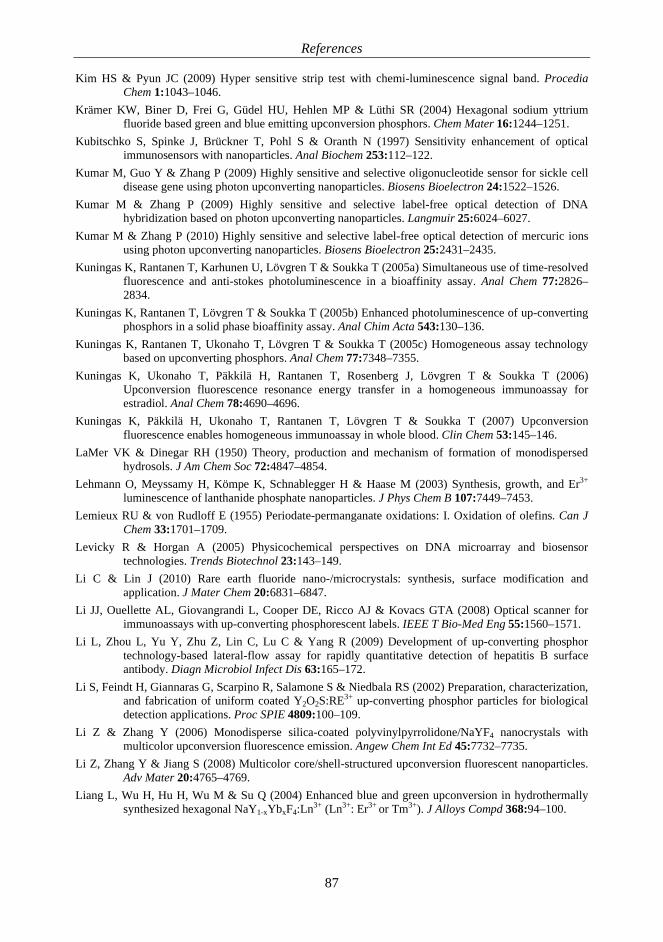
References
87
Kim HS & Pyun JC (2009) Hyper sensitive strip test with chemi-luminescence signal band. ProcediaChem 1:1043–1046.
Krämer KW, Biner D, Frei G, Güdel HU, Hehlen MP & Lüthi SR (2004) Hexagonal sodium yttriumfluoride based green and blue emitting upconversion phosphors. Chem Mater 16:1244–1251.
Kubitschko S, Spinke J, Brückner T, Pohl S & Oranth N (1997) Sensitivity enhancement of opticalimmunosensors with nanoparticles. Anal Biochem 253:112–122.
Kumar M, Guo Y & Zhang P (2009) Highly sensitive and selective oligonucleotide sensor for sickle celldisease gene using photon upconverting nanoparticles. Biosens Bioelectron 24:1522–1526.
Kumar M & Zhang P (2009) Highly sensitive and selective label-free optical detection of DNAhybridization based on photon upconverting nanoparticles. Langmuir 25:6024–6027.
Kumar M & Zhang P (2010) Highly sensitive and selective label-free optical detection of mercuric ionsusing photon upconverting nanoparticles. Biosens Bioelectron 25:2431–2435.
Kuningas K, Rantanen T, Karhunen U, Lövgren T & Soukka T (2005a) Simultaneous use of time-resolvedfluorescence and anti-stokes photoluminescence in a bioaffinity assay. Anal Chem 77:2826–2834.
Kuningas K, Rantanen T, Lövgren T & Soukka T (2005b) Enhanced photoluminescence of up-convertingphosphors in a solid phase bioaffinity assay. Anal Chim Acta 543:130–136.
Kuningas K, Rantanen T, Ukonaho T, Lövgren T & Soukka T (2005c) Homogeneous assay technologybased on upconverting phosphors. Anal Chem 77:7348–7355.
Kuningas K, Ukonaho T, Päkkilä H, Rantanen T, Rosenberg J, Lövgren T & Soukka T (2006)Upconversion fluorescence resonance energy transfer in a homogeneous immunoassay forestradiol. Anal Chem 78:4690–4696.
Kuningas K, Päkkilä H, Ukonaho T, Rantanen T, Lövgren T & Soukka T (2007) Upconversionfluorescence enables homogeneous immunoassay in whole blood. Clin Chem 53:145–146.
LaMer VK & Dinegar RH (1950) Theory, production and mechanism of formation of monodispersedhydrosols. J Am Chem Soc 72:4847–4854.
Lehmann O, Meyssamy H, Kömpe K, Schnablegger H & Haase M (2003) Synthesis, growth, and Er3+
luminescence of lanthanide phosphate nanoparticles. J Phys Chem B 107:7449–7453.Lemieux RU & von Rudloff E (1955) Periodate-permanganate oxidations: I. Oxidation of olefins. Can J
Chem 33:1701–1709.Levicky R & Horgan A (2005) Physicochemical perspectives on DNA microarray and biosensor
technologies. Trends Biotechnol 23:143–149.Li C & Lin J (2010) Rare earth fluoride nano-/microcrystals: synthesis, surface modification and
application. J Mater Chem 20:6831–6847.Li JJ, Ouellette AL, Giovangrandi L, Cooper DE, Ricco AJ & Kovacs GTA (2008) Optical scanner for
immunoassays with up-converting phosphorescent labels. IEEE T Bio-Med Eng 55:1560–1571.Li L, Zhou L, Yu Y, Zhu Z, Lin C, Lu C & Yang R (2009) Development of up-converting phosphor
technology-based lateral-flow assay for rapidly quantitative detection of hepatitis B surfaceantibody. Diagn Microbiol Infect Dis 63:165–172.
Li S, Feindt H, Giannaras G, Scarpino R, Salamone S & Niedbala RS (2002) Preparation, characterization,and fabrication of uniform coated Y2O2S:RE3+ up-converting phosphor particles for biologicaldetection applications. Proc SPIE 4809:100–109.
Li Z & Zhang Y (2006) Monodisperse silica-coated polyvinylpyrrolidone/NaYF4 nanocrystals withmulticolor upconversion fluorescence emission. Angew Chem Int Ed 45:7732–7735.
Li Z, Zhang Y & Jiang S (2008) Multicolor core/shell-structured upconversion fluorescent nanoparticles.Adv Mater 20:4765–4769.
Liang L, Wu H, Hu H, Wu M & Su Q (2004) Enhanced blue and green upconversion in hydrothermallysynthesized hexagonal NaY1-xYbxF4:Ln3+ (Ln3+: Er3+ or Tm3+). J Alloys Compd 368:94–100.
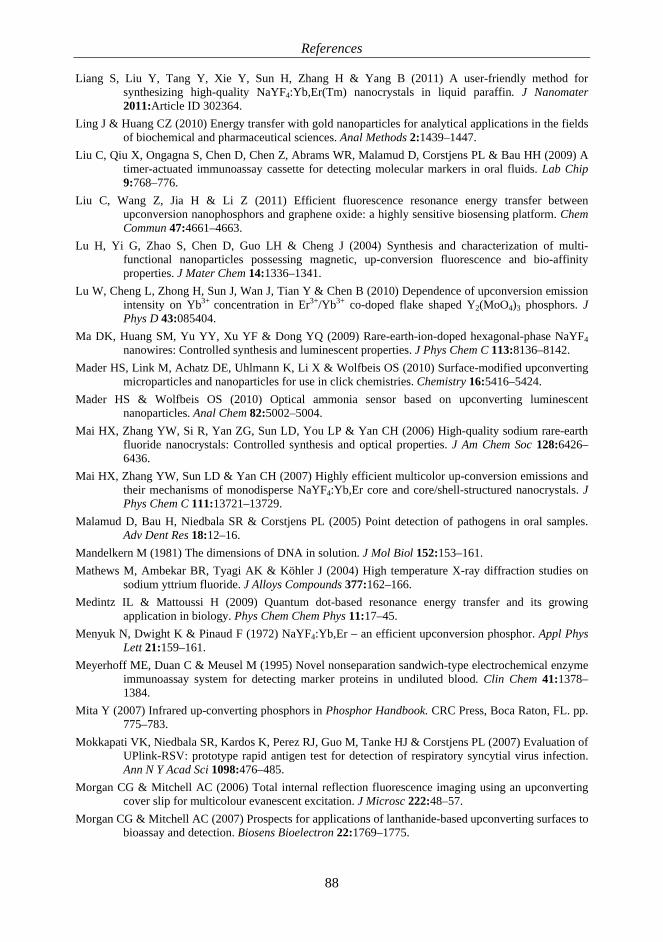
References
88
Liang S, Liu Y, Tang Y, Xie Y, Sun H, Zhang H & Yang B (2011) A user-friendly method forsynthesizing high-quality NaYF4:Yb,Er(Tm) nanocrystals in liquid paraffin. J Nanomater2011:Article ID 302364.
Ling J & Huang CZ (2010) Energy transfer with gold nanoparticles for analytical applications in the fieldsof biochemical and pharmaceutical sciences. Anal Methods 2:1439–1447.
Liu C, Qiu X, Ongagna S, Chen D, Chen Z, Abrams WR, Malamud D, Corstjens PL & Bau HH (2009) Atimer-actuated immunoassay cassette for detecting molecular markers in oral fluids. Lab Chip9:768–776.
Liu C, Wang Z, Jia H & Li Z (2011) Efficient fluorescence resonance energy transfer betweenupconversion nanophosphors and graphene oxide: a highly sensitive biosensing platform. ChemCommun 47:4661–4663.
Lu H, Yi G, Zhao S, Chen D, Guo LH & Cheng J (2004) Synthesis and characterization of multi-functional nanoparticles possessing magnetic, up-conversion fluorescence and bio-affinityproperties. J Mater Chem 14:1336–1341.
Lu W, Cheng L, Zhong H, Sun J, Wan J, Tian Y & Chen B (2010) Dependence of upconversion emissionintensity on Yb3+ concentration in Er3+/Yb3+ co-doped flake shaped Y2(MoO4)3 phosphors. JPhys D 43:085404.
Ma DK, Huang SM, Yu YY, Xu YF & Dong YQ (2009) Rare-earth-ion-doped hexagonal-phase NaYF4nanowires: Controlled synthesis and luminescent properties. J Phys Chem C 113:8136–8142.
Mader HS, Link M, Achatz DE, Uhlmann K, Li X & Wolfbeis OS (2010) Surface-modified upconvertingmicroparticles and nanoparticles for use in click chemistries. Chemistry 16:5416–5424.
Mader HS & Wolfbeis OS (2010) Optical ammonia sensor based on upconverting luminescentnanoparticles. Anal Chem 82:5002–5004.
Mai HX, Zhang YW, Si R, Yan ZG, Sun LD, You LP & Yan CH (2006) High-quality sodium rare-earthfluoride nanocrystals: Controlled synthesis and optical properties. J Am Chem Soc 128:6426–6436.
Mai HX, Zhang YW, Sun LD & Yan CH (2007) Highly efficient multicolor up-conversion emissions andtheir mechanisms of monodisperse NaYF4:Yb,Er core and core/shell-structured nanocrystals. JPhys Chem C 111:13721–13729.
Malamud D, Bau H, Niedbala SR & Corstjens PL (2005) Point detection of pathogens in oral samples.Adv Dent Res 18:12–16.
Mandelkern M (1981) The dimensions of DNA in solution. J Mol Biol 152:153–161.Mathews M, Ambekar BR, Tyagi AK & Köhler J (2004) High temperature X-ray diffraction studies on
sodium yttrium fluoride. J Alloys Compounds 377:162–166.Medintz IL & Mattoussi H (2009) Quantum dot-based resonance energy transfer and its growing
application in biology. Phys Chem Chem Phys 11:17–45.Menyuk N, Dwight K & Pinaud F (1972) NaYF4:Yb,Er – an efficient upconversion phosphor. Appl Phys
Lett 21:159–161.Meyerhoff ME, Duan C & Meusel M (1995) Novel nonseparation sandwich-type electrochemical enzyme
immunoassay system for detecting marker proteins in undiluted blood. Clin Chem 41:1378–1384.
Mita Y (2007) Infrared up-converting phosphors in Phosphor Handbook. CRC Press, Boca Raton, FL. pp.775–783.
Mokkapati VK, Niedbala SR, Kardos K, Perez RJ, Guo M, Tanke HJ & Corstjens PL (2007) Evaluation ofUPlink-RSV: prototype rapid antigen test for detection of respiratory syncytial virus infection.Ann N Y Acad Sci 1098:476–485.
Morgan CG & Mitchell AC (2006) Total internal reflection fluorescence imaging using an upconvertingcover slip for multicolour evanescent excitation. J Microsc 222:48–57.
Morgan CG & Mitchell AC (2007) Prospects for applications of lanthanide-based upconverting surfaces tobioassay and detection. Biosens Bioelectron 22:1769–1775.
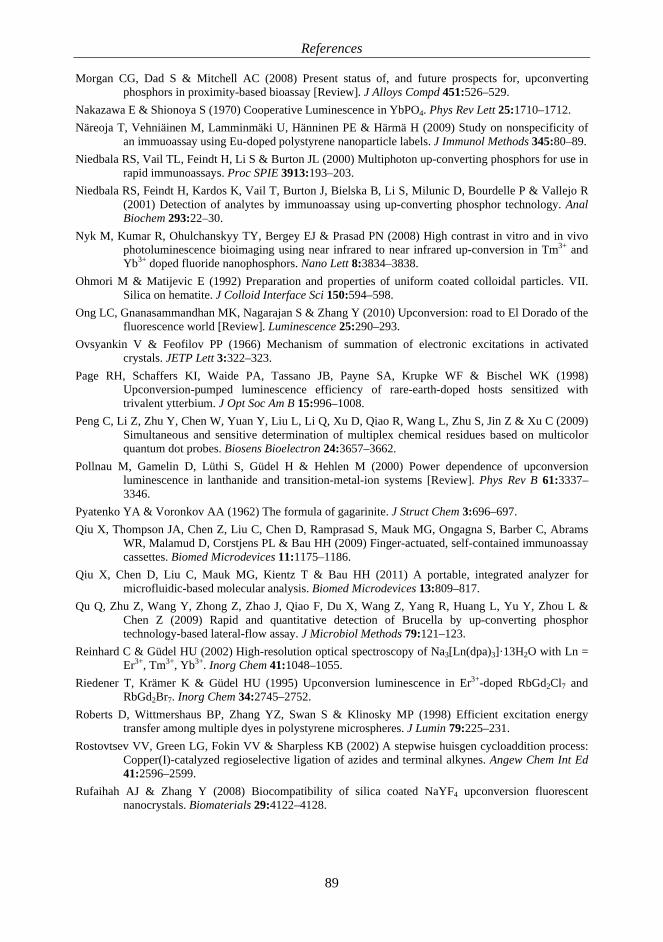
References
89
Morgan CG, Dad S & Mitchell AC (2008) Present status of, and future prospects for, upconvertingphosphors in proximity-based bioassay [Review]. J Alloys Compd 451:526–529.
Nakazawa E & Shionoya S (1970) Cooperative Luminescence in YbPO4. Phys Rev Lett 25:1710–1712.Näreoja T, Vehniäinen M, Lamminmäki U, Hänninen PE & Härmä H (2009) Study on nonspecificity of
an immuoassay using Eu-doped polystyrene nanoparticle labels. J Immunol Methods 345:80–89.Niedbala RS, Vail TL, Feindt H, Li S & Burton JL (2000) Multiphoton up-converting phosphors for use in
rapid immunoassays. Proc SPIE 3913:193–203.Niedbala RS, Feindt H, Kardos K, Vail T, Burton J, Bielska B, Li S, Milunic D, Bourdelle P & Vallejo R
(2001) Detection of analytes by immunoassay using up-converting phosphor technology. AnalBiochem 293:22–30.
Nyk M, Kumar R, Ohulchanskyy TY, Bergey EJ & Prasad PN (2008) High contrast in vitro and in vivophotoluminescence bioimaging using near infrared to near infrared up-conversion in Tm3+ andYb3+ doped fluoride nanophosphors. Nano Lett 8:3834–3838.
Ohmori M & Matijevic E (1992) Preparation and properties of uniform coated colloidal particles. VII.Silica on hematite. J Colloid Interface Sci 150:594–598.
Ong LC, Gnanasammandhan MK, Nagarajan S & Zhang Y (2010) Upconversion: road to El Dorado of thefluorescence world [Review]. Luminescence 25:290–293.
Ovsyankin V & Feofilov PP (1966) Mechanism of summation of electronic excitations in activatedcrystals. JETP Lett 3:322–323.
Page RH, Schaffers KI, Waide PA, Tassano JB, Payne SA, Krupke WF & Bischel WK (1998)Upconversion-pumped luminescence efficiency of rare-earth-doped hosts sensitized withtrivalent ytterbium. J Opt Soc Am B 15:996–1008.
Peng C, Li Z, Zhu Y, Chen W, Yuan Y, Liu L, Li Q, Xu D, Qiao R, Wang L, Zhu S, Jin Z & Xu C (2009)Simultaneous and sensitive determination of multiplex chemical residues based on multicolorquantum dot probes. Biosens Bioelectron 24:3657–3662.
Pollnau M, Gamelin D, Lüthi S, Güdel H & Hehlen M (2000) Power dependence of upconversionluminescence in lanthanide and transition-metal-ion systems [Review]. Phys Rev B 61:3337–3346.
Pyatenko YA & Voronkov AA (1962) The formula of gagarinite. J Struct Chem 3:696–697.Qiu X, Thompson JA, Chen Z, Liu C, Chen D, Ramprasad S, Mauk MG, Ongagna S, Barber C, Abrams
WR, Malamud D, Corstjens PL & Bau HH (2009) Finger-actuated, self-contained immunoassaycassettes. Biomed Microdevices 11:1175–1186.
Qiu X, Chen D, Liu C, Mauk MG, Kientz T & Bau HH (2011) A portable, integrated analyzer formicrofluidic-based molecular analysis. Biomed Microdevices 13:809–817.
Qu Q, Zhu Z, Wang Y, Zhong Z, Zhao J, Qiao F, Du X, Wang Z, Yang R, Huang L, Yu Y, Zhou L &Chen Z (2009) Rapid and quantitative detection of Brucella by up-converting phosphortechnology-based lateral-flow assay. J Microbiol Methods 79:121–123.
Reinhard C & Güdel HU (2002) High-resolution optical spectroscopy of Na3[Ln(dpa)3]·13H2O with Ln =Er3+, Tm3+, Yb3+. Inorg Chem 41:1048–1055.
Riedener T, Krämer K & Güdel HU (1995) Upconversion luminescence in Er3+-doped RbGd2Cl7 andRbGd2Br7. Inorg Chem 34:2745–2752.
Roberts D, Wittmershaus BP, Zhang YZ, Swan S & Klinosky MP (1998) Efficient excitation energytransfer among multiple dyes in polystyrene microspheres. J Lumin 79:225–231.
Rostovtsev VV, Green LG, Fokin VV & Sharpless KB (2002) A stepwise huisgen cycloaddition process:Copper(I)-catalyzed regioselective ligation of azides and terminal alkynes. Angew Chem Int Ed41:2596–2599.
Rufaihah AJ & Zhang Y (2008) Biocompatibility of silica coated NaYF4 upconversion fluorescentnanocrystals. Biomaterials 29:4122–4128.
References
90
Sanjuro A, Lau KH, Lowe D, Canizales A, Jiang N, Schneider LV, Mufti N, Rewicj RT, Johansson M &Kardos K (2000) Production of subtantially monodisperse phosphor particles [Patent].08/986196.
Santra S, Zhang P, Wang K, Tapec R & Tan W (2001) Conjugation of biomolecules with luminophore-doped silica nanoparticles for photostable biomarkers. Anal Chem 73:4988–4993.
Schäfer H, Ptacek P, Eickmeier H & Haase M (2009) Synthesis of hexagonal Yb3+,Er3+-Doped NaYF4nanocrystals at low temperature. Adv Funct Mater 19:3091–3097.
Selvan ST, Tan TT & Ying JY (2005) Robust, non-cytotoxic, silica-coated CdSe quantum dots withefficient photoluminescence. Adv Mater 17:1620–1625.
Selvin PR (1996) Lanthanide-based resonance energy transfer [Review]. IEEE J Sel Top Quant Electr2:1077–1087.
Selvin PR (2002) Principles and biophysical applications of lanthanide-based probes [Review]. Annu RevBiophys Biomol Struct 31:275–302.
Siitari H, Hemmilä I, Soini E, Lövgren T & Koistinen V (1983) Detection of hepatitis B surface antigenusing time-resolved fluoroimmunoassay. Nature 301:258–260.
Simpson CR, Kohl M, Essenpreis M & Cope M (1998) Near-infrared optical properties of ex vivo humanskin and subcutaneous tissues measured using the Monte Carlo inversion technique. Phys MedBiol 43:2465–2478.
Sivakumar S, Diamente PR & van Veggel FC (2006) Silica-coated Ln3+-doped LaF3 nanoparticles asrobust down- and upconverting biolabels. Chem -Eur J 12:5878–5884.
Snitzer E & Woodcock R (1965) Yb3+-Er3+ glass laser. Appl Phys Lett 6:45–46.Soini E & Hemmilä I (1979) Fluoroimmunoassay: Present status and key problems [Review]. Clin Chem
25:353–361.Soini E & Kojola H (1983) Time-resolved fluorometer for lanthanide chelates--a new generation of
nonisotopic immunoassays. Clin Chem 29:65–68.Soini E, Lövgren T & Reimer C (1987) Time-resolved fluorescence of lanthanide probes and applications
in biotechnology [Review]. Crit Rev Anal Chem 18:105–154.Sommerdijk J (1973) Influence of host lattice on the infrared-excited visible luminescence in Yb3+, Er3+-
doped fluorides. J Lumin 6:61–67.Soukka T, Kuningas K, Rantanen T, Haaslahti V & Lövgren T (2005) Photochemical characterization of
up-converting inorganic lanthanide phosphors as potential labels. J Fluoresc 15:513–528.Stöber W, Fink A & Bohn E (1968) Controlled growth of monodisperse silica spheres in the micron size
range. J Colloid Interface Sci 26:62–69.Sun LD, Gu JQ, Zhang SZ, Zhang YW & Yan CH (2009a) Luminescence resonance energy transfer based
on ß-NaYF4:Yb,Er nanoparticles and TRITC dye. Sci China Ser B 52:1590–1595.Sun LN, Peng H, Stich MI, Achatz D & Wolfbeis OS (2009b) pH sensor based on upconverting
luminescent lanthanide nanorods. Chem Commun 5000–5002.Suyver JF, Aebischer A, Biner D, Gerner P, Grimm J, Heer S, Krämer K, Reinhard C & Güdel HU
(2005a) Novel materials doped with trivalent lanthanides and transition metal ions showingnear-infrared to visible photon upconversion. Opt Mater 27:1111–1130.
Suyver JF, Aebischer A, García-Revilla S, Gerner P & Güdel HU (2005b) Anomalous power dependenceof sensitized upconversion luminescence [Review]. Phys Rev B 71:125123.
Suyver JF, Grimm J, Krämer KW & Güdel HU (2005c) Highly efficient near-infrared to visible up-conversion process in NaYF4:Er3+,Yb3+. J Lumin 114:53–59.
Suyver JF, Grimm J, van Veen MK, Biner D, Krämer KW & Güdel HU (2006) Upconversionspectroscopy and properties of NaYF4 doped with Er3+, Tm3+ and/or Yb3+. J Lumin 117:1–12.
Tan M, Ye Z, Wang G & Yuan J (2004) Preparation and time-resolved fluorometric application ofluminescent europium nanoparticles. Chem Mater 16:2494–2498.
References
91
Tornoe CW, Christensen C & Meldal M (2002) Peptidotriazoles on solid phase: [1,2,3]-triazoles byregiospecific copper(I)-catalyzed 1,3-dipolar cycloadditions of terminal alkynes to azides. J OrgChem 67:3057–3064.
Ueda H (2002) Open Sandwich Immunoassay: A novel immunoassay approach based on the interchaininteraction of an antibody variable region [Review]. J Biosci Bioeng 94:614–619.
Ukonaho T, Rantanen T, Jämsen L, Kuningas K, Päkkilä H, Lövgren T & Soukka T (2007) Comparison ofinfrared-excited up-converting phosphors and europium nanoparticles as labels in a two-siteimmunoassay. Anal Chim Acta 596:106–115.
Välimaa L, Sjöroos M, Luhtala M, Toivanen P, Lövgren T & Ilonen J (1998) Detection of HLA-B27alleles by group-specific amplification and time-resolved fluorometry. J Immunol Methods219:131–137.
van de Rijke F, Zijlmans H, Li S, Vail T, Raap AK, Niedbala RS & Tanke HJ (2001) Up-convertingphosphor reporters for nucleic acid microarrays. Nature Biotech 19:273–276.
Vetrone F, Boyer JC, Capobianco JA, Speghini A & Bettinelli M (2003) Effect of Yb3+ codoping on theupconversion emission in nanocrystalline Y2O3:Er3+. J Phys Chem B 107:1107–1112.
Vetrone F, Naccache R, Morgan CG & Capobianco JA (2010a) Luminescence resonance energy transferfrom an upconverting nanoparticle to a fluorescent phycobiliprotein. Nanoscale 2:1185.
Vetrone F, Naccache R, Zamarron A, de la Fuente AJ, Sanz-Rodriguez F, Martinez Maestro L, MartinRodriguez E, Jaque D, Garcia Sole J & Capobianco JA (2010b) Temperature sensing usingfluorescent nanothermometers. ACS Nano 4:3254–3258.
Wang F & Liu X (2008) Upconversion multicolor fine-tuning: Visible to near-infrared emission fromlanthanide-doped NaYF4 nanoparticles. J Am Chem Soc 130:5642–5643.
Wang F & Liu X (2009) Recent advances in the chemistry of lanthanide-doped upconversion nanocrystals[Review]. Chem Soc Rev 38:976–989.
Wang F, Han Y, Lim CS, Lu Y, Wang J, Xu J, Chen H, Zhang C, Hong M & Liu X (2010) Simultaneousphase and size control of upconversion nanocrystals through lanthanide doping. Nature463:1061–1065.
Wang J, Chen Z, Corstjens PL, Mauk MG & Bau HH (2006) A disposable microfluidic cassette for DNAamplification and detection. Lab Chip 6:46–53.
Wang L, Yan R, Huo Z, Wang L, Zeng J, Bao J, Wang X, Peng Q & Li Y (2005) Fluorescence resonantenergy transfer biosensor based on upconversion-luminescent nanoparticles. Angew Chem Int Ed44:6054–6057.
Wang L & Li Y (2006) Green upconversion nanocrystals for DNA detection. Chem Commun 24:2557–2559.
Wang M, Hou W, Mi CC, Wang WX, Xu ZR, Teng HH, Mao CB & Xu SK (2009a) Immunoassay of goatantihuman immunoglobulin G antibody based on luminescence resonance energy transferbetween near-infrared responsive NaYF4:Yb, Er upconversion fluorescent nanoparticles andgold nanoparticles. Anal Chem 81:8783–8789.
Wang Y, Tu L, Zhao J, Sun Y, Kong X & Zhang H (2009b) Upconversion luminescence of ß-NaYF4:Yb3+, Er3+@ß-NaYF4 core/shell nanoparticles: excitation power density and surface dependence.J Phys Chem C 113:7164–7169.
Waynant RW, Ilev IK & Gannor I (2001) Mid-infrared laser applications in medicine and biology. PhilTrans R Soc Lond A 359:635–644.
Wei Y, Lu F, Zhang X & Chen D (2007) Synthesis and characterization of efficient near-infraredupconversion Yb and Tm codoped NaYF4 nanocrystal reporter. J Alloys Compounds 427:333–340.
Wilchek M, Bayer EA & Livnah O (2006) Essentials of biorecognition: the (strept)avidin-biotin system asa model for protein-protein and protein-ligand interaction [Review]. Immunol Lett 103:27–32.
Wollenberger LV, Yao YMM, Mufti NA & Schneider LV (1997) Detection of DNA using upconvertingphosphor reporter probes. Proc SPIE 2985:100–111.
References
92
Wright WH, Mufti NA, Tagg NT, Webb RR & Schneider LV (1997) High-sensitivity immunoassay usinga novel upconverting phosphor reporter. Proc SPIE 2985:248–255.
Wybourne BG (1965) Spectroscopic properties of rare earths. Interscience Publishers, New York. pp. 237.Xiao X, Haushalter JP & Faris GW (2005) Upconversion from aqueous phase lanthanide chelates. Opt
Lett 30:1674–1676.Xing Y & Rao J (2008) Quantum dot bioconjugates for in vitro diagnostics & in vivo imaging. Cancer
Biomark 4:307–319.Xu CT, Axelsson J & Andersson-Engels S (2009) Fluorescence diffuse optical tomography using
upconverting nanoparticles. Appl Phys Lett 94:251107.Yalow RS & Berson SA (1960) Immunoassay of endogenous plasma insulin in man. J Clin Invest
39:1157–1175.Yan C, Dadvand A, Rosei F & Perepichka DF (2010) Near-IR photoresponse in new up-converting
CdSe/NaYF4:Yb,Er nanoheterostructures. J Am Chem Soc 132:8868–8869.Yan Z, Zhou L, Zhao Y, Wang J, Huang L, Hu K, Liu H, Wang H, Guo Z & Song Y (2006) Rapid
quantitative detection of Yersinia pestis by lateral-flow immunoassay and up-convertingphosphor technology-based biosensor. Sensors Actuators B: Chem 119:656–663.
Ye X, Collins JE, Kang Y, Chen J, Chen DTN, Yodh AG & Murray CB (2010) Morphologicallycontrolled synthesis of colloidal upconversion nanophosphors and their shape-directed self-assembly. Proc Natl Acad Sci USA 107:22430–22435.
Yi DK, Selvan ST, Lee SS, Papaefthymiou GC, Kundaliya D & Ying JY (2005) Silica-coatednanocomposites of magnetic nanoparticles and quantum dots. J Am Chem Soc 127:4990–4991.
Yi GS, Lu H, Zhao S, Ge Y, Yang W, Chen D & Guo LH (2004) Synthesis, characterization, andbiological application of size-controlled nanocrystalline NaYF4:Yb,Er infrared-to-visible up-conversion phosphors. Nano Lett 4:2191–2196.
Yi GS & Chow GM (2006) Synthesis of hexagonal-phase NaYF4:Yb,Er and NaYF4:Yb,Tm nanocrystalswith efficient up-conversion fluorescence. Adv Funct Mater 16:2324–2329.
Yi GS & Chow GM (2007) Water-soluble NaYF4:Yb,Er(Tm)/NaYF4/polymer core/shell/shellnanoparticles with significant enhancement of upconversion fluorescence. Chem Mater 19:341–343.
Ylihärsilä M, Valta T, Karp M, Hattara L, Harju E, Hölsä J, Saviranta P, Waris M & Soukka T (2011)Oligonucleotide array-in-well platform for detection and genotyping human adenoviruses byutilizing upconverting phosphor label technology. Anal Chem 83:1456–1461.
Zarling DA, Rossi MJ, Peppers NA, Kane J, Faris GW & Dyer MJ (1994) Up-converting reporters forbiological and other assays using laser excitation techniques [Patent]. PCT/US93/08712.
Zeng JH, Su J, Li ZH, Yan RX & Li YD (2005) Synthesis and upconversion luminescence of hexagonal-phase NaYF4:Yb, Er3+ phosphors of controlled size and morphology. Adv Mater 17:2119–2123.
Zeng SM, Yankowitz J, Widness JA & Strauss RG (2001) Etiology of differences in hematocrit betweenmales and females: sequence-based polymorphisms in erythropoietin and its receptor. J GendSpecif Med 4:35–40.
Zhang H & Meyerhoff ME (2006) Gold-coated magnetic particles for solid-phase immunoassays:enhancing immobilized antibody binding efficiency and analytical performance. Anal Chem78:609–616.
Zhang H, Li Y, Lin Y, Huang Y & Duan X (2011) Composition tuning the upconversion emission inNaYF4:Yb/Tm hexaplate nanocrystals. Nanoscale 3:963–966.
Zhang J, Shade CM, Chengelis DA & Petoud S (2007) A strategy to protect and sensitize near-infraredluminescent Nd3+ and Yb3+: Organic tropolonate ligands for the sensitization of Ln3+-dopedNaYF4 nanocrystals. J Am Chem Soc 129:14834–14835.
Zhang J & Petoud S (2008) Azulene-moiety-based ligand for the efficient sensitization of four near-infrared luminescent lanthanide cations: Nd3+, Er3+, Tm3+, and Yb3+. Chemistry 14:1264–1272.
References
93
Zhang L, Hu H, Qi C & Lin F (2001) Spectroscopic properties and energy transfer in Yb3+/Er3+-dopedphosphate glasses. Opt Mater 17:371–377.
Zhang P, Rogelj S, Nguyen K & Wheeler D (2006) Design of a highly sensitive and specific nucleotidesensor based on photon upconverting particles. J Am Chem Soc 128:12410–12411.
Zhang Q, Song K, Zhao J, Kong X, Sun Y, Liu X, Zhang Y, Zeng Q & Zhang H (2009a) Hexanedioic acidmediated surface-ligand-exchange process for transferring NaYF4:Yb/Er (or Yb/Tm) up-converting nanoparticles from hydrophobic to hydrophilic. J Colloid Interface Sc 336:171–175.
Zhang SZ, Sun LD, Tian H, Liu Y, Wang JF & Yan CH (2009b) Reversible luminescence switching ofNaYF4:Yb,Er nanoparticles with controlled assembly of gold nanoparticles. Chem Commun2547–2549.
Zijlmans HJ, Bonnet J, Burton J, Kardos K, Vail T, Niedbala RS & Tanke HJ (1999) Detection of cell andtissue surface antigens using up-converting phosphors: a new reporter technology. Anal Biochem267:30–36.
Zucchi G, Maury O, Thuéry P, Gumy F, Bünzli JC & Ephritikhine M (2009) 2,2'-Bipyrimidine as efficientsensitizer of the solid-state luminescence of lanthanide and uranyl ions from visible to near-infrared. Chemistry 15:9686–9696.
Zuiderwijk M, Tanke HJ, Sam Niedbala R & Corstjens PL (2003) An amplification-free hybridization-based DNA assay to detect Streptococcus pneumoniae utilizing the up-converting phosphortechnology. Clin Biochem 36:401–403.