Embed Size (px)
Citation preview
UCCSN Enrollment Planning
UCCSN Enrollment Planning
Information to support the preparation of the 2005-07 biennial budget
Information to support the preparation of the 2005-07 biennial budget
University & Community
College System of Nevada
January 2004 Presentation to the UCCSN Board of Regents –Budget & Finance Committee
Presentation to the UCCSN Board of Regents –Budget & Finance Committee
2
Presentation ObjectivePresentation Objective
Provide information to support decision making in the preparation of the 2005-07 biennial budget
UCCSN Enrollment History Enrollment Plans (2003-04 thru 2012-13)Population Trends & Demographics
20031994Looking Back (1994 – 2003)
2012Looking Forward (2003 – 2012)
UCCSN Enrollment HistoryUCCSN Enrollment History
4
Headcount Enrollment Headcount Enrollment
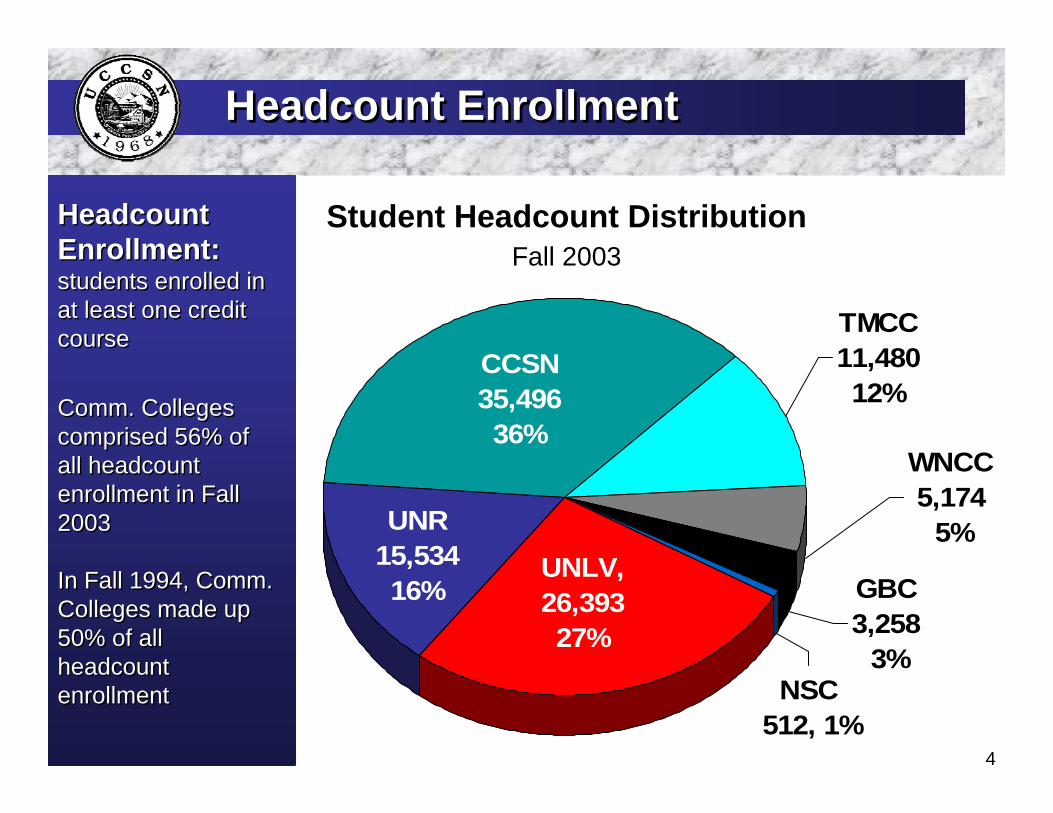
Headcount Enrollment: students enrolled in at least one credit course
Comm. Colleges comprised 56% of all headcount enrollment in Fall 2003
In Fall 1994, Comm. Colleges made up 50% of all headcount enrollment
Headcount Enrollment: students enrolled in at least one credit course
Comm. Colleges comprised 56% of all headcount enrollment in Fall 2003
In Fall 1994, Comm. Colleges made up 50% of all headcount enrollment
GBC 3,258 3%
NSC 512, 1%
WNCC 5,174 5%
TMCC 11,480 12%
UNLV, 26,393 27%
UNR 15,534 16%
CCSN 35,496 36%
Student Headcount DistributionFall 2003
5
Enrollment HistoryEnrollment History
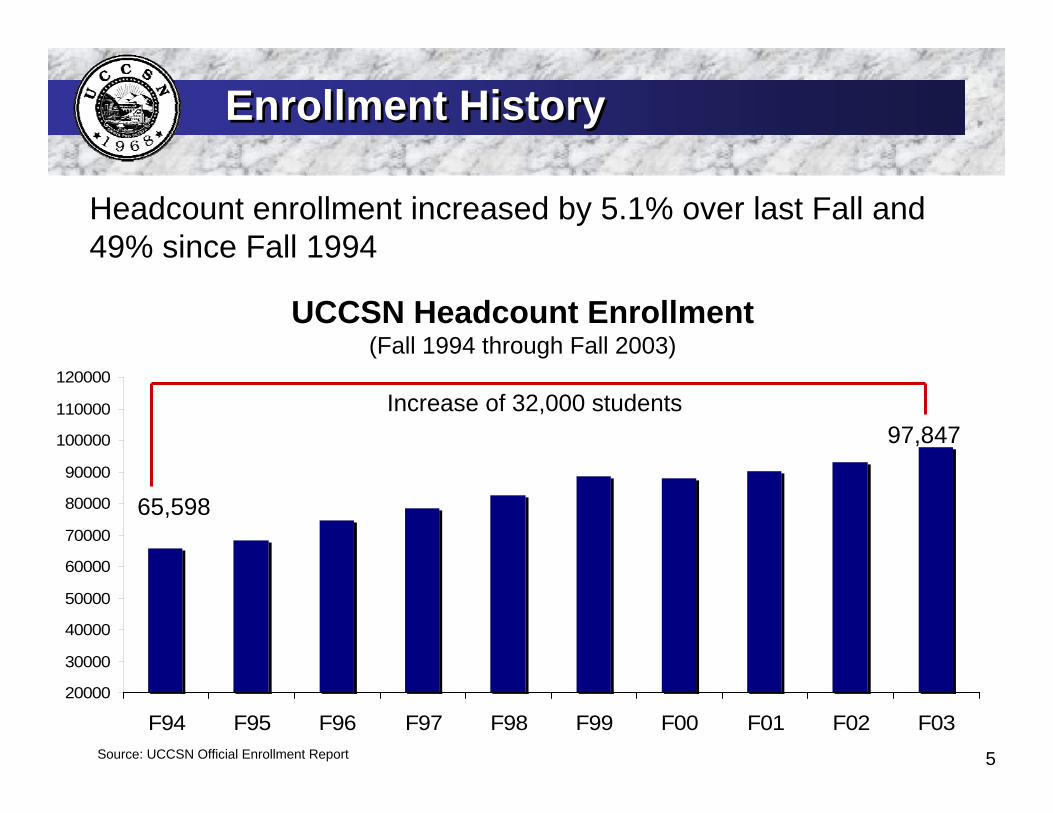
Headcount enrollment increased by 5.1% over last Fall and 49% since Fall 1994
UCCSN Headcount Enrollment(Fall 1994 through Fall 2003)
20000
30000
40000
50000
60000
70000
80000
90000
100000
110000
120000
F94 F95 F96 F97 F98 F99 F00 F01 F02 F03Source: UCCSN Official Enrollment Report
65,598
97,847Increase of 32,000 students
6
Enrollment HistoryEnrollment History
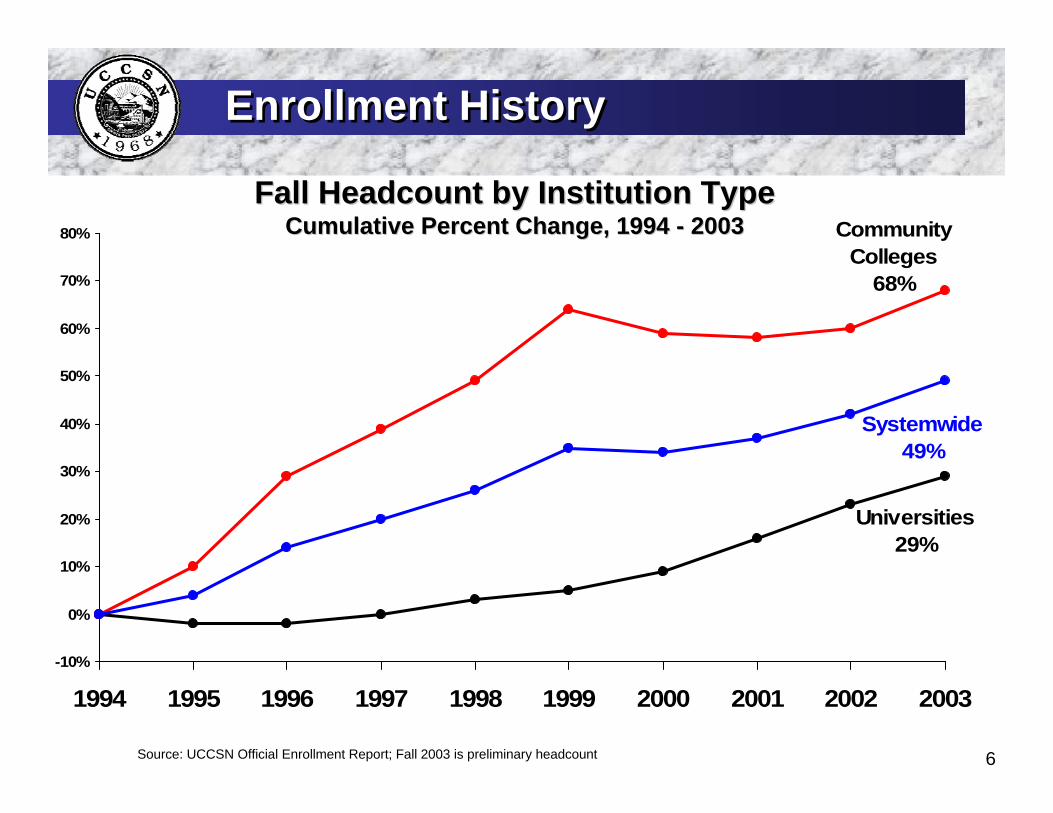
Universities 29%
Community Colleges
68%
Systemwide49%
-10%
0%
10%
20%
30%
40%
50%
60%
70%
80%
1994 1995 1996 1997 1998 1999 2000 2001 2002 2003
Fall Headcount by Institution Type Fall Headcount by Institution Type Cumulative Percent Change, 1994 Cumulative Percent Change, 1994 -- 20032003
Source: UCCSN Official Enrollment Report; Fall 2003 is preliminary headcount
7
Enrollment HistoryEnrollment History
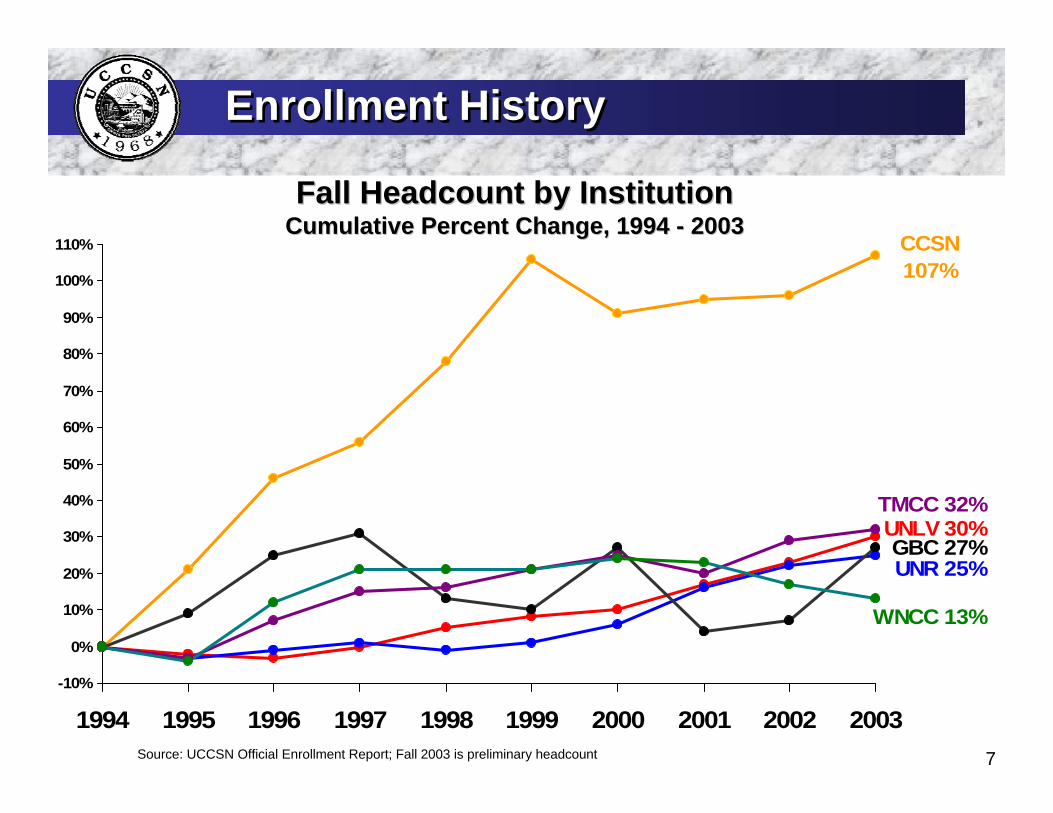
UNLV 30%
UNR 25%
CCSN 107%
GBC 27%
TMCC 32%
WNCC 13%
-10%
0%
10%
20%
30%
40%
50%
60%
70%
80%
90%
100%
110%
1994 1995 1996 1997 1998 1999 2000 2001 2002 2003
Fall Headcount by Institution Fall Headcount by Institution Cumulative Percent Change, 1994 Cumulative Percent Change, 1994 -- 20032003
Source: UCCSN Official Enrollment Report; Fall 2003 is preliminary headcount
8
Enrollment PlansEnrollment Plans
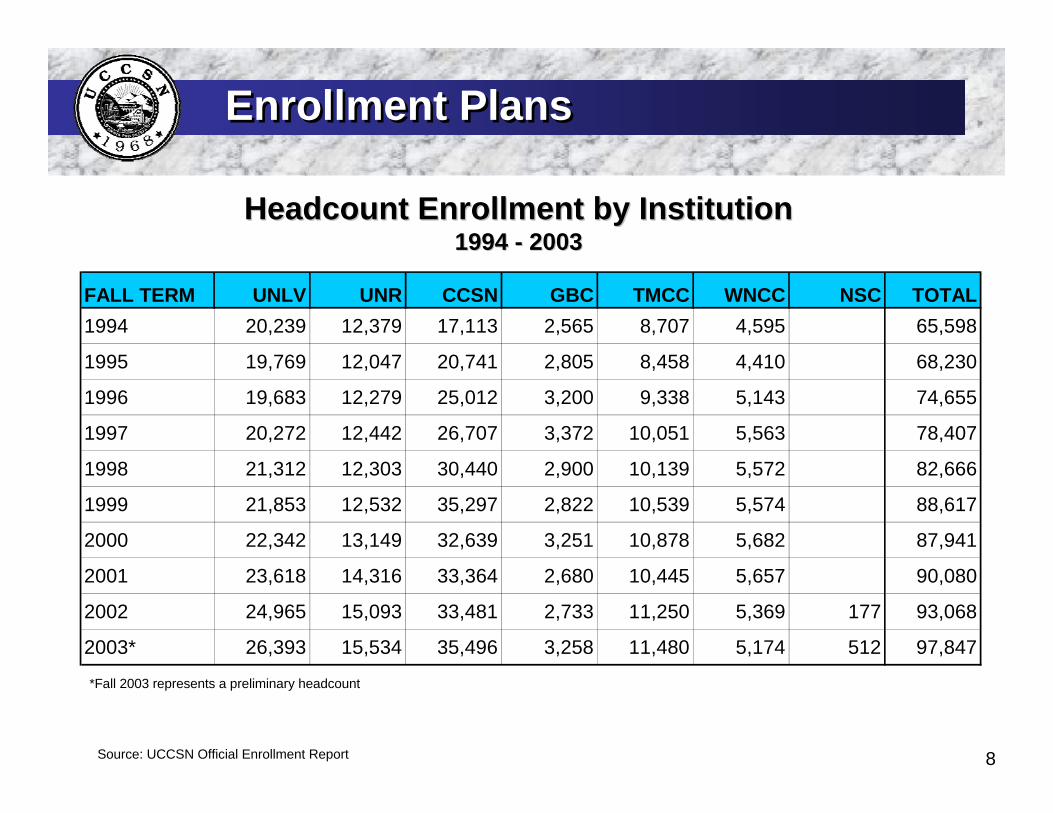
Headcount Enrollment by Institution Headcount Enrollment by Institution 1994 1994 -- 20032003
*Fall 2003 represents a preliminary headcount
FALL TERM UNLV UNR CCSN GBC TMCC WNCC NSC TOTAL1994 20,239 12,379 17,113 2,565 8,707 4,595 65,598
1995 19,769 12,047 20,741 2,805 8,458 4,410 68,230
1996 19,683 12,279 25,012 3,200 9,338 5,143 74,655
1997 20,272 12,442 26,707 3,372 10,051 5,563 78,407
1998 21,312 12,303 30,440 2,900 10,139 5,572 82,666
1999 21,853 12,532 35,297 2,822 10,539 5,574 88,617
2000 22,342 13,149 32,639 3,251 10,878 5,682 87,941
2001 23,618 14,316 33,364 2,680 10,445 5,657 90,080
2002 24,965 15,093 33,481 2,733 11,250 5,369 177 93,068
2003* 26,393 15,534 35,496 3,258 11,480 5,174 512 97,847
Source: UCCSN Official Enrollment Report
9
Full-time Equivalent Enrollment Full-time Equivalent Enrollment
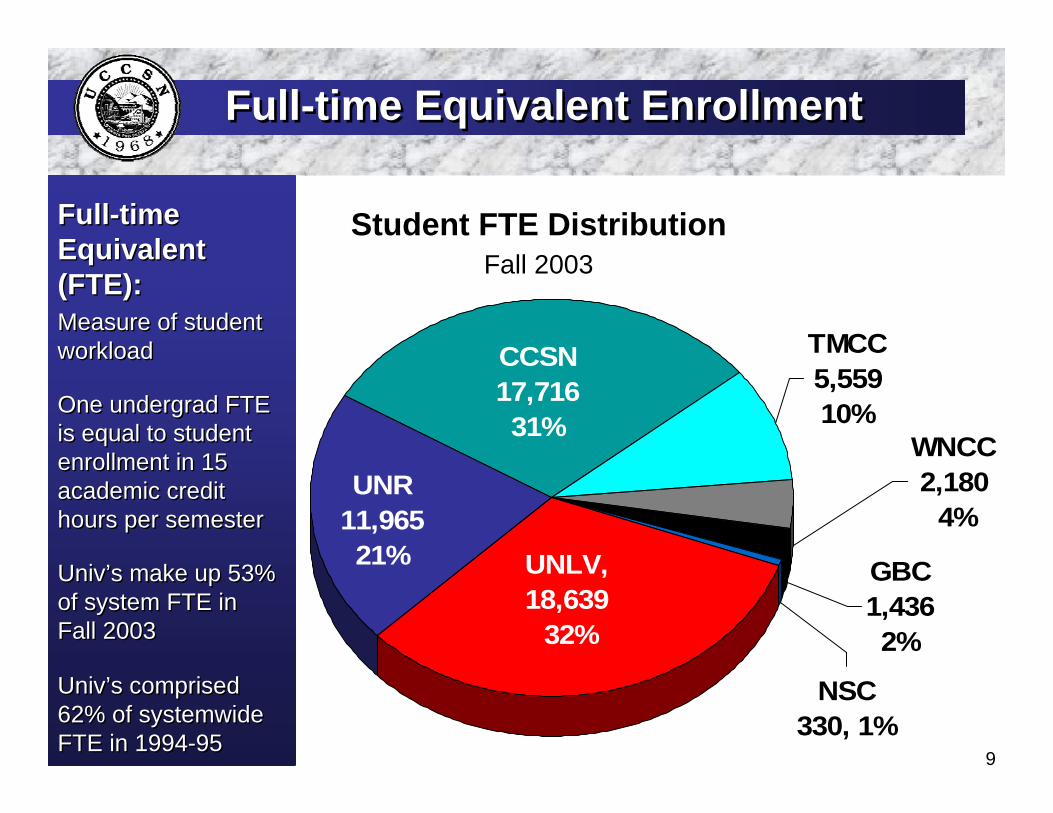
Full-time Equivalent (FTE):Measure of student workload
One undergrad FTE is equal to student enrollment in 15 academic credit hours per semester
Univ’s make up 53% of system FTE in Fall 2003
Univ’s comprised 62% of systemwide FTE in 1994-95
Full-time Equivalent (FTE):Measure of student workload
One undergrad FTE is equal to student enrollment in 15 academic credit hours per semester
Univ’s make up 53% of system FTE in Fall 2003
Univ’s comprised 62% of systemwide FTE in 1994-95
NSC 330, 1%
GBC 1,436 2%
WNCC 2,180 4%
TMCC 5,559 10%
UNLV, 18,639 32%
UNR 11,965 21%
CCSN 17,716 31%
Student FTE DistributionFall 2003
10
Enrollment HistoryEnrollment History
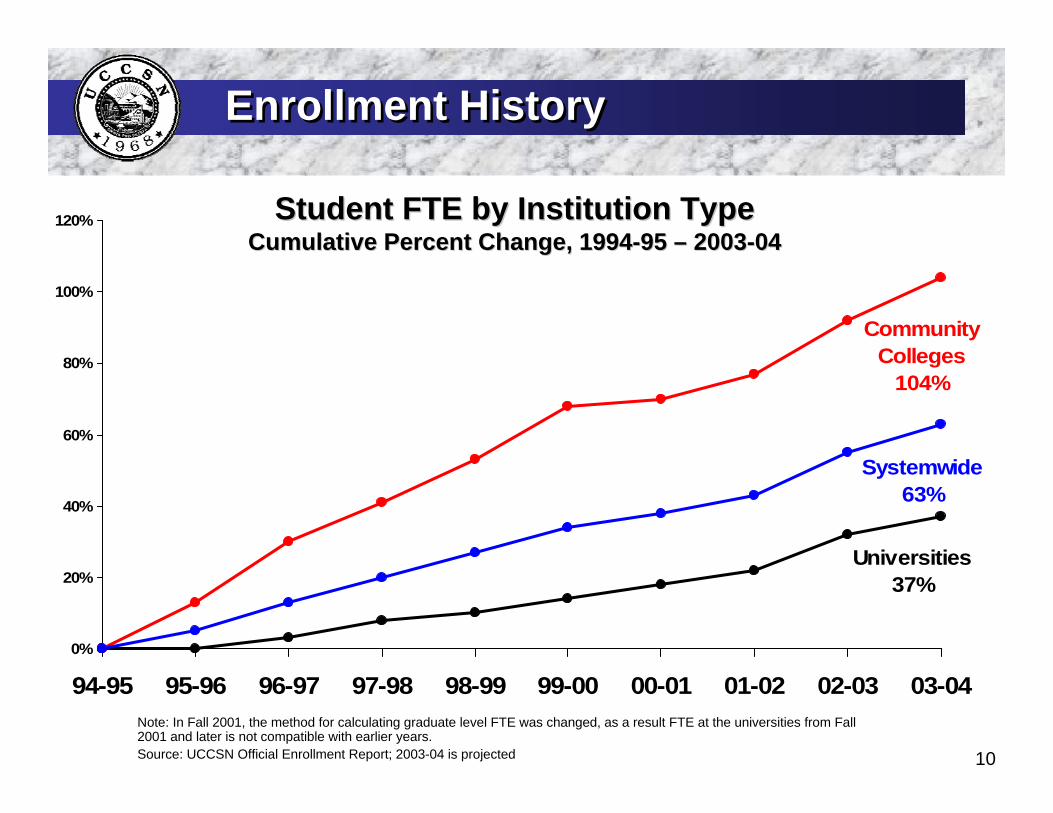
Universities 37%
Community Colleges
104%
Systemwide63%
0%
20%
40%
60%
80%
100%
120%
94-95 95-96 96-97 97-98 98-99 99-00 00-01 01-02 02-03 03-04
Student FTE by Institution Type Student FTE by Institution Type Cumulative Percent Change, 1994Cumulative Percent Change, 1994--95 95 –– 20032003--0404
Source: UCCSN Official Enrollment Report; 2003-04 is projected
Note: In Fall 2001, the method for calculating graduate level FTE was changed, as a result FTE at the universities from Fall 2001 and later is not compatible with earlier years.
11
Enrollment HistoryEnrollment History
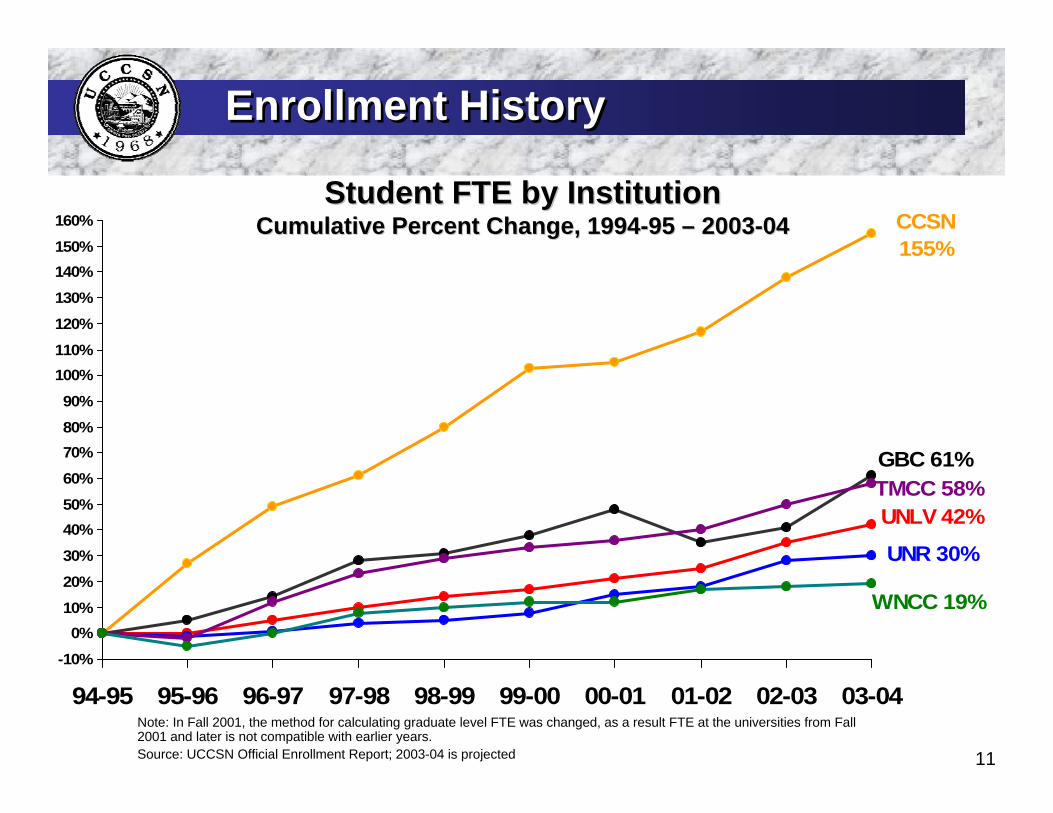
UNLV 42%
UNR 30%
CCSN 155%
GBC 61%TMCC 58%
WNCC 19%
-10%
0%10%
20%
30%
40%50%
60%
70%80%
90%
100%110%
120%
130%
140%150%
160%
94-95 95-96 96-97 97-98 98-99 99-00 00-01 01-02 02-03 03-04
Student FTE by InstitutionStudent FTE by InstitutionCumulative Percent Change, 1994Cumulative Percent Change, 1994--95 95 –– 20032003--0404
Source: UCCSN Official Enrollment Report; 2003-04 is projected
Note: In Fall 2001, the method for calculating graduate level FTE was changed, as a result FTE at the universities from Fall 2001 and later is not compatible with earlier years.
12
Enrollment PlansEnrollment Plans
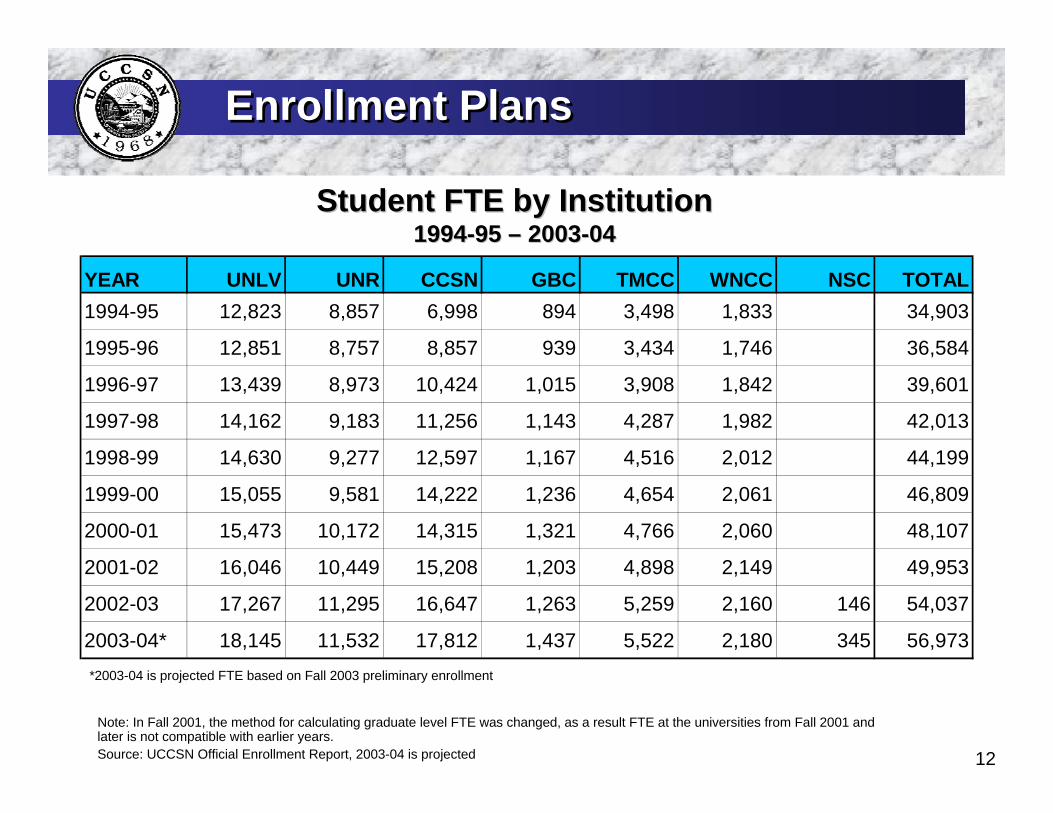
Student FTE by Institution Student FTE by Institution 19941994--95 95 –– 20032003--0404
Source: UCCSN Official Enrollment Report, 2003-04 is projected
*2003-04 is projected FTE based on Fall 2003 preliminary enrollment
Note: In Fall 2001, the method for calculating graduate level FTE was changed, as a result FTE at the universities from Fall 2001 and later is not compatible with earlier years.
YEAR UNLV UNR CCSN GBC TMCC WNCC NSC TOTAL1994-95 12,823 8,857 6,998 894 3,498 1,833 34,903
1995-96 12,851 8,757 8,857 939 3,434 1,746 36,584
1996-97 13,439 8,973 10,424 1,015 3,908 1,842 39,601
1997-98 14,162 9,183 11,256 1,143 4,287 1,982 42,013
1998-99 14,630 9,277 12,597 1,167 4,516 2,012 44,199
1999-00 15,055 9,581 14,222 1,236 4,654 2,061 46,809
2000-01 15,473 10,172 14,315 1,321 4,766 2,060 48,107
2001-02 16,046 10,449 15,208 1,203 4,898 2,149 49,953
2002-03 17,267 11,295 16,647 1,263 5,259 2,160 146 54,037
2003-04* 18,145 11,532 17,812 1,437 5,522 2,180 345 56,973

Enrollment PlansEnrollment Plans
14
Development of Enrollment Plans– Each biennium institutions provide 10-year
enrollment plans– Institutions are asked to provide visionary, practical
and attainable plans – Also asked to consider the following factors
• actual and projected rates of Nevada high school graduates • population growth in local service areas • historical and projected participation rates
Uses of Enrollment Plans– driver in space needs calculations– supporting information in development of capital
appropriations– method for developing systemwide 10-yr projections
Enrollment PlansEnrollment Plans
15
60000
70000
80000
90000
100000
110000
120000
130000
140000
150000
160000
F03 F04 F05 F06 F07 F08 F09 F10 F11 F12
Projected EnrollmentProjected Enrollment
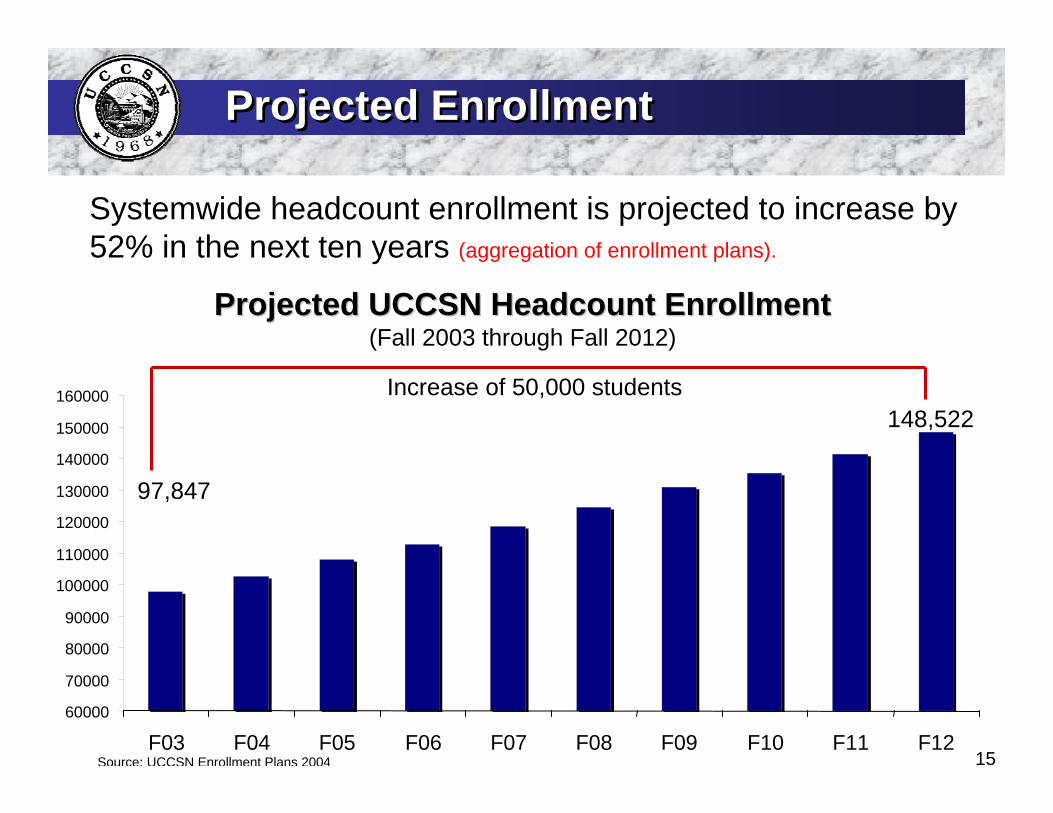
Systemwide headcount enrollment is projected to increase by 52% in the next ten years (aggregation of enrollment plans).
Projected UCCSN Headcount EnrollmentProjected UCCSN Headcount Enrollment(Fall 2003 through Fall 2012)
Source: UCCSN Enrollment Plans 2004
148,522
97,847
Increase of 50,000 students
16
Projected EnrollmentProjected Enrollment
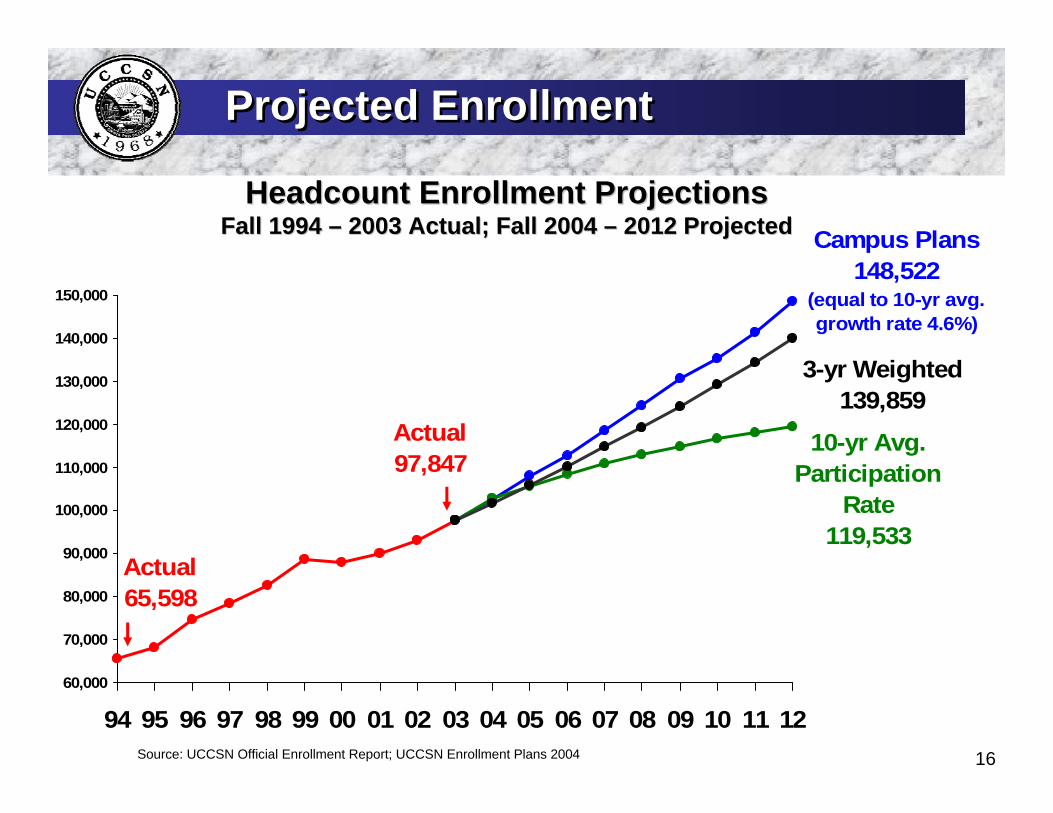
Actual 65,598
Actual 97,847
Campus Plans 148,522
(equal to 10-yr avg. growth rate 4.6%)
10-yr Avg. Participation
Rate 119,533
3-yr Weighted 139,859
60,000
70,000
80,000
90,000
100,000
110,000
120,000
130,000
140,000
150,000
94 95 96 97 98 99 00 01 02 03 04 05 06 07 08 09 10 11 12
Headcount Enrollment ProjectionsHeadcount Enrollment ProjectionsFall 1994 Fall 1994 –– 2003 Actual; Fall 2004 2003 Actual; Fall 2004 –– 2012 Projected2012 Projected
Source: UCCSN Official Enrollment Report; UCCSN Enrollment Plans 2004
17
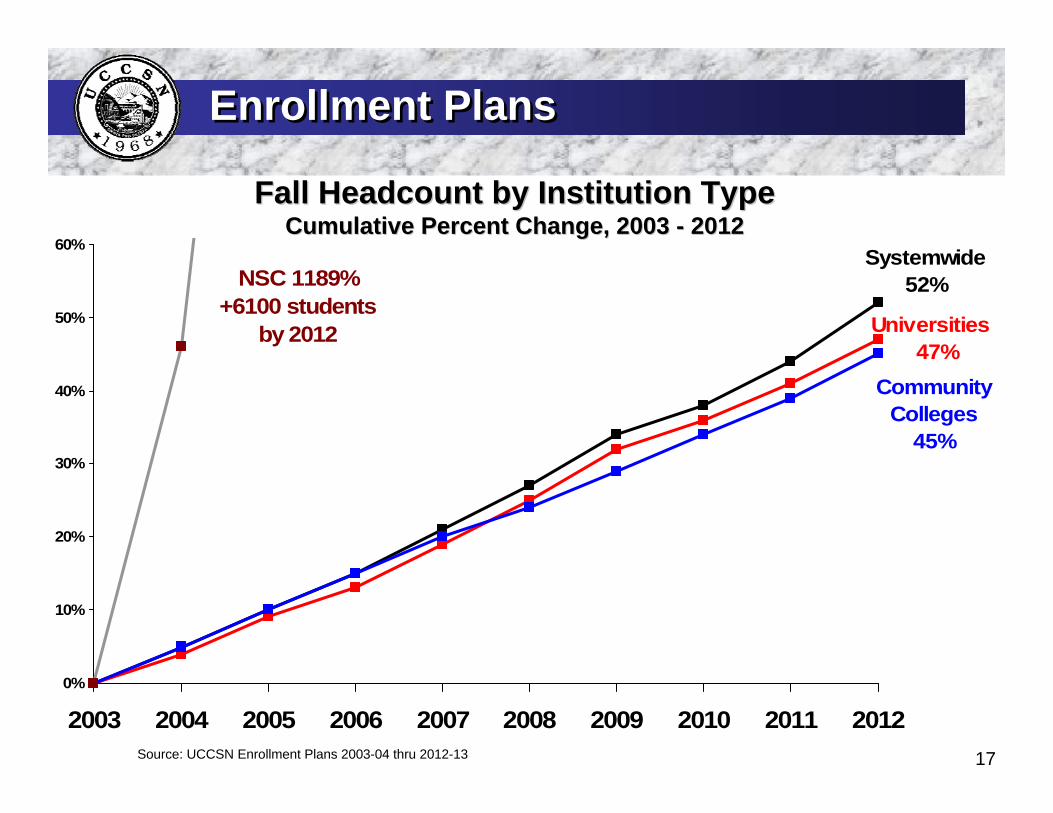
Enrollment PlansEnrollment Plans
Systemwide52%
Universities 47%
Community Colleges
45%
NSC 1189%+6100 students
by 2012
0%
10%
20%
30%
40%
50%
60%
2003 2004 2005 2006 2007 2008 2009 2010 2011 2012
Fall Headcount by Institution Type Fall Headcount by Institution Type Cumulative Percent Change, 2003 Cumulative Percent Change, 2003 -- 20122012
Source: UCCSN Enrollment Plans 2003-04 thru 2012-13
18
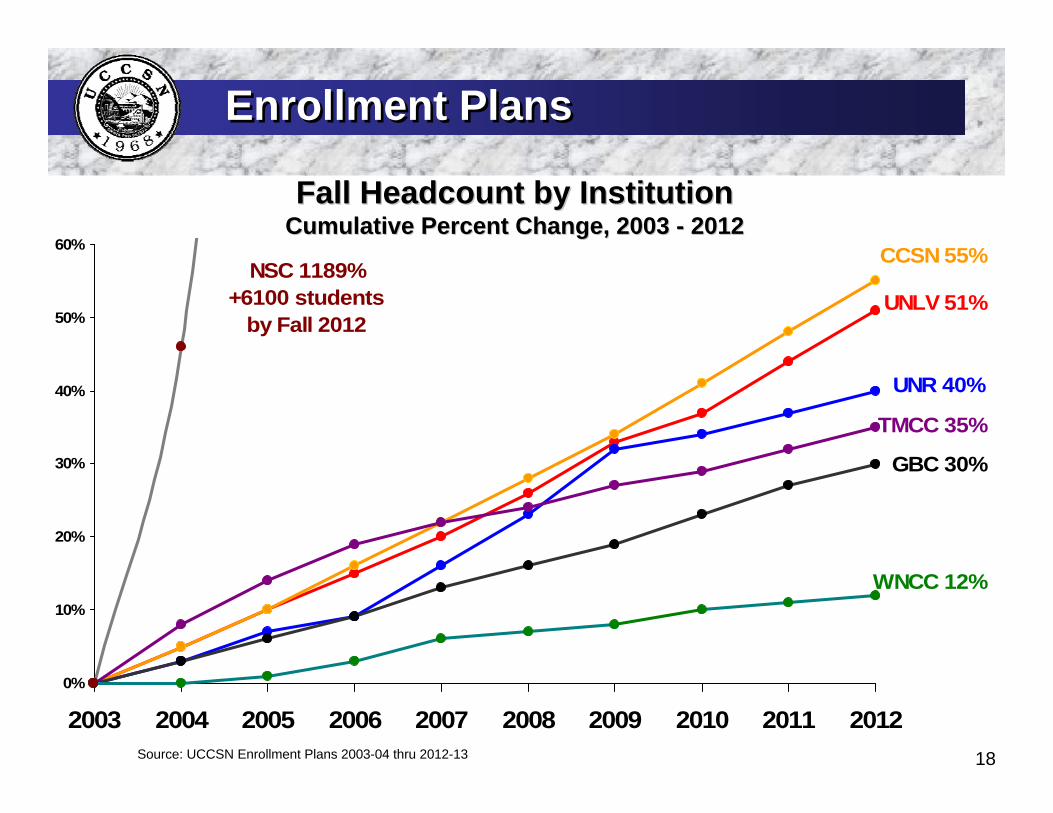
Enrollment PlansEnrollment Plans
UNLV 51%
UNR 40%
CCSN 55%
GBC 30%
TMCC 35%
WNCC 12%
NSC 1189%+6100 students
by Fall 2012
0%
10%
20%
30%
40%
50%
60%
2003 2004 2005 2006 2007 2008 2009 2010 2011 2012
Fall Headcount by Institution Fall Headcount by Institution Cumulative Percent Change, 2003 Cumulative Percent Change, 2003 -- 20122012
Source: UCCSN Enrollment Plans 2003-04 thru 2012-13
19
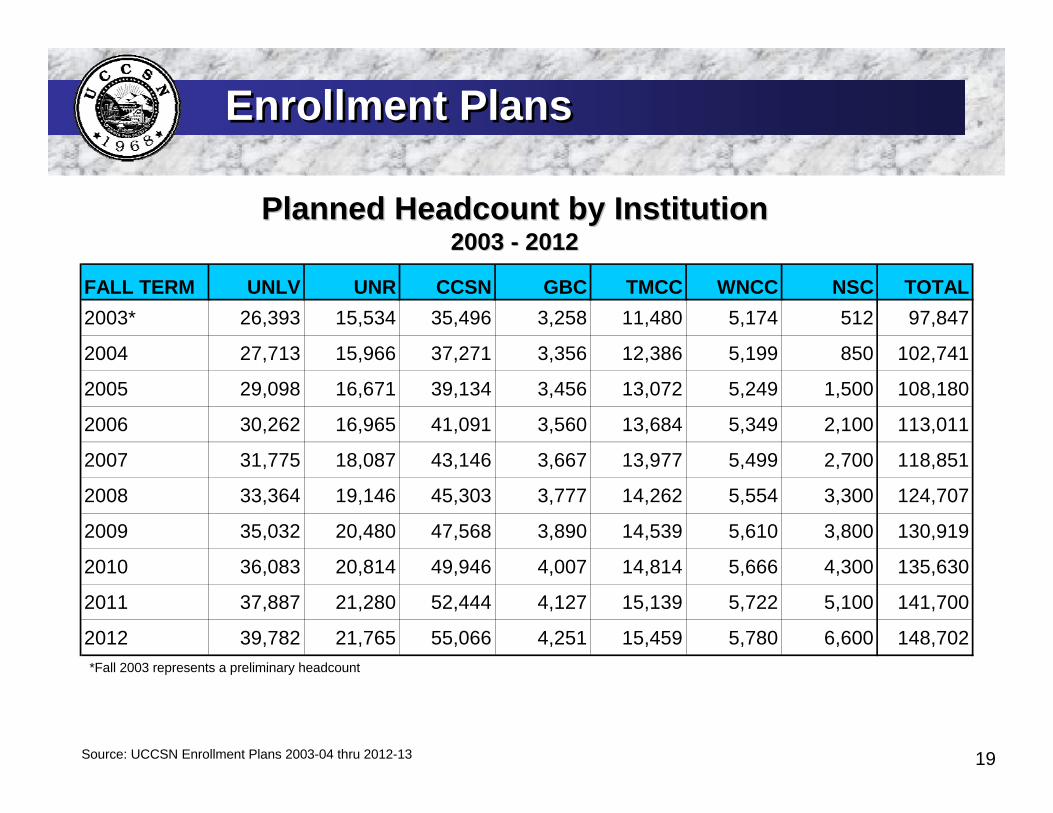
Enrollment PlansEnrollment Plans
Planned Headcount by Institution Planned Headcount by Institution 2003 2003 -- 20122012
*Fall 2003 represents a preliminary headcount
Source: UCCSN Enrollment Plans 2003-04 thru 2012-13
FALL TERM UNLV UNR CCSN GBC TMCC WNCC NSC TOTAL2003* 26,393 15,534 35,496 3,258 11,480 5,174 512 97,847
2004 27,713 15,966 37,271 3,356 12,386 5,199 850 102,741
2005 29,098 16,671 39,134 3,456 13,072 5,249 1,500 108,180
2006 30,262 16,965 41,091 3,560 13,684 5,349 2,100 113,011
2007 31,775 18,087 43,146 3,667 13,977 5,499 2,700 118,851
2008 33,364 19,146 45,303 3,777 14,262 5,554 3,300 124,707
2009 35,032 20,480 47,568 3,890 14,539 5,610 3,800 130,919
2010 36,083 20,814 49,946 4,007 14,814 5,666 4,300 135,630
2011 37,887 21,280 52,444 4,127 15,139 5,722 5,100 141,700
2012 39,782 21,765 55,066 4,251 15,459 5,780 6,600 148,702
20
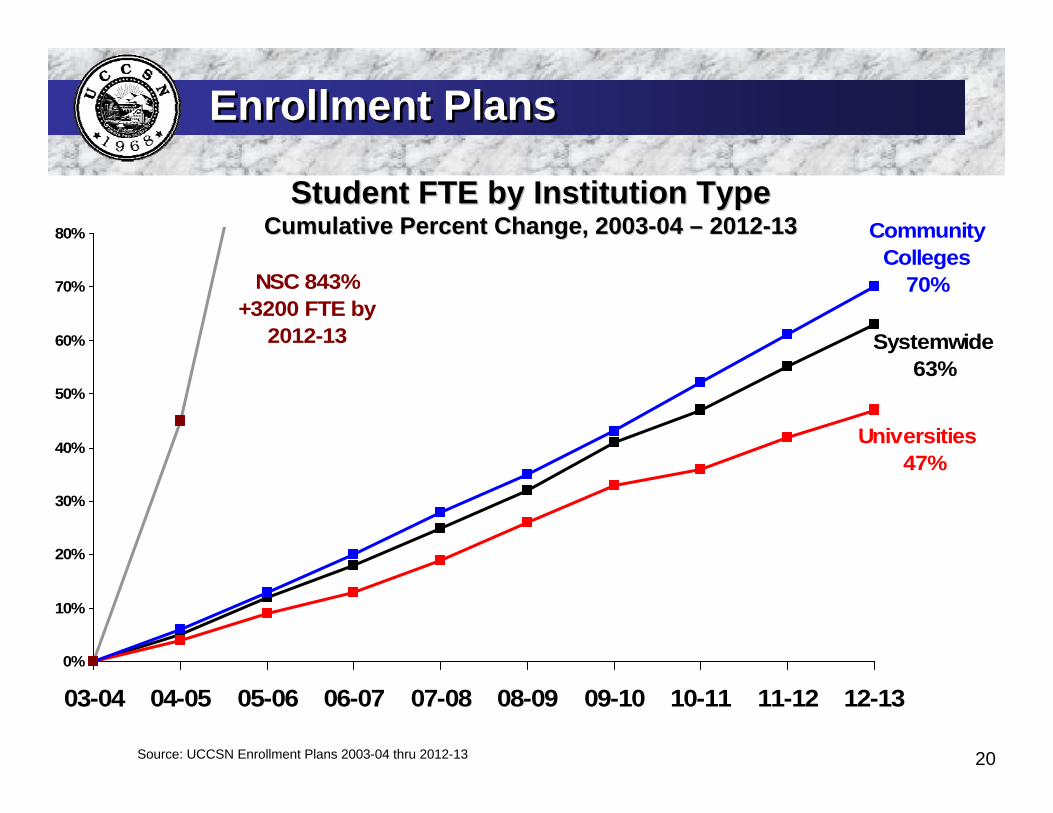
Enrollment PlansEnrollment Plans
Systemwide63%
Universities 47%
Community Colleges
70%NSC 843%+3200 FTE by
2012-13
0%
10%
20%
30%
40%
50%
60%
70%
80%
03-04 04-05 05-06 06-07 07-08 08-09 09-10 10-11 11-12 12-13
Student FTE by Institution Type Student FTE by Institution Type Cumulative Percent Change, 2003Cumulative Percent Change, 2003--04 04 –– 20122012--1313
Source: UCCSN Enrollment Plans 2003-04 thru 2012-13
21
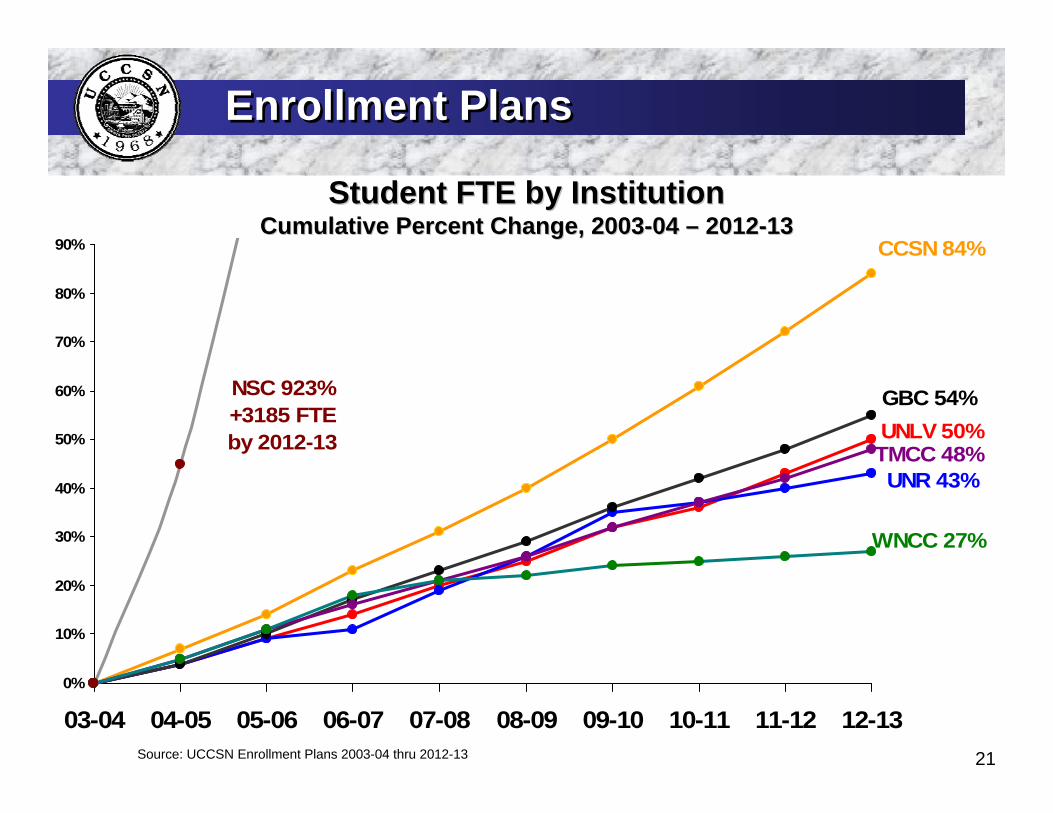
Enrollment PlansEnrollment Plans
UNLV 50%
UNR 43%
CCSN 84%
GBC 54%
TMCC 48%
WNCC 27%
NSC 923%+3185 FTE by 2012-13
0%
10%
20%
30%
40%
50%
60%
70%
80%
90%
03-04 04-05 05-06 06-07 07-08 08-09 09-10 10-11 11-12 12-13
Student FTE by Institution Student FTE by Institution Cumulative Percent Change, 2003Cumulative Percent Change, 2003--04 04 –– 20122012--1313
Source: UCCSN Enrollment Plans 2003-04 thru 2012-13
22
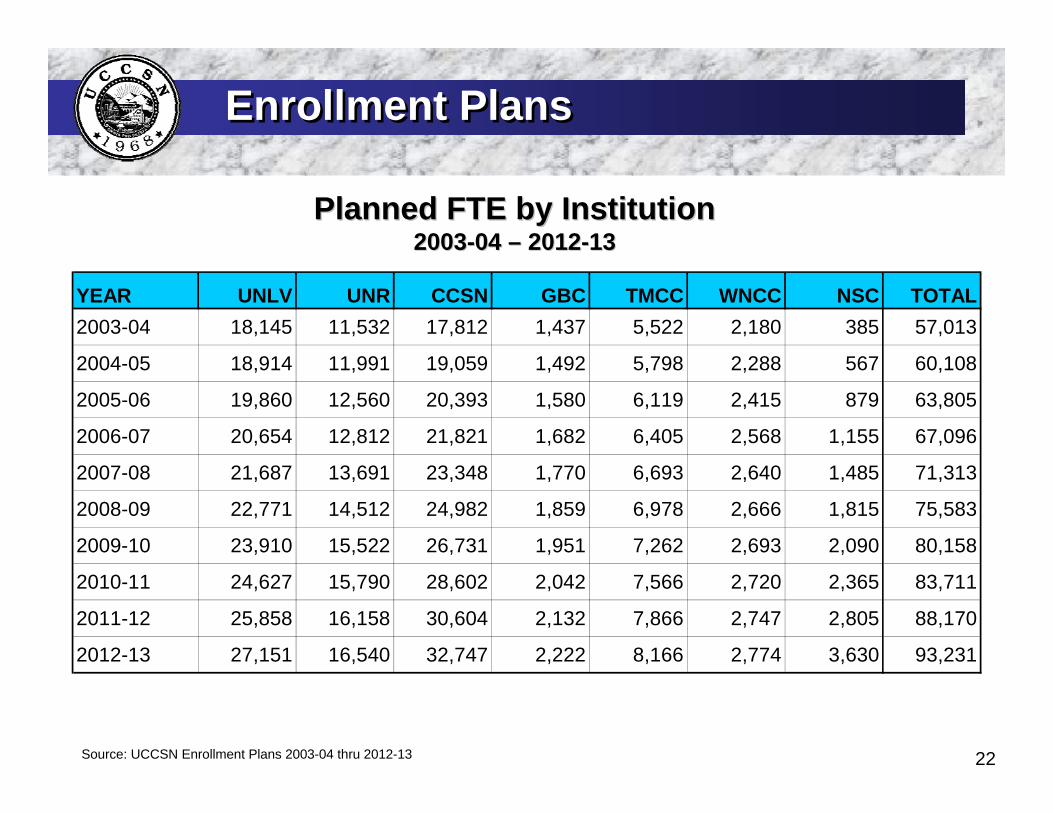
Enrollment PlansEnrollment Plans
Planned FTE by Institution Planned FTE by Institution 20032003--04 04 –– 20122012--1313
Source: UCCSN Enrollment Plans 2003-04 thru 2012-13
YEAR UNLV UNR CCSN GBC TMCC WNCC NSC TOTAL2003-04 18,145 11,532 17,812 1,437 5,522 2,180 385 57,013
2004-05 18,914 11,991 19,059 1,492 5,798 2,288 567 60,108
2005-06 19,860 12,560 20,393 1,580 6,119 2,415 879 63,805
2006-07 20,654 12,812 21,821 1,682 6,405 2,568 1,155 67,096
2007-08 21,687 13,691 23,348 1,770 6,693 2,640 1,485 71,313
2008-09 22,771 14,512 24,982 1,859 6,978 2,666 1,815 75,583
2009-10 23,910 15,522 26,731 1,951 7,262 2,693 2,090 80,158
2010-11 24,627 15,790 28,602 2,042 7,566 2,720 2,365 83,711
2011-12 25,858 16,158 30,604 2,132 7,866 2,747 2,805 88,170
2012-13 27,151 16,540 32,747 2,222 8,166 2,774 3,630 93,231
Population TrendsPopulation Trends
24
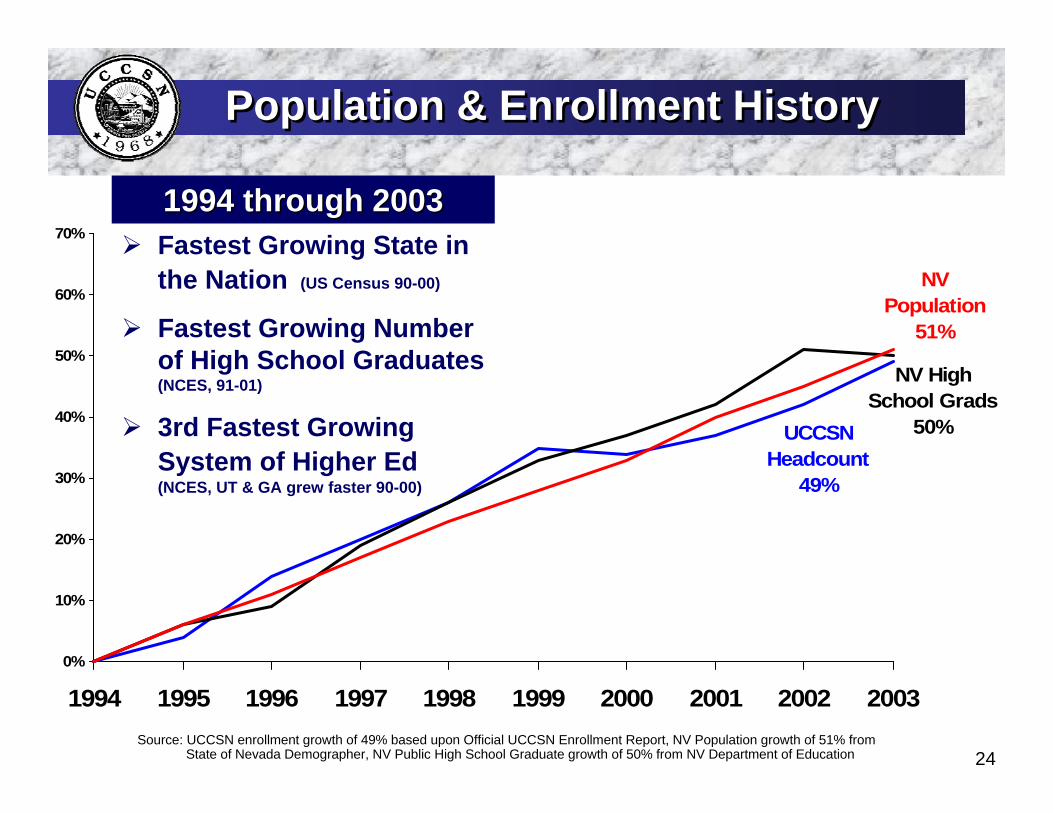
Population & Enrollment HistoryPopulation & Enrollment History
UCCSN Headcount
49%
NV High School Grads
50%
NV Population
51%
0%
10%
20%
30%
40%
50%
60%
70%
1994 1995 1996 1997 1998 1999 2000 2001 2002 2003
1994 through 20031994 through 2003
Source: UCCSN enrollment growth of 49% based upon Official UCCSN Enrollment Report, NV Population growth of 51% from State of Nevada Demographer, NV Public High School Graduate growth of 50% from NV Department of Education
Fastest Growing State in the Nation (US Census 90-00)
Fastest Growing Number of High School Graduates (NCES, 91-01)
3rd Fastest Growing System of Higher Ed(NCES, UT & GA grew faster 90-00)
25
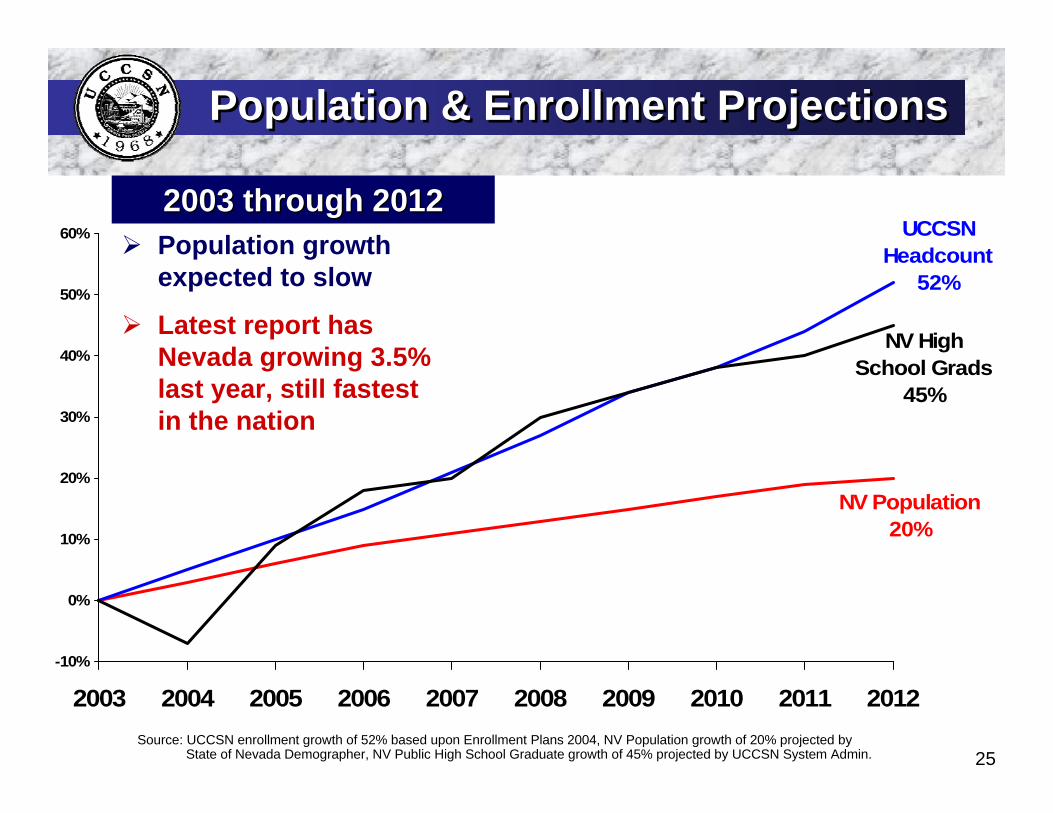
Population & Enrollment ProjectionsPopulation & Enrollment Projections
NV Population 20%
NV High School Grads
45%
UCCSN Headcount
52%
-10%
0%
10%
20%
30%
40%
50%
60%
2003 2004 2005 2006 2007 2008 2009 2010 2011 2012
2003 through 20122003 through 2012
Source: UCCSN enrollment growth of 52% based upon Enrollment Plans 2004, NV Population growth of 20% projected by State of Nevada Demographer, NV Public High School Graduate growth of 45% projected by UCCSN System Admin.
Population growth expected to slow
Latest report has Nevada growing 3.5% last year, still fastest in the nation
26
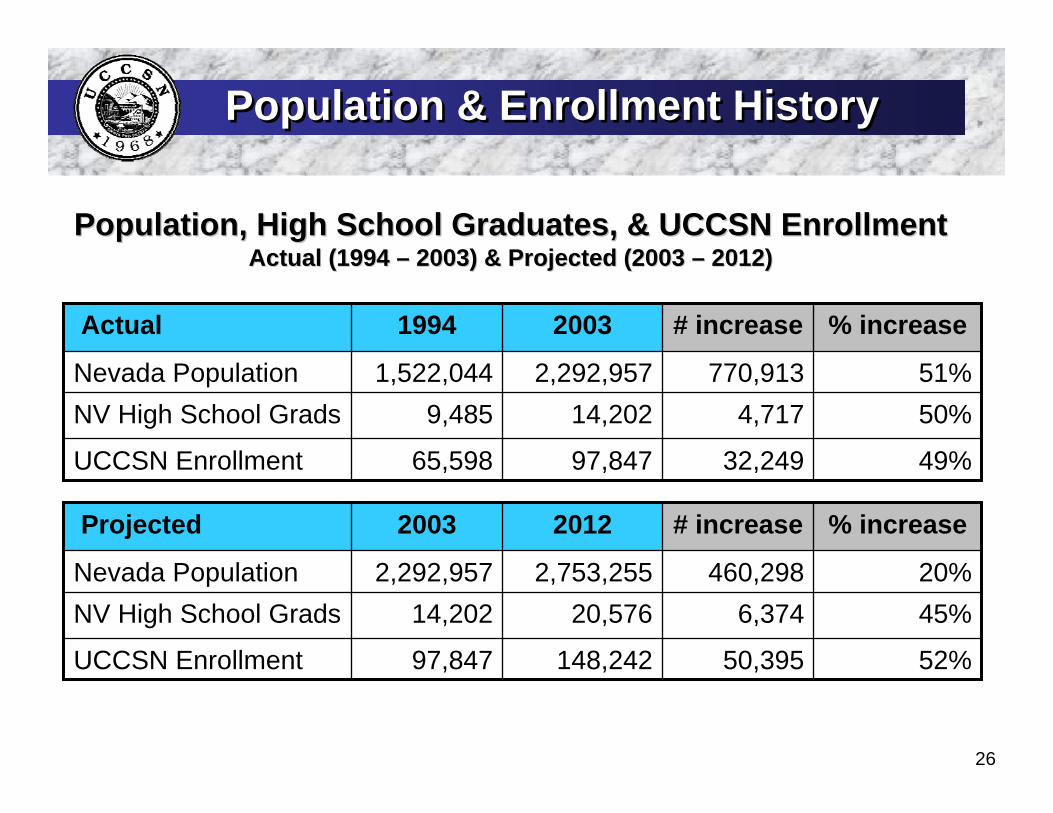
49%32,24997,84765,598UCCSN Enrollment
50%4,71714,2029,485NV High School Grads51%770,9132,292,9571,522,044Nevada Population
% increase# increase20031994Actual
Population, High School Graduates, & UCCSN Enrollment Population, High School Graduates, & UCCSN Enrollment Actual (1994 Actual (1994 –– 2003) & Projected (2003 2003) & Projected (2003 –– 2012) 2012)
Population & Enrollment HistoryPopulation & Enrollment History
52%50,395148,24297,847UCCSN Enrollment
45%6,37420,57614,202NV High School Grads20%460,2982,753,2552,292,957Nevada Population
% increase# increase20122003Projected
27
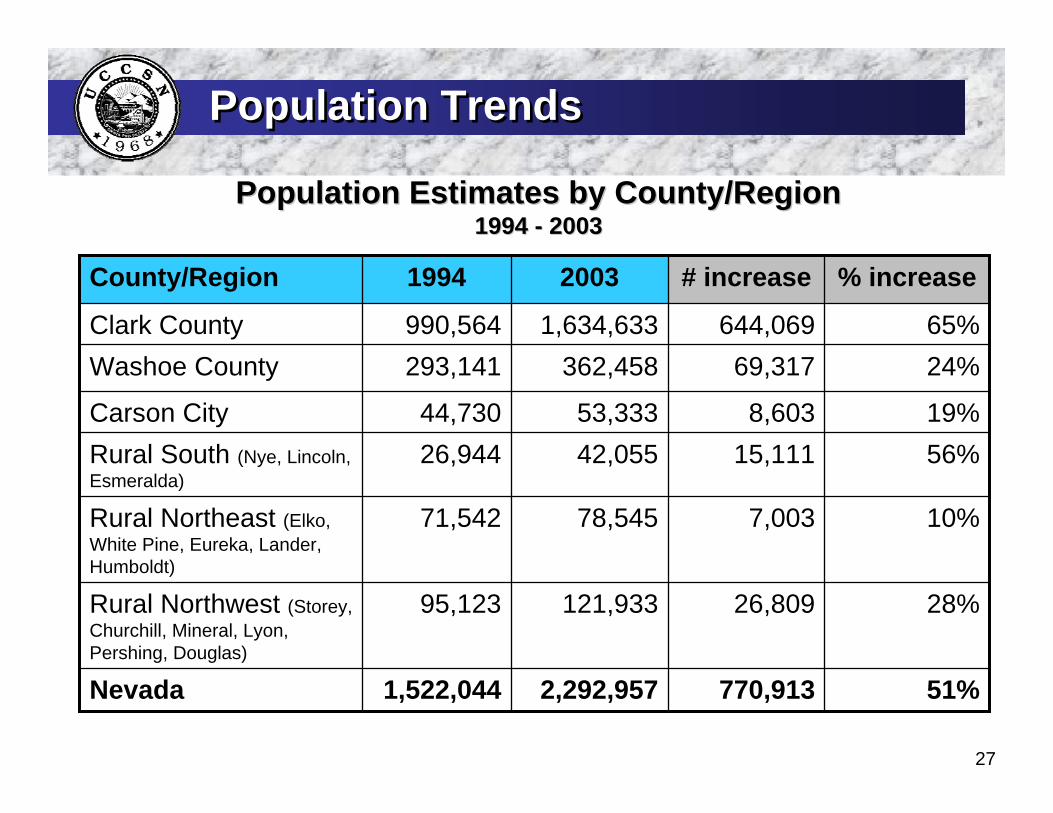
Population TrendsPopulation Trends
51%770,9132,292,9571,522,044Nevada
28%26,809121,93395,123Rural Northwest (Storey, Churchill, Mineral, Lyon, Pershing, Douglas)
10%7,00378,54571,542Rural Northeast (Elko, White Pine, Eureka, Lander, Humboldt)
56%15,11142,05526,944Rural South (Nye, Lincoln, Esmeralda)
19%8,60353,33344,730Carson City
24%69,317362,458293,141Washoe County65%644,0691,634,633990,564Clark County
% increase# increase20031994County/Region
Population Estimates by County/Region Population Estimates by County/Region 1994 1994 -- 20032003
28
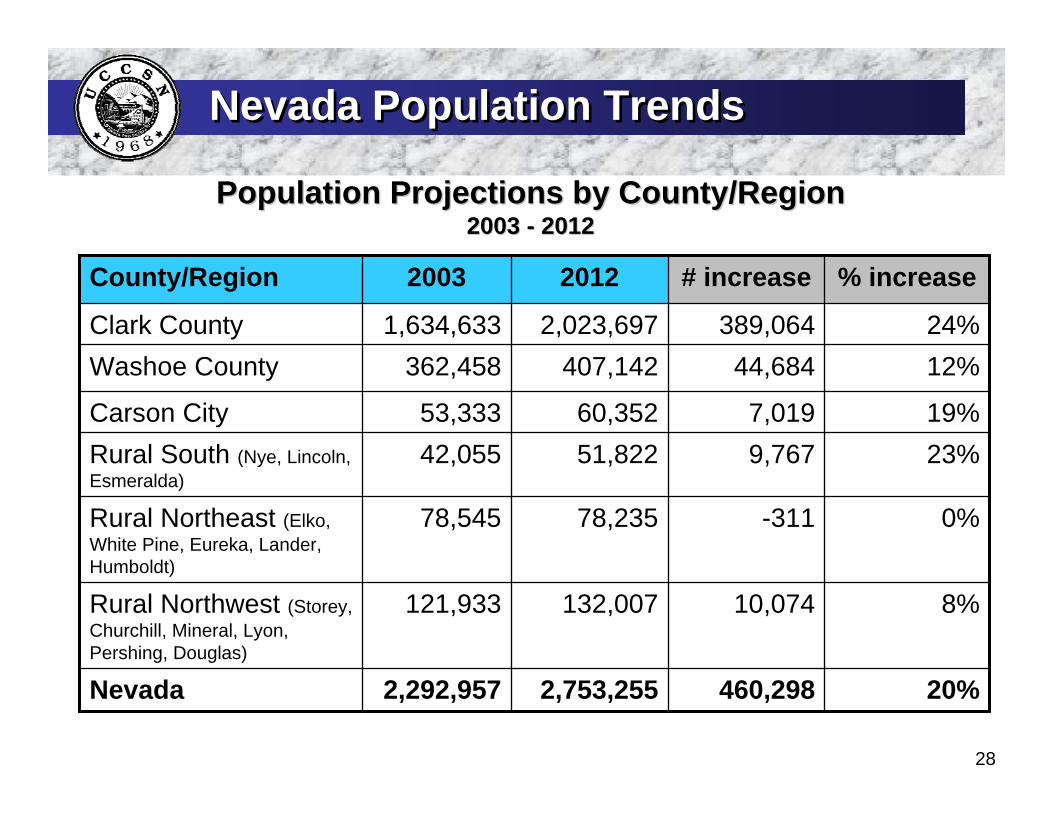
Nevada Population TrendsNevada Population Trends
20%460,2982,753,2552,292,957Nevada
8%10,074132,007121,933Rural Northwest (Storey, Churchill, Mineral, Lyon, Pershing, Douglas)
0%-31178,23578,545Rural Northeast (Elko, White Pine, Eureka, Lander, Humboldt)
23%9,76751,82242,055Rural South (Nye, Lincoln, Esmeralda)
19%7,01960,35253,333Carson City
12%44,684407,142362,458Washoe County24%389,0642,023,6971,634,633Clark County
% increase# increase20122003County/Region
Population Projections by County/Region Population Projections by County/Region 2003 2003 -- 20122012
29
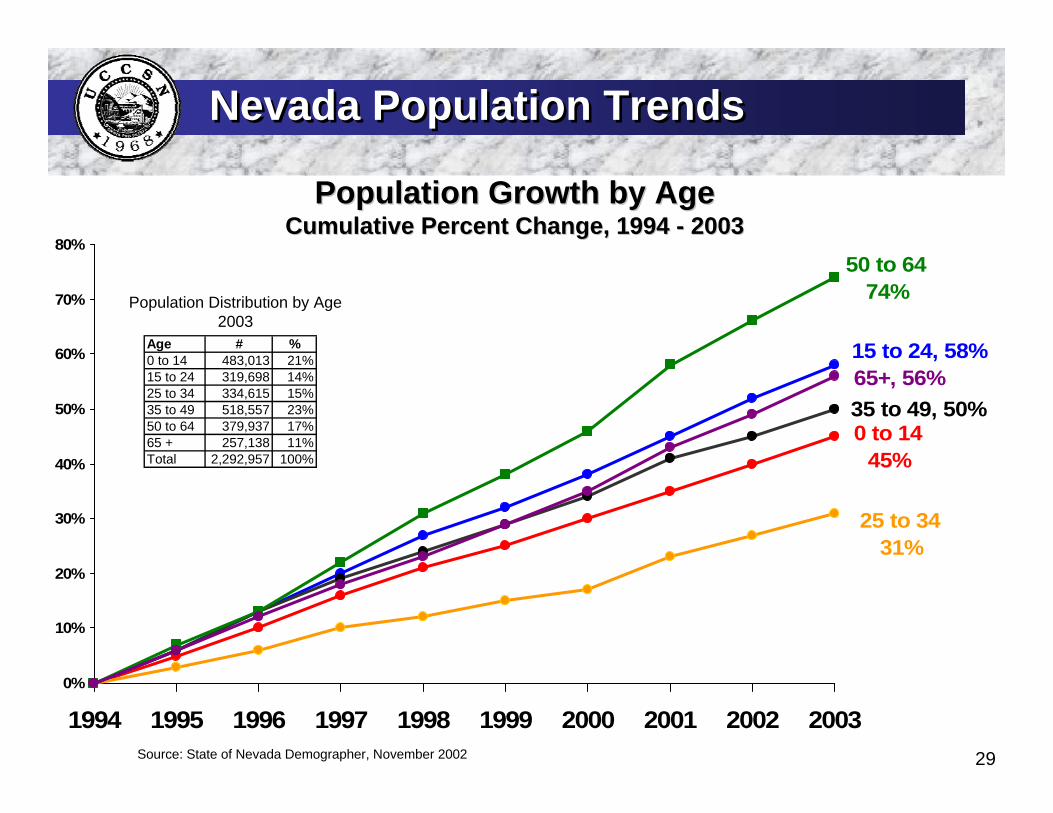
0 to 14 45%
15 to 24, 58%
25 to 34 31%
35 to 49, 50%
50 to 64 74%
65+, 56%
0%
10%
20%
30%
40%
50%
60%
70%
80%
1994 1995 1996 1997 1998 1999 2000 2001 2002 2003
Population Growth by Age Population Growth by Age Cumulative Percent Change, 1994 Cumulative Percent Change, 1994 -- 20032003
Source: State of Nevada Demographer, November 2002
Nevada Population TrendsNevada Population Trends
Age # %0 to 14 483,013 21%15 to 24 319,698 14%25 to 34 334,615 15%35 to 49 518,557 23%50 to 64 379,937 17%65 + 257,138 11%Total 2,292,957 100%
Population Distribution by Age 2003
30
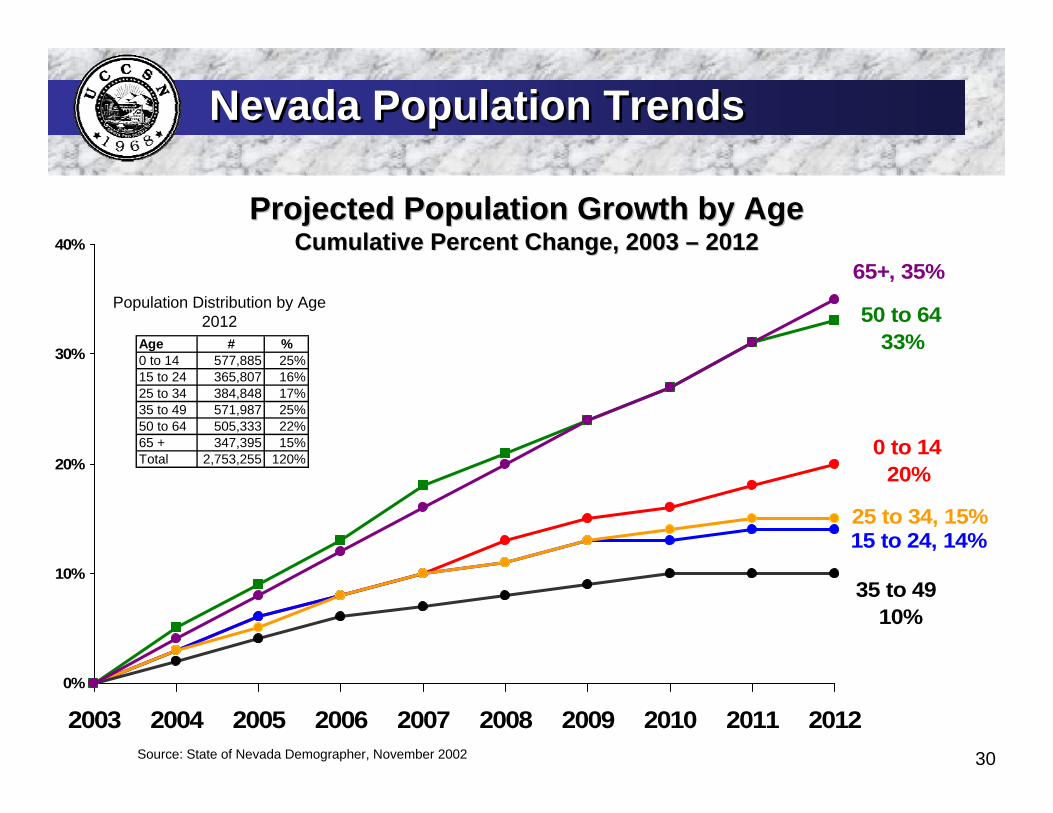
0 to 14 20%
15 to 24, 14%25 to 34, 15%
35 to 49 10%
50 to 64 33%
65+, 35%
0%
10%
20%
30%
40%
2003 2004 2005 2006 2007 2008 2009 2010 2011 2012
Projected Population Growth by Age Projected Population Growth by Age Cumulative Percent Change, 2003 Cumulative Percent Change, 2003 –– 2012 2012
Source: State of Nevada Demographer, November 2002
Nevada Population TrendsNevada Population Trends
Age # %0 to 14 577,885 25%15 to 24 365,807 16%25 to 34 384,848 17%35 to 49 571,987 25%50 to 64 505,333 22%65 + 347,395 15%Total 2,753,255 120%
Population Distribution by Age 2012
31
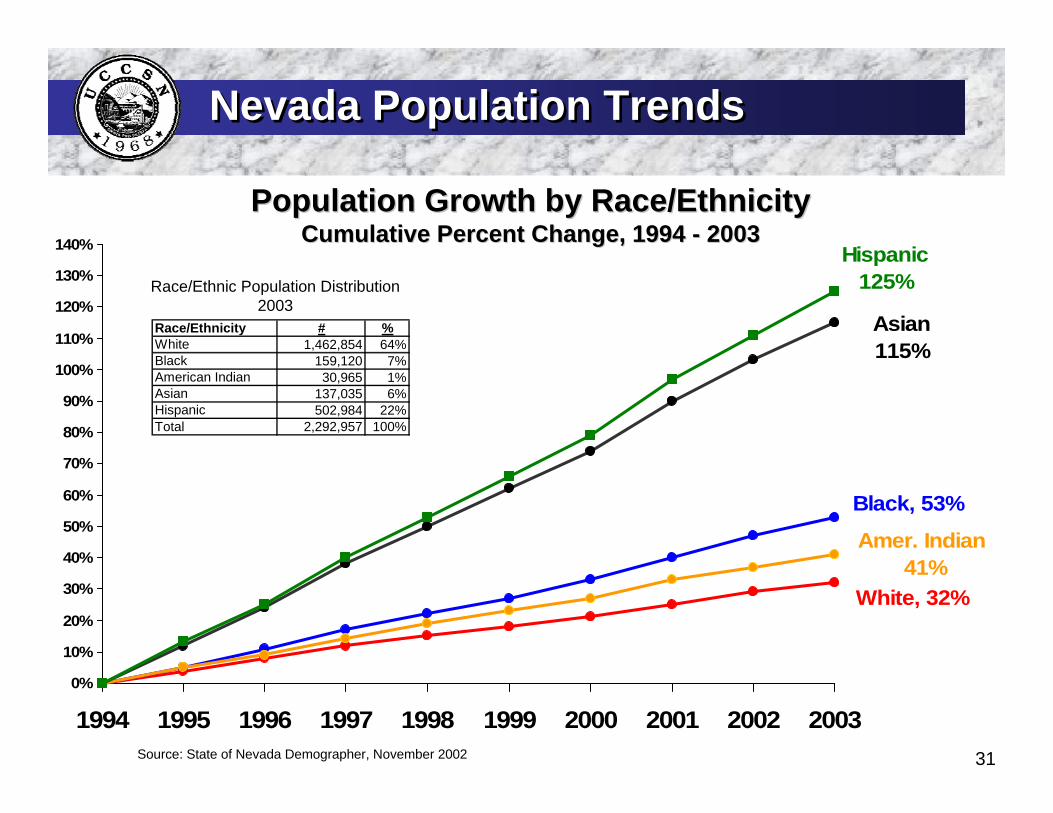
White, 32%
Black, 53%
Amer. Indian 41%
Asian115%
Hispanic 125%
0%
10%
20%
30%
40%
50%
60%
70%
80%
90%
100%
110%
120%
130%
140%
1994 1995 1996 1997 1998 1999 2000 2001 2002 2003
Population Growth by Race/Ethnicity Population Growth by Race/Ethnicity Cumulative Percent Change, 1994 Cumulative Percent Change, 1994 -- 20032003
Source: State of Nevada Demographer, November 2002
Nevada Population TrendsNevada Population Trends
Race/Ethnic Population Distribution 2003
Race/Ethnicity # %White 1,462,854 64%Black 159,120 7%American Indian 30,965 1%Asian 137,035 6%Hispanic 502,984 22%Total 2,292,957 100%
32
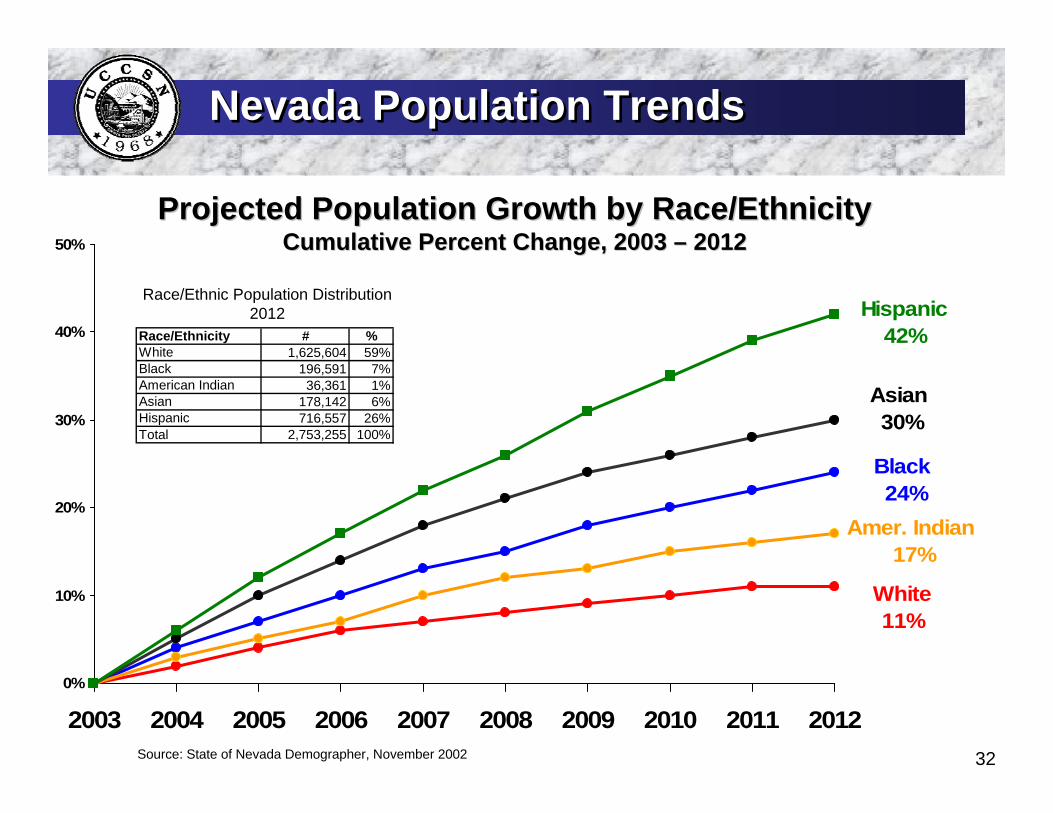
White 11%
Black 24%
Amer. Indian 17%
Asian 30%
Hispanic 42%
0%
10%
20%
30%
40%
50%
2003 2004 2005 2006 2007 2008 2009 2010 2011 2012
Projected Population Growth by Race/Ethnicity Projected Population Growth by Race/Ethnicity Cumulative Percent Change, 2003 Cumulative Percent Change, 2003 –– 2012 2012
Source: State of Nevada Demographer, November 2002
Nevada Population TrendsNevada Population Trends
Race/Ethnicity # %White 1,625,604 59%Black 196,591 7%American Indian 36,361 1%Asian 178,142 6%Hispanic 716,557 26%Total 2,753,255 100%
Race/Ethnic Population Distribution 2012
33
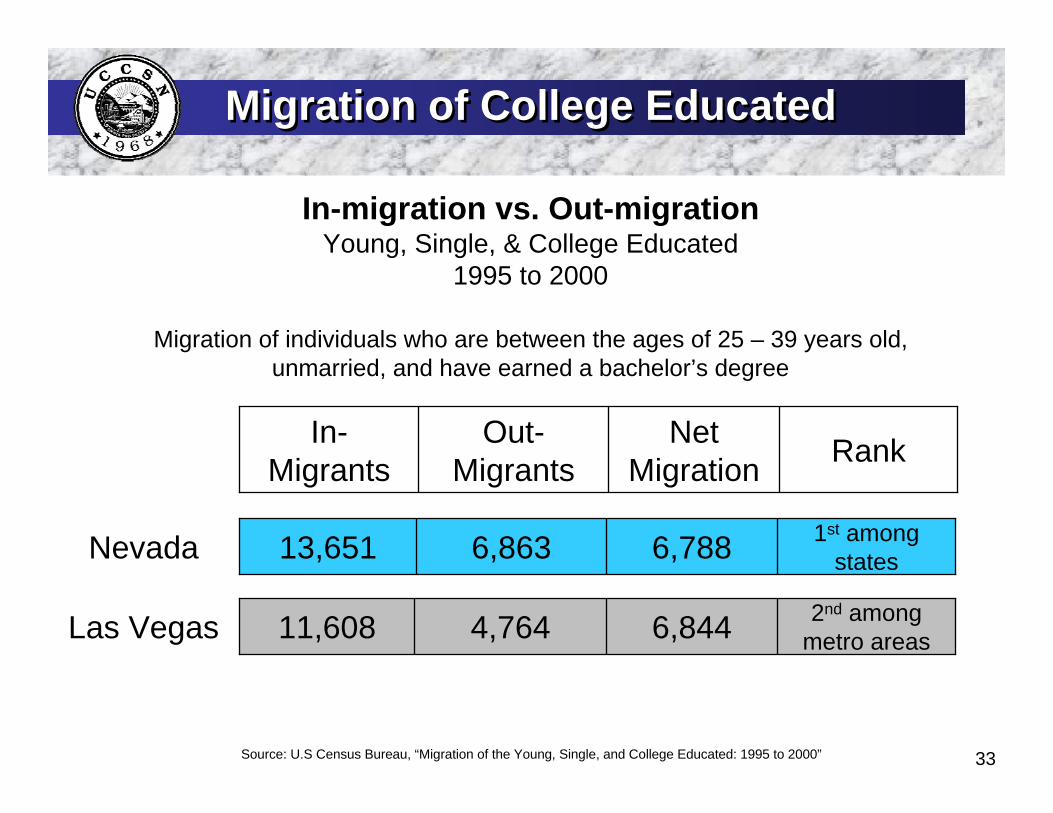
Migration of College EducatedMigration of College Educated
RankNet Migration
Out-Migrants
In-Migrants
13,651 1st among states6,7886,863Nevada
11,608 2nd among metro areas6,8444,764Las Vegas
In-migration vs. Out-migration Young, Single, & College Educated
1995 to 2000
Source: U.S Census Bureau, “Migration of the Young, Single, and College Educated: 1995 to 2000”
Migration of individuals who are between the ages of 25 – 39 years old, unmarried, and have earned a bachelor’s degree
34
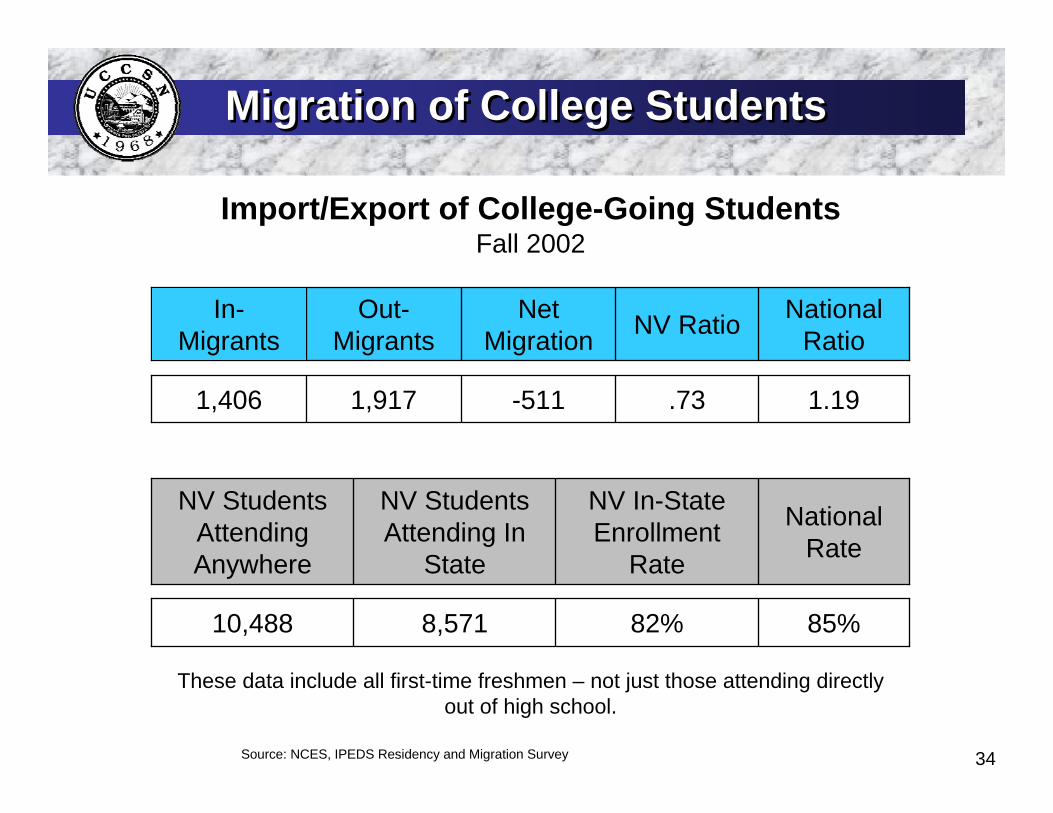
Migration of College StudentsMigration of College Students
Import/Export of College-Going Students Fall 2002
Source: NCES, IPEDS Residency and Migration Survey
NV Ratio National Ratio
Net Migration
Out-Migrants
.73 1.19-5111,917
In-Migrants
1,406
These data include all first-time freshmen – not just those attending directly out of high school.
National Rate
NV In-State Enrollment
Rate
NV Students Attending In
State
NV Students Attending Anywhere
85%82%8,57110,488
SummarySummary
36
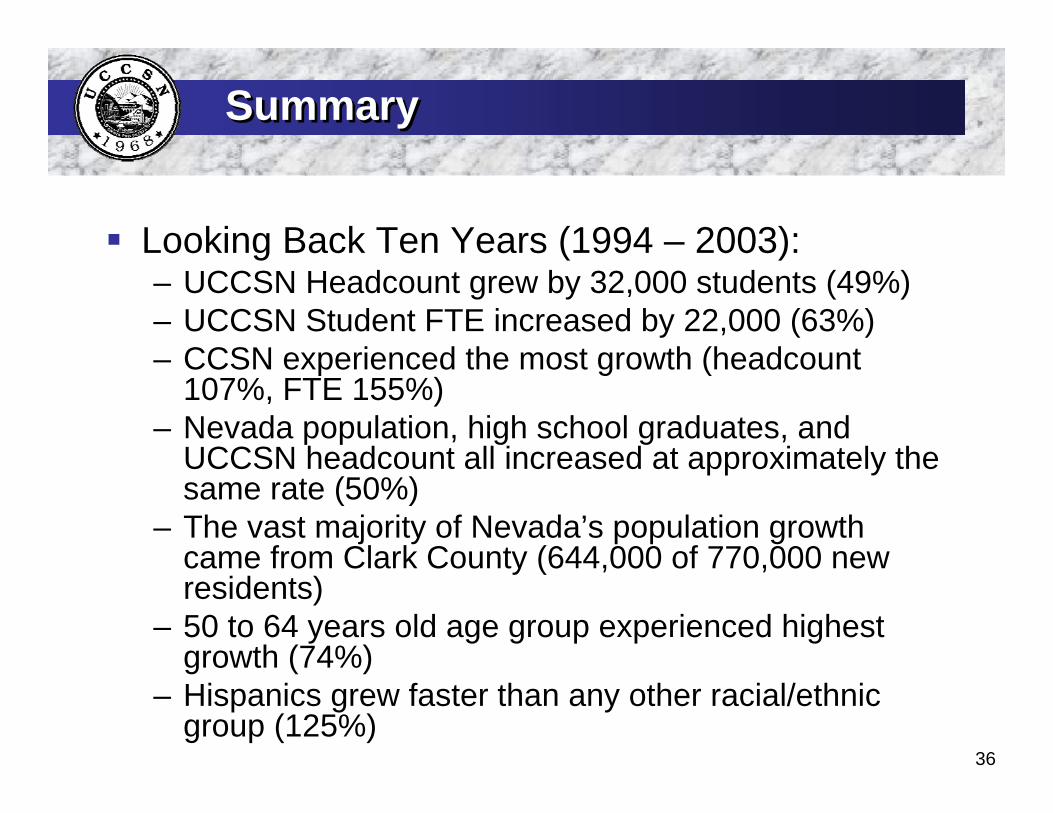
Looking Back Ten Years (1994 – 2003):– UCCSN Headcount grew by 32,000 students (49%)– UCCSN Student FTE increased by 22,000 (63%)– CCSN experienced the most growth (headcount
107%, FTE 155%) – Nevada population, high school graduates, and
UCCSN headcount all increased at approximately the same rate (50%)
– The vast majority of Nevada’s population growth came from Clark County (644,000 of 770,000 new residents)
– 50 to 64 years old age group experienced highest growth (74%)
– Hispanics grew faster than any other racial/ethnic group (125%)
SummarySummary
37
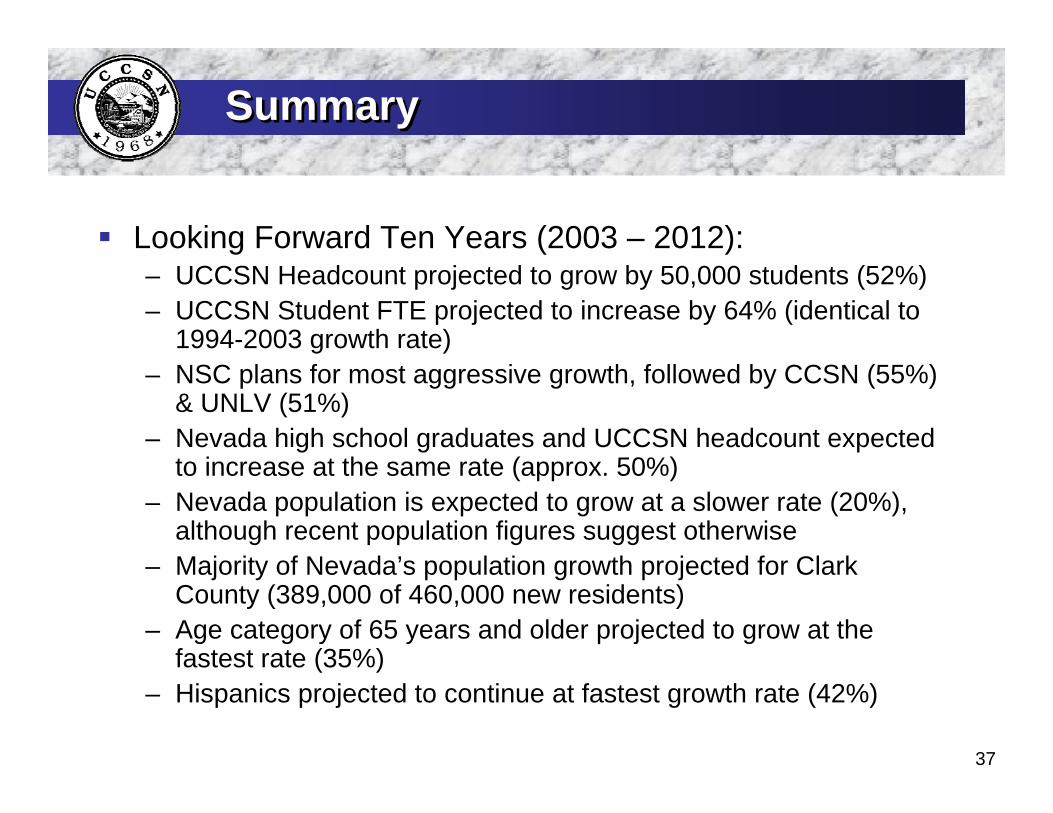
Looking Forward Ten Years (2003 – 2012):– UCCSN Headcount projected to grow by 50,000 students (52%)– UCCSN Student FTE projected to increase by 64% (identical to
1994-2003 growth rate)– NSC plans for most aggressive growth, followed by CCSN (55%)
& UNLV (51%)– Nevada high school graduates and UCCSN headcount expected
to increase at the same rate (approx. 50%)– Nevada population is expected to grow at a slower rate (20%),
although recent population figures suggest otherwise– Majority of Nevada’s population growth projected for Clark
County (389,000 of 460,000 new residents)– Age category of 65 years and older projected to grow at the
fastest rate (35%)– Hispanics projected to continue at fastest growth rate (42%)
SummarySummary