Embed Size (px)
Citation preview
How to Encourage College Summer EnrollmentFinal Lessons from the EASE Project
CAITLIN ANZELONE, MICHAEL WEISS, CAMIELLE HEADLAM with XAVIER ALEMAÑY
OCTOBER 2020

HOW TO ENCOURAGE COLLEGE SUMMER ENROLLMENT
CAITLIN ANZELONE, MICHAEL WEISS, CAMIELLE HEADLAM with XAVIER ALEMAÑY
OCTOBER 2020
Final Lessons from the EASE Project
iiHow to Encourage College Summer Enrollment: Final Lessons from the EASE Project
The Encouraging Additional Summer Enrollment (EASE) project is funded by Ascendium Education Group.
Dissemination of MDRC publications is supported by the following organizations and individuals that help finance MDRC’s public policy outreach and expanding efforts to communicate the results and implications of our work to policymakers, practitioners, and others: The Annie E. Casey Foun-dation, Arnold Ventures, Charles and Lynn Schusterman Family Foundation, The Edna McConnell Clark Foundation, Ford Foundation, The George Gund Foundation, Daniel and Corinne Goldman, The Harry and Jeanette Weinberg Foundation, Inc., The JPB Foundation, The Joyce Foundation, The Kresge Foundation, and Sandler Foundation.
In addition, earnings from the MDRC Endowment help sustain our dissemination efforts. Con-tributors to the MDRC Endowment include Alcoa Foundation, The Ambrose Monell Foundation, Anheuser-Busch Foundation, Bristol-Myers Squibb Foundation, Charles Stewart Mott Foundation, Ford Foundation, The George Gund Foundation, The Grable Foundation, The Lizabeth and Frank Newman Charitable Foundation, The New York Times Company Foundation, Jan Nicholson, Paul H. O’Neill Charitable Foundation, John S. Reed, Sandler Foundation, and The Stupski Family Fund, as well as other individual contributors.
For information about MDRC and copies of our publications, see our website: www.mdrc.org.
Copyright © 2020 by MDRC®. All rights reserved.
Supporters

How to Encourage College Summer Enrollment: Final Lessons from the EASE Projectiii
Despite the benefits of taking summer courses, most community college students do not do so. MDRC’s Encouraging Additional Summer Enrollment (EASE) study used behavioral insights and a fi-nancial incentive with the goal of boosting enrollment rates. The research team designed and then tested two interventions using a randomized controlled trial, the most rigorous form of evaluation. The study included 10,668 first-year community college students at 10 different schools in Ohio. All of the students were eligible for federal Pell Grants. The first intervention was launched at four colleges in spring 2017, when a total of 3,689 students were randomly assigned, and a second itera-tion was launched at 10 colleges in spring 2018, with 6,979 additional students. This report presents findings from the EASE evaluation and is the final report on this project. It examines impacts on academic outcomes one year plus one summer after students were randomly assigned.
There were three research groups:
1 Students in the control group received messages the college was already sending to promote summer enrollment and its standard financial aid.
2 Students in the informational campaign group received messages that incorporated princi-ples from behavioral science. Using mostly email and mail, colleges sent personalized funding information about how the student could pay for the courses; testimonials from other students about why they took summer courses; plan-making prompts about how to register and choose courses; and reminders about deadlines.
3 Students in the “last-dollar” tuition-assistance group were offered a similar informational campaign plus gap tuition called the Summer Scholar Grant. The grant covered the difference between students’ summer tuition and fees and their financial aid (that is, their Pell Grant and Ohio College Opportunity Grant funds).
Both interventions were effective at increasing summer enrollment. The addition of the last-dollar grant doubled the magnitude of the impact. The informational campaign cost an average of $15 per student, while the last-dollar grant with the informational campaign cost an average of $79 per student. The reinstatement of year-round Pell Grants by the federal government in between the spring 2017 and spring 2018 cohorts did not influence the effectiveness of the interventions: They were effective in both contexts. While the effects of the interventions on overall credits earned were modest, both interventions benefited students and had a positive return on investment for colleges, making them worthy of consideration for college administrators.
Overview

ivHow to Encourage College Summer Enrollment: Final Lessons from the EASE Project
Overview iii
List of Exhibits v
Acknowledgments vi
Why Encourage Summer Enrollment? 1
Why is Summer Enrollment Low? 2
What Was the Study Design? 15
What Were the Results? 18
How Did Colleges Implement the Interventions? 27
What Did the Interventions Cost? 30
How Much Additional Revenue Did the Interventions Generate for the College? 33
Have These Strategies Been Sustained and Expanded by Colleges? 35
What Are the Project Implications? 36
Appendix
Supplementary Tables and Figures 38
References 46
Contents

How to Encourage College Summer Enrollment: Final Lessons from the EASE Projectv
Table
1 Costs of EASE Intervention – Full Sample 31A.1 EASE Enrollment, Credit, and Degree Outcomes for Full Sample 39A.2 EASE Spring and Summer Pass Rates for First Summer Enrollees (Non-Experimental) 42A.3 EASE Percent of Students Enrolled in the First Summer by Subgroup 43
A.4 Outcomes and Simplified ROI in the First Summer for Full Sample 44
Figure
1 Why Study the Issue of Summer Enrollment? 1
2 Rational Versus Realistic View of the Student Decision-Making Process 3
3 The Research Team’s Diagnosis Process 5
4 Pell Grant Award Examples 6
5 Example of Personalized Funding Estimate in an Email 7
6 Example of “Free” Summer Course Messaging 9
7 Example of Students’ Experiences with Summer Courses 10
8 Example of Instructions for Registering for Summer Courses 13
9 Example of Plan-Making Tool in a Letter 14
10 How the Student Experience Informed the Solutions Designed 16
11 Study Design 17
12 Summer Enrollment Rates 1913 Summer Credits Earned 2014 Average Credit Impact Among Students Induced to Enroll in Summer 21
15 Why an Increase in Summer Enrollment is Not Expected to Lead to a Substantial Increase in Fall Enrollment
23
16 How Phase I Implementation Research Informed Phase II 2817 Return on Investment from Each Intervention 35
A.1 Sustained Effects on Credits Earned 45
Box
1 Helpful Terms Used in This Report 4
Exhibits

viHow to Encourage College Summer Enrollment: Final Lessons from the EASE Project
We would like to acknowledge and thank Ascendium Education Group for supporting the Encour-aging Additional Summer Enrollment project through funding for the tuition-assistance Grants and the intervention design, implementation, and research efforts. We thank Sue Cui and Amy Kerwin for their continued encouragement and guidance.
We would also like to express appreciation and admiration for our college partners who participat-ed in the project and were essential to its launch and implementation. The project could not have been achieved without the dedication and many contributions of their staff members.
Our partners at the Ohio Association of Community Colleges provided crucial support, including Laura Rittner and Anne Foster, who coordinated project efforts and provided strategic guidance. We would also like to recognize Brett Visger from the Ohio Department of Higher Education, who provided early assistance with reconnaissance efforts, and Dilip Soman and Benjamin Castleman, who advised on the intervention design.
Finally, we would like to thank our present and past MDRC colleagues who contributed tirelessly on many aspects of this project, including Melissa Boynton, Justine Yu, Benjamin Cohen, Kayla Reiman, Dan Handy, Dorota Biedzio, Edith Yang, Colin Hill, Emma Fernandez, Himani Gupta, Robert Ivry, and many others. We would like to give special recognition to Erick Alonzo for diligently coordi-nating and fact-checking this report, and to Fred Doolittle, Clinton Key, and John Hutchins for their review. Jill Kirschenbaum edited the report and Carolyn Thomas prepared it for publication.
The Authors
Acknowledgments
1
Why Encourage Summer Enrollment?Higher education is one of the largest systems in the United States that help reduce poverty and increase incomes. Community colleges, with year-round enrollment of more than eight million students, offer workforce development and skills training, provide a pathway to four-year insti-tutions,1 and have the potential to help students achieve their longer-term career objectives. The low cost of tuition and open admissions policies (compared with four-year colleges and universi-ties) have historically meant that these schools have provided many students with access to post-secondary education they might not have had otherwise. However, students also face barriers when navigating the institutions designed to help them. Only 13 percent of students who enroll in a community college earn an associate’s degree within two years, a sign that the system is not working as intended.2
The Encouraging Additional Summer Enrollment (EASE) project was developed by MDRC in part-nership with the Ohio Association of Community Colleges and 10 community colleges in Ohio. The research team created two interventions to simplify enrollment decisions and promote regis-tration. The goal was to encourage low-income community college students to enroll in summer courses that could help them make progress toward a degree. Summer enrollment may also keep students engaged in school, reducing their likelihood of dropping out between spring and fall semesters.3 Despite these potential benefits, most students do not enroll in summer courses (see Figure 1).
1 Community College Research Center (2020).2 Juszkiewicz (2017).3 Liu (2016).
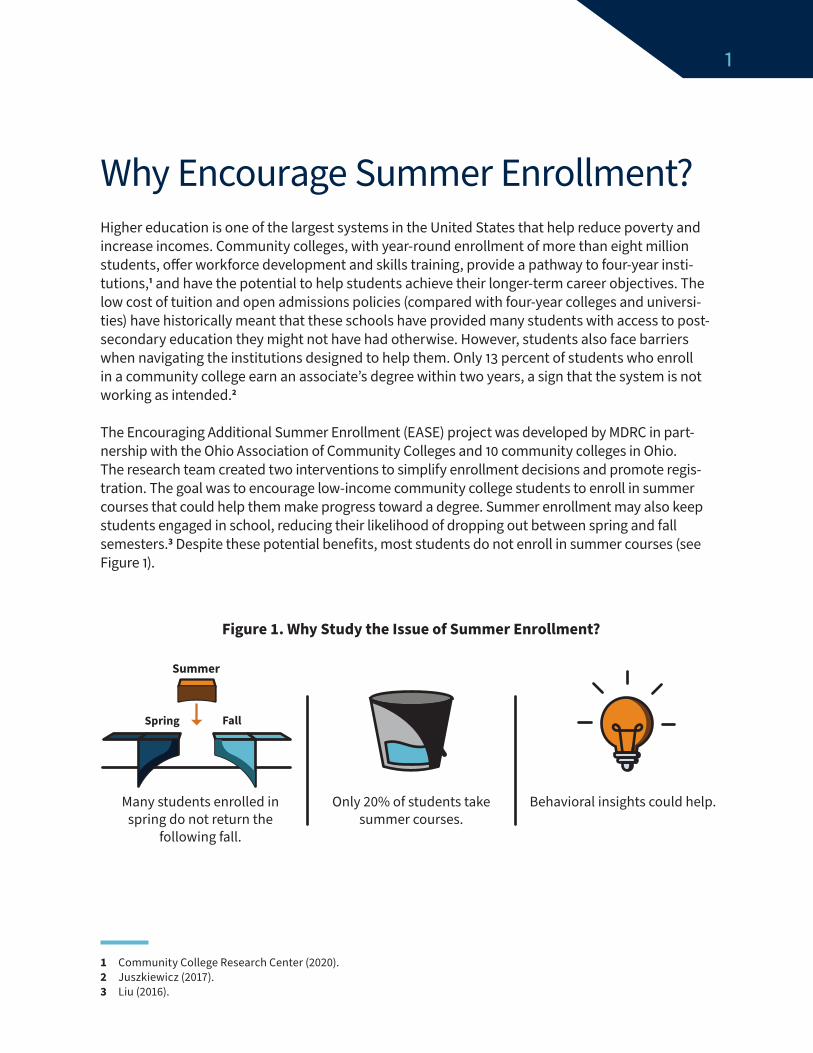
Figure 1. Why Study the Issue of Summer Enrollment?
Many students enrolled in spring do not return the
following fall.
Only 20% of students take summer courses.
Behavioral insights could help.

2How to Encourage College Summer Enrollment: Final Lessons from the EASE Project
Only about one in four students at the colleges in the EASE study enrolled in summer courses when the project began in 2017. There are many reasons why students may not sign up for summer, but central to the study were two questions: Could the team design interventions that would induce more students to enroll? And if more students enrolled, would they experience improved academic outcomes?
The team used behavioral insights, which can shed light on an individual’s decision-making and behavior, to encourage summer enrollment. The study’s design intentionally merged “nudges,” de-fined as subtle and modest changes that help improve individual decision-making (such as target-ed reminders or personalized letters),4 with a financial intervention (in this case, tuition assistance) to explore how the two would complement each other.
Central to the intervention design was to take the perspective of the students enrolling in college (see Figure 2). The team followed MDRC’s Center for Applied Behavioral Science (CABS) approach — which focuses on elevating the experience of the end users — to identify the challenges students were facing and to consider various enrollment processes from their point of view.5 The team also analyzed administrative data collected by each college to further pinpoint interventions that might be the most effective. The team applied the CABS lens to the subject of summer enrollment, but it can also be applied to many aspects of the college experience to develop solutions to some of the challenges that students face.
Prior EASE publications provided copies of the EASE intervention materials and discussed early findings from the evaluation. This report, the final publication on this project, provides findings from the evaluation one year plus one summer after students were randomly assigned. It also pre-sents information on the implementation and cost of the EASE interventions.
Why Is Summer Enrollment Low?The team conducted a diagnosis of students’ experiences to identify some of the barriers that pre-vent students from enrolling in summer courses. The inquiry focused on low-income students eligi-ble for Pell Grants at four of the participating colleges. (Box 1 provides an explanation of terms used in this report.) At each institution, the team conducted student focus groups, interviewed adminis-trators and staff members, reviewed available documents, and conducted quantitative analyses of summer registration trends and financial aid use (see Figure 3). As part of this diagnosis, the team mapped each step in the summer registration and financial aid process to identify points along the way at which barriers might be preventing students from enrolling. Several main insights emerged that the team linked to solutions to address these barriers.
4 Thaler (2018).5 Headlam, Anzelone, and Weiss (2018).

How to Encourage College Summer Enrollment: Final Lessons from the EASE Project3
Figure 2. Rational Versus Realistic View of the Student Decision-Making Process

4How to Encourage College Summer Enrollment: Final Lessons from the EASE Project
Box 1. Helpful Terms Used in This Report
PELL GRANT: This Grant is provided by the U.S. federal government and is available to students with financial need who have not earned their first bachelor’s degree and who are enrolled in college. Students must apply for Pell Grants using the Free Application for Federal Student Aid (FAFSA) and are awarded an amount based on their circumstances. This funding is directly applied to cover college tuition and fees. Students can also receive unused Pell Grant funds as refund checks that they can use to pay for books and other education-related expenses.
EXPECTED FAMILY CONTRIBUTION (EFC): Students must provide their income, and, if a de-pendent, the income of their parents or guardians, to receive a Pell Grant. Their income level, among other factors, generates an EFC amount that determines the size of their Pell Grant. Students with an EFC of zero are eligible for the maximum Pell award.
LAST-DOLLAR GRANT, CALLED THE “SUMMER SCHOLAR GRANT”: As part of the EASE interven-tion, students in the last-dollar tuition-assistance research group were offered a Grant called the Summer Scholar Grant. It covered the difference between students’ summer tuition and fees and any federal or state Grant financial aid (such as Pell Grant funding).
TRAILER COLLEGE: Colleges that structure their financial aid year as fall, spring, and summer are called trailer colleges. (In other words, summer “trails” as the last term in the aid year.)
HEADER COLLEGE: Colleges that structure their financial aid year as summer, fall, and spring are considered header colleges. (In other words, summer “heads” as the first term in the aid year.)
CREATING SOLUTIONS THAT ADDRESS BARRIERS TO ENROLLMENT
BARRIERPaying for summer courses is a major concern for students.
Students and staff members said that a lack of money was a key reason students did not enroll in summer courses. However, financial aid data that the team analyzed in 2017 revealed that most Pell-eligible students at the study colleges — 79 percent — did not exhaust all of their aid and had Pell Grant funding remaining that could be used for summer school. The reinstatement of year-round Pell Grants, which can be used in summer, led to an even higher percentage of students having funding available in 2018. While tuition is only one part of the cost of college, the team was interested in learning whether providing easy-to-understand information about available aid or a “last-dollar” tuition-assistance Grant (that is, one that covered the difference between students’ summer tuition and fees and their financial aid) would encourage more enrollment in summer classes.

How to Encourage College Summer Enrollment: Final Lessons from the EASE Project5
SOLUTIONCommunicate and simplify cost information.
All of the students in this study were Pell-eligible, first-year college students. Federal Pell Grant amounts are personalized based on each student’s circumstance. The award amount is largely based on two measures: the Expected Family Contribution (EFC), that is, the income, assets, and benefits from the student’s family; and enrollment level, the number of credits the student chooses to take. The lower the EFC, the more money the student will receive. There are also four enrollment levels for Pell funding: quarter time, half time, three-quarter time, and full time. Taken together, these factors provide each student with a unique dollar amount. (That amount can change based on EFC status changes and enrollment levels.) For a full-time student with an EFC of zero, the max-imum award amount was around $6,100 per year for the 2018-2019 award year. There are hundreds of combinations that exist for Pell award amounts. Figure 4 presents four examples that show how much the amounts may vary.
Because the customized calculations for students depend on their EFC and the number of credits they attempt in a given term, students may not be informed of their aid amount until after they register for courses. The paradox here is that if the financial aid information is only shared after the decision to enroll, students may not have all the information they need to make the decision to enroll in the first place. The team developed two ways to address this:
Figure 3. The Research Team’s Diagnosis Process
Talked with dozens of college administrators including financial aid, student services, and marketing sta�; advisors; counselors; vice presidents and presidents
Spoke with administratorsReviewed each college’s website and a large sample of standard communications sent to students, including all communications specifically relevant to summer
Reviewed communications
Conducted focus groups to learn what students thought about summer courses and to understand their communication preferences
Listened to studentsCollected and analyzed thousands of records of students’ financial aid behavior and registration trends
Obtained behavioral data
Reviewed summer course o�erings at each college
Explored course catalogs

6How to Encourage College Summer Enrollment: Final Lessons from the EASE Project
� SOLUTION 1: Provide personal funding estimates
The team explored how to explain summer school cost considerations to students. In collaboration with each participating college’s financial aid office, the team created a Pell Grant Calculator. Finan-cial aid staff members used the calculator to estimate the dollar amount of an individual student’s remaining Pell Grant funding, and then sent the estimate in a personalized message to the student (see Figure 5). The email and postal mailings were designed to show funding by four thresholds: quarter time (1 to 5 credits), half time (6 to 8 credits), three-quarter time (9 to 11 credits), and full time (12 or more credits), because that is how Pell funding is distributed.
In the messages, the team also incorporated behavioral science principles such as reciprocity — the social norm of responding to a positive action with another positive action.6 The messages indi-cated that a financial aid staff member had taken time to review the student’s financial aid package and to calculate the amount of Pell Grant remaining to cover the student’s summer courses. The team included this principle to encourage students to take the estimate seriously and consider taking summer courses.
� SOLUTION 2: Provide financial aid through last-dollar grants and frame summer courses as “free”
The team thought the Pell Grant Calculator would be an effective solution for students who had large Pell Grant amounts remaining. But several steps would still need to be taken: Students would have to decide which courses to take, identify the correct credit threshold, note the dollar amount
6 Fehr and Schmidt (2006).
Figure 4. Pell Grant Award Examples
Student Expected Family Contribution (EFC) ($)
Enrollment level
Award amount ($)
Student A 0 Full time 6,095
Student B 1,000 Full time 5,145
Student C 0 Half time 3,804
Student D 1,000 Half time 2,573
SOURCE: Examples of Pell Grant awards taken from Ivy Tech Community College’s Federal Pell Grant Chart. https://www.ivytech.edu/files/Federal-Pell-Grant-Chart.pdf

How to Encourage College Summer Enrollment: Final Lessons from the EASE Project7
Hi Taylor, I am pleased to let you know that you have up to $2,960 from the year-round Pell Grant to use for summer courses. I strongly recommend you take at least one summer class, because this is financial aid you do not have to pay back. Don’t miss out on the opportunity to take advantage of your funding and get ahead in your education. Your grant award will depend on how many summer courses you take. Use this chart* to determine how many courses you should plan to take this summer:
If you take… You will receive… 1 to 5 credits $740 6 to 8 credits $1,480
9 to 11 credits $2,220 12 or more credits $2,960
If you have questions about your financial aid, email me, call 555-555-0100, or visit the Financial Aid office, located in the Student Services building M101. Best, Bill Louis Financial Aid *Important notes: Funding is contingent on remaining a Pell Grant recipient in summer 2018. Values in the chart are estimates based on your Expected Family Contribution (EFC) and enrollment history.
Figure 5. Example of Personalized Funding Estimate in an Email

8How to Encourage College Summer Enrollment: Final Lessons from the EASE Project
listed in the email and mailing, compare that with the cost of tuition for that credit amount, and then decide to sign up and pay the remaining tuition, if required.
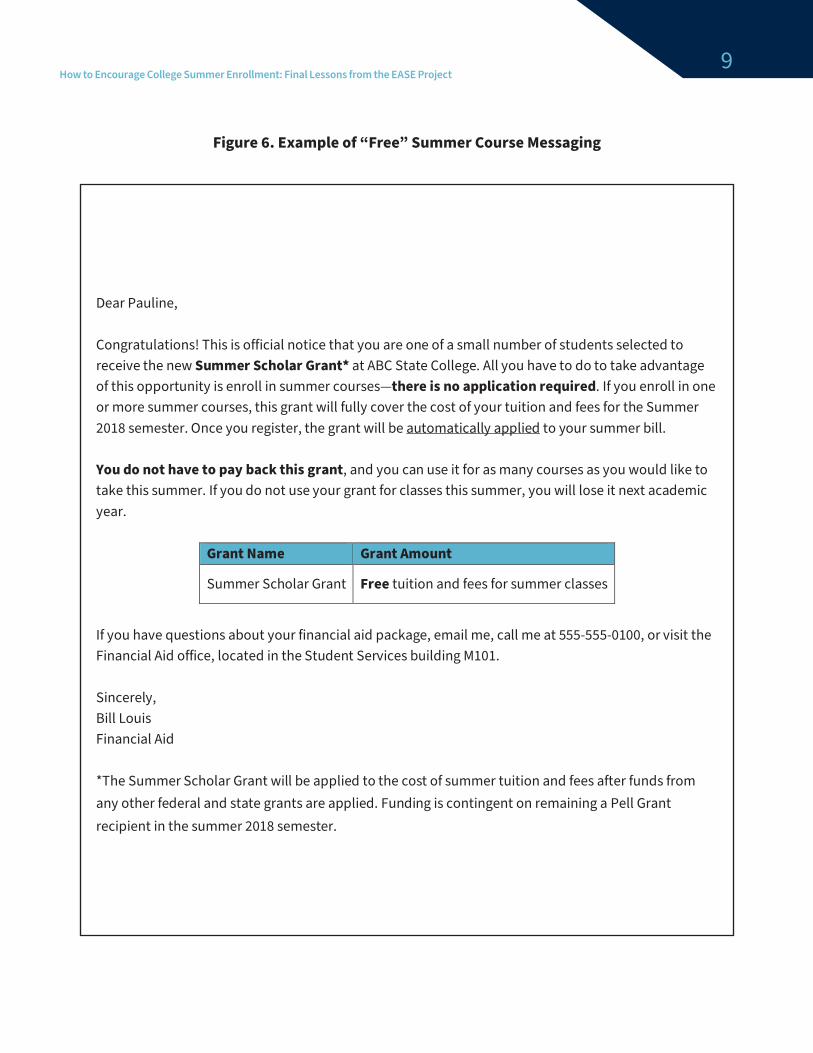
Solution 2 eliminated those steps. The team, with funding from Ascendium Education Group, provided a last-dollar grant that was branded the “Summer Scholar Grant.” It covered the remain-ing cost of summer courses if Pell and state aid did not fully cover a student’s summer tuition. The team named it the Summer Scholar Grant to convey a scholar identity and the idea that students who take summer classes are not academically behind, as they might assume from experience in secondary school, but are getting ahead. Each Summer Scholar Grant amount was determined by a student’s remaining need (if any), and thus personalized to that student. This resulted in some students receiving Summer Scholar Grants with large dollar amounts, while others did not receive any money at all since their summer tuition was already fully covered by Pell and state aid. But for the student, the message was simply conveyed as the cost being “fully covered.” Summer was ulti-mately “free” for all students, so the team created messages that advertised free summer courses for Summer Scholar Grant recipients. This alleviated the hassle factor of determining whether a student had enough funding to cover summer tuition (see Figure 6).
Both strategies were designed to address the financial realities that students faced while providing them with a full picture of their financial situation — giving them the critical information they need-ed to decide about whether to enroll in summer.
BARRIERStudents have summer obligations such as working or caring for family.
While many students set out hoping to complete community college in close to two years, either by earning an associate’s degree or by transferring at that point to a four-year school, competing obligations stood in their way. Students tended to increase work hours during the summer months to earn extra money for the year, or they needed to care for children who were not in school during the summer. Others may have simply needed a break from school. By giving stronger weight to more immediate payoffs or needs, rather than focusing on the future benefits of summer courses, students might delay their degree aspirations.
SOLUTIONElevate peers’ positive experiences in summer courses.
Aware of these competing priorities, the team gathered testimonials from other students who had successfully enrolled in summer courses, in order to influence the decisions of students in the EASE study.7 The testimonials addressed many of the concerns students in the study had expressed, such as not being able to take classes that they needed to graduate, the times that courses were offered, and the cost. Figure 7 provides sample testimonials from students at one Ohio college.
The team shared via email and mailings the experiences of students who had successfully used summer courses to fulfill degree requirements or to graduate on time or earlier. The team highlight-
7 MacCoun (2012).
How to Encourage College Summer Enrollment: Final Lessons from the EASE Project9
Figure 6. Example of “Free” Summer Course Messaging
Dear Pauline, Congratulations! This is official notice that you are one of a small number of students selected to receive the new Summer Scholar Grant* at ABC State College. All you have to do to take advantage of this opportunity is enroll in summer courses—there is no application required. If you enroll in one or more summer courses, this grant will fully cover the cost of your tuition and fees for the Summer 2018 semester. Once you register, the grant will be automatically applied to your summer bill. You do not have to pay back this grant, and you can use it for as many courses as you would like to take this summer. If you do not use your grant for classes this summer, you will lose it next academic year.
Grant Name Grant Amount
Summer Scholar Grant Free tuition and fees for summer classes
If you have questions about your financial aid package, email me, call me at 555-555-0100, or visit the Financial Aid office, located in the Student Services building M101. Sincerely, Bill Louis Financial Aid *The Summer Scholar Grant will be applied to the cost of summer tuition and fees after funds from any other federal and state grants are applied. Funding is contingent on remaining a Pell Grant recipient in the summer 2018 semester.

10How to Encourage College Summer Enrollment: Final Lessons from the EASE Project
Figure 7. Example of Students’ Experiences with Summer Courses
Dear Janae Williams, As you may have heard around campus, many of your classmates are signing up for summer courses to get the most out of their time at ABC State College. You are one of a small number of students selected to receive the new Summer Scholar Grant*, which means you can take summer courses for free.
I wanted to share a couple of stories from students like you who got the most out of their summer by taking classes:
“I wasn’t sure in the beginning if I was going to take summer courses, but I am very happy that I did. It helped me not lose focus and just kept me on track.… The workload part of it is huge for me because I won’t have to stress out with taking two additional classes on top of my nursing program. And without doing summer, I wouldn’t have been able to achieve that.”
--Heather I., Nursing student
“I think of it as a win-win situation. I was able to finish my modern language requirement as a result of taking a summer course. I had a couple friends in the class, and we would typically study after classes together.…It was a good experience overall.”
--Jacob B., Associate of Arts
Make sure you don’t miss out on this opportunity! If you haven’t already done so, log in at www .stuinfo.collegesite.edu/registration to register for courses by May 1, 2018.
Sincerely, James Cho Student Academic Success *The Summer Scholar Grant will be used to pay the cost of summer tuition and fees after other federal and state grants are applied. Funding is contingent on remaining a Pell Grant recipient.

How to Encourage College Summer Enrollment: Final Lessons from the EASE Project11
ed examples of how students had overcome work or family obligations — for example, by taking advantage of evening classes or by taking courses online.
BARRIERSummer term is not conveyed as the norm.
Students received limited information about the summer term, including its potential benefits and deadlines. The team’s administrative data analysis revealed that college students under 24 years of age were less likely to attend during the summer, indicating that social norms may also have con-tributed to low summer enrollment. Some students may have remembered having summers off during secondary school and may not have considered enrolling in the summer term. Others may have believed that summer coursework was for students who were behind, as was often the case in high school, and not for those who aimed to get ahead.
SOLUTIONHighlight the benefits of enrolling in summer courses.
The team wanted to highlight the benefits of taking summer courses and the positive impacts on students’ long-term outcomes. Many students who were increasing their work hours or pursuing other short-term priorities during the summer still hoped to complete an associate’s degree in two years. The team wanted to make the idea of taking summer courses the norm by showing that by not taking summer courses, students were putting themselves behind. The team illustrated this concept on a postcard. The road straight to graduation included taking summer courses, while the road that didn’t include taking summer courses was a detour to graduation.
BARRIERDegree planning and course decision-making is complicated.
Students were often unaware of summer course offerings because the options were more limited than in the fall and spring semesters. However, many students — especially those who attended school part-time or had developmental education requirements — likely had courses they could take in the summer. At the same time, degree planning documents typically offered only fall and spring term information but did not mention the summer term, even though that was a time when meaningful progress could be made toward part-time students’ degrees. Furthermore, because fewer courses were offered in summer, there was some concern that the courses students needed to meet their degree requirements might not be available.
SOLUTIONProvide clear options for summer courses and planning.
The team simplified the process of registering for summer courses by including all of the informa-tion that a student would need to enroll in just three steps. Each college’s instructions varied slight-ly, but in this example, students were encouraged first to write down the courses that they hadn’t taken yet, identify the classes offered during the summer that would work with their schedule, and then immediately sign up for them. The team linked to all relevant information, such as the course
12How to Encourage College Summer Enrollment: Final Lessons from the EASE Project
catalog and the college portal, directly in the email to make it easier for students to navigate to the requisite web pages. Figure 8 shows a sample email sent by one of the project’s college partners.
Several colleges created personalized course recommendations for students that highlighted three to five options that would work with their major. While this information was already available to students if they searched the college’s course catalogue, highlighting and personalizing a few relevant options for them and providing clear guidance may have made them more likely to act on their intention to register.
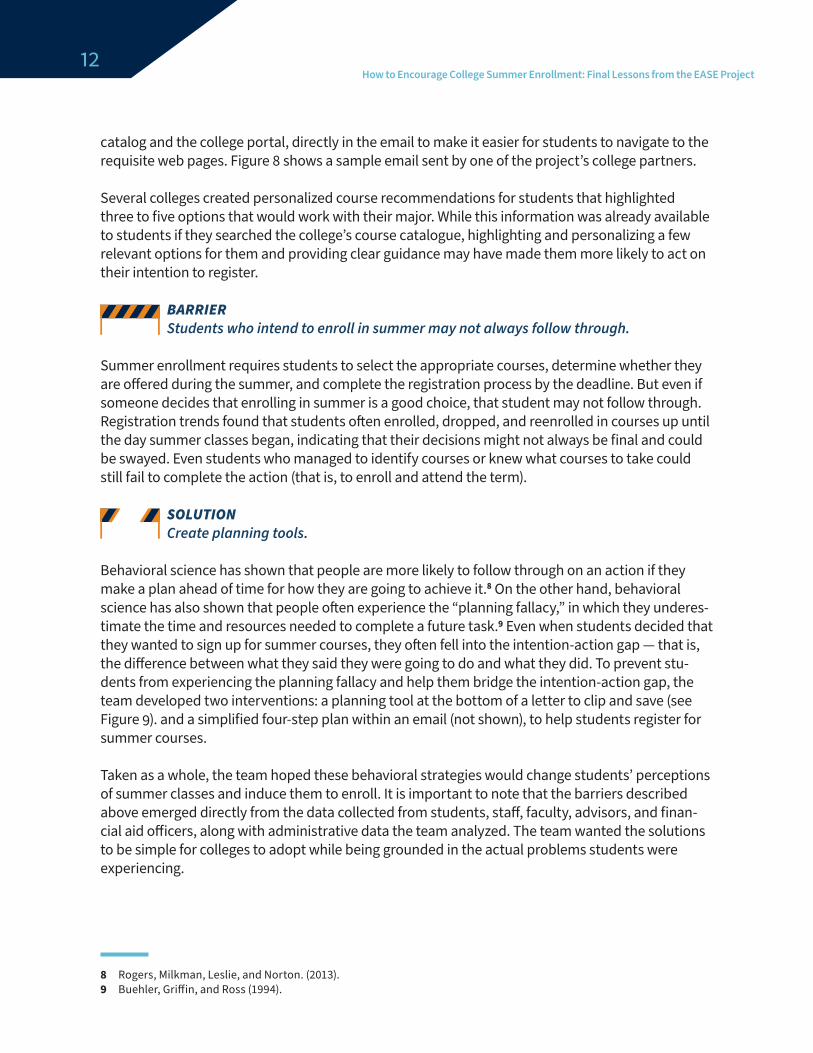
BARRIERStudents who intend to enroll in summer may not always follow through.
Summer enrollment requires students to select the appropriate courses, determine whether they are offered during the summer, and complete the registration process by the deadline. But even if someone decides that enrolling in summer is a good choice, that student may not follow through. Registration trends found that students often enrolled, dropped, and reenrolled in courses up until the day summer classes began, indicating that their decisions might not always be final and could be swayed. Even students who managed to identify courses or knew what courses to take could still fail to complete the action (that is, to enroll and attend the term).
SOLUTIONCreate planning tools.
Behavioral science has shown that people are more likely to follow through on an action if they make a plan ahead of time for how they are going to achieve it.8 On the other hand, behavioral science has also shown that people often experience the “planning fallacy,” in which they underes-timate the time and resources needed to complete a future task.9 Even when students decided that they wanted to sign up for summer courses, they often fell into the intention-action gap — that is, the difference between what they said they were going to do and what they did. To prevent stu-dents from experiencing the planning fallacy and help them bridge the intention-action gap, the team developed two interventions: a planning tool at the bottom of a letter to clip and save (see Figure 9). and a simplified four-step plan within an email (not shown), to help students register for summer courses.
Taken as a whole, the team hoped these behavioral strategies would change students’ perceptions of summer classes and induce them to enroll. It is important to note that the barriers described above emerged directly from the data collected from students, staff, faculty, advisors, and finan-cial aid officers, along with administrative data the team analyzed. The team wanted the solutions to be simple for colleges to adopt while being grounded in the actual problems students were experiencing.
8 Rogers, Milkman, Leslie, and Norton. (2013).9 Buehler, Griffin, and Ross (1994).

How to Encourage College Summer Enrollment: Final Lessons from the EASE Project13
Figure 8. Example of Instructions for Registering for Summer Courses
Hi Jane, Summer registration is now open! Take advantage of your new Summer Scholar Grant, which allows you to take Summer 2018 courses for FREE! Taking summer courses is the best way to stay on track toward getting your degree. In fact, many of your classmates at ABC State College attend summer classes to graduate sooner. Secure your seat in the classes you need by taking a few minutes to register for summer courses now. Follow these simple steps to enroll:
1. Look at the summer course schedule [link here] and write down courses that you need for your degree program that you haven’t taken yet.
2. Choose courses that work with your summer schedule. 3. Register for your summer courses at www.stuinfo.collegesite/edu/registration.
Pay for your summer courses with your Summer Scholar Grant.
If you need assistance, take 15 minutes this week while on campus to check in with me. Contact me at klucas@collegesite. edu or 500-555-0100 to schedule a quick advising session. Sincerely, Karen Lucas Academic Advisor P.S. All you need to do to receive the Summer Scholar Grant is enroll in summer courses. You do NOT need to apply for the grant separately. The Summer Scholar Grant will be used to pay the cost of summer tuition and fees after other federal and state grants are applied. Funding is contingent on remaining a Pell Grant recipient in summer 2018.

14How to Encourage College Summer Enrollment: Final Lessons from the EASE Project
Figure 9. Example of Plan-Making Tool in a Letter
Your goals could be closer than you think! Register for summer now to make it happen.
Think about how summer can help you:
I will commit to taking summer courses so I can achieve my goals faster.
I want to graduate faster I would like to earn more credits this year I still have prerequisites to take for my major
If you checked yes to any of these, summer courses are right for you!
ADAPTING INTERVENTIONS TO NATIONAL POLICY CHANGESPhase I of the EASE interventions launched in spring 2017 and included a cohort of 3,689 first-year low-income students who had enrolled in the spring semester. At that time, students who enrolled full time in the fall and spring semesters did not have Pell Grant funding remaining for summer courses, but part-time students may have had some Pell funding available. Phase II of the inter-ventions, with a cohort of 6,979 students, was launched at 10 colleges in spring 2018 to encourage enrollment in the summer 2018 term. By then the year-round Pell Grant had been reinstated and all Pell Grant recipients could receive funding to pay for summer courses.
The solutions described were used to encourage enrollment in both the 2017 and 2018 summer terms. However, when implementing the interventions in Phase II, the team made minor adjust-ments to account for the year-round Pell Grant, and to take into account feedback the team had solicited from students after the first summer term. Changes in Phase II included:
� A mention of year-round Pell in the informational campaign group communications, such as: “I have good news! I took some time to review your records and identified you as a student who will benefit from the new year-round Pell Grant policy!”
� Changing the planning tool from a postcard in Phase I to a letter mailed in an envelope in Phase II. The shift from postcard to letter was to account for students who said they did not remember the postcard.
How to Encourage College Summer Enrollment: Final Lessons from the EASE Project15
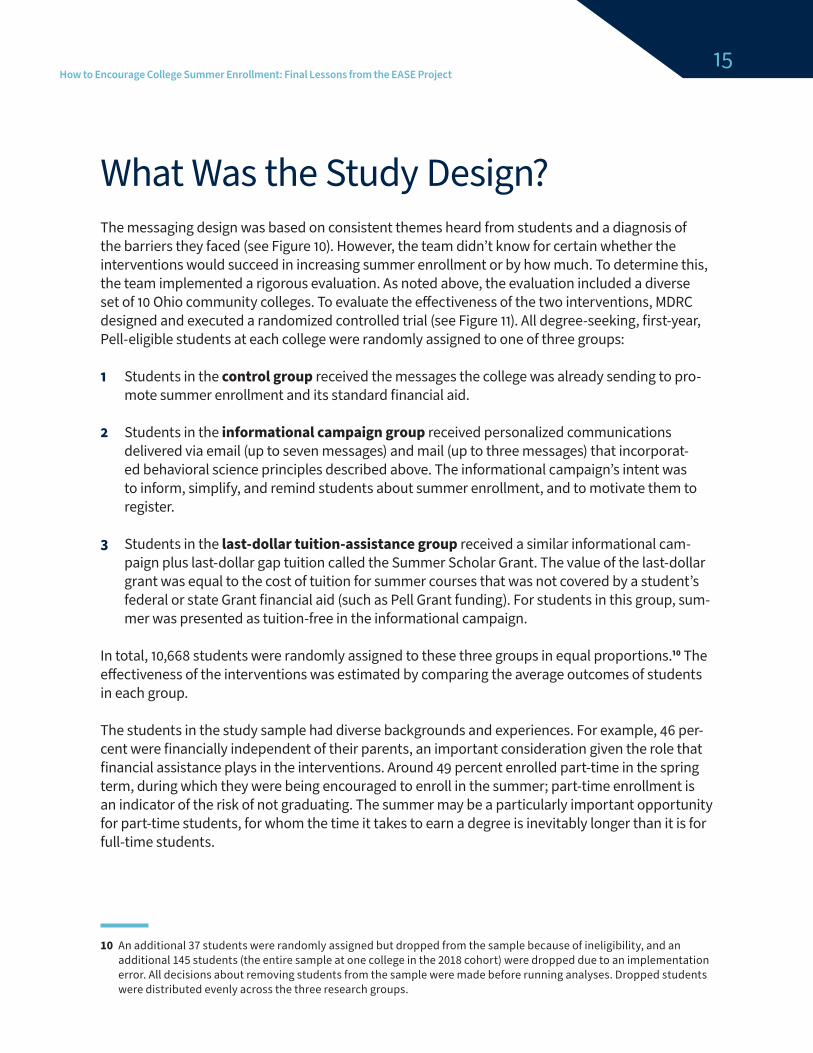
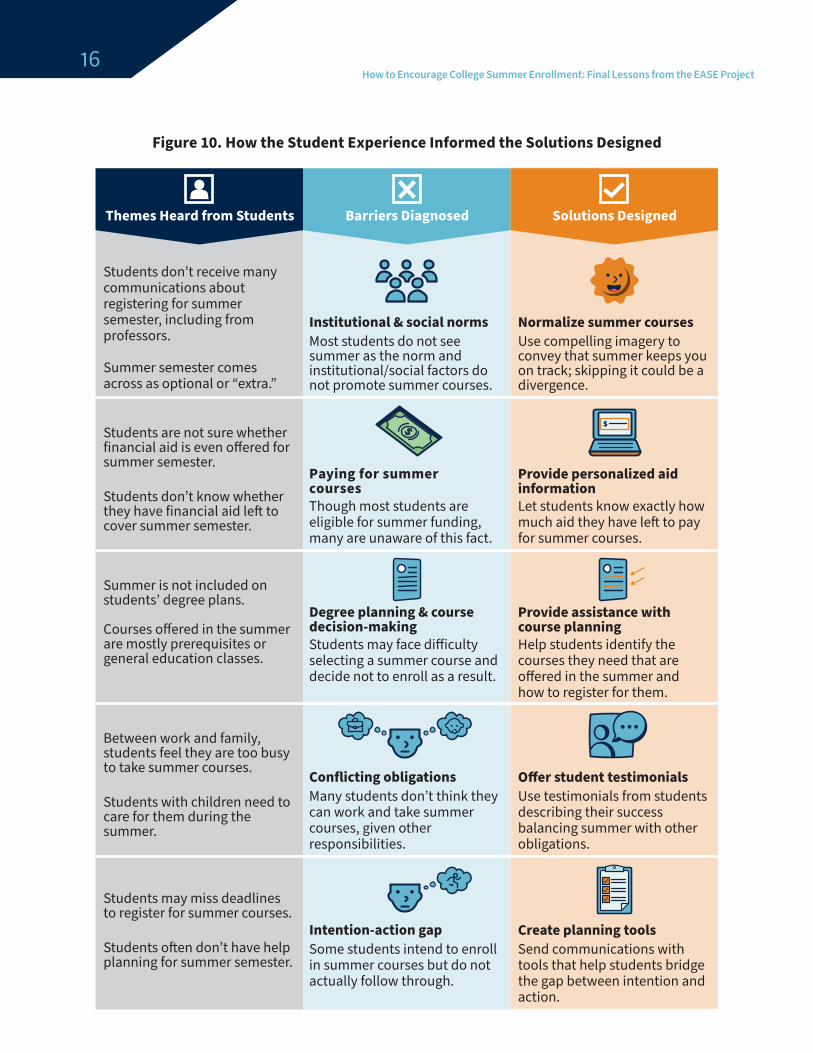
What Was the Study Design?The messaging design was based on consistent themes heard from students and a diagnosis of the barriers they faced (see Figure 10). However, the team didn’t know for certain whether the interventions would succeed in increasing summer enrollment or by how much. To determine this, the team implemented a rigorous evaluation. As noted above, the evaluation included a diverse set of 10 Ohio community colleges. To evaluate the effectiveness of the two interventions, MDRC designed and executed a randomized controlled trial (see Figure 11). All degree-seeking, first-year, Pell-eligible students at each college were randomly assigned to one of three groups:
1 Students in the control group received the messages the college was already sending to pro-mote summer enrollment and its standard financial aid.
2 Students in the informational campaign group received personalized communications delivered via email (up to seven messages) and mail (up to three messages) that incorporat-ed behavioral science principles described above. The informational campaign’s intent was to inform, simplify, and remind students about summer enrollment, and to motivate them to register.
3 Students in the last-dollar tuition-assistance group received a similar informational cam-paign plus last-dollar gap tuition called the Summer Scholar Grant. The value of the last-dollar grant was equal to the cost of tuition for summer courses that was not covered by a student’s federal or state Grant financial aid (such as Pell Grant funding). For students in this group, sum-mer was presented as tuition-free in the informational campaign.
In total, 10,668 students were randomly assigned to these three groups in equal proportions.10 The effectiveness of the interventions was estimated by comparing the average outcomes of students in each group.
The students in the study sample had diverse backgrounds and experiences. For example, 46 per-cent were financially independent of their parents, an important consideration given the role that financial assistance plays in the interventions. Around 49 percent enrolled part-time in the spring term, during which they were being encouraged to enroll in the summer; part-time enrollment is an indicator of the risk of not graduating. The summer may be a particularly important opportunity for part-time students, for whom the time it takes to earn a degree is inevitably longer than it is for full-time students.
10 An additional 37 students were randomly assigned but dropped from the sample because of ineligibility, and an additional 145 students (the entire sample at one college in the 2018 cohort) were dropped due to an implementation error. All decisions about removing students from the sample were made before running analyses. Dropped students were distributed evenly across the three research groups.
16How to Encourage College Summer Enrollment: Final Lessons from the EASE Project
Figure 10. How the Student Experience Informed the Solutions Designed
Themes Heard from Students Barriers Diagnosed Solutions Designed
Most students do not see summer as the norm and institutional/social factors do not promote summer courses.
Institutional & social normsUse compelling imagery to convey that summer keeps you on track; skipping it could be a divergence.
Normalize summer courses
Students don’t receive many communications about registering for summer semester, including from professors.
Summer semester comes across as optional or “extra.”
Between work and family, students feel they are too busy to take summer courses.
Students with children need to care for them during the summer.
Students may miss deadlines to register for summer courses.
Students o�en don’t have help planning for summer semester.
Summer is not included on students’ degree plans.
Courses o ered in the summer are mostly prerequisites or general education classes.
Students are not sure whether financial aid is even o ered for summer semester.
Students don’t know whether they have financial aid le� to cover summer semester.
Though most students are eligible for summer funding, many are unaware of this fact.
Paying for summercourses
Let students know exactly how much aid they have le� to pay for summer courses.
Provide personalized aid information
Students may face di iculty selecting a summer course and decide not to enroll as a result.
Degree planning & course decision-making
Help students identify the courses they need that are o ered in the summer and how to register for them.
Provide assistance with course planning
Many students don’t think they can work and take summer courses, given other responsibilities.
Conflicting obligationsUse testimonials from students describing their success balancing summer with other obligations.
O�er student testimonials
Some students intend to enroll in summer courses but do not actually follow through.
Intention-action gapSend communications with tools that help students bridge the gap between intention and action.
Create planning tools

How to Encourage College Summer Enrollment: Final Lessons from the EASE Project17
RESEARCH QUESTIONSThe primary aim of the evaluation was to answer a few focused questions.11 They included:
1 Did the interventions increase summer enrollment?
Because the last-dollar grant added cost, it was also important to know:
2 Was the more costly intervention more effective at increasing summer enrollment?
Because the summer 2017 cohort operated without year-round Pell funding and the summer 2018 cohort operated with year-round Pell, the research team also asked:
11 The project’s registered analysis plan is available at https://osf.io/mryxh/.
Figure 11. Study Design
10
3
1
6
98
7
4 5
2
10,668 students at 10 Ohio community colleges
Randomly assigned to one of three research groups
No Intervention (Control) Informational CampaignLast-Dollar Grant Paired with
Informational Campaign
• Pell Grant–eligible• First-year student• Ohio resident
College’s standard communications and financial
aid o�erings
College’s standard communications and financial
aid o�erings
Behaviorally informed emails, postcards, and letters
College’s standard communications and financial
aid o�erings
Last-dollar grant
Behaviorally informed emails, postcards, and letters

18How to Encourage College Summer Enrollment: Final Lessons from the EASE Project
3 Did the policy shift to year-round Pell influence the effectiveness of the interventions?
In addition to addressing these primary questions, the team also explored questions about the following topics:
� The interventions’ effects on progress toward a degree (using credits earned as a proxy for progress)
� The extent to which the interventions led to increases in fall enrollment
� The extent to which early positive effects faded out, were maintained, or grew
� The extent to which improvements in summer enrollment rates varied by types of students or colleges
What Were the Results?
EFFECTS ON ACADEMIC OUTCOMESBoth the 2017 and 2018 interventions achieved their primary aim — to increase summer enrollment. The addition of tuition assistance to the informational campaign more than doubled its effective-ness. Both interventions increased summer enrollment in the absence and in the presence of year-round Pell Grants and for multiple types of students — suggesting potentially generalizable results. Both interventions also led to small and sustained positive impacts on credit accumulation, bring-ing students closer to earning a degree. Neither intervention, however, had a positive effect on fall enrollment.
1 Did the interventions increase summer enrollment?
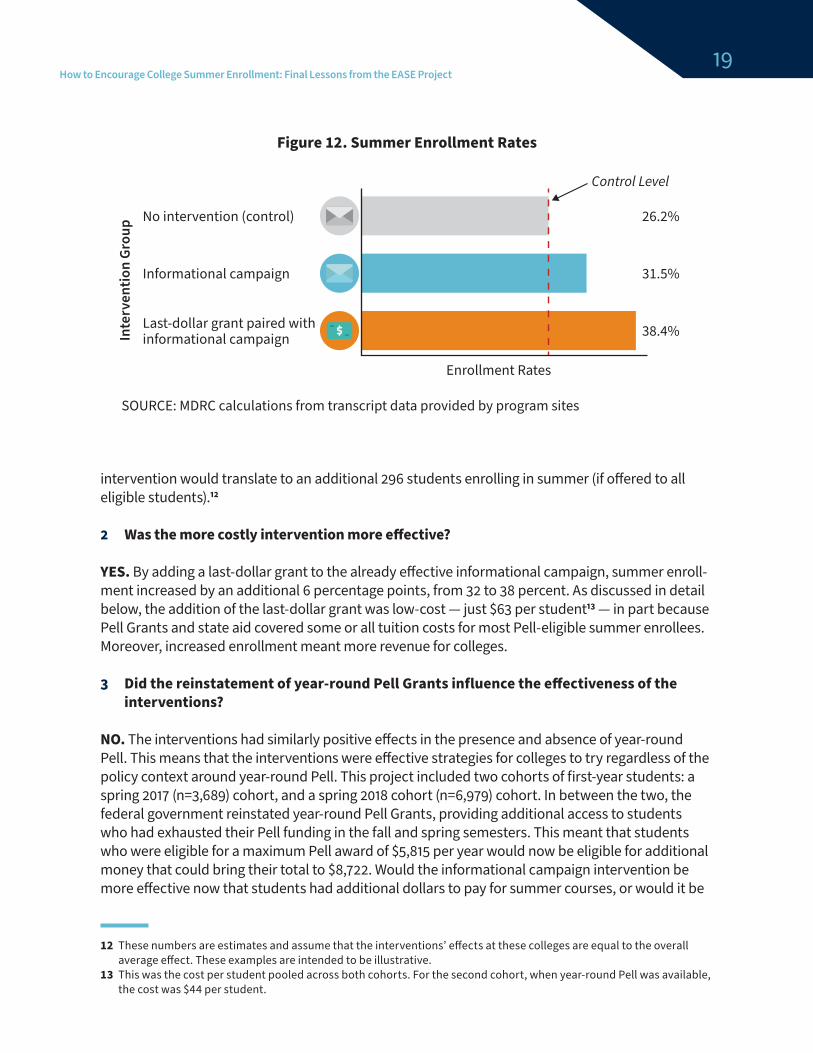
YES. Both interventions caused more students to enroll in the summer. In the absence of any in-tervention, 26 percent of students enrolled in the summer. The informational campaign increased summer enrollment by 5 percentage points, to 32 percent. The last-dollar grant paired with the informational campaign increased summer enrollment by 12 percentage points, to 38 percent (see Figure 12).
The increases in summer enrollment rates have meaningful implications for students at colleges implementing these strategies. For example, at a college like Clark State Community College, which is a midsize college that served 596 Pell-eligible first-year students in summer 2018, the more costly intervention would translate to an additional 72 students enrolling in the summer (if offered to all eligible students). At Columbus Community College, which served 2,465 Pell-eligible first-year students in summer 2018, the results for student enrollment would be even larger: The more costly
How to Encourage College Summer Enrollment: Final Lessons from the EASE Project19
intervention would translate to an additional 296 students enrolling in summer (if offered to all eligible students).12
2 Was the more costly intervention more effective?
YES. By adding a last-dollar grant to the already effective informational campaign, summer enroll-ment increased by an additional 6 percentage points, from 32 to 38 percent. As discussed in detail below, the addition of the last-dollar grant was low-cost — just $63 per student13 — in part because Pell Grants and state aid covered some or all tuition costs for most Pell-eligible summer enrollees. Moreover, increased enrollment meant more revenue for colleges.
3 Did the reinstatement of year-round Pell Grants influence the effectiveness of the interventions?
NO. The interventions had similarly positive effects in the presence and absence of year-round Pell. This means that the interventions were effective strategies for colleges to try regardless of the policy context around year-round Pell. This project included two cohorts of first-year students: a spring 2017 (n=3,689) cohort, and a spring 2018 cohort (n=6,979) cohort. In between the two, the federal government reinstated year-round Pell Grants, providing additional access to students who had exhausted their Pell funding in the fall and spring semesters. This meant that students who were eligible for a maximum Pell award of $5,815 per year would now be eligible for additional money that could bring their total to $8,722. Would the informational campaign intervention be more effective now that students had additional dollars to pay for summer courses, or would it be
12 These numbers are estimates and assume that the interventions’ effects at these colleges are equal to the overall average effect. These examples are intended to be illustrative.
13 This was the cost per student pooled across both cohorts. For the second cohort, when year-round Pell was available, the cost was $44 per student.
Figure 12. Summer Enrollment Rates
Enrollment Rates
SOURCE: MDRC calculations from transcript data provided by program sites
26.2%
38.4%
31.5%
Control Level
No intervention (control)
Informational campaign
Last-dollar grant paired with informational campaignIn
terv
entio
n Gr
oup
20How to Encourage College Summer Enrollment: Final Lessons from the EASE Project
ineffective because all students (including the control group) would be inundated with new mes-sages about year-round Pell, drowning out the campaign? Would the addition of a last-dollar grant no longer have value since all students now had access to at least some financial aid? Should the team change the interventions, given this directly relevant policy shift? After lengthy discussion, the team decided to keep the interventions largely the same and see what happened.14
In the end, the estimated effect of the informational campaign on summer enrollment was nearly identical across the two cohorts. The estimated effect of the last-dollar grant paired with an infor-mational campaign was slightly lower in magnitude with year-round Pell in place, but not discern-ably different.15 In sum, the effectiveness of these interventions held up to a major shift in highly relevant federal policy — a strong sign for the broader generalizability of findings.
With the primary research questions answered, several secondary questions remained.
� Did the interventions help students’ progress toward earning a degree?
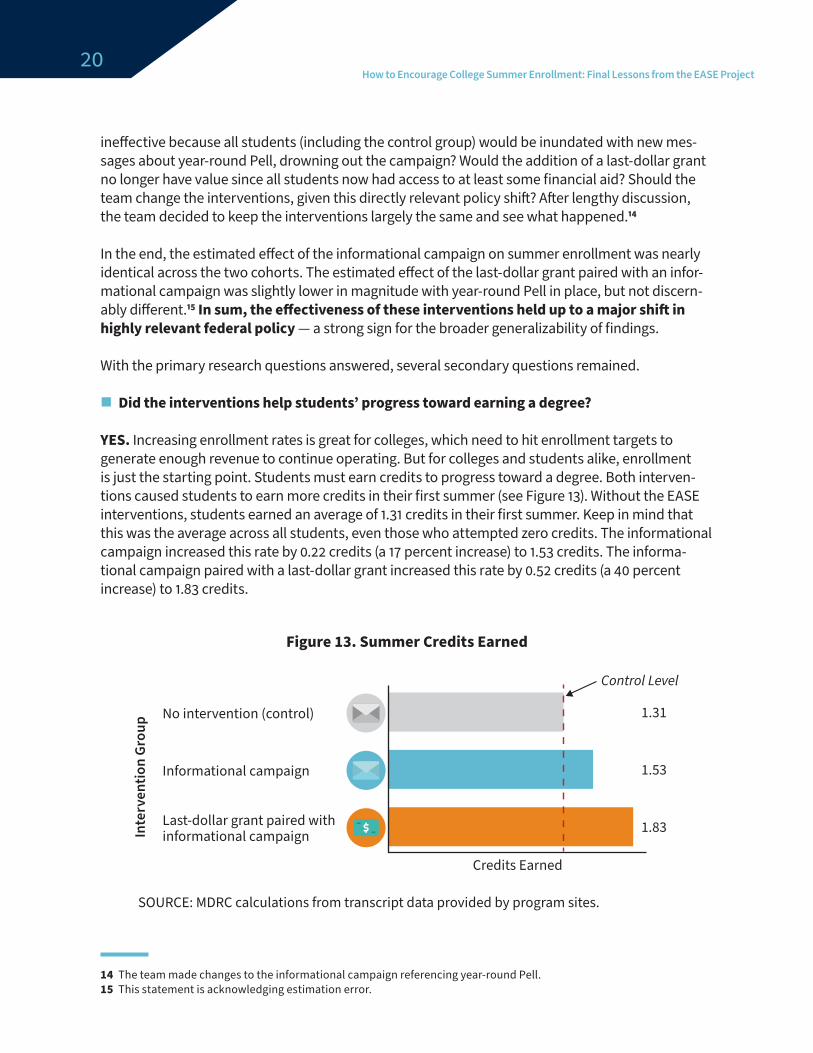
YES. Increasing enrollment rates is great for colleges, which need to hit enrollment targets to generate enough revenue to continue operating. But for colleges and students alike, enrollment is just the starting point. Students must earn credits to progress toward a degree. Both interven-tions caused students to earn more credits in their first summer (see Figure 13). Without the EASE interventions, students earned an average of 1.31 credits in their first summer. Keep in mind that this was the average across all students, even those who attempted zero credits. The informational campaign increased this rate by 0.22 credits (a 17 percent increase) to 1.53 credits. The informa-tional campaign paired with a last-dollar grant increased this rate by 0.52 credits (a 40 percent increase) to 1.83 credits.
14 The team made changes to the informational campaign referencing year-round Pell.15 This statement is acknowledging estimation error.
Figure 13. Summer Credits Earned
No intervention (control)
Informational campaign
Last-dollar grant paired with informational campaign
Credits Earned
Control Level
1.31
1.83
1.53
SOURCE: MDRC calculations from transcript data provided by program sites.
Inte
rven
tion
Grou
p

How to Encourage College Summer Enrollment: Final Lessons from the EASE Project21
Another way to consider the interventions’ impact on students’ progress toward a degree is to look at whether the interventions caused more students to complete at least one summer course. Here again, the answer was “Yes.” Among all control group members, 21.9 percent passed at least one class in their first summer. The informational campaign increased this rate by 3.9 percentage points to 25.8 percent. The last-dollar grant paired with the informational campaign increased this rate by 10 percentage points to 31.9 percent (see Appendix Table A.1.) Both interventions caused more students to earn at least some credits in the summer.
Pushing this a step further, how many additional credits, on average, were earned by the students who benefited from these interventions? As displayed in Figure 14, the team assumed that all effects on summer credits earned were concentrated among the students who were induced to
Figure 14. Average Credit Impact Among Students Induced to Enroll in Summer
No e�ect on credits
No e�ect on credits
4.2 credite�ect
4.3 credite�ect
61.6%
26.2%
12.2%
26.2%
68.5%
5.3%
Students who do not enroll with or without intervention (impact must be 0)=Students who enroll with or without intervention (impact assumed to be 0)=Students induced to enroll by the intervention (impact on credits comes from this group)=
Informational Campaign Last-Dollar Grant Paired with Informational Campaign
SOURCE: MDRC calculations from transcript data provided by program sites.
NOTE: The light blue bars represent students induced to enroll in summer by the intervention. Among such students, the estimated e�ect on credits earned is calculated by dividing (a) the overall average impact on credits earned by (b) the percent induced to enroll in the summer. In the case of the information campaign this is 0.22/0.053 = 4.2 credits earned. In the case of the last-dollar grant paired with informational campaign this is 0.52/0.0122 = 4.3 credits earned. The impact on credits earned for the informational campaign and last-dollar grant paired with informational campaign (0.22 and 0.52, respectively) are shown in Appendix Table A.1.

22How to Encourage College Summer Enrollment: Final Lessons from the EASE Project
enroll in the summer.16 It seems likely, then, that the informational campaign caused 5.3 percent of students to earn an average of 4.2 credits that they would not have earned without the campaign (calculated as 0.22/0.053). Similarly, the last-dollar grant paired with the informational campaign caused 12 percent of students to earn an average of 4.3 credits that they otherwise would not have earned (calculated as 0.52/0.122). Students induced by the interventions to enroll in summer passed one to two additional courses. While the interventions’ effects on overall average credits earned were small, for the subset of students who benefited from these interventions, the effects were meaningful.
The interventions’ success in increasing summer credit accumulation occurred, in part, because students attempted more credits. But how did students fare when induced to attempt extra cred-its? What were their pass rates?
Summer course pass rates were 76 percent for the control group, 74 percent for students in the informational campaign group, and 75 percent for students in the last-dollar tuition-assistance group (see Appendix Table A.2). So, the intervention groups had lower pass rates. But this isn’t an apples-to-apples comparison. Both interventions caused additional students to enroll in summer courses, making the composition of summer enrollees different across the three groups. One way in which summer enrollees could differ among the groups is in their pass rates before the rele-vant summer (that is, in the spring) — an indicator of prior performance. Spring pass rates among summer enrollees were 86 percent for the control group, 83 percent for the informational cam-paign group, and 82 percent for the last-dollar tuition-assistance group. This implies that students induced to enroll in summer were initially lower-performing than students who enrolled in the summer with or without an intervention. The upshot: Considering the prior performance of summer enrollees, those induced to enroll in the summer performed fine.
As a related aside, among all summer enrollees, pass rates were lower in the summer term than in the prior spring term. There are several possible reasons for this. Students may have been juggling more responsibilities in the summer such as child care, summer internships, and extra part-time work. It may also be that students took harder courses in the summer, or that the compressed time frame was more challenging for them.
� Did students take courses that kept them on track for graduation?
YES. One concern at the outset of the study was that students would not have appropriate course options in summer that would help them make progress toward their degree requirements. A subset of students whose records were examined in detail were taking courses that were relevant to their major or required for graduation. The research team examined a random sample of 50 students at one college from the last-dollar tuition-assistance group. The team analyzed the stu-dents’ declared majors (as of spring 2018) and transcript records from summer 2018. The team also reviewed the students’ course records and compared them with the course catalog to see if the classes they took were listed as a part of their major’s program requirements.
16 While plausible, it is also possible that some students who would have enrolled in the summer with or without the intervention earned more credits because of the intervention. This seems particularly feasible for the group that received a tuition wavier.

How to Encourage College Summer Enrollment: Final Lessons from the EASE Project23
Of the 50 students examined, 48 attempted at least one course required for their degree; 38 passed (that is, earned a grade of A, B, C, D, or P) at least one course required for their degree; and 84 per-cent of the credits attempted by these students counted for their major (not shown). This suggests that students were able to take and pass courses that fulfilled their major requirements, an impor-tant marker of progress toward a degree.
� Did the interventions’ success at increasing summer enrollment lead to increases in fall enrollment?
NO. Despite both interventions increasing summer enrollment, fall enrollment levels were unaf-fected by them. Without the EASE interventions, 54.7 percent of students enrolled in the fall, com-pared with 54.8 percent of those who were offered the informational campaign, and 55.4 percent of those who were offered the last-dollar grant paired with the informational campaign (see Appen-dix Table A.1). These differences are neither practically meaningful nor statistically significant. So, what happened? Why didn’t increased summer enrollment cause increased fall enrollment?
Without enormous effects on summer enrollment, it’s unlikely that increasing summer enrollment alone will lead directly to substantively meaningful increases in fall enrollment. Figure 15 provides a visual depiction of the funnel that creates this challenge. Some 1,363 students who were offered the last-dollar grant paired with the informational campaign (or 38.4 percent of the total sample
Figure 15. Why an Increase in Summer Enrollment is Not Expected to Lead to a Substantial Increase in Fall Enrollment
(Last-Dollar Grant Paired with Informational Campaign Example)
NOTE: aBased on past research on academic momentum, 71 students would be predicted to be induced to enroll in fall.
Everyone in sample (3,550)
Number of students
Students who enrolled in
summer (1,363)433 Induced to enroll in summer by intervention
930 Would have enrolled without intervention
Students induced to enroll in summer (433)
25 Induced to enroll in falla
1,363Enrolled in summer
2,187Didn’t enroll in summer
= 5 students
24How to Encourage College Summer Enrollment: Final Lessons from the EASE Project
of 3,550) enrolled in summer. This included 930 students, or 26.2 percent of the total sample, who enrolled with or without the informational campaign; and 433 students, or 12.2 percent of the total sample, that the intervention caused to enroll in summer. If students induced to enroll in summer are 16 percentage points more likely to enroll in fall (as some past research on academic momen-tum suggests), then one would only expect an additional 1.9 percentage point increase in fall enrollment rates (16 percent of 12.2 percentage points).17 This equals 71 additional fall enrollees.
However, the estimated effect on fall enrollment was 0.7 percentage points, smaller than the pre-dicted 1.9 percentage points. This might mean that summer enrollment bridges the gap less than past research suggests; but more importantly, it shows that increasing summer enrollment alone is unlikely to substantially increase fall enrollment. Therefore, the main benefit of these interven-tions is to increase summer enrollment and credit accumulation — they don’t meaningfully help with fall retention.
� Did the early positive effects of the interventions fade out? Did they grow? Were they maintained?
The effects of the interventions were maintained. Since the interventions did not boost fall enrollment, one might wonder whether the control group “caught up.” That is, what happened to the positive credit gain these interventions caused? As noted earlier, the average effect on credits earned during the first summer was 0.22 more credits for the informational campaign group, and 0.52 more credits for the last-dollar tuition-assistance group. A year later, at the end of the second summer, the average effects on cumulative credits earned were 0.21 and 0.51 for the same two groups, respectively (see Appendix Figure A.1). In the case of the informational campaign group the result was not statistically significant (because the precision of the estimated effect decreased over time); however, there is no evidence of fade-out, since the effect estimates were basically identical at the end of the first and second summers. Both interventions increased credits earned during summer 2017, and these effects remained present one year later.
Students in the evaluation first enrolled in college during the fall or spring prior to the intervention summer. For those who first enrolled in fall, the end of the second summer represented two years after entering college. For those who first enrolled in spring, the end of the second summer was one semester shy of two years after entering college. Given the duration of follow-up, it is pre-mature to expect effects on degree completion, and the data match this expectation; there is no compelling evidence of an effect on degree completion. Given the positive effect on credit accu-mulation combined with the parallel logic explained above about why fall enrollment is so hard to increase, it seems unlikely that these interventions alone will even modestly increase graduation rates, even with longer-term follow-up. Rather, these interventions are compelling because they help students make academic progress, they are low-cost, they have strong potential for being ex-panded to other states, and it seems plausible that they, in combination with other reforms, could help improve graduation rates.
17 Attewell, Heil, and Reisel. (2012).
How to Encourage College Summer Enrollment: Final Lessons from the EASE Project25
� Were the interventions effective at increasing summer enrollment for different types of students?
The interventions increased summer enrollment for each subgroup examined. The findings presented thus far have been estimates of the overall average effects of the interventions. But in-terventions can have different effects for different types of students. Based on data availability (see Appendix Table A.3 for detailed results), each intervention’s effects were estimated for the follow-ing subsets of students:
� Expected Family Contribution (EFC = 0 or EFC > 0)
� Race/ethnicity (White, Black, Hispanic, Multiracial, or Other)
� Pell funds remaining for use in summer (yes or no)
The estimated effect of the informational campaign was positive for all subgroups of stu-dents examined. 18
The estimated effect of the last-dollar grant paired with the informational campaign was large and positive for all students.19 The addition of the last-dollar grant appeared to be espe-cially beneficial for students with an EFC > 0. The reason, the team hypothesized, was that as stu-dents’ EFC increased, they were eligible for smaller Pell Grant awards; consequently, the monetary value of the last-dollar grant provided by the college increased to cover the difference. Examined through an equity lens, this finding raises important questions.
All students in this project were Pell recipients. This indicates that the federal government deemed them as having financial need. Students with an EFC = 0 were considered to have the greatest financial need. For those students, the last-dollar grant paired with the informational campaign increased summer enrollment by an estimated 9.7 percentage points. For those with an EFC > 0, the estimated effect was 16.8 percentage points. While the intervention benefited both groups, it benefited those with less financial need more. Typically, this would mean exacerbating an existing equity gap since students with greater financial need tend to perform worse academically. Inter-estingly, in the absence of the interventions, students in this study with EFC = 0 enrolled in summer at slightly higher rates than students with EFC > 0. That is, there was no traditional equity gap on this outcome measure. The intervention flipped the direction of the difference so that students with EFC > 0 were now 4.4 percentage points more likely to enroll in the summer. Within the sub-population of Pell-eligible students, the intervention did not improve equity with respect to finan-cial-need-based achievement gaps.
Taking a broader perspective and considering all students in the colleges (not just Pell-eligible students), the last-dollar grant paired with the informational campaign may be a useful strategy to mitigate inequity. Since students with the least financial need (that is, those who were not Pell
18 In all but two instances (students in the multiracial subgroup or with no Pell funding remaining), the estimated effect was statistically significant.
19 In all instances the estimated effect was also statistically significant.
26How to Encourage College Summer Enrollment: Final Lessons from the EASE Project
recipients) were not offered the interventions, they were unlikely to be affected by them. Thus, by targeting Pell recipients and having a positive effect on their summer enrollment, the interventions must have reduced the achievement gap between Pell recipients and students who didn’t receive Pell Grants.
In sum, the evidence suggests that both interventions had positive effects for several different types of students. This is encouraging.
� Did the effect of the interventions vary across colleges?20
NO AND YES. The effect of the informational campaign did not appear to vary across col-leges, but the effect of the last-dollar grant paired with the informational campaign may have varied across colleges. An intervention that works at one college may not necessarily work at another one. Such variation in effectiveness can occur because of differences in intervention implementation, context, student population served, or alternative services offered.21 A strength of this study is that it took place at 10 colleges. Because of this, it was possible to test whether the interventions’ effects on summer enrollment varied among the different schools.
For the informational campaign, there is no evidence that effects on summer enrollment varied across colleges. The best estimate is that the informational campaign consistently increased summer enrollment by around 5 percentage points. Given this, it’s unsurprising that effects were positive whether a college’s financial aid calendar was a header or a trailer22 and whether the college was large (more than 1,000 students in the sample) or small (less than 1,000 students in the sample).
Considering the diversity of colleges in the study and the consistency of this finding, this suggests that the results would likely apply to similar colleges elsewhere. An important caveat is that all 10 colleges were in Ohio, which means they shared the same state policy context. To the extent that the state policy context may influence the effectiveness of the informational campaign, the results may not apply quite so broadly.
The last-dollar grant paired with the informational campaign increased summer enrollment at all colleges. But there is some hint that the interventions’ effectiveness varied across colleges. One college characteristic that was associated with larger-than-average effects was being a trailer college — that is, a college where summer was the last term in the financial aid year. The estimated effect on summer enrollment at trailer colleges was 13.7 percentage points, compared with 8.8 per-centage points at header colleges. One possible explanation is that the language used to describe
20 This project’s analysis plan included two exploratory subgroups that are not included here: (1) communication mode and (2) strength of control message. The first subgroup was intended if there was a clear divide among colleges where some used the planned emails, letters, and postcards, and others used an additional communication mode such as text messaging. Only a few colleges used a third mode, and that mode varied. The second subgroup was intended to examine whether the effectiveness of the intervention depended on what it was being compared with — that is, what messages the college was already sending to the control group. Upon examination, there was not much variation in control group messages. Due to the above, the research team never conducted these analyses.
21 Weiss, Bloom, and Brock (2014).22 That is, whether the financial year began in the summer (header) or fall (trailer) term.
How to Encourage College Summer Enrollment: Final Lessons from the EASE Project27
the last-dollar grant was simpler at trailer colleges; at header colleges, where the first term of finan-cial aid starts in the summer, messages had to reflect the difference in financial aid structure. The estimated effect of the last-dollar grant paired with the informational campaign was very similar at large colleges compared with small colleges. Again, given the diversity of colleges in the study and the universally positive effects, this suggests that the results will likely apply to similar colleges elsewhere, with the same caveat as above.
How Did Colleges Implement the Interventions?MDRC conducted qualitative research to understand how the informational campaigns and last-dollar grants were implemented, how students experienced the interventions, and the feasibil-ity of implementation. Implementation research after Phase I focused on the student experience, in order to refine the design of the informational campaigns for Phase II, when the strategies would be expanded to more colleges and to more students in Ohio. Implementation research after Phase II focused on understanding whether the study and interventions were implemented as designed. Below is a discussion of the key questions and findings. Colleges interested in detailed information on how to implement the messages and copies of the complete informational campaigns can see an earlier MDRC publication called the EASE Handbook for Community Colleges: Encouraging Addi-tional Summer Enrollment.23
� How did students experience the interventions?
Following Phase 1, the team called students in the three study groups to understand their ex-perience with the messaging and the last-dollar grant for the summer term. Three key findings emerged:
1 Students were more likely to remember the mailed letter. When asked if they received spe-cific communications about summer courses, many students indicated that they were selective about which emails they opened. Following Phase I, student interviewees were more likely to recall the mailed financial aid letter than the other messages. This may be because many colleges typically rely on email to communicate with students and mailed letters are uncom-mon. The introduction of a mailed letter and the fact that the letter was from the financial aid department — one that students feel is important — may have made them more likely to read or recall it.
2 Students were less likely to remember the postcard. Many student interviewees had no recollection of the postcards. This finding is noteworthy because in prior behavioral science studies, postcards helped to encourage action because recipients did not have to open an
23 Headlam, Cohen, and Reiman. (2020).
28How to Encourage College Summer Enrollment: Final Lessons from the EASE Project
envelope to receive the message. It may be that students didn’t recall the postcards because the postcards were perceived of as junk mail.
3 Some students thought they had to apply for the tuition Grant. The team found that many student interviewees who were offered the Summer Scholar Grant thought it was a mer-it-based scholarship that required an application or a minimum GPA. This was not the case: All students in the intervention group were offered the Grant and would have received it had they enrolled in summer courses.
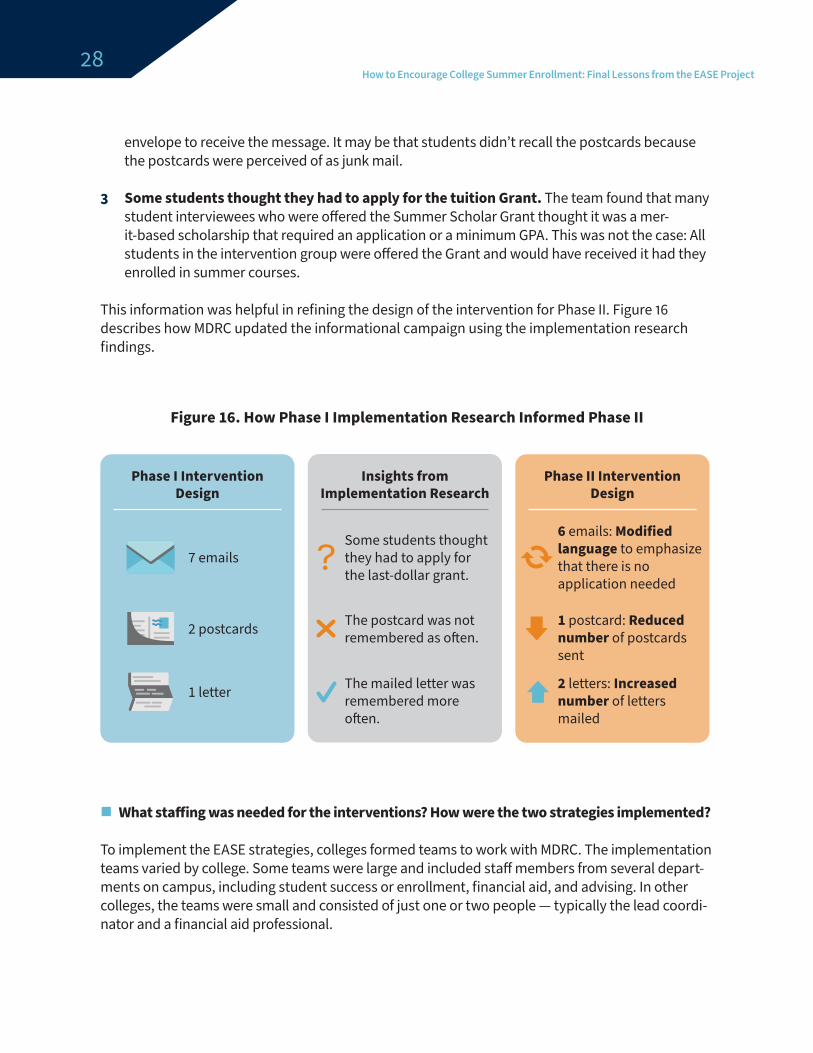
This information was helpful in refining the design of the intervention for Phase II. Figure 16 describes how MDRC updated the informational campaign using the implementation research findings.
� What staffing was needed for the interventions? How were the two strategies implemented?
To implement the EASE strategies, colleges formed teams to work with MDRC. The implementation teams varied by college. Some teams were large and included staff members from several depart-ments on campus, including student success or enrollment, financial aid, and advising. In other colleges, the teams were small and consisted of just one or two people — typically the lead coordi-nator and a financial aid professional.
Figure 16. How Phase I Implementation Research Informed Phase II
Phase I Intervention Design
Phase II Intervention Design
Insights from Implementation Research
7 emails
2 postcards
1 letter
6 emails: Modified language to emphasize that there is no application needed
1 postcard: Reduced number of postcards sent
2 letters: Increased number of letters mailed
The postcard was not remembered as o�en.
The mailed letter was remembered more o�en.
Some students thought they had to apply for the last-dollar grant.

How to Encourage College Summer Enrollment: Final Lessons from the EASE Project29
� Were colleges able to implement the informational campaigns as planned? What was easy to implement? What was challenging to implement?
The informational campaigns were implemented with medium to high fidelity to the original plan. Six out of 10 colleges sent all of the messages in the campaigns. The remaining four colleges did not send one or two of the messages. While the messages were designed to be customized, a few colleges made major changes to the content of one or two messages in the campaign.
The messages that did not include personalized information other than students’ names were the easiest to implement. The messages that included personalized Pell Grant estimates and summer course recommendations were the most difficult to implement. In particular, the message that provided students with specific course recommendations based on their majors and course-taking histories was the most difficult for colleges to execute. Only four colleges sent specific course rec-ommendations to students. Two of the remaining six colleges elected not to send this message and the other four colleges used alternate strategies to help students select summer courses. Three of these colleges grouped students by major and sent them a general list of courses that students in that major could take during the summer. One college recommended that students see an advisor for specific course recommendations. Providing specific course recommendations to students is a potentially powerful tool, and the implementation of this message highlighted that many colleges do not have the appropriate technology to provide personalized course information to students.
� Was sending the informational campaign really that different?
YES. The intervention messages were notably different from the colleges’ standard communica-tions in three main ways.
First, students in the two EASE intervention groups received many more messages about summer enrollment than students in the control group. Colleges typically sent two to three summer enroll-ment-related messages to the general student population. In contrast, colleges in the EASE study sent 7 to 10 messages related to summer enrollment to students in the intervention groups, in addition to any standard messaging.
Second, the content of the messages was different. Most of the colleges’ standard messages (ap-proximately two-thirds) focused on enrollment information such as registration opening, proce-dures, and deadlines, and most messages (about three-quarters) were solely informational — that is, they did not promote or encourage summer enrollment. Rather, the messages provided basic in-formation without conveying reasons students should enroll. When the colleges’ messages includ-ed behavioral principles, they typically were used for personalization or implementation prompts. The EASE messages, on the other hand, were not only informational but motivational. That is, they directly encouraged students to enroll in summer courses.
Finally, the colleges’ standard messages typically covered one area at a time — for example, regis-tration or financial aid — while the EASE messages combined registration and financial aid infor-mation. The study findings suggest that the content and the frequency of the EASE informational campaigns could have led to the positive impacts on summer enrollment.
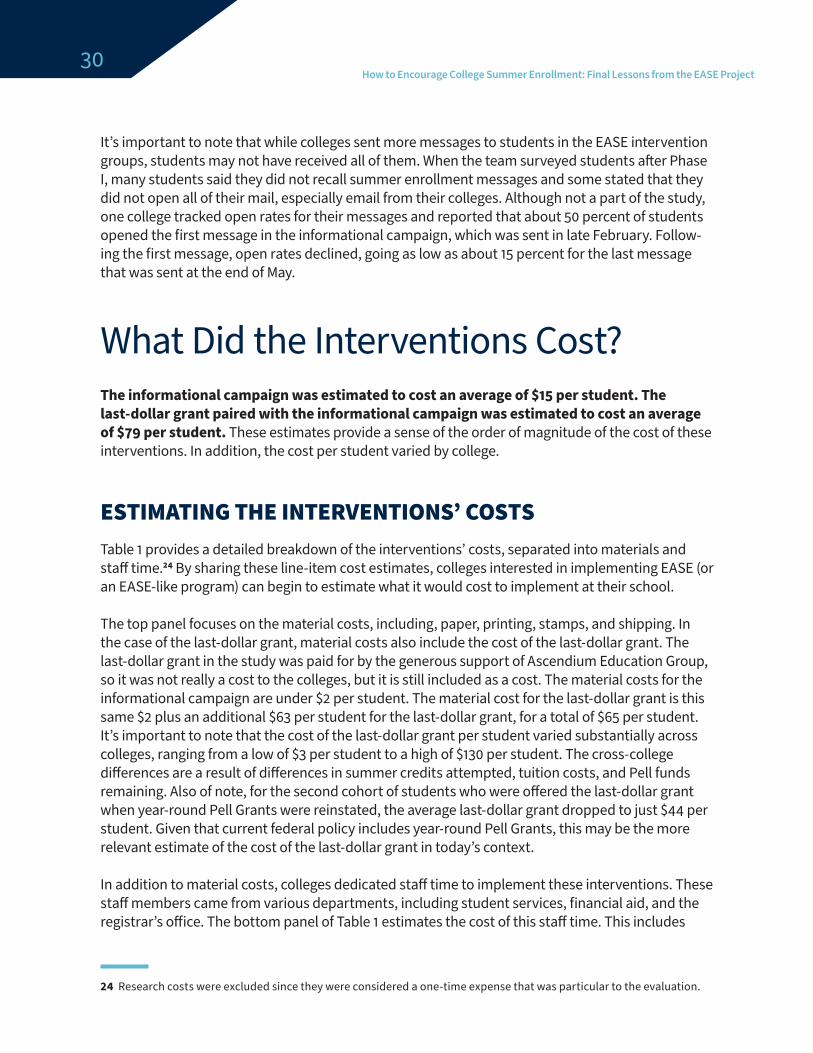
30How to Encourage College Summer Enrollment: Final Lessons from the EASE Project
It’s important to note that while colleges sent more messages to students in the EASE intervention groups, students may not have received all of them. When the team surveyed students after Phase I, many students said they did not recall summer enrollment messages and some stated that they did not open all of their mail, especially email from their colleges. Although not a part of the study, one college tracked open rates for their messages and reported that about 50 percent of students opened the first message in the informational campaign, which was sent in late February. Follow-ing the first message, open rates declined, going as low as about 15 percent for the last message that was sent at the end of May.
What Did the Interventions Cost?The informational campaign was estimated to cost an average of $15 per student. The last-dollar grant paired with the informational campaign was estimated to cost an average of $79 per student. These estimates provide a sense of the order of magnitude of the cost of these interventions. In addition, the cost per student varied by college.
ESTIMATING THE INTERVENTIONS’ COSTSTable 1 provides a detailed breakdown of the interventions’ costs, separated into materials and staff time.24 By sharing these line-item cost estimates, colleges interested in implementing EASE (or an EASE-like program) can begin to estimate what it would cost to implement at their school.
The top panel focuses on the material costs, including, paper, printing, stamps, and shipping. In the case of the last-dollar grant, material costs also include the cost of the last-dollar grant. The last-dollar grant in the study was paid for by the generous support of Ascendium Education Group, so it was not really a cost to the colleges, but it is still included as a cost. The material costs for the informational campaign are under $2 per student. The material cost for the last-dollar grant is this same $2 plus an additional $63 per student for the last-dollar grant, for a total of $65 per student. It’s important to note that the cost of the last-dollar grant per student varied substantially across colleges, ranging from a low of $3 per student to a high of $130 per student. The cross-college differences are a result of differences in summer credits attempted, tuition costs, and Pell funds remaining. Also of note, for the second cohort of students who were offered the last-dollar grant when year-round Pell Grants were reinstated, the average last-dollar grant dropped to just $44 per student. Given that current federal policy includes year-round Pell Grants, this may be the more relevant estimate of the cost of the last-dollar grant in today’s context.
In addition to material costs, colleges dedicated staff time to implement these interventions. These staff members came from various departments, including student services, financial aid, and the registrar’s office. The bottom panel of Table 1 estimates the cost of this staff time. This includes
24 Research costs were excluded since they were considered a one-time expense that was particular to the evaluation.
How to Encourage College Summer Enrollment: Final Lessons from the EASE Project31
Table 1. Costs of EASE Intervention – Full Sample
DIRECT COST OF MATERIALSCOST PER STUDENT
NUMBER OF STUDENTS
INFORMATIONAL CAMPAIGN
COST PER STUDENT
NUMBER OF STUDENTS
TUITION + INFO CAMPAIGN
Planning letter and/or postcard
Paper and printing $0.02 3,565 $71 $0.02 3,550 $71
Stamps $0.55 3,565 $1,961 $0.55 3,550 $1,953
Financial aid letter
Paper and printing $0.02 3,565 $71 $0.02 3,550 $71
Stamps $0.55 3,565 $1,961 $0.55 3,550 $1,953
Cost-benefit postcard
Paper and printing $0.10 3,565 $340 $0.10 3,550 $340
Shipping $0.03 3,565 $107 $0.03 3,550 $107
Stamps $0.55 3,565 $1,961 $0.55 3,550 $1,953
Email communications (10)
Last-dollar granta
Disbursements to students NA NA NA $63.00 3,550 $223,650
TOTAL COST OF MATERIALS $1.82 $6,472 $64.82 $230,096
(continued)

32How to Encourage College Summer Enrollment: Final Lessons from the EASE Project
STAFF COSTS
STAFF HOURLY
RATE
STAFF HOURS
FOR TASK
NUMBER OF COLLEGES
IMPLEMENTING ACROSS BOTH
PHASESINFORMATIONAL
CAMPAIGN
STAFF HOURLY
RATE
STAFF HOURS
FOR TASK
NUMBER OF COLLEGES
IMPLEMENTING ACROSS BOTH
PHASESTUITION + INFO
CAMPAIGN
Planning letter and/or postcard
Time to print, fold, and mail $41.40 6 14 $3,478 $41.40 6 14 $3,478
Financial aid letter
Time to merge Pell estimation in letter $41.40 6 14 $3,478 NA NA NA NA
Time to print, fold, and mail $41.40 8 14 $4,637 $41.40 8 14 $4,637
Cost-benefit postcard
Time to mail $41.40 2 14 $1,159 $41.40 2 14 $1,159
Email communications (10)
Time to send emails $41.40 20 14 $11,592 $41.40 20 14 $11,592
Time to merge Pell estimation into one email $41.40 4 14 $2,318 NA NA NA NA
Time to calculate course recs in email $41.40 8 14 $4,637 $41.40 8 14 $4,637
Last-dollar grant
Time to disburse the aid NA NA NA NA $41.40 20 14 $11,592
Overall staff coordination/management $41.40 24 14 $13,910 $41.40 24 14 $13,910
Total staff costs per campaign $45,209 $51,005
TOTAL STAFF COSTS PER STUDENT $12.68b $14.37b
TOTAL MATERIALS AND STAFF COSTS PER STUDENT $14.50 $79.18
NOTE: Staff hourly rate comes from the CBCSE Cost Tool Kit (2015) developed by the Center for Benefit-Cost Studies of Education, Teachers College, Columbia University. In Ohio the tool estimates an hourly rate of $28.10 with a benefit rate of 53.85 percent for “Academic advisor/counselor – Junior Colleges.” NA = $0 or not applicable. aThe last-dollar grant is included as a material cost. bThe total staff costs per student is the sum of the total staff costs for each campaign divided by the number of students in each intervention arm.
Table 1 (continued)

How to Encourage College Summer Enrollment: Final Lessons from the EASE Project33
time for printing, folding, and mailing letters; merging estimates of remaining Pell funds into the financial aid and email communications; and so on. In addition, staff costs incorporate time for overall coordination and management. The per-student cost associated with staff time was around $12 to $14 per student.
MDRC did not ask college staff members to keep detailed time logs tracking the hours spent im-plementing these interventions. Rather, the estimated staff hours for each task are an educated guess based on conversations with staff members, notes from interviews, and feedback from the staff regarding initial estimates. Colleges considering implementing these interventions may want to consider the hourly pay rates at their school and the estimated time they expect it will take to complete each task.
Also of note is the fact that the per-student costs of staff time varied across colleges, owing in part to the different size of each institution. Much of the staff time is fixed, so per-student costs de-creased as colleges served more students. In addition, colleges varied in terms of how they imple-mented the interventions. Some involved large numbers of staff and others used a streamlined process, resulting in differences in hours spent implementing the interventions. Finally, the team did not estimate the cost associated with additional credits that students attempted as a result of the interventions. If enough additional students enroll in summer, a college is likely to incur addi-tional costs, for example, to hire additional instructors.
How Much Additional Revenue Did the Interventions Generate for the College?The informational campaign generated an estimated $48 to $69 per student in additional reve-nue for the college. The last-dollar grant paired with the informational campaign generated an estimated $105 to $155 per student in additional revenue for the college. (See Appendix Table A.4.) Much like the costs, these estimates are not exact, and they vary across colleges, but they provide a sense of the order of magnitude of the revenue generated by these interventions. Moreover, these numbers suggest that the revenue generated by these interventions exceeded the cost to operate them.
EASE INTERVENTIONS INCREASE TUITION AND STATE REVENUE FOR COLLEGESBoth interventions increased the number of credits students attempted during their first summer after enrolling in college. The informational campaign caused an additional 0.35 credits attempted and the last-dollar grant paired with the informational campaign caused an additional 0.75 cred-its attempted. Across the 10 colleges in the study, tuition prices averaged approximately $143 per credit. Thus, the informational campaign’s boosting of credits attempted generated an additional
34How to Encourage College Summer Enrollment: Final Lessons from the EASE Project
$48 per student in tuition revenue for the college, or 0.35 x $143. The more costly intervention led to $105 per student in additional tuition revenue for the college, or 0.75 x $143.25
Tuition is only one source of additional revenue colleges may receive as a result of these interven-tions; colleges may also receive more state funding. Ohio’s state funding formula, for example, is performance-based: Colleges can receive additional revenue based on student academic out-comes, including outcomes that these interventions had an impact on, such as credit accumula-tion.26 The team estimates that Ohio’s state funding formula provides approximately $98 per credit earned. Thus, the informational campaign’s boosting of credits earned generated $22 per student in additional state funding, or 0.22 x $98. The more costly intervention led to $51 per student in additional state funding, or 0.52 x $98. These estimates are likely too small since they do not con-sider state funding associated with completing remedial classes, meeting credit benchmarks (that is, earning 12, 24, and 36 credits), degree and certificate attainment, or transfers. Effectively, the interventions were assumed to have no impact on those outcomes.27
A POSITIVE RETURN ON INVESTMENT FOR COLLEGESBoth interventions generated more revenue than their costs. The mission of most colleges is not to make money, and the sole goal of college programs or policies is not to see a positive return on investment. However, a program or policy that is beneficial to students, helps colleges fill seats and meet performance goals, and raises more revenue than it costs seems worthy of considera-tion. Figure 17 presents estimates of the revenue minus costs for each intervention. As shown, the informational campaign increased revenue by $34 or $55 per student (depending on whether state funding was included). The last-dollar grant paired with the informational campaign increased revenue by $27 or $76 per student (again, depending on whether state funding was included).
The positive return on investment has important implications for a college implementing these strategies. For example, at a school like Marion Technical Community College, which is a small college that served just over 200 Pell-eligible first-year students in summer 2017, the more costly intervention is estimated to generate $15,200 in additional revenue after accounting for cost, if offered to all eligible students (including state aid). At Sinclair Community College, which served around 1,500 Pell-eligible first-year students in summer 2018, the potential revenue is even larger — the more costly intervention is estimated to generate $114,000 in additional revenue after account-ing for cost, if offered to all eligible students (including state aid).28
25 Multiplication values are not exact, since tuition varied across colleges and estimated impacts were not the same among the colleges.
26 Performance funding in Ohio is zero-sum, meaning that the pot of dollars is fixed. Consequently, if all colleges im-prove their outcomes, it’s possible that no college would receive any additional money. This is not necessarily a limita-tion for the revenue estimates presented here because they are relative to the counterfactual, in which EASE is not implemented at the college. Thus, even if EASE is implemented and no additional state funding is received because other colleges improved outcomes at the same rate, the dollar amounts presented herein represent the funding that EASE prevented the institution from losing.
27 Here, too, multiplication values are not exact, since tuition varied across colleges and estimated impacts are not the same among the colleges.
28 These numbers are estimates and assume that the interventions’ effects at these colleges are equal to the overall
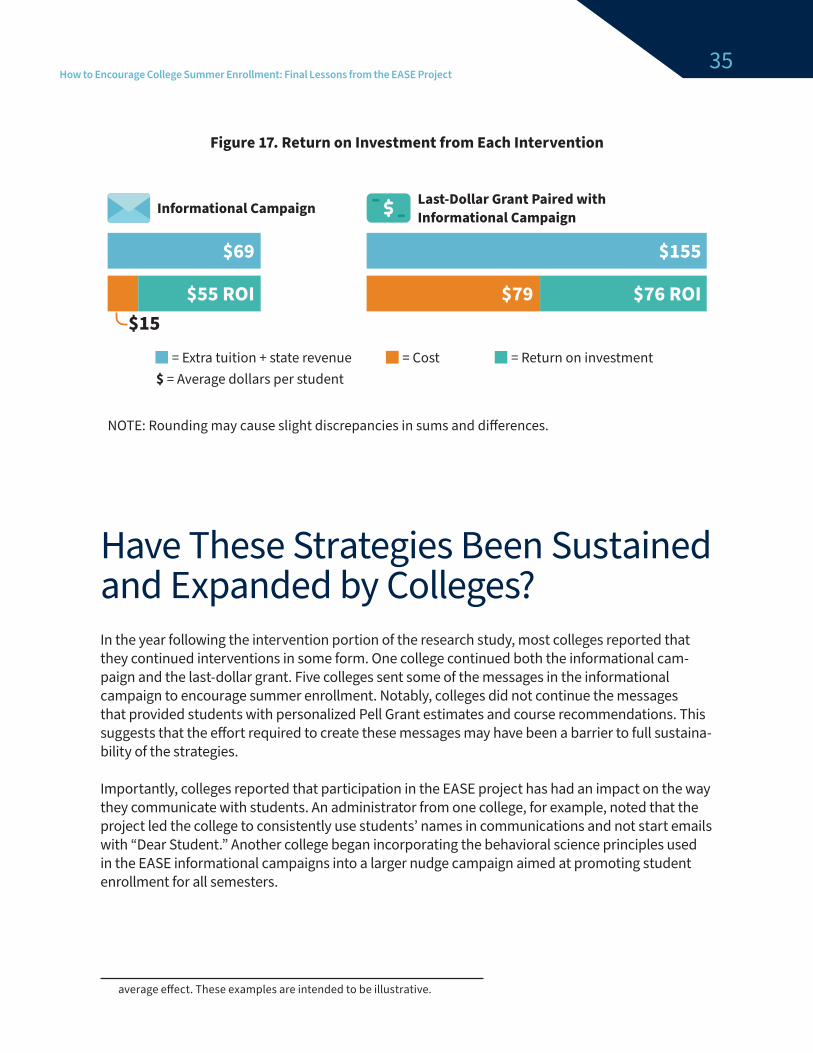
How to Encourage College Summer Enrollment: Final Lessons from the EASE Project35
Have These Strategies Been Sustained and Expanded by Colleges?In the year following the intervention portion of the research study, most colleges reported that they continued interventions in some form. One college continued both the informational cam-paign and the last-dollar grant. Five colleges sent some of the messages in the informational campaign to encourage summer enrollment. Notably, colleges did not continue the messages that provided students with personalized Pell Grant estimates and course recommendations. This suggests that the effort required to create these messages may have been a barrier to full sustaina-bility of the strategies.
Importantly, colleges reported that participation in the EASE project has had an impact on the way they communicate with students. An administrator from one college, for example, noted that the project led the college to consistently use students’ names in communications and not start emails with “Dear Student.” Another college began incorporating the behavioral science principles used in the EASE informational campaigns into a larger nudge campaign aimed at promoting student enrollment for all semesters.
average effect. These examples are intended to be illustrative.
Figure 17. Return on Investment from Each Intervention
$69
Informational Campaign Last-Dollar Grant Paired with Informational Campaign
$15
$155
$76 ROI$79$55 ROI
= Cost = Return on investment= Extra tuition + state revenue$ = Average dollars per student
NOTE: Rounding may cause slight discrepancies in sums and di�erences.
36How to Encourage College Summer Enrollment: Final Lessons from the EASE Project
Toward the end of the project, the Ohio Association of Community Colleges offered planning Grants to community colleges in the state to help them determine ways to institutionalize the EASE strategies into their annual operations to increase summer enrollment.
What Are the Project Implications?
BENEFITS FOR BOTH STUDENTS AND COLLEGESStudents made progress toward their goals by earning credits in the summer, received additional Pell funding by enrolling in summer courses, and in the case of the last-dollar grant, received schol-arship dollars. At the same time, colleges made progress in their goal of helping students achieve their academic pursuits, increased enrollment rates by filling seats during a term when enrollment rates are low, and increased revenue at a rate that exceeded the cost of the interventions. The interventions are cost-effective, have a positive return on investment, and are scalable. In these ways, these interventions are a win-win. The findings may contribute to larger initiatives taking place at individual institutions and inform higher education policy at the local, state, and national levels.
The informational campaign demonstrates that nudges worked to encourage more students to enroll in summer. The team has publicly released the full messaging content in the EASE Handbook for Community Colleges mentioned earlier. The main considerations for colleges may be staff time available to implement the messaging campaign and tuition-assistance Grant and a project man-ager to ensure the interventions are launched and implemented on time.
The last-dollar grant paired with the informational campaign was even more effective than the informational campaign alone, but it costs more. This is in line with what many would expect, but there are some nuances worth discussing. First, it’s encouraging to know that the total cost of the Grant was quite small, on average. Notably, many students with an EFC = 0 did not need the last-dollar grant because they were already fully covered by their Pell Grant. Interestingly, the last-dollar grant with informational campaign was still more effective than just the informational campaign for EFC = 0 students. This may be due to the simplicity of the message: “You are fully covered in summer!”
Both interventions increased the summer enrollment rate, and as a result, students earned more credits — a sign of improved academic outcomes. The effects on credit accumulation were modest in magnitude, as one might expect from light-touch, low-cost interventions. Thus, it is unlikely that these modest, short-term effects will lead to meaningful impacts on degree or certificate comple-tion (the follow-up is too short to say for sure). Without very large effects on summer enrollment rates, it seems unlikely that any intervention aimed solely at increasing summer enrollment rates will increase degree completion by more than a percentage point or two. The main effect of in-creasing summer enrollment is to help some students earn credits during the summer, credits that are the building blocks toward earning a degree. Nonetheless, as colleges develop new programs
How to Encourage College Summer Enrollment: Final Lessons from the EASE Project37
or implement reforms like guided pathways, incorporating EASE as one component in a broader program or a concrete component in a principled reform seems worthy of strong consideration.
MORE SIMPLIFICATION TO FINANCIAL AID DELIVERY IS NEEDEDPell Grants from the federal government help lower-income students pay for college by supple-menting the cost of tuition. However, the diagnosis of the barriers to summer enrollment conduct-ed in the EASE study showed that the availability of financial aid was not always easy to under-stand. Students who had aid available for summer through their Pell Grant didn’t always know that they had it. EASE messaging was designed to directly inform students of how much Pell they had for each level of enrollment — an example of using behavioral science to deliver simplified informa-tion about a federal policy.
The lessons from the EASE study could be applied to how colleges approach fall and spring aid as well. Many of the financial aid complexities examined were not specific to summer, even though that was the focus of the study. The Pell Grant calculator tool MDRC developed in collaboration with the Ohio colleges could be utilized all year to help students understand how different enroll-ment choices might impact their funding amounts. In analyses of administrative financial aid data, the team simulated how different scenarios might play out for students. For example, a student choosing to enroll in 9 or 11 credits for a semester would receive the same Pell dollar amount be-cause both of those credit levels are considered “three-quarter time,” even though the tuition and other costs are different. Taking a user-centered approach to the entire financial aid system within a college may be a useful exercise.
ELEVATING THE STUDENT PERSPECTIVE IN INTERVENTION DESIGNThe team’s diagnosis showed that students face multiple barriers to summer enrollment — from inadequate information about available financial aid and course options to a lack of childcare and financial resources. This project aimed to find solutions based on the students’ own experiences and used a specific approach to problem-solving that focused on collecting information from stu-dents and colleges. This approach could be applied to a wide range of challenges that colleges and state agencies hope to address. It keeps the student perspective at the center of the process and may lead to new solutions for entrenched problems.
38How to Encourage College Summer Enrollment: Final Lessons from the EASE Project
Supplementary Tables and Figures
Appendix A

How to Encourage College Summer Enrollment: Final Lessons from the EASE Project39
ADJUSTED MEAN INFO CAMPAIGN VS. CONTROL INFO CAMPAIGN + TUITION VS. CONTROL
OUTCOMEINFO + TUITION
GROUPINFO
GROUPCONTROL
GROUP DIFFERENCE SE P-VALUE DIFFERENCE SE P-VALUE
First summerEnrolled in any course (%) 38.4 31.5 26.2 5.3 1.1 0.000 12.2 1.1 0.000Passed a course or more (%) 31.9 25.8 21.9 3.9 1.0 0.000 10.0 1.0 0.000Credits attempted
College-level 2.15 1.78 1.49 0.29 0.08 0.000 0.66 0.08 0.000Developmental 0.31 0.27 0.22 0.05 0.03 0.031 0.09 0.03 0.001Total 2.45 2.05 1.70 0.35 0.08 0.000 0.75 0.08 0.000
Credits earnedCollege-level 1.63 1.36 1.17 0.19 0.07 0.003 0.47 0.07 0.000Developmental 0.19 0.17 0.14 0.03 0.02 0.132 0.05 0.02 0.010Total 1.83 1.53 1.31 0.22 0.07 0.001 0.52 0.07 0.000
Degree earned (%)Certificate 1.1 0.8 0.7 0.1 0.2 0.713 0.5 0.2 0.039Associate's 0.2 0.2 0.2 0.0 0.1 0.828 0.0 0.1 0.970
First fallEnrolled in any course (%) 55.4 54.8 54.7 0.0 1.2 0.996 0.7 1.2 0.568Credits attempted
College-level 5.14 5.06 5.10 -0.04 0.12 0.762 0.05 0.12 0.706Developmental 0.51 0.53 0.48 0.04 0.03 0.225 0.02 0.03 0.499Total 5.65 5.59 5.58 0.00 0.13 0.977 0.07 0.13 0.591
Credits earnedCollege-level 3.87 3.88 3.92 -0.04 0.11 0.750 -0.05 0.11 0.637Developmental 0.30 0.29 0.27 0.02 0.03 0.450 0.03 0.03 0.210Total 4.17 4.17 4.19 -0.02 0.12 0.884 -0.02 0.12 0.852
Cumulative credits earnedCollege-level 5.49 5.23 5.07 0.16 0.15 0.293 0.42 0.15 0.006Developmental 0.49 0.45 0.41 0.05 0.03 0.162 0.08 0.03 0.018Total 5.97 5.68 5.48 0.21 0.16 0.187 0.50 0.16 0.001
(continued)
Appendix Table A.1. EASE Enrollment, Credit, and Degree Outcomes for Full Sample
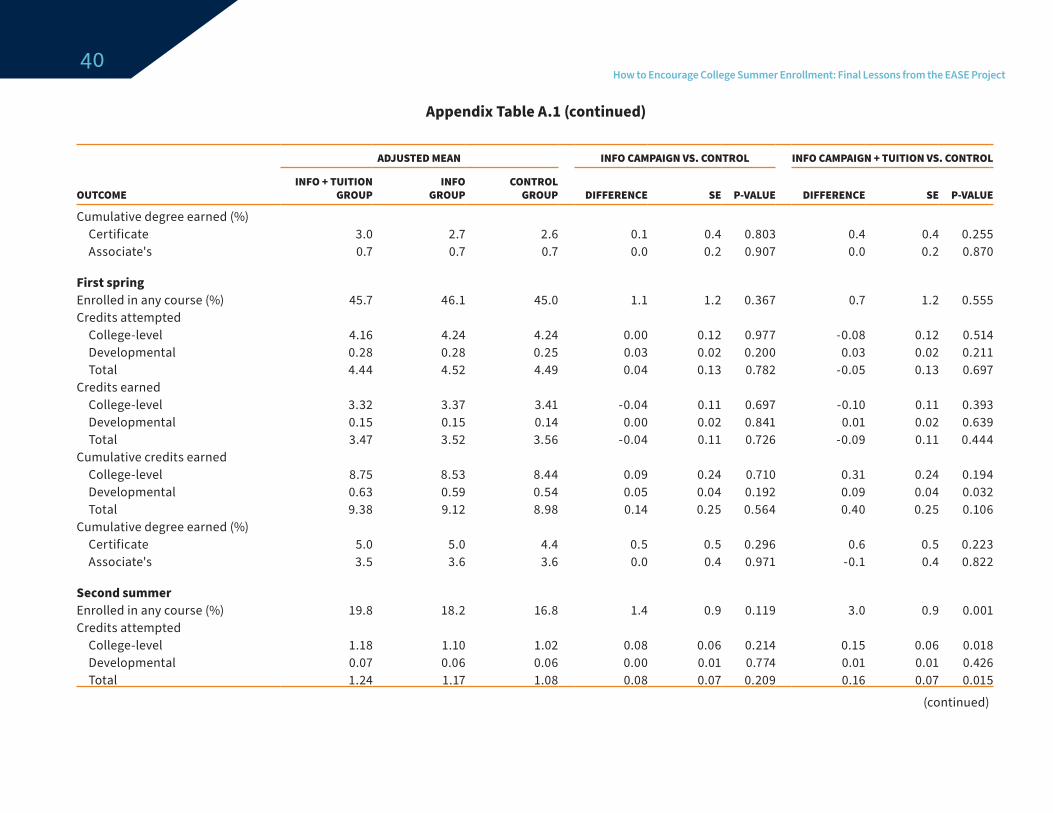
40How to Encourage College Summer Enrollment: Final Lessons from the EASE Project
ADJUSTED MEAN INFO CAMPAIGN VS. CONTROL INFO CAMPAIGN + TUITION VS. CONTROL
OUTCOMEINFO + TUITION
GROUPINFO
GROUPCONTROL
GROUP DIFFERENCE SE P-VALUE DIFFERENCE SE P-VALUE
Cumulative degree earned (%)Certificate 3.0 2.7 2.6 0.1 0.4 0.803 0.4 0.4 0.255Associate's 0.7 0.7 0.7 0.0 0.2 0.907 0.0 0.2 0.870
First springEnrolled in any course (%) 45.7 46.1 45.0 1.1 1.2 0.367 0.7 1.2 0.555Credits attempted
College-level 4.16 4.24 4.24 0.00 0.12 0.977 -0.08 0.12 0.514Developmental 0.28 0.28 0.25 0.03 0.02 0.200 0.03 0.02 0.211Total 4.44 4.52 4.49 0.04 0.13 0.782 -0.05 0.13 0.697
Credits earnedCollege-level 3.32 3.37 3.41 -0.04 0.11 0.697 -0.10 0.11 0.393Developmental 0.15 0.15 0.14 0.00 0.02 0.841 0.01 0.02 0.639Total 3.47 3.52 3.56 -0.04 0.11 0.726 -0.09 0.11 0.444
Cumulative credits earnedCollege-level 8.75 8.53 8.44 0.09 0.24 0.710 0.31 0.24 0.194Developmental 0.63 0.59 0.54 0.05 0.04 0.192 0.09 0.04 0.032Total 9.38 9.12 8.98 0.14 0.25 0.564 0.40 0.25 0.106
Cumulative degree earned (%)Certificate 5.0 5.0 4.4 0.5 0.5 0.296 0.6 0.5 0.223Associate's 3.5 3.6 3.6 0.0 0.4 0.971 -0.1 0.4 0.822
Second summerEnrolled in any course (%) 19.8 18.2 16.8 1.4 0.9 0.119 3.0 0.9 0.001Credits attempted
College-level 1.18 1.10 1.02 0.08 0.06 0.214 0.15 0.06 0.018Developmental 0.07 0.06 0.06 0.00 0.01 0.774 0.01 0.01 0.426Total 1.24 1.17 1.08 0.08 0.07 0.209 0.16 0.07 0.015
(continued)
Appendix Table A.1 (continued)

How to Encourage College Summer Enrollment: Final Lessons from the EASE Project41
ADJUSTED MEAN INFO CAMPAIGN VS. CONTROL INFO CAMPAIGN + TUITION VS. CONTROL
OUTCOMEINFO + TUITION
GROUPINFO
GROUPCONTROL
GROUP DIFFERENCE SE P-VALUE DIFFERENCE SE P-VALUE
Credits earnedCollege-level 0.93 0.90 0.83 0.07 0.06 0.225 0.10 0.06 0.081Developmental 0.04 0.04 0.03 0.01 0.01 0.246 0.01 0.01 0.258Total 0.97 0.94 0.86 0.08 0.06 0.173 0.11 0.06 0.060
Cumulative credits earnedCollege-level 9.65 9.39 9.24 0.15 0.27 0.578 0.41 0.27 0.131Developmental 0.67 0.63 0.57 0.06 0.04 0.124 0.10 0.04 0.018Total 10.31 10.02 9.81 0.21 0.28 0.438 0.51 0.28 0.067
Cumulative degree earned (%)Certificate 5.6 5.5 5.0 0.6 0.5 0.294 0.6 0.5 0.270Associate's 4.3 4.5 4.6 -0.1 0.5 0.891 -0.3 0.5 0.580
Summer terms onlyCumulative credits attempted
College-level 3.32 2.88 2.51 0.37 0.11 0.001 0.81 0.11 0.000Developmental 0.38 0.34 0.28 0.06 0.03 0.040 0.10 0.03 0.001Total 3.70 3.22 2.79 0.43 0.12 0.000 0.91 0.12 0.000
Cumulative credits earnedCollege-level 2.56 2.26 1.99 0.26 0.10 0.007 0.57 0.10 0.000Developmental 0.23 0.21 0.17 0.04 0.02 0.068 0.06 0.02 0.005Total 2.79 2.47 2.16 0.30 0.10 0.003 0.63 0.10 0.000
Sample size (total = 10,668) 3,550 3,565 3,553
SOURCE: MDRC calculations from transcript data provided by program sites.
NOTES: Rounding may cause slight discrepancies in sums and differences. Estimates are adjusted by random assignment block, gender, dependency status, race, age, and Expected Family Contribution (EFC). The statistics above exclude the 145 Cohort 2 students at Marion Technical College who were removed from the study due to an error in messaging. No bachelor’s degrees were conferred during the follow-up period.
Appendix Table A.1 (continued)
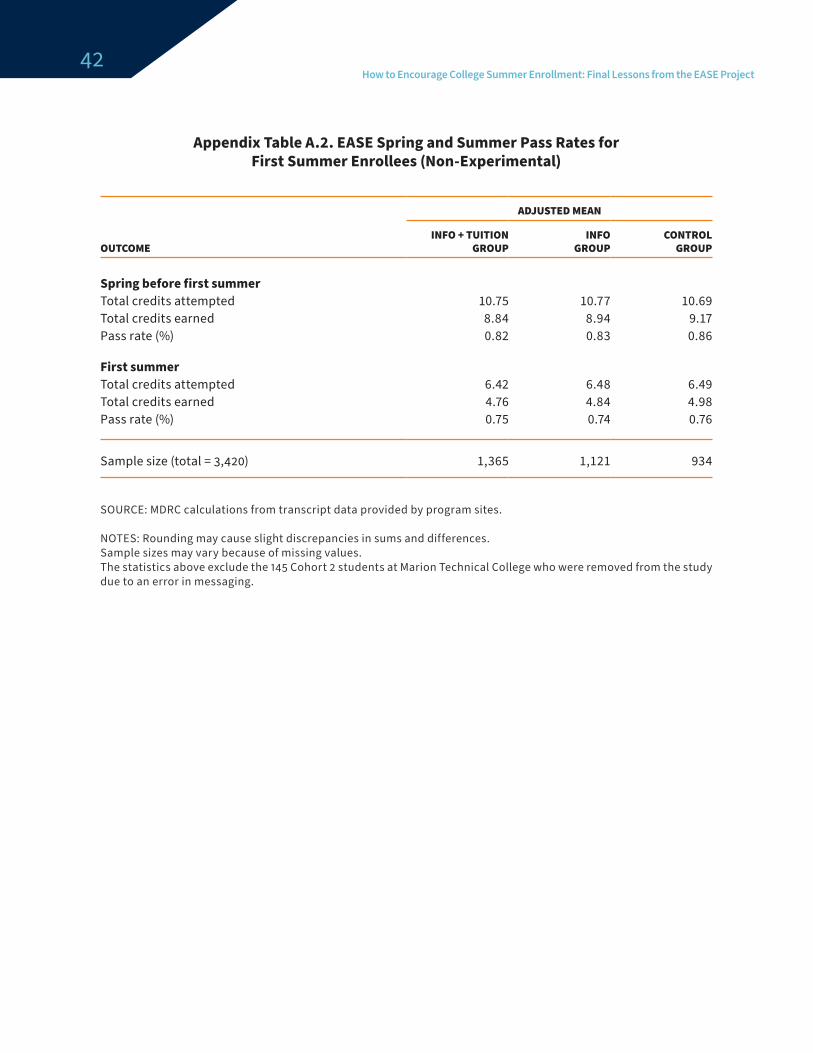
42How to Encourage College Summer Enrollment: Final Lessons from the EASE Project
Appendix Table A.2. EASE Spring and Summer Pass Rates for First Summer Enrollees (Non-Experimental)
ADJUSTED MEAN
OUTCOMEINFO + TUITION
GROUPINFO
GROUPCONTROL
GROUP
Spring before first summerTotal credits attempted 10.75 10.77 10.69Total credits earned 8.84 8.94 9.17Pass rate (%) 0.82 0.83 0.86
First summerTotal credits attempted 6.42 6.48 6.49Total credits earned 4.76 4.84 4.98Pass rate (%) 0.75 0.74 0.76
Sample size (total = 3,420) 1,365 1,121 934
SOURCE: MDRC calculations from transcript data provided by program sites.
NOTES: Rounding may cause slight discrepancies in sums and differences.Sample sizes may vary because of missing values.The statistics above exclude the 145 Cohort 2 students at Marion Technical College who were removed from the study due to an error in messaging.
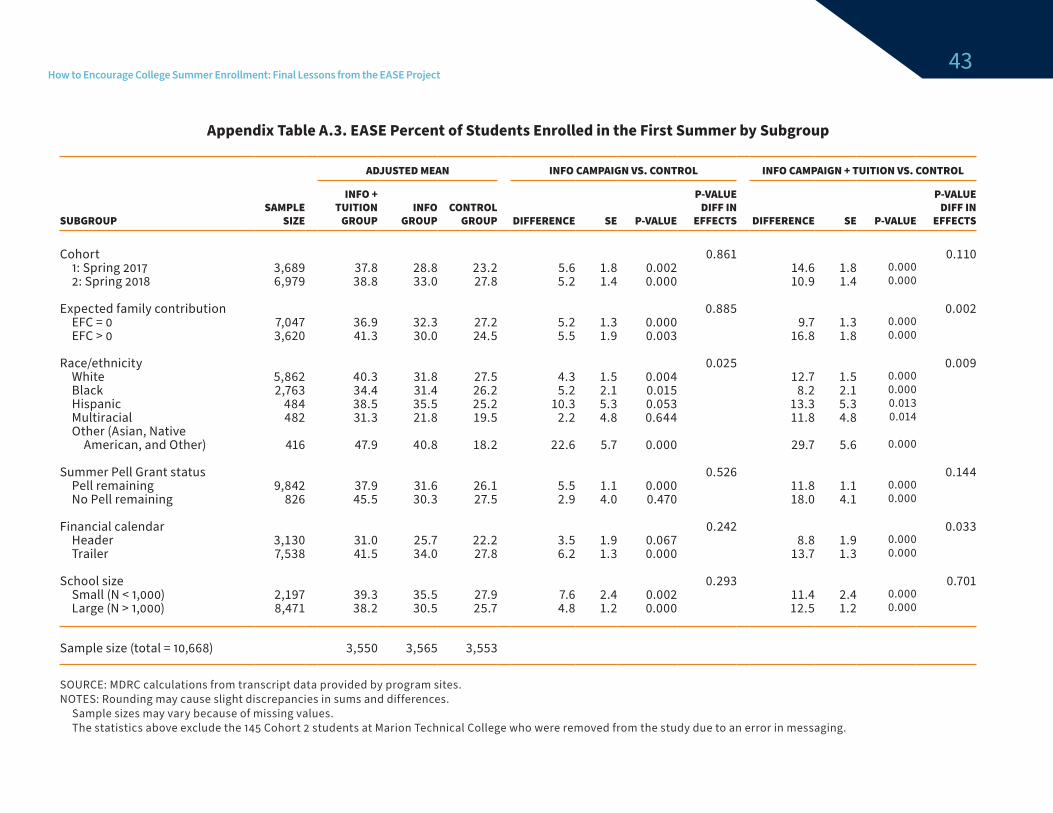
How to Encourage College Summer Enrollment: Final Lessons from the EASE Project43
Appendix Table A.3. EASE Percent of Students Enrolled in the First Summer by Subgroup
ADJUSTED MEAN INFO CAMPAIGN VS. CONTROL INFO CAMPAIGN + TUITION VS. CONTROL
SUBGROUPSAMPLE
SIZE
INFO + TUITION
GROUPINFO
GROUPCONTROL
GROUP DIFFERENCE SE P-VALUE
P-VALUE DIFF IN
EFFECTS DIFFERENCE SE P-VALUE
P-VALUE DIFF IN
EFFECTS
Cohort 0.861 0.1101: Spring 2017 3,689 37.8 28.8 23.2 5.6 1.8 0.002 14.6 1.8 0.0002: Spring 2018 6,979 38.8 33.0 27.8 5.2 1.4 0.000 10.9 1.4 0.000
Expected family contribution 0.885 0.002EFC = 0 7,047 36.9 32.3 27.2 5.2 1.3 0.000 9.7 1.3 0.000EFC > 0 3,620 41.3 30.0 24.5 5.5 1.9 0.003 16.8 1.8 0.000
Race/ethnicity 0.025 0.009White 5,862 40.3 31.8 27.5 4.3 1.5 0.004 12.7 1.5 0.000Black 2,763 34.4 31.4 26.2 5.2 2.1 0.015 8.2 2.1 0.000Hispanic 484 38.5 35.5 25.2 10.3 5.3 0.053 13.3 5.3 0.013Multiracial 482 31.3 21.8 19.5 2.2 4.8 0.644 11.8 4.8 0.014Other (Asian, Native
American, and Other) 416 47.9 40.8 18.2 22.6 5.7 0.000 29.7 5.6 0.000
Summer Pell Grant status 0.526 0.144Pell remaining 9,842 37.9 31.6 26.1 5.5 1.1 0.000 11.8 1.1 0.000No Pell remaining 826 45.5 30.3 27.5 2.9 4.0 0.470 18.0 4.1 0.000
Financial calendar 0.242 0.033Header 3,130 31.0 25.7 22.2 3.5 1.9 0.067 8.8 1.9 0.000Trailer 7,538 41.5 34.0 27.8 6.2 1.3 0.000 13.7 1.3 0.000
School size 0.293 0.701Small (N < 1,000) 2,197 39.3 35.5 27.9 7.6 2.4 0.002 11.4 2.4 0.000Large (N > 1,000) 8,471 38.2 30.5 25.7 4.8 1.2 0.000 12.5 1.2 0.000
Sample size (total = 10,668) 3,550 3,565 3,553
SOURCE: MDRC calculations from transcript data provided by program sites.NOTES: Rounding may cause slight discrepancies in sums and differences. Sample sizes may vary because of missing values. The statistics above exclude the 145 Cohort 2 students at Marion Technical College who were removed from the study due to an error in messaging.

44How to Encourage College Summer Enrollment: Final Lessons from the EASE Project
Appendix Table A.4. Outcomes and Simplified ROI in the First Summer for Full Sample
ADJUSTED MEANINFO CAMPAIGN
VS. CONTROLINFO CAMPAIGN + TUITION
VS. CONTROL
INFO + TUITION GROUP
INFO GROUP
CONTROL GROUP DIFFERENCE SE P-VALUE DIFFERENCE SE P-VALUE
Intervention outcomesEnrollment (%) 38.4 31.5 26.2 5.3 1.1 0.000 12.2 1.1 0.000Credits attempted 2.45 2.05 1.70 0.35 0.08 0.000 0.75 0.08 0.000Credits earned 1.83 1.53 1.31 0.22 0.07 0.001 0.52 0.07 0.000Pell disbursed ($) 388 354 289 65 15 0.000 99 15 0.000
Revenue ($)Tuition revenue per student 344 287 239 48 11 0.000 105 11 0.000State revenue per student 174 146 125 21 7 0.002 49 7 0.000Total revenue 518 433 363 69 17 0.000 155 18 0.000
Cost ($)Summer Scholar Grant 63 0 0 0 3 0.990 62 3 0.000Cost of material goods 16 15 0 15 0 0.000 16 0 0.000Total cost 79 15 0 15 3 0.000 79 3 0.000
Revenue minus cost ($)Lower bound (excluding state) 265 272 239 34 11 0.002 27 11 0.017Higher bound (including state) 439 418 363 55 17 0.001 76 17 0.000
SOURCE: Revenue information was collected in 2018 using college websites and correspondence. These numbers were used for both cohorts, assuming costs did not change greatly from year to year. The numbers are not comprehensive. The following revenue sources are excluded: class-based fees (such as labs and online courses); nonrequired fees (such as late fees); out-of-county surcharges for Lakeland, Rio Grande, and Sinclair. Semesterly fees are excluded from revenue calcu-lations; sensitivity tests showed these improved the revenue to schools by $1-$2 per student.
NOTE: Rounding may cause slight discrepancies in sums and differences.

How to Encourage College Summer Enrollment: Final Lessons from the EASE Project45
Appendix Figure A.1. Sustained Effects on Credits Earned
0.220.21
-0.4
-0.2
0.0
0.2
0.4
0.6
0.8
1.0
Baseline Summer 1 Fall 1 Spring 1 Summer 2
Est. E�ect + 90% Confidence Interval
0.520.51
0.0
0.2
0.4
0.6
0.8
1.0
Baseline Summer 1 Fall 1 Spring 1 Summer 2
Est. E�ect + 90% Confidence Interval
Informational Campaign
Last-Dollar Grant Paired with Informational Campaign
SOURCE: MDRC calculations from transcript data provided by program sites.

46How to Encourage College Summer Enrollment: Final Lessons from the EASE Project
Attewell, Paul, Scott Heil, and Liza Reisel. 2012. “What Is Academic Momentum? And Does It Mat-ter?” Educational Evaluation & Policy Analysis 34, 1: 27-44.
Buehler, Roger, Dale Griffin, and Michael Ross. 1994. “Exploring the “Planning Fallacy”: Why Peo-ple Underestimate Their Task Completion Times.” Journal of Personality & Social Psychology 67, 3: 366-381.
Community College Research Center. 2020. “Community College FAQs.” Website: https://ccrc.tc.columbia.edu/Community-College-FAQs.html.
Fehr, Ernst, and Klaus M. Schmidt. 2006. “The Economics of Fairness, Reciprocity, and Altruism – Experimental Evidence and New Theories.” Pages 615-691 in Serge-Christophe Kolm and Jean Mercier Ythier (eds.), Handbook of the Economics of Giving, Altruism, and Reciprocity. Amster-dam: North-Holland.
Headlam, Camielle, Caitlin Anzelone, and Michael J. Weiss. 2018. Making Summer Pay Off: Using Behavioral Science to Encourage Postsecondary Summer Enrollment. New York: MDRC.
Headlam, Camielle, Benjamin Cohen, and Kayla Reiman. 2020. EASE Handbook for Community Colleges: Encouraging Additional Summer Enrollment. New York: MDRC.
Juszkiewicz, Jolanta. 2017. Trends in Community College Enrollment and Completion Data, 2017. Washington, DC: American Association of Community Colleges.
Liu, Vivian Yuen Ting. 2016. Goodbye to Summer Vacation? The Effects of Summer Enrollment on College and Employment Outcomes. A CAPSEE Working Paper. New York: Center for Postsec-ondary Education and Employment.
MacCoun, Robert 2012. “The Burden of Social Proof: Shared Thresholds and Social Influence.” Psychological Review 119, 2: 28.
Rogers, Todd, Katherine L. Milkman, John K. Leslie, and Michael Norton. 2013. “Beyond Good Intentions: Prompting People to Make Plans Improves Follow-Through on Important Tasks.” Behavioral Science and Policy 1, 2: 33-41.
Thaler, Richard. 2018. “From Cashews to Nudges: The Evolution of Behavioral Economics.” Ameri-can Economic Review 108, 6: 1,265-1,287.
Weiss, Michael, Howard Bloom, and Thomas Brock. 2014. “A Conceptual Framework for Studying the Sources of Variation in Program Effects.” Journal of Policy Analysis and Management 33, 3: 778-808.
References

About MDRCMDRC is a nonprofit, nonpartisan social and education policy research organization dedicated to learning what works to improve the well-being of low-income people. Through its research and the active communication of its findings, MDRC seeks to enhance the effectiveness of social and education policies and programs.
Founded in 1974 and located in New York; Oakland, California; Washington, DC; and Los Ange-les, MDRC is best known for mounting rigorous, large-scale, real-world tests of new and exist-ing policies and programs. Its projects are a mix of demonstrations (field tests of promising new program approaches) and evaluations of ongoing government and community initiatives. MDRC’s staff members bring an unusual combination of research and organizational experience to their work, providing expertise on the latest in qualitative and quantitative methods and on program design, development, implementation, and management. MDRC seeks to learn not just whether a program is effective but also how and why the program’s effects occur. In addition, it tries to place each project’s findings in the broader context of related research — in order to build knowledge about what works across the social and education policy fields. MDRC’s findings, lessons, and best practices are shared with a broad audience in the policy and practitioner community as well as with the general public and the media.
Over the years, MDRC has brought its unique approach to an ever-growing range of policy areas and target populations. Once known primarily for evaluations of state welfare-to-work programs, today MDRC is also studying public school reforms, employment programs for ex-prisoners, and programs to help low-income students succeed in college. MDRC’s projects are organized into five areas:
� Promoting Family Well-Being and Children’s Development
� Improving Public Education
� Raising Academic Achievement and Persistence in College
� Supporting Low-Wage Workers and Communities
� Overcoming Barriers to Employment
Working in almost every state, all of the nation’s largest cities, and Canada and the United Kingdom, MDRC conducts its projects in partnership with national, state, and local govern-ments, public school systems, community organizations, and numerous private philanthropies.

New York 200 Vesey Street, 23rd Floor, New York, NY 10281, Tel: 212 532 3200 Oakland 475 14th Street, Suite 750, Oakland, CA 94612, Tel: 510 663 6372 Washington, DC 750 17th Street, NW, Suite 501, Washington, DC 20006 Los Angeles 11965 Venice Boulevard, Suite 402, Los Angeles, CA 90066 www.mdrc.org