Embed Size (px)
Citation preview
Unit 7: Introduction to Storm SurgeFEMA L311 Course
National Hurricane Conference Orlando, Florida26 March 2012
Robbie BergHurricane Specialist
Jamie RhomeStorm Surge Team Lead

Hurricane Katrina (2005) – Mississippi1200 deaths, $108 billion damage
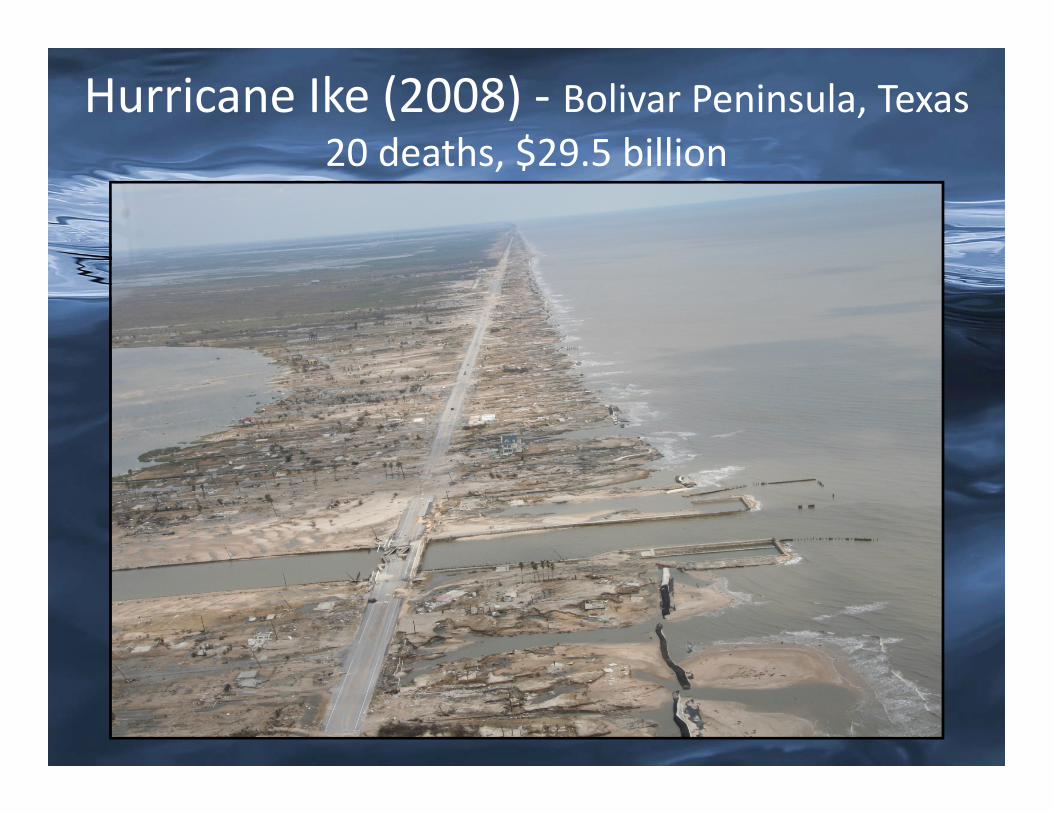
Hurricane Ike (2008) ‐ Bolivar Peninsula, Texas20 deaths, $29.5 billion
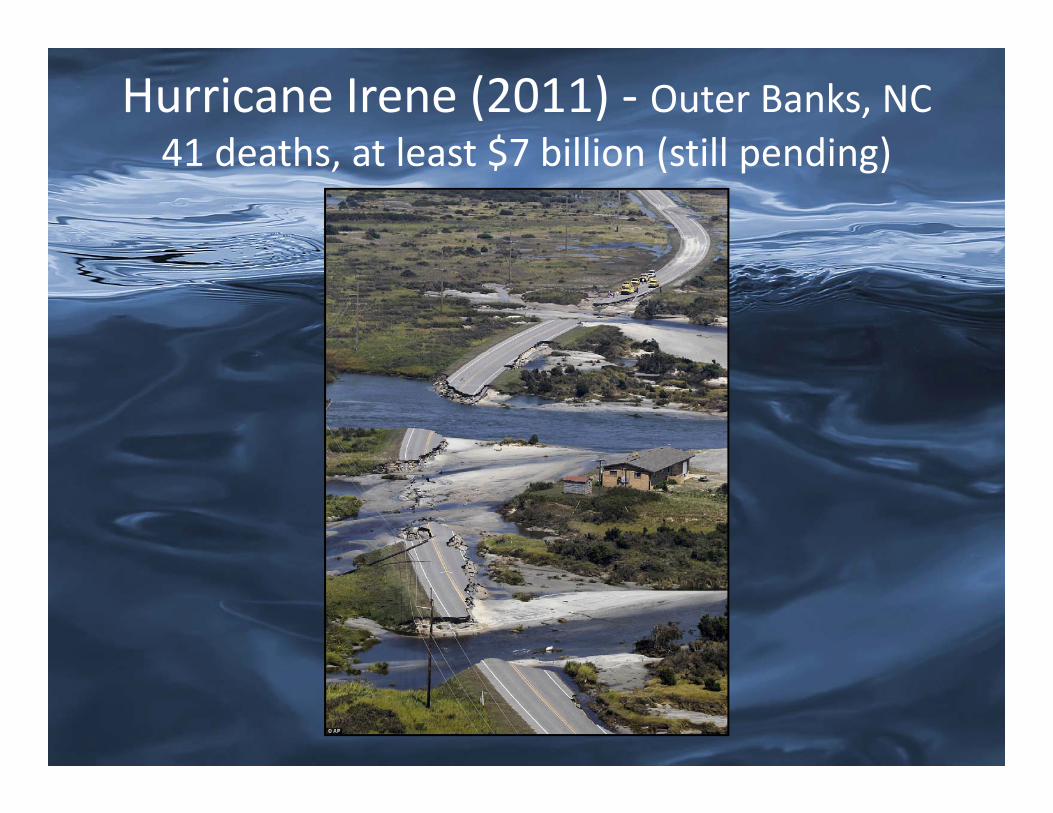
Hurricane Irene (2011) ‐ Outer Banks, NC41 deaths, at least $7 billion (still pending)
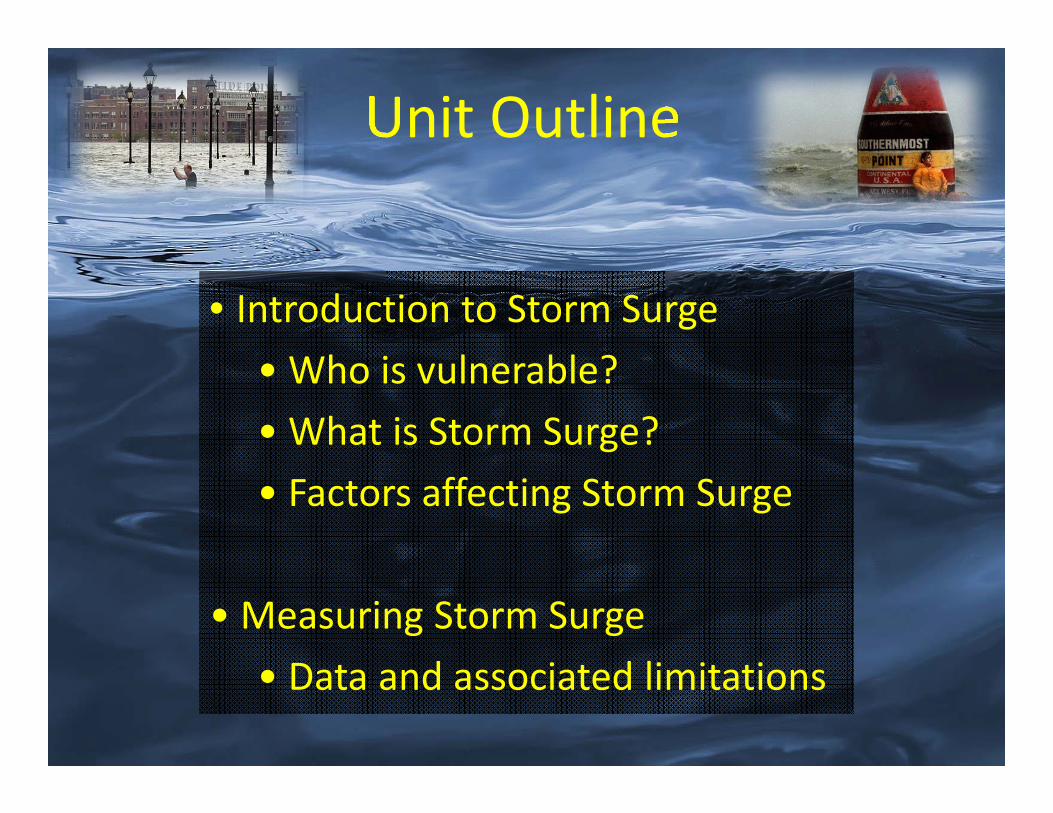
• Introduction to Storm Surge• Who is vulnerable?• What is Storm Surge?• Factors affecting Storm Surge
• Measuring Storm Surge• Data and associated limitations
Unit Outline
Why is Surge an Important Issue?
6
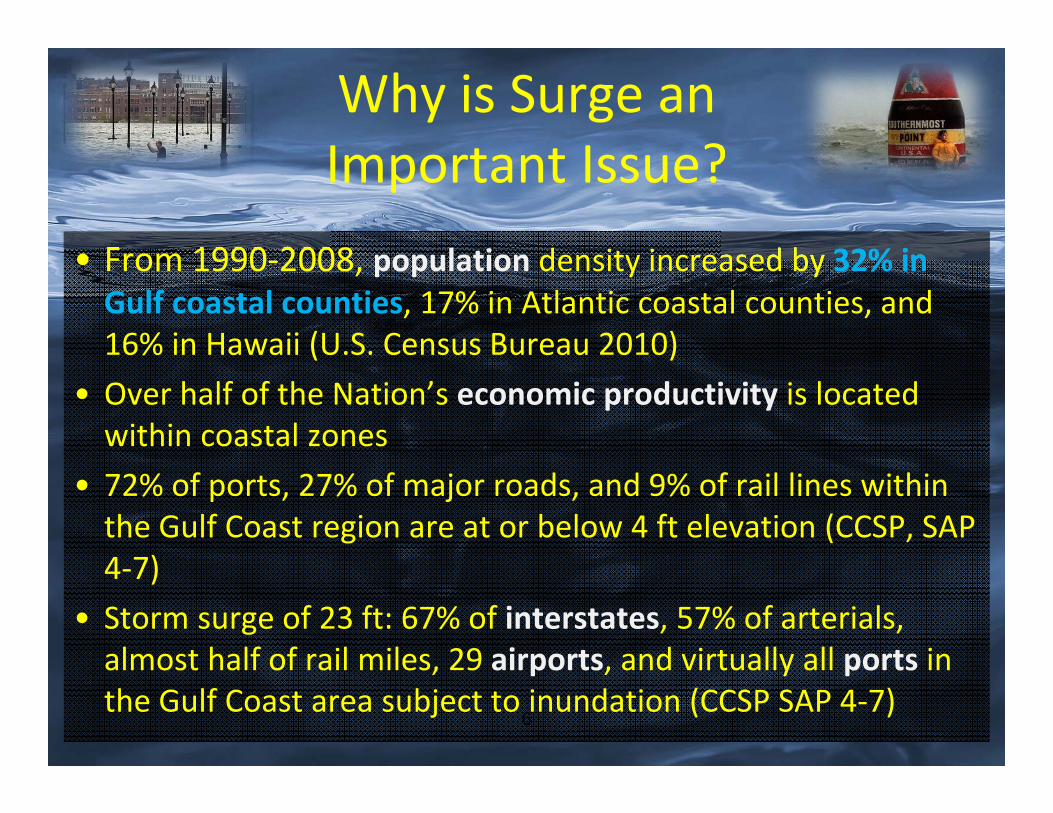
• From 1990‐2008, population density increased by 32% in Gulf coastal counties, 17% in Atlantic coastal counties, and 16% in Hawaii (U.S. Census Bureau 2010)
• Over half of the Nation’s economic productivity is located within coastal zones
• 72% of ports, 27% of major roads, and 9% of rail lines within the Gulf Coast region are at or below 4 ft elevation (CCSP, SAP 4‐7)
• Storm surge of 23 ft: 67% of interstates, 57% of arterials, almost half of rail miles, 29 airports, and virtually all ports in the Gulf Coast area subject to inundation (CCSP SAP 4‐7)
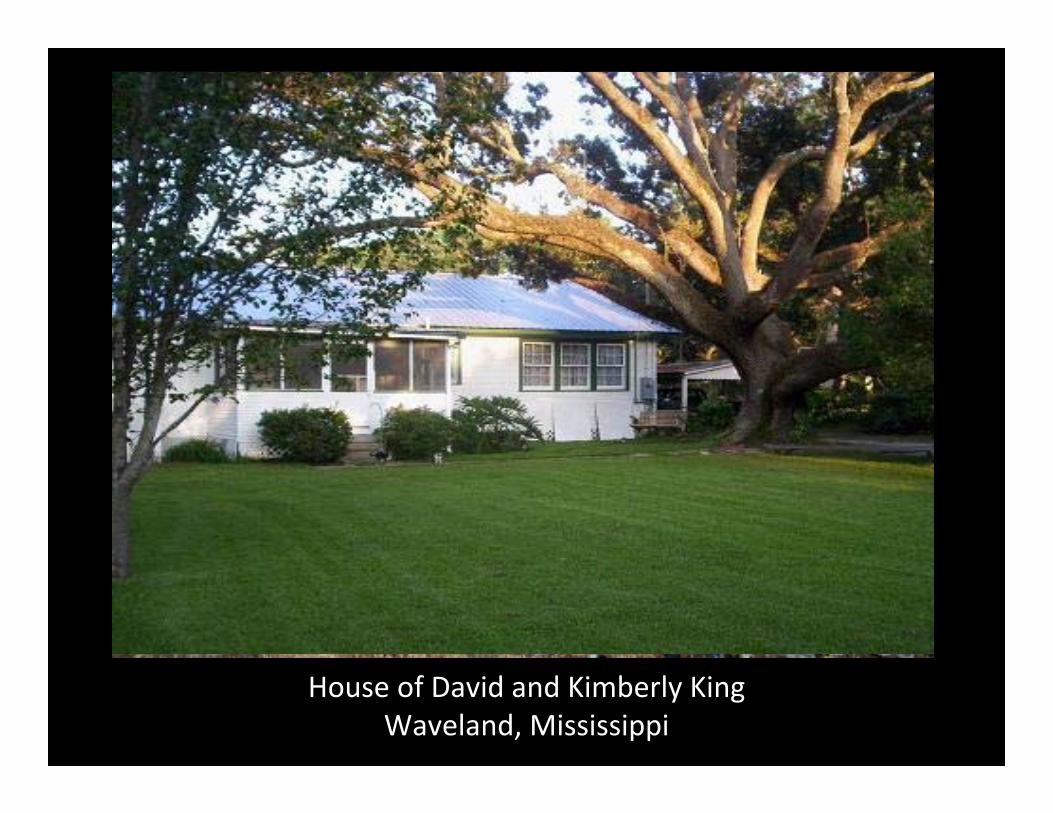
House of David and Kimberly KingWaveland, Mississippi
10
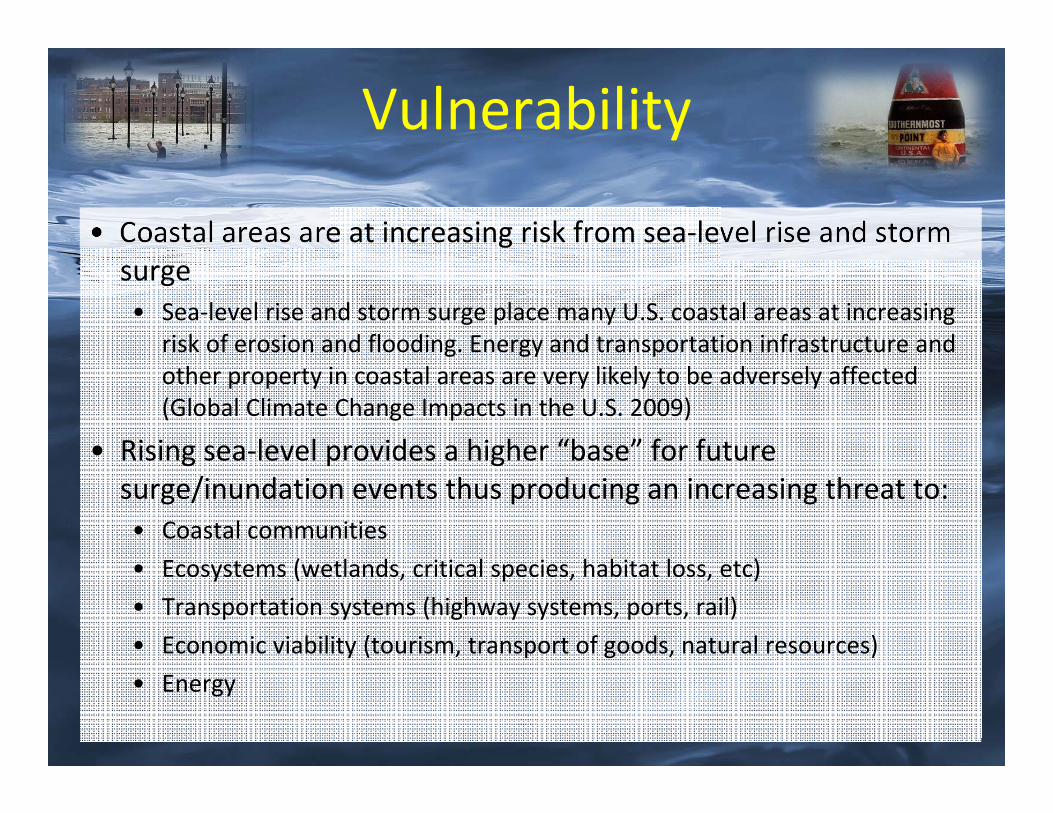
Vulnerability
• Coastal areas are at increasing risk from sea‐level rise and storm surge • Sea‐level rise and storm surge place many U.S. coastal areas at increasing
risk of erosion and flooding. Energy and transportation infrastructure and other property in coastal areas are very likely to be adversely affected (Global Climate Change Impacts in the U.S. 2009)
• Rising sea‐level provides a higher “base” for future surge/inundation events thus producing an increasing threat to:• Coastal communities • Ecosystems (wetlands, critical species, habitat loss, etc)• Transportation systems (highway systems, ports, rail)• Economic viability (tourism, transport of goods, natural resources)• Energy
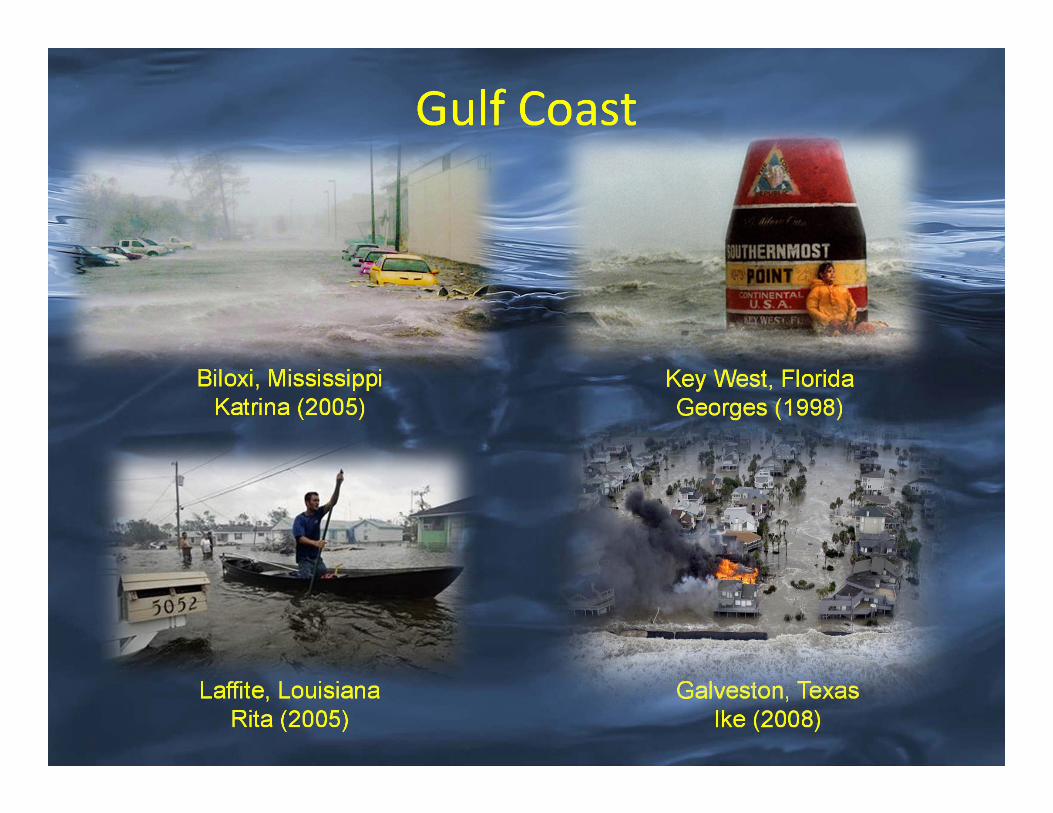
Gulf Coast
Biloxi, MississippiKatrina (2005)
Key West, FloridaGeorges (1998)
Laffite, LouisianaRita (2005)
Galveston, TexasIke (2008)
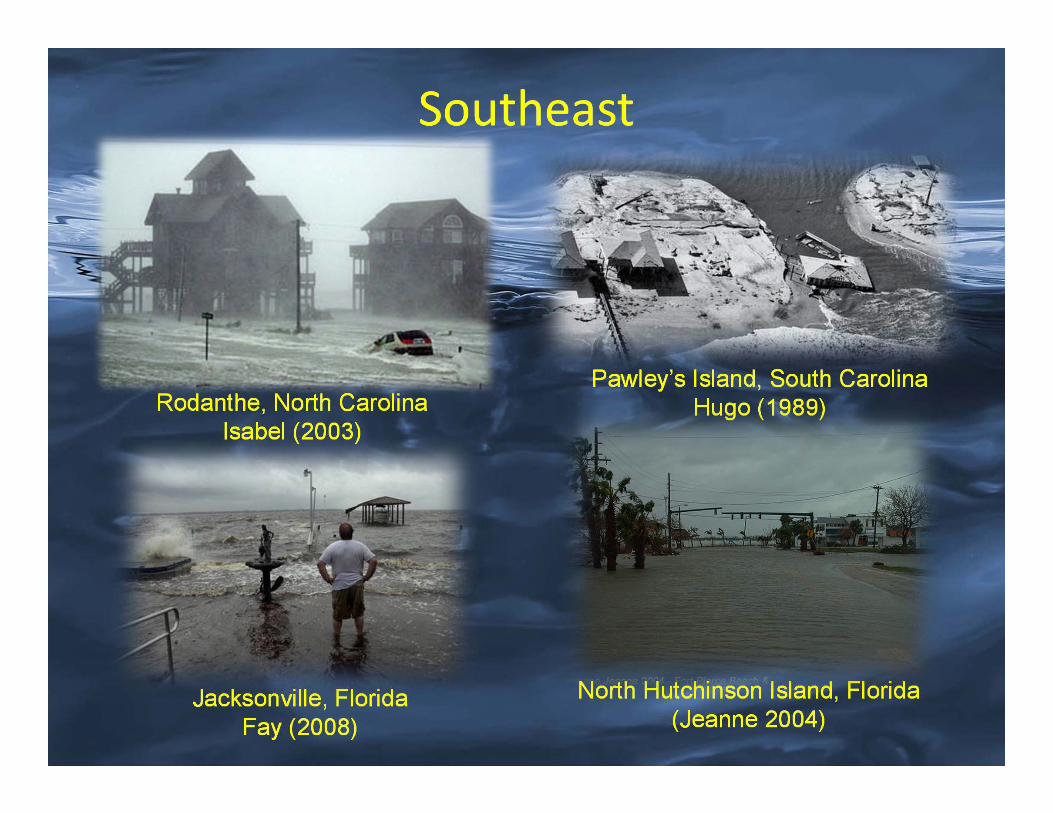
Southeast
Rodanthe, North CarolinaIsabel (2003)
Pawley’s Island, South CarolinaHugo (1989)
North Hutchinson Island, Florida(Jeanne 2004)
Jacksonville, FloridaFay (2008)
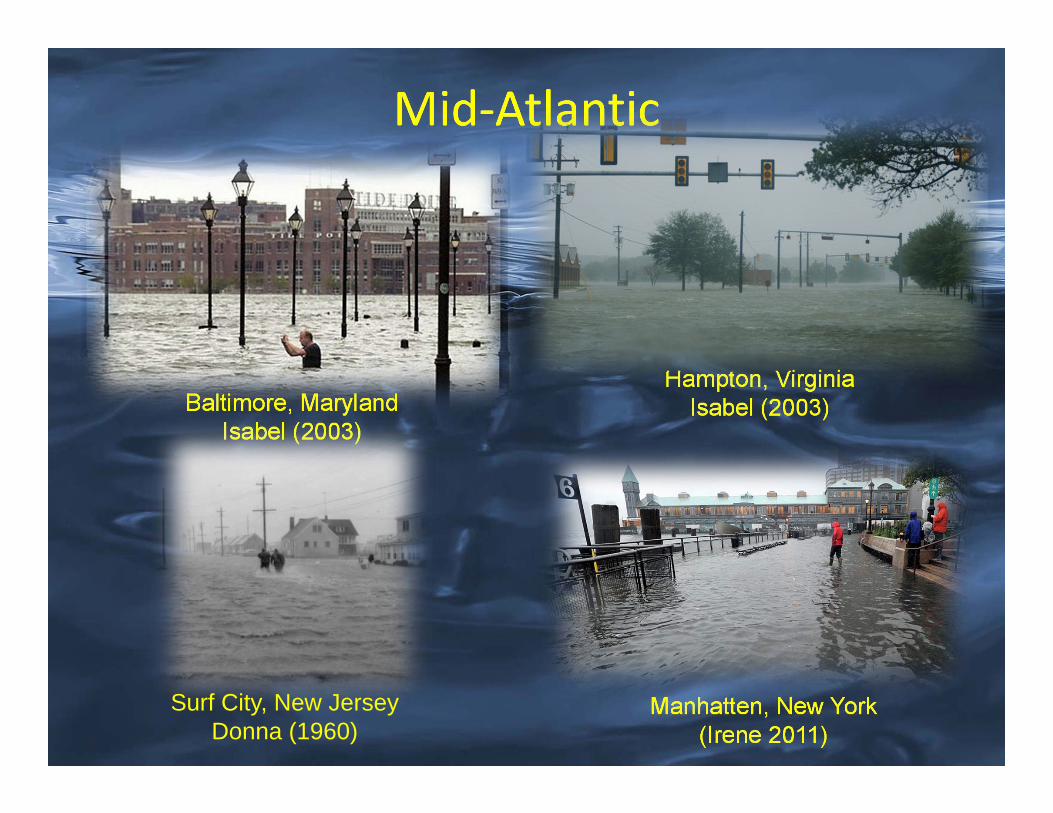
Mid‐Atlantic
Baltimore, MarylandIsabel (2003)
Hampton, VirginiaIsabel (2003)
Manhatten, New York(Irene 2011)
Surf City, New JerseyDonna (1960)
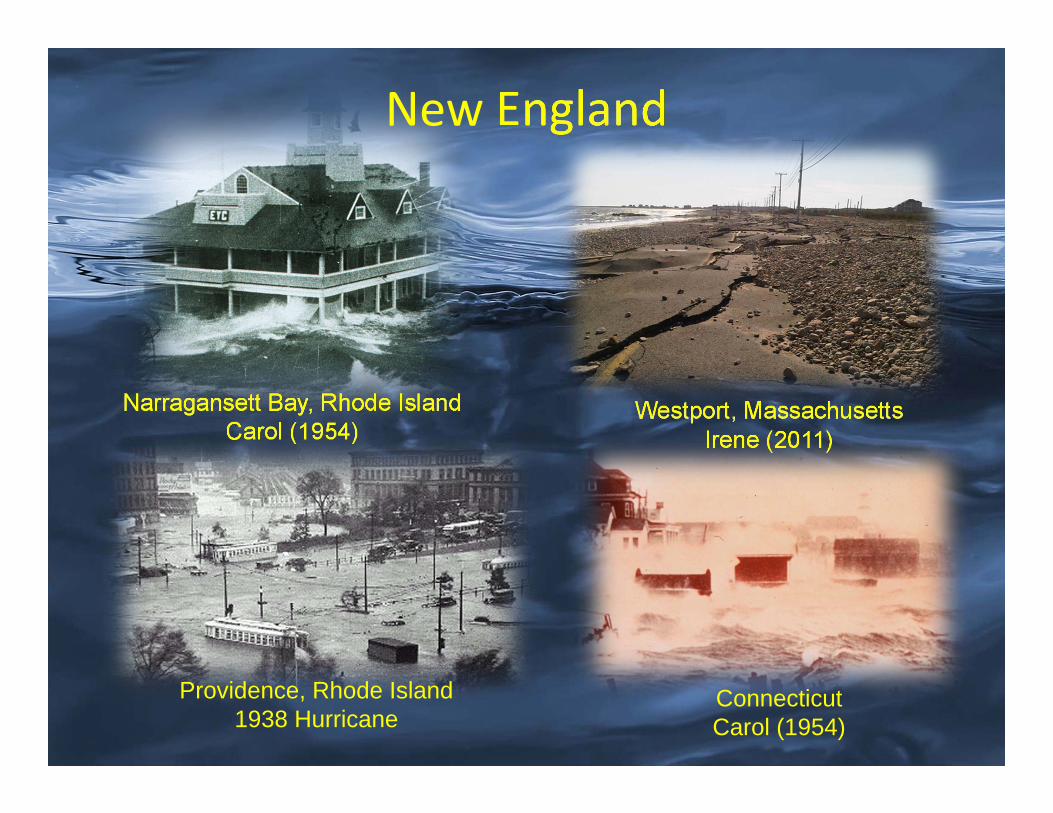
New England
Narragansett Bay, Rhode IslandCarol (1954)
Westport, MassachusettsIrene (2011)
ConnecticutCarol (1954)
Providence, Rhode Island1938 Hurricane

• Brownsville, TX 25 years– 1980 (Allen)
• Galveston, TX 18 years– 1983 (Alicia)
• New Orleans, LA 19 years– 2005 (Katrina)
• Houma, LA 18 years– 1992 (Andrew)
Return Period for Major Hurricanes (center within 75 miles)
Major Hurricane expected to make landfall in the Gulf every 2 years
• Biloxi, MS 18 years– 2005 (Katrina)
• Mobile, AL 23 years– 2004 (Ivan)
• Tampa, FL 23 years– 1921
• Naples, FL 14 years– 2005 (Wilma)
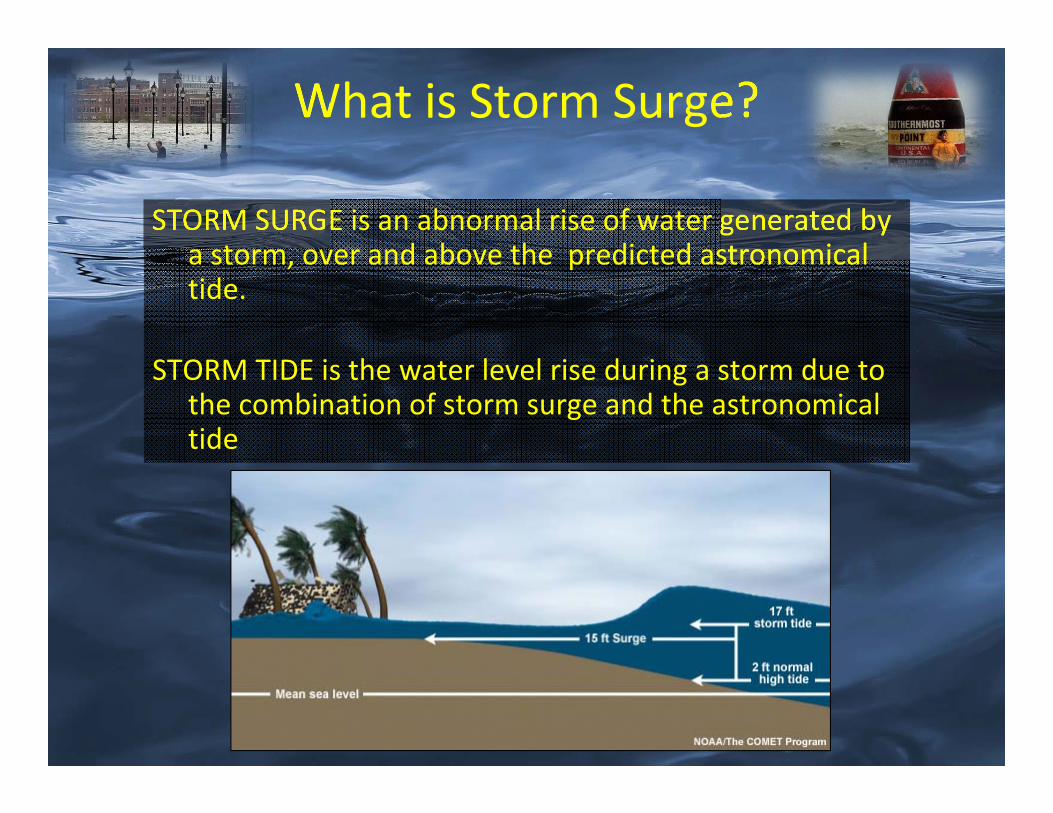
What is Storm Surge?
STORM SURGE is an abnormal rise of water generated by a storm, over and above the predicted astronomical tide.
STORM TIDE is the water level rise during a storm due to the combination of storm surge and the astronomical tide
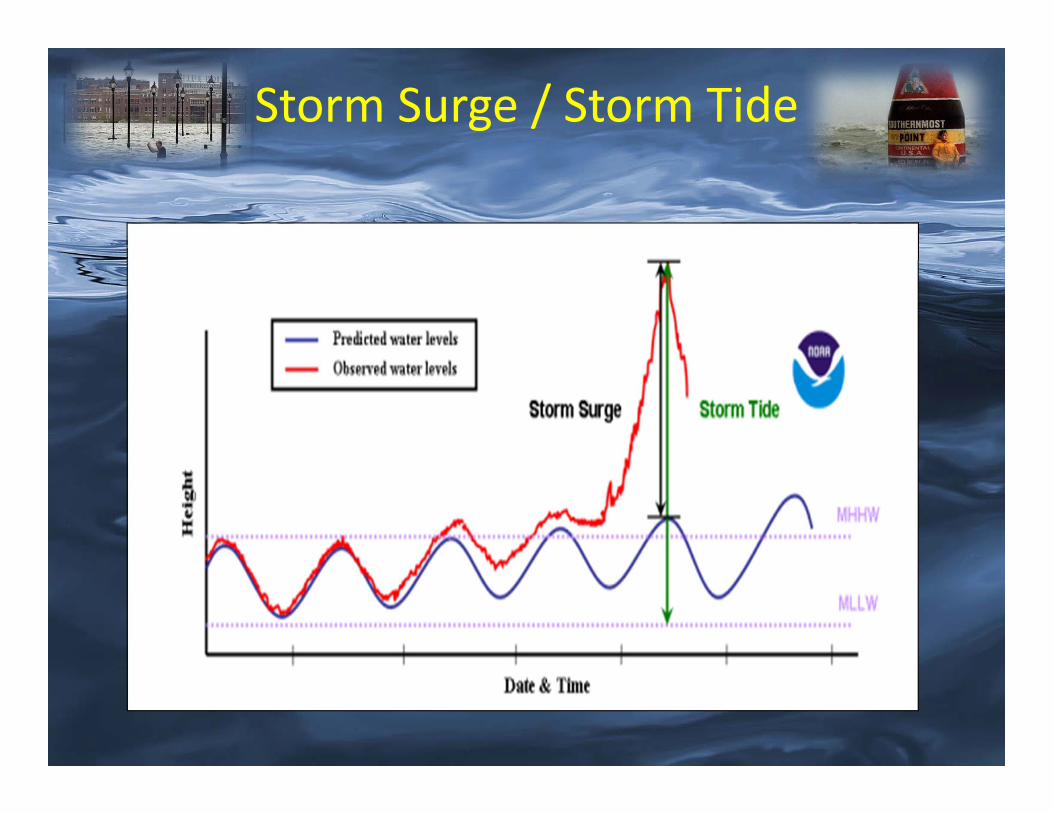
Storm Surge / Storm Tide
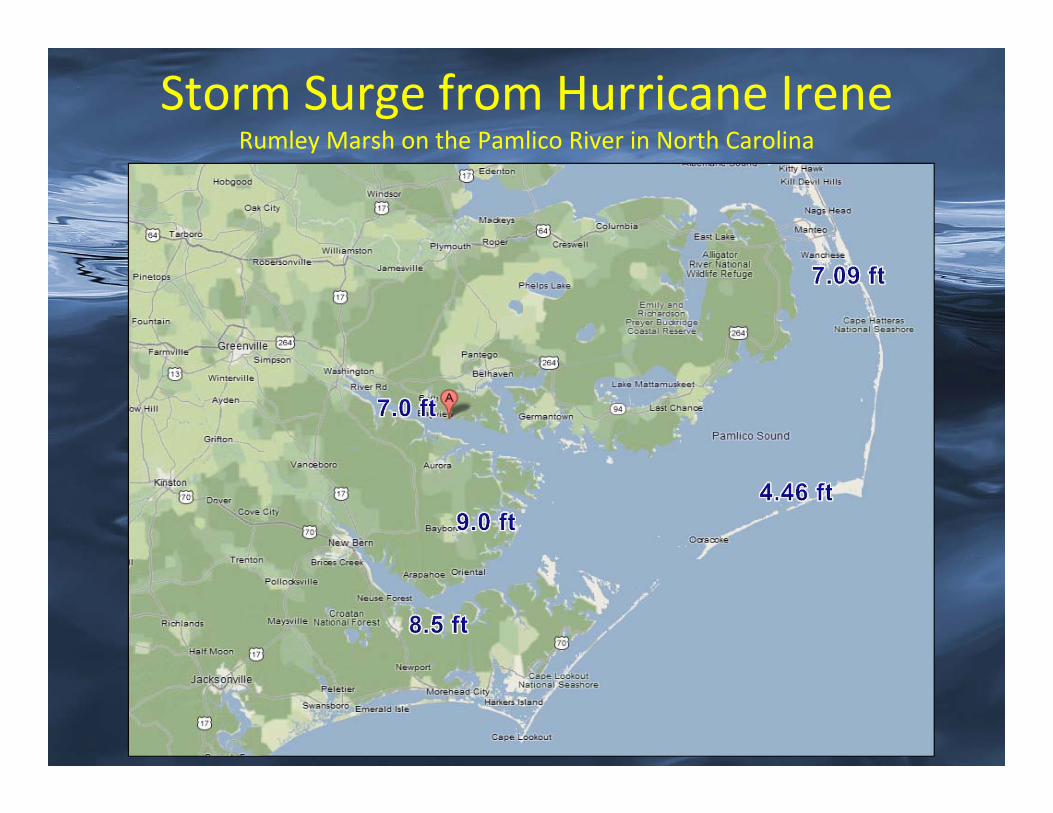
Storm Surge from Hurricane IreneRumley Marsh on the Pamlico River in North Carolina
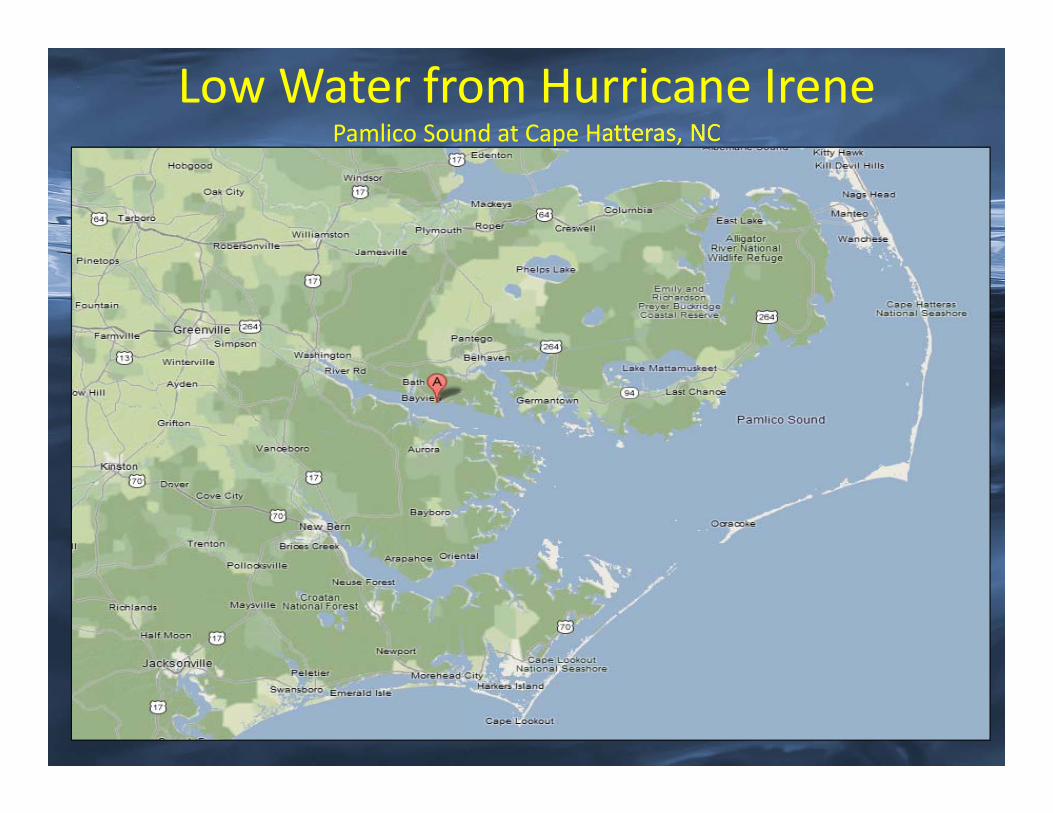
Low Water from Hurricane IrenePamlico Sound at Cape Hatteras, NC
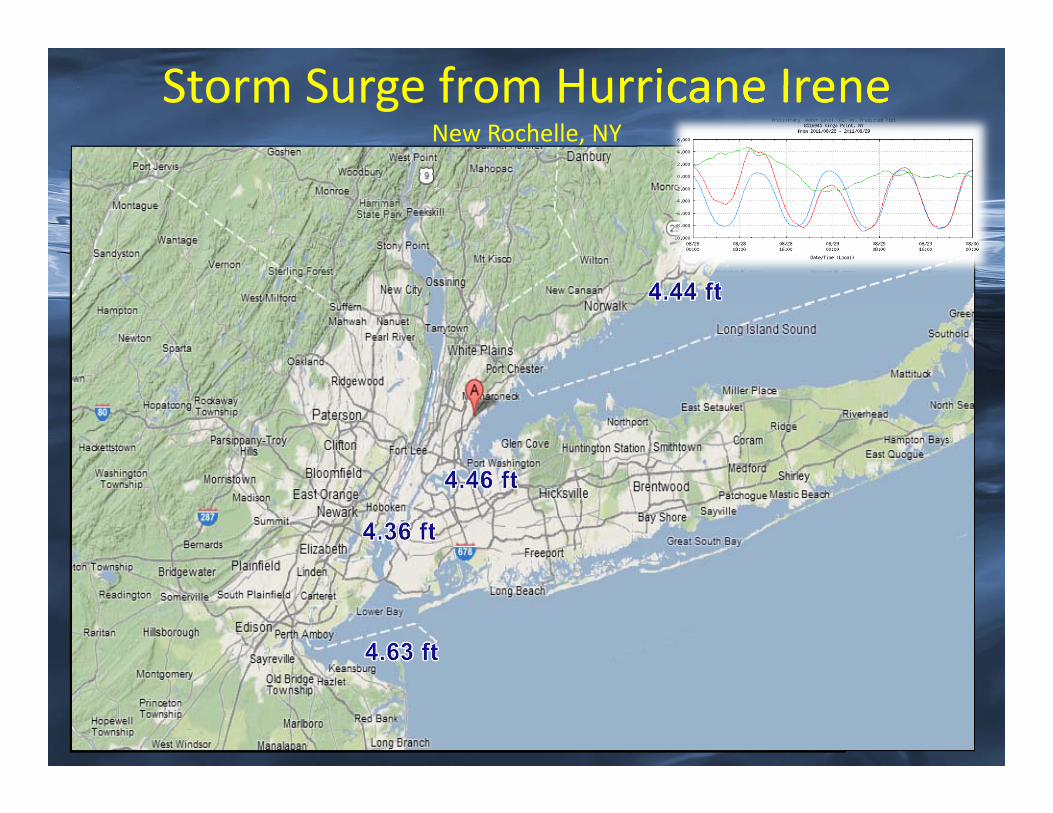
Storm Surge from Hurricane IreneNew Rochelle, NY
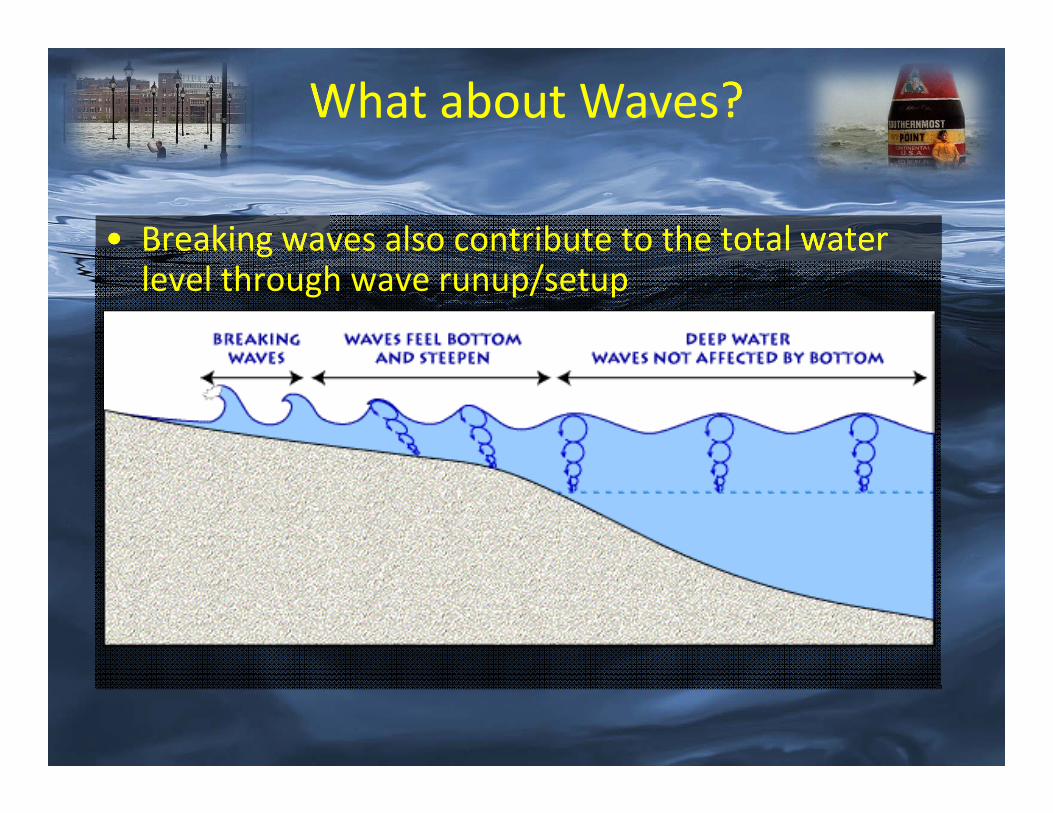
• Breaking waves also contribute to the total water level through wave runup/setup
• WAVE RUNUP is the time‐varying fluctuation of water‐level elevation at the shoreline due to wave breaking
• WAVE SETUP is the time‐averaged water level rise due to wave breaking
• The magnitude of both runup and setup are related to offshore wave period, wave height, and shelf slope
What about Waves?
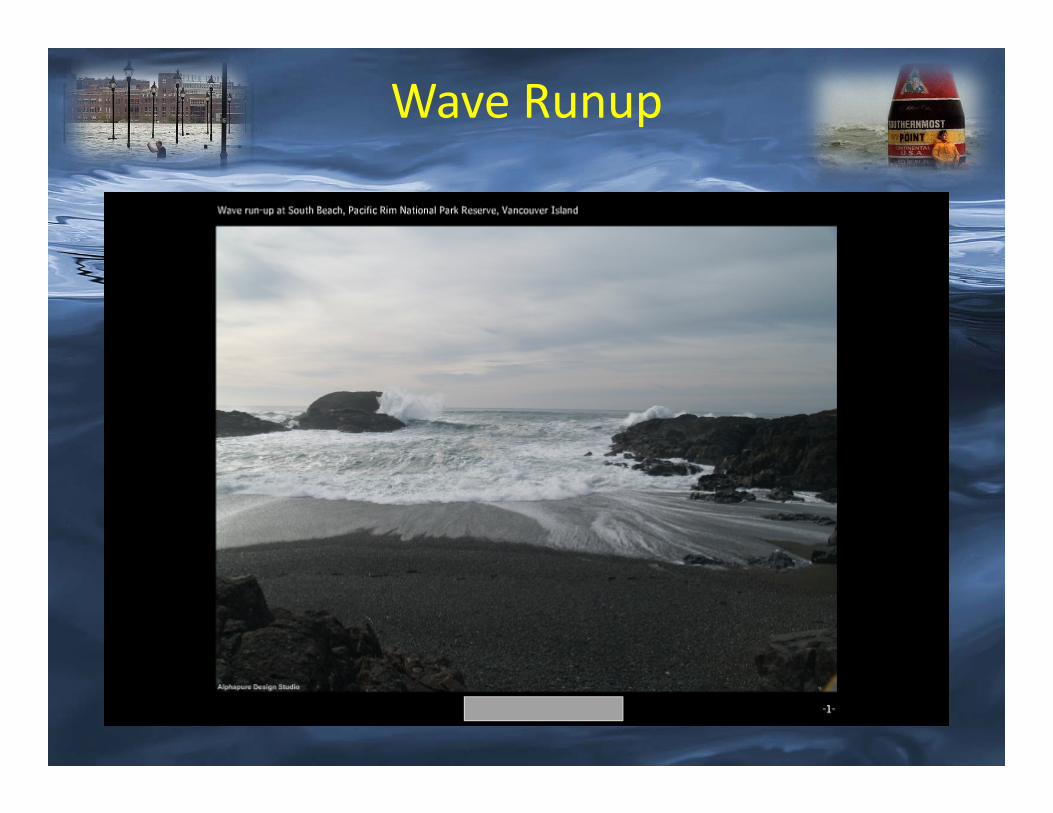
Wave Runup
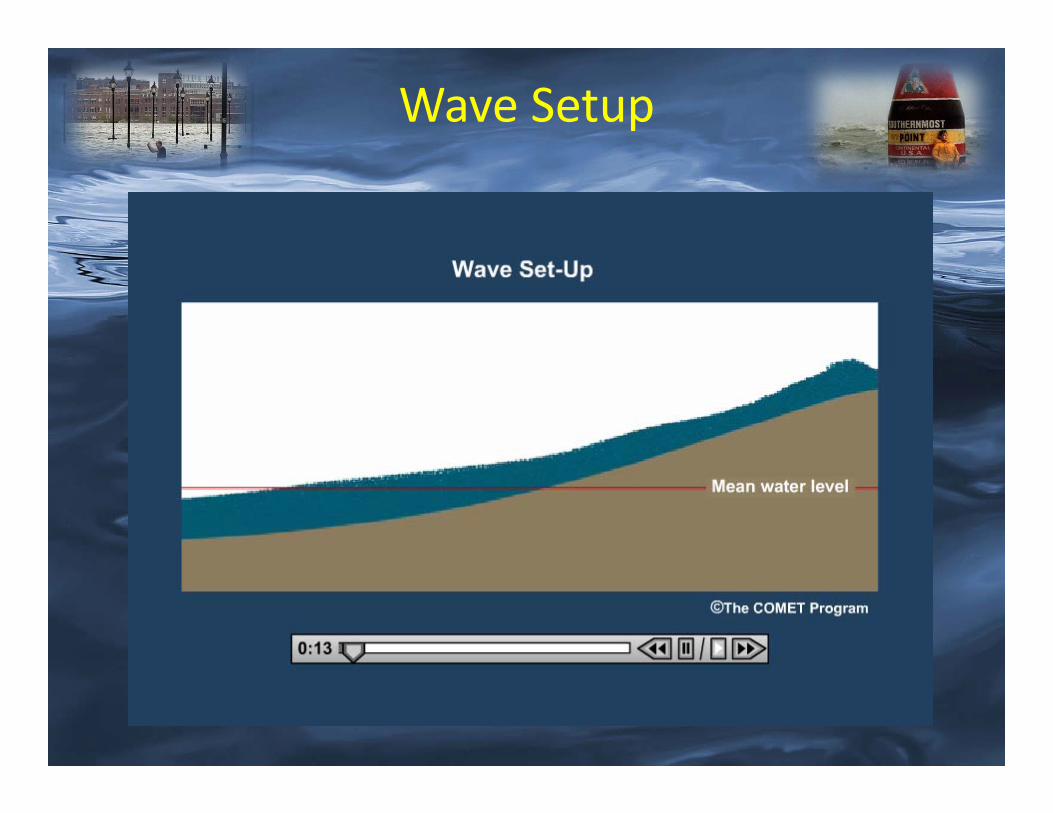
Wave Setup

GalvestonDay before Ike arrived
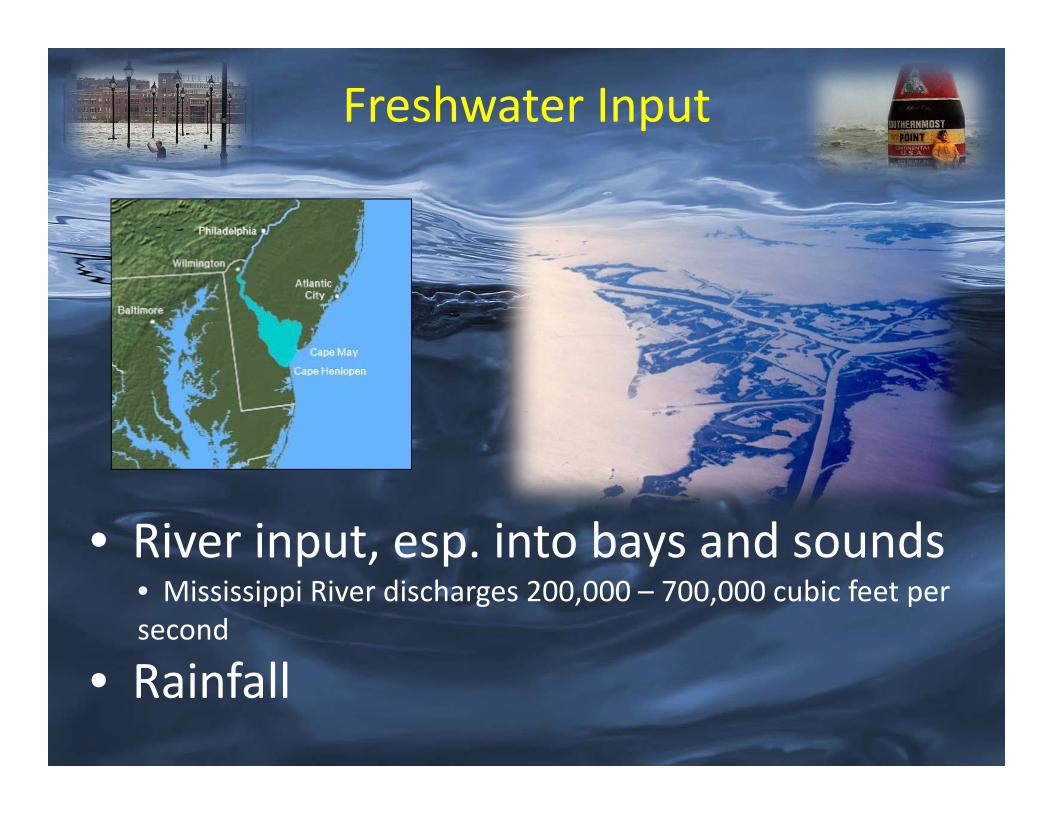
Freshwater Input
• River input, esp. into bays and sounds• Mississippi River discharges 200,000 – 700,000 cubic feet per second
• Rainfall
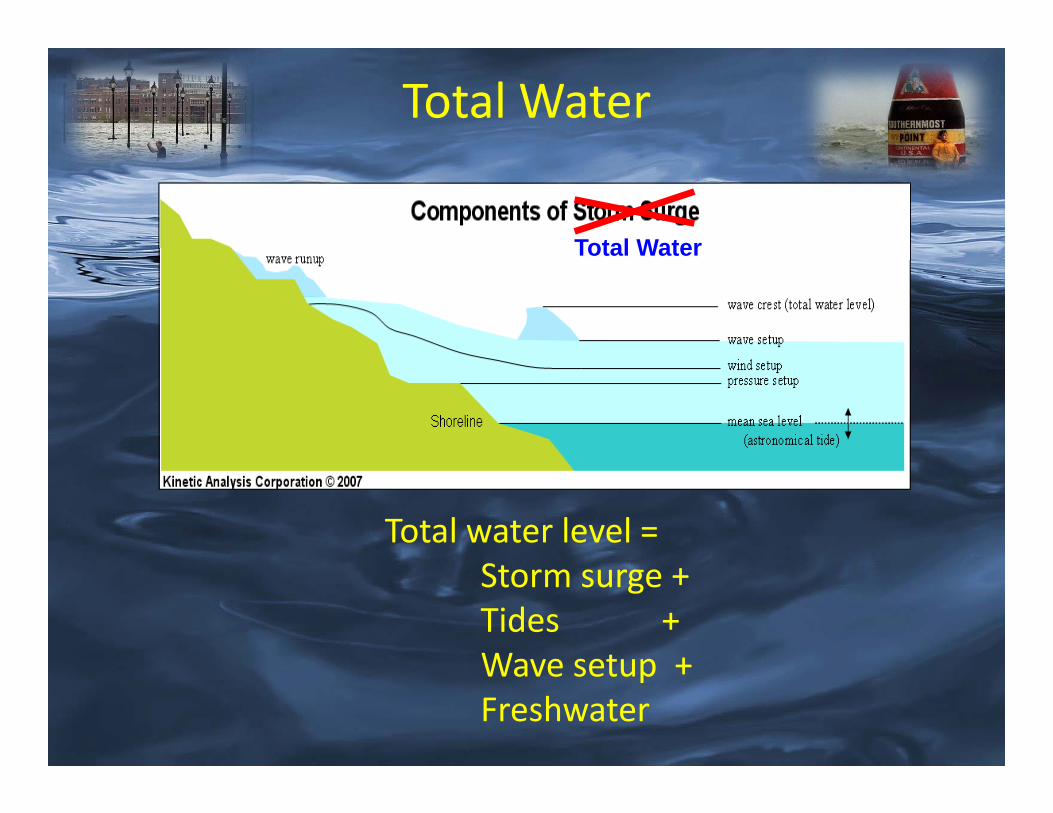
Total Water
Total water level =Storm surge +Tides +Wave setup +Freshwater
Total Water

No More Surge in the Saffir‐Simpson Scale!
(it fits like a square peg in a round hole)
IKE (2)KATRINA (3)
CHARLEY (4)
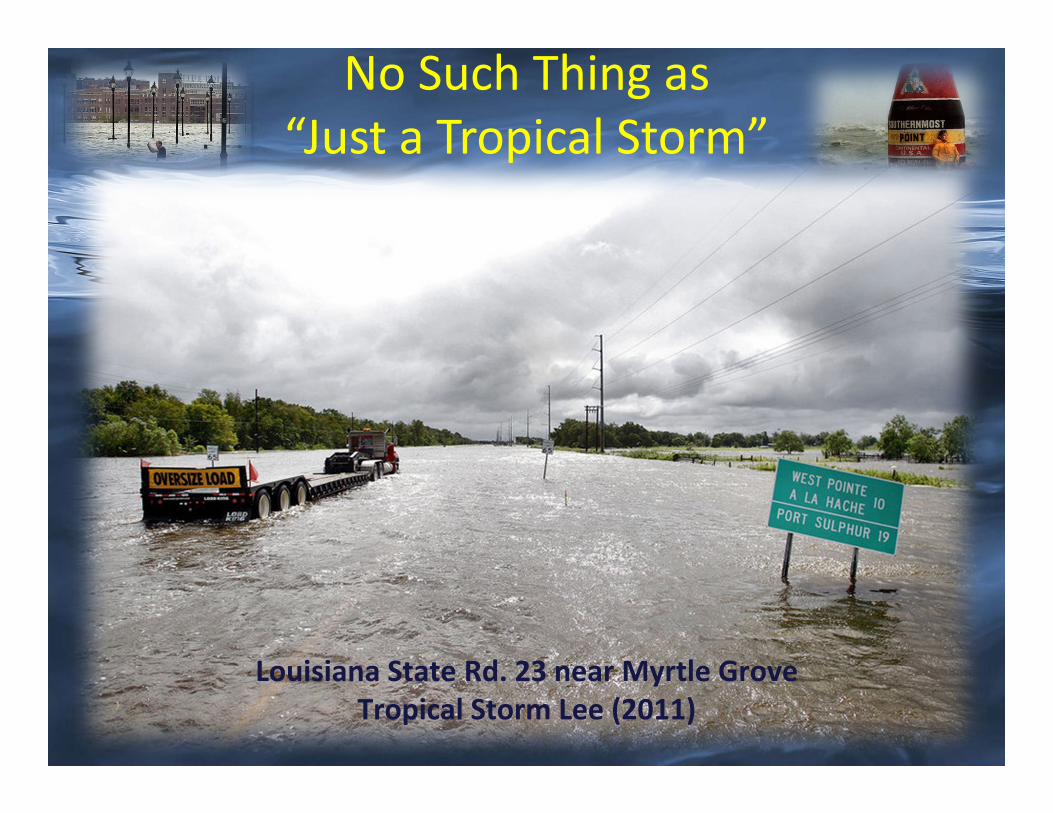
No Such Thing as “Just a Tropical Storm”
Louisiana State Rd. 23 near Myrtle GroveTropical Storm Lee (2011)
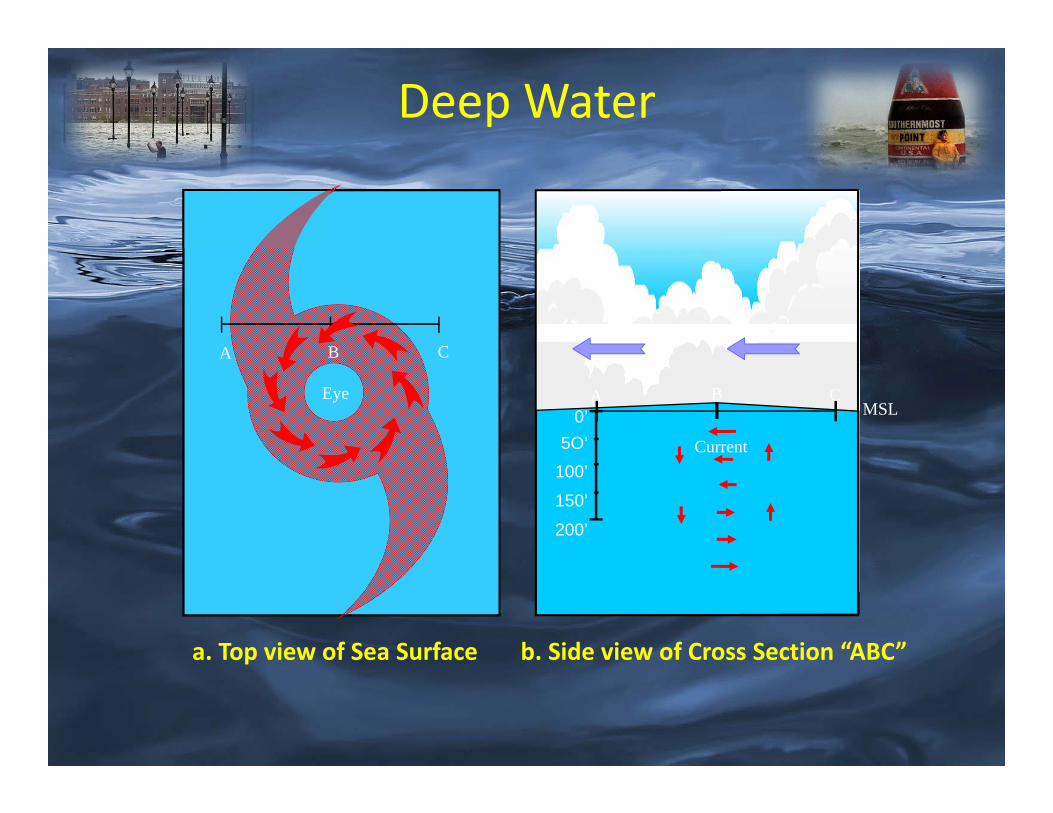
b. Side view of Cross Section “ABC”a. Top view of Sea Surface
0’5O’
100’
150’
200’
Wind
Current
A B CMSL
A B
Eye
CWind
Deep Water
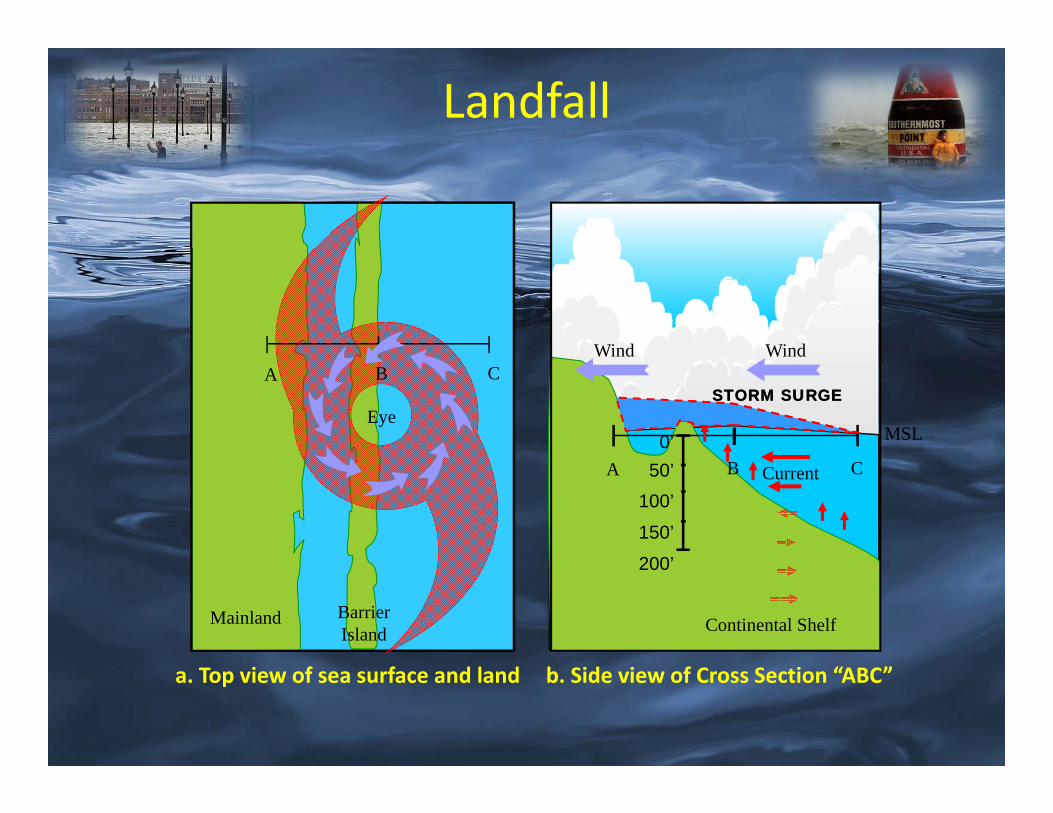
b. Side view of Cross Section “ABC”a. Top view of sea surface and land
Wind
A B C0’
50’100’
150’
200’
Continental ShelfBarrierIsland
Mainland
A B C
Eye
Current
MSL
STORM SURGE
Wind
STORM SURGE
Landfall

Understanding Surge
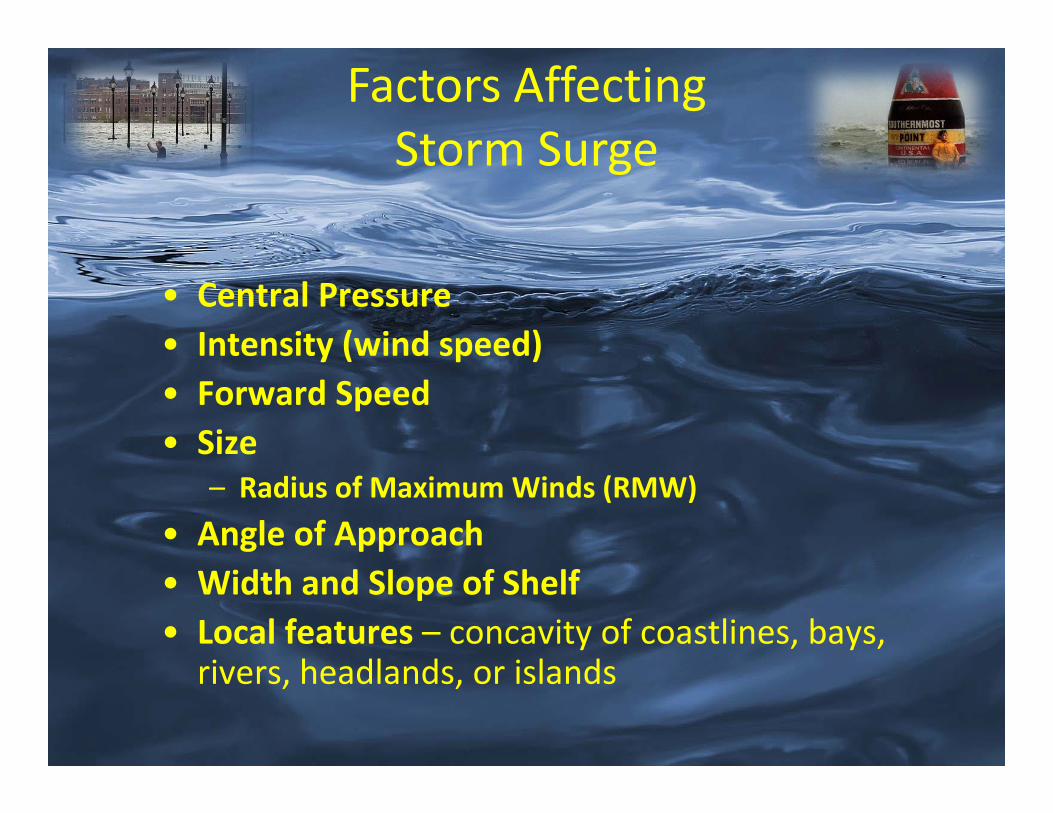
• Central Pressure• Intensity (wind speed)• Forward Speed• Size
– Radius of Maximum Winds (RMW)• Angle of Approach• Width and Slope of Shelf• Local features – concavity of coastlines, bays, rivers, headlands, or islands
Factors Affecting Storm Surge
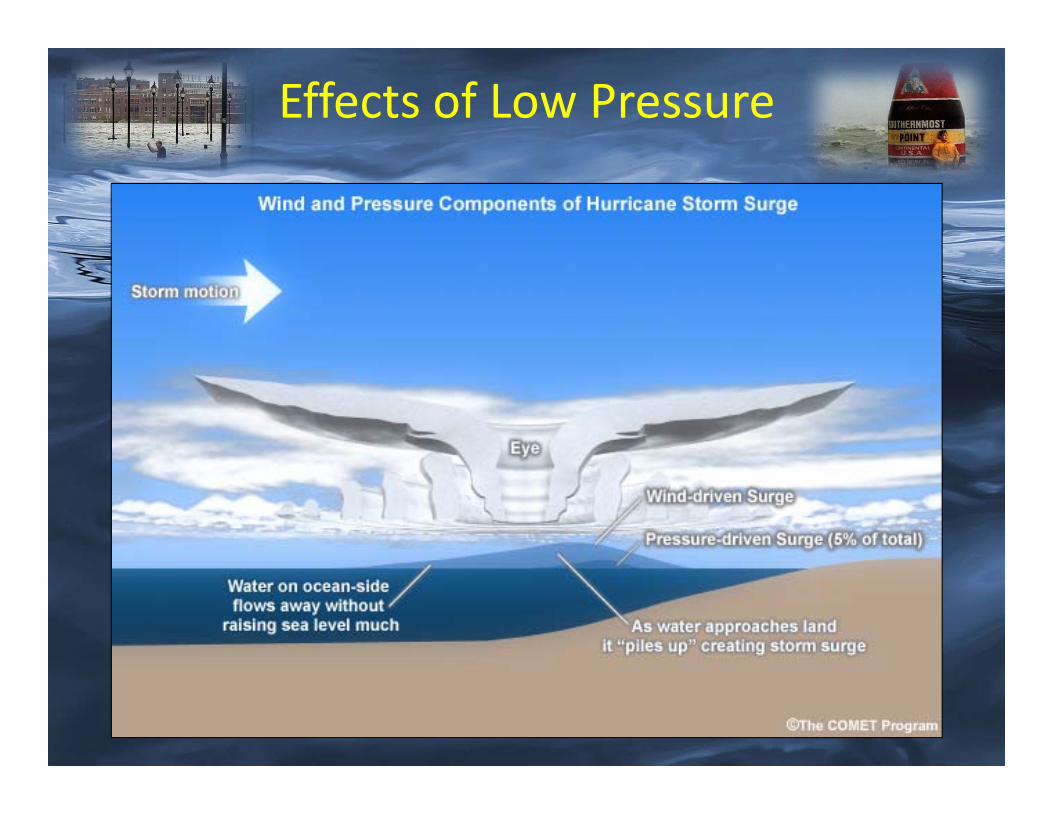
Effects of Low Pressure
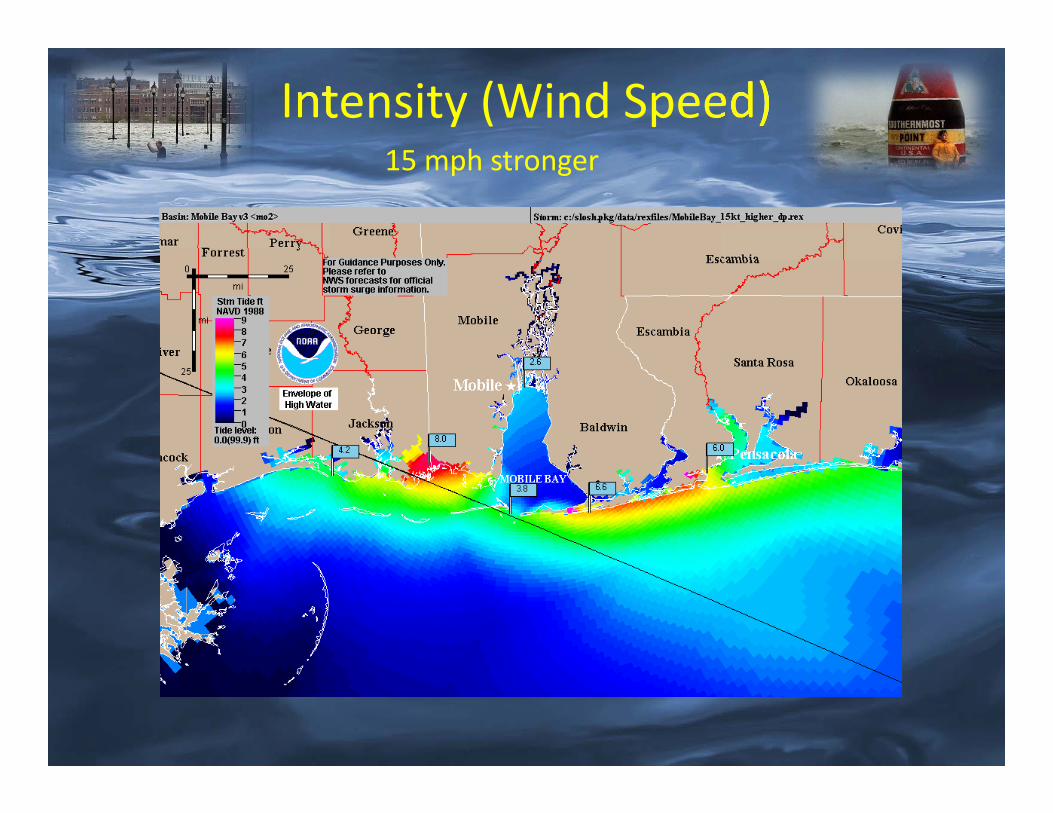
15 mph stronger
Intensity (Wind Speed)
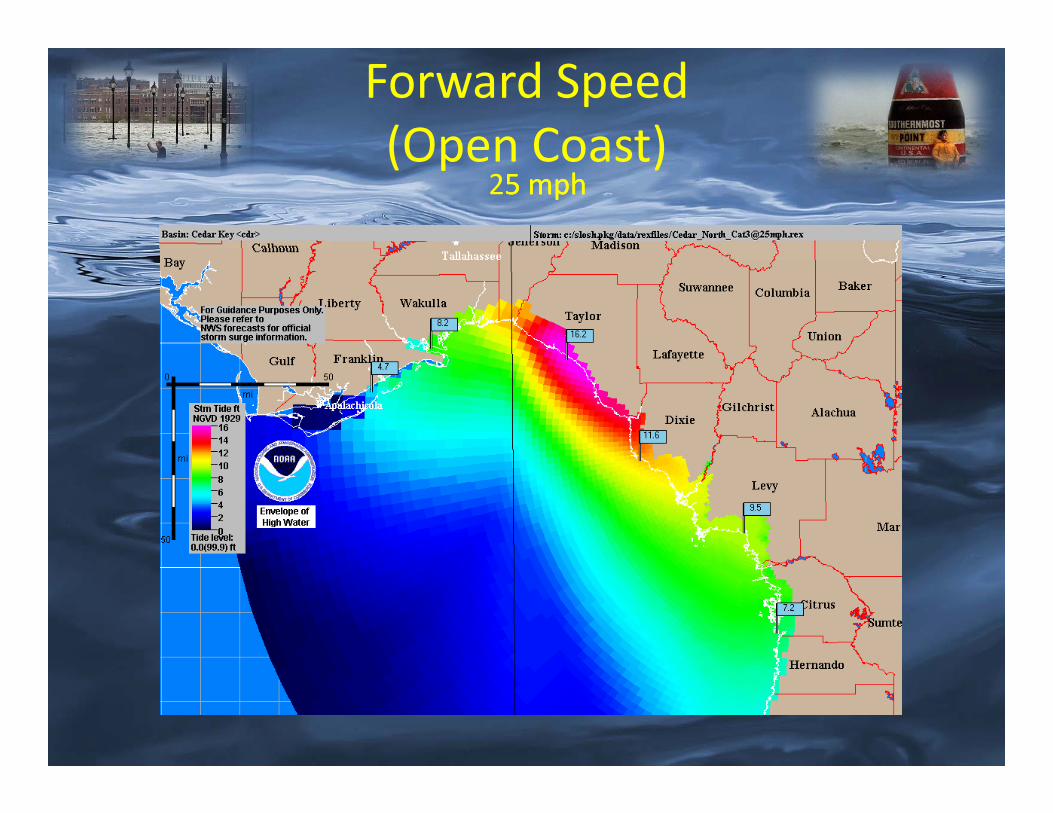
5 mph25 mph
Forward Speed(Open Coast)
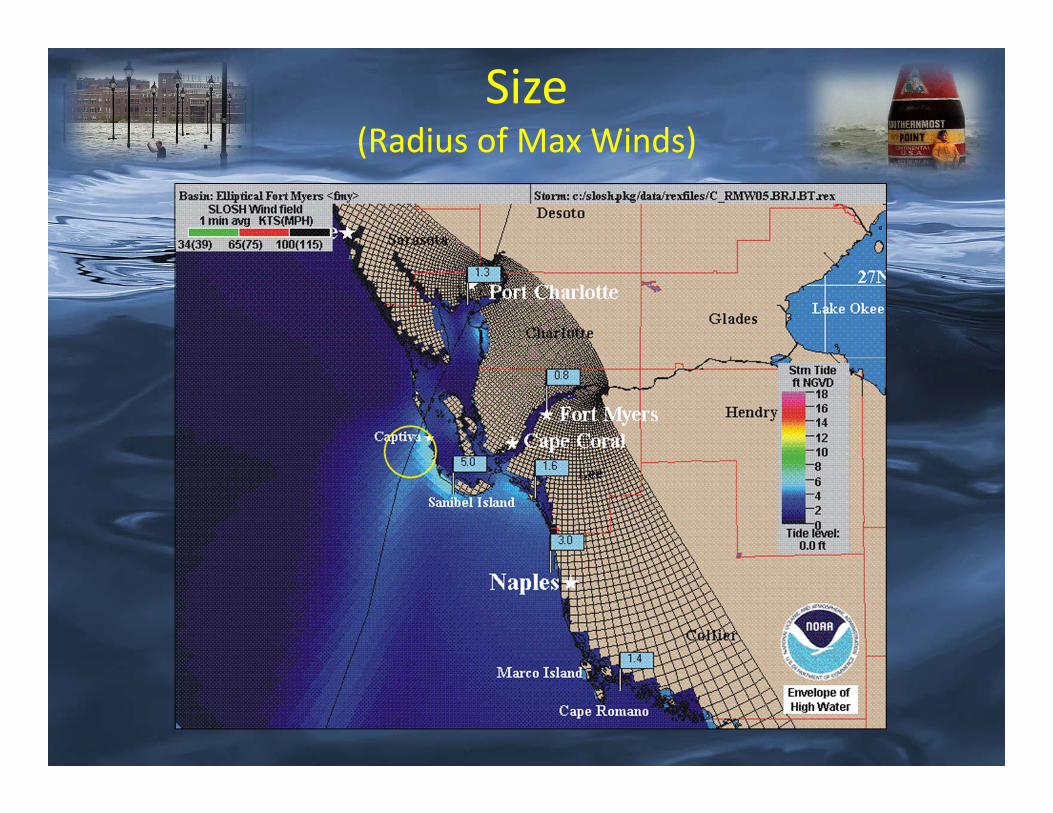
Size (Radius of Max Winds)
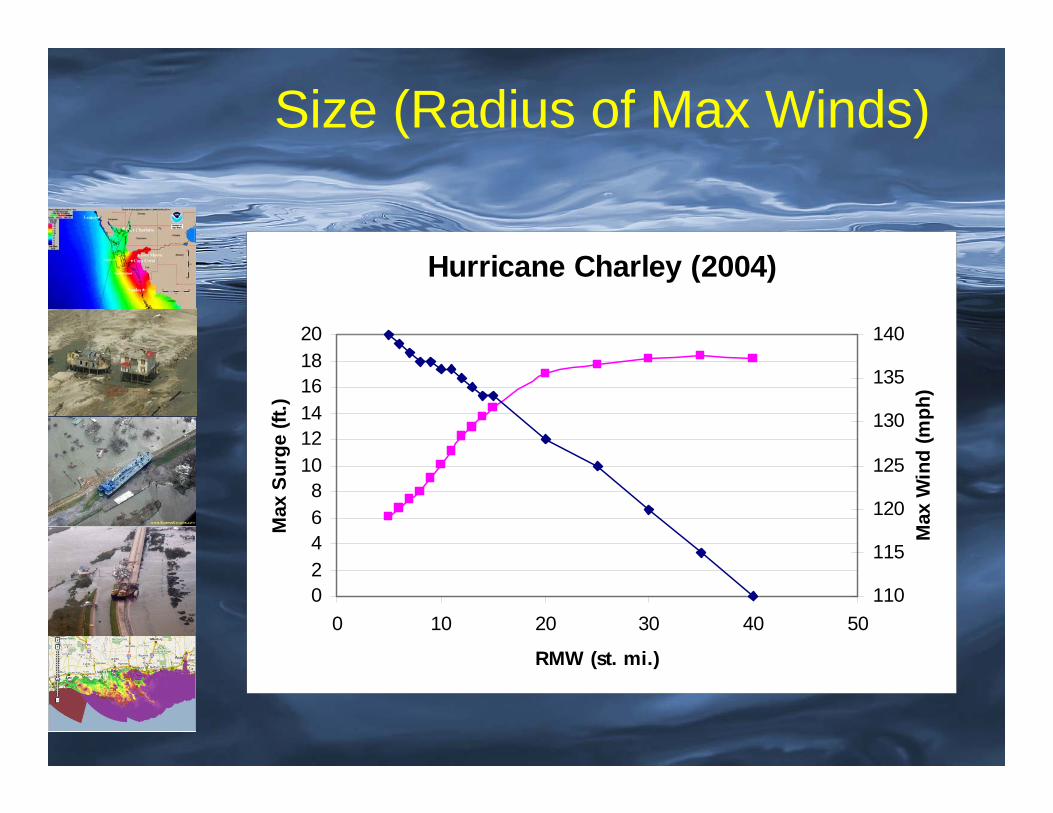
Hurricane Charley (2004)
02468
101214161820
0 10 20 30 40 50
RMW (st. mi.)
Max
Sur
ge (f
t.)
110
115
120
125
130
135
140
Max
Win
d (m
ph)
Size (Radius of Max Winds)
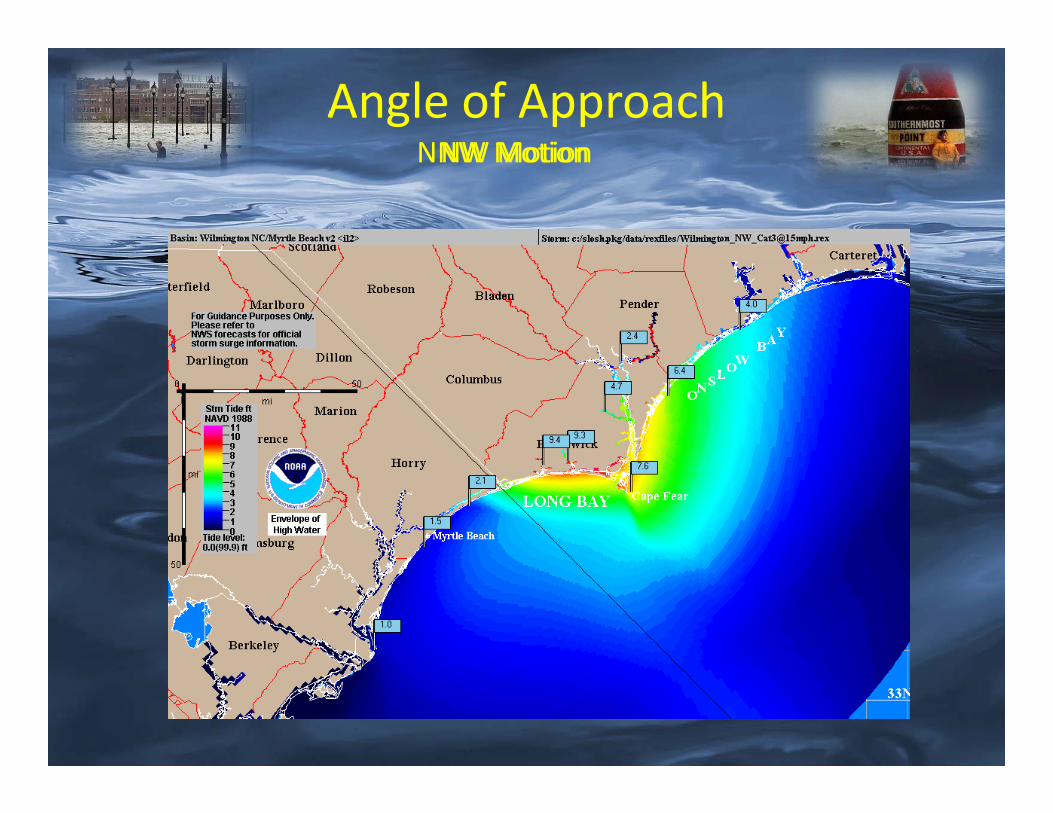
NNW MotionNW MotionAngle of Approach
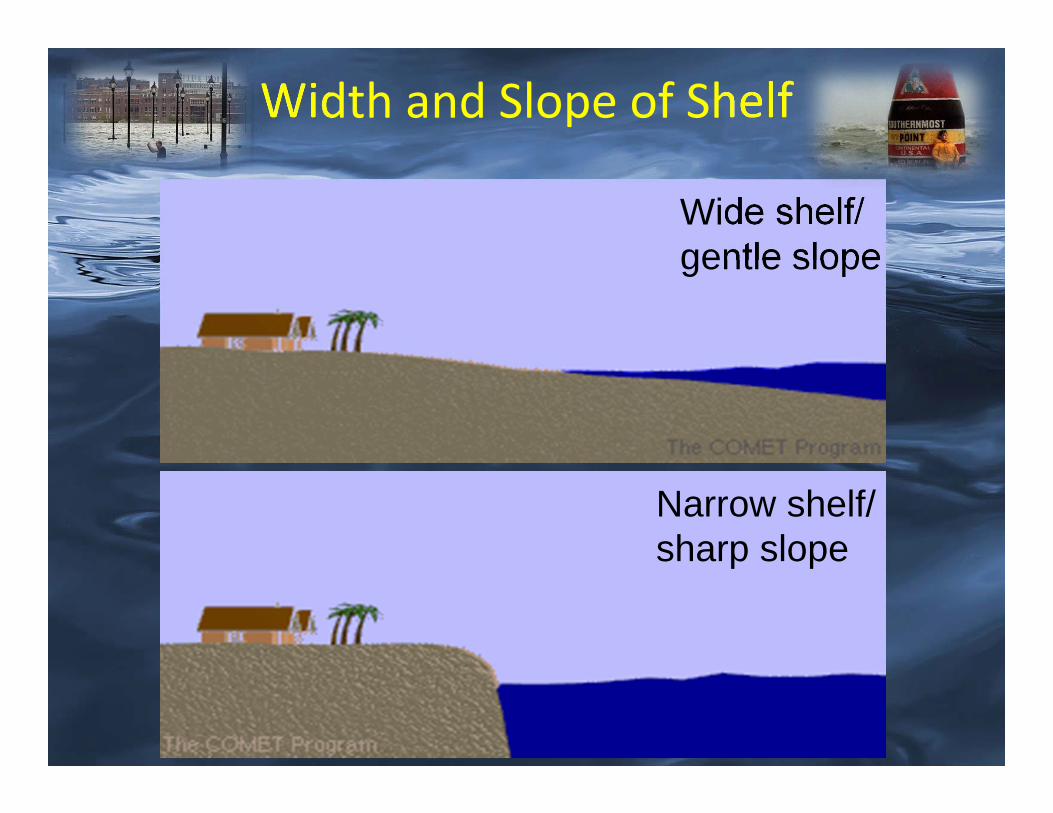
Wide shelf/ gentle slope
Narrow shelf/ sharp slope
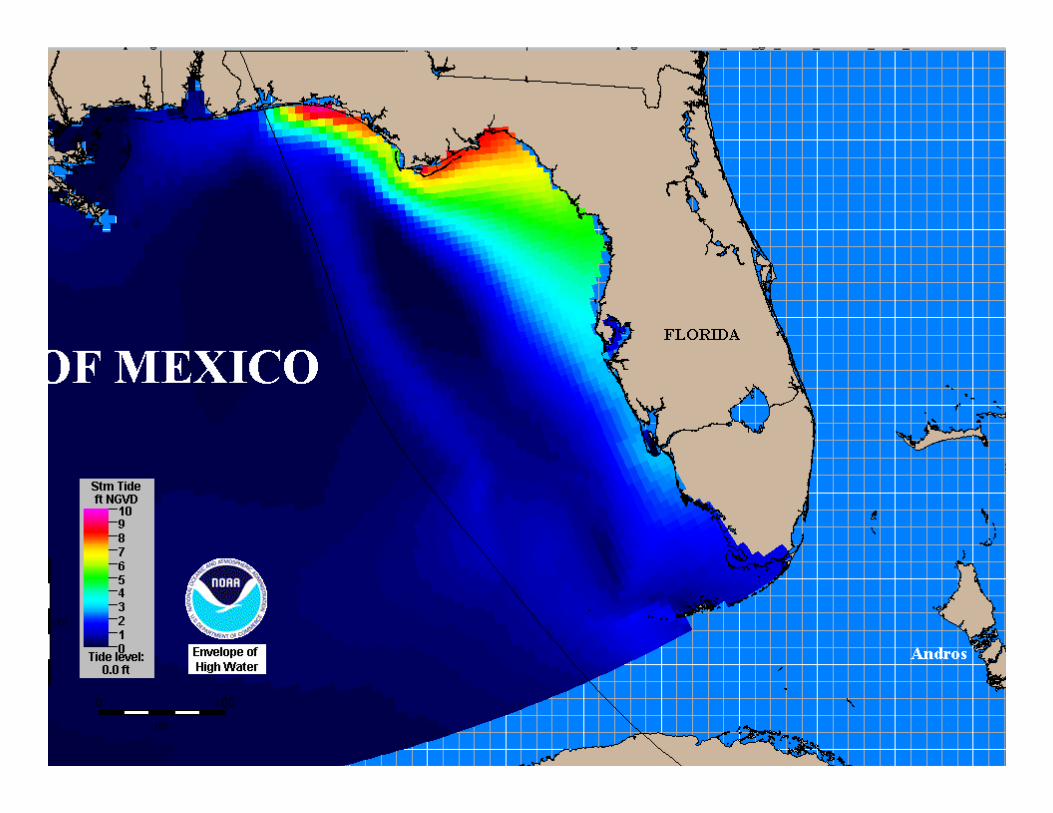
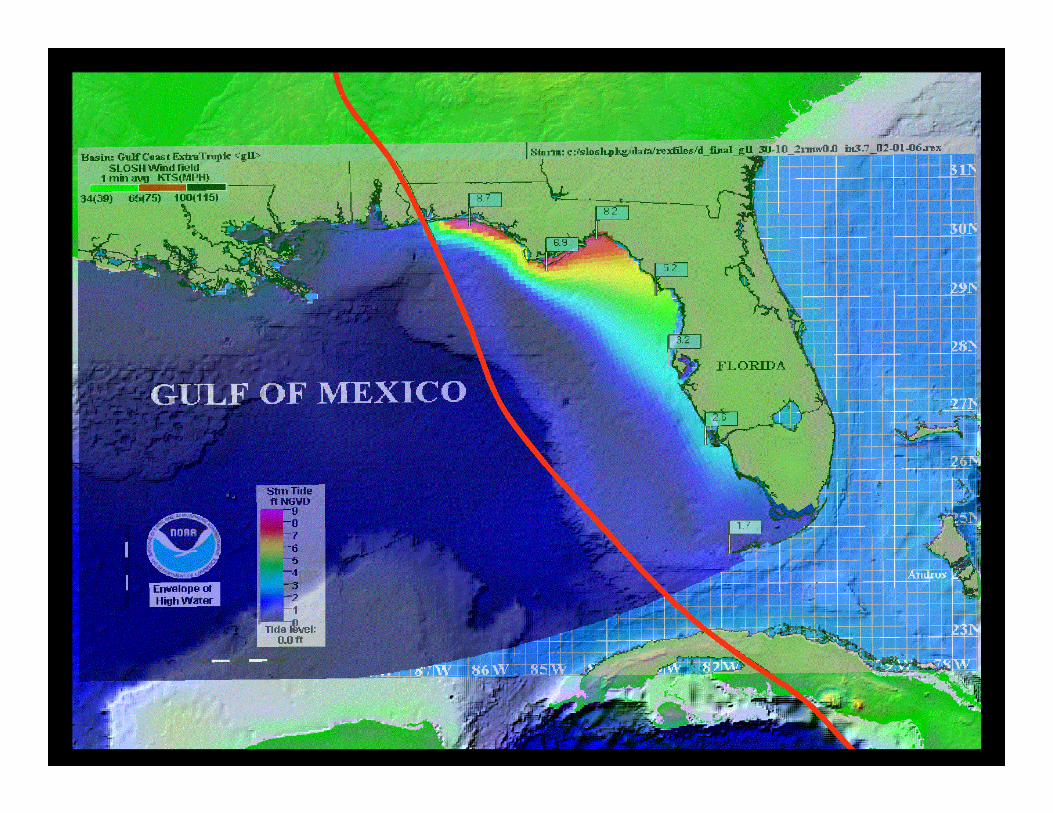
Width and Slope of Shelf
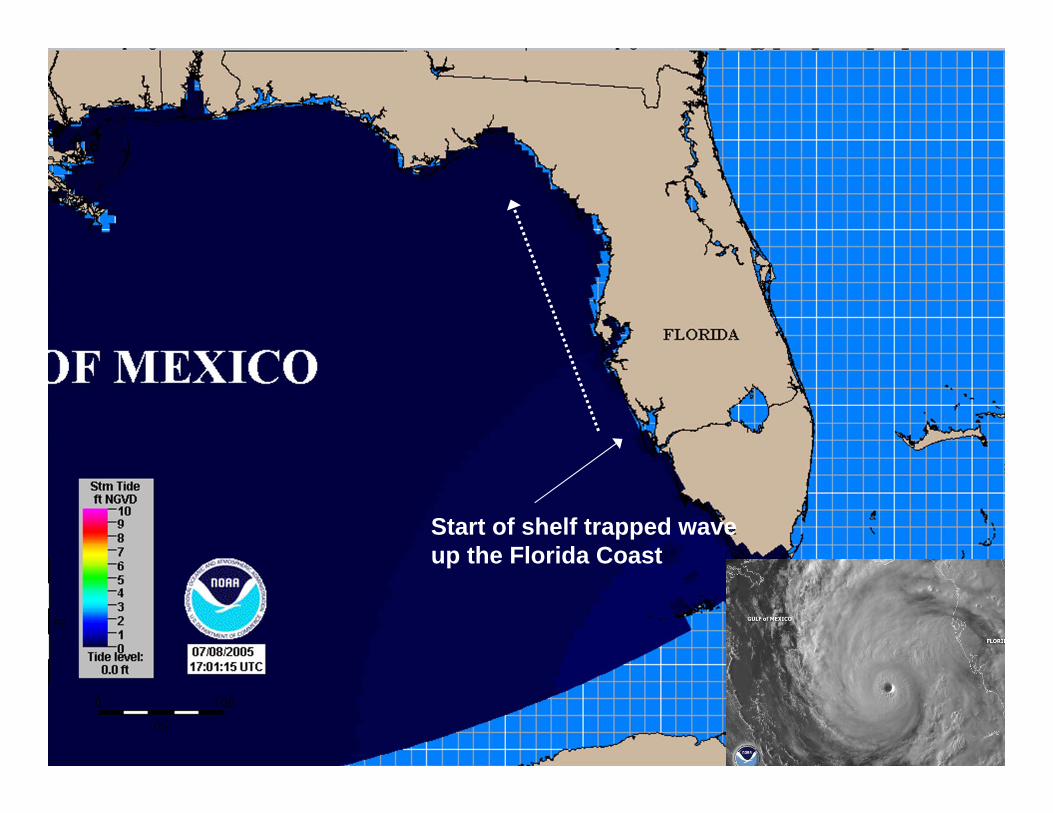
Start of shelf trapped waveup the Florida Coast
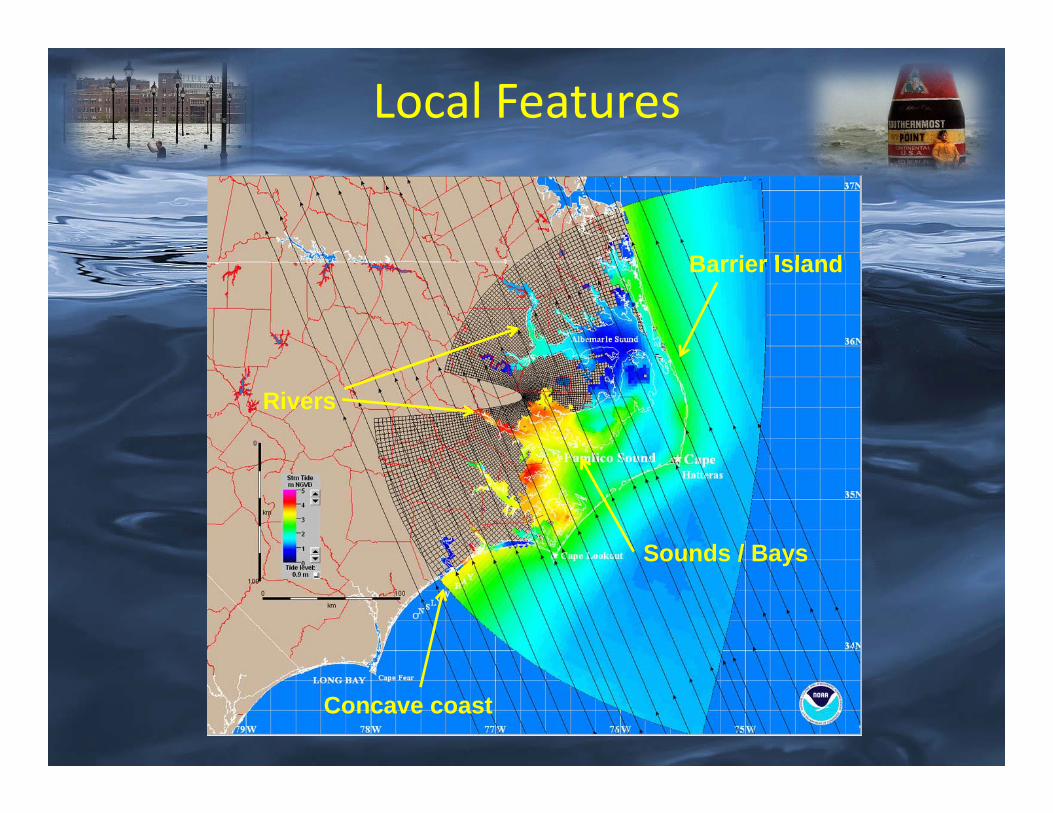
Barrier Island
Rivers
Concave coast
Sounds / Bays
Local Features
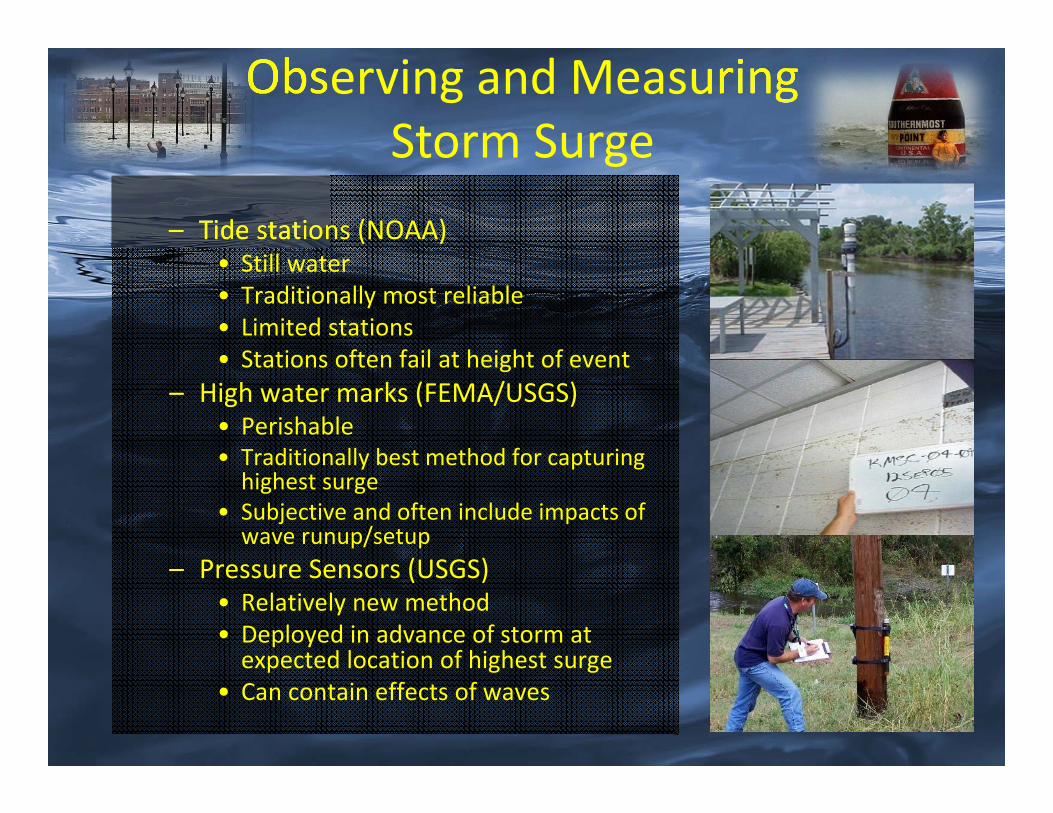
– Tide stations (NOAA)• Still water• Traditionally most reliable• Limited stations• Stations often fail at height of event
– High water marks (FEMA/USGS)• Perishable • Traditionally best method for capturing highest surge
• Subjective and often include impacts of wave runup/setup
– Pressure Sensors (USGS)• Relatively new method• Deployed in advance of storm at expected location of highest surge
• Can contain effects of waves
Observing and Measuring Storm Surge
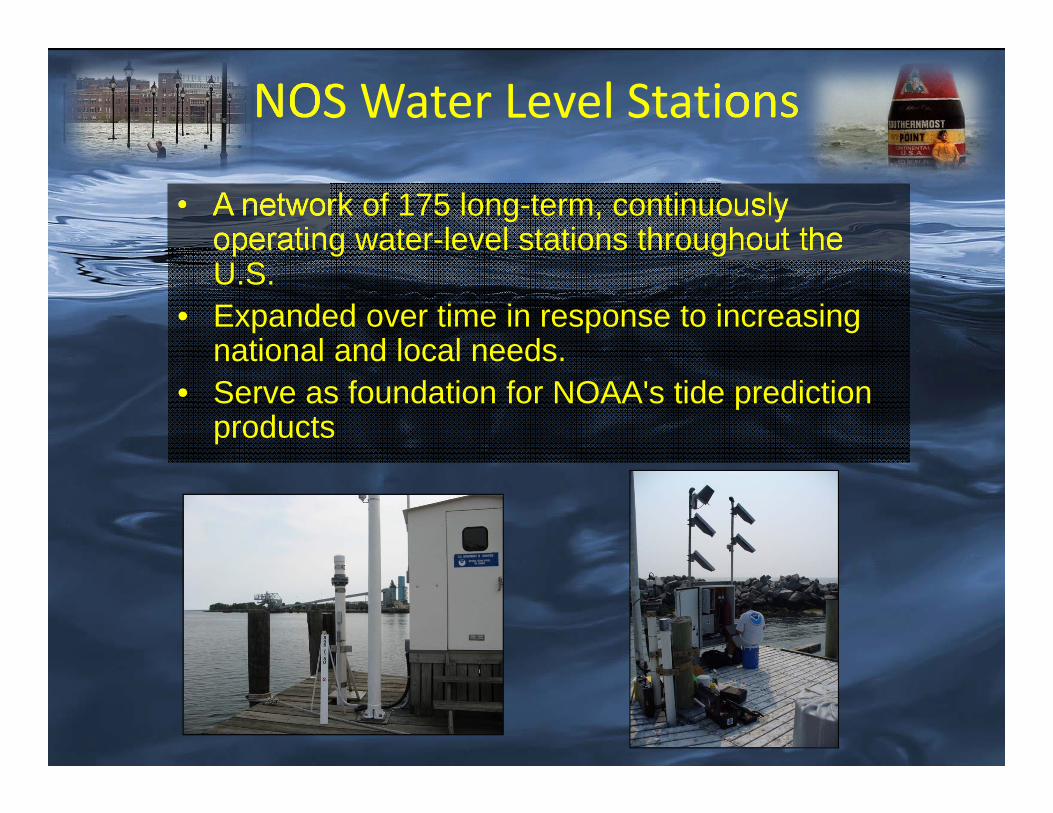
• A network of 175 long-term, continuously operating water-level stations throughout the U.S.
• Expanded over time in response to increasing national and local needs.
• Serve as foundation for NOAA's tide prediction products
NOS Water Level Stations
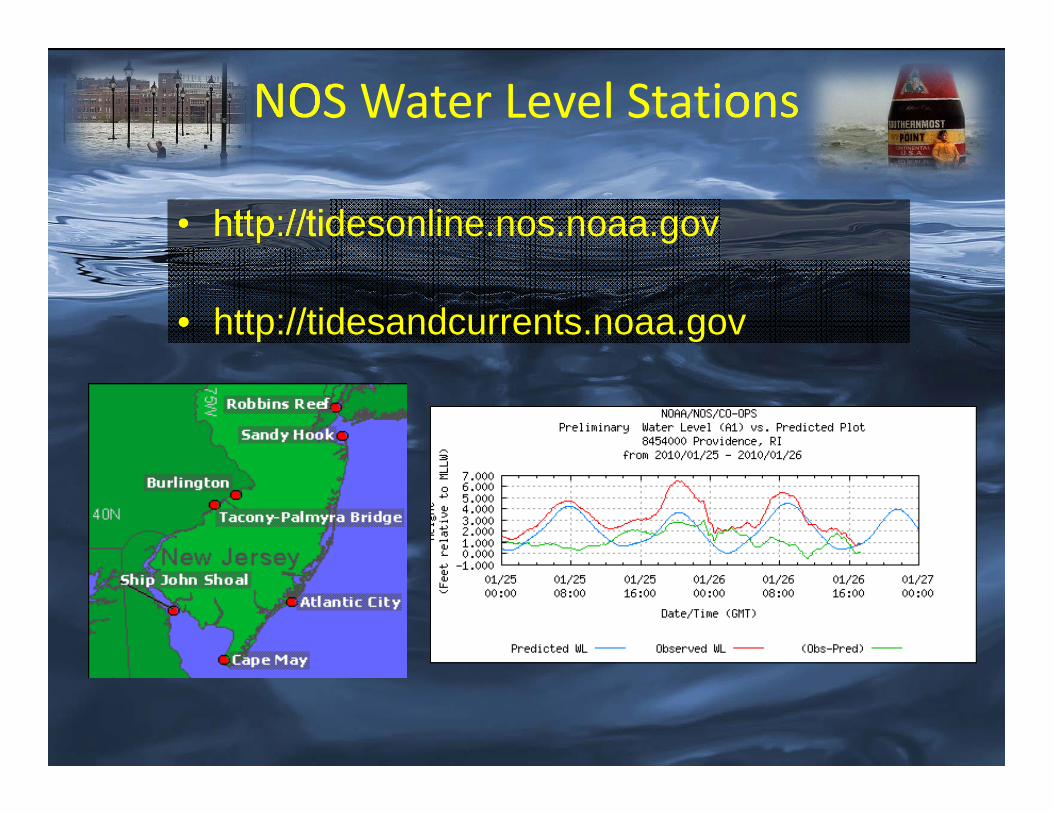
• http://tidesonline.nos.noaa.gov
• http://tidesandcurrents.noaa.gov
NOS Water Level Stations

• Lines found on trees and structures marking the highest elevation (peak) of the water surface for a flood event, created by foam, seed, or other debris
• Survey crews deployed after storm to locate and record reliable HWMs
• GPS methods used to determine location for coastal HWMs, which are then mapped on a vertical datum such as NAVD88
• Generally include effects of wave action/wave runup and only a small percentage of HWMs represent still water (storm surge)
High Water Marks
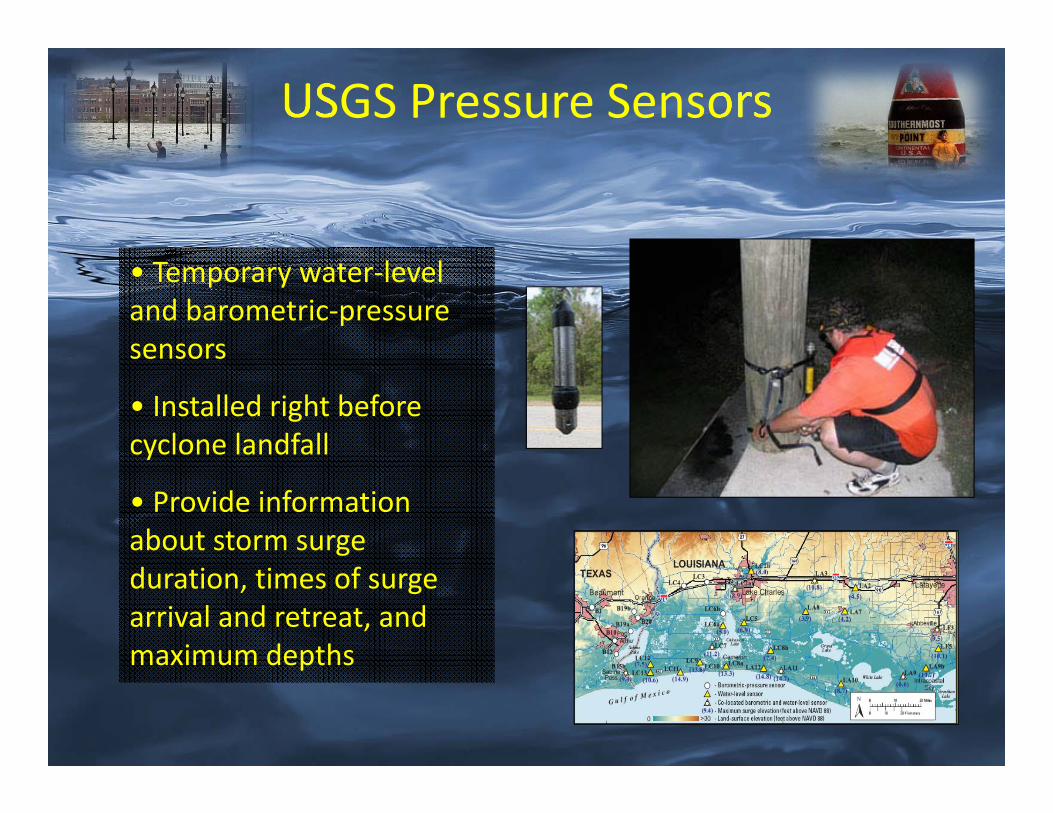
• Temporary water‐level and barometric‐pressure sensors
• Installed right before cyclone landfall
• Provide information about storm surge duration, times of surge arrival and retreat, and maximum depths
USGS Pressure Sensors
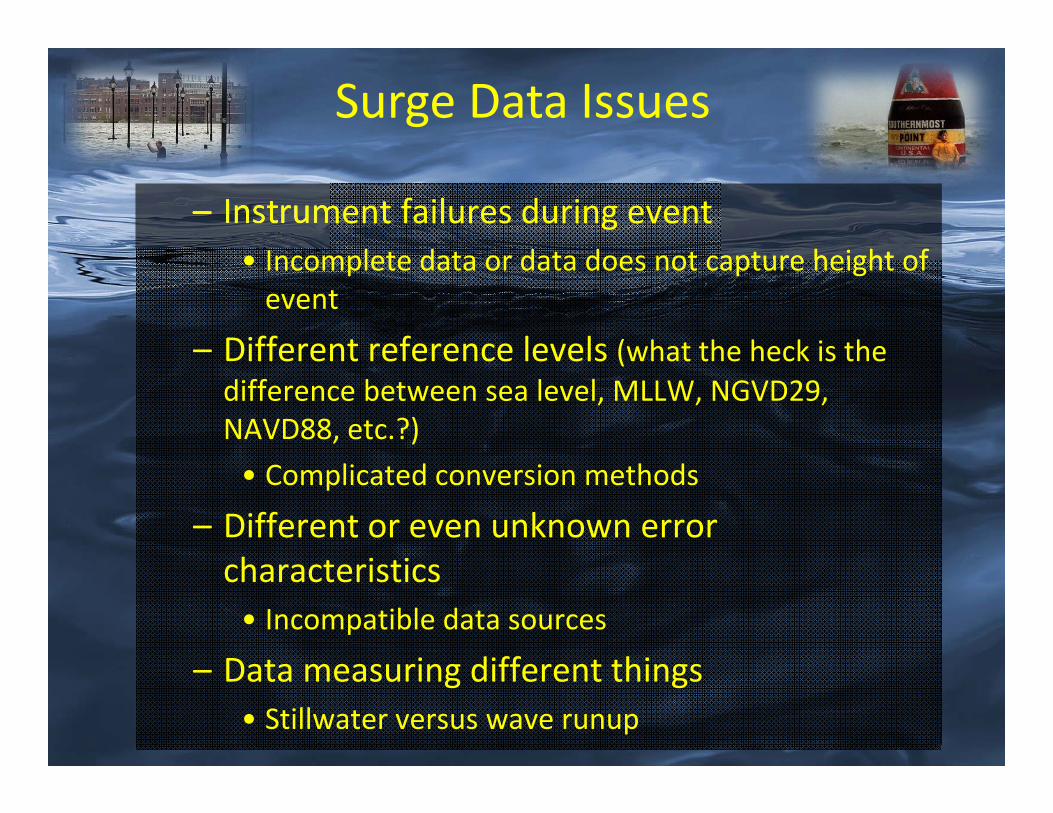
– Instrument failures during event• Incomplete data or data does not capture height of event
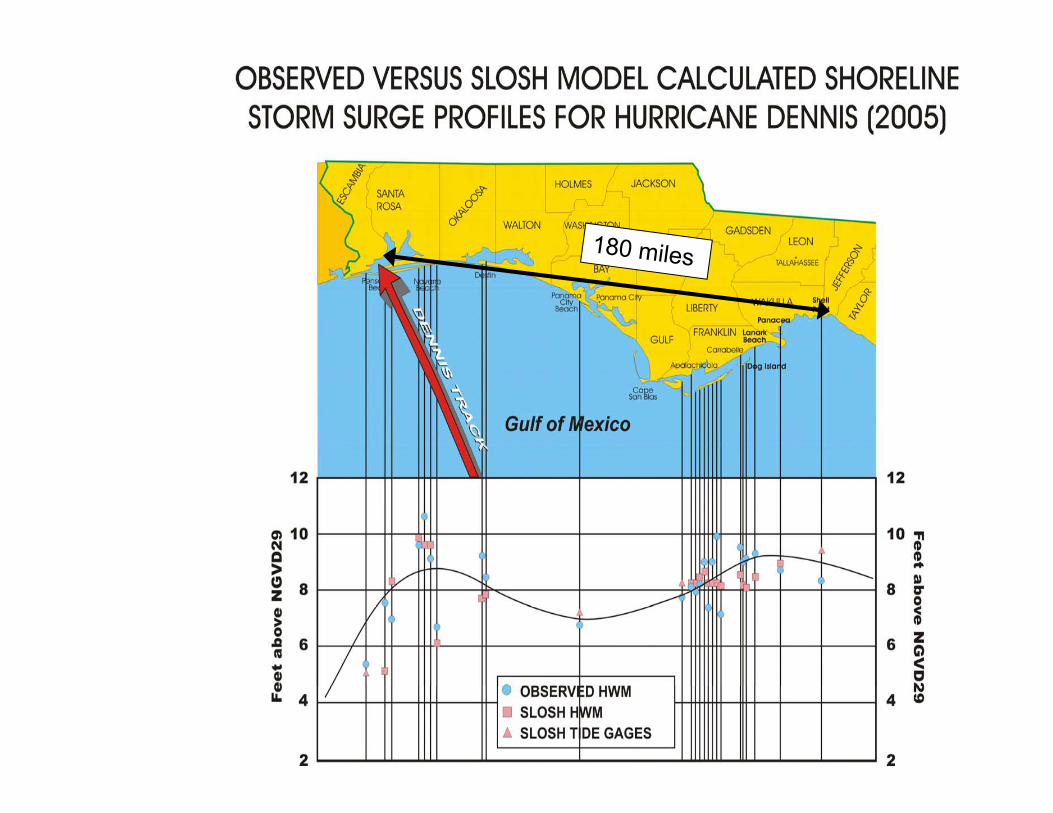
– Different reference levels (what the heck is the difference between sea level, MLLW, NGVD29, NAVD88, etc.?)• Complicated conversion methods
– Different or even unknown error characteristics• Incompatible data sources
– Data measuring different things• Stillwater versus wave runup
Surge Data Issues
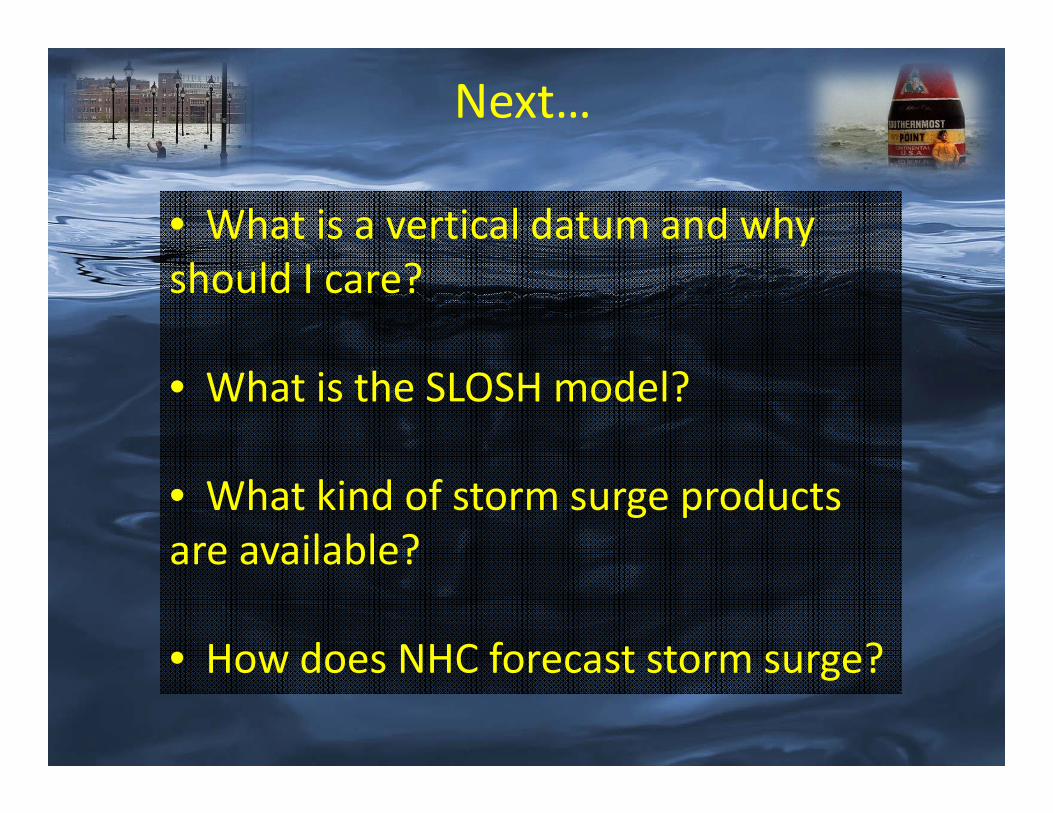
Next…
• What is a vertical datum and why should I care?
• What is the SLOSH model?
• What kind of storm surge products are available?
• How does NHC forecast storm surge?