Embed Size (px)
Citation preview
Monitoring Hurricane Rita Inland Storm Surge
By Benton D. McGee, Roland W. Tollett, and Burl B. Goree
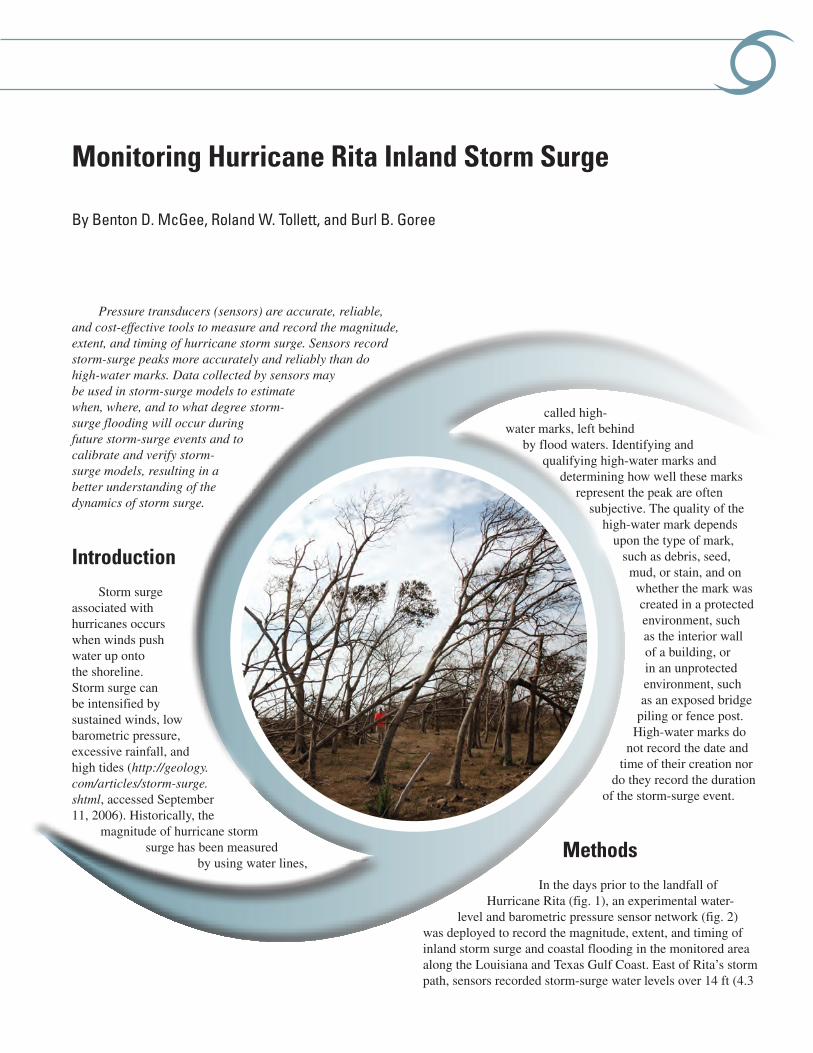
Pressure transducers (sensors) are accurate, reliable, and cost-effective tools to measure and record the magnitude, extent, and timing of hurricane storm surge. Sensors record storm-surge peaks more accurately and reliably than do high-water marks. Data collected by sensors may be used in storm-surge models to estimate when, where, and to what degree storm-surge flooding will occur during future storm-surge events and to calibrate and verify storm-surge models, resulting in a better understanding of the dynamics of storm surge.
IntroductionStorm surge
associated with hurricanes occurs when winds push water up onto the shoreline. Storm surge can be intensified by sustained winds, low barometric pressure, excessive rainfall, and high tides (http://geology.com/articles/storm-surge.shtml, accessed September 11, 2006). Historically, the
magnitude of hurricane storm surge has been measured
by using water lines,
called high-water marks, left behind
by flood waters. Identifying and qualifying high-water marks and
determining how well these marks represent the peak are often
subjective. The quality of the high-water mark depends
upon the type of mark, such as debris, seed, mud, or stain, and on whether the mark was created in a protected environment, such as the interior wall of a building, or in an unprotected environment, such as an exposed bridge
piling or fence post. High-water marks do
not record the date and time of their creation nor
do they record the duration of the storm-surge event.
MethodsIn the days prior to the landfall of
Hurricane Rita (fig. 1), an experimental water-level and barometric pressure sensor network (fig. 2)
was deployed to record the magnitude, extent, and timing of inland storm surge and coastal flooding in the monitored area along the Louisiana and Texas Gulf Coast. East of Rita’s storm path, sensors recorded storm-surge water levels over 14 ft (4.3

258 Science and the Storms: the USGS Response to the Hurricanes of 2005
Gulf of Mexico
Texas
Arkansas
Louisiana
Mississippi
Alabama
FloridaMonitored area
Sept. 23, 2005 10 p.m.Sept. 23, 2005 10 p.m.
Sept. 23, 2005 1 a.m.Sept. 23, 2005 1 a.m.
Sept. 22, 2005 4 a.m.Sept. 22, 2005 4 a.m.
Sept. 24, 2005 10 a.m.Sept. 24, 2005 10 a.m.
N
Figure 1. Map showing path of Hurricane Rita and study area (Hurricane Rita satellite imagery obtained from the National Aeronautics and Space Administration, 2006).

Monitoring Hurricane Rita Inland Storm Surge 259
Figure 2. Map showing locations of storm-surge sensors in southwestern Louisiana and southeastern Texas. Maximum storm-surge elevation measurements are shown in yellow.
LC13
LC12LC11B15b
B12
B20
B19b
B19aB10
B1
LC5
LC6b
LC6a
LC7
LC9
LC8aLC10 LA12 LA11
LA8LA7
LA10
LA9LA9b
LF5
LF3
LA2
LA3
LC2a
LC2b
LC3LC4
LC8b
(6.93)
(9.35)
(7.52)
(10.62)(14.90) (13.82)
(11.15)
(13.34)
(5.04)
(8.93)
(7.38)
(14.83) (14.68)
(8.03)
(3.86)
(10.84)(4.49)
(4.21)
(8.70)(6.62)
(10.73)
(10.07)
(9.52)(6.93)
(9.35)
(7.52)
(10.62)(14.90) (13.82)
(11.15)
(13.34)
(5.04)
(8.93)
(7.38)
(14.83) (14.68)
(8.03)
(3.86)
(10.84)(4.49)
(4.21)
(8.70)(6.62)
(10.73)
(10.07)
(9.52)
Barometric pressure
Water level—Maximum surge elevation, in feet above NAVD 88, shown in parentheses
Barometric pressure and water level—Maximum surge elevation, in feet above NAVD 88, shown in parentheses
Sensor lost to hurricane
LC6b
LC5
LC7
LC10
Data-collection site and identifier, by sensor type
Greater than 30
0
Land-surface elevation, in feet above the North America Vertical Datum of 1988 (NAVD 88)
165
167
96
90
27
8282
14
2727
10
10
49
29º50’
30º10’
94º00’ 93º00’
29º30’
Gulf of Mexico
Sabine
Lake
Calcas
ieuLa
ke Grand Lake
White Lake
Verm
ilion
Lak
e
Beaumont
Orange
Port Arthur
Sabine Pass
Lake Charles
Cameron
IntracoastalCity
Abbeville
Lafayette
TEXAS
LOUISIANA
0 10 20 Kilometers
N0 10 20 Miles

260 Science and the Storms: the USGS Response to the Hurricanes of 2005
m) above the North American Vertical Datum of 1988 (NAVD 88) along the Louisiana Gulf Coast and rates of water-level rise in excess of 5 ft (1.5 m) per hour. Comparisons between high-water marks and water-level data from nearby inundated sensors indicated that the sensors recorded storm-surge peaks more accurately and reliably than did high-water marks. Data collected by the storm-surge sensors may be used in computer models (1) to estimate when, where, and to what degree storm-surge flooding will occur in future events and (2) to calibrate and verify storm-surge models, resulting in a better understanding of the dynamics of storm surge.
The study area was situated east of Rita’s storm path (fig. 1), in the right front quadrant of the storm, where the maximum storm surge was expected to occur. The monitored area covered approximately 4,000 mi2 (10,360 km2) and was generally bounded to the north by Interstate 10 (I-10), to the south by the Louisiana and Texas coastlines, to the east by the Vermilion River, and to the west by the cities of Beaumont, Orange, and Port Arthur, Tex. A total of 47 sensors (34 water-level sensors and 13 barometric pressure sensors) were deployed at 33 sites during September 22–23, 2005, prior to the landfall of Rita (fig. 2). Sensors were deployed along and inland of the Louisiana and Texas coasts, usually along waterways, from Sabine Pass, Tex., through Abbeville, La.
The sensors were unvented pressure transducers capable of measuring and recording three parameters: absolute pressure, temperature, and internal battery voltage. Absolute pressure is the force exerted by air (barometric pressure) or water on the sensor. The force, or weight of water is converted to the height of water (water level) overlying the sensor. Inundated sensors were used to record storm-surge water levels, and noninundated sensors were used to record barometric pressure. Water-level data from inundated sensors were corrected for changes in barometric pressure by using data from a colocated barometric pressure sensor. If a barometric pressure sensor was not colocated with a storm-surge sensor, the data from the nearest barometric pressure sensor were used to correct the storm-surge data.
The sensors recorded temperature and pressure every 30 seconds during the storm and for several days afterwards. The dimensions of the sensors were approximately 6 inches (15.2 cm) in length and 1 inch (2.5 cm) in diameter (fig. 3) and were encased in 1.5 inch (3.8 cm) by 18 inch (45.7 cm) metal pipes and strapped to permanent objects, such as piers and power poles (fig. 4). Storm-surge sensors were deployed on permanent structures at elevations that would likely be inundated by storm surge, and barometric pressure sensors were deployed on permanent structures at elevations that would not likely be inundated by storm surge.
Water-level data from inundated sensors also were corrected for salinity because salinity content increases the density, and therefore the weight, of the water. Corrections for salinity were based upon the location of the sensor in proximity to the coast. In general, sensors located in the southern part of the study area were categorized as measuring
Figure 4. Photograph showing metal pipe containing a water-level sensor or barometric pressure sensor strapped to a power pole.
Figure 3. Photograph showing sensor used to record water level and barometric pressure.
Monitoring Hurricane Rita Inland Storm Surge 261
salt water, sensors located in the northern part of the study area were categorized as measuring freshwater, and sensors located in the middle were categorized as measuring brackish water.
Elevation surveys were conducted to relate all storm-surge data, including water-level data from inundated sensors, high-water marks, and water-surface measurements, to sea level (sea level defined by the NAVD 88) (http://www.ngs.noaa.gov/PUBS_LIB/NAVD88/navd88report.htm, accessed September 11, 2006). Elevation surveys were conducted by using the Global Positioning System and differential levels.
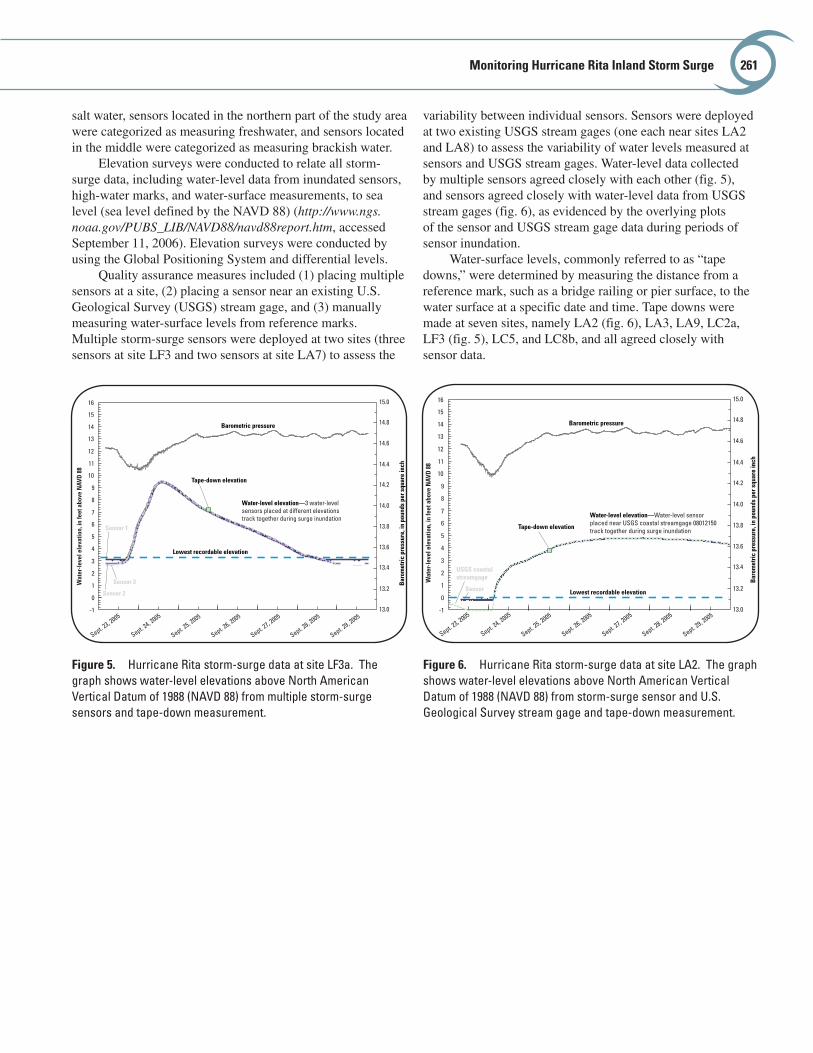
Quality assurance measures included (1) placing multiple sensors at a site, (2) placing a sensor near an existing U.S. Geological Survey (USGS) stream gage, and (3) manually measuring water-surface levels from reference marks. Multiple storm-surge sensors were deployed at two sites (three sensors at site LF3 and two sensors at site LA7) to assess the
variability between individual sensors. Sensors were deployed at two existing USGS stream gages (one each near sites LA2 and LA8) to assess the variability of water levels measured at sensors and USGS stream gages. Water-level data collected by multiple sensors agreed closely with each other (fig. 5), and sensors agreed closely with water-level data from USGS stream gages (fig. 6), as evidenced by the overlying plots of the sensor and USGS stream gage data during periods of sensor inundation.
Water-surface levels, commonly referred to as “tape downs,” were determined by measuring the distance from a reference mark, such as a bridge railing or pier surface, to the water surface at a specific date and time. Tape downs were made at seven sites, namely LA2 (fig. 6), LA3, LA9, LC2a, LF3 (fig. 5), LC5, and LC8b, and all agreed closely with sensor data.
Figure 6. Hurricane Rita storm-surge data at site LA2. The graph shows water-level elevations above North American Vertical Datum of 1988 (NAVD 88) from storm-surge sensor and U.S. Geological Survey stream gage and tape-down measurement.
Lowest recordable elevation
Water-level elevation—Water-level sensorplaced near USGS coastal streamgage 08012150track together during surge inundation
Barometric pressure
Tape-down elevation
14.4
15.0
14.8
14.6
14.2
14.0
13.8
13.6
13.4
13.2
13.0
16
15
14
13
12
11
10
9
8
7
6
5
4
3
2
1
0
-1
Bar
omet
ric
pres
sure
, in
poun
ds p
er s
quar
e in
ch
Wat
er-l
evel
ele
vatio
n, in
feet
abo
ve N
AVD
88
Sept. 23, 2005
Sept. 24, 2005
Sept. 25, 2005
Sept. 26, 2005
Sept. 27, 2005
Sept. 28, 2005
Sept. 29, 2005
Sensor
USGS coastalstreamgage
Figure 5. Hurricane Rita storm-surge data at site LF3a. The graph shows water-level elevations above North American Vertical Datum of 1988 (NAVD 88) from multiple storm-surge sensors and tape-down measurement.
Lowest recordable elevation
Water-level elevation—3 water-levelsensors placed at different elevationstrack together during surge inundation
Barometric pressure
Tape-down elevation
Sept. 23, 2005
Sept. 24, 2005
Sept. 25, 2005
Sept. 26, 2005
Sept. 27, 2005
Sept. 28, 2005
Sept. 29, 2005
Bar
omet
ric
pres
sure
, in
poun
ds p
er s
quar
e in
ch
Wat
er-l
evel
ele
vatio
n, in
feet
abo
ve N
AVD
88
16
15
14
13
12
11
10
9
8
7
6
5
4
3
2
1
0
-1
14.4
15.0
14.8
14.6
14.2
14.0
13.8
13.6
13.4
13.2
13.0
Sensor 1
Sensor 2
Sensor 3
262 Science and the Storms: the USGS Response to the Hurricanes of 2005
Sept. 23, 2005
Sept. 24, 2005
Sept. 25, 2005
Sept. 26, 2005
Sept. 27, 2005
Sept. 28, 2005
Sept. 29, 2005
14.4
15.0
14.8
14.6
14.2
14.0
13.8
13.6
13.4
13.2
13.0
16
15
14
13
12
11
10
9
8
7
6
5
4
3
2
1
0
-1
Wat
er-l
evel
ele
vatio
n, in
feet
abo
ve N
AVD
88
Bar
omet
ric
pres
sure
, in
poun
ds p
er s
quar
e in
ch
Barometric pressure
Water-level elevation
High-water-mark elevation
Lowest recordable elevation
High-water markHigh-water mark
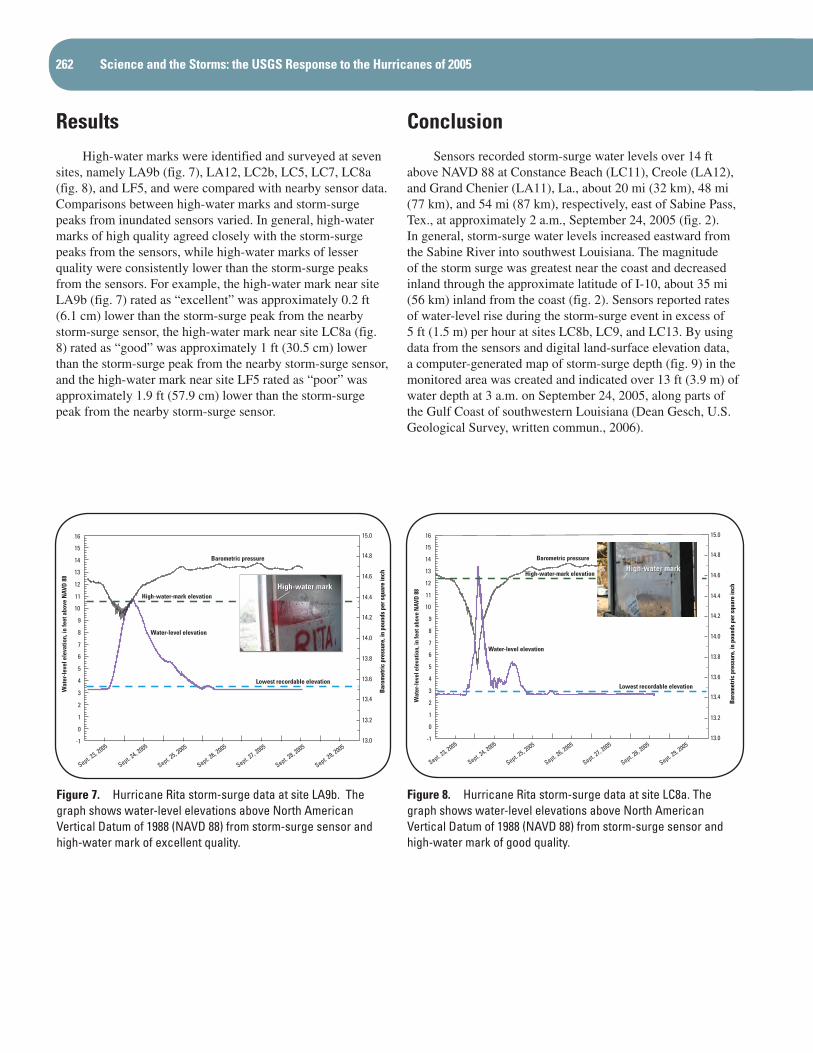
Figure 7. Hurricane Rita storm-surge data at site LA9b. The graph shows water-level elevations above North American Vertical Datum of 1988 (NAVD 88) from storm-surge sensor and high-water mark of excellent quality.
16
15
14
13
12
11
10
9
8
7
6
5
4
3
2
1
0
-1
14.4
15.0
14.8
14.6
14.2
14.0
13.8
13.6
13.4
13.2
13.0B
arom
etri
c pr
essu
re, i
n po
unds
per
squ
are
inch
Wat
er-l
evel
ele
vatio
n, in
feet
abo
ve N
AVD
88
Sept. 23, 2005
Sept. 24, 2005
Sept. 25, 2005
Sept. 26, 2005
Sept. 27, 2005
Sept. 28, 2005
Sept. 29, 2005
Barometric pressure
High-water-mark elevation
Water-level elevation
Lowest recordable elevation
High-water markHigh-water mark
Figure 8. Hurricane Rita storm-surge data at site LC8a. The graph shows water-level elevations above North American Vertical Datum of 1988 (NAVD 88) from storm-surge sensor and high-water mark of good quality.
ResultsHigh-water marks were identified and surveyed at seven
sites, namely LA9b (fig. 7), LA12, LC2b, LC5, LC7, LC8a (fig. 8), and LF5, and were compared with nearby sensor data. Comparisons between high-water marks and storm-surge peaks from inundated sensors varied. In general, high-water marks of high quality agreed closely with the storm-surge peaks from the sensors, while high-water marks of lesser quality were consistently lower than the storm-surge peaks from the sensors. For example, the high-water mark near site LA9b (fig. 7) rated as “excellent” was approximately 0.2 ft (6.1 cm) lower than the storm-surge peak from the nearby storm-surge sensor, the high-water mark near site LC8a (fig. 8) rated as “good” was approximately 1 ft (30.5 cm) lower than the storm-surge peak from the nearby storm-surge sensor, and the high-water mark near site LF5 rated as “poor” was approximately 1.9 ft (57.9 cm) lower than the storm-surge peak from the nearby storm-surge sensor.
ConclusionSensors recorded storm-surge water levels over 14 ft
above NAVD 88 at Constance Beach (LC11), Creole (LA12), and Grand Chenier (LA11), La., about 20 mi (32 km), 48 mi (77 km), and 54 mi (87 km), respectively, east of Sabine Pass, Tex., at approximately 2 a.m., September 24, 2005 (fig. 2). In general, storm-surge water levels increased eastward from the Sabine River into southwest Louisiana. The magnitude of the storm surge was greatest near the coast and decreased inland through the approximate latitude of I-10, about 35 mi (56 km) inland from the coast (fig. 2). Sensors reported rates of water-level rise during the storm-surge event in excess of 5 ft (1.5 m) per hour at sites LC8b, LC9, and LC13. By using data from the sensors and digital land-surface elevation data, a computer-generated map of storm-surge depth (fig. 9) in the monitored area was created and indicated over 13 ft (3.9 m) of water depth at 3 a.m. on September 24, 2005, along parts of the Gulf Coast of southwestern Louisiana (Dean Gesch, U.S. Geological Survey, written commun., 2006).

Monitoring Hurricane Rita Inland Storm Surge 263
Figure 9. Map showing locations of storm-surge sensors and computer-generated storm-surge depth, in feet, on September 24, 2005, at 3 a.m. in southwestern Louisiana and southeastern Texas.
Orange
Barometric pressureWater levelBarometric pressure and water level
Greater than 30
0
LC6bLC5LC7
Greater than 131211109876543210
Storm-surge depth, in feet Land-surface elevation, in feet above the the North America Vertical Datum of 1988 (NAVD 88)
Data-collection site and identifier, by sensor type
N
0 10 20 Kilometers
0 10 20 Miles
LC13
LC12LC11B15b
B12
B20
B19b
B19aB10
B1
LC5
LC6b
LC6a
LC7
LC9
LC8a LA12 LA11
LA8LA7
LA10
LA9 LA9b
LF5
LF3
LA2
LA3
LC2a
LC2b
LC3LC4
LC8b
165
167
96
90
27
8282
14
2727
10
10
49
Gulf of Mexico
Sabine
Lake
Calcas
ieuLa
ke Grand Lake
White Lake
Verm
ilion
Lak
e
Beaumont
Orange
Port Arthur
Sabine Pass
Lake Charles
Cameron
IntracoastalCity
Abbeville
Lafayette
TEXAS
LOUISIANA
29º50’
30º10’
94º00’ 93º00’
29º30’
Contact InformationBenton D. McGee, Supervisory Hydrologist ([email protected]);
Roland W. Tollett, Hydrologist ([email protected]); and Burl B. Goree, Hydrologic Technician ([email protected])
U.S. Department of the InteriorU.S. Geological SurveyLouisiana Water Science Center3535 S. Sherwood Forest Blvd., Suite 120Baton Rouge, LA 70816