Embed Size (px)
Citation preview
Appendix E
Integrated Ecosystem Restoration and Hurricane Protection: Louisiana’s Comprehensive Master Plan for a Sustainable Coast Appendix E: Hurricane Surge Evaluations
Coastal Protection and Restoration Authority of Louisiana
April 2007
Appendix E
i
Table of Contents 1.0 INTRODUCTION ........................................................................................................................................................1
2.0 DATA SOURCE ...........................................................................................................................................................2 2.1 HURRICANE SURGE PARAMETERS FOR ADCIRC........................................................................................................4
2.1.1 Historical Storms ...................................................................................................................................................4 3.0 REFINEMENTS TO CASE1 AND CASE2 .............................................................................................................10
4.0 ASSESSMENT OF CASE1 AND CASE2 RESULTS .............................................................................................11 4.1 OUTPUT POINTS.........................................................................................................................................................11 4.2 COMPARISON OF CASE1 AND CASE2 SURGE HEIGHTS ALONG COAST....................................................................13 4.3 DATUM .....................................................................................................................................................................14
5.0 SELECTION OF CASE1 FOR PLANNING STUDY.............................................................................................15
6.0 MAXIMUM SURGE HEIGHT ELEVATIONS......................................................................................................16 6.1 BRETON SOUND TO COAST EAST OF MISSISSIPPI RIVER ...........................................................................................21 6.2 NORTH SIDE OF LAKE PONTCHARTRAIN ...................................................................................................................22 6.2 NORTH SIDE OF LAKE PONTCHARTRAIN ...................................................................................................................22 6.3 ST. BERNARD PARISH ALONG THE MRGO................................................................................................................23 6.4 WEST BANK PLOT.....................................................................................................................................................24 6.5 HOUMA PLOT............................................................................................................................................................25 6.6 MORGAN CITY PLOT.................................................................................................................................................26 6.7 ABBEVILLE-LAFAYETTE-KAPLAN PLOT ...................................................................................................................27 6.8 LAND BRIDGE BETWEEN GRAND AND WHITE LAKES................................................................................................28 6.9 LAKE CHARLES AREA...............................................................................................................................................29 6.10 SABINE RIVER PLOT..................................................................................................................................................30
7.0 WAVES AND INTERIOR FLOODING ..................................................................................................................31
8.0 EXTRAPOLATION OF ADCIRC RESULTS.........................................................................................................34
9.0 ECONOMIC COMPUTATIONS .............................................................................................................................39
10.0 RISK, RELIABILITY AND UNCERTAINTY........................................................................................................40 10.1 SYSTEM CONDITIONS CONTRIBUTING TO UNCERTAINTY..........................................................................................40 10.2 UNCERTAINTIES IN THE APPLICATION OF ADCIRC ..................................................................................................41
10.2.1 Wind and Pressure Fields................................................................................................................................41 10.2.2 Inaccuracies in the ADCIRC Computations....................................................................................................42 10.2.3 Inaccuracies in Characterizing Natural System..............................................................................................43 10.2.4 Inaccuracies in Hurricane Tracks ...................................................................................................................43 10.2.5 Wind Stress Coefficients ..................................................................................................................................43 10.2.6 Steric Effects....................................................................................................................................................43 10.2.7 Historical Hurricane Data Base......................................................................................................................43 10.2.8 Subsidence .......................................................................................................................................................43 10.2.9 Wave Setup ......................................................................................................................................................44 10.2.10 JPM or EST .....................................................................................................................................................44
Appendix E
ii
List of Figures Figure 4.1: Selected Alignments for Surge Height Profiles ....................................................................................12 Figure 4.2: Case 1 and 2 Surge Heights, Coastal Alignment West of S/W Pass.....................................................13 Figure 6.1: Delta Plain Maximum Surge Elevations for 1% Probability Hurricane ................................................17 Figure 6.2: Chenier Plain Maximum Surge Elevations for 1% Probability Hurricane ............................................18 Figure 6.3: Delta Plain Maximum Surge Elevations for 0.2% Probability Hurricane .............................................19 Figure 6.4: Chenier Plain Maximum Surge Elevations for 0.2% Probability Hurricane .........................................20 Figure 6.5: Case 1 Surge Heights, Coastal Alignment East of S/W Pass..............................................................21 Figure 6.6: Case 1 Surge Height, Pontchartrain Alignment along North Shore......................................................22 Figure 6.7: Case 1 Surge Height, St Bernard Parish Alignment along MRGO.......................................................23 Figure 6.8: Case 1 Surge Height, West Bank Alignment (-90.1 Degrees West).....................................................24 Figure 6.9: Case 1 Surge Height along Houma Alignment (-90.7 Degrees West)..................................................25 Figure 6.10: Case 1 Surge Height along Morgan City Alignment (-91.3 Degrees West) .......................................26 Figure 6.11: Case 1 Surge Height along Abbeville/Lafayette Alignment (-91.95 Degrees West)..........................27 Figure 6.12: Case 1 Surge Height along Gueydan/Mermentau Alignment (-92.5 Degrees West)..........................28 Figure 6.13: Case 1 Surge Height East of Calcasieu Ship Channel (-93.2 Degrees West) .....................................29 Figure 6.14: Case 1 Surge Height along Sabine River (-93.8 Degrees West) .........................................................30 Figure 7.1 through 7.10: Save Points 1 to 172 (STWAVE Southeast grid) (USACE, July 2006)...........................33
List of Tables Table 2.1 Storm Surge Events Considered in this Analysis ......................................................................................4 Table 2.2 Historic Storms..........................................................................................................................................5 Table 2.3 Data in HURDAT for Hurricane Andrew (1)............................................................................................6 Table 2.4 Hypothetical Storms ..................................................................................................................................9 Table 7.1. Summary of Waves and Water Levels for Modeling Alignment 1 (USACE, July 2006, Table L-8).....32 Table 10.1 Sources of Uncertainties in the Overall Process and Their Significance (from Enclosure F, USACE
Report to Congress, July 2006) ............................................................................................................42
Appendix E
1
1.0 Introduction In the development of the Comprehensive Coast Protection Master Plan it is vital to have an appreciation of the levels of storm surge flooding risk to coastal Louisiana. For planning purposes, modeling of storm surge propagation for a number of hypothetical hurricane events and paths is one of the most effective methods to estimate surge levels to develop the storm protection strategy.
As part of plan appraisal, both the economic analysis and the selection of levee heights require information on water surface elevations resulting from the hurricane event. Four different processes must be considered in arriving at those elevations. They are:
1) The maximum hurricane-surge water surface elevation for a given annual reoccurrence interval; 2) The wave heights superimposed on surge elevations; 3) Interior flooding elevations due to rainfall-runoff inside of the protected area; and 4) The flood runoff hydrograph entering the protected area from the watershed upstream.
The economic analysis depends on all four of these processes. The hurricane protection levees are dominated by the first two.
The remainder of this Appendix describes the origin, processing and outputs of the hurricane surge data used in developing the Master Plan. Section 2 describes the raw data used for this analysis. Section 3 then sets out the refinements made to the data. Section 4 presents the assessment of CASE1 and CASE2 data. The rationale behind the choice of the final datasets used for the surge analysis is given in Section 5. Section 6 describes the maximum surge elevation outputs from the data. Sections 7 through 9 describe the wave and interior flooding analyses, extrapolation of the results, and the link to the economic analysis undertaken using these results. Section 10 addresses uncertainty in the results.
Appendix E
2
2.0 Data Source The New Orleans District of the USACE provided water surface elevations for hurricane events based upon preliminary computational modeling studies provided to CPRA-IPT. The hurricane surge elevations were computed using the Advanced CIRCulation (ADCIRC) computer program (Luettich, Westerink, and Scheffner, 1992). Two datasets were provided, entitled CASE1 and CASE2, representing two complete sets of hurricane surge predictions for a number of event probabilities.
The ADCIRC results contained only surge height elevations. Hypothetical events YR5SURGE through YR500SURGE give the maximum surge height across the state, where YR5 and YR500 correspond to the annual probability of 2.0 percent and 0.2 percent, respectively, that the height will be equaled or exceeded. The historical events give surge heights along the historical tracks. Although these specific cases are not described by name in the documents, the general procedures for surge and wave computations were given in Enclosure F of the US Army Corps of Engineers Report to Congress (USACE, 2006) and in the draft of a report being prepared for the New Orleans District by the Engineering Research and Development Center (ERDC DRAFT, July 2006). According to the ERDC draft report:
“The ADCIRC numerical model was chosen for simulating the long-wave hydrodynamic processes in the study area. When imposing the wind and atmospheric pressure fields, the ADCIRC model can accurately replicate tide induced and storm-surge water levels and currents. The ADCIRC model was developed in the USACE Dredging Research Program (DRP) as a family of two- and three-dimensional finite element-based models (Luettich, Westerink, and Scheffner 1992; Westerink et al. 1992). An important[feature] of the model is that it can simulate tidal circulation and storm-surge propagation over very large computational domains while simultaneously providing high resolution in areas of complex shoreline configuration and bathymetry. In two dimensions, the model is formulated using the depth-averaged shallow water equations for conservation of mass and momentum. Furthermore, the formulation assumes that the water is incompressible, hydrostatic pressure conditions exist, and that the Boussinesq approximation is valid.”
The difference between CASE1 and CASE2 is the length of record used in the statistical analysis (Personal communication with Mr. Carl Anderson, MVN-PM). The CASE1 study utilized storms from 1893 to 2005. The CASE2 period of record was extended backward to 1853.
The storm parameters for both CASE1 and CASE2 hurricane surges were computed using the “Empirical Simulation Technique” (EST) (ERDC DRAFT, July 2006). According to the Coastal and Hydraulics Lab, ERDC, Vicksburg, MS, “This technique assumes [that] the best information is local to the site and utilizes historical storms in the computation. EST uses re-sampling/bootstrap methods to estimate variability (non-parametric), and it uses hypothetical storms to help smooth effects from single large storms in the data set (judgment). EST can accommodate coupled wave-surge models since typically only a small set of events is needed for the computation.” (“Estimating Storm Frequency,” Hurricane Protection Design Workshop, December 20-21, 2005, USACE 2006, Appendix E). Appendix B in the ERDC DRAFT (July 2006) summarizes the Empirical Simulation Technique as follows:
“The Empirical Simulation Technique (EST) or the extended “bootstrap” approach is a statistical resampling, nearest neighbor, random-walk interpolation technique that uses historical data to develop joint probability relationships among the various measured storm parameters. There are no simplifying assumptions concerning the development of probability density functions describing historical events. Thus, the interdependence of
Appendix E
3
parameters is maintained. In this manner, parameter probabilities are site specific, do not depend on fixed parametric relationships, and do not assume parameter independence. Thus, the EST is distribution free and nonparametric. The EST was first developed to model multi-parameter events such as tropical hurricanes, in which storms can be described in terms of defined storm parameters such as central pressure deficit, radius to maximum winds, maximum winds, minimum distance from the eye of the storm to the location of interest, forward speed of the eye, and tidal phase during the storm event. The extratropical storm events (westerlies) modeled during this study are not well represented by such a parameterization and as such the one-dimensional version of has been adopted. A complete description of the EST may be found in Scheffner and Borgman (1992), Borgman et al. (1992) and Scheffner et al. (1999). The only assumption in the EST is that future events will be statistically similar in magnitude and frequency to past events. The 1D EST begins with an analysis of historical events that have impacted the region of interest. Fort each event, a storm response is defined for which a frequency-of-occurrence analysis is performed. In the present application, the response is the maximum water-surface elevation induced by the storm, which includes the storm surge computed via ADCIRC, the additional water level increases due to atmospheric pressure (inverted barometer), and the tides. Implementation of the 1D EST begins with the selection of a subset of storm events that is representative of the entire set of historical storms. This subset is referred to as the “training set.” The training set usually includes historical events but may include historical storms with a deviation or perturbation, such as a storm with a slightly altered path. Some historical events may also be deleted from the training set if two events are nearly identical such that both would produce the same response. Because the purpose is to fill the parameter space, two similar events are redundant. The training set can be augmented with additional storms contained in the historical data set. Storm events augmenting the training set are referred to as the “statistical set” of storms. Whereas numerical models are used for generating response vectors for those events in the training set, response vectors for the statistical set of storms are interpolated using the training set response vectors. Thus, stage-frequency relationships can be generated using the entire historical data set without need of simulating all storms in that data set.”
The hypothetical storms having a probability greater than 1 percent of being equaled or exceeded in any given year were not used in the CPRA-IPT analysis for the following reasons. First, the Federal Emergency Management Agency (FEMA) would not certify levee protection for these more probable events. Secondly, existing levees prevent the higher probability events from damaging concentrated assets. The two storm events that were used in the comparison of CASE1 and CASE2 are listed in Table 2.1.
Appendix E
4
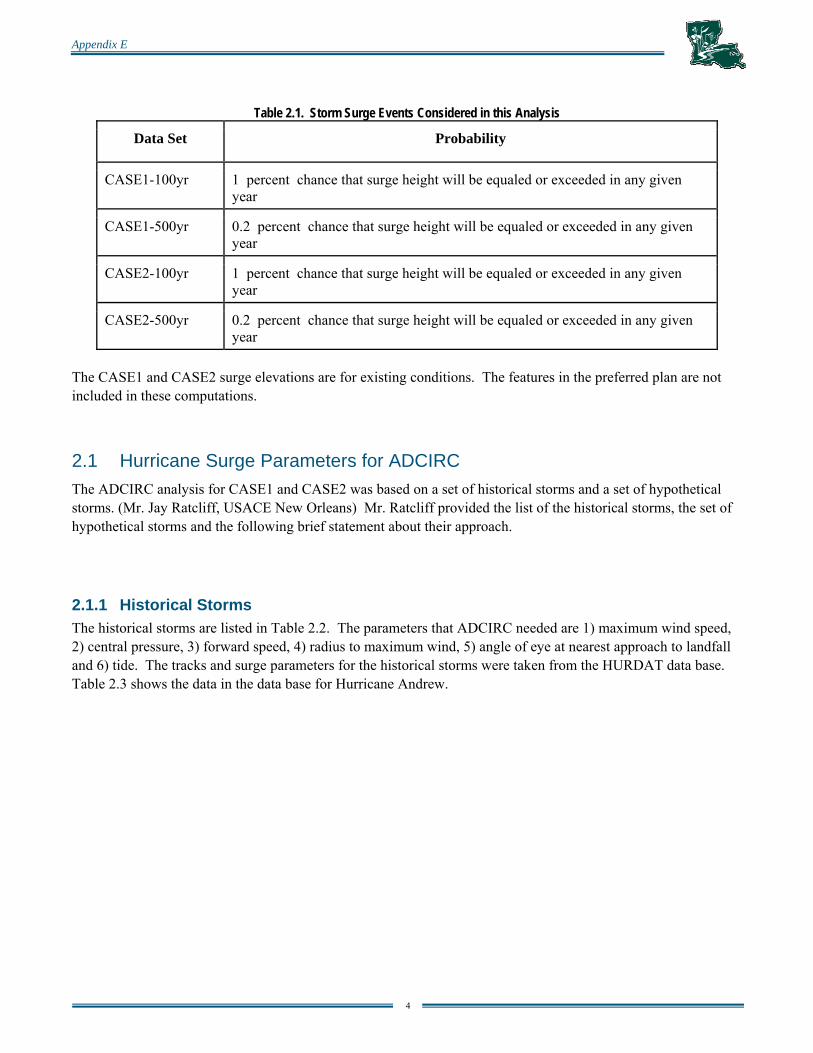
Table 2.1. Storm Surge Events Considered in this Analysis
Data Set Probability
CASE1-100yr 1 percent chance that surge height will be equaled or exceeded in any given year
CASE1-500yr 0.2 percent chance that surge height will be equaled or exceeded in any given year
CASE2-100yr 1 percent chance that surge height will be equaled or exceeded in any given year
CASE2-500yr 0.2 percent chance that surge height will be equaled or exceeded in any given year
The CASE1 and CASE2 surge elevations are for existing conditions. The features in the preferred plan are not included in these computations.
2.1 Hurricane Surge Parameters for ADCIRC The ADCIRC analysis for CASE1 and CASE2 was based on a set of historical storms and a set of hypothetical storms. (Mr. Jay Ratcliff, USACE New Orleans) Mr. Ratcliff provided the list of the historical storms, the set of hypothetical storms and the following brief statement about their approach.
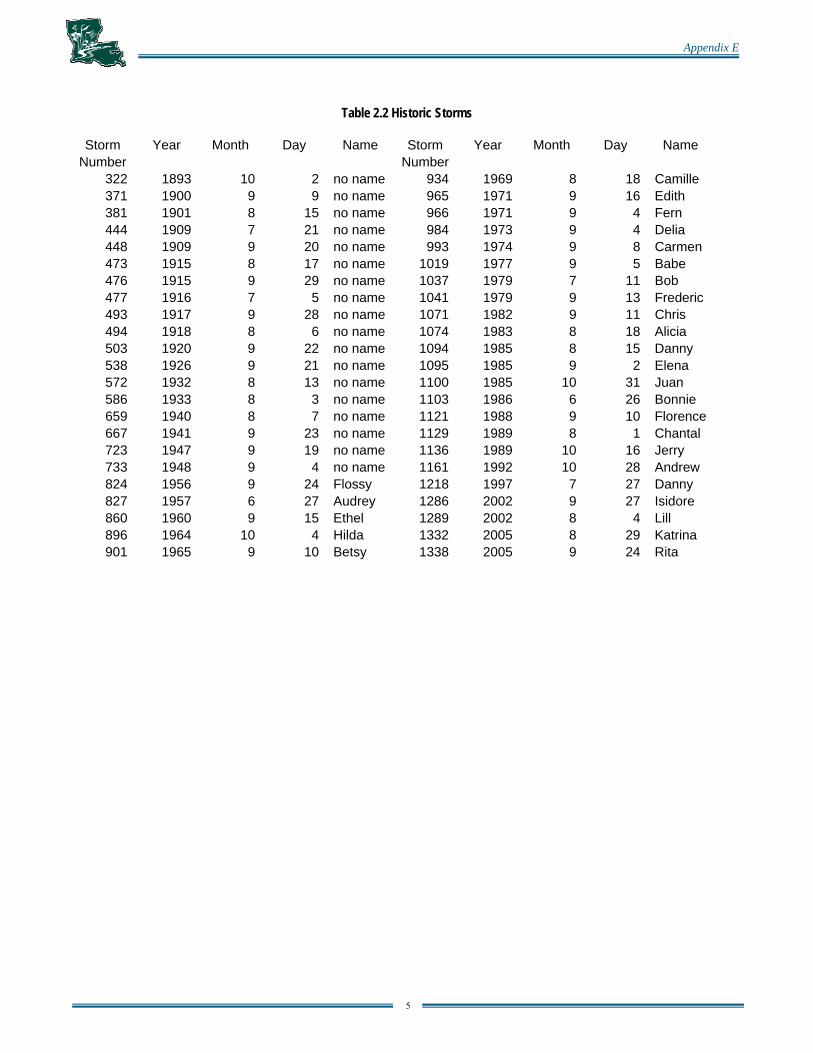
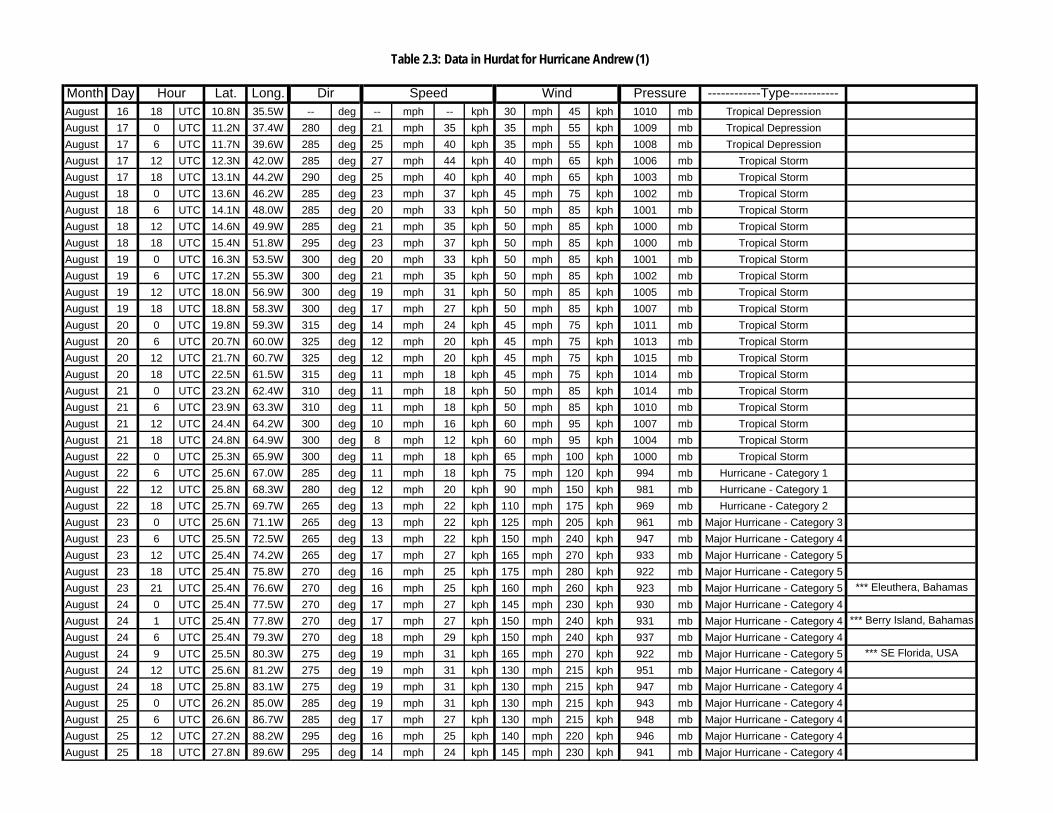
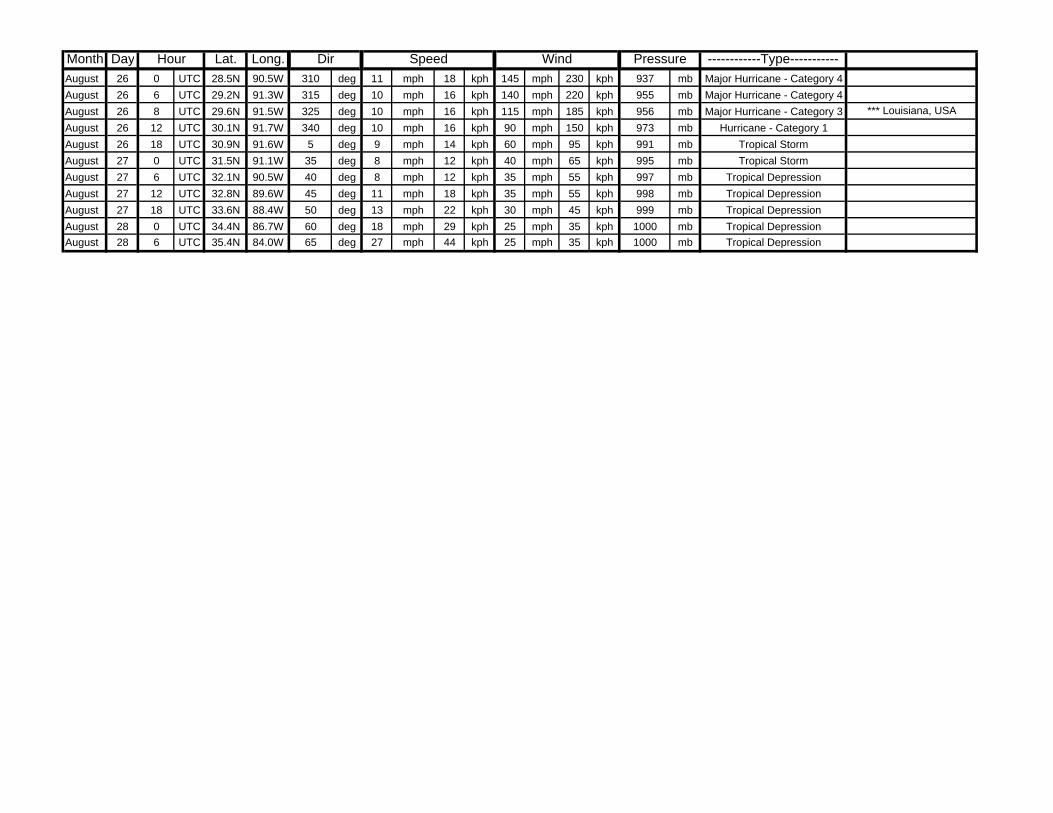
2.1.1 Historical Storms The historical storms are listed in Table 2.2. The parameters that ADCIRC needed are 1) maximum wind speed, 2) central pressure, 3) forward speed, 4) radius to maximum wind, 5) angle of eye at nearest approach to landfall and 6) tide. The tracks and surge parameters for the historical storms were taken from the HURDAT data base. Table 2.3 shows the data in the data base for Hurricane Andrew.
Appendix E
5
Table 2.2 Historic Storms
Storm Year Month Day Name Storm Year Month Day Name Number Number
322 1893 10 2 no name 934 1969 8 18 Camille 371 1900 9 9 no name 965 1971 9 16 Edith 381 1901 8 15 no name 966 1971 9 4 Fern 444 1909 7 21 no name 984 1973 9 4 Delia 448 1909 9 20 no name 993 1974 9 8 Carmen 473 1915 8 17 no name 1019 1977 9 5 Babe 476 1915 9 29 no name 1037 1979 7 11 Bob 477 1916 7 5 no name 1041 1979 9 13 Frederic 493 1917 9 28 no name 1071 1982 9 11 Chris 494 1918 8 6 no name 1074 1983 8 18 Alicia 503 1920 9 22 no name 1094 1985 8 15 Danny 538 1926 9 21 no name 1095 1985 9 2 Elena 572 1932 8 13 no name 1100 1985 10 31 Juan 586 1933 8 3 no name 1103 1986 6 26 Bonnie 659 1940 8 7 no name 1121 1988 9 10 Florence667 1941 9 23 no name 1129 1989 8 1 Chantal 723 1947 9 19 no name 1136 1989 10 16 Jerry 733 1948 9 4 no name 1161 1992 10 28 Andrew 824 1956 9 24 Flossy 1218 1997 7 27 Danny 827 1957 6 27 Audrey 1286 2002 9 27 Isidore 860 1960 9 15 Ethel 1289 2002 8 4 Lill 896 1964 10 4 Hilda 1332 2005 8 29 Katrina 901 1965 9 10 Betsy 1338 2005 9 24 Rita
Month Day Lat. Long. ------------Type-----------August 16 18 UTC 10.8N 35.5W -- deg -- mph -- kph 30 mph 45 kph 1010 mb Tropical DepressionAugust 17 0 UTC 11.2N 37.4W 280 deg 21 mph 35 kph 35 mph 55 kph 1009 mb Tropical DepressionAugust 17 6 UTC 11.7N 39.6W 285 deg 25 mph 40 kph 35 mph 55 kph 1008 mb Tropical DepressionAugust 17 12 UTC 12.3N 42.0W 285 deg 27 mph 44 kph 40 mph 65 kph 1006 mb Tropical StormAugust 17 18 UTC 13.1N 44.2W 290 deg 25 mph 40 kph 40 mph 65 kph 1003 mb Tropical StormAugust 18 0 UTC 13.6N 46.2W 285 deg 23 mph 37 kph 45 mph 75 kph 1002 mb Tropical StormAugust 18 6 UTC 14.1N 48.0W 285 deg 20 mph 33 kph 50 mph 85 kph 1001 mb Tropical StormAugust 18 12 UTC 14.6N 49.9W 285 deg 21 mph 35 kph 50 mph 85 kph 1000 mb Tropical StormAugust 18 18 UTC 15.4N 51.8W 295 deg 23 mph 37 kph 50 mph 85 kph 1000 mb Tropical StormAugust 19 0 UTC 16.3N 53.5W 300 deg 20 mph 33 kph 50 mph 85 kph 1001 mb Tropical StormAugust 19 6 UTC 17.2N 55.3W 300 deg 21 mph 35 kph 50 mph 85 kph 1002 mb Tropical StormAugust 19 12 UTC 18.0N 56.9W 300 deg 19 mph 31 kph 50 mph 85 kph 1005 mb Tropical StormAugust 19 18 UTC 18.8N 58.3W 300 deg 17 mph 27 kph 50 mph 85 kph 1007 mb Tropical StormAugust 20 0 UTC 19.8N 59.3W 315 deg 14 mph 24 kph 45 mph 75 kph 1011 mb Tropical StormAugust 20 6 UTC 20.7N 60.0W 325 deg 12 mph 20 kph 45 mph 75 kph 1013 mb Tropical StormAugust 20 12 UTC 21.7N 60.7W 325 deg 12 mph 20 kph 45 mph 75 kph 1015 mb Tropical StormAugust 20 18 UTC 22.5N 61.5W 315 deg 11 mph 18 kph 45 mph 75 kph 1014 mb Tropical StormAugust 21 0 UTC 23.2N 62.4W 310 deg 11 mph 18 kph 50 mph 85 kph 1014 mb Tropical StormAugust 21 6 UTC 23.9N 63.3W 310 deg 11 mph 18 kph 50 mph 85 kph 1010 mb Tropical StormAugust 21 12 UTC 24.4N 64.2W 300 deg 10 mph 16 kph 60 mph 95 kph 1007 mb Tropical StormAugust 21 18 UTC 24.8N 64.9W 300 deg 8 mph 12 kph 60 mph 95 kph 1004 mb Tropical StormAugust 22 0 UTC 25.3N 65.9W 300 deg 11 mph 18 kph 65 mph 100 kph 1000 mb Tropical StormAugust 22 6 UTC 25.6N 67.0W 285 deg 11 mph 18 kph 75 mph 120 kph 994 mb Hurricane - Category 1August 22 12 UTC 25.8N 68.3W 280 deg 12 mph 20 kph 90 mph 150 kph 981 mb Hurricane - Category 1August 22 18 UTC 25.7N 69.7W 265 deg 13 mph 22 kph 110 mph 175 kph 969 mb Hurricane - Category 2August 23 0 UTC 25.6N 71.1W 265 deg 13 mph 22 kph 125 mph 205 kph 961 mb Major Hurricane - Category 3August 23 6 UTC 25.5N 72.5W 265 deg 13 mph 22 kph 150 mph 240 kph 947 mb Major Hurricane - Category 4August 23 12 UTC 25.4N 74.2W 265 deg 17 mph 27 kph 165 mph 270 kph 933 mb Major Hurricane - Category 5August 23 18 UTC 25.4N 75.8W 270 deg 16 mph 25 kph 175 mph 280 kph 922 mb Major Hurricane - Category 5August 23 21 UTC 25.4N 76.6W 270 deg 16 mph 25 kph 160 mph 260 kph 923 mb Major Hurricane - Category 5 *** Eleuthera, BahamasAugust 24 0 UTC 25.4N 77.5W 270 deg 17 mph 27 kph 145 mph 230 kph 930 mb Major Hurricane - Category 4August 24 1 UTC 25.4N 77.8W 270 deg 17 mph 27 kph 150 mph 240 kph 931 mb Major Hurricane - Category 4 *** Berry Island, BahamasAugust 24 6 UTC 25.4N 79.3W 270 deg 18 mph 29 kph 150 mph 240 kph 937 mb Major Hurricane - Category 4August 24 9 UTC 25.5N 80.3W 275 deg 19 mph 31 kph 165 mph 270 kph 922 mb Major Hurricane - Category 5 *** SE Florida, USAAugust 24 12 UTC 25.6N 81.2W 275 deg 19 mph 31 kph 130 mph 215 kph 951 mb Major Hurricane - Category 4August 24 18 UTC 25.8N 83.1W 275 deg 19 mph 31 kph 130 mph 215 kph 947 mb Major Hurricane - Category 4August 25 0 UTC 26.2N 85.0W 285 deg 19 mph 31 kph 130 mph 215 kph 943 mb Major Hurricane - Category 4August 25 6 UTC 26.6N 86.7W 285 deg 17 mph 27 kph 130 mph 215 kph 948 mb Major Hurricane - Category 4August 25 12 UTC 27.2N 88.2W 295 deg 16 mph 25 kph 140 mph 220 kph 946 mb Major Hurricane - Category 4August 25 18 UTC 27.8N 89.6W 295 deg 14 mph 24 kph 145 mph 230 kph 941 mb Major Hurricane - Category 4
Table 2.3: Data in Hurdat for Hurricane Andrew (1)
PressureHour Dir WindSpeed
Month Day Lat. Long. ------------Type-----------PressureHour Dir WindSpeedAugust 26 0 UTC 28.5N 90.5W 310 deg 11 mph 18 kph 145 mph 230 kph 937 mb Major Hurricane - Category 4August 26 6 UTC 29.2N 91.3W 315 deg 10 mph 16 kph 140 mph 220 kph 955 mb Major Hurricane - Category 4August 26 8 UTC 29.6N 91.5W 325 deg 10 mph 16 kph 115 mph 185 kph 956 mb Major Hurricane - Category 3 *** Louisiana, USAAugust 26 12 UTC 30.1N 91.7W 340 deg 10 mph 16 kph 90 mph 150 kph 973 mb Hurricane - Category 1August 26 18 UTC 30.9N 91.6W 5 deg 9 mph 14 kph 60 mph 95 kph 991 mb Tropical StormAugust 27 0 UTC 31.5N 91.1W 35 deg 8 mph 12 kph 40 mph 65 kph 995 mb Tropical StormAugust 27 6 UTC 32.1N 90.5W 40 deg 8 mph 12 kph 35 mph 55 kph 997 mb Tropical DepressionAugust 27 12 UTC 32.8N 89.6W 45 deg 11 mph 18 kph 35 mph 55 kph 998 mb Tropical DepressionAugust 27 18 UTC 33.6N 88.4W 50 deg 13 mph 22 kph 30 mph 45 kph 999 mb Tropical DepressionAugust 28 0 UTC 34.4N 86.7W 60 deg 18 mph 29 kph 25 mph 35 kph 1000 mb Tropical DepressionAugust 28 6 UTC 35.4N 84.0W 65 deg 27 mph 44 kph 25 mph 35 kph 1000 mb Tropical Depression

Appendix E
8
“Hurricane Camille, one of the most intense and destructive storms ever, struck the Mississippi Gulf Coast, but severely affected the lower Louisiana delta region. Camille had a central pressure of 26.61 inches and an average forward speed of about 13 knots. This storm made landfall just east of the Louisiana state line on August 18, 1969. As a Saffir-Simpson category 5 storm, Camille’s maximum winds were estimated at 160 mph with gusts up to 200 mph. Peak stages include 11.1 feet, NGVD, at Shell Beach on 17 August and 10.0 feet, NGVD, at GIWW at Paris Road Bridge in the Mississippi River Gulf Outlet (MRGO) on 18 August. In Lake Pontchartrain at West End, a peak stage of 5.2 feet, NGVD, was recorded.
Hurricane Katrina made landfall as a category 4 storm in Plaquemines Parish just south of Buras with 140 mph winds on 29 August 2005 with gusts to over 100 mph in New Orleans. Katrina made a second landfall near the Louisiana/Mississippi state line approximately 4 hours later as a category 3 storm with maximum winds of 125 mph. Precipitation analysis from NOAA’s Climate Prediction Center show that rainfall accumulations exceeded 8-10 inches along much of Katrina’s path. Katrina flooded virtually all of Plaquemines Parish and St. Bernard Parish. Several floodwalls failed in Orleans Parish along with levees being overtopped in New Orleans East resulting in flooding 80% of the parish. Katrina produced catastrophic damage and untold casualties in the New Orleans area and along the Mississippi Gulf Coast. NWS SLOSH models showed a forecast surge of over 17 ft along a portion of the Louisiana coast. Preliminary measurements of the surge from Hurricane Katrina are about 18 ft along the Mississippi River Gulf Outlet, east of New Orleans. On Mississippi River at New Orleans, the stage rose from about 2 feet, NGVD, to 15.50 feet, NGVD. (USACE, 2005).
Less than one month after Katrina made landfall in southeastern Louisiana, Hurricane Rita came ashore in southwestern Louisiana. Rita made landfall early on 24 September just east of the Texas/Louisiana state line near Johnson’s Bayou as a category 3 storm with 120 mph winds. Rita caused devastating storm surge flooding and wind damage in coastal Louisiana and extreme southeastern Texas.
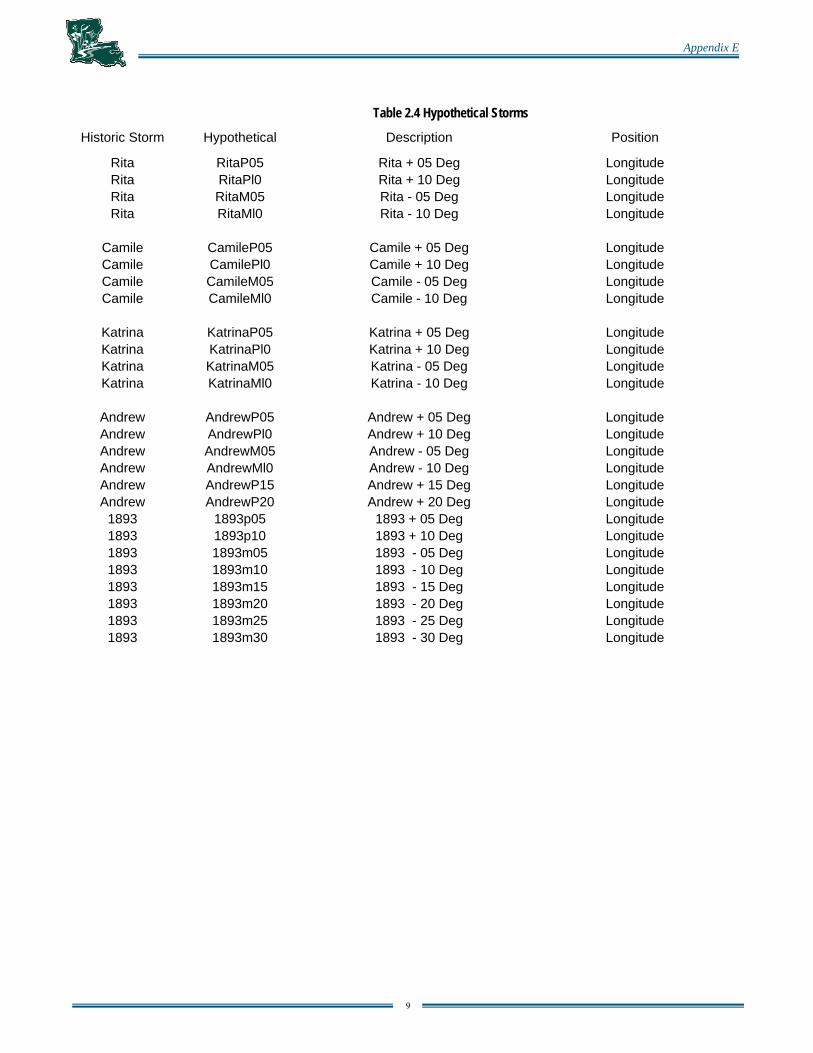
The set of hypothetical storms is shown in Table 2.4. These were developed from the historical storms by varying the landfall parameter and tide. Other parameters are the same as the historical storms. “The angle and tide data are specific to each point location analyzed and we analyzed thousands of points and these data files are very large.” (Mr. Jay Ratcliff, USACE New Orleans)
Appendix E
9
Table 2.4 Hypothetical Storms
Historic Storm Hypothetical Description Position
Rita RitaP05 Rita + 05 Deg Longitude Rita RitaPl0 Rita + 10 Deg Longitude Rita RitaM05 Rita - 05 Deg Longitude Rita RitaMl0 Rita - 10 Deg Longitude
Camile CamileP05 Camile + 05 Deg Longitude Camile CamilePl0 Camile + 10 Deg Longitude Camile CamileM05 Camile - 05 Deg Longitude Camile CamileMl0 Camile - 10 Deg Longitude
Katrina KatrinaP05 Katrina + 05 Deg Longitude Katrina KatrinaPl0 Katrina + 10 Deg Longitude Katrina KatrinaM05 Katrina - 05 Deg Longitude Katrina KatrinaMl0 Katrina - 10 Deg Longitude
Andrew AndrewP05 Andrew + 05 Deg Longitude Andrew AndrewPl0 Andrew + 10 Deg Longitude Andrew AndrewM05 Andrew - 05 Deg Longitude Andrew AndrewMl0 Andrew - 10 Deg Longitude Andrew AndrewP15 Andrew + 15 Deg Longitude Andrew AndrewP20 Andrew + 20 Deg Longitude
1893 1893p05 1893 + 05 Deg Longitude 1893 1893p10 1893 + 10 Deg Longitude 1893 1893m05 1893 - 05 Deg Longitude 1893 1893m10 1893 - 10 Deg Longitude 1893 1893m15 1893 - 15 Deg Longitude 1893 1893m20 1893 - 20 Deg Longitude 1893 1893m25 1893 - 25 Deg Longitude 1893 1893m30 1893 - 30 Deg Longitude
Appendix E
10
3.0 Refinements to CASE1 and CASE2 When the USACE provided the CASE1 and CASE2 data sets, USACE representatives cautioned that the datasets were the best available at the time (August 2006). However, this data will not be the final data sets available for planning efforts. A new ADCIRC study is underway to refine the surge and wave heights along the coast of Louisiana.
The USACE is refining both its method for computing the probability of surge heights and the resolution of the model grid. The interaction between surge height and waves was included in CASE1 and CASE2 studies by computing the values externally and adding them to the ADCIRC input data file for the next iteration. In the new study, those interactions will be computed automatically. The new computations will use more storm tracks and more angles with the coastline then was used in the CASE1 and CASE2 analyses (IPET, 10 March 2006).
Appendix E
11
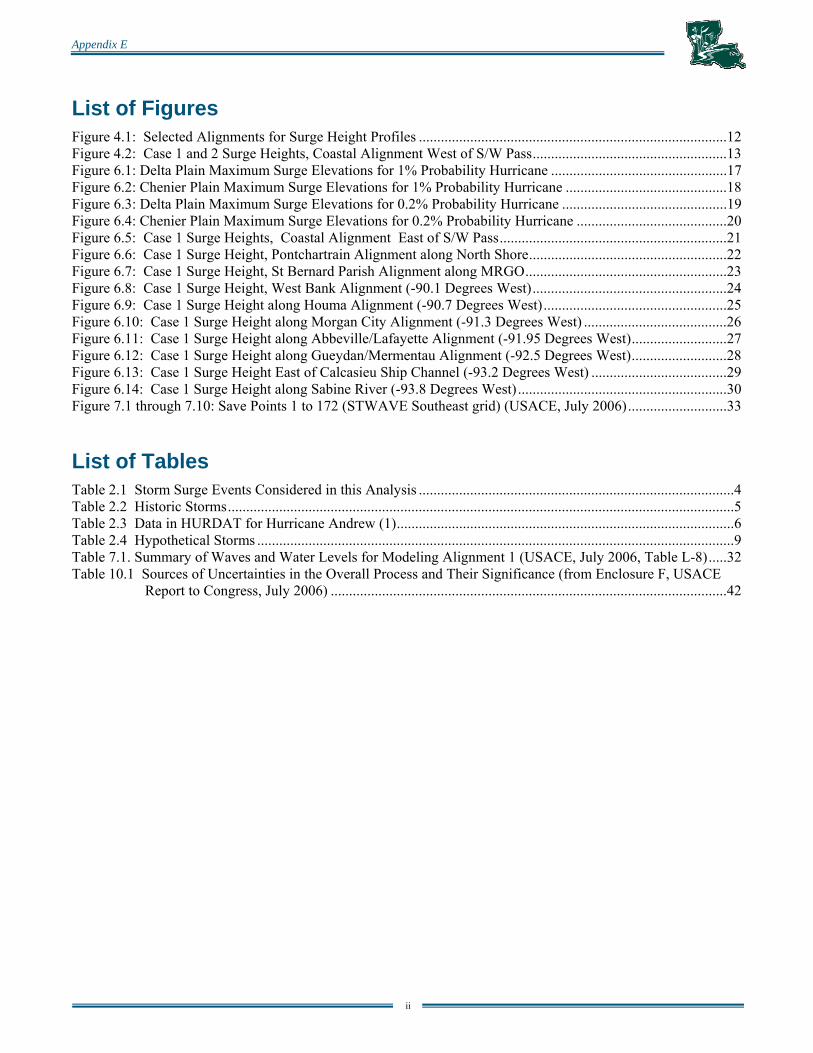
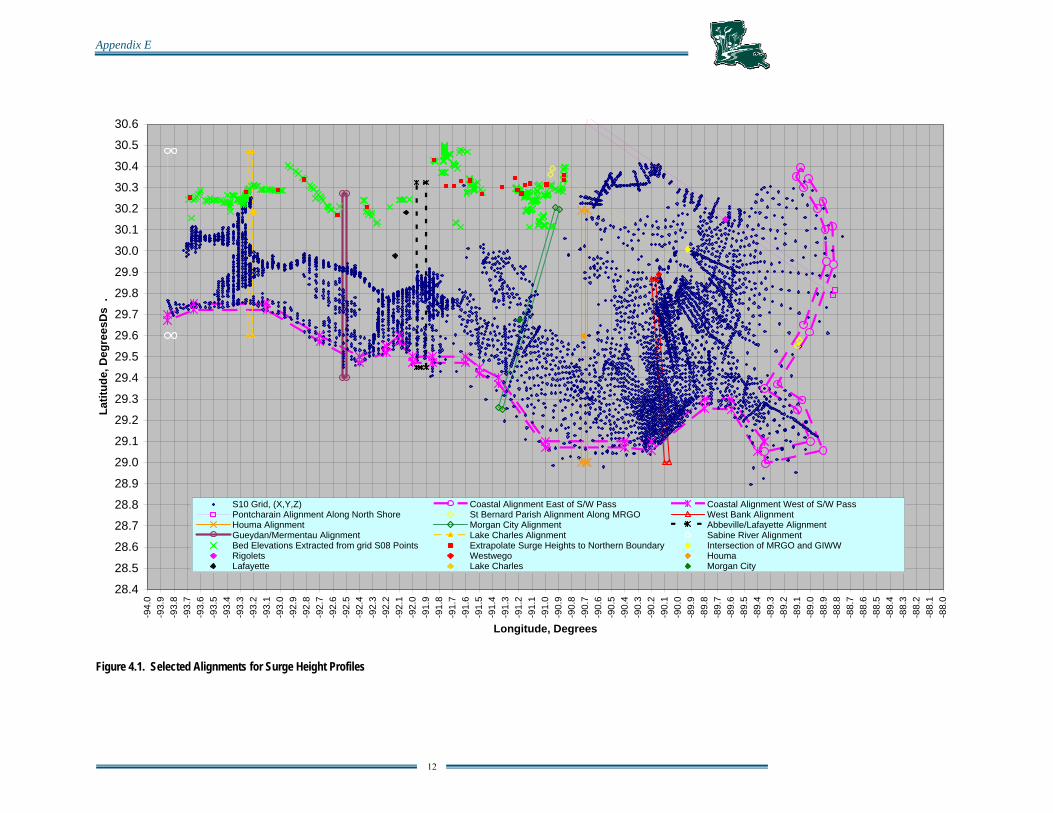
4.0 Assessment of CASE1 and CASE2 Results 4.1 Output points The computed surge heights were extracted from the ADCIRC results at 4,800 grid points. These are shown in Figure 4.1. The grid points start just offshore and extend to the northern limits of the ADCIRC grid. The computations used grid S10 (personal communication, Mr. Vann Stutts, MVN-ED-H). The present bird’s foot delta is the prominent feature in the southeast corner of this figure. It lies between 89.0 and 89.5 degrees West Longitude and between 28.8 and 29.4 degrees North Latitude.
Profiles of the maximum computed elevations of CASE1 and CASE2 surges were needed along the coastline to compare the two results. Shape polygons are laid out on Figure 4-1 to show where those elevations would be extracted from the data base. The coastline is divided into two parts by the Southwest Pass of the Mississippi River. The shape polygon labeled “Coastal Alignment West of S/W Pass” encloses the grid points from the Texas State line to S/W Pass at which the surge elevations would be extracted. The polygon labeled “Coastal Alignment East of S/W Pass” encloses the grid points between S/W Pass and the Mississippi State line.
Nine inland profiles were plotted. These begin at the coastal polygon and extend inland to high ground. Each is assigned the name of a prominent geographical feature along its path. They start in the east with shape polygon “Pontchartrain Alignment along North Shore” and end in the west with shape polygon “Sabine River Alignment.” Each profile is referenced by the latitude and longitude at its intersection with the coastal profile
Appendix E
12
28.4
28.5
28.6
28.7
28.8
28.9
29.0
29.1
29.2
29.3
29.4
29.5
29.6
29.7
29.8
29.9
30.0
30.1
30.2
30.3
30.4
30.5
30.6
-94.
0-9
3.9
-93.
8-9
3.7
-93.
6-9
3.5
-93.
4-9
3.3
-93.
2-9
3.1
-93.
0-9
2.9
-92.
8-9
2.7
-92.
6-9
2.5
-92.
4-9
2.3
-92.
2-9
2.1
-92.
0-9
1.9
-91.
8-9
1.7
-91.
6-9
1.5
-91.
4-9
1.3
-91.
2-9
1.1
-91.
0-9
0.9
-90.
8-9
0.7
-90.
6-9
0.5
-90.
4-9
0.3
-90.
2-9
0.1
-90.
0-8
9.9
-89.
8-8
9.7
-89.
6-8
9.5
-89.
4-8
9.3
-89.
2-8
9.1
-89.
0-8
8.9
-88.
8-8
8.7
-88.
6-8
8.5
-88.
4-8
8.3
-88.
2-8
8.1
-88.
0
Longitude, Degrees
Latit
ude,
Deg
rees
Ds
.
S10 Grid, (X,Y,Z) Coastal Alignment East of S/W Pass Coastal Alignment West of S/W PassPontcharain Alignment Along North Shore St Bernard Parish Alignment Along MRGO West Bank Alignment Houma Alignment Morgan City Alignment Abbeville/Lafayette AlignmentGueydan/Mermentau Alignment Lake Charles Alignment Sabine River AlignmentBed Elevations Extracted from grid S08 Points Extrapolate Surge Heights to Northern Boundary Intersection of MRGO and GIWWRigolets Westwego HoumaLafayette Lake Charles Morgan City
Figure 4.1. Selected Alignments for Surge Height Profiles
Appendix E
13
-50
-45
-40
-35
-30
-25
-20
-15
-10
-5
0
5
10
15
20
25
30
35
40
-94 -93 -92 -91 -90 -89 -88Longitude, Degrees
Elev
atio
n, F
t
0
2
4
6
8
10
12
14
16
18
20
22
24
26
28
30
32
34
36
Diff
eren
ce, H
500
- H10
0, F
t
Coastal Profile Case1 Surge, 0.20%
Coastal Profile Case1 Surge, 1%
Coastal Profile Case2 Surge, 0.20%
Coastal Profile Case2 Surge, 1%
Bed Elev. Case 1
Difference, H500 - H100 Case 1
S/W
Pas
s
Tex
as L
ine
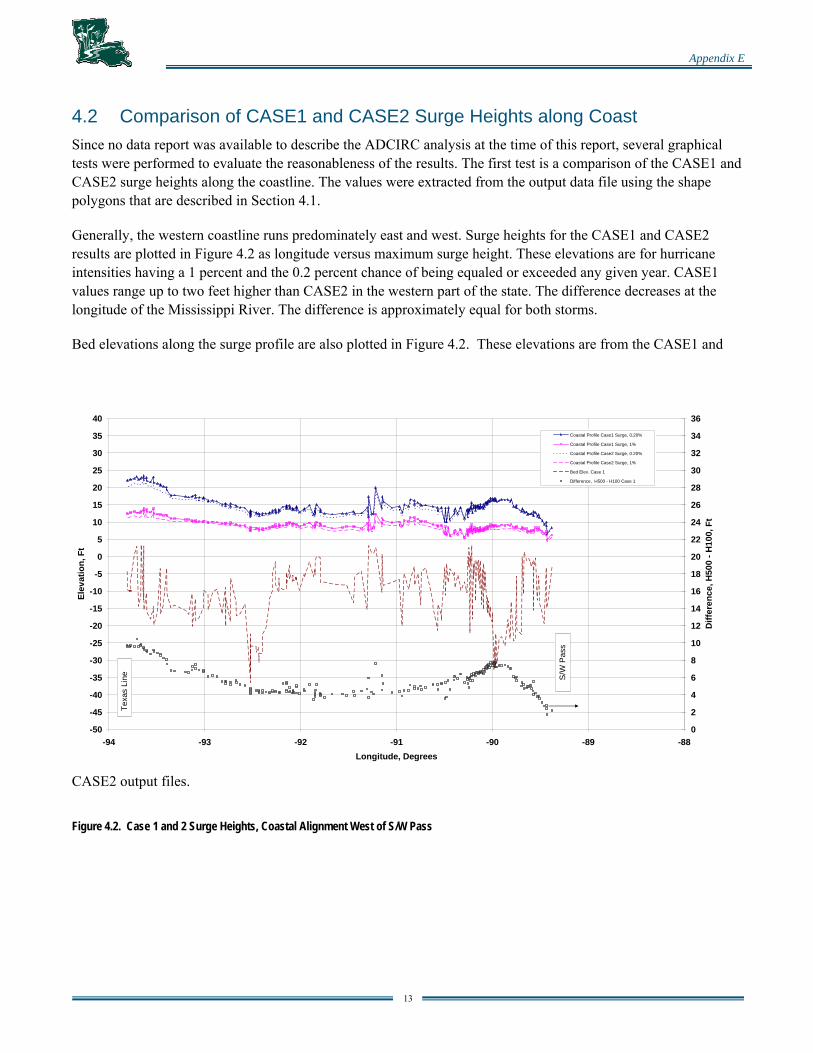
4.2 Comparison of CASE1 and CASE2 Surge Heights along Coast Since no data report was available to describe the ADCIRC analysis at the time of this report, several graphical tests were performed to evaluate the reasonableness of the results. The first test is a comparison of the CASE1 and CASE2 surge heights along the coastline. The values were extracted from the output data file using the shape polygons that are described in Section 4.1.
Generally, the western coastline runs predominately east and west. Surge heights for the CASE1 and CASE2 results are plotted in Figure 4.2 as longitude versus maximum surge height. These elevations are for hurricane intensities having a 1 percent and the 0.2 percent chance of being equaled or exceeded any given year. CASE1 values range up to two feet higher than CASE2 in the western part of the state. The difference decreases at the longitude of the Mississippi River. The difference is approximately equal for both storms.
Bed elevations along the surge profile are also plotted in Figure 4.2. These elevations are from the CASE1 and
CASE2 output files.
Figure 4.2. Case 1 and 2 Surge Heights, Coastal Alignment West of S/W Pass
Appendix E
14
4.3 Datum The CASE1 and CASE2 data were used as provided by the USACE. The datum is NGVD29/LMSL. In the future analyses, the recommended datum will be NAVD88 (2004.65). In its evaluation of conditions following hurricane Katrina, the Independent Performance Evaluation Team (IPET) made a special study of datum and published a considerable amount of information for the New Orleans area. One conclusion states the following: “The Local Mean Sea Level (LMSL) is roughly 0.2 feet above the North American Vertical Datum of 1988, readjusted for New Orleans in 2004 on the 65 Julian day of that year.” (IPET, 1 June 2006). However, adjustments vary along the coast, and the IPET report only presented conditions in the New Orleans area. The datum correction at other places along the coast may need to be adjusted from one to two feet (personal communication, Mr. Vann Stutts, MVN-ED-H). The adjustment may be about the same as the difference between CASE1 and CASE2 surge elevations in the western part of the state. Datum adjustments will be incorporated into the new surge computations being run by the USACE.
Appendix E
15
5.0 Selection of CASE1 for Planning Study In general, the 1 percent chance storm surge is at elevation eight to ten feet along the coast between the Calcasieu Ship Channel and Southwest Pass of the Mississippi River for CASE1. That surge height increases to thirteen feet at the Texas state line. This amplification is probably due to the curvature of the Texas coastline as it proceeds west from the Sabine River. Such geometric features concentrate the flow which amplifies the height of the surge.
The surge associated with the 0.2 percent chance event plots from four to ten feet higher than the 1 percent surge height. The greatest difference is at the Texas state line. The amplification is explained using the same argument as stated above for the 1 percent chance surge height. The fact that the more intense event ramps up to a greater height is reasonable since hydrodynamics is a non-linear process.
Figure 4.2 shows CASE2 to be about a foot lower than CASE1 along much of the western coast. However, CASE 1 is being used by the USACE in its preliminary levee design (personal communication with Mr. Larry Banks, USACE Mississippi Valley Division). This reason, coupled with the fact that the NGVD29 datum was used rather than NAVD88, led to the adoption of CASE1 for use in this planning study. These surge heights are being used for planning purposes only. They will be refined as soon as the new ADCIRC analyses are completed.
Appendix E
16
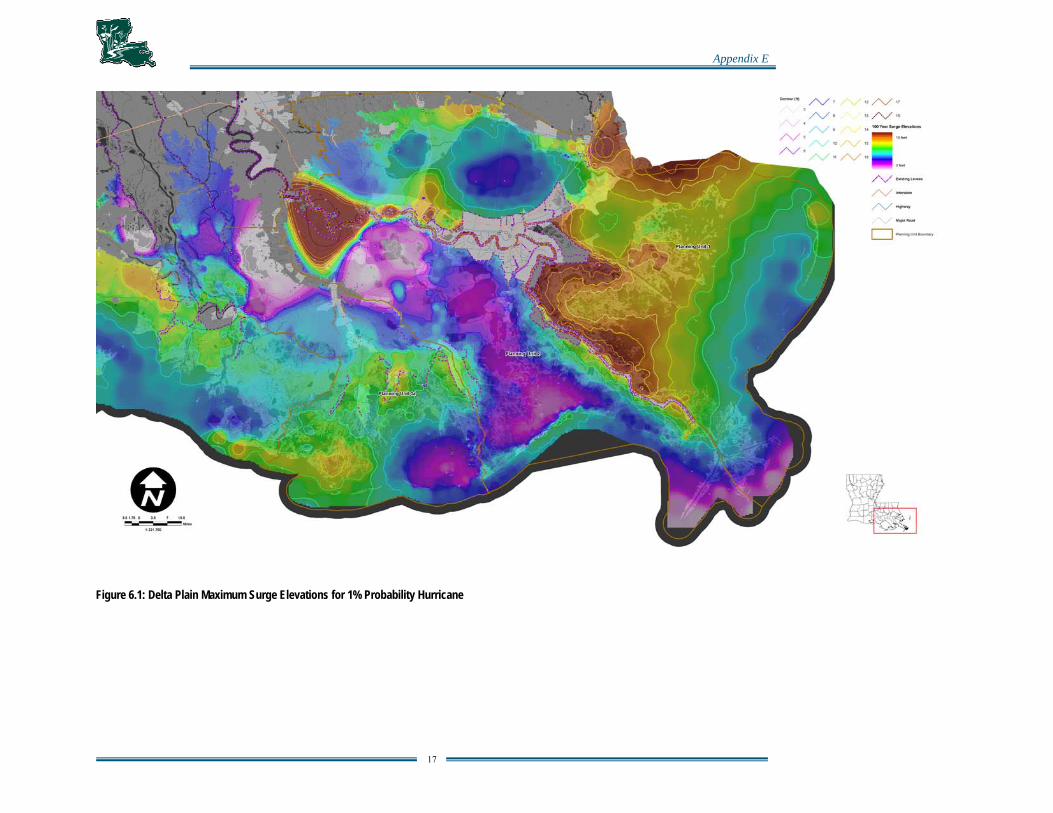
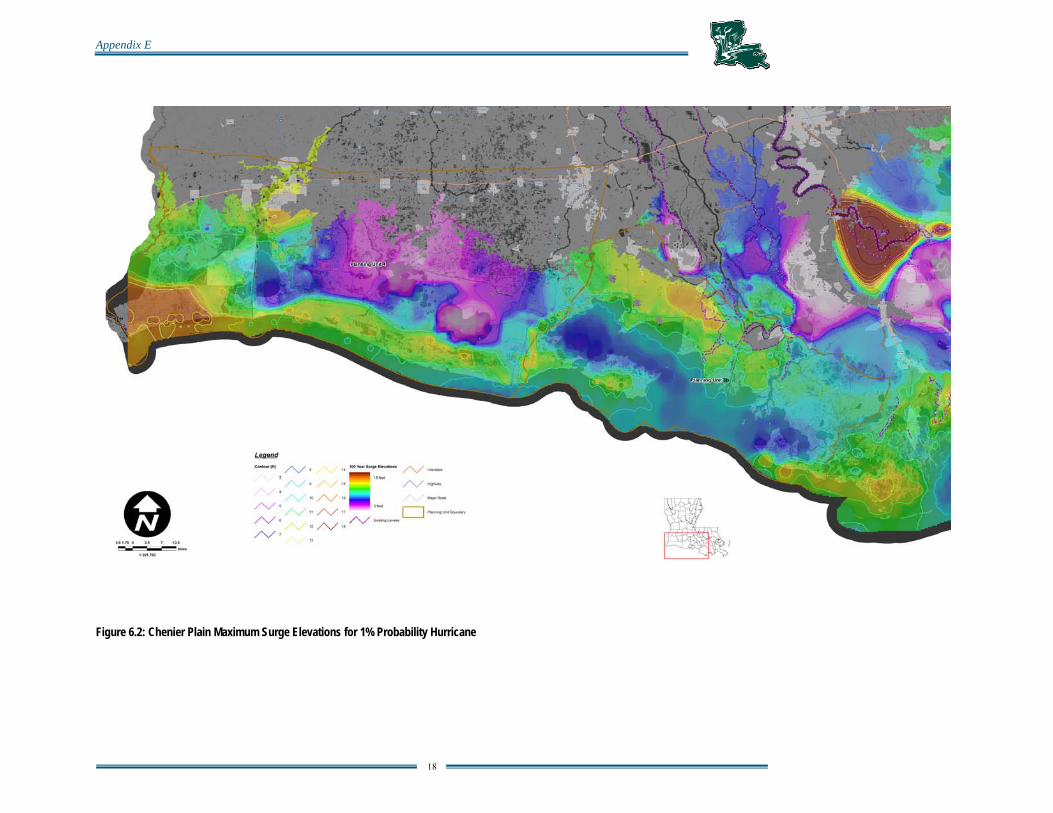
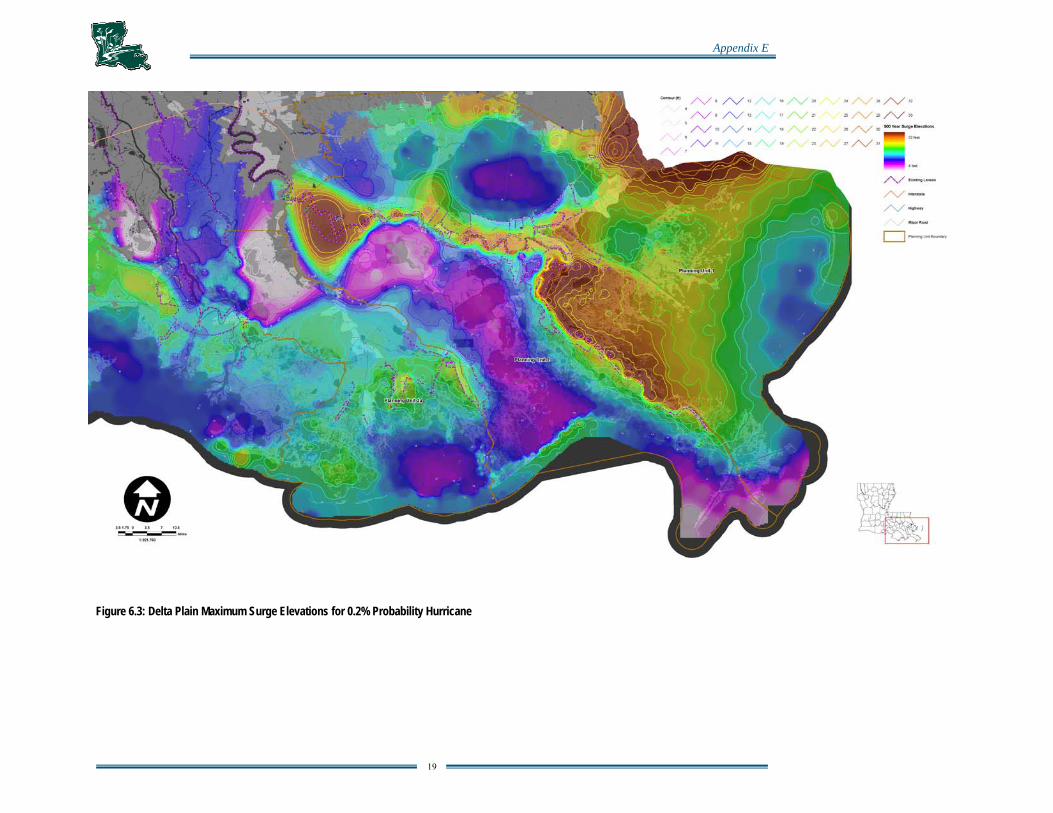
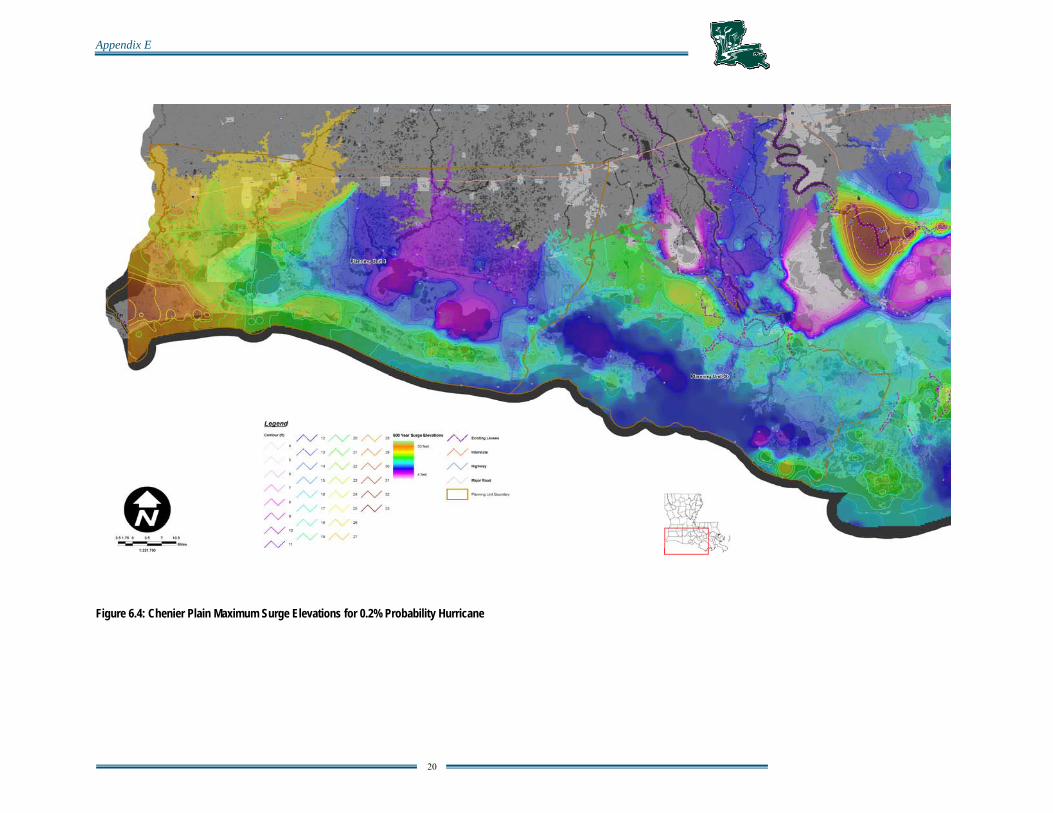
6.0 Maximum Surge Height Elevations The maximum surge elevations were converted into digital contour maps. Each map is a composite of the maximum surge heights in all ADCIRC runs for the storm in the figure title. These maximum, computed surge elevations were used in the computation of economic damages and in the computation of levee heights. However, to view the depth of the surge at selected alignments along the coast, surge elevations and bed profiles were plotted by extracting values from the CASE1 data base. The maximum surge elevations for the 1.0 percent annual probability event are shown in Figure 6.1 for the Delta Plain and 6.2 for the Chenier Plain. The 0.2 percent chance event surges are shown in Figures 6.3 for the Delta Plain and 6.4 for the Chenier Plain. These profiles are discussed in the following paragraphs.
Appendix E
17
Figure 6.1: Delta Plain Maximum Surge Elevations for 1% Probability Hurricane
Appendix E
18
Figure 6.2: Chenier Plain Maximum Surge Elevations for 1% Probability Hurricane
Appendix E
19
Figure 6.3: Delta Plain Maximum Surge Elevations for 0.2% Probability Hurricane
Appendix E
20
Figure 6.4: Chenier Plain Maximum Surge Elevations for 0.2% Probability Hurricane
Appendix E
21
-50
-45
-40
-35
-30
-25
-20
-15
-10
-5
0
5
10
15
20
25
30
35
40
28.80 29.00 29.20 29.40 29.60 29.80 30.00 30.20 30.40 30.60Latitude, Degrees
Elev
atio
n
0
2
4
6
8
10
12
14
16
18
20
22
24
26
28
30
32
34
36
Diff
eren
ce, H
500
- H
100
, Ft
Coastal Profile Surge, 500 YrCoastal Profile Surge, 500 YrBed Elev. Case 1Difference, H500 - H100
S/W
Pas
s
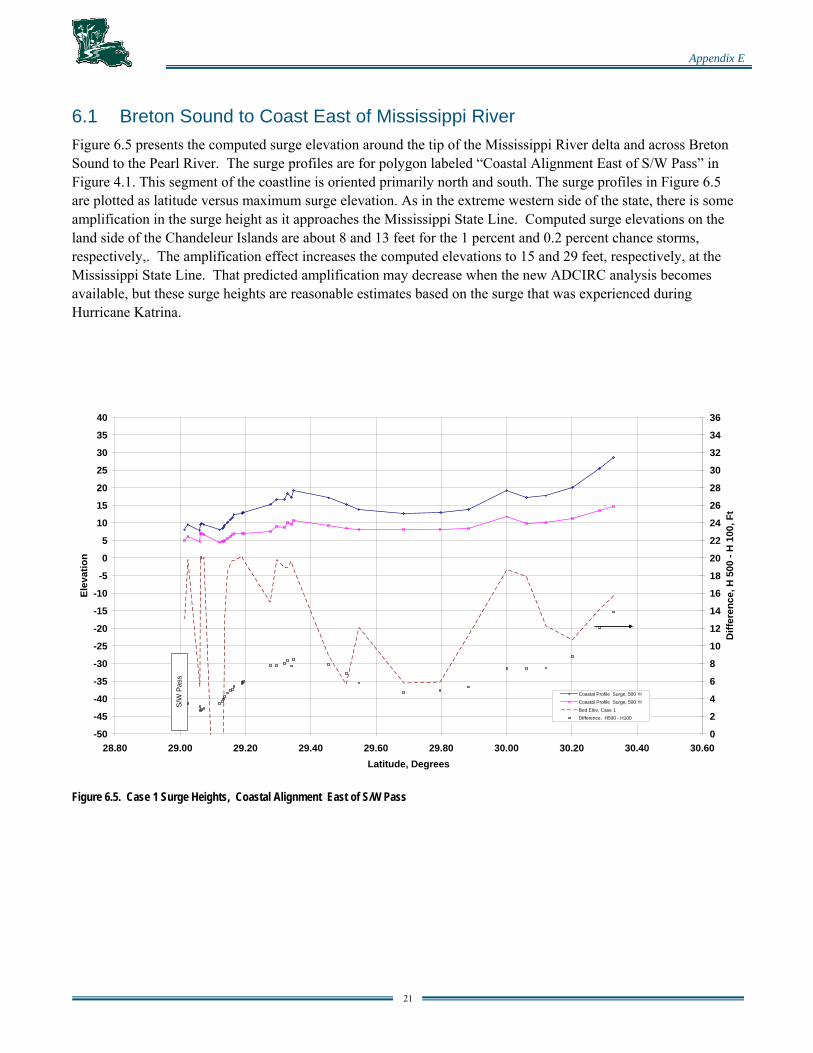
6.1 Breton Sound to Coast East of Mississippi River Figure 6.5 presents the computed surge elevation around the tip of the Mississippi River delta and across Breton Sound to the Pearl River. The surge profiles are for polygon labeled “Coastal Alignment East of S/W Pass” in Figure 4.1. This segment of the coastline is oriented primarily north and south. The surge profiles in Figure 6.5 are plotted as latitude versus maximum surge elevation. As in the extreme western side of the state, there is some amplification in the surge height as it approaches the Mississippi State Line. Computed surge elevations on the land side of the Chandeleur Islands are about 8 and 13 feet for the 1 percent and 0.2 percent chance storms, respectively,. The amplification effect increases the computed elevations to 15 and 29 feet, respectively, at the Mississippi State Line. That predicted amplification may decrease when the new ADCIRC analysis becomes available, but these surge heights are reasonable estimates based on the surge that was experienced during Hurricane Katrina.
Figure 6.5. Case 1 Surge Heights, Coastal Alignment East of S/W Pass
Appendix E
22
-50
-45
-40
-35
-30
-25
-20
-15
-10
-5
0
5
10
15
20
25
30
35
40
29.70 29.80 29.90 30.00 30.10 30.20 30.30 30.40 30.50Latitude, Degrees
Elev
atio
n
0
2
4
6
8
10
12
14
16
18
20
22
24
26
28
30
32
34
36
Diff
eren
ce, H
500
- H
100
, Ft
YR100FT Surge YR500FT Surge Bed Elev. Case 1 Rigolets YR100FT Surge
YR500FT Surge Bed Elev. Case 1 Rigolets Difference, H500 - H100 Difference, H500 - H100
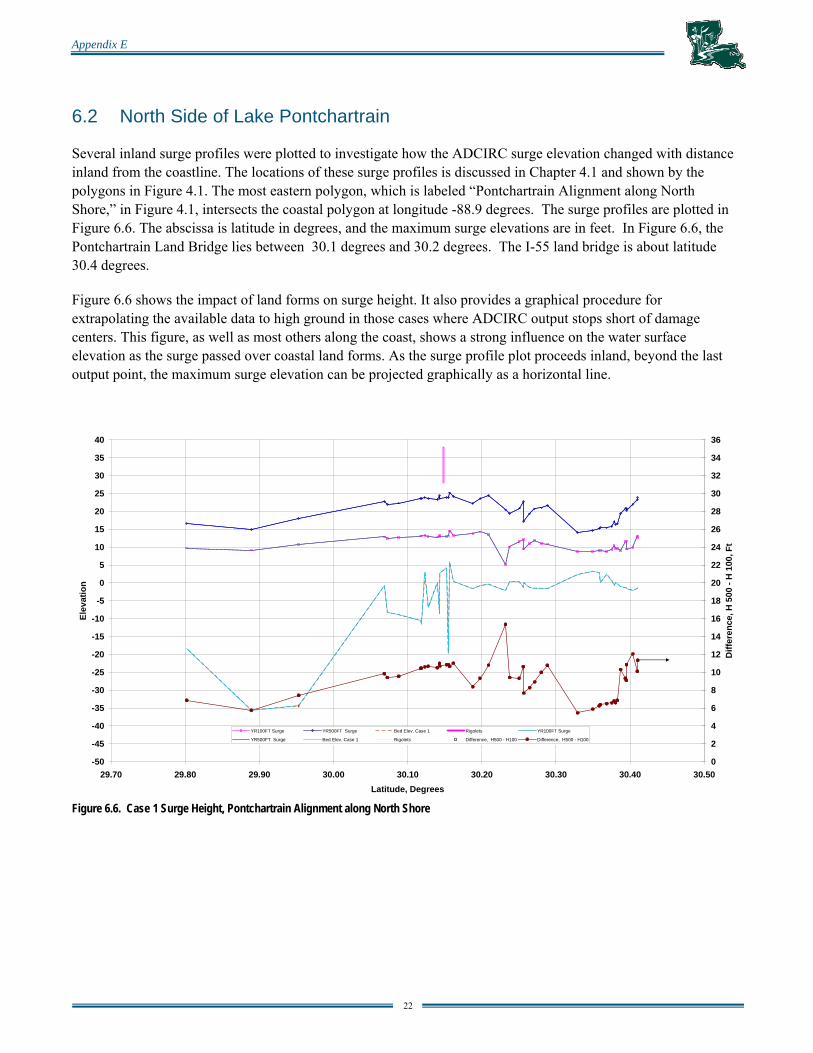
6.2 North Side of Lake Pontchartrain Several inland surge profiles were plotted to investigate how the ADCIRC surge elevation changed with distance inland from the coastline. The locations of these surge profiles is discussed in Chapter 4.1 and shown by the polygons in Figure 4.1. The most eastern polygon, which is labeled “Pontchartrain Alignment along North Shore,” in Figure 4.1, intersects the coastal polygon at longitude -88.9 degrees. The surge profiles are plotted in Figure 6.6. The abscissa is latitude in degrees, and the maximum surge elevations are in feet. In Figure 6.6, the Pontchartrain Land Bridge lies between 30.1 degrees and 30.2 degrees. The I-55 land bridge is about latitude 30.4 degrees.
Figure 6.6 shows the impact of land forms on surge height. It also provides a graphical procedure for extrapolating the available data to high ground in those cases where ADCIRC output stops short of damage centers. This figure, as well as most others along the coast, shows a strong influence on the water surface elevation as the surge passed over coastal land forms. As the surge profile plot proceeds inland, beyond the last output point, the maximum surge elevation can be projected graphically as a horizontal line.
Figure 6.6. Case 1 Surge Height, Pontchartrain Alignment along North Shore
Appendix E
23
-50
-45
-40
-35
-30
-25
-20
-15
-10
-5
0
5
10
15
20
25
30
35
40
29.50 29.60 29.70 29.80 29.90 30.00 30.10 30.20Latitude, Degrees
Elev
atio
n
0
2
4
6
8
10
12
14
16
18
20
22
24
26
28
30
32
34
36
Diff
eren
ce, H
500
- H10
0
YR500FT SurgeYR100FT SurgeBED ELEV Case 1Intersection of MRGO and GIWWDifference, H500 - H100
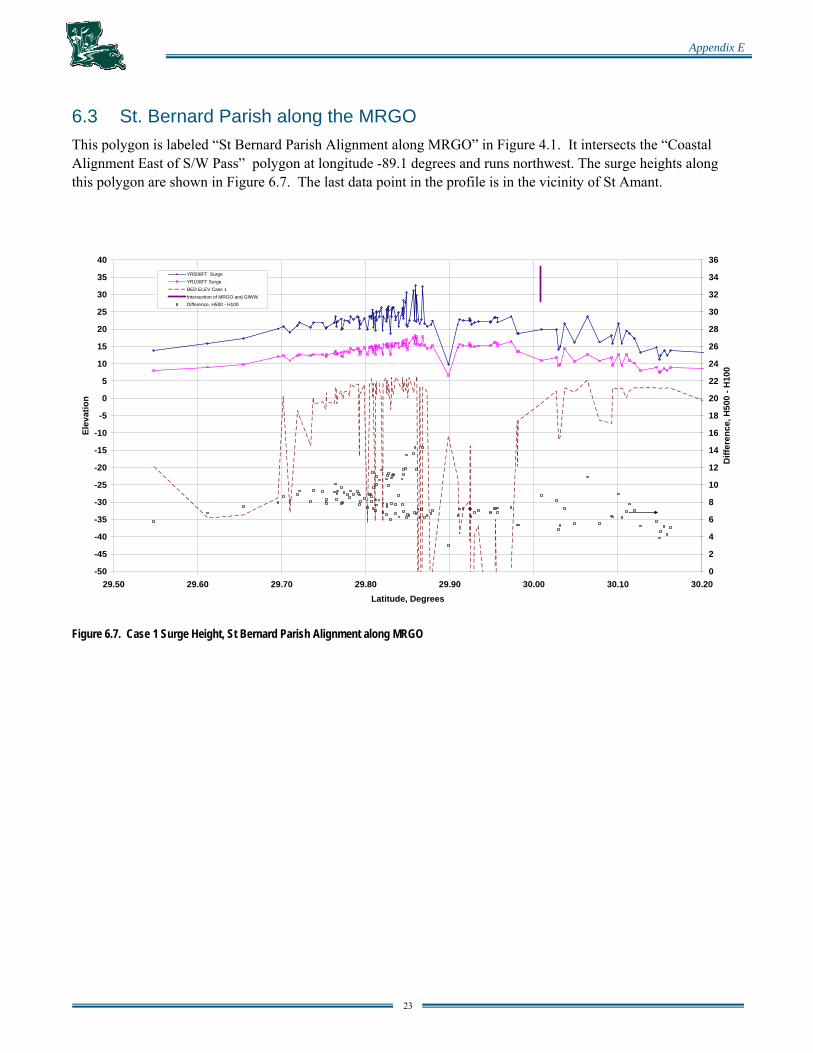
6.3 St. Bernard Parish along the MRGO This polygon is labeled “St Bernard Parish Alignment along MRGO” in Figure 4.1. It intersects the “Coastal Alignment East of S/W Pass” polygon at longitude -89.1 degrees and runs northwest. The surge heights along this polygon are shown in Figure 6.7. The last data point in the profile is in the vicinity of St Amant.
Figure 6.7. Case 1 Surge Height, St Bernard Parish Alignment along MRGO
Appendix E
24
-50
-45
-40
-35
-30
-25
-20
-15
-10
-5
0
5
10
15
20
25
30
35
40
29.00 29.10 29.20 29.30 29.40 29.50 29.60 29.70 29.80 29.90 30.00Latitude, Degrees
Elev
atio
n, F
t NG
VD29
0
2
4
6
8
10
12
14
16
18
20
22
24
26
28
30
32
34
36
Diff
eren
ce, H
500
- H10
0
YR500FT SurgeYR100FT SurgeBED ELEV Case 1WestwegoDifference, H500 - H100
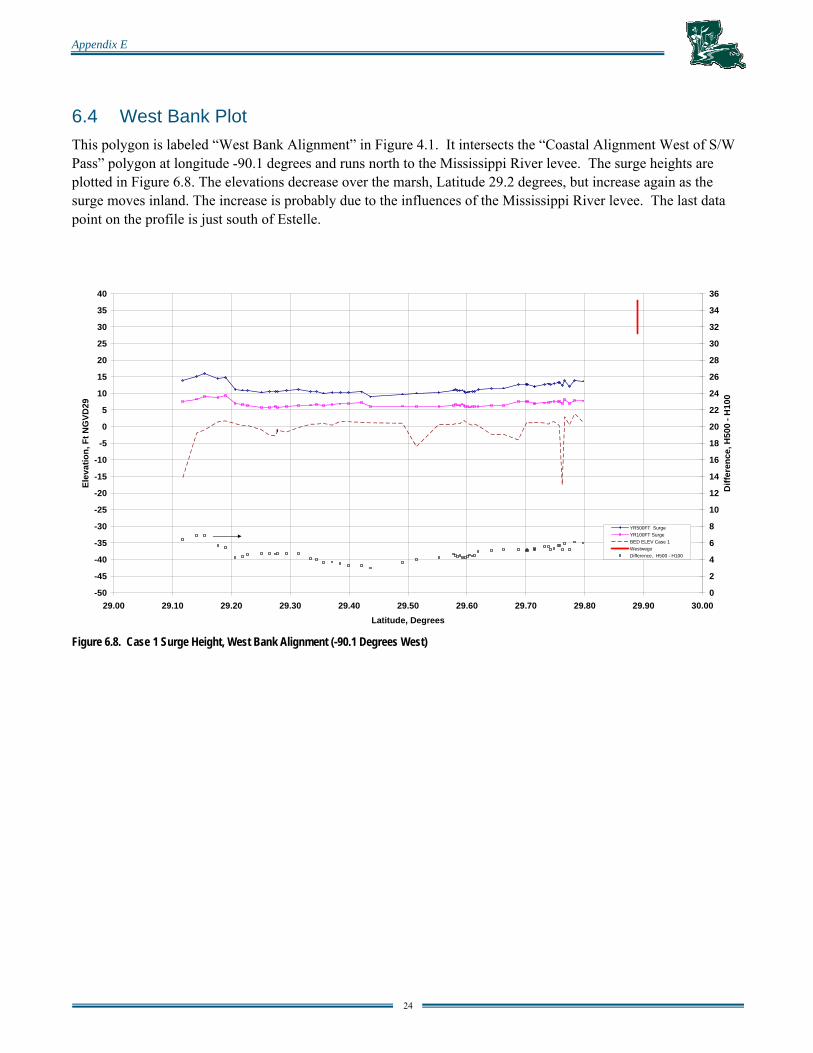
6.4 West Bank Plot This polygon is labeled “West Bank Alignment” in Figure 4.1. It intersects the “Coastal Alignment West of S/W Pass” polygon at longitude -90.1 degrees and runs north to the Mississippi River levee. The surge heights are plotted in Figure 6.8. The elevations decrease over the marsh, Latitude 29.2 degrees, but increase again as the surge moves inland. The increase is probably due to the influences of the Mississippi River levee. The last data point on the profile is just south of Estelle.
Figure 6.8. Case 1 Surge Height, West Bank Alignment (-90.1 Degrees West)
Appendix E
25
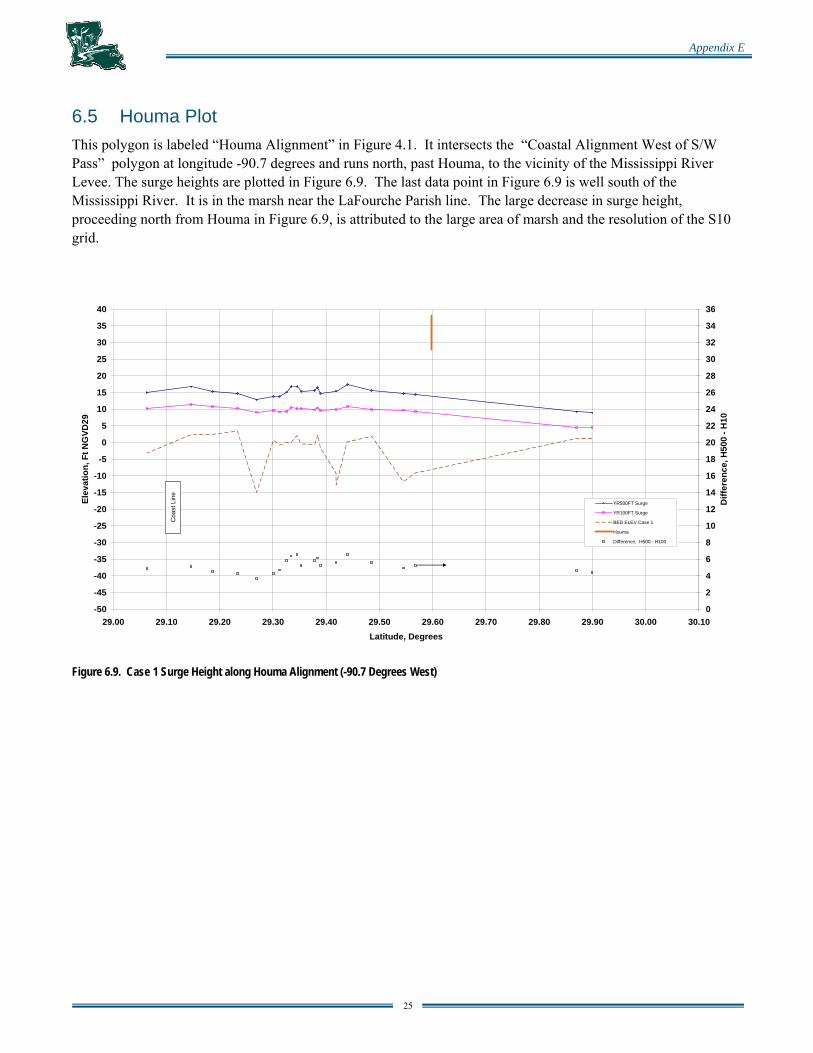
6.5 Houma Plot This polygon is labeled “Houma Alignment” in Figure 4.1. It intersects the “Coastal Alignment West of S/W Pass” polygon at longitude -90.7 degrees and runs north, past Houma, to the vicinity of the Mississippi River Levee. The surge heights are plotted in Figure 6.9. The last data point in Figure 6.9 is well south of the Mississippi River. It is in the marsh near the LaFourche Parish line. The large decrease in surge height, proceeding north from Houma in Figure 6.9, is attributed to the large area of marsh and the resolution of the S10 grid.
Figure 6.9. Case 1 Surge Height along Houma Alignment (-90.7 Degrees West)
-50
-45
-40
-35
-30
-25
-20
-15
-10
-5
0
5
10
15
20
25
30
35
40
29.00 29.10 29.20 29.30 29.40 29.50 29.60 29.70 29.80 29.90 30.00 30.10Latitude, Degrees
Elev
atio
n, F
t NG
VD29
0
2
4
6
8
10
12
14
16
18
20
22
24
26
28
30
32
34
36
Diff
eren
ce, H
500
- H10
YR500FT Surge
YR100FT Surge
BED ELEV Case 1
Houma
Difference, H500 - H100
Coa
st L
ine
Appendix E
26
-50
-45
-40
-35
-30
-25
-20
-15
-10
-5
0
5
10
15
20
25
30
35
40
29.20 29.30 29.40 29.50 29.60 29.70 29.80 29.90Latitude, Degrees
Elev
atio
n, F
t NG
VD29
0
2
4
6
8
10
12
14
16
18
20
22
24
26
28
30
32
34
36
Diff
eren
ce, H
500
- H10
YR500FT Surge
YR100FT Surge
BED ELEV Case 1
Morgan City
Difference, H500 - H100
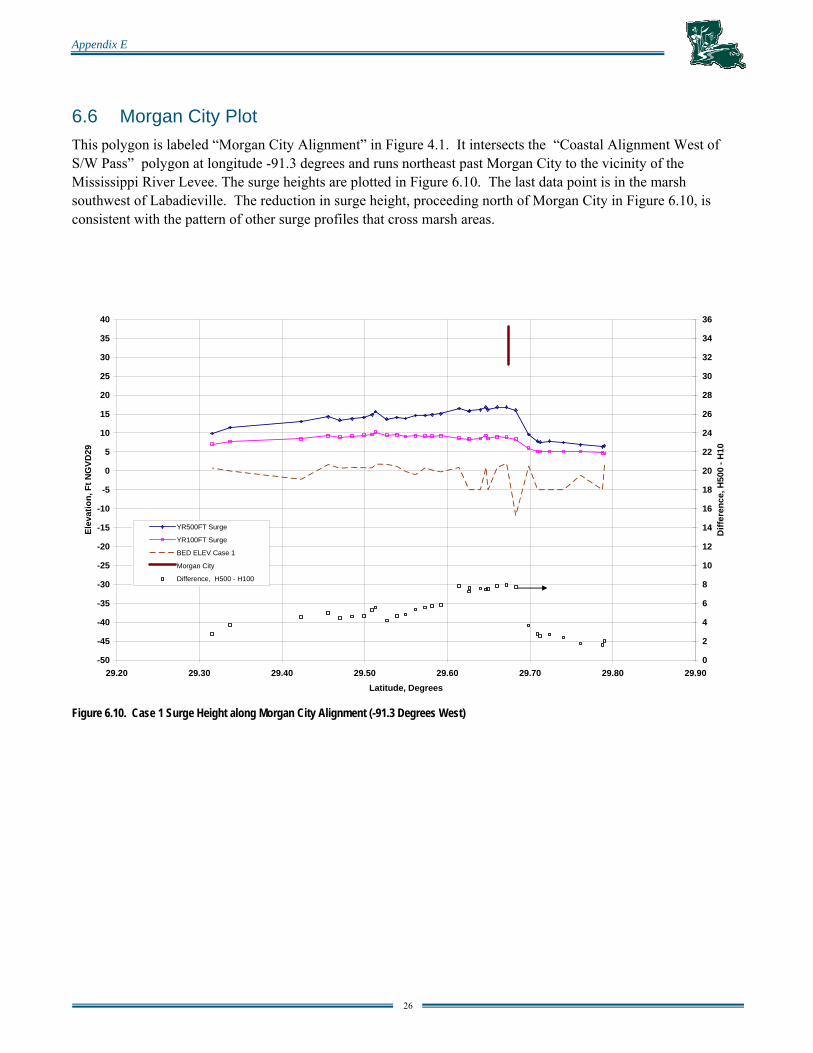
6.6 Morgan City Plot This polygon is labeled “Morgan City Alignment” in Figure 4.1. It intersects the “Coastal Alignment West of S/W Pass” polygon at longitude -91.3 degrees and runs northeast past Morgan City to the vicinity of the Mississippi River Levee. The surge heights are plotted in Figure 6.10. The last data point is in the marsh southwest of Labadieville. The reduction in surge height, proceeding north of Morgan City in Figure 6.10, is consistent with the pattern of other surge profiles that cross marsh areas.
Figure 6.10. Case 1 Surge Height along Morgan City Alignment (-91.3 Degrees West)
Appendix E
27
-50
-45
-40
-35
-30
-25
-20
-15
-10
-5
0
5
10
15
20
25
30
35
40
29.40 29.50 29.60 29.70 29.80 29.90 30.00 30.10 30.20 30.30Latitude, Degrees
Elev
atio
n, F
t NG
VD29
0
2
4
6
8
10
12
14
16
18
20
22
24
26
28
30
32
34
36
Diff
eren
ce, H
500
- H10
0
YR500FT SurgeYR100FT SurgeBED ELEV Case 1BED ELEV SL15_v3 GridLafayetteAbbevilleDifference, H500 - H100
Sco
oner
By
Coa
st L
ine
GIW
W
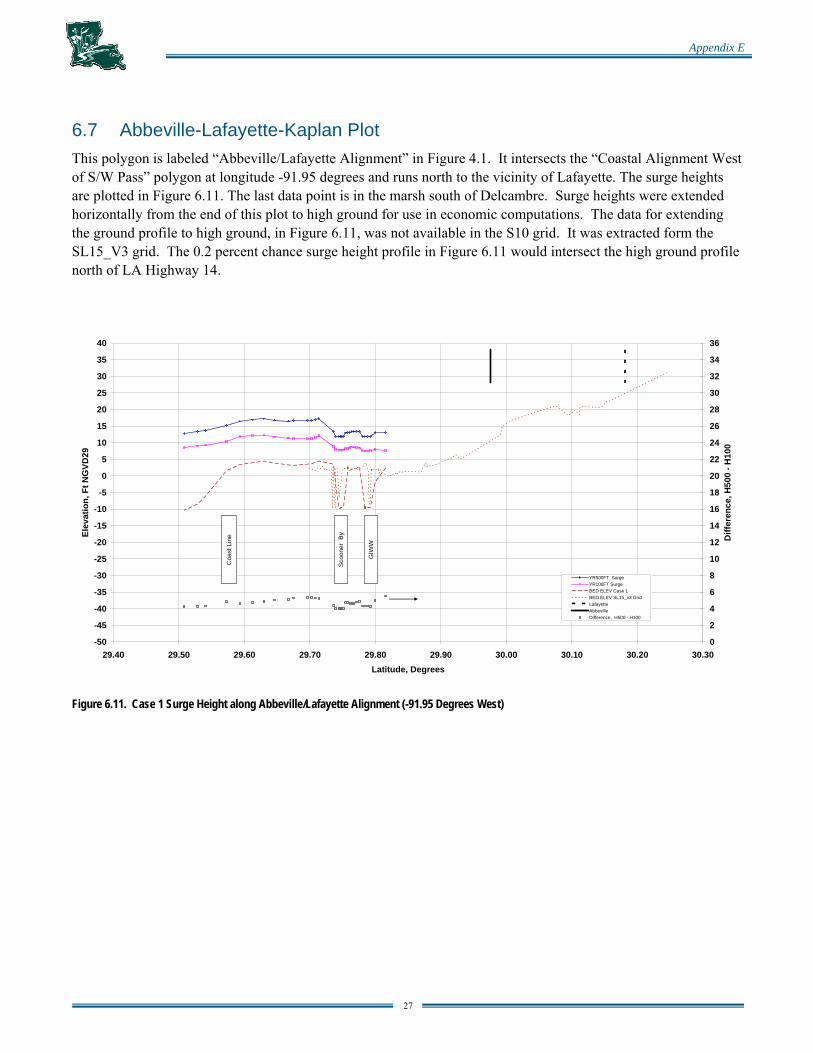
6.7 Abbeville-Lafayette-Kaplan Plot This polygon is labeled “Abbeville/Lafayette Alignment” in Figure 4.1. It intersects the “Coastal Alignment West of S/W Pass” polygon at longitude -91.95 degrees and runs north to the vicinity of Lafayette. The surge heights are plotted in Figure 6.11. The last data point is in the marsh south of Delcambre. Surge heights were extended horizontally from the end of this plot to high ground for use in economic computations. The data for extending the ground profile to high ground, in Figure 6.11, was not available in the S10 grid. It was extracted form the SL15_V3 grid. The 0.2 percent chance surge height profile in Figure 6.11 would intersect the high ground profile north of LA Highway 14.
Figure 6.11. Case 1 Surge Height along Abbeville/Lafayette Alignment (-91.95 Degrees West)
Appendix E
28
-50
-45
-40
-35
-30
-25
-20
-15
-10
-5
0
5
10
15
20
25
30
35
40
29.40 29.50 29.60 29.70 29.80 29.90 30.00 30.10 30.20 30.30Latitude, Degrees
Elev
atio
n, F
t NG
VD29
0
2
4
6
8
10
12
14
16
18
20
22
24
26
28
30
32
34
36
Diff
eren
ce, H
500
- H10
0
YR500FT Surge
YR100FT Surge
BED ELEV Case 1
-BED ELEV SL15b_3v Grid
Difference, H500 - H100
Coa
st L
ine
GIW
W
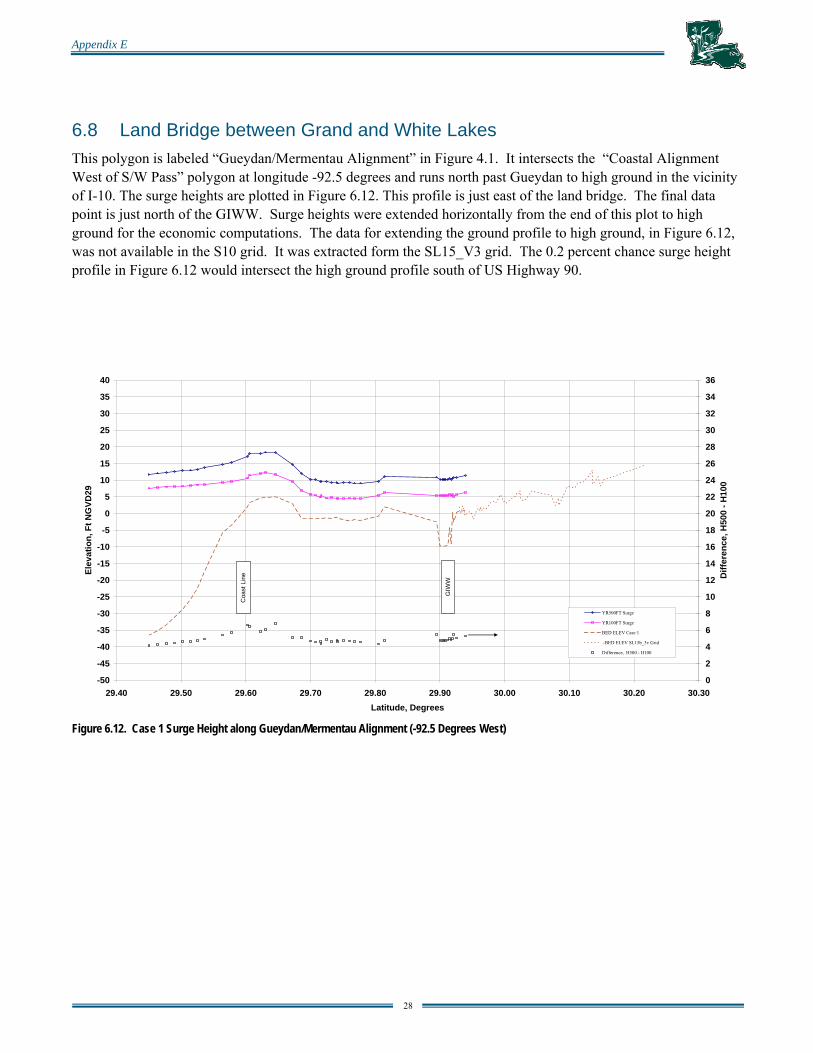
6.8 Land Bridge between Grand and White Lakes This polygon is labeled “Gueydan/Mermentau Alignment” in Figure 4.1. It intersects the “Coastal Alignment West of S/W Pass” polygon at longitude -92.5 degrees and runs north past Gueydan to high ground in the vicinity of I-10. The surge heights are plotted in Figure 6.12. This profile is just east of the land bridge. The final data point is just north of the GIWW. Surge heights were extended horizontally from the end of this plot to high ground for the economic computations. The data for extending the ground profile to high ground, in Figure 6.12, was not available in the S10 grid. It was extracted form the SL15_V3 grid. The 0.2 percent chance surge height profile in Figure 6.12 would intersect the high ground profile south of US Highway 90.
Figure 6.12. Case 1 Surge Height along Gueydan/Mermentau Alignment (-92.5 Degrees West)
Appendix E
29
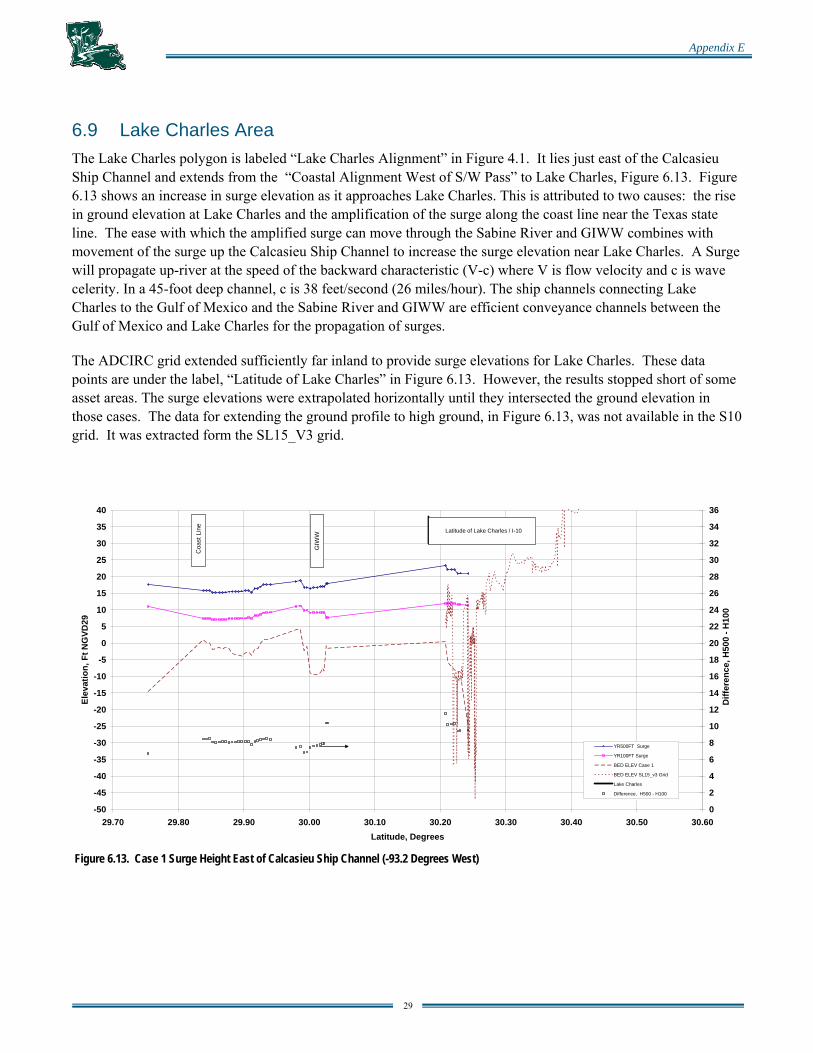
6.9 Lake Charles Area The Lake Charles polygon is labeled “Lake Charles Alignment” in Figure 4.1. It lies just east of the Calcasieu Ship Channel and extends from the “Coastal Alignment West of S/W Pass” to Lake Charles, Figure 6.13. Figure 6.13 shows an increase in surge elevation as it approaches Lake Charles. This is attributed to two causes: the rise in ground elevation at Lake Charles and the amplification of the surge along the coast line near the Texas state line. The ease with which the amplified surge can move through the Sabine River and GIWW combines with movement of the surge up the Calcasieu Ship Channel to increase the surge elevation near Lake Charles. A Surge will propagate up-river at the speed of the backward characteristic (V-c) where V is flow velocity and c is wave celerity. In a 45-foot deep channel, c is 38 feet/second (26 miles/hour). The ship channels connecting Lake Charles to the Gulf of Mexico and the Sabine River and GIWW are efficient conveyance channels between the Gulf of Mexico and Lake Charles for the propagation of surges.
The ADCIRC grid extended sufficiently far inland to provide surge elevations for Lake Charles. These data points are under the label, “Latitude of Lake Charles” in Figure 6.13. However, the results stopped short of some asset areas. The surge elevations were extrapolated horizontally until they intersected the ground elevation in those cases. The data for extending the ground profile to high ground, in Figure 6.13, was not available in the S10 grid. It was extracted form the SL15_V3 grid.
Figure 6.13. Case 1 Surge Height East of Calcasieu Ship Channel (-93.2 Degrees West)
-50
-45
-40
-35
-30
-25
-20
-15
-10
-5
0
5
10
15
20
25
30
35
40
29.70 29.80 29.90 30.00 30.10 30.20 30.30 30.40 30.50 30.60Latitude, Degrees
Elev
atio
n, F
t NG
VD29
0
2
4
6
8
10
12
14
16
18
20
22
24
26
28
30
32
34
36
Diff
eren
ce, H
500
- H10
0
YR500FT Surge
YR100FT Surge
BED ELEV Case 1
BED ELEV SL15_v3 Grid
Lake Charles
Difference, H500 - H100
Coa
st L
ine
GIW
W
Latitude of Lake Charles / I-10
Appendix E
30
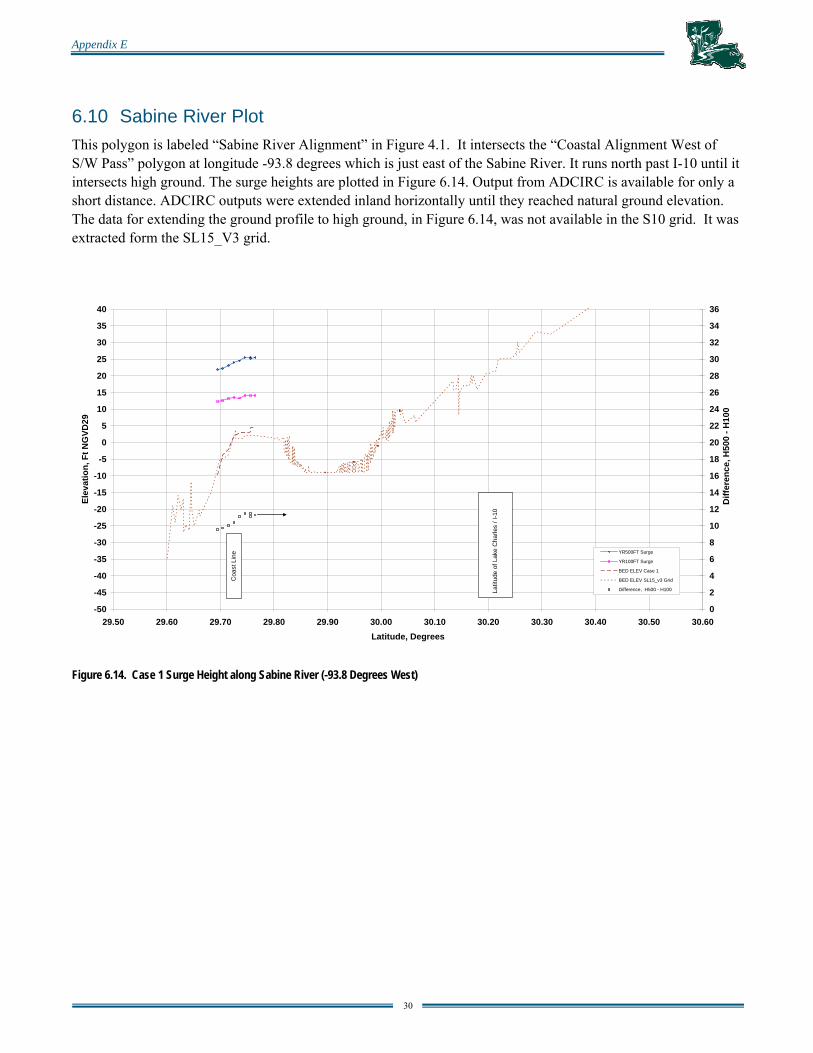
6.10 Sabine River Plot This polygon is labeled “Sabine River Alignment” in Figure 4.1. It intersects the “Coastal Alignment West of S/W Pass” polygon at longitude -93.8 degrees which is just east of the Sabine River. It runs north past I-10 until it intersects high ground. The surge heights are plotted in Figure 6.14. Output from ADCIRC is available for only a short distance. ADCIRC outputs were extended inland horizontally until they reached natural ground elevation. The data for extending the ground profile to high ground, in Figure 6.14, was not available in the S10 grid. It was extracted form the SL15_V3 grid.
Figure 6.14. Case 1 Surge Height along Sabine River (-93.8 Degrees West)
-50
-45
-40
-35
-30
-25
-20
-15
-10
-5
0
5
10
15
20
25
30
35
40
29.50 29.60 29.70 29.80 29.90 30.00 30.10 30.20 30.30 30.40 30.50 30.60Latitude, Degrees
Elev
atio
n, F
t NG
VD29
0
2
4
6
8
10
12
14
16
18
20
22
24
26
28
30
32
34
36
Diff
eren
ce, H
500
- H10
0
YR500FT Surge
YR100FT Surge
BED ELEV Case 1
BED ELEV SL15_v3 Grid
Difference, H500 - H100
Lat
itude
of L
ake
Cha
rles
/ I-1
0
Coa
st L
ine
Appendix E
31
7.0 Waves and Interior Flooding The consequences of interior flooding and flood runoff from the watershed were considered using regional rules, but detailed studies were not conducted for this master plan. Waves and interior flooding are necessary to compute total economic damages and to plan the protection features. Detailed studies are being conducted by the Corps of Engineers to quantify the contributions of waves and interior flooding, and the results will be incorporated into the master plan later.
In terms of the significance of interior flooding and flood runoff from the watersheds on the master plan, those processes might tend to reduce economic benefits of a surge protection system. However, the reduction is not expected to be significant enough to change the major decisions being made at the master plan level.
Waves are a different matter. They affect levee height and must be included in the development of the master plan. Waves, interior flooding, and runoff hydrographs must be determined separately from ADCIRC and combined with the ADCIRC surge elevations to provide a complete analysis of the damages from water. Two approaches were developed to estimate wave heights. One approach is referred to as the inland procedure, and the other is referred to as the open coast procedure.
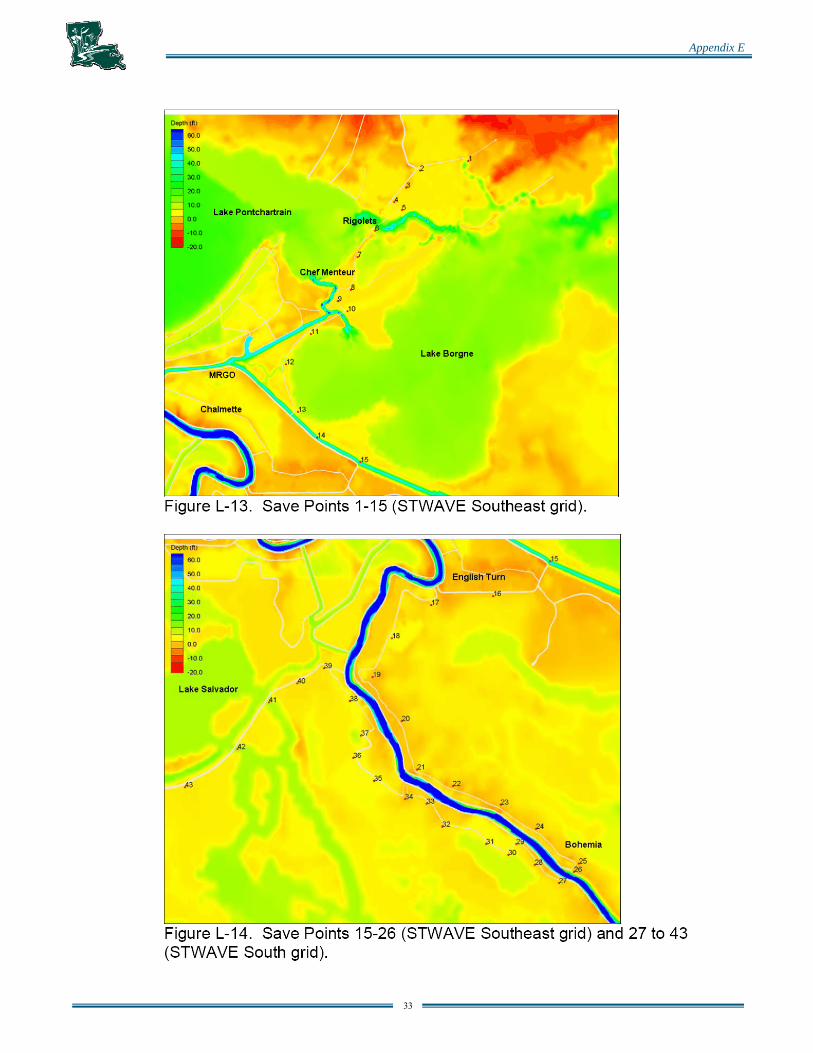
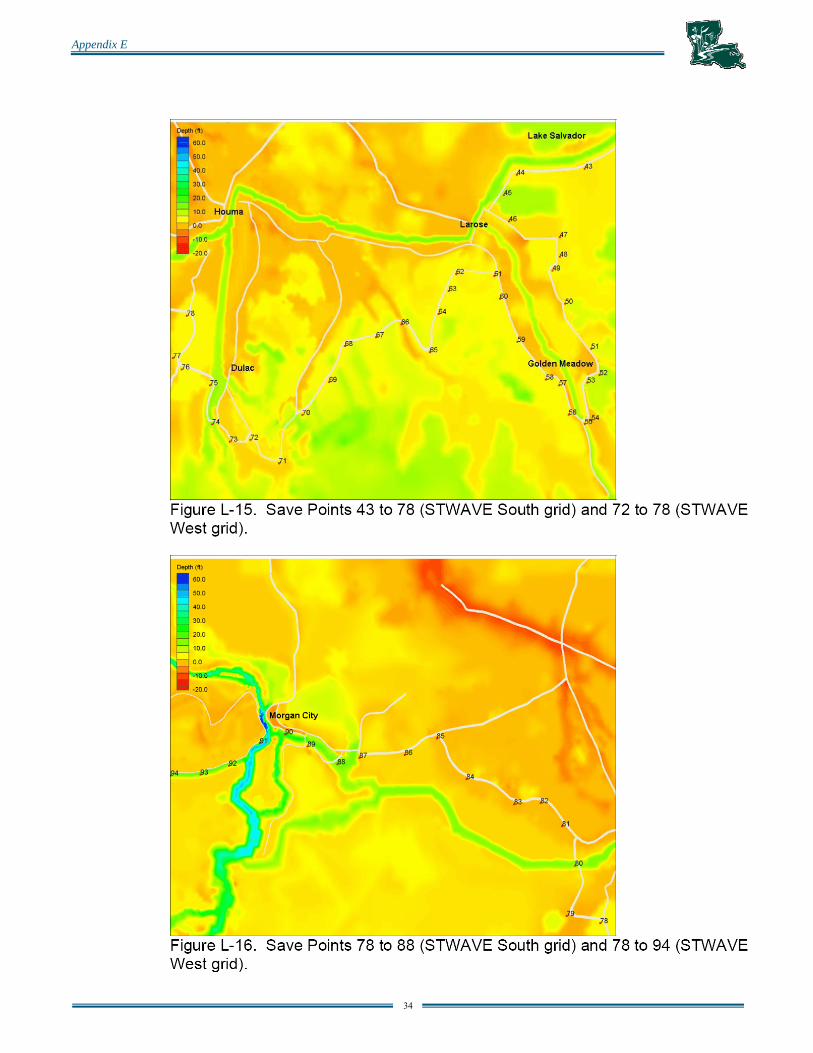
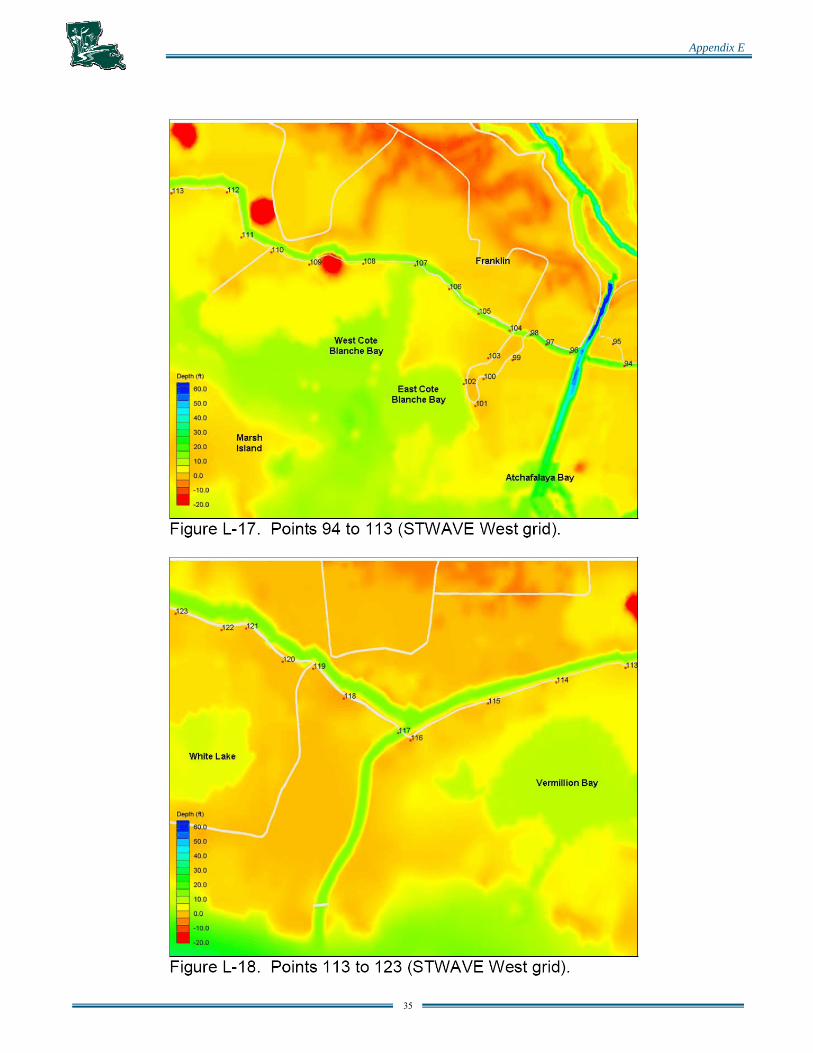
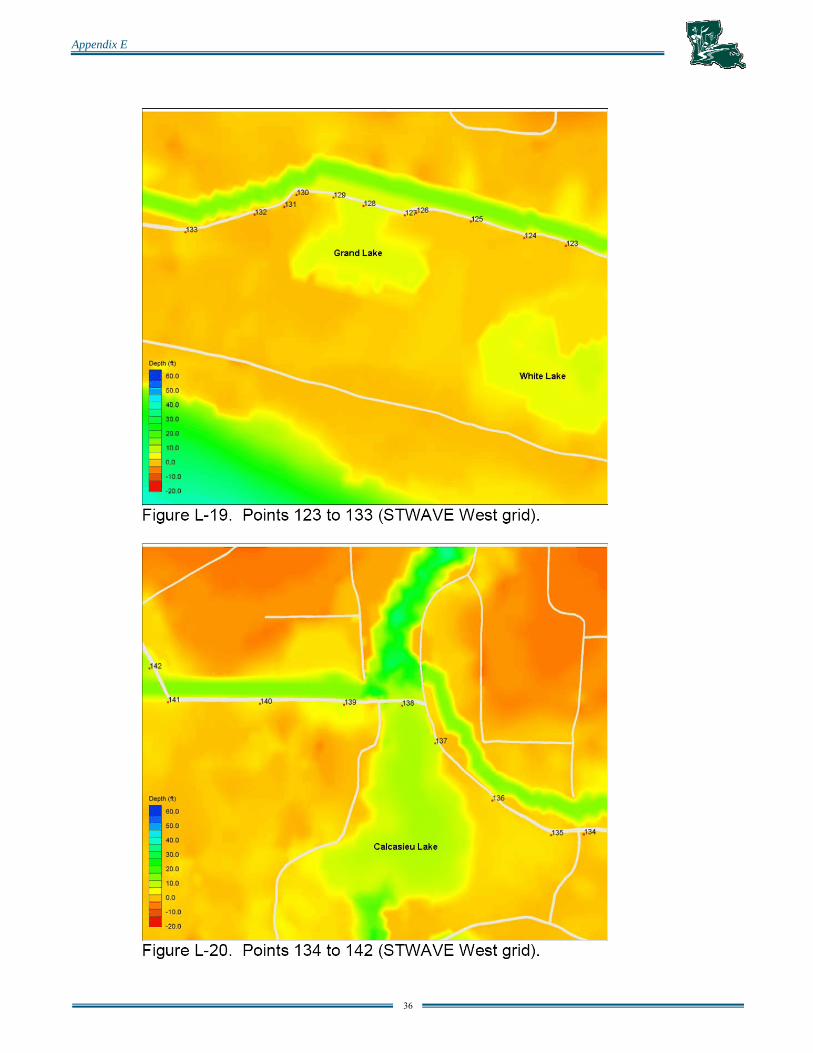
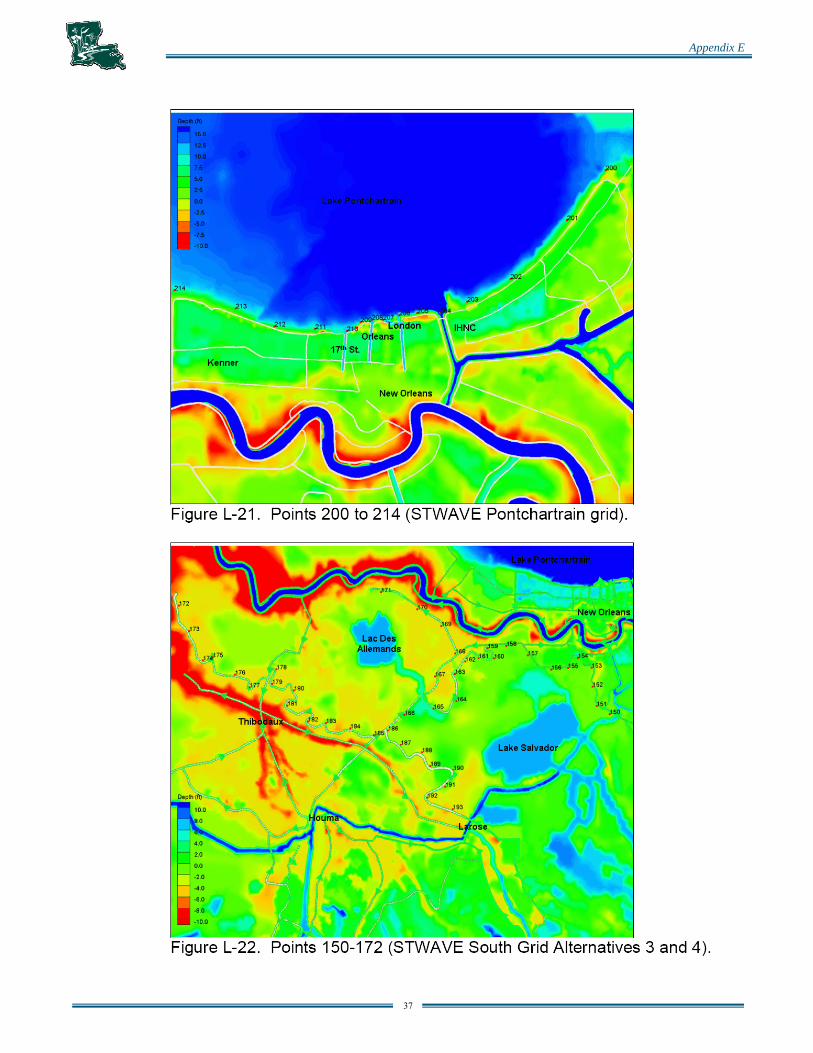
An example of the inland procedure follows: D = 13 feet (D is the depth of surge at toe of levee.) Hb = 0.78 D = 0.78 x 13 = 10.2 feet (Hb is the height of breaking wave.) Hs = 10.2 x 0.66 = 6.76 feet (Hs is the height of significant wave.) R/Hs = 1 (Run up ratio - assume 1.0) R = 6.76 feet (Run up distance) LE = D + R + z (z is ground elevation at toe of levee and LE is levee elevation) = 13 + 6.76 + 0 = 19.76 → use 20 feet (Levee elevation) The open coast approach utilized the computations made by the Corps of Engineers in its report to Congress dated July 2006 computed the ratio between wave height and surge depth. Since most of the levee alignment in the master plan follows one of the alternatives in the USACE report, the same “save points” are used in this master plan as were used in the USACE report. Figures L-13 through L-22 were copied from the USACE’s Enclosure, “Engineering Investigations.” These figures and a sample table from the Corps of Engineers report are reproduced below. The figures show the location of “save points.” Save points, surge heights and computed wave heights are shown in sample table, Table 7.1.
Because the storms in the master plan are different from those in the USACE report to Congress, it is not possible to use either the surge or wave heights from the USACE report directly. Therefore, a conversion factor was computed using the ratio of wave height (W) divided by the surge depth (S). It was applied to the 1 percent and the 0.2 percent chance surge depths to compute wave heights for this master plan. The wave height ratio is computed in the last column in Table 7.1 below. That column of information was not included in the USACE report. The values of W/S range from 0.36 to 0.38. A value of 0.36 was adopted for this plan.
Appendix E
32
This open coast ratio of wave height to surge can be compared to the inland ratio as follows:
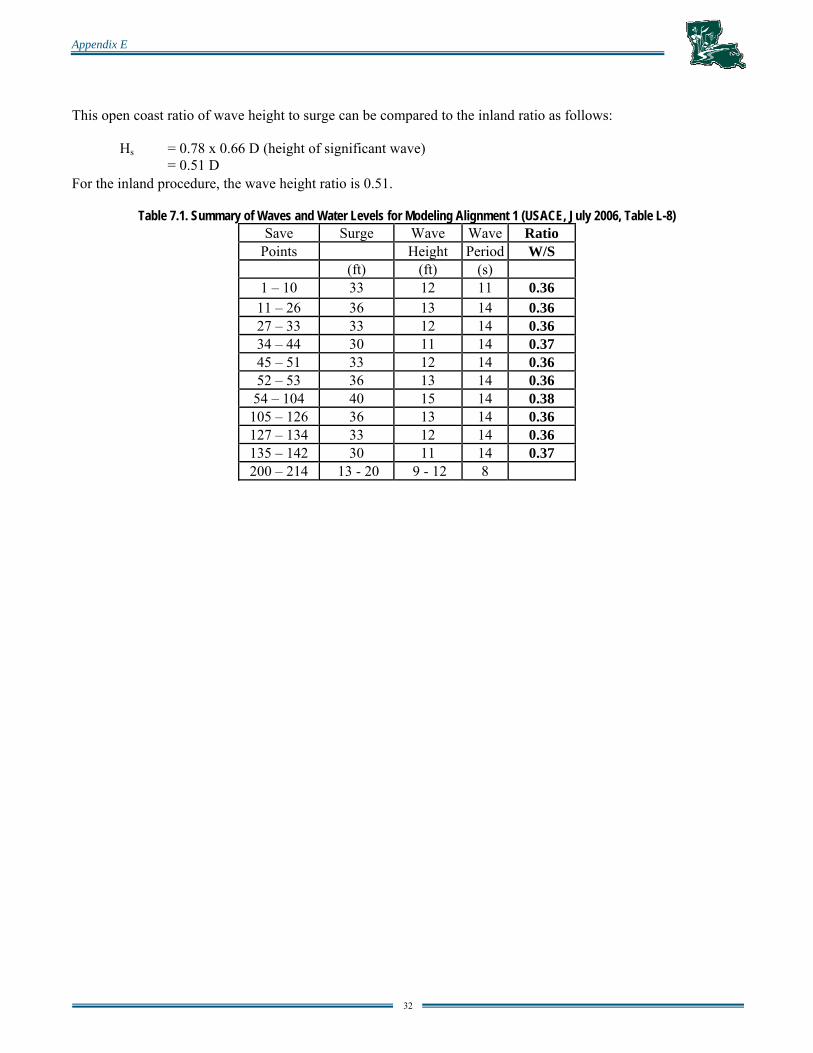
Hs = 0.78 x 0.66 D (height of significant wave) = 0.51 D For the inland procedure, the wave height ratio is 0.51.
Table 7.1. Summary of Waves and Water Levels for Modeling Alignment 1 (USACE, July 2006, Table L-8) Save Surge Wave Wave Ratio
Points Height Period W/S (ft) (ft) (s)
1 – 10 33 12 11 0.36 11 – 26 36 13 14 0.36 27 – 33 33 12 14 0.36 34 – 44 30 11 14 0.37 45 – 51 33 12 14 0.36 52 – 53 36 13 14 0.36
54 – 104 40 15 14 0.38 105 – 126 36 13 14 0.36 127 – 134 33 12 14 0.36 135 – 142 30 11 14 0.37 200 – 214 13 - 20 9 - 12 8
Appendix E
33
Figure 7.1 through 7.10. Save Points 1 to 172 (STWAVE Southeast grid) (USACE, July 2006)
Appendix E
34
Appendix E
35
Appendix E
36
Appendix E
37
Appendix E
38
8.0 Extrapolation of ADCIRC Results No extrapolation was required to estimate the levee heights. However, many of the census blocks used in the economic computations are located north of the output points where CASE1 ADCIRC results are available. ADCIRC grid S10 did not include those areas, but a more recent ADCIRC grid, SL15v3, does extend to high ground. Model estimates of surge heights are not available on the new grid, but the ground elevations were extracted and plotted on the profiles to establish the northward limit of surge elevations. The bed elevation file was then filtered for display, and the green “Xs” in Figure 4.1 were plotted to show the northward extent of bed or ground elevation.
Surge heights were then extrapolated to the northern limit of the economic census blocks using the profile plots. Figure 4.1 illustrates the northern limit of the extrapolated elevations. The surge heights were extrapolated horizontally.

Appendix E
39
9.0 Economic Computations The maximum storm surge elevations in the CASE1 output files were converted into a digital surge elevation map to make the economic computations. The computations were made by census block. This analysis is described in full in Appendix F, Economic Consequences. The economic computations do not include waves, local precipitation, local inflow or pumping. These other components will be important later when design level details are required.
Appendix E
40
10.0 Risk, Reliability and Uncertainty In the general sense, risk and reliability analysis is an analytical method that considers the expected performance of the individual components making up a system and the consequences that result if those components fail to perform as expected. The Interagency Performance Evaluation Task Force (IPET) used the following mathematical expression to define risk:
Risk = (Probability of Failure) times (Consequence of Failure)
In the civil engineering community, performance is defined as the probability that specific loads will cause a system to fail, and losses are defined as the adverse impacts if that failure occurs. Losses can be expressed in terms of lives, dollars, area flooded, environmental qualities, social/cultural metrics ... etc. Whatever metric is used, the adverse impact of the loss is called the Consequence of Failure.
At this stage of development, there is not sufficient information to conduct a realistic risk and reliability analysis for the master plan. Instead, a return-period approach for design events has been used because hurricane severity may be ranked using the surrogate parameter, maximum surge height. The best available data at the time of this writing are the CASE1 surge heights for events having annual probabilities of being equaled or exceeded of 1 percent and 0.2 percent. Uncertainties associated with the CASE1 surge heights were not evaluated. Nevertheless, risk and reliability concepts are very useful for identifying the parameters that do contribute uncertainties in a return-period analysis.
10.1 System Conditions Contributing to Uncertainty The IPET report describes the hurricane protection system as a collection of leveed sub-systems that form hydrologic sub-systems, which they called basins. The basins are independently maintained and operated by local parishes and levee boards.
Components of a the protection system include earthen levees, flood-walls, foundation conditions, pumping stations, canals, wall closures, power supply systems and operations personnel. The hazard that is driving the Probability of Failure in the above expression is the hurricane event. The hurricane loads the levees and flood walls with a peak surge height, effective wave height, effective wave duration, and volume of inflow from local precipitation. The significant parameter for determining the Consequences of Failure is the water level on the protected side of the levee. During Katrina some levees in the hurricane protection system were simply overtopped. In those cases, the water volume entering the protected side could be computed hydraulically. However, levee height was not the only parameter allowing water to enter the protected area. Some levees and flood walls failed, allowing water into protected areas, but the structure was not overtopped. Some were breached when the foundation failed. IPET also discovered that the effectiveness of the system depended on human factors. For example, some components of the sub-system failed because they were stop-logs and gates that had to be physically operated by personnel from the local parish or levee board. In some cases a pumping station became the conduit for letting water into the protected area because the electrical power failed. Therefore, the IPET added operations personnel to their list of system components because their performance during Katrina contributed uncertainty to the performance of the hurricane protection system. They developed the following list of components that contributed uncertainty to the performance of the hurricane system:
Local jurisdiction Flood wall type and cross section
Appendix E
41
Levee type and cross section Engineering parameters defining structural performance Soil strength parameters Foundations parameters
The uncertainties listed above are indicative of the factors affecting the design of elements of the protection system that are somewhat independent of the storm uncertainties. To a large extent because the profession has more experience dealing with them, these uncertainties are better understood compared to those associated with storm parameter measurements and modeling.
There are two fundamentally different sources of uncertainty in an analysis of storm related uncertainty. One is the uncertainty of predicting a future event. This is attributed to the randomness of storm events in nature as we know it. Therefore, these storm events are predicted in terms of their likelihood of occurring (e.g., the chance of heads in a coin flip).
The second source of uncertainty is attributed to the lack of knowledge or data regarding the characteristics of the storms. For example, the ability to determine the likelihood of an event (i.e., its rate of occurrence) requires that field measurements of key storm parameters be available in time and space. If a complete data set were available, the uncertainty in the computed rate of occurrence of the storm parameters would be relatively small. However, the more limited the data set, the greater the uncertainty becomes (i.e., statistical confidence intervals on parameter estimates are large). In addition to the uncertainty that results from a lack of data, there is the uncertainty that results from the lack of knowledge. This uncertainty is attributed to the lack of understanding (e.g., knowledge) about the physical processes that must be modeled (e.g., the meteorological processes that generate hurricane events). Both of these sources, lack of knowledge and lack of data, are pertinent in the application of ADCIRC.
10.2 Uncertainties in the Application of ADCIRC The load on the system due to surge heights is computed by ADCIRC. There are uncertainties associated with the application of ADCIRC in both the calibration and production runs. Uncertainty in knowledge and data affects the computed load on the system. Uncertainty in predicting future conditions affects both the load on the system and the future consequences of failure.
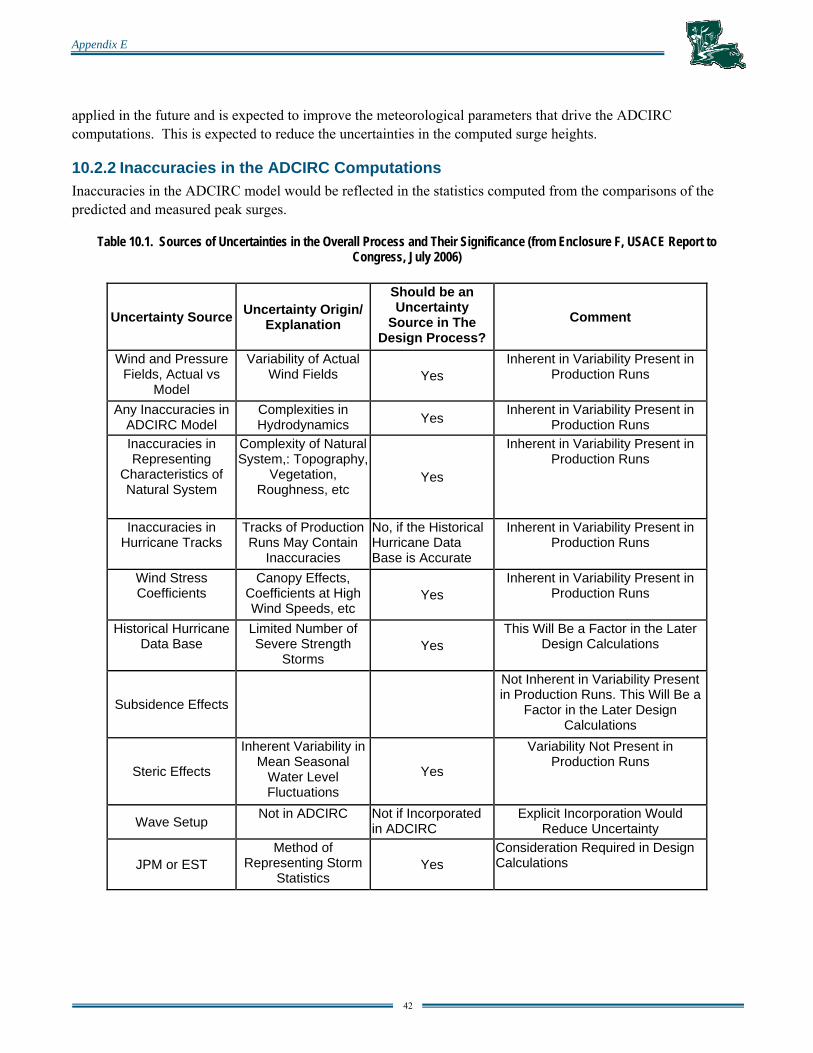
The known sources of uncertainties associated with ADCIRC modeling are presented in column 1 of Table 10.1. The manner in which these uncertainties would contribute to the computations is presented in column 2, and the whether they should be utilized in the design process is stated in column 3. None of these uncertainties were addressed in the master plan. However, they may affect future surge heights computations. Each of those sources is discussed below.
10.2.1 Wind and Pressure Fields The wind field is the fundamental energy source driving ADCIRC computations. It is computed externally and read into ADCIRC as a boundary condition. Hind casting historical events had revealed uncertainties in both the computed winds and barometric pressure fields. Research to reduce that uncertainty is presently under way using newly acquired, high quality aircraft data communications capability. The benefits from this research will be
Appendix E
42
applied in the future and is expected to improve the meteorological parameters that drive the ADCIRC computations. This is expected to reduce the uncertainties in the computed surge heights.
10.2.2 Inaccuracies in the ADCIRC Computations Inaccuracies in the ADCIRC model would be reflected in the statistics computed from the comparisons of the predicted and measured peak surges.
Table 10.1. Sources of Uncertainties in the Overall Process and Their Significance (from Enclosure F, USACE Report to Congress, July 2006)
Uncertainty Source Uncertainty Origin/ Explanation
Should be an Uncertainty
Source in The Design Process?
Comment
Wind and Pressure Fields, Actual vs
Model
Variability of Actual Wind Fields Yes
Inherent in Variability Present in Production Runs
Any Inaccuracies in ADCIRC Model
Complexities in Hydrodynamics Yes Inherent in Variability Present in
Production Runs Inaccuracies in Representing
Characteristics of Natural System
Complexity of Natural System,: Topography,
Vegetation, Roughness, etc
Yes
Inherent in Variability Present in Production Runs
Inaccuracies in Hurricane Tracks
Tracks of Production Runs May Contain
Inaccuracies
No, if the Historical Hurricane Data Base is Accurate
Inherent in Variability Present in Production Runs
Wind Stress Coefficients
Canopy Effects, Coefficients at High Wind Speeds, etc
Yes Inherent in Variability Present in
Production Runs
Historical Hurricane Data Base
Limited Number of Severe Strength
Storms Yes
This Will Be a Factor in the Later Design Calculations
Subsidence Effects
Not Inherent in Variability Present in Production Runs. This Will Be a
Factor in the Later Design Calculations
Steric Effects
Inherent Variability in Mean Seasonal
Water Level Fluctuations
Yes
Variability Not Present in Production Runs
Wave Setup Not in ADCIRC Not if Incorporated in ADCIRC
Explicit Incorporation Would Reduce Uncertainty
JPM or EST Method of
Representing Storm Statistics
Yes Consideration Required in Design Calculations
Appendix E
43
10.2.3 Inaccuracies in Characterizing Natural System Efforts were made to characterize the natural system faithfully. This includes bathymetry of water bodies and topography of land features, including vegetation characteristics. However, the vastness of the study area relative to the resolution of a single land form fronting a levee suggests that considerable uncertainty is likely to be present in some computed surge heights. The variability in vegetation characteristics are another source of uncertainty. Changes in geomorphology during a storm event can make a substantial difference in surge heights in the vicinity of the erosion, deposition or debris mass.
The natural system will change over time because of subsidence, erosion, deposition and sea level rise. Those changes will affect the vegetative cover. Predicting these changes is considered to be a significant uncertainty.
10.2.4 Inaccuracies in Hurricane Tracks Uncertainty is associated with the selection of hurricane tracks. Inaccuracies in a hurricane track are expected to increase the differences between the predicted and measured peak surges. These differences are used to compute the uncertainty for design heights. The resulting design calculations would contain overly conservative results if the uncertainties are too large.
10.2.5 Wind Stress Coefficients The Garratt wind stress coefficients were incorporated into the ADCIRC calculations. There are relatively few measurements of wind speeds during the more extreme events, and this is an area of active research. Recent investigations suggest that wind stress coefficients may level off – or even decrease, at very high wind speeds. If the wind stress coefficients were constant with increasing wind speed, an inappropriate stress coefficient would be offset through calibration (probably adjusting the wind stress coefficient). However, if the wind stress coefficients vary with wind speed, such an adjustment is only appropriate for the range of speeds in the calibration storms. Surge heights in more extreme hurricanes could tend to be overestimated.
10.2.6 Steric Effects The steric contributions to mean water level are a result of the seasonally reduced density of the water due to thermal and fresh water effects. Thus, the steric contribution can be characterized by a monthly average and a statistical distribution about that average. As will be evident later, uncertainties in steric effects were avoided in the evaluation data base which comprised the differences between the peak surges (measured and computed) and their respective mean water levels immediately prior to the hurricane induced water levels. In design it will be necessary to include both the mean steric contribution (appropriate for the hurricane season months) and an approximation of the contribution due to the statistical uncertainty in components of steric water levels.
10.2.7 Historical Hurricane Data Base The record length (time-wise) of the historical hurricane data base is short relative to the time that might be considered appropriate to estimate the occurrence of extreme events needed for this surge height analysis. This will contribute to uncertainties in the return periods of the peak surges.
10.2.8 Subsidence Subsidence and sea level rise are important future conditions. Subsidence includes both regional effects and local effects. The uncertainty in future rates of subsidence and sea level rise is critical to the prediction of levee elevations.

Appendix E
44
10.2.9 Wave Setup Although the basic physics of wave related setup are well understood, to date explicit incorporation into ADCIRC has been precluded by the complexities associated with this incorporation. Wave setup was not included implicitly in the calculated results to date. The issue is being researched.
10.2.10 JPM or EST The Joint Probability Method (JPM) and the Empirical Simulation Technique (EST) are the two general approaches to incorporating the historical hurricane characteristics into the simulation of a series of storms and computing the return periods of the resulting storm surges. There are questions about which of these two methods is more applicable. The issue is being researched.