Embed Size (px)
Citation preview
Atlantic hurricane surge response to geoengineeringJohn C. Moorea,b,1, Aslak Grinsteda,c, Xiaoran Guoa, Xiaoyong Yua, Svetlana Jevrejevaa,d, Annette Rinkea,e,Xuefeng Cuia, Ben Kravitzf, Andrew Lentong, Shingo Watanabeh, and Duoying Jia,1
aJoint Center for Global Change Studies, College of Global Change and Earth System Science, Beijing Normal University, Beijing 100875, China;bArctic Centre, University of Lapland, Rovaniemi 96101, Finland; cCentre for Ice and Climate, Niels Bohr Institute, University of Copenhagen, 2100Copenhagen Ø, Denmark; dNational Oceanography Centre, Liverpool L3 5DA, United Kingdom; eAlfred Wegener Institute, Helmholtz Centre for Polar andMarine Research, Potsdam 14473, Germany; fAtmospheric Sciences and Global Change Division, Pacific Northwest National Laboratory, Richland, WA 99352;gCommonwealth Scientific and Industrial Research Organisation, Oceans and Atmosphere Flagship, Hobart, Tasmania, TAS 7004, Australia; and hJapanAgency for Marine-Earth Science and Technology, Yokohama 237-0061, Japan
Edited by Kerry A. Emanuel, Massachusetts Institute of Technology, Cambridge, MA, and approved September 29, 2015 (received for review June 12, 2015)
Devastating floods due to Atlantic hurricanes are relatively rareevents. However, the frequency of the most intense storms is likelyto increase with rises in sea surface temperatures. Geoengineeringby stratospheric sulfate aerosol injection cools the tropics relativeto the polar regions, including the hurricane Main DevelopmentRegion in the Atlantic, suggesting that geoengineering maymitigate hurricanes. We examine this hypothesis using eight earthsystem model simulations of climate under the GeoengineeringModel Intercomparison Project (GeoMIP) G3 and G4 schemes thatuse stratospheric aerosols to reduce the radiative forcing under theRepresentative Concentration Pathway (RCP) 4.5 scenario. Globalmean temperature increases are greatly ameliorated by geoengineer-ing, and tropical temperature increases are at most half of thosetemperature increases in the RCP4.5. However, sulfate injectionwould have to double (to nearly 10 teragrams of SO2 per year)between 2020 and 2070 to balance the RCP4.5, approximately theequivalent of a 1991 Pinatubo eruption every 2 y, with consequentimplications for stratospheric ozone. We project changes in stormfrequencies using a temperature-dependent generalized extremevalue statistical model calibrated by historical storm surges and ob-served temperatures since 1923. The number of storm surge eventsas big as the one caused by the 2005 Katrina hurricane are reduced byabout 50% compared with no geoengineering, but this reduction isonly marginally statistically significant. Nevertheless, when sea levelrise differences in 2070 between the RCP4.5 and geoengineering arefactored into coastal flood risk, we find that expected flood levels arereduced by about 40 cm for 5-y events and about halved for 50-ysurges.
extremes | flooding | climate engineering
Changes in the frequency and intensity of extreme events, suchas droughts, storms, floods, volcanic eruptions, and earth-
quakes, are generally likely to have more of an impact on theenvironment, human activities, and economies than changes inmean climate. The most intense floods are associated withtropical events, such as typhoons or hurricanes, because thestrong winds and intense low pressure associated with tropicalcyclones generate storm surges (1–3). Damage to coastal cities isthe greatest cost from increased sea level rise and flooding risk(2, 4). Several of the largest cities in the United States are vul-nerable to the Atlantic surge threat, such as those surges causedby Hurricane Katrina (2005) or Superstorm Sandy (2012).Atlantic hurricanes are not simply stochastic events, but are
statistically related to large-scale climate phenomena, such as thestate of El Niño Southern Oscillation (ENSO) (5), North Africandust (6), and, most clearly, global and tropical Atlantic temper-atures (7). Geoengineering is a method of offsetting the globaltemperature rise from greenhouse gases, although inevitablyalso altering other important climate parameters, such as pre-cipitation and teleconnection patterns (8, 9). We may thus askthe question: How successful would geoengineering be at re-ducing the frequency and intensity of hurricane storm surgesfrom Atlantic hurricanes? To date, analyzing extremes under
geoengineering scenarios has been limited (10) due to the rela-tively short (typically 50 y) duration of simulations and, in thecase of intense storms or hurricanes, by the relatively low reso-lution of climate models.The influence of climate change on Atlantic hurricanes has been
difficult to establish: Visual observations of storms were spatiallyconfined to near coastal areas until the satellite era, climate modelshave generally been of too coarse a resolution to resolve hurricanesadequately, and no ab initio model of hurricane formation exists asof yet. A relatively new and unbiased observational index of stormsurges recorded in six high-frequency tide-gauge records extendingback to 1923 from the southeastern United States (3) (Methods)shows that the frequency and magnitude of storm surges variedwith temperature. Warmer sea surface temperatures raise theocean-atmospheric thermodynamic state, increasing the maxi-mum potential tropical cyclone frequency and intensity. However,warming may also dry the middle troposphere and increase verticalwind shear, reducing cyclone numbers (11), although some studiesfind this latter effect to be minor (12). Genesis potential indices(12, 13) empirically combine these factors to relate tropical cyclonecyclogenesis to environmental forcing factors. Genesis potentialdependence on sea surface temperature changes appears similarwhether caused by either increased atmospheric CO2 concentra-tions or changes in insolation at the 1–2 °C range discussed here(13), but aerosol effects that may be relevant to geoengineeringwere not simulated. Geoengineering by injection of sulfate aerosolsinto the lower stratosphere would result in increased absorption ofsolar radiation and localized heating. Increasing concentrations ofgreenhouse gases, to the contrary, leads to cooling of the tropicaltropopause and lower stratosphere. This region of the atmospherecontrols the outflow temperature of tropical cyclones, with warmeroutflow temperatures associated with a decrease in tropical cycloneintensity (14). Despite these complicating factors, Grinsted et al. (7)
Significance
We estimate that stratospheric sulfate aerosol geoengineeringmay somewhat ameliorate Atlantic hurricane intensity andfrequency, but there will be more “Katrina”-level events thanduring the past 30 y. Geoengineering would likely be reason-ably effective at controlling coastal flood risk relative to thecoastal flood risk expected under the Representative Concen-tration Pathway (RCP) 4.5 greenhouse gas warming, in part,due to its impact on global sea level rise, although flood riskwould still be significantly larger than at present.
Author contributions: J.C.M. designed research; J.C.M., A.G., B.K., A.L., S.W., and D.J.performed research; A.G. contributed new reagents/analytic tools; A.G., X.G., X.Y., andD.J. analyzed data; and J.C.M., S.J., A.R., X.C., and B.K. wrote the paper.
The authors declare no conflict of interest.
This article is a PNAS Direct Submission.1To whom correspondence may be addressed. Email: [email protected] or [email protected].
This article contains supporting information online at www.pnas.org/lookup/suppl/doi:10.1073/pnas.1510530112/-/DCSupplemental.
13794–13799 | PNAS | November 10, 2015 | vol. 112 | no. 45 www.pnas.org/cgi/doi/10.1073/pnas.1510530112
showed that globally gridded surface temperatures, temperaturesin the tropical Atlantic Main Development Region (MDR;85°W–20°W and 10°N–20°N), and simple global mean surfacetemperature all explain Atlantic hurricane observations betterthan various predictors previously suggested, such as the NorthAtlantic Oscillation, Southern Oscillation, radiative forcing, andMDR temperature anomaly relative to tropical ocean tempera-tures. Results from downscaling global climate model output togenerate hurricane statistics under changing climate have beenpublished (ref. 15 and references therein); only one method (15)finds increases in North Atlantic tropical cyclone numbers throughthe 21st century, whereas other approaches predict decreases.Robust temperature differences between geoengineered andgreenhouse climates (9) (Results) motivate us to use a tempera-ture-dependent generalized extreme value (GEV) model of cy-clone probability density function (7) rather than counts of poorlyresolved cyclones or changes in vertical wind shear. This modelalso allows both the cyclone intensity and its frequency to berelated to regional or global temperatures.
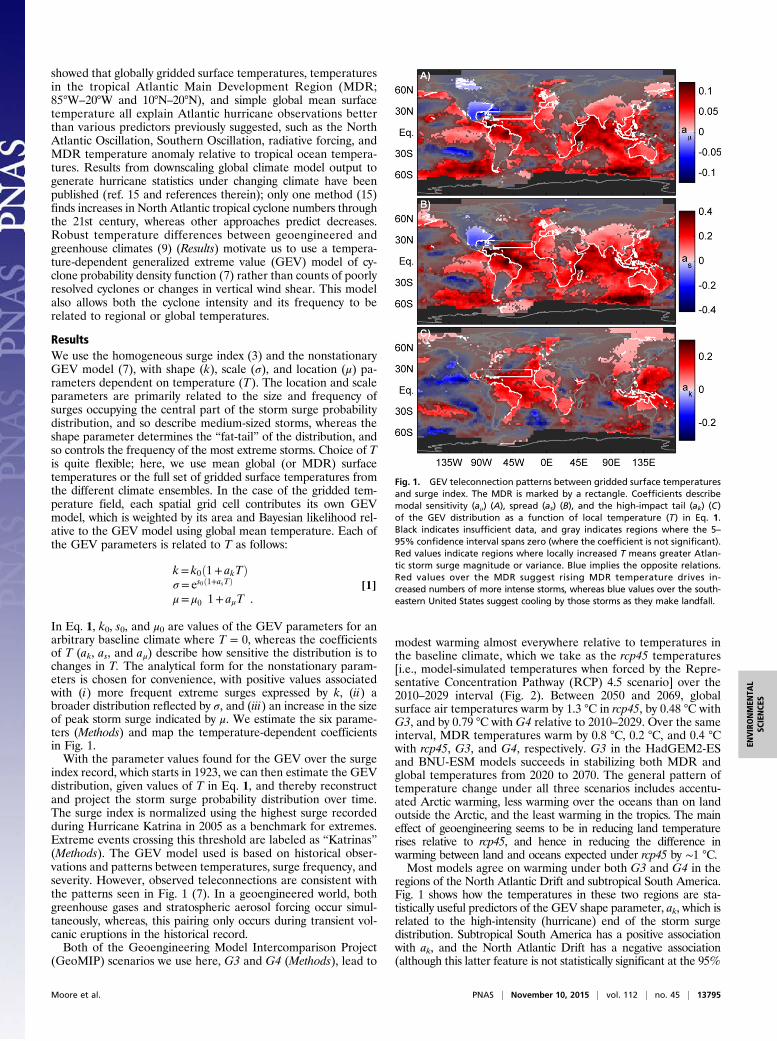
ResultsWe use the homogeneous surge index (3) and the nonstationaryGEV model (7), with shape (k), scale (σ), and location (μ) pa-rameters dependent on temperature (T). The location and scaleparameters are primarily related to the size and frequency ofsurges occupying the central part of the storm surge probabilitydistribution, and so describe medium-sized storms, whereas theshape parameter determines the “fat-tail” of the distribution, andso controls the frequency of the most extreme storms. Choice of Tis quite flexible; here, we use mean global (or MDR) surfacetemperatures or the full set of gridded surface temperatures fromthe different climate ensembles. In the case of the gridded tem-perature field, each spatial grid cell contributes its own GEVmodel, which is weighted by its area and Bayesian likelihood rel-ative to the GEV model using global mean temperature. Each ofthe GEV parameters is related to T as follows:
k= k0ð1+ akTÞσ = es0ð1+asTÞ
μ= μ0�1+ aμT
�.
[1]
In Eq. 1, k0, s0, and μ0 are values of the GEV parameters for anarbitrary baseline climate where T = 0, whereas the coefficientsof T (ak, as, and aμ) describe how sensitive the distribution is tochanges in T. The analytical form for the nonstationary param-eters is chosen for convenience, with positive values associatedwith (i) more frequent extreme surges expressed by k, (ii) abroader distribution reflected by σ, and (iii) an increase in the sizeof peak storm surge indicated by μ. We estimate the six parame-ters (Methods) and map the temperature-dependent coefficientsin Fig. 1.With the parameter values found for the GEV over the surge
index record, which starts in 1923, we can then estimate the GEVdistribution, given values of T in Eq. 1, and thereby reconstructand project the storm surge probability distribution over time.The surge index is normalized using the highest surge recordedduring Hurricane Katrina in 2005 as a benchmark for extremes.Extreme events crossing this threshold are labeled as “Katrinas”(Methods). The GEV model used is based on historical obser-vations and patterns between temperatures, surge frequency, andseverity. However, observed teleconnections are consistent withthe patterns seen in Fig. 1 (7). In a geoengineered world, bothgreenhouse gases and stratospheric aerosol forcing occur simul-taneously, whereas, this pairing only occurs during transient vol-canic eruptions in the historical record.Both of the Geoengineering Model Intercomparison Project
(GeoMIP) scenarios we use here, G3 and G4 (Methods), lead to
modest warming almost everywhere relative to temperatures inthe baseline climate, which we take as the rcp45 temperatures[i.e., model-simulated temperatures when forced by the Repre-sentative Concentration Pathway (RCP) 4.5 scenario] over the2010–2029 interval (Fig. 2). Between 2050 and 2069, globalsurface air temperatures warm by 1.3 °C in rcp45, by 0.48 °C withG3, and by 0.79 °C with G4 relative to 2010–2029. Over the sameinterval, MDR temperatures warm by 0.8 °C, 0.2 °C, and 0.4 °Cwith rcp45, G3, and G4, respectively. G3 in the HadGEM2-ESand BNU-ESM models succeeds in stabilizing both MDR andglobal temperatures from 2020 to 2070. The general pattern oftemperature change under all three scenarios includes accentu-ated Arctic warming, less warming over the oceans than on landoutside the Arctic, and the least warming in the tropics. The maineffect of geoengineering seems to be in reducing land temperaturerises relative to rcp45, and hence in reducing the difference inwarming between land and oceans expected under rcp45 by ∼1 °C.Most models agree on warming under both G3 and G4 in the
regions of the North Atlantic Drift and subtropical South America.Fig. 1 shows how the temperatures in these two regions are sta-tistically useful predictors of the GEV shape parameter, ak, which isrelated to the high-intensity (hurricane) end of the storm surgedistribution. Subtropical South America has a positive associationwith ak, and the North Atlantic Drift has a negative association(although this latter feature is not statistically significant at the 95%
Fig. 1. GEV teleconnection patterns between gridded surface temperaturesand surge index. The MDR is marked by a rectangle. Coefficients describemodal sensitivity (aμ) (A), spread (as) (B), and the high-impact tail (ak) (C)of the GEV distribution as a function of local temperature (T) in Eq. 1.Black indicates insufficient data, and gray indicates regions where the 5–95% confidence interval spans zero (where the coefficient is not significant).Red values indicate regions where locally increased T means greater Atlan-tic storm surge magnitude or variance. Blue implies the opposite relations.Red values over the MDR suggest rising MDR temperature drives in-creased numbers of more intense storms, whereas blue values over the south-eastern United States suggest cooling by those storms as they make landfall.
Moore et al. PNAS | November 10, 2015 | vol. 112 | no. 45 | 13795
ENVIRONMEN
TAL
SCIENCE
S
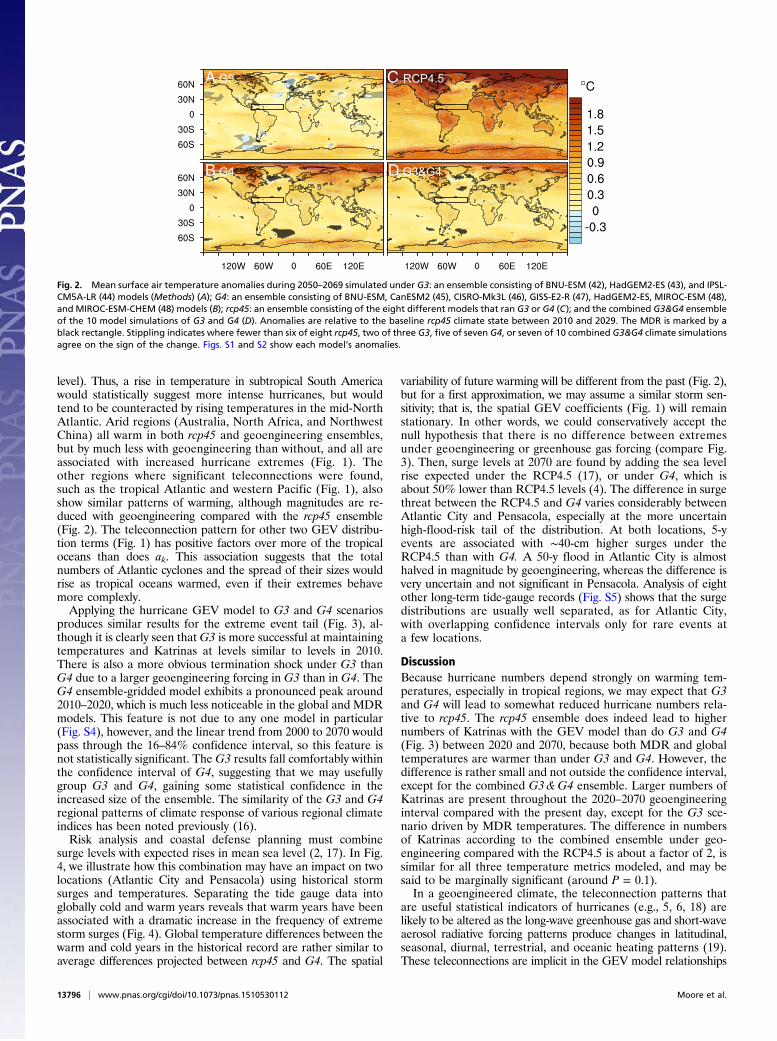
level). Thus, a rise in temperature in subtropical South Americawould statistically suggest more intense hurricanes, but wouldtend to be counteracted by rising temperatures in the mid-NorthAtlantic. Arid regions (Australia, North Africa, and NorthwestChina) all warm in both rcp45 and geoengineering ensembles,but by much less with geoengineering than without, and all areassociated with increased hurricane extremes (Fig. 1). Theother regions where significant teleconnections were found,such as the tropical Atlantic and western Pacific (Fig. 1), alsoshow similar patterns of warming, although magnitudes are re-duced with geoengineering compared with the rcp45 ensemble(Fig. 2). The teleconnection pattern for other two GEV distribu-tion terms (Fig. 1) has positive factors over more of the tropicaloceans than does ak. This association suggests that the totalnumbers of Atlantic cyclones and the spread of their sizes wouldrise as tropical oceans warmed, even if their extremes behavemore complexly.Applying the hurricane GEV model to G3 and G4 scenarios
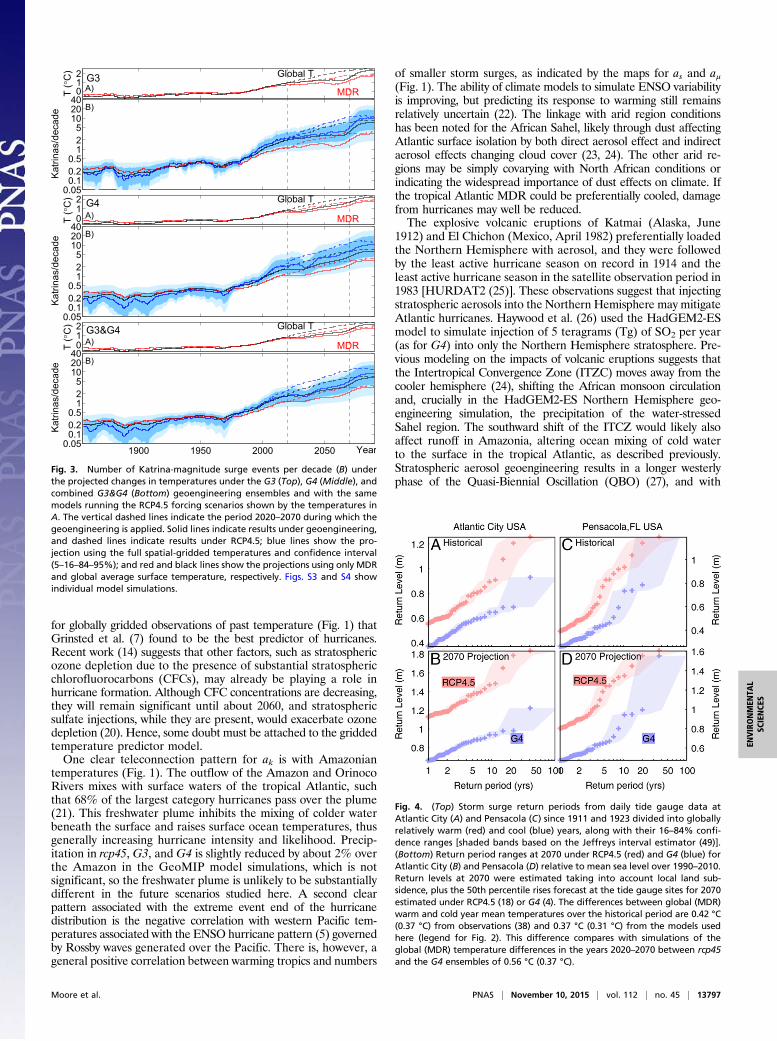
produces similar results for the extreme event tail (Fig. 3), al-though it is clearly seen thatG3 is more successful at maintainingtemperatures and Katrinas at levels similar to levels in 2010.There is also a more obvious termination shock under G3 thanG4 due to a larger geoengineering forcing in G3 than in G4. TheG4 ensemble-gridded model exhibits a pronounced peak around2010–2020, which is much less noticeable in the global and MDRmodels. This feature is not due to any one model in particular(Fig. S4), however, and the linear trend from 2000 to 2070 wouldpass through the 16–84% confidence interval, so this feature isnot statistically significant. The G3 results fall comfortably withinthe confidence interval of G4, suggesting that we may usefullygroup G3 and G4, gaining some statistical confidence in theincreased size of the ensemble. The similarity of the G3 and G4regional patterns of climate response of various regional climateindices has been noted previously (16).Risk analysis and coastal defense planning must combine
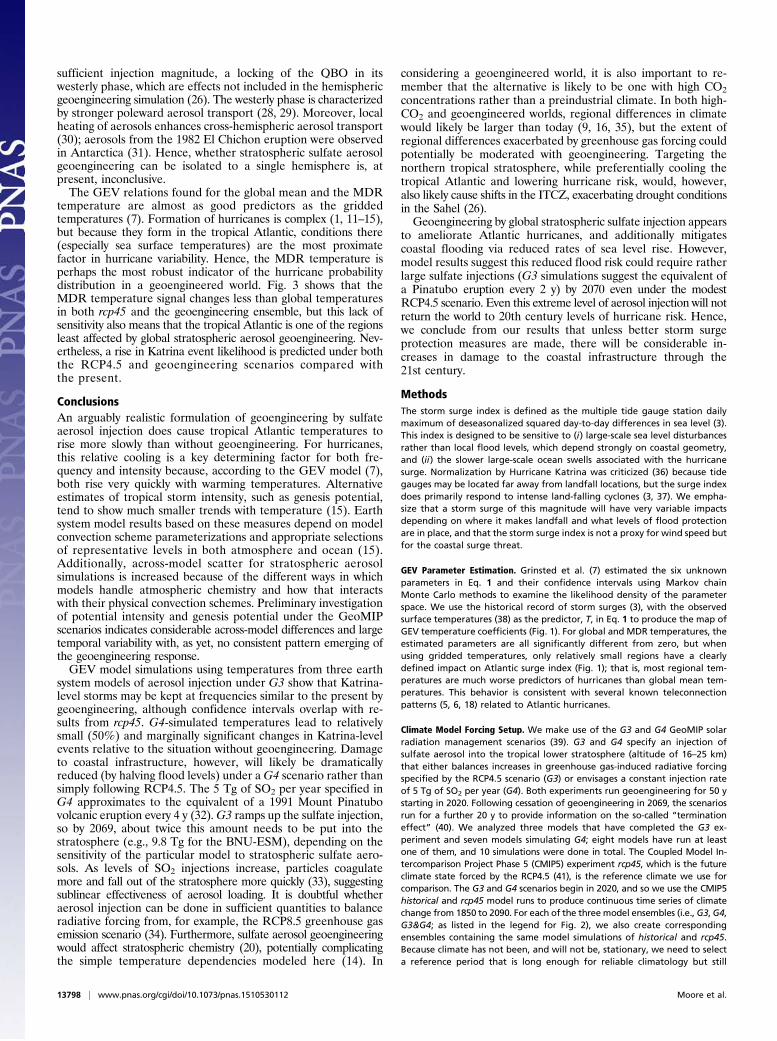
surge levels with expected rises in mean sea level (2, 17). In Fig.4, we illustrate how this combination may have an impact on twolocations (Atlantic City and Pensacola) using historical stormsurges and temperatures. Separating the tide gauge data intoglobally cold and warm years reveals that warm years have beenassociated with a dramatic increase in the frequency of extremestorm surges (Fig. 4). Global temperature differences between thewarm and cold years in the historical record are rather similar toaverage differences projected between rcp45 and G4. The spatial
variability of future warming will be different from the past (Fig. 2),but for a first approximation, we may assume a similar storm sen-sitivity; that is, the spatial GEV coefficients (Fig. 1) will remainstationary. In other words, we could conservatively accept thenull hypothesis that there is no difference between extremesunder geoengineering or greenhouse gas forcing (compare Fig.3). Then, surge levels at 2070 are found by adding the sea levelrise expected under the RCP4.5 (17), or under G4, which isabout 50% lower than RCP4.5 levels (4). The difference in surgethreat between the RCP4.5 and G4 varies considerably betweenAtlantic City and Pensacola, especially at the more uncertainhigh-flood-risk tail of the distribution. At both locations, 5-yevents are associated with ∼40-cm higher surges under theRCP4.5 than with G4. A 50-y flood in Atlantic City is almosthalved in magnitude by geoengineering, whereas the difference isvery uncertain and not significant in Pensacola. Analysis of eightother long-term tide-gauge records (Fig. S5) shows that the surgedistributions are usually well separated, as for Atlantic City,with overlapping confidence intervals only for rare events ata few locations.
DiscussionBecause hurricane numbers depend strongly on warming tem-peratures, especially in tropical regions, we may expect that G3and G4 will lead to somewhat reduced hurricane numbers rela-tive to rcp45. The rcp45 ensemble does indeed lead to highernumbers of Katrinas with the GEV model than do G3 and G4(Fig. 3) between 2020 and 2070, because both MDR and globaltemperatures are warmer than under G3 and G4. However, thedifference is rather small and not outside the confidence interval,except for the combined G3&G4 ensemble. Larger numbers ofKatrinas are present throughout the 2020–2070 geoengineeringinterval compared with the present day, except for the G3 sce-nario driven by MDR temperatures. The difference in numbersof Katrinas according to the combined ensemble under geo-engineering compared with the RCP4.5 is about a factor of 2, issimilar for all three temperature metrics modeled, and may besaid to be marginally significant (around P = 0.1).In a geoengineered climate, the teleconnection patterns that
are useful statistical indicators of hurricanes (e.g., 5, 6, 18) arelikely to be altered as the long-wave greenhouse gas and short-waveaerosol radiative forcing patterns produce changes in latitudinal,seasonal, diurnal, terrestrial, and oceanic heating patterns (19).These teleconnections are implicit in the GEV model relationships
A G3
B G4
C RCP4.5
D G3&G4
Fig. 2. Mean surface air temperature anomalies during 2050–2069 simulated under G3: an ensemble consisting of BNU-ESM (42), HadGEM2-ES (43), and IPSL-CM5A-LR (44) models (Methods) (A); G4: an ensemble consisting of BNU-ESM, CanESM2 (45), CISRO-Mk3L (46), GISS-E2-R (47), HadGEM2-ES, MIROC-ESM (48),and MIROC-ESM-CHEM (48) models (B); rcp45: an ensemble consisting of the eight different models that ran G3 or G4 (C); and the combined G3&G4 ensembleof the 10 model simulations of G3 and G4 (D). Anomalies are relative to the baseline rcp45 climate state between 2010 and 2029. The MDR is marked by ablack rectangle. Stippling indicates where fewer than six of eight rcp45, two of three G3, five of seven G4, or seven of 10 combined G3&G4 climate simulationsagree on the sign of the change. Figs. S1 and S2 show each model’s anomalies.
13796 | www.pnas.org/cgi/doi/10.1073/pnas.1510530112 Moore et al.
for globally gridded observations of past temperature (Fig. 1) thatGrinsted et al. (7) found to be the best predictor of hurricanes.Recent work (14) suggests that other factors, such as stratosphericozone depletion due to the presence of substantial stratosphericchlorofluorocarbons (CFCs), may already be playing a role inhurricane formation. Although CFC concentrations are decreasing,they will remain significant until about 2060, and stratosphericsulfate injections, while they are present, would exacerbate ozonedepletion (20). Hence, some doubt must be attached to the griddedtemperature predictor model.One clear teleconnection pattern for ak is with Amazonian
temperatures (Fig. 1). The outflow of the Amazon and OrinocoRivers mixes with surface waters of the tropical Atlantic, suchthat 68% of the largest category hurricanes pass over the plume(21). This freshwater plume inhibits the mixing of colder waterbeneath the surface and raises surface ocean temperatures, thusgenerally increasing hurricane intensity and likelihood. Precip-itation in rcp45, G3, and G4 is slightly reduced by about 2% overthe Amazon in the GeoMIP model simulations, which is notsignificant, so the freshwater plume is unlikely to be substantiallydifferent in the future scenarios studied here. A second clearpattern associated with the extreme event end of the hurricanedistribution is the negative correlation with western Pacific tem-peratures associated with the ENSO hurricane pattern (5) governedby Rossby waves generated over the Pacific. There is, however, ageneral positive correlation between warming tropics and numbers
of smaller storm surges, as indicated by the maps for as and aμ(Fig. 1). The ability of climate models to simulate ENSO variabilityis improving, but predicting its response to warming still remainsrelatively uncertain (22). The linkage with arid region conditionshas been noted for the African Sahel, likely through dust affectingAtlantic surface isolation by both direct aerosol effect and indirectaerosol effects changing cloud cover (23, 24). The other arid re-gions may be simply covarying with North African conditions orindicating the widespread importance of dust effects on climate. Ifthe tropical Atlantic MDR could be preferentially cooled, damagefrom hurricanes may well be reduced.The explosive volcanic eruptions of Katmai (Alaska, June
1912) and El Chichon (Mexico, April 1982) preferentially loadedthe Northern Hemisphere with aerosol, and they were followedby the least active hurricane season on record in 1914 and theleast active hurricane season in the satellite observation period in1983 [HURDAT2 (25)]. These observations suggest that injectingstratospheric aerosols into the Northern Hemisphere may mitigateAtlantic hurricanes. Haywood et al. (26) used the HadGEM2-ESmodel to simulate injection of 5 teragrams (Tg) of SO2 per year(as for G4) into only the Northern Hemisphere stratosphere. Pre-vious modeling on the impacts of volcanic eruptions suggests thatthe Intertropical Convergence Zone (ITZC) moves away from thecooler hemisphere (24), shifting the African monsoon circulationand, crucially in the HadGEM2-ES Northern Hemisphere geo-engineering simulation, the precipitation of the water-stressedSahel region. The southward shift of the ITCZ would likely alsoaffect runoff in Amazonia, altering ocean mixing of cold waterto the surface in the tropical Atlantic, as described previously.Stratospheric aerosol geoengineering results in a longer westerlyphase of the Quasi-Biennial Oscillation (QBO) (27), and with
Fig. 4. (Top) Storm surge return periods from daily tide gauge data atAtlantic City (A) and Pensacola (C) since 1911 and 1923 divided into globallyrelatively warm (red) and cool (blue) years, along with their 16–84% confi-dence ranges [shaded bands based on the Jeffreys interval estimator (49)].(Bottom) Return period ranges at 2070 under RCP4.5 (red) and G4 (blue) forAtlantic City (B) and Pensacola (D) relative to mean sea level over 1990–2010.Return levels at 2070 were estimated taking into account local land sub-sidence, plus the 50th percentile rises forecast at the tide gauge sites for 2070estimated under RCP4.5 (18) or G4 (4). The differences between global (MDR)warm and cold year mean temperatures over the historical period are 0.42 °C(0.37 °C) from observations (38) and 0.37 °C (0.31 °C) from the models usedhere (legend for Fig. 2). This difference compares with simulations of theglobal (MDR) temperature differences in the years 2020–2070 between rcp45and the G4 ensembles of 0.56 °C (0.37 °C).
Fig. 3. Number of Katrina-magnitude surge events per decade (B) underthe projected changes in temperatures under the G3 (Top), G4 (Middle), andcombined G3&G4 (Bottom) geoengineering ensembles and with the samemodels running the RCP4.5 forcing scenarios shown by the temperatures inA. The vertical dashed lines indicate the period 2020–2070 during which thegeoengineering is applied. Solid lines indicate results under geoengineering,and dashed lines indicate results under RCP4.5; blue lines show the pro-jection using the full spatial-gridded temperatures and confidence interval(5–16–84–95%); and red and black lines show the projections using only MDRand global average surface temperature, respectively. Figs. S3 and S4 showindividual model simulations.
Moore et al. PNAS | November 10, 2015 | vol. 112 | no. 45 | 13797
ENVIRONMEN
TAL
SCIENCE
S
sufficient injection magnitude, a locking of the QBO in itswesterly phase, which are effects not included in the hemisphericgeoengineering simulation (26). The westerly phase is characterizedby stronger poleward aerosol transport (28, 29). Moreover, localheating of aerosols enhances cross-hemispheric aerosol transport(30); aerosols from the 1982 El Chichon eruption were observedin Antarctica (31). Hence, whether stratospheric sulfate aerosolgeoengineering can be isolated to a single hemisphere is, atpresent, inconclusive.The GEV relations found for the global mean and the MDR
temperature are almost as good predictors as the griddedtemperatures (7). Formation of hurricanes is complex (1, 11–15),but because they form in the tropical Atlantic, conditions there(especially sea surface temperatures) are the most proximatefactor in hurricane variability. Hence, the MDR temperature isperhaps the most robust indicator of the hurricane probabilitydistribution in a geoengineered world. Fig. 3 shows that theMDR temperature signal changes less than global temperaturesin both rcp45 and the geoengineering ensemble, but this lack ofsensitivity also means that the tropical Atlantic is one of the regionsleast affected by global stratospheric aerosol geoengineering. Nev-ertheless, a rise in Katrina event likelihood is predicted under boththe RCP4.5 and geoengineering scenarios compared withthe present.
ConclusionsAn arguably realistic formulation of geoengineering by sulfateaerosol injection does cause tropical Atlantic temperatures torise more slowly than without geoengineering. For hurricanes,this relative cooling is a key determining factor for both fre-quency and intensity because, according to the GEV model (7),both rise very quickly with warming temperatures. Alternativeestimates of tropical storm intensity, such as genesis potential,tend to show much smaller trends with temperature (15). Earthsystem model results based on these measures depend on modelconvection scheme parameterizations and appropriate selectionsof representative levels in both atmosphere and ocean (15).Additionally, across-model scatter for stratospheric aerosolsimulations is increased because of the different ways in whichmodels handle atmospheric chemistry and how that interactswith their physical convection schemes. Preliminary investigationof potential intensity and genesis potential under the GeoMIPscenarios indicates considerable across-model differences and largetemporal variability with, as yet, no consistent pattern emerging ofthe geoengineering response.GEV model simulations using temperatures from three earth
system models of aerosol injection under G3 show that Katrina-level storms may be kept at frequencies similar to the present bygeoengineering, although confidence intervals overlap with re-sults from rcp45. G4-simulated temperatures lead to relativelysmall (50%) and marginally significant changes in Katrina-levelevents relative to the situation without geoengineering. Damageto coastal infrastructure, however, will likely be dramaticallyreduced (by halving flood levels) under aG4 scenario rather thansimply following RCP4.5. The 5 Tg of SO2 per year specified inG4 approximates to the equivalent of a 1991 Mount Pinatubovolcanic eruption every 4 y (32).G3 ramps up the sulfate injection,so by 2069, about twice this amount needs to be put into thestratosphere (e.g., 9.8 Tg for the BNU-ESM), depending on thesensitivity of the particular model to stratospheric sulfate aero-sols. As levels of SO2 injections increase, particles coagulatemore and fall out of the stratosphere more quickly (33), suggestingsublinear effectiveness of aerosol loading. It is doubtful whetheraerosol injection can be done in sufficient quantities to balanceradiative forcing from, for example, the RCP8.5 greenhouse gasemission scenario (34). Furthermore, sulfate aerosol geoengineeringwould affect stratospheric chemistry (20), potentially complicatingthe simple temperature dependencies modeled here (14). In
considering a geoengineered world, it is also important to re-member that the alternative is likely to be one with high CO2concentrations rather than a preindustrial climate. In both high-CO2 and geoengineered worlds, regional differences in climatewould likely be larger than today (9, 16, 35), but the extent ofregional differences exacerbated by greenhouse gas forcing couldpotentially be moderated with geoengineering. Targeting thenorthern tropical stratosphere, while preferentially cooling thetropical Atlantic and lowering hurricane risk, would, however,also likely cause shifts in the ITCZ, exacerbating drought conditionsin the Sahel (26).Geoengineering by global stratospheric sulfate injection appears
to ameliorate Atlantic hurricanes, and additionally mitigatescoastal flooding via reduced rates of sea level rise. However,model results suggest this reduced flood risk could require ratherlarge sulfate injections (G3 simulations suggest the equivalent ofa Pinatubo eruption every 2 y) by 2070 even under the modestRCP4.5 scenario. Even this extreme level of aerosol injection will notreturn the world to 20th century levels of hurricane risk. Hence,we conclude from our results that unless better storm surgeprotection measures are made, there will be considerable in-creases in damage to the coastal infrastructure through the21st century.
MethodsThe storm surge index is defined as the multiple tide gauge station dailymaximum of deseasonalized squared day-to-day differences in sea level (3).This index is designed to be sensitive to (i) large-scale sea level disturbancesrather than local flood levels, which depend strongly on coastal geometry,and (ii) the slower large-scale ocean swells associated with the hurricanesurge. Normalization by Hurricane Katrina was criticized (36) because tidegauges may be located far away from landfall locations, but the surge indexdoes primarily respond to intense land-falling cyclones (3, 37). We empha-size that a storm surge of this magnitude will have very variable impactsdepending on where it makes landfall and what levels of flood protectionare in place, and that the storm surge index is not a proxy for wind speed butfor the coastal surge threat.
GEV Parameter Estimation. Grinsted et al. (7) estimated the six unknownparameters in Eq. 1 and their confidence intervals using Markov chainMonte Carlo methods to examine the likelihood density of the parameterspace. We use the historical record of storm surges (3), with the observedsurface temperatures (38) as the predictor, T, in Eq. 1 to produce the map ofGEV temperature coefficients (Fig. 1). For global and MDR temperatures, theestimated parameters are all significantly different from zero, but whenusing gridded temperatures, only relatively small regions have a clearlydefined impact on Atlantic surge index (Fig. 1); that is, most regional tem-peratures are much worse predictors of hurricanes than global mean tem-peratures. This behavior is consistent with several known teleconnectionpatterns (5, 6, 18) related to Atlantic hurricanes.
Climate Model Forcing Setup. We make use of the G3 and G4 GeoMIP solarradiation management scenarios (39). G3 and G4 specify an injection ofsulfate aerosol into the tropical lower stratosphere (altitude of 16–25 km)that either balances increases in greenhouse gas-induced radiative forcingspecified by the RCP4.5 scenario (G3) or envisages a constant injection rateof 5 Tg of SO2 per year (G4). Both experiments run geoengineering for 50 ystarting in 2020. Following cessation of geoengineering in 2069, the scenariosrun for a further 20 y to provide information on the so-called “terminationeffect” (40). We analyzed three models that have completed the G3 ex-periment and seven models simulating G4; eight models have run at leastone of them, and 10 simulations were done in total. The Coupled Model In-tercomparison Project Phase 5 (CMIP5) experiment rcp45, which is the futureclimate state forced by the RCP4.5 (41), is the reference climate we use forcomparison. The G3 and G4 scenarios begin in 2020, and so we use the CMIP5historical and rcp45 model runs to produce continuous time series of climatechange from 1850 to 2090. For each of the three model ensembles (i.e., G3, G4,G3&G4; as listed in the legend for Fig. 2), we also create correspondingensembles containing the same model simulations of historical and rcp45.Because climate has not been, and will not be, stationary, we need to selecta reference period that is long enough for reliable climatology but still
13798 | www.pnas.org/cgi/doi/10.1073/pnas.1510530112 Moore et al.
leaves significant climate change under the RCP4.5 by 2070; hence, we usethe 2010–2029 interval as our reference climate.
Other model fields, such as precipitation under G3 and G4, showmuch lesssignificant regional differences than do temperature anomalies (16, 35).Furthermore, under geoengineering, there are smaller changes in precipitationcompared with preindustrial precipitation than under purely greenhouse gasforcing (8, 16); this effect is related to much smaller temperature-drivenfeedbacks in the climate system under geoengineering than under puregreenhouse gas forcing (19). These smaller feedbacks would imply that ageoengineered high-CO2 world may be closer to our present climate than apurely greenhouse gas-forced world in terms of hurricane frequency, whichis, of course, one potential objective of geoengineering; hence, the GEV modelparameters or the surge threat found from the historical period are as plau-sible in G3 and G4 as they are under the RCP4.5.
We also examined daily two- to six-bandpass filtered sea level pressurevariability, wind shear, thermodynamic potential intensity, and genesispotential (14, 15) over the MDR region in earth system model output forchanges that could characterize changes in cyclone activity. We found nosignificant differences, which may perhaps be expected, given the
relatively low resolution (≈200 km) of the models compared with tropicalcyclones.
ACKNOWLEDGMENTS. We thank J. Haywood and A. Jones, the editor, andtwo anonymous referees for suggesting improvements to the manuscript;all participants of the GeoMIP and their model development teams; theCLIVAR/WCRP Working Group on Coupled Modeling for endorsing theGeoMIP; and the scientists managing the earth system grid data nodes who haveassisted with making GeoMIP output available. This research was funded bythe National Basic Research Program of China (Grant 2015CB953600). ThePacific Northwest National Laboratory is operated for the US Department ofEnergy by Battelle Memorial Institute under Contract DE-AC05-76RL01830.GISS ModelE2 simulations were supported by the National Aeronautics andSpace Administration (NASA) High-End Computing Program through theNASA Center for Climate Simulation at the Goddard Space Flight Center.S.J. was funded by the European Union’s Seventh Programme for Research,Technological Development and Demonstration under Grant FP7-ENV-2013-Two-Stage-603396- RISES-AM. A.L. was supported by the Common-wealth Scientific and Industrial Research Organisation Oceans, AtmosphereFlagship, and S.W. was supported by the SOUSEI Program, Ministry of Ed-ucation, Culture, Sports, Science and Technology, Japan.
1. Knutson TR, et al. (2010) Tropical cyclones and climate change. Nat Geosci 3:157–163.2. Lin N, Emanuel K, Oppenheimer M, Vanmarcke E (2012) Physically based assessment
of hurricane surge threat under climate change. Nat Clim Change 2:462–467.3. Grinsted A, Moore JC, Jevrejeva S (2012) Homogeneous record of Atlantic hurricane
surge threat since 1923. Proc Natl Acad Sci USA 109(48):19601–19605.4. Moore JC, Jevrejeva S, Grinsted A (2010) Efficacy of geoengineering to limit 21st
century sea-level rise. Proc Natl Acad Sci USA 107(36):15699–15703.5. Gray WM (1984) Atlantic seasonal hurricane frequency. Part I: El Niño and 30 mb
quasi-biennial oscillation influences. Monthly Weather Review 112(9):1649–1668.6. Gray WM (1990) Strong association between west african rainfall and u.s. Landfall of
intense hurricanes. Science 249(4974):1251–1256.7. Grinsted A, Moore JC, Jevrejeva S (2013) Projected Atlantic tropical cyclone threat
from rising temperatures. Proc Natl Acad Sci USA 110(14):5369–5373.8. Tilmes S, et al. (2013) The hydrological impact of geo-engineering in the Geo-
engineering Model Intercomparison Project (GeoMIP). J Geophys Res 118(19):11036–11058.
9. Ricke KL, Morgan MG, Allen MR (2010) Regional climate response to solar-radiationmanagement. Nat Geosci 3:537–541.
10. Curry CL, et al. (2014) A multi-model examination of climate extremes in an idealizedgeoengineering experiment. J Geophys Res 119(7):3900–3923.
11. Vecchi GA, Soden BJ (2007) Increased tropical Atlantic wind shear in model projec-tions of global warming. Geophys Res Lett 34:L08702.
12. Bruyère C, Holland G, Towler E (2012) Investigating the use of a Genesis PotentialIndex for tropical cyclones in the North Atlantic Basin. J Clim 25(24):8611–8626.
13. Emanuel K, Sobel A (2013) Response of tropical sea surface temperature, pre-cipitation, and tropical cyclone-related variables to changes in global and localforcing. Journal of Advances in Modeling Earth Systems 5(2):447–458.
14. Emanuel K, Solomon S, Folini D, Davis S, Cagnazzo C (2013) Influence of tropicaltropopause layer cooling on Atlantic hurricane activity. J Clim 26:2288–2301.
15. Emanuel KA (2013) Downscaling CMIP5 climate models shows increased tropical cy-clone activity over the 21st century. Proc Natl Acad Sci USA 110(30):12219–12224.
16. Yu X, et al. (2015) Impacts, effectiveness and regional inequalities of the GeoMIP G1to G4 solar radiation management scenarios. Global Planet Change 129:10–22.
17. Kopp RW, et al. (2014) Probabilistic 21st and 22nd century sea-level projections at aglobal network of tide gauge sites. Earth’s Future 2:383–406.
18. Moore JC, Grinsted A, Jevrejeva S (2008) Gulf stream and ENSO increase the tem-perature sensitivity of Atlantic tropical cyclones. J Clim 21(7):1523–1531.
19. Kravitz B, et al. (2013) An energetic perspective on hydrologic cycle changes in theGeoengineering Model Intercomparison Project (GeoMIP). J Geophys Res 118:13087–13102.
20. Tilmes S, Müller R, Salawitch R (2008) The sensitivity of polar ozone depletion toproposed geoengineering schemes. Science 320(5880):1201–1204.
21. Grodsky SA, et al. (2012) Haline hurricane wake in the Amazon/Orinoco plume:AQUARIUS/SACD and SMOS observations. Geophys Res Lett 39:L20603.
22. Bellenger H, Guilyardi E, Leloup J, Lengaigne M, Vialard J (2014) ENSO representationin climate models: From CMIP3 to CMIP5. Clim Dyn 42:1999–2018.
23. Wang CZ, Dong SF, Evan AT, Foltz GR, Lee SK (2012) Multidecadal covariability ofNorth Atlantic sea surface temperature, African dust, Sahel rainfall, and Atlantichurricanes. J Clim 25:5404–5415.
24. Booth BB, Dunstone NJ, Halloran PR, Andrews T, Bellouin N (2012) Aerosols impli-cated as a prime driver of twentieth-century North Atlantic climate variability. Nature484:228–232.
25. Landsea CW, Franklin JL, Beven JL (2013) The revised Atlantic hurricane database(HURDAT2). United States National Oceanic and Atmospheric Administration’s
National Weather Service. Available at www.nhc.noaa.gov/data/hurdat/hurdat2-format-atlantic.pdf. Accessed May 20, 2015.
26. Haywood JM, Jones A, Bellouin N, Stephenson D (2013) Asymmetric forcing fromstratospheric aerosols impacts Sahelian rainfall. Nat Clim Chang 3:660–665.
27. Aquila V, Garfinkel CI, Newman PA, Oman LD, Waugh DW (2014) Modifications of thequasi-biennial oscillation by a geoengineering perturbation of the stratosphericaerosol layer. Geophys Res Lett 41:1738–1744.
28. Trepte CR, Veiga RE, McCormick MP (1993) The poleward dispersal of Mount Pina-tubo volcanic aerosol. J Geophys Res 98:18563–18573.
29. McCormick MP, Thomason LW, Trepte CR (1993) Atmospheric effects of the Mt. Pi-natubo eruption. Nature 373:399–404.
30. Young RE, Houben H, Toon OB (1994) Radiatively forced dispersion of the Mt. Pi-natubo volcanic cloud and induced temperature perturbations in the stratosphereduring the first few months following the eruption. Geophys Res Lett 21:369–372.
31. Hofmann DJ, Rosen JM (1985) Antarctic observations of stratospheric aerosol andhigh altitude condensation nuclei following the El Chichon eruption. Geophys ResLett 12:13–16.
32. Bluth GJS, Doiron SD, Schnetzler CC, Krueger AJ, Walter LS (1992) Global tracking ofthe SO2 clouds from the June 1991 Mount Pinatubo eruptions. Geophys Res Lett 19:151–154.
33. Heckendorn P, et al. (2009) The impact of geoengineering aerosols on stratospherictemperature and ozone. Environ Res Lett 4:045108.
34. Niemeier U, Timmreck C (2015) What is the limit of stratospheric sulfur climate en-gineering? Atmos Chem Phys Discuss 15:10939–10969.
35. Kravitz B, et al. (2014) A multi-model assessment of regional climate disparitiescaused by solar geoengineering. Environ Res Lett 9(7):74013–74019.
36. Kennedy AB, Dietrich JC, Westerink JJ (2013) The surge standard for “events of Ka-trina magnitude”. Proc Natl Acad Sci USA 110(29):E2665–E2666.
37. Grinsted A, Moore JC, Jevrejeva S (2013) Reply to Kennedy et al.: Katrina storm re-cords in tide gauges. Proc Natl Acad Sci USA 110(29):E2667.
38. Hansen J, Ruedy R, Sato M, Lo K (2010) Global surface temperature change. RevGeophys 48:RG4004.
39. Kravitz B, et al. (2011) The Geoengineering Model Intercomparison Project (GeoMIP).Atmospheric Science Letters 12:162–167.
40. Jones A, et al. (2013) The “termination effect” in experiment G2 of the Geo-engineering Model Intercomparison Project (GeoMIP). J Geophys Res 118(17):9743–9752.
41. Taylor KE, Stouffer RJ, Meehl GA (2012) An overview of CMIP5 and the experimentdesign. Bulletin of the American Meteorological Society 93:485–498.
42. Ji D, et al. (2014) Description and basic evaluation of Beijing Normal University EarthSystem Model (BNU-ESM) version 1. Geoscience Model Development 7:2039–2064.
43. Collins WJ, et al. (2011) Development and evaluation of an earth-system model—HadGEM2. Geoscience Model Development 4:1051–1075.
44. Dufresne J-L, et al. (2013) Climate change projections using the IPSL-CM5 earth systemmodel: From CMIP3 to CMIP5. Clim Dyn 40:2123–2165.
45. Arora VK, et al. (2011) Carbon emission limits required to satisfy future representativeconcentration pathways of greenhouse gases. Geophys Res Lett 38:L05805.
46. Phipps SJ, et al. (2011) The CSIRO Mk3L climate system model version 1.0—Part1: Description and evaluation. Geoscience Model Development 4:483–509.
47. Schmidt GA, et al. (2006) Present day atmospheric simulations using GISS ModelE: Comparison to in-situ, satellite and reanalysis data. J Clim 19:153–192.
48. Watanabe S, et al. (2011) MIROC-ESM 2010: Model description and basic results ofCMIP5-20c3m experiments. Geoscience Model Development 4:845–872.
49. Brown LD, Cai TT, DasGupta A (2001) Interval estimation for a binomial proportion.Stat Sci 16:101–133.
Moore et al. PNAS | November 10, 2015 | vol. 112 | no. 45 | 13799
ENVIRONMEN
TAL
SCIENCE
S