Embed Size (px)
Citation preview

UNI Generation Decommissioning Report
APPENDIX 1: Upper North Island Dynamic Reactive Support - Need Analysis
March 2016
Report No: NP622
Prepared By: Si Kuok Ting
Group Manager: NIKKI NEWHAM
File:

Contents
Table of contents
Executive summary ....................................................................................................................... III
1 Purpose of this document ...................................................................................................... 4
2 Introduction ............................................................................................................................. 4
2.1 Purpose of the investigation ......................................................................................... 4
2.2 Scope of the investigation ............................................................................................ 5
3 Findings and conclusions ...................................................................................................... 6
3.1 Winter N-1 .................................................................................................................... 6
3.2 Winter N-G-1 ................................................................................................................ 8
3.3 Summer N-1 ............................................................................................................... 10
3.4 Summer N-G-1 ........................................................................................................... 11
3.5 Upper North Island load limits .................................................................................... 12
3.6 Static capacitor requirement ....................................................................................... 13
3.7 Impact of operating decommissioned generators as synchronous condensers .......... 13
4 Recommendations ................................................................................................................ 13
5 Analysis ................................................................................................................................. 14
5.1 Assumptions ............................................................................................................... 14
5.2 Grid planning guidelines ............................................................................................. 17
5.3 Methodology ............................................................................................................... 18
5.4 Other generation and slack generator ........................................................................ 18
5.5 Planning horizon ........................................................................................................ 19
Appendix A Motor load modelling ........................................................................................ 20
Appendix B Monitored transmission bus ............................................................................. 22
Appendix C Forecast power factor ....................................................................................... 23
C O P Y R I G H T © 2 0 1 6 T R A N S P O W E R N E W Z E A L A N D L I M I T E D . A L L R I G H T S R E S E R V E D This document is protected by copyright vested in Transpower New Zealand Limited (“Transpower”). No part of the document may be reproduced or transmitted in any form by any means including, without limitation, electronic, photocopying, recording or otherwise, without the prior written permission of Transpower. No information embodied in the documents which is not already in the public domain shall be communicated in any manner whatsoever to any third party without the prior written consent of Transpower. Any breach of the above obligations may be restrained by legal proceedings seeking remedies including injunctions, damages and costs. L I M I T A T I O N O F L I A B I L I T Y / D I S C L A I M E R O F W A R R A N T Y This document is produced for internal use only and has not been approved for external release. Its conclusions are based on the information currently available to Transpower and may change as further information becomes available either internally or externally.

Executive summary
UNI Generation Decommissioning Report © Transpower New Zealand Limited 2016. All rights reserved.Page 3 of 26
Executive summary
This report presents the findings of the investigation into the dynamic reactive need date in the upper North Island.
The results of the investigation showed that the upper North Island is at risk of dynamic voltage instability as soon as all the Huntly Rankine units are decommissioned.
The analysis found that the most onerous contingency is Pakuranga–Whakamaru–1 when Huntly unit 5 is not in service during winter (i.e. N-G-1, where Huntly unit 5 is the “G”). If all of the Huntly Rankine units are decommissioned in 2016, the upper North Island is at risk of dynamic voltage instability with prudent winter load forecast under the N-G-1 scenario.
Table 0-1 summarises the results of the dynamic voltage stability studies. The year indicated is the first year in which the voltage performance criteria is breached by at least one major bus and/or generator bus in the upper North Island.
Table 0-1: Dynamic voltage stability results
Case Load year criteria is breached UNI load limit (MW)[1] Contingency
Winter N-1 2020 2534 PAK–WKM–1
Winter N-G-1 2016[2] 2219[2] PAK–WKM–1
Summer N-1 Beyond 2035 N/A PAK–WKM–1
Summer N-G-1 2019 1972 PAK–WKM–1
1. The load includes 5% margin.
2. This assumes the two remaining Huntly Rankine units (unit 1 and 2) are decommissioned in 2016.
Low voltages were noted in the Waikato region. A separate study is needed to determine if these low voltages flag that voltage stability issues also exist in the Waikato region.
Dynamic studies inherently have modelling uncertainties, especially the proportion and type of motor load and the dynamic behaviour of the motor and other loads. It is proposed to undertake a motor load survey to better assess the proportion and type of motor load. More detailed investigations will also be undertaken which include sensitivity studies of the technical assumptions. This will refine the need date, size and optimum location of additional dynamic support where the need for this investment is identified in this report.

Chapter 1 : Purpose of this document
UNI Generation Decommissioning Report © Transpower New Zealand Limited 2015. All rights reserved.Page 4 of 26
1 Purpose of this document
The purpose of this report is to present the results of upper North Island dynamic reactive support needs analysis.
2 Introduction
2.1 Purpose of the investigation
The upper North Island region covers the geographical area north of Huntly including Bombay, Auckland, North Isthmus and Northland (see Figure 2-1). The transmission networks are shown in Figure 2-2.
Figure 2-1: Upper North Island 220 kV and 110 kV network

Chapter 2 : Introduction
UNI Generation Decommissioning Report © Transpower New Zealand Limited 2015. All rights reserved.Page 5 of 26
Figure 2-2 Upper North Island 220 kV and 110 kV schematic
The upper North Island does not have enough local generation to meet local demand, and the shortfall is met from distant generation at and south of Huntly. The situation will continue as there is no new committed generation in the upper North Island, and worsen with the recent and future decommissioning of generation totalling 1555 MW1 in the upper North Island announced by three major electricity generators, with the last 500 MW to be decommissioned by December 2018 (unless market conditions change).
Beyond 2018, the upper North Island will also rely on distant generation to help maintain the voltage stability to within acceptable tolerances.
Shunt capacitor banks provide only static voltage support. Conventionally switched capacitors cannot provide the dynamic response required for sudden power system events when a rapid response is required to maintain voltage quality. For such events, dynamic reactive support devices such as generators, synchronous condensers, static var compensators (SVCs), and static synchronous compensators (STATCOMs) are required.
Static and dynamic reactive support in the upper North Island is currently provided by a combination of shunt capacitor banks, two STATCOMs, an SVC and the generators at Huntly (when connected). The need for investment will grow as load continues to grow in the region.
The purpose of the investigation was to determine the need date for investment in the upper North Island when 1555 MW of thermal generation retires.
2.2 Scope of the investigation
The scope of this investigation was to determine the N-1 and N-G-1 need dates and corresponding load limits due to transient voltage stability in upper North Island.
1 The thermal generation that is or will be decommissioned in the upper North Island is:
- Southdown CCGT (175 MW, decommissioned); - Otahuhu CCGT (380 MW, decommissioned); - Huntly Rankine units 3 and 4 (250 MW each, decommissioned); - Huntly Rankine units 1 and 2 (250 MW each, will be decommissioned by December 2018 unless market conditions change).
Chapter 3 : Findings and conclusions
UNI Generation Decommissioning Report © Transpower New Zealand Limited 2015. All rights reserved.Page 6 of 26
3 Findings and conclusions
The investigation found that the worst contingency is a 2 to ground fault on Pakuranga– Whakamaru–1 (PAK-WKM-1) during winter when Huntly unit 5 is not in service2 (or not offered into the electricity market).
The results include standard modelling assumptions for dynamic studies. This includes a permanent 2 to ground fault, applied at 1 second with the faulted circuit disconnected (tripped) after 100 milliseconds, and an autoreclose reclose onto the circuit which is still faulted 1.5 seconds after the initial fault. The results also model 25% of group one motor loads disconnecting during or shortly after the fault due to the motor control or protection. These standard modelling assumptions and others are as discussed in Appendix A. The transmission buses monitored are listed in Appendix B.
Figure 3-1 to Figure 3-6 shows the voltage recovery at major buses and/or generator buses in the upper North Island.
3.1 Winter N-1
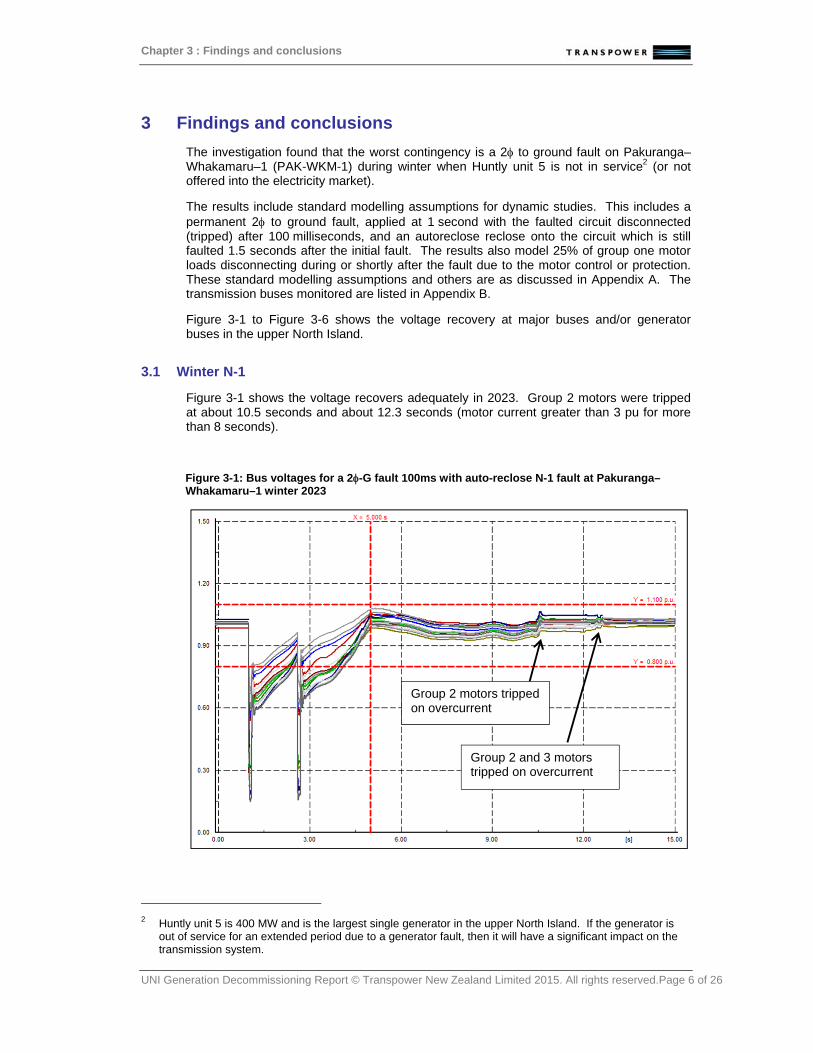
Figure 3-1 shows the voltage recovers adequately in 2023. Group 2 motors were tripped at about 10.5 seconds and about 12.3 seconds (motor current greater than 3 pu for more than 8 seconds).
Figure 3-1: Bus voltages for a 2-G fault 100ms with auto-reclose N-1 fault at Pakuranga–Whakamaru–1 winter 2023
2 Huntly unit 5 is 400 MW and is the largest single generator in the upper North Island. If the generator is
out of service for an extended period due to a generator fault, then it will have a significant impact on the transmission system.
Group 2 motors tripped on overcurrent
Group 2 and 3 motors tripped on overcurrent

Chapter 3 : Findings and conclusions
UNI Generation Decommissioning Report © Transpower New Zealand Limited 2015. All rights reserved.Page 7 of 26
Figure 3-2 shows that the upper North Island is at risk of dynamic voltage instability from winter 2024. Compared to Figure 3-1, the incremental load growth from 2023 to 2024 means the available dynamic reactive support is insufficient in the upper North Island to provide enough voltage support, causing a slow voltage recovery.
A large number of transmission buses breach the voltage criteria (see Figure 3-2). Consequently the Group 3 motors were tripped due to undervoltage 4 seconds after the first fault. This represents the expected response of Group 3 motors to this undervoltage.
The motor tripping causes the voltage to swing in the opposite direction, causing high bus voltages greater than 1.1 pu.
Buses at Maungaturoto 110 kV and Mount Roskill 110 kV usually breach the criteria first, followed by Bream Bay 220 kV, Mangere 110 kV, and Hepburn 110 kV.
Figure 3-2: Bus voltages for a 2-G fault 100ms with auto-reclose N-1 fault at Pakuranga–Whakamaru–1 winter 2024
Group 3 motors tripped on undervoltage
Chapter 3 : Findings and conclusions
UNI Generation Decommissioning Report © Transpower New Zealand Limited 2015. All rights reserved.Page 8 of 26
3.2 Winter N-G-1
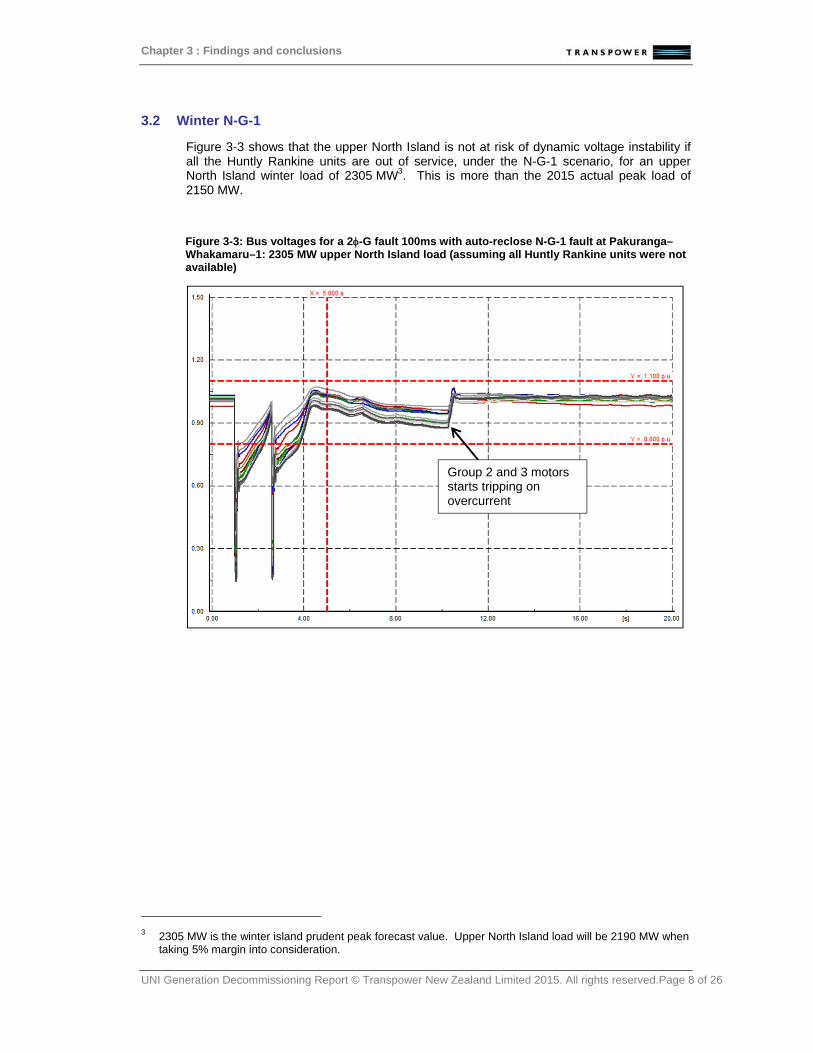
Figure 3-3 shows that the upper North Island is not at risk of dynamic voltage instability if all the Huntly Rankine units are out of service, under the N-G-1 scenario, for an upper North Island winter load of 2305 MW3. This is more than the 2015 actual peak load of 2150 MW.
Figure 3-3: Bus voltages for a 2-G fault 100ms with auto-reclose N-G-1 fault at Pakuranga–Whakamaru–1: 2305 MW upper North Island load (assuming all Huntly Rankine units were not available)
3 2305 MW is the winter island prudent peak forecast value. Upper North Island load will be 2190 MW when
taking 5% margin into consideration.
Group 2 and 3 motors starts tripping on overcurrent

Chapter 3 : Findings and conclusions
UNI Generation Decommissioning Report © Transpower New Zealand Limited 2015. All rights reserved.Page 9 of 26
Figure 3-4 shows that the upper North Island is at risk of dynamic voltage instability if all the Huntly Rankine units are out of service under N-G-1 scenario, for an upper North Island load of 2336 MW4.
Comparing the results in Figure 3-3 with Figure 3-4, the difference in the upper North Island N-G-1 load limit (if all the Huntly Rankine units are out of service) is 31 MW. The difference in load between the results shown in the two figures represents about one year of load growth.
Figure 3-4: Bus voltages for a 2-G fault 100ms with auto-reclose N-G-1 fault at Pakuranga–Whakamaru–1: 2336 MW upper North Island load (assuming all Huntly Rankine units were not available)
4 2336 MW is the winter island prudent peak forecast value. The upper North Island load is 2219 MW when
taking 5% margin into consideration.
Group 3 motors tripped on undervoltage

Chapter 3 : Findings and conclusions
UNI Generation Decommissioning Report © Transpower New Zealand Limited 2015. All rights reserved.Page 10 of 26
3.3 Summer N-1
Figure 3-5 shows that the upper North Island is not at risk of dynamic voltage instability with summer 2035 load under the N-1 scenario. The analysis showed that the voltage recovers adequately in summer 2035.
Figure 3-5: Bus voltages for a 2-G fault 100ms with auto-reclose N-1 fault at Pakuranga–Whakamaru–1 summer 2035
Chapter 3 : Findings and conclusions
UNI Generation Decommissioning Report © Transpower New Zealand Limited 2015. All rights reserved.Page 11 of 26
3.4 Summer N-G-1
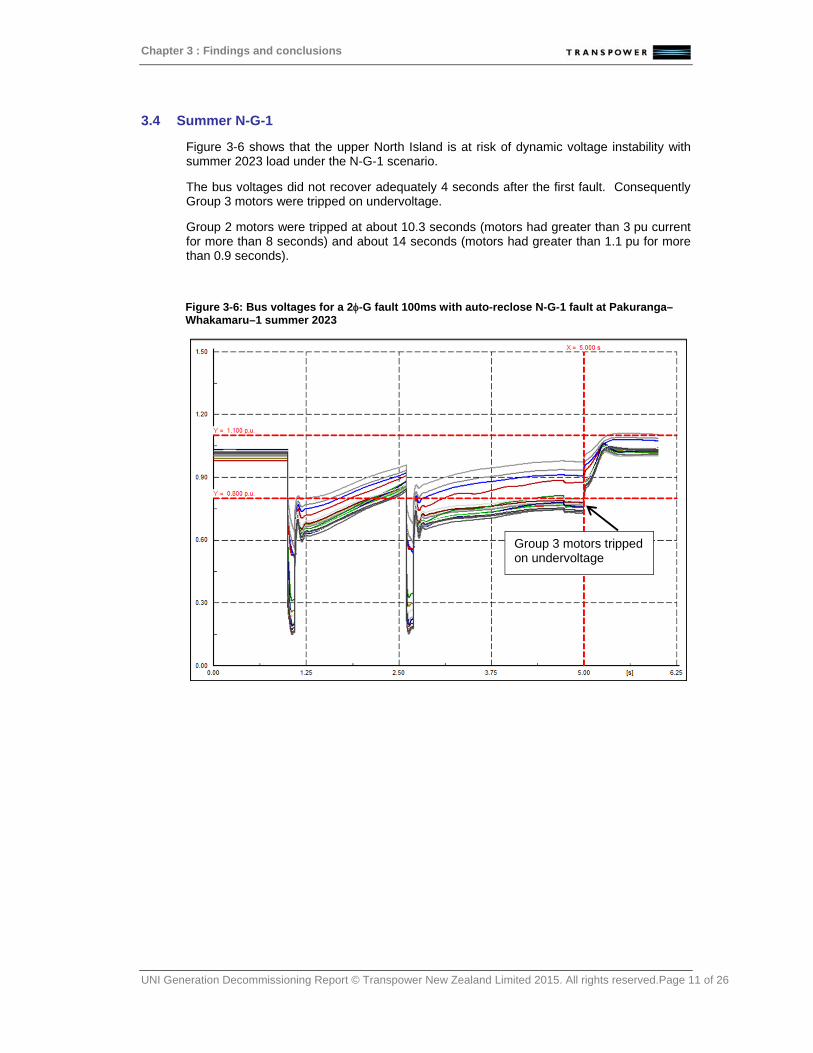
Figure 3-6 shows that the upper North Island is at risk of dynamic voltage instability with summer 2023 load under the N-G-1 scenario.
The bus voltages did not recover adequately 4 seconds after the first fault. Consequently Group 3 motors were tripped on undervoltage.
Group 2 motors were tripped at about 10.3 seconds (motors had greater than 3 pu current for more than 8 seconds) and about 14 seconds (motors had greater than 1.1 pu for more than 0.9 seconds).
Figure 3-6: Bus voltages for a 2-G fault 100ms with auto-reclose N-G-1 fault at Pakuranga–Whakamaru–1 summer 2023
Group 3 motors tripped on undervoltage

Chapter 3 : Findings and conclusions
UNI Generation Decommissioning Report © Transpower New Zealand Limited 2015. All rights reserved.Page 12 of 26
3.5 Upper North Island load limits
Figure 3-7 shows the load limits for dynamic voltage stability in upper North Island. The dynamic voltage stability analysis did not include a 5% margin on upper North Island load. A 5% margin brings forward the:
N-1 (summer) need date, no issues within the planning timeframe
N-1 (winter) need date from 2024 to 2020
N-G-1 (summer) need date from 2023 to 2019.
However, for the N-G-1 (winter) scenario, the upper North Island load is at risk of dynamic voltage instability as soon as the last two Huntly Rankine units are decommissioned.
Figure 3-7: Upper North Island dynamic voltage stability limits
(a) Winter limits
(b) Summer limits
0
500
1000
1500
2000
2500
3000
3500
2016
2017
2018
2019
2020
2021
2022
2023
2024
2025
2026
2027
2028
2029
2030
2031
2032
2033
2034
2035
Up
per
No
rth
Isla
nd
Lo
ad (
MW
)
Year
Winter Load
Limit: Winter N-1
Limit: Winter N-1 (+5%)
Limit: Winter N-G-1
Limit: Winter N-G-1 (+5%)
0
500
1000
1500
2000
2500
3000
3500
2016
2017
2018
2019
2020
2021
2022
2023
2024
2025
2026
2027
2028
2029
2030
2031
2032
2033
2034
2035
Upp
er N
orth
Isla
nd L
oad
(MW
)
Year
Summer Load
Limit: Summer N-G-1
Limit: Summer N-G-1 (5%)

Chapter 4 : Recommendations
UNI Generation Decommissioning Report © Transpower New Zealand Limited 2015. All rights reserved.Page 13 of 26
3.6 Static capacitor requirement
Table 3-1 shows the amount of additional reactive power support needed in the upper North Island to maintain the transmission buses at their set points pre-contingency. Note that positive values mean that the reactive source is providing reactive power to the network, and negative values mean that the reactive source is absorbing reactive power from the network.
Table 3-1: Static capacitor requirement (pre-contingency)
Case Load year criteria is breached
Additional pre-contingency reactive support (Mvar)
Albany 220 kV
Marsden 220 kV
Otahuhu 220 kV
Hamilton 220 kV
Winter N-1 2024 -5 +3 +57 +130
Winter N-G-1 2016[1] -46 -12 +43 +104
Summer N-1 Beyond 2035 N/A N/A N/A N/A
Summer N-G-1 2023 -92 -4 -114 +53
1. This assumes the two remaining Huntly Rankine units (unit 1 and 2) are decommissioned in 2016.
Table 3-1 shows that additional static reactive support is required at Otahuhu as soon as the last two Rankine units at Huntly are decommissioned to maintain the pre-event voltage setpoints.
3.7 Impact of operating decommissioned generators as synchronous condensers
The investigation found that it is possible to maintain dynamic voltage stability in the upper North Island by retaining the decommissioned generating units as synchronous condensers. To maintain dynamic voltage stability in winter 2018 would require at least:
two Southdown generators (G101, and G102), or
one Huntly Rankine unit.
Alternatively, retaining two Huntly Rankine units as synchronous condensers will defer the winter N-G-1 need date to 2025.
4 Recommendations
The investigation recommends a study into the:
transient voltage recovery for the Waikato region
sensitivity of the need date to the combination of static shunt capacitor size and placement to delay the need date for dynamic reactive plant,
sensitivity of the need date to different voltage profile at major upper North Island buses
sensitivity to the amount of Group 1 motors that trip to identify whether it is economic to avoid some motor load disconnecting during voltage recovery because of energy not served benefits
sensitivity to the sequence of events such as N-1-G compared with N-G-1
the impact of using PZQZ characteristics for static load model.

Chapter 5 : Analysis
UNI Generation Decommissioning Report © Transpower New Zealand Limited 2015. All rights reserved.Page 14 of 26
5 Analysis
5.1 Assumptions
This section describes the assumptions made in the analysis. Assumptions include the:
demand forecast
motor loads
generation assumptions
dynamic reactive plant dispatch
steady state voltage support
voltage profile
transient voltage performance criteria
methodology
5.1.1 Demand Forecast
The analysis used the 2015 Transmission Planning Report North Island prudent peak demand forecast for 2015 to 2030 load year.
The upper North Island peak demand forecast is listed in Table 5-1 and plotted in Figure 5-1. The power factor values area listed in Appendix C for each grid exit point in the North Island.
Table 5-1: Upper North Island demand forecast
Year Peak Demand (MW)
Winter Summer
2015 2366 1888
2016 2406 1919
2017 2433 1938
2018 2470 1964
2019 2509 1995
2020 2544 2021
2021 2575 2041
2022 2606 2060
2023 2636 2076
2024 2667 2093
2025 2698 2109
2026 2728 2124
2027 2758 2140
2028 2788 2155
2029 2819 2171
2030 2849 2187
2031 2878 2204
2032 2908 2220
2033 2937 2236
2034 2967 2254
2035 2996 2270

Chapter 5 : Analysis
UNI Generation Decommissioning Report © Transpower New Zealand Limited 2015. All rights reserved.Page 15 of 26
Figure 5-1: Upper North Island demand forecast
5.1.2 Motor loads
The amount and type of motor load connected within the distribution networks has a significant influence on the amount of dynamic reactive support required. The assumptions used in this investigation are given in Appendix A.
5.1.3 Generation Assumptions
Table 5-2 lists the upper North Island generation dispatch.
Table 5-2: Upper North Island generation dispatch (beyond 2018)
Generation P (MW) Q (Mvar)
(+ve capacitive range, -ve inductive range)
OTC 0 0
Southdown 0 0
Ngawha 25 0
Glenbrook 77 0
Huntly-U1 0 0
Huntly-U2 0 0
Huntly-U3 0 0
Huntly-U4 0 0
Huntly-U5 400 +202
Huntly-U6 40 +38
The total upper North Island generation is 542 MW. The N-G-1 scenario assumes the biggest generator in upper North Island (i.e. Huntly-U5) is not offered to the electricity market or on maintenance outage, which brings the total UNI generation down to 142 MW.
The analysis assumed that Huntly unit 1 and unit 2 will be retired by December 2018. Otahuhu Combined Cycle has been decommissioned, and Southdown is decommissioned.
0
500
1000
1500
2000
2500
3000
3500
201
5
201
6
201
7
201
8
201
9
202
0
202
1
202
2
202
3
202
4
202
5
202
6
202
7
202
8
202
9
203
0
203
1
203
2
203
3
203
4
203
5
Up
per
No
rth
Isl
and
Lo
ad (
MW
)
Year
Island peak_Winter
Island peak_Summer

Chapter 5 : Analysis
UNI Generation Decommissioning Report © Transpower New Zealand Limited 2015. All rights reserved.Page 16 of 26
5.1.4 Existing upper North Island reactive support
Dynamic
The existing upper North Island dynamic reactive support is listed in Table 5-3.
Table 5-3: Dynamic reactive support
UNI dynamic Reactive Support Reactive power range (Mvar)
(+ve capacitive range, -ve inductive range)
Marsden STC +80/-68[1]
Penrose STC +/-60[1]
Albany SVC +/-100
1. The Penrose and Marsden STATCOMs have a 2 seconds overload of +/-80 Mvar.
Pre-contingency the STATCOMs and SVC are dispatched at 0 Mvar so that the devices maintain dynamic reserve to respond to the system events.
Static
Table 5-4 lists the capacitors that are used for voltage support in upper North Island.
Table 5-4: Static support (pre-contingency)
Capacitor Voltage (kV) Reactive (Mvar) Dispatch (Mvar)
Albany C1 110 50 50
Albany C2 220 100 100
Bombay C11[1] 110 50 0
Henderson C1 220 75 0
Hepburn Road C11 110 50 50
Hepburn Road C12 110 50 50
Hepburn Road C13 110 50 50
Kaitaia C1 binary capacitor[2] 11 22.4 3.4
Otahuhu C11 110 50 50
Otahuhu C12 110 50 50
Otahuhu C29 110 100 100
Otahuhu C30 110 100 100
Otahuhu C31 110 100 100
Penrose C1 220 75 0
Penrose C11 110 50 0
Penrose C12 110 50 50
Penrose C13 110 50 50
Penrose C14 110 50 50
Wairau Road C1[1] 33 18 0
Wairau Road C2[1] 33 18 0
1. Capacitor was not dispatched in the analysis.
2. Total Kaitaia binary capacitor is 22.4 Mvar. The analysis assumed 3.4 var was available for dispatch.
5.1.5 Voltage support assumptions

Chapter 5 : Analysis
UNI Generation Decommissioning Report © Transpower New Zealand Limited 2015. All rights reserved.Page 17 of 26
In each forecast year capacitors are switched pre-contingency to maintain the pre-contingency voltage profile (see Table 5-5). Additional capacitance was modelled if the voltage profile cannot be maintained.
These voltage set points are based on average value during peak hours over the 2015 winter period. Determining if these are the optimum voltage set points following the last decommissioning of thermal generation in December 2018 will be determined as part of the next stage of the investigations.
Table 5-5: Bus voltages maintained in upper North Island for both summer and winter
Bus Voltage (pu)
MDN220 1.000
ALB220 1.022
OTA220 1.020
HAM220 1.010
WKM220 1.026
MTI220 1.035
WPA220 1.039
5.1.6 Contingency
Table 5-6 lists the contingencies used in the investigation.
Table 5-6: N-1 and N-G-1 contingency
Type Contingency
N-1 Pakuranga–Whakamaru–1
N-1 Huntly–Takanini–Otahuhu
N-1 Otahuhu–Whakamaru–1
N-1 Albany SVC
N-1 Hobson Street–Penrose–1
N-1 Ohinewai–Otahuhu–1
N-1 Henderson–Otahuhu–1
N-1 Hamilton–Whakamaru–1
N-1 Huntly-U5
N-G-1 Huntly-U5, Pakuranga–Whakamaru–1
N-G-1 Huntly-U5, Huntly–Takanini–Otahuhu
N-G-1 Huntly-U5, Otahuhu–Whakamaru–1
N-G-1 Huntly-U5, Albany SVC
N-G-1 Huntly-U5, Hobson Street–Penrose–1
N-G-1 Huntly-U5, Ohinewai–Otahuhu–1
N-G-1 Huntly-U5, Henderson–Otahuhu–1
N-G-1 Huntly-U5, Hamilton–Whakamaru–1
5.2 Grid planning guidelines5
5.2.1 Voltage recovery criteria
5 Grid Planning Guideline 2014, Section 9.
Chapter 5 : Analysis
UNI Generation Decommissioning Report © Transpower New Zealand Limited 2015. All rights reserved.Page 18 of 26
Transpower’s transient voltage criteria are derived from the fundamental requirements set out in the Electricity Industry Participation Code (EIPC) reliability standard for the New Zealand Power Transmission System.
The recovery criteria for major (220 kV and 110 kV) and generator buses are:
Voltage must be greater than 0.5 pu following a single credible contingency event which removes an item of equipment from service without a transmission system short circuit fault. For modelling purposes, all load is assumed to stay connected during and following the event;
Voltage must recover to above 0.8 pu in less than 4 seconds following a credible contingency event. This requirement is to ensure that voltages have recovered to the extent that under-voltage based protection relays on grid connected generating units do not operate which would cause the units to disconnect from the power system;
Voltage overshoot must be limited to below 1.3 pu. This applies for areas that are remote from the HVDC link terminals such as the upper North Island and upper South Island. This requirement is to ensure that overvoltage based protections on generating units do not operate which would cause the generating unit to disconnect from the power system;
Voltage overshoot must not be above 1.1 pu for more than 0.9 seconds. This requirement is based on the normal operating range for voltages in the Part 8 of EIPC;
There is no pole slipping on grid connected generating units. This requirement is to ensure that protection relays on generating units do not operate to remove the unit from the power system.
5.2.2 Economic investments criteria
It is additionally possible to make economically justified investment in addition to the voltage criteria. The economic investment criteria is based on the amount of avoidable tripped motor load during a fault.
The overvoltage and undervoltage criteria are listed in Section 5.2.1. In addition, motor current must not be greater than 6 times the rated current (6 pu) for more than 3 seconds and not be greater than 3 times the rated current (3 pu) for more than 8 seconds.
The load models and their protection are described in Appendix A.
5.3 Methodology
In addition to the transient voltage performance criteria, the following requirements are also made when undertaking the analysis:
Load is increased by 5% of the forecasted load, to maintain a margin between the stability limit and the predicted load level.
25% of the expected Group 1 contactor connected motors will trip.
The worst expected fault type is a close-in double phase to ground fault with an unsuccessful auto-reclose attempt assuming it is not as option to disable the auto-reclose (or increase the re-close time) for any of the critical circuits.
5.4 Other generation and slack generator The HVDC link at Haywards provides 1200 MW to the North Island.
No new generation planned in the upper North Island area for the study period.
Generation development scenarios are not considered in this study.
Wind generation contribution during the peak period is 100% of its installed capacity.
A slack generator without dynamic response was modelled at the Whakamaru 220 kV bus.

Chapter 5 : Analysis
UNI Generation Decommissioning Report © Transpower New Zealand Limited 2015. All rights reserved.Page 19 of 26
5.5 Planning horizon
The analysis considers 20 years of demand forecast (2015 to 2035).
Appendix A: Motor load modelling
UNI Generation Decommissioning Report © Transpower New Zealand Limited 2015. All rights reserved.Page 20 of 26
Appendix A Motor load modelling6
The load model determines how the load reacts to faults and dips in voltages. In the studies the load model is based on the motor load data surveyed by SKM in 2013.
The load model consists of:
induction motor load
static “non rotating” load
known distribution capacitors
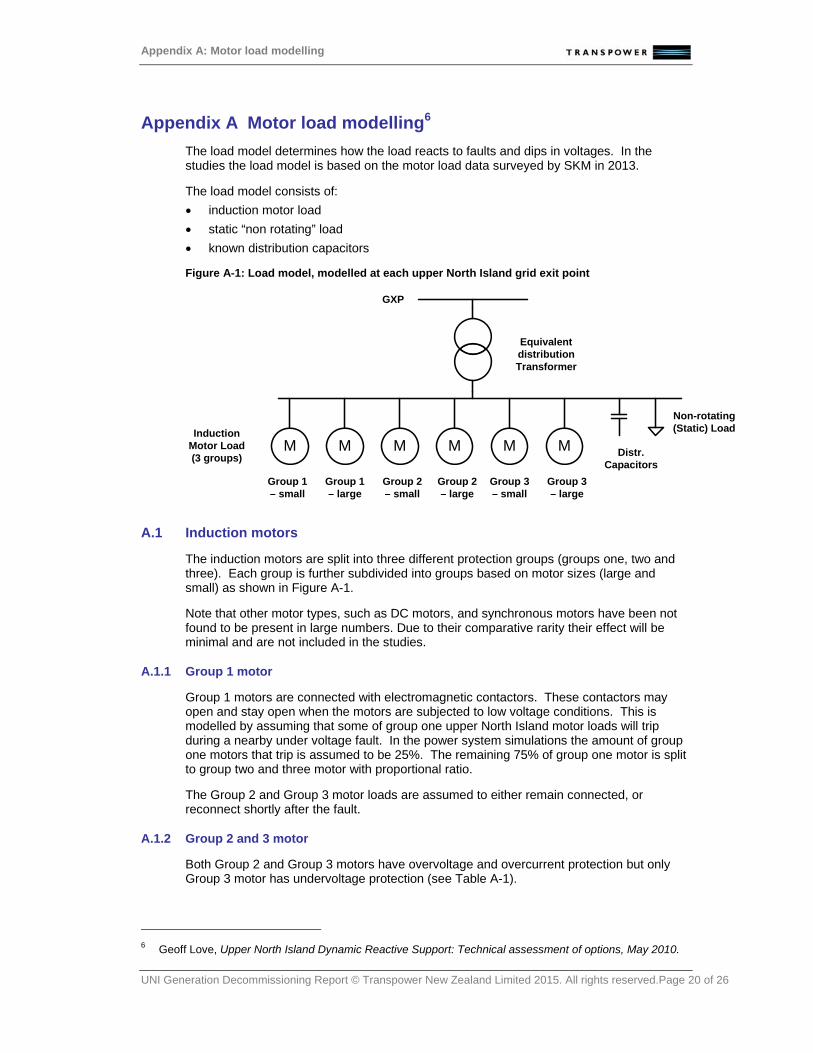
Figure A-1: Load model, modelled at each upper North Island grid exit point
A.1 Induction motors
The induction motors are split into three different protection groups (groups one, two and three). Each group is further subdivided into groups based on motor sizes (large and small) as shown in Figure A-1.
Note that other motor types, such as DC motors, and synchronous motors have been not found to be present in large numbers. Due to their comparative rarity their effect will be minimal and are not included in the studies.
A.1.1 Group 1 motor
Group 1 motors are connected with electromagnetic contactors. These contactors may open and stay open when the motors are subjected to low voltage conditions. This is modelled by assuming that some of group one upper North Island motor loads will trip during a nearby under voltage fault. In the power system simulations the amount of group one motors that trip is assumed to be 25%. The remaining 75% of group one motor is split to group two and three motor with proportional ratio.
The Group 2 and Group 3 motor loads are assumed to either remain connected, or reconnect shortly after the fault.
A.1.2 Group 2 and 3 motor
Both Group 2 and Group 3 motors have overvoltage and overcurrent protection but only Group 3 motor has undervoltage protection (see Table A-1).
6 Geoff Love, Upper North Island Dynamic Reactive Support: Technical assessment of options, May 2010.
M
GXP
InductionMotor Load(3 groups)
Non-rotating(Static) Load
Distr.Capacitors
Equivalent distribution Transformer
M
Group 1 – small
Group 1 – large
Group 2 – small
Group 2 – large
Group 3 – small
Group 3 – large
M M M M

Appendix A: Motor load modelling
UNI Generation Decommissioning Report © Transpower New Zealand Limited 2015. All rights reserved.Page 21 of 26
Table A-1: Motor protection7
Protection Group 1 Group 2 Group 3
Electromagnetic Yes No No
Over-current Yes Yes Yes
Over-voltage Yes Yes Yes
Undervoltage Some No Yes
A.2 Static load
The static load is assumed to stay connected during the fault. It is modelled as having the following voltage dependent characteristics;
real power, P, has a constant current characteristic
reactive power, Q, has a constant impedance characteristic
This characteristic is commonly called PIQZ.
A.3 Distribution capacitor banks
Distribution capacitor banks are needed to support voltage in the distribution network and meet distribution companies’ power factor obligations. Known distribution capacitors are explicitly modelled.
A.4 Distribution network
The distribution network is modelled as a transformer between the grid exit point and the load. A network impedance of 10% is assumed (where the load MW demand is the MVA base).
A.5 Load model composition
The composition of each grid exit point is that found by SKM in their 2013 motor load survey. The load composition was surveyed in the peak winter period and the extreme summer period. The load composition for the entire upper North Island is summarised in Table A-2.
Table A-2: Upper North Island Load Composition Summary
Period Static Induction motors
Group One Group Two Group Three
Large Small Large Small Large Small
Winter GXP average 50% 6.3% 18.3% 1.4% 13.4% 2.8% 7.8%
Extreme Summer GXP average
59.7% 5.7% 14.5% 1.2% 11.8% 2.2% 5.6%
7 Victor Lo, Upper North Island Grid Upgrade Investigation Project: Need Analysis (NP532), February 2013.

Appendix B: Monitored transmission bus
UNI Generation Decommissioning Report © Transpower New Zealand Limited 2015. All rights reserved.Page 22 of 26
Appendix B Monitored transmission bus
Bus Voltage (kV)
BOB110 110
BRB220 220
GLN_G3 11
GLN_M1 11
GLN220 220
GLN33_3 33
HEP110 110
HLY_UN2 16.5
HLY_UN4 16.5
HLY_UN5 18
HLY_UN6 11
HOB110 110
KTA110 110
LST110 110
MNG110 110
MTO110 110
NWA11 11
NWA33 33
ROS110 110
SWN220 220
WIR110 110

Appendix C: Forecast power factor
UNI Generation Decommissioning Report © Transpower New Zealand Limited 2015. All rights reserved.Page 23 of 26
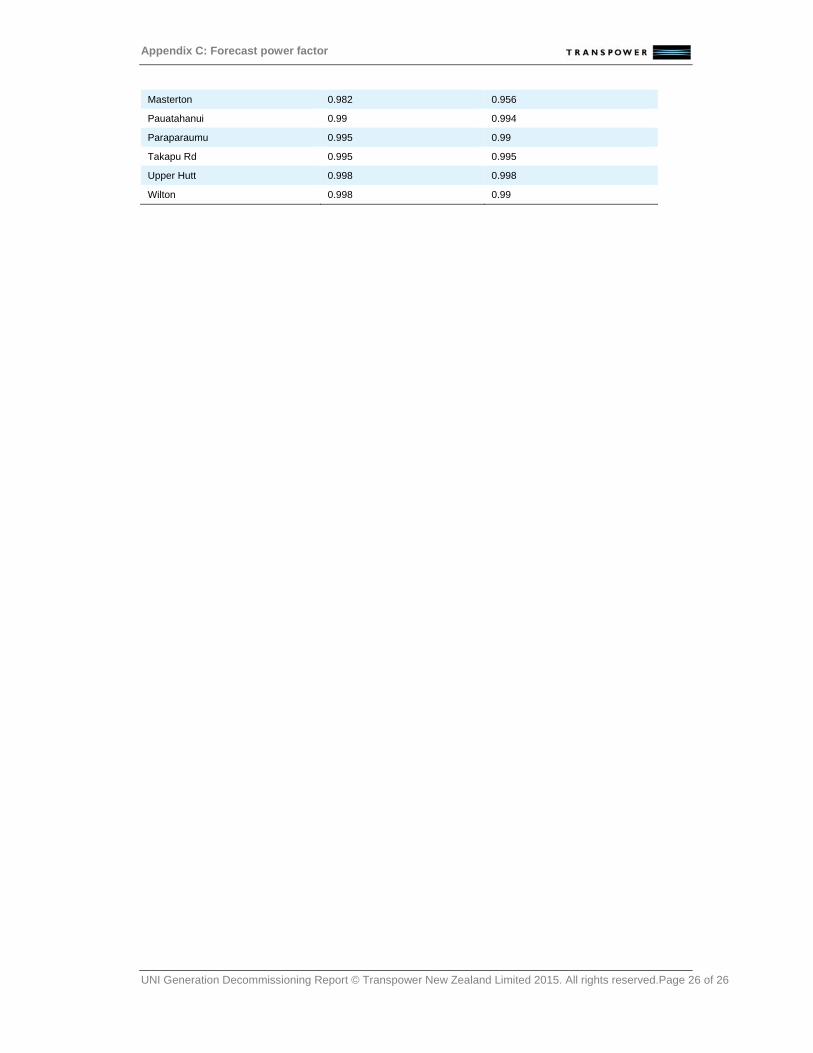
Appendix C Forecast power factor
Northland At island peak winter prudent At island peak summer prudent
Bream Bay 0.972 0.968
Kensington 1 0.992
Marsden 1 1
Maungatapere 0.977 0.969
Maungaturoto 1 0.998
Wellsford 1 1
Auckland
Albany (Wairau Road) 0.998 0.998
Albany 33 kV 0.994 0.985
Bombay 110 kV 0.994 0.978
Bombay 33 kV 0.987 0.957
Glenbrook 33 kV-1 1 1
Glenbrook 33 kV-2 0.976 0.953
Glenbrook-NZ Steel 1 0.991
Henderson 0.997 0.997
Hepburn Road 0.997 0.973
Hobson Street 0.989 0.97
Meremere 0.976 0.978
Mangere 110 kV 0.884 0.876
Mangere 33 kV 0.988 0.974
Otahuhu 0.995 0.997
Pakuranga 0.991 0.981
Penrose 22 kV 0.978 0.956
Penrose 33 kV 0.986 0.975
Penrose 110 kV - LST 0.997 0.973
Mount Roskill 22 kV 0.983 0.976
Mount Roskill - KING 0.998 0.956
Silverdale 0.998 0.999
Southdown 1 1
Takanini 0.997 0.998
Wiri 0.993 0.984
Waikato
Cambridge 0.989 0.964
Hamilton 11 kV 0.996 0.982
Hamilton 33 kV 0.995 0.984
Hamilton NZR 1 1
Hinuera 0.98 0.944
Huntly 1 1
Hangatiki 0.928 0.89

Appendix C: Forecast power factor
UNI Generation Decommissioning Report © Transpower New Zealand Limited 2015. All rights reserved.Page 24 of 26
Kinleith 11 kV (T1, T2, T3) 0.848 0.845
Kinleith 11 kV (T5) -0.888 -0.907
Kinleith 33 kV 0.993 0.97
Kopu 1 1
Lichfield 0.954 0.949
Maraetai 1 1
Piako 0.988 0.958
Putaruru 1 1
Te Awamutu 0.99 0.96
Te Kowhai 0.995 0.988
Waihou 1 0.995
Whakamaru 1 1
Waikino 0.999 0.999
Bay of Plenty
Edgecumbe 0.971 0.944
Kawerau 11 kV (T1, T2) 0.888 0.864
Kawerau 11 kV (T11, T14) 1 1
Kawerau 11 kV (T6, T7, T8, T9) 0.983 0.988
Kaitimako 1 1
Matahina 1 1
Mt Maunganui 11 kV 1 0.95
Mt Maunganui 33 kV 0.991 0.979
Owhata 0.995 0.986
Rotorua 11 kV 0.997 0.99
Rotorua 33 kV 0.989 0.963
Tauranga 11 kV 0.996 0.979
Tauranga 33 kV 0.979 0.989
Te Kaha 0.984 0.944
Te Matai 0.98 0.964
Tarukenga 1 0.995
Waiotahi 0.989 0.967
Central North Island
Bunnythorpe 33 kV 0.983 0.963
Bunnythorpe NZR 1 1
Dannevirke 0.99 0.953
Linton 0.993 0.979
Mangamaire 0.991 0.957
Mangahao 0.959 0.943
Marton 0.975 0.932
Mataroa 0.987 0.977
National Park 0.979 1
Ohaaki 0.994 0.955
Ohakune 0.983 0.98

Appendix C: Forecast power factor
UNI Generation Decommissioning Report © Transpower New Zealand Limited 2015. All rights reserved.Page 25 of 26
Ongarue 1 0.981
Tokaanu 0.997 0.95
Tangiwai 11 kV 1 0.999
Tangiwai NZR 1 1
Woodville 1 0.999
Waipawa 0.972 0.921
Hawke's Bay
Fernhill 0.983 0.949
Gisborne 0.984 0.955
Gisborne 0.986 0.964
Redclyffe 0.989 0.971
Tokomaru Bay 0.984 0.955
Tuai 0.995 0.988
Whirinaki 1 1
Wairoa 0.985 0.948
Wairoa 1 1
Whakatu 0.984 0.965
Whirinaki 1 1
Taranaki
Brunswick 0.974 0.928
Carrington St 0.98 0.951
Huirangi 0.964 0.919
Hawera 0.983 0.956
Hawera (KUPE) -0.968 -0.963
Motunui 0.936 0.918
Moturoa 0.99 0.971
Opunake 0.937 0.903
Stratford 220 kV 1 1
Stratford 33 kV 0.985 0.934
Taumarunui 1 1
Wanganui 0.939 0.938
Waverley 0.957 0.905
Wellington Central Park 11 kV 0.992 0.973
Central Park 33 kV 0.988 0.977
Gracefield 0.99 0.974
Greytown 0.995 0.954
Haywards 11 kV 0.997 0.991
Haywards 33 kV 0.987 0.984
Kaiwharawhara 0.992 0.978
Melling 11 kV 0.99 0.97
Melling 33 kV 0.996 0.997
Appendix C: Forecast power factor
UNI Generation Decommissioning Report © Transpower New Zealand Limited 2015. All rights reserved.Page 26 of 26
Masterton 0.982 0.956
Pauatahanui 0.99 0.994
Paraparaumu 0.995 0.99
Takapu Rd 0.995 0.995
Upper Hutt 0.998 0.998
Wilton 0.998 0.99