Embed Size (px)
Citation preview
Understanding and Characterizing PlanetLab ResourceUsage for Federated Network Testbeds
Wonho KimDepartment of Computer Science
Princeton [email protected]
Ajay RoopakaluDepartment of Computer Science
Princeton [email protected]
Katherine Y. LiDepartment of Computer Science
Princeton [email protected]
Vivek S. PaiDepartment of Computer Science
Princeton [email protected]
ABSTRACT
Global network testbeds are crucial for innovative networkresearch. Built on the success of PlanetLab, the next genera-tion of federated testbeds are under active development, butvery little is known about resource usage in the shared in-frastructures. In this paper, we conduct an extensive studyof the usage profiles in PlanetLab that we collected for sixyears by running CoMon, a PlanetLab monitoring service.We examine various aspects of node-level behavior as well asexperiment-centric behavior, and describe their implicationsfor resource management in the federated testbeds. Ourmain contributions are threefold: (1) Contrary to commonbelief, our measurements show there is no tragedy of thecommons in PlanetLab, since most PlanetLab experimentsexploit the system’s network reach more than just its hard-ware resources; (2) We examine resource allocation systemsproposed for the federated testbeds, such as bartering andcentral banking schemes, and show that they would handleonly a small percentage of the total usage in PlanetLab; and(3) Lastly, we identify factors that account for high resourcecontention or poor utilization in PlanetLab nodes. We an-alyze workload imbalance and problematic slices in Planet-Lab, and describe the implications of our measurements forimproving overall utility of the testbed.
Categories and Subject Descriptors
C.4 [Performance of Systems]: Design studies, Perfor-mance attributes
General Terms
Measurement, Design, Performance
Permission to make digital or hard copies of all or part of this work forpersonal or classroom use is granted without fee provided that copies arenot made or distributed for profit or commercial advantage and that copiesbear this notice and the full citation on the first page. To copy otherwise, torepublish, to post on servers or to redistribute to lists, requires prior specificpermission and/or a fee.IMC’11, November 2–4, 2011, Berlin, Germany.Copyright 2011 ACM 978-1-4503-1013-0/11/11 ...$10.00.
Keywords
PlanetLab, Network Testbeds, Characterization
1. INTRODUCTIONBuilding on the unprecedented success of PlanetLab [23],
the next generation of testbeds have been under active devel-opment recently. In its design phase, the GENI [14] projectaims to federate multiple testbeds that are owned and oper-ated by autonomous organizations. It plans to cover diversenetworks including PlanetLab-like wide-area testbeds, fiberoptics, and even sensor grids. To coordinate resource man-agement across the organizational boundaries, the federatedinfrastructure suite needs an extensive policy framework andincentive system. However, very little is known about re-source usage in the federated frameworks, which is requiredfor designing future policy engines.
In this paper, we analyze resource usage in PlanetLaband discuss its design implications for the emerging feder-ated testbeds. We note that PlanetLab itself is a feder-ated platform. The nodes in PlanetLab are managed by atrusted intermediary named PlanetLab Central (PLC), buteach site retains ultimate control over its own nodes. Sinceit was launched in 2002, PlanetLab has tried to balance fair-ness and the utility of the system without imposing strictresource controls [6, 22]. Thus, we believe that understand-ing resource usage in PlanetLab can help shape the policydecisions of future testbeds that have similar design require-ments. Since planned testbeds such as GENI have architec-tures similar to PlanetLab, the lessons we have learned fromour analysis can be generalized beyond PlanetLab to manyfederated systems that need to control shared resources do-nated by autonomous organizations.
Characterizing PlanetLab’s resource usage is challengingbecause it is highly dynamic and evolves with changes in theunderlying platform. For example, some experiments areactive year-round and consume an almost constant amountof resources while many other experiments show heavy andbursty demand over short time periods. As a result, large-scale, long-term analysis is necessary to capture usage pat-terns and their evolution.
To address this challenge, we have collected detailed statis-tics on every online PlanetLab node and the active experi-ments running on the node since August 2004 through thePlanetLab monitoring system CoMon [20]. The collected
515
datasets have detailed information about both node-centricand experiment-centric data at five minutes granularity. Inaddition to passively recording OS-provided metrics, CoMonalso actively gathers information about each node’s statusby periodically running a set of test programs. In this pa-per, we analyze six years of PlanetLab usage, from 2005 to2010. Our three main observations follow:
No tragedy of the commons Conventional wisdom sug-gests that network testbeds should suffer from a tragedy ofthe commons, and this belief has led to much developmenton PlanetLab, including two deployed resource reservationschemes [16, 27], two deployed resource discovery systems [1,2], and papers investigating resource allocation and migra-tion [12, 19]. This belief has even shaped the requirementsof testbeds like GENI, which are devoting much attentionand software development cost to resource reservation sys-tems [13].
However, we observe no indication of the tragedy of thecommons on PlanetLab, and we find several measurementsindicating that these kinds of network testbeds are unlikelyto suffer such effects. Unlike compute clusters where userstry to utilize every available resource, most PlanetLab usersare not aggressive in using resources in the testbed. WhilePlanetLab hosts some long running services, most Planet-Lab experiments have bursty resource consumption, and thisresource consumption is tied to network activity. As a re-sult, the resource consumption shows bimodal distributionsalong many axes. The primary reason for the non-aggressivebehavior of PlanetLab users is that the main utility of Plan-etLab comes from its wide network vantage points, not theaggregate amount of resources.
Limitations of market-based resource allocation Usingdata-driven analysis, we explore the effectiveness of two rep-resentative resource allocation schemes proposed for PlanetLab-like federated systems: pair-wise bartering and market-basedbanking. We find that the bartering and banking systemscan account only for 3% and 14% of the total resource usagerespectively, because most resource usage is from sites thatdo not donate the same amount of resources. Since the re-maining 83% of the resources need to be allocated, market-based allocation approaches are not sufficient for networktestbeds, and some mechanism must be employed to ensurethat the bulk of the testbed’s resources are used appropri-ately.
Improving utility of PlanetLab We examine factors thatdegrade the overall utility of PlanetLab, and discuss howto mitigate their impact. We find that workload is per-sistently unbalanced among PlanetLab nodes, resulting inhigh system lags in overloaded nodes as well as inefficientresource usage. Several factors are responsible for this im-balance, ranging from users staying with known-good nodesto node utility being degraded due to DNS failures, nodeunreliability, bandwidth limitations, and other reasons. Wealso find unstable experiments consume a disproportionatelyhigh share of the resource, typically dwarfing stable long-running services. We simulate pruning the problematic ex-periments to measure their impact on other well-behavedexperiments in PlanetLab.
The rest of this paper is structured as follows. In Sec-tion 2, we describe some background on PlanetLab andCoMon datasets. We analyze per-slice characteristics in Sec-tion 3, and examine several resource allocation systems in
��������������
���� ���� � �
��� �� ������
���� ��
���� ����
�� �� ��
���������������������
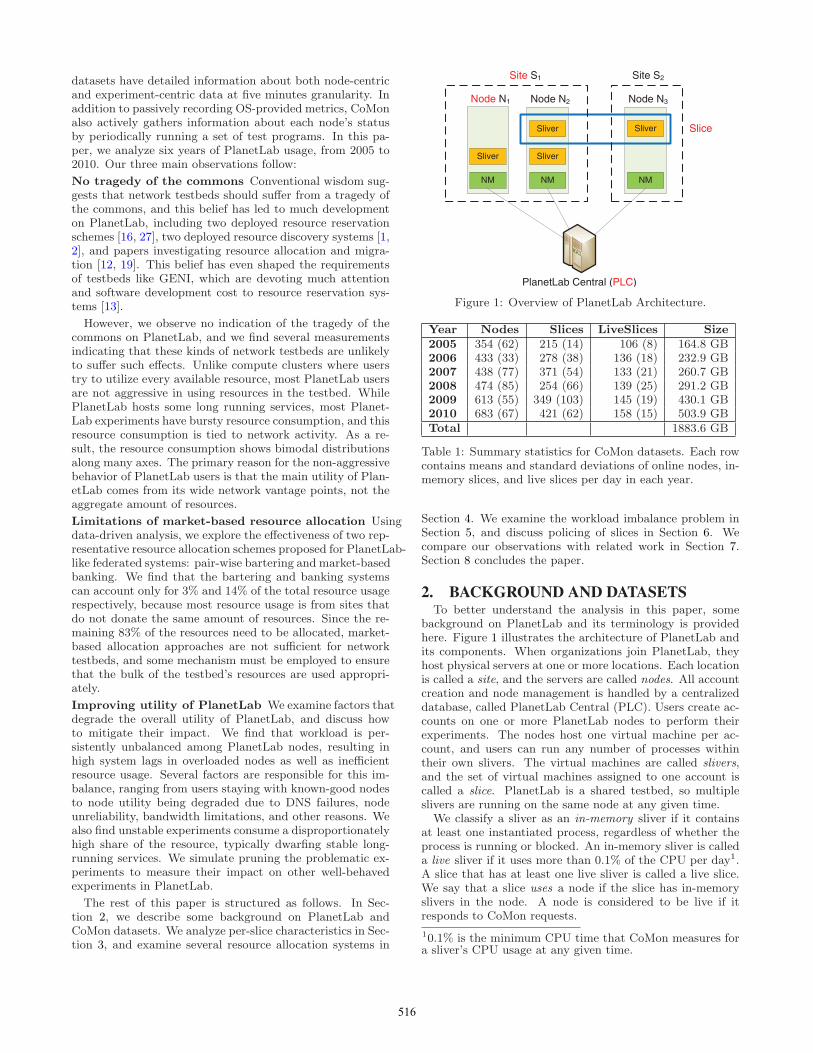
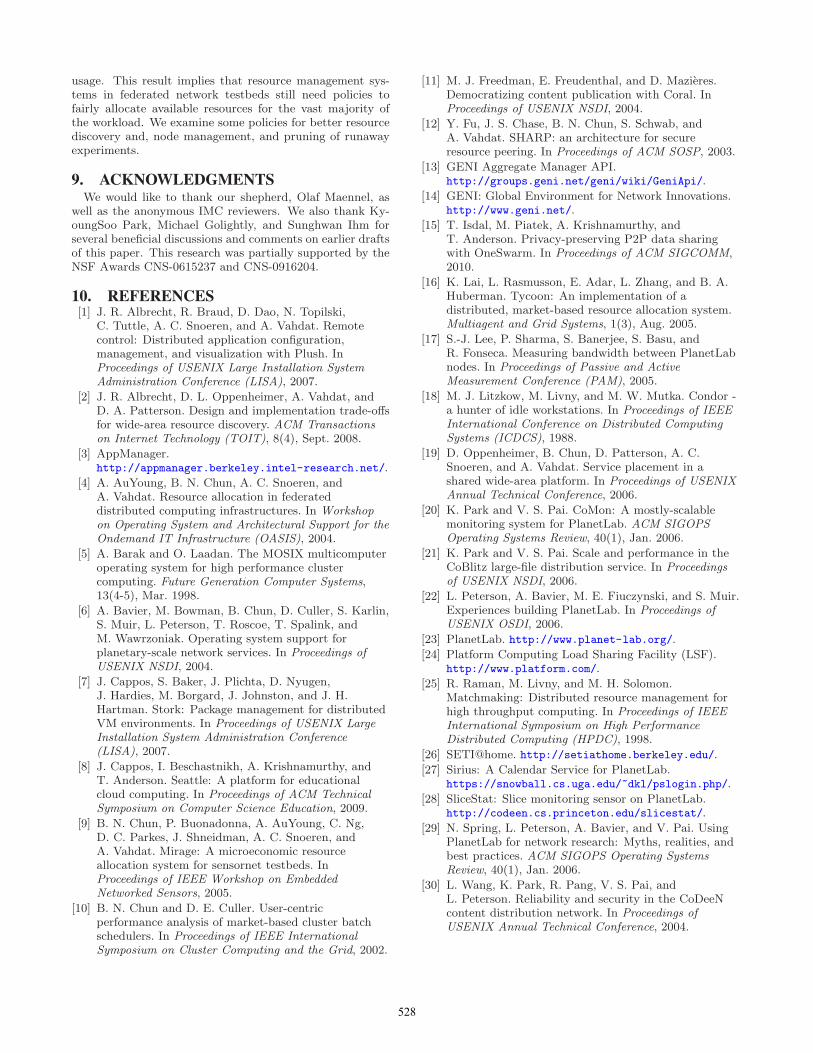
Figure 1: Overview of PlanetLab Architecture.
Year Nodes Slices LiveSlices Size
2005 354 (62) 215 (14) 106 (8) 164.8 GB2006 433 (33) 278 (38) 136 (18) 232.9 GB2007 438 (77) 371 (54) 133 (21) 260.7 GB2008 474 (85) 254 (66) 139 (25) 291.2 GB2009 613 (55) 349 (103) 145 (19) 430.1 GB2010 683 (67) 421 (62) 158 (15) 503.9 GBTotal 1883.6 GB
Table 1: Summary statistics for CoMon datasets. Each rowcontains means and standard deviations of online nodes, in-memory slices, and live slices per day in each year.
Section 4. We examine the workload imbalance problem inSection 5, and discuss policing of slices in Section 6. Wecompare our observations with related work in Section 7.Section 8 concludes the paper.
2. BACKGROUND AND DATASETSTo better understand the analysis in this paper, some
background on PlanetLab and its terminology is providedhere. Figure 1 illustrates the architecture of PlanetLab andits components. When organizations join PlanetLab, theyhost physical servers at one or more locations. Each locationis called a site, and the servers are called nodes. All accountcreation and node management is handled by a centralizeddatabase, called PlanetLab Central (PLC). Users create ac-counts on one or more PlanetLab nodes to perform theirexperiments. The nodes host one virtual machine per ac-count, and users can run any number of processes withintheir own slivers. The virtual machines are called slivers,and the set of virtual machines assigned to one account iscalled a slice. PlanetLab is a shared testbed, so multipleslivers are running on the same node at any given time.
We classify a sliver as an in-memory sliver if it containsat least one instantiated process, regardless of whether theprocess is running or blocked. An in-memory sliver is calleda live sliver if it uses more than 0.1% of the CPU per day1.A slice that has at least one live sliver is called a live slice.We say that a slice uses a node if the slice has in-memoryslivers in the node. A node is considered to be live if itresponds to CoMon requests.
10.1% is the minimum CPU time that CoMon measures fora sliver’s CPU usage at any given time.
516
05/Jun 06/Jun 07/Jun 08/Jun 09/Jun 10/Jun
Year/Month
0
200
400
600
800
1000C
ou
nt
Nodes
Live Slices
Available Sites
Active Sites
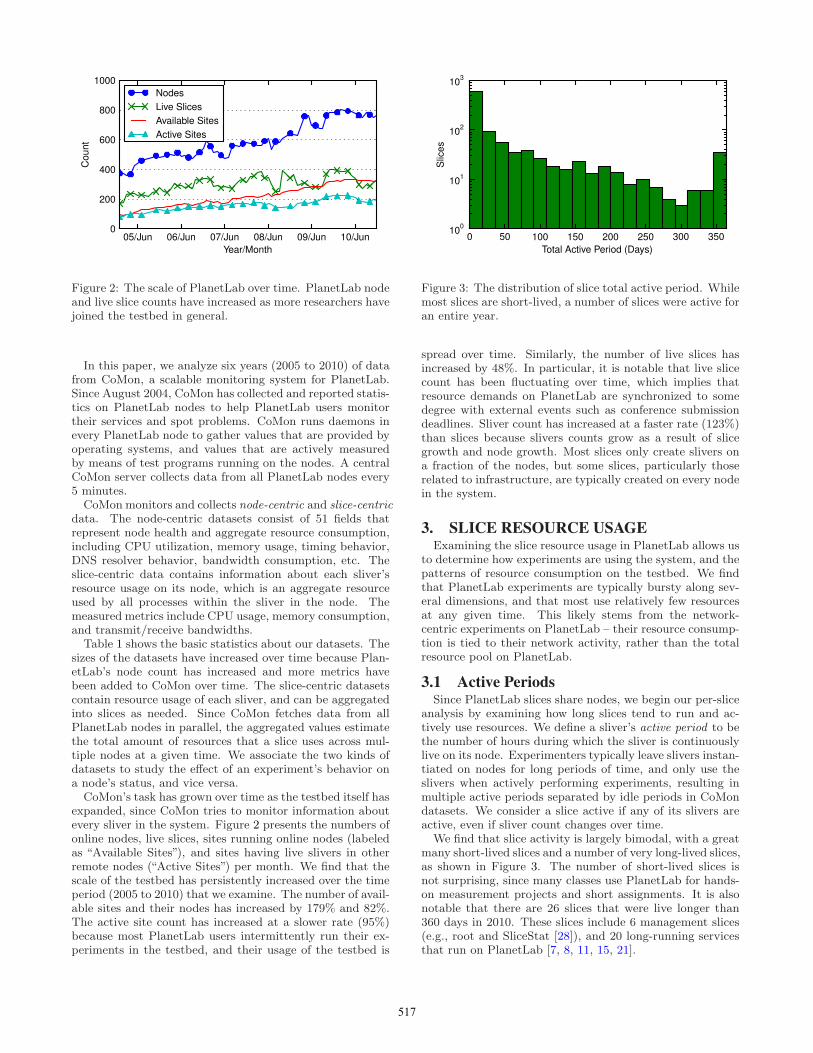
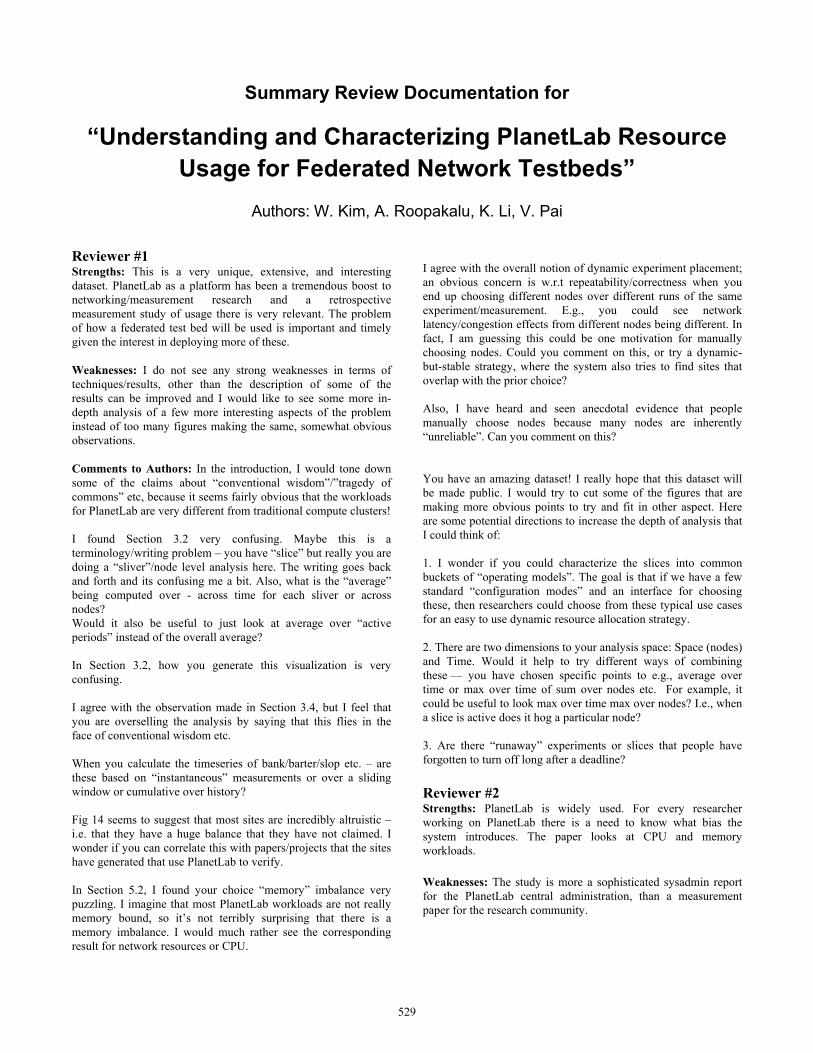
Figure 2: The scale of PlanetLab over time. PlanetLab nodeand live slice counts have increased as more researchers havejoined the testbed in general.
In this paper, we analyze six years (2005 to 2010) of datafrom CoMon, a scalable monitoring system for PlanetLab.Since August 2004, CoMon has collected and reported statis-tics on PlanetLab nodes to help PlanetLab users monitortheir services and spot problems. CoMon runs daemons inevery PlanetLab node to gather values that are provided byoperating systems, and values that are actively measuredby means of test programs running on the nodes. A centralCoMon server collects data from all PlanetLab nodes every5 minutes.CoMon monitors and collects node-centric and slice-centric
data. The node-centric datasets consist of 51 fields thatrepresent node health and aggregate resource consumption,including CPU utilization, memory usage, timing behavior,DNS resolver behavior, bandwidth consumption, etc. Theslice-centric data contains information about each sliver’sresource usage on its node, which is an aggregate resourceused by all processes within the sliver in the node. Themeasured metrics include CPU usage, memory consumption,and transmit/receive bandwidths.Table 1 shows the basic statistics about our datasets. The
sizes of the datasets have increased over time because Plan-etLab’s node count has increased and more metrics havebeen added to CoMon over time. The slice-centric datasetscontain resource usage of each sliver, and can be aggregatedinto slices as needed. Since CoMon fetches data from allPlanetLab nodes in parallel, the aggregated values estimatethe total amount of resources that a slice uses across mul-tiple nodes at a given time. We associate the two kinds ofdatasets to study the effect of an experiment’s behavior ona node’s status, and vice versa.CoMon’s task has grown over time as the testbed itself has
expanded, since CoMon tries to monitor information aboutevery sliver in the system. Figure 2 presents the numbers ofonline nodes, live slices, sites running online nodes (labeledas “Available Sites”), and sites having live slivers in otherremote nodes (“Active Sites”) per month. We find that thescale of the testbed has persistently increased over the timeperiod (2005 to 2010) that we examine. The number of avail-able sites and their nodes has increased by 179% and 82%.The active site count has increased at a slower rate (95%)because most PlanetLab users intermittently run their ex-periments in the testbed, and their usage of the testbed is
0 50 100 150 200 250 300 350
Total Active Period (Days)
100
101
102
103
Slic
es
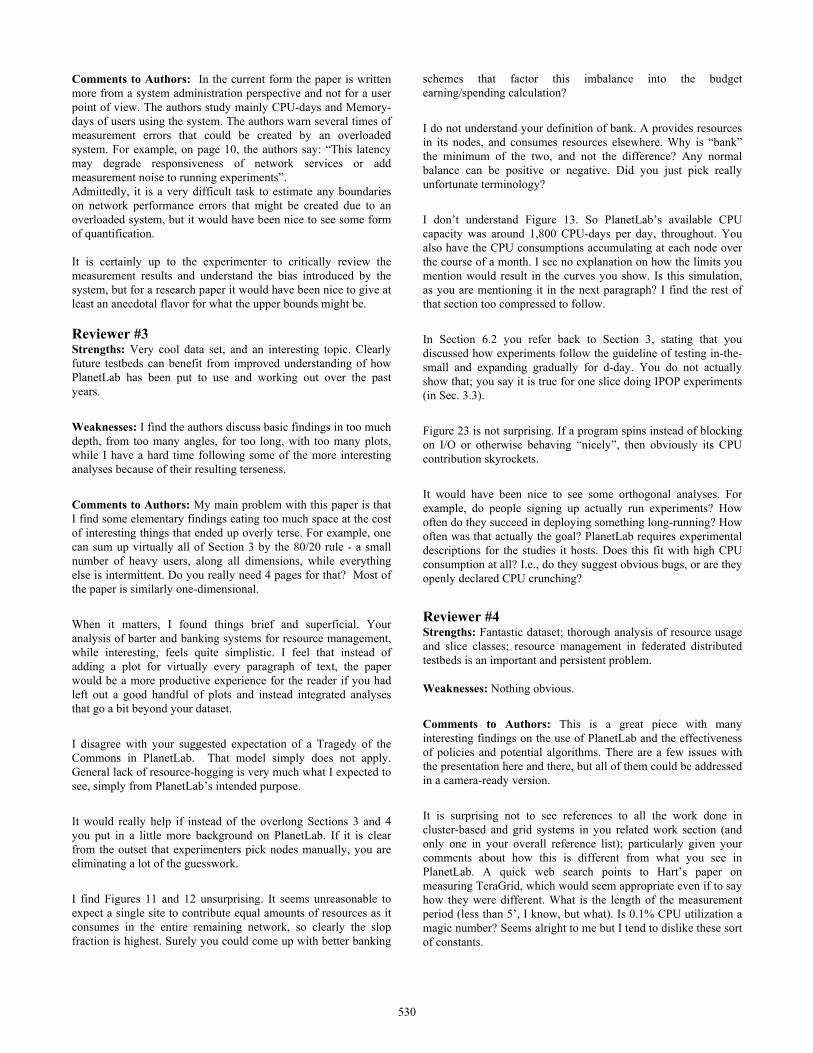
Figure 3: The distribution of slice total active period. Whilemost slices are short-lived, a number of slices were active foran entire year.
spread over time. Similarly, the number of live slices hasincreased by 48%. In particular, it is notable that live slicecount has been fluctuating over time, which implies thatresource demands on PlanetLab are synchronized to somedegree with external events such as conference submissiondeadlines. Sliver count has increased at a faster rate (123%)than slices because slivers counts grow as a result of slicegrowth and node growth. Most slices only create slivers ona fraction of the nodes, but some slices, particularly thoserelated to infrastructure, are typically created on every nodein the system.
3. SLICE RESOURCE USAGEExamining the slice resource usage in PlanetLab allows us
to determine how experiments are using the system, and thepatterns of resource consumption on the testbed. We findthat PlanetLab experiments are typically bursty along sev-eral dimensions, and that most use relatively few resourcesat any given time. This likely stems from the network-centric experiments on PlanetLab – their resource consump-tion is tied to their network activity, rather than the totalresource pool on PlanetLab.
3.1 Active PeriodsSince PlanetLab slices share nodes, we begin our per-slice
analysis by examining how long slices tend to run and ac-tively use resources. We define a sliver’s active period to bethe number of hours during which the sliver is continuouslylive on its node. Experimenters typically leave slivers instan-tiated on nodes for long periods of time, and only use theslivers when actively performing experiments, resulting inmultiple active periods separated by idle periods in CoMondatasets. We consider a slice active if any of its slivers areactive, even if sliver count changes over time.
We find that slice activity is largely bimodal, with a greatmany short-lived slices and a number of very long-lived slices,as shown in Figure 3. The number of short-lived slices isnot surprising, since many classes use PlanetLab for hands-on measurement projects and short assignments. It is alsonotable that there are 26 slices that were live longer than360 days in 2010. These slices include 6 management slices(e.g., root and SliceStat [28]), and 20 long-running servicesthat run on PlanetLab [7, 8, 11, 15, 21].
517
80 85 90 95 100
Fraction of Slices (%)
0
10
20
30
40
50C
PU
pe
r N
od
e (
%)
2006
2008
2010
(a) CPU
80 85 90 95 100
Fraction of Slices (%)
0
2
4
6
8
10
Me
mo
ry p
er
No
de
(%
)
(b) Memory
80 85 90 95 100
Fraction of Slices (%)
0
100
200
300
400
500
Ba
nd
wid
th p
er
No
de
(K
bp
s)
(c) Bandwidth
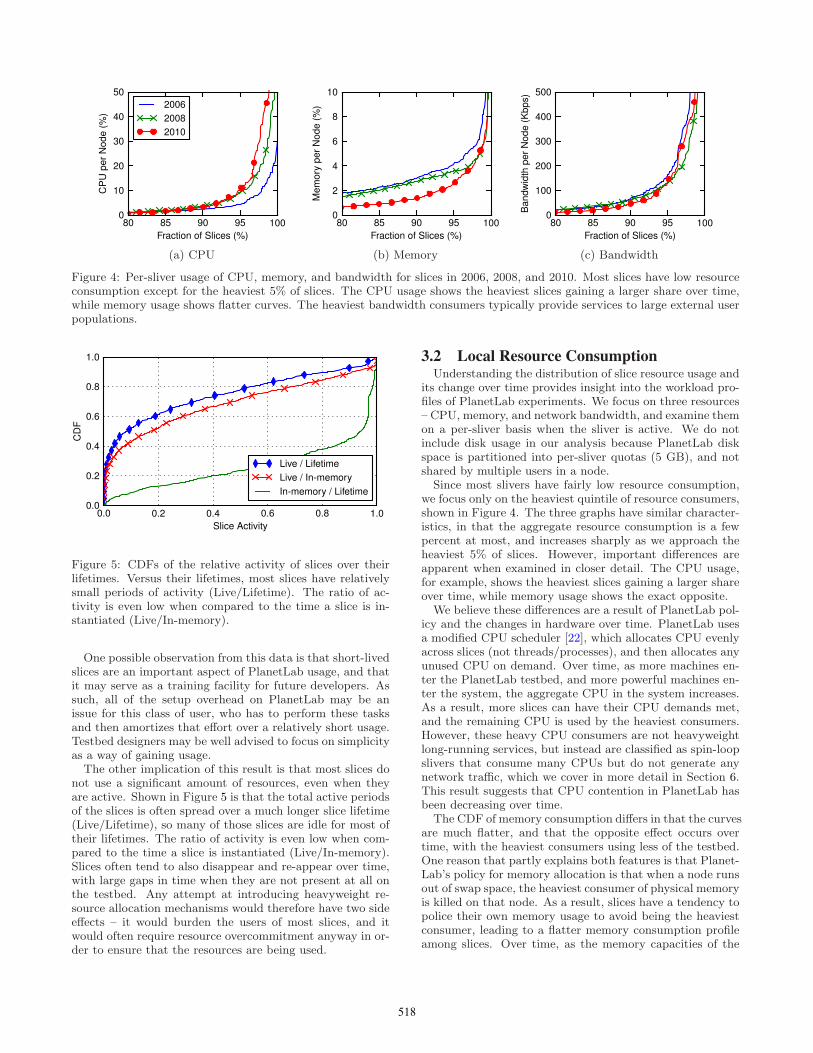
Figure 4: Per-sliver usage of CPU, memory, and bandwidth for slices in 2006, 2008, and 2010. Most slices have low resourceconsumption except for the heaviest 5% of slices. The CPU usage shows the heaviest slices gaining a larger share over time,while memory usage shows flatter curves. The heaviest bandwidth consumers typically provide services to large external userpopulations.
0.0 0.2 0.4 0.6 0.8 1.0
Slice Activity
0.0
0.2
0.4
0.6
0.8
1.0
CD
F
Live / Lifetime
Live / In-memory
In-memory / Lifetime
Figure 5: CDFs of the relative activity of slices over theirlifetimes. Versus their lifetimes, most slices have relativelysmall periods of activity (Live/Lifetime). The ratio of ac-tivity is even low when compared to the time a slice is in-stantiated (Live/In-memory).
One possible observation from this data is that short-livedslices are an important aspect of PlanetLab usage, and thatit may serve as a training facility for future developers. Assuch, all of the setup overhead on PlanetLab may be anissue for this class of user, who has to perform these tasksand then amortizes that effort over a relatively short usage.Testbed designers may be well advised to focus on simplicityas a way of gaining usage.The other implication of this result is that most slices do
not use a significant amount of resources, even when theyare active. Shown in Figure 5 is that the total active periodsof the slices is often spread over a much longer slice lifetime(Live/Lifetime), so many of those slices are idle for most oftheir lifetimes. The ratio of activity is even low when com-pared to the time a slice is instantiated (Live/In-memory).Slices often tend to also disappear and re-appear over time,with large gaps in time when they are not present at all onthe testbed. Any attempt at introducing heavyweight re-source allocation mechanisms would therefore have two sideeffects – it would burden the users of most slices, and itwould often require resource overcommitment anyway in or-der to ensure that the resources are being used.
3.2 Local Resource ConsumptionUnderstanding the distribution of slice resource usage and
its change over time provides insight into the workload pro-files of PlanetLab experiments. We focus on three resources– CPU, memory, and network bandwidth, and examine themon a per-sliver basis when the sliver is active. We do notinclude disk usage in our analysis because PlanetLab diskspace is partitioned into per-sliver quotas (5 GB), and notshared by multiple users in a node.
Since most slivers have fairly low resource consumption,we focus only on the heaviest quintile of resource consumers,shown in Figure 4. The three graphs have similar character-istics, in that the aggregate resource consumption is a fewpercent at most, and increases sharply as we approach theheaviest 5% of slices. However, important differences areapparent when examined in closer detail. The CPU usage,for example, shows the heaviest slices gaining a larger shareover time, while memory usage shows the exact opposite.
We believe these differences are a result of PlanetLab pol-icy and the changes in hardware over time. PlanetLab usesa modified CPU scheduler [22], which allocates CPU evenlyacross slices (not threads/processes), and then allocates anyunused CPU on demand. Over time, as more machines en-ter the PlanetLab testbed, and more powerful machines en-ter the system, the aggregate CPU in the system increases.As a result, more slices can have their CPU demands met,and the remaining CPU is used by the heaviest consumers.However, these heavy CPU consumers are not heavyweightlong-running services, but instead are classified as spin-loopslivers that consume many CPUs but do not generate anynetwork traffic, which we cover in more detail in Section 6.This result suggests that CPU contention in PlanetLab hasbeen decreasing over time.
The CDF of memory consumption differs in that the curvesare much flatter, and that the opposite effect occurs overtime, with the heaviest consumers using less of the testbed.One reason that partly explains both features is that Planet-Lab’s policy for memory allocation is that when a node runsout of swap space, the heaviest consumer of physical memoryis killed on that node. As a result, slices have a tendency topolice their own memory usage to avoid being the heaviestconsumer, leading to a flatter memory consumption profileamong slices. Over time, as the memory capacities of the
518
0 20 40 60 80 100
Fraction of Slices (%)
0
200
400
600
800N
od
es
Available
Max
Average
(a) 2006
0 20 40 60 80 100
Fraction of Slices (%)
0
200
400
600
800
No
de
s
(b) 2008
0 20 40 60 80 100
Fraction of Slices (%)
0
200
400
600
800
No
de
s
(c) 2010
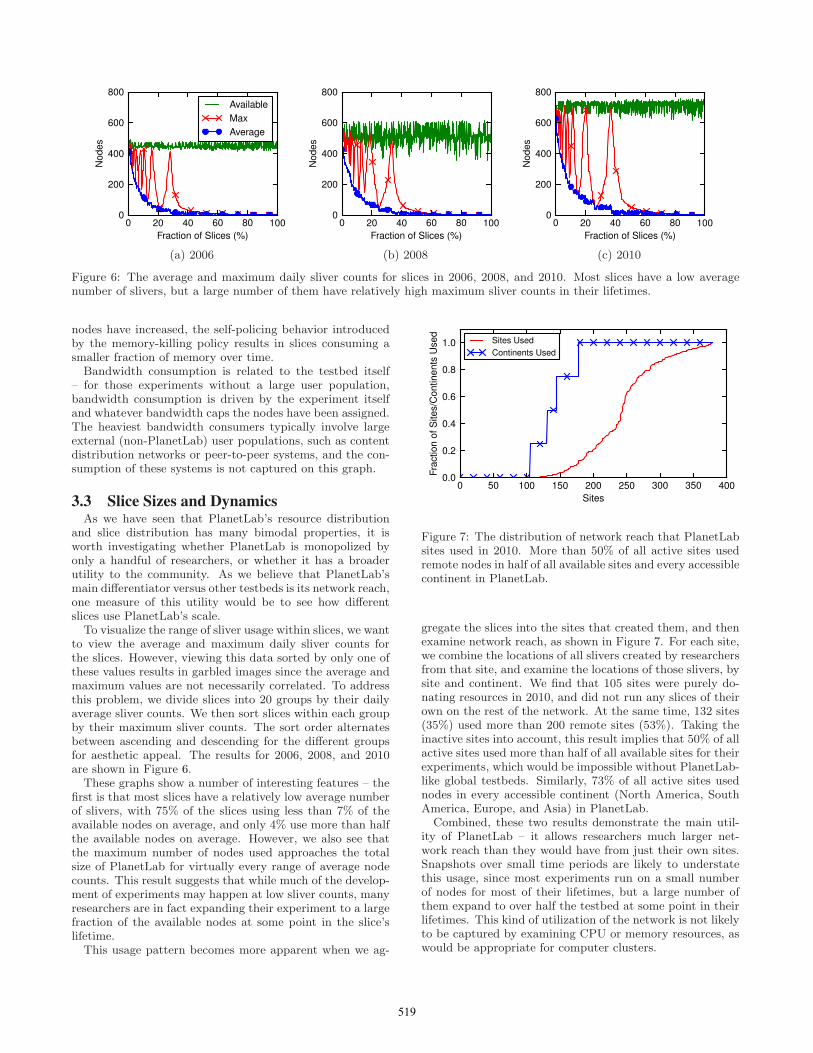
Figure 6: The average and maximum daily sliver counts for slices in 2006, 2008, and 2010. Most slices have a low averagenumber of slivers, but a large number of them have relatively high maximum sliver counts in their lifetimes.
nodes have increased, the self-policing behavior introducedby the memory-killing policy results in slices consuming asmaller fraction of memory over time.Bandwidth consumption is related to the testbed itself
– for those experiments without a large user population,bandwidth consumption is driven by the experiment itselfand whatever bandwidth caps the nodes have been assigned.The heaviest bandwidth consumers typically involve largeexternal (non-PlanetLab) user populations, such as contentdistribution networks or peer-to-peer systems, and the con-sumption of these systems is not captured on this graph.
3.3 Slice Sizes and DynamicsAs we have seen that PlanetLab’s resource distribution
and slice distribution has many bimodal properties, it isworth investigating whether PlanetLab is monopolized byonly a handful of researchers, or whether it has a broaderutility to the community. As we believe that PlanetLab’smain differentiator versus other testbeds is its network reach,one measure of this utility would be to see how differentslices use PlanetLab’s scale.To visualize the range of sliver usage within slices, we want
to view the average and maximum daily sliver counts forthe slices. However, viewing this data sorted by only one ofthese values results in garbled images since the average andmaximum values are not necessarily correlated. To addressthis problem, we divide slices into 20 groups by their dailyaverage sliver counts. We then sort slices within each groupby their maximum sliver counts. The sort order alternatesbetween ascending and descending for the different groupsfor aesthetic appeal. The results for 2006, 2008, and 2010are shown in Figure 6.These graphs show a number of interesting features – the
first is that most slices have a relatively low average numberof slivers, with 75% of the slices using less than 7% of theavailable nodes on average, and only 4% use more than halfthe available nodes on average. However, we also see thatthe maximum number of nodes used approaches the totalsize of PlanetLab for virtually every range of average nodecounts. This result suggests that while much of the develop-ment of experiments may happen at low sliver counts, manyresearchers are in fact expanding their experiment to a largefraction of the available nodes at some point in the slice’slifetime.This usage pattern becomes more apparent when we ag-
0 50 100 150 200 250 300 350 400
Sites
0.0
0.2
0.4
0.6
0.8
1.0
Fra
ctio
n o
f S
ite
s/C
on
tin
en
ts U
se
d
Sites Used
Continents Used
Figure 7: The distribution of network reach that PlanetLabsites used in 2010. More than 50% of all active sites usedremote nodes in half of all available sites and every accessiblecontinent in PlanetLab.
gregate the slices into the sites that created them, and thenexamine network reach, as shown in Figure 7. For each site,we combine the locations of all slivers created by researchersfrom that site, and examine the locations of those slivers, bysite and continent. We find that 105 sites were purely do-nating resources in 2010, and did not run any slices of theirown on the rest of the network. At the same time, 132 sites(35%) used more than 200 remote sites (53%). Taking theinactive sites into account, this result implies that 50% of allactive sites used more than half of all available sites for theirexperiments, which would be impossible without PlanetLab-like global testbeds. Similarly, 73% of all active sites usednodes in every accessible continent (North America, SouthAmerica, Europe, and Asia) in PlanetLab.
Combined, these two results demonstrate the main util-ity of PlanetLab – it allows researchers much larger net-work reach than they would have from just their own sites.Snapshots over small time periods are likely to understatethis usage, since most experiments run on a small numberof nodes for most of their lifetimes, but a large number ofthem expand to over half the testbed at some point in theirlifetimes. This kind of utilization of the network is not likelyto be captured by examining CPU or memory resources, aswould be appropriate for computer clusters.
519
0 1 2 3 4 5
Fraction of Slices (%)
0.0
0.5
1.0
1.5
2.0
2.5C
PU
-day(
×104
) 2006
2008
2010
(a) Per-slice CPU usage
95 96 97 98 99 100
Fraction of Slices (%)
0.0
0.2
0.4
0.6
0.8
1.0
CD
F
(b) CDF of total CPU usage
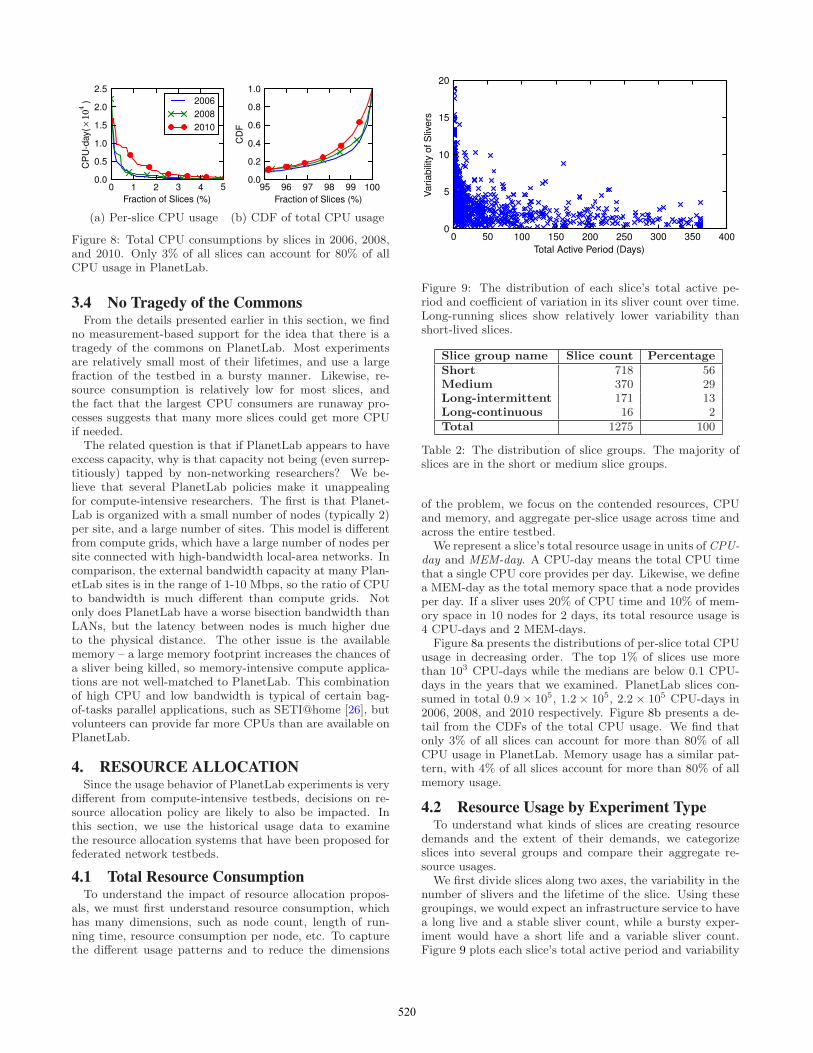
Figure 8: Total CPU consumptions by slices in 2006, 2008,and 2010. Only 3% of all slices can account for 80% of allCPU usage in PlanetLab.
3.4 No Tragedy of the CommonsFrom the details presented earlier in this section, we find
no measurement-based support for the idea that there is atragedy of the commons on PlanetLab. Most experimentsare relatively small most of their lifetimes, and use a largefraction of the testbed in a bursty manner. Likewise, re-source consumption is relatively low for most slices, andthe fact that the largest CPU consumers are runaway pro-cesses suggests that many more slices could get more CPUif needed.The related question is that if PlanetLab appears to have
excess capacity, why is that capacity not being (even surrep-titiously) tapped by non-networking researchers? We be-lieve that several PlanetLab policies make it unappealingfor compute-intensive researchers. The first is that Planet-Lab is organized with a small number of nodes (typically 2)per site, and a large number of sites. This model is differentfrom compute grids, which have a large number of nodes persite connected with high-bandwidth local-area networks. Incomparison, the external bandwidth capacity at many Plan-etLab sites is in the range of 1-10 Mbps, so the ratio of CPUto bandwidth is much different than compute grids. Notonly does PlanetLab have a worse bisection bandwidth thanLANs, but the latency between nodes is much higher dueto the physical distance. The other issue is the availablememory – a large memory footprint increases the chances ofa sliver being killed, so memory-intensive compute applica-tions are not well-matched to PlanetLab. This combinationof high CPU and low bandwidth is typical of certain bag-of-tasks parallel applications, such as SETI@home [26], butvolunteers can provide far more CPUs than are available onPlanetLab.
4. RESOURCE ALLOCATIONSince the usage behavior of PlanetLab experiments is very
different from compute-intensive testbeds, decisions on re-source allocation policy are likely to also be impacted. Inthis section, we use the historical usage data to examinethe resource allocation systems that have been proposed forfederated network testbeds.
4.1 Total Resource ConsumptionTo understand the impact of resource allocation propos-
als, we must first understand resource consumption, whichhas many dimensions, such as node count, length of run-ning time, resource consumption per node, etc. To capturethe different usage patterns and to reduce the dimensions
0 50 100 150 200 250 300 350 400
Total Active Period (Days)
0
5
10
15
20
Va
ria
bili
ty o
f S
live
rs
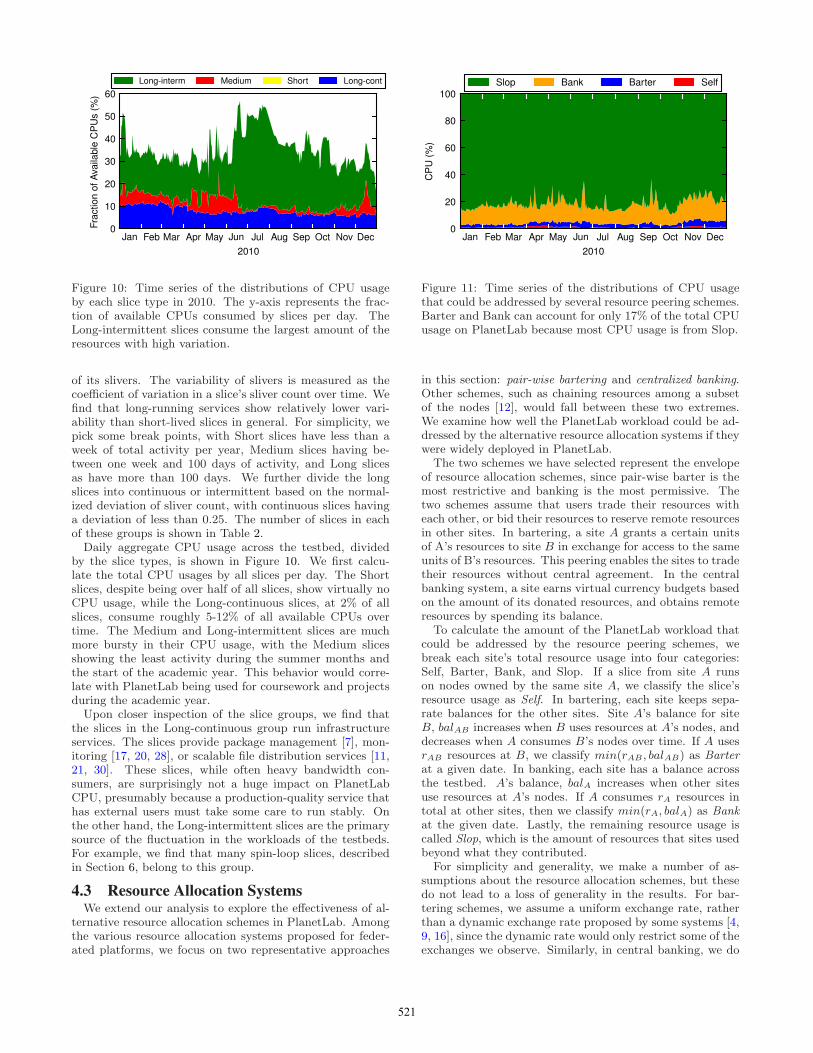
Figure 9: The distribution of each slice’s total active pe-riod and coefficient of variation in its sliver count over time.Long-running slices show relatively lower variability thanshort-lived slices.
Slice group name Slice count Percentage
Short 718 56Medium 370 29Long-intermittent 171 13Long-continuous 16 2Total 1275 100
Table 2: The distribution of slice groups. The majority ofslices are in the short or medium slice groups.
of the problem, we focus on the contended resources, CPUand memory, and aggregate per-slice usage across time andacross the entire testbed.
We represent a slice’s total resource usage in units of CPU-day and MEM-day. A CPU-day means the total CPU timethat a single CPU core provides per day. Likewise, we definea MEM-day as the total memory space that a node providesper day. If a sliver uses 20% of CPU time and 10% of mem-ory space in 10 nodes for 2 days, its total resource usage is4 CPU-days and 2 MEM-days.
Figure 8a presents the distributions of per-slice total CPUusage in decreasing order. The top 1% of slices use morethan 103 CPU-days while the medians are below 0.1 CPU-days in the years that we examined. PlanetLab slices con-sumed in total 0.9 × 10⁵, 1.2 × 10⁵, 2.2 × 10⁵ CPU-days in2006, 2008, and 2010 respectively. Figure 8b presents a de-tail from the CDFs of the total CPU usage. We find thatonly 3% of all slices can account for more than 80% of allCPU usage in PlanetLab. Memory usage has a similar pat-tern, with 4% of all slices account for more than 80% of allmemory usage.
4.2 Resource Usage by Experiment TypeTo understand what kinds of slices are creating resource
demands and the extent of their demands, we categorizeslices into several groups and compare their aggregate re-source usages.
We first divide slices along two axes, the variability in thenumber of slivers and the lifetime of the slice. Using thesegroupings, we would expect an infrastructure service to havea long live and a stable sliver count, while a bursty exper-iment would have a short life and a variable sliver count.Figure 9 plots each slice’s total active period and variability
520
Jan Feb Mar Apr May Jun Jul Aug Sep Oct Nov Dec
2010
0
10
20
30
40
50
60F
ractio
n o
f A
vaila
ble
CP
Us (
%)
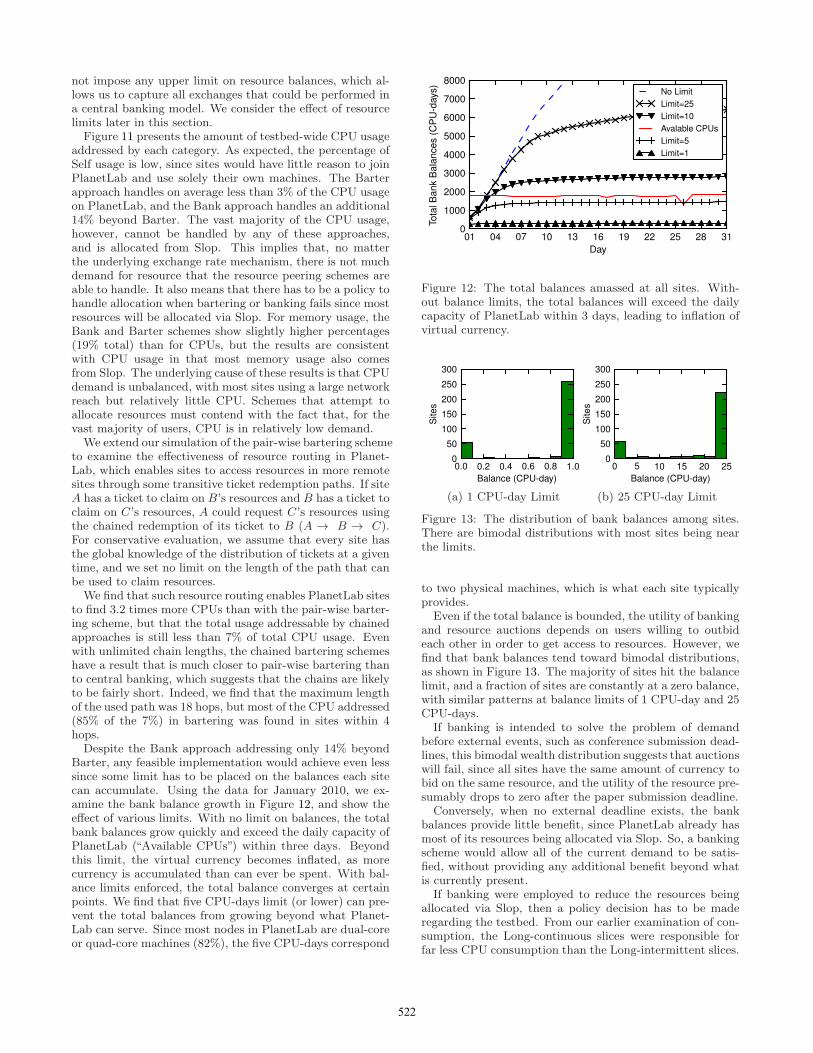
Long-interm Medium Short Long-cont
Figure 10: Time series of the distributions of CPU usageby each slice type in 2010. The y-axis represents the frac-tion of available CPUs consumed by slices per day. TheLong-intermittent slices consume the largest amount of theresources with high variation.
of its slivers. The variability of slivers is measured as thecoefficient of variation in a slice’s sliver count over time. Wefind that long-running services show relatively lower vari-ability than short-lived slices in general. For simplicity, wepick some break points, with Short slices have less than aweek of total activity per year, Medium slices having be-tween one week and 100 days of activity, and Long slicesas have more than 100 days. We further divide the longslices into continuous or intermittent based on the normal-ized deviation of sliver count, with continuous slices havinga deviation of less than 0.25. The number of slices in eachof these groups is shown in Table 2.Daily aggregate CPU usage across the testbed, divided
by the slice types, is shown in Figure 10. We first calcu-late the total CPU usages by all slices per day. The Shortslices, despite being over half of all slices, show virtually noCPU usage, while the Long-continuous slices, at 2% of allslices, consume roughly 5-12% of all available CPUs overtime. The Medium and Long-intermittent slices are muchmore bursty in their CPU usage, with the Medium slicesshowing the least activity during the summer months andthe start of the academic year. This behavior would corre-late with PlanetLab being used for coursework and projectsduring the academic year.Upon closer inspection of the slice groups, we find that
the slices in the Long-continuous group run infrastructureservices. The slices provide package management [7], mon-itoring [17, 20, 28], or scalable file distribution services [11,21, 30]. These slices, while often heavy bandwidth con-sumers, are surprisingly not a huge impact on PlanetLabCPU, presumably because a production-quality service thathas external users must take some care to run stably. Onthe other hand, the Long-intermittent slices are the primarysource of the fluctuation in the workloads of the testbeds.For example, we find that many spin-loop slices, describedin Section 6, belong to this group.
4.3 Resource Allocation SystemsWe extend our analysis to explore the effectiveness of al-
ternative resource allocation schemes in PlanetLab. Amongthe various resource allocation systems proposed for feder-ated platforms, we focus on two representative approaches
Jan Feb Mar Apr May Jun Jul Aug Sep Oct Nov Dec
2010
0
20
40
60
80
100
CP
U (
%)
Slop Bank Barter Self
Figure 11: Time series of the distributions of CPU usagethat could be addressed by several resource peering schemes.Barter and Bank can account for only 17% of the total CPUusage on PlanetLab because most CPU usage is from Slop.
in this section: pair-wise bartering and centralized banking.Other schemes, such as chaining resources among a subsetof the nodes [12], would fall between these two extremes.We examine how well the PlanetLab workload could be ad-dressed by the alternative resource allocation systems if theywere widely deployed in PlanetLab.
The two schemes we have selected represent the envelopeof resource allocation schemes, since pair-wise barter is themost restrictive and banking is the most permissive. Thetwo schemes assume that users trade their resources witheach other, or bid their resources to reserve remote resourcesin other sites. In bartering, a site A grants a certain unitsof A’s resources to site B in exchange for access to the sameunits of B’s resources. This peering enables the sites to tradetheir resources without central agreement. In the centralbanking system, a site earns virtual currency budgets basedon the amount of its donated resources, and obtains remoteresources by spending its balance.
To calculate the amount of the PlanetLab workload thatcould be addressed by the resource peering schemes, webreak each site’s total resource usage into four categories:Self, Barter, Bank, and Slop. If a slice from site A runson nodes owned by the same site A, we classify the slice’sresource usage as Self. In bartering, each site keeps sepa-rate balances for the other sites. Site A’s balance for siteB, balAB increases when B uses resources at A’s nodes, anddecreases when A consumes B’s nodes over time. If A usesrAB resources at B, we classify min(rAB , balAB) as Barterat a given date. In banking, each site has a balance acrossthe testbed. A’s balance, balA increases when other sitesuse resources at A’s nodes. If A consumes rA resources intotal at other sites, then we classify min(rA, balA) as Bankat the given date. Lastly, the remaining resource usage iscalled Slop, which is the amount of resources that sites usedbeyond what they contributed.
For simplicity and generality, we make a number of as-sumptions about the resource allocation schemes, but thesedo not lead to a loss of generality in the results. For bar-tering schemes, we assume a uniform exchange rate, ratherthan a dynamic exchange rate proposed by some systems [4,9, 16], since the dynamic rate would only restrict some of theexchanges we observe. Similarly, in central banking, we do
521
not impose any upper limit on resource balances, which al-lows us to capture all exchanges that could be performed ina central banking model. We consider the effect of resourcelimits later in this section.Figure 11 presents the amount of testbed-wide CPU usage
addressed by each category. As expected, the percentage ofSelf usage is low, since sites would have little reason to joinPlanetLab and use solely their own machines. The Barterapproach handles on average less than 3% of the CPU usageon PlanetLab, and the Bank approach handles an additional14% beyond Barter. The vast majority of the CPU usage,however, cannot be handled by any of these approaches,and is allocated from Slop. This implies that, no matterthe underlying exchange rate mechanism, there is not muchdemand for resource that the resource peering schemes areable to handle. It also means that there has to be a policy tohandle allocation when bartering or banking fails since mostresources will be allocated via Slop. For memory usage, theBank and Barter schemes show slightly higher percentages(19% total) than for CPUs, but the results are consistentwith CPU usage in that most memory usage also comesfrom Slop. The underlying cause of these results is that CPUdemand is unbalanced, with most sites using a large networkreach but relatively little CPU. Schemes that attempt toallocate resources must contend with the fact that, for thevast majority of users, CPU is in relatively low demand.We extend our simulation of the pair-wise bartering scheme
to examine the effectiveness of resource routing in Planet-Lab, which enables sites to access resources in more remotesites through some transitive ticket redemption paths. If siteA has a ticket to claim on B’s resources and B has a ticket toclaim on C’s resources, A could request C’s resources usingthe chained redemption of its ticket to B (A → B → C).For conservative evaluation, we assume that every site hasthe global knowledge of the distribution of tickets at a giventime, and we set no limit on the length of the path that canbe used to claim resources.We find that such resource routing enables PlanetLab sites
to find 3.2 times more CPUs than with the pair-wise barter-ing scheme, but that the total usage addressable by chainedapproaches is still less than 7% of total CPU usage. Evenwith unlimited chain lengths, the chained bartering schemeshave a result that is much closer to pair-wise bartering thanto central banking, which suggests that the chains are likelyto be fairly short. Indeed, we find that the maximum lengthof the used path was 18 hops, but most of the CPU addressed(85% of the 7%) in bartering was found in sites within 4hops.Despite the Bank approach addressing only 14% beyond
Barter, any feasible implementation would achieve even lesssince some limit has to be placed on the balances each sitecan accumulate. Using the data for January 2010, we ex-amine the bank balance growth in Figure 12, and show theeffect of various limits. With no limit on balances, the totalbank balances grow quickly and exceed the daily capacity ofPlanetLab (“Available CPUs”) within three days. Beyondthis limit, the virtual currency becomes inflated, as morecurrency is accumulated than can ever be spent. With bal-ance limits enforced, the total balance converges at certainpoints. We find that five CPU-days limit (or lower) can pre-vent the total balances from growing beyond what Planet-Lab can serve. Since most nodes in PlanetLab are dual-coreor quad-core machines (82%), the five CPU-days correspond
01 04 07 10 13 16 19 22 25 28 31
Day
0
1000
2000
3000
4000
5000
6000
7000
8000
To
tal B
an
k B
ala
nce
s (
CP
U-d
ays)
No Limit
Limit=25
Limit=10
Avalable CPUs
Limit=5
Limit=1
Figure 12: The total balances amassed at all sites. With-out balance limits, the total balances will exceed the dailycapacity of PlanetLab within 3 days, leading to inflation ofvirtual currency.
0.0 0.2 0.4 0.6 0.8 1.0
Balance (CPU-day)
0
50
100
150
200
250
300
Site
s
(a) 1 CPU-day Limit
0 5 10 15 20 25
Balance (CPU-day)
0
50
100
150
200
250
300
Site
s
(b) 25 CPU-day Limit
Figure 13: The distribution of bank balances among sites.There are bimodal distributions with most sites being nearthe limits.
to two physical machines, which is what each site typicallyprovides.
Even if the total balance is bounded, the utility of bankingand resource auctions depends on users willing to outbideach other in order to get access to resources. However, wefind that bank balances tend toward bimodal distributions,as shown in Figure 13. The majority of sites hit the balancelimit, and a fraction of sites are constantly at a zero balance,with similar patterns at balance limits of 1 CPU-day and 25CPU-days.
If banking is intended to solve the problem of demandbefore external events, such as conference submission dead-lines, this bimodal wealth distribution suggests that auctionswill fail, since all sites have the same amount of currency tobid on the same resource, and the utility of the resource pre-sumably drops to zero after the paper submission deadline.
Conversely, when no external deadline exists, the bankbalances provide little benefit, since PlanetLab already hasmost of its resources being allocated via Slop. So, a bankingscheme would allow all of the current demand to be satis-fied, without providing any additional benefit beyond whatis currently present.
If banking were employed to reduce the resources beingallocated via Slop, then a policy decision has to be maderegarding the testbed. From our earlier examination of con-sumption, the Long-continuous slices were responsible forfar less CPU consumption than the Long-intermittent slices.
522
0 50 100 150msec
0.0
0.2
0.4
0.6
0.8
1.0C
DF
Bottom 25%
Middle
Top 25%
(a) ServTest-max
0 500 1000 1500 2000 2500msec
0.0
0.2
0.4
0.6
0.8
1.0
CD
F
(b) Timer-max
0 5 10 15 20 25msec
0.0
0.2
0.4
0.6
0.8
1.0
CD
F
(c) SleepLoop
Figure 14: CDFs of system lags in nodes grouped by their average CPU load.
0 20 40 60 80 100
Utilization (%)
0.0
0.2
0.4
0.6
0.8
1.0
CD
F
CPU
Memory
Figure 15: CDFs of average CPU/Memory utilization of allPlanetLab nodes in 2010.
One may decide that Slop should be allocated preferentiallyto continuously-running services in order to increase the vis-ibility (internally and externally) of PlanetLab. In any case,the decision becomes how to allocate the Slop, not how touse banking, suggesting that banking by itself provides littleutility.
5. WORKLOAD IMBALANCEDespite the availability of resources on PlanetLab, some
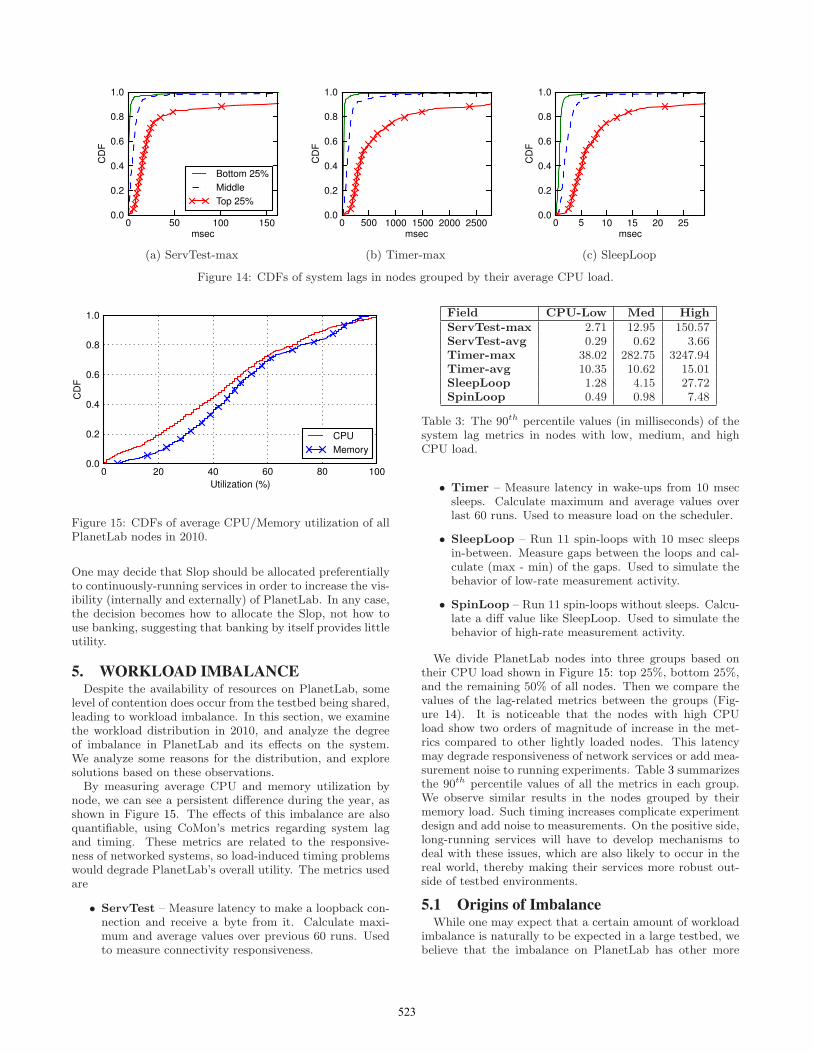
level of contention does occur from the testbed being shared,leading to workload imbalance. In this section, we examinethe workload distribution in 2010, and analyze the degreeof imbalance in PlanetLab and its effects on the system.We analyze some reasons for the distribution, and exploresolutions based on these observations.By measuring average CPU and memory utilization by
node, we can see a persistent difference during the year, asshown in Figure 15. The effects of this imbalance are alsoquantifiable, using CoMon’s metrics regarding system lagand timing. These metrics are related to the responsive-ness of networked systems, so load-induced timing problemswould degrade PlanetLab’s overall utility. The metrics usedare
• ServTest – Measure latency to make a loopback con-nection and receive a byte from it. Calculate maxi-mum and average values over previous 60 runs. Usedto measure connectivity responsiveness.
Field CPU-Low Med High
ServTest-max 2.71 12.95 150.57ServTest-avg 0.29 0.62 3.66Timer-max 38.02 282.75 3247.94Timer-avg 10.35 10.62 15.01SleepLoop 1.28 4.15 27.72SpinLoop 0.49 0.98 7.48
Table 3: The 90th percentile values (in milliseconds) of thesystem lag metrics in nodes with low, medium, and highCPU load.
• Timer – Measure latency in wake-ups from 10 msecsleeps. Calculate maximum and average values overlast 60 runs. Used to measure load on the scheduler.
• SleepLoop – Run 11 spin-loops with 10 msec sleepsin-between. Measure gaps between the loops and cal-culate (max - min) of the gaps. Used to simulate thebehavior of low-rate measurement activity.
• SpinLoop – Run 11 spin-loops without sleeps. Calcu-late a diff value like SleepLoop. Used to simulate thebehavior of high-rate measurement activity.
We divide PlanetLab nodes into three groups based ontheir CPU load shown in Figure 15: top 25%, bottom 25%,and the remaining 50% of all nodes. Then we compare thevalues of the lag-related metrics between the groups (Fig-ure 14). It is noticeable that the nodes with high CPUload show two orders of magnitude of increase in the met-rics compared to other lightly loaded nodes. This latencymay degrade responsiveness of network services or add mea-surement noise to running experiments. Table 3 summarizesthe 90th percentile values of all the metrics in each group.We observe similar results in the nodes grouped by theirmemory load. Such timing increases complicate experimentdesign and add noise to measurements. On the positive side,long-running services will have to develop mechanisms todeal with these issues, which are also likely to occur in thereal world, thereby making their services more robust out-side of testbed environments.
5.1 Origins of ImbalanceWhile one may expect that a certain amount of workload
imbalance is naturally to be expected in a large testbed, webelieve that the imbalance on PlanetLab has other more
523
05 06 07 08 09 10
Node Registration Year
0
5
10
15
20
25
30L
ive
Sliv
ers
pe
r N
od
e
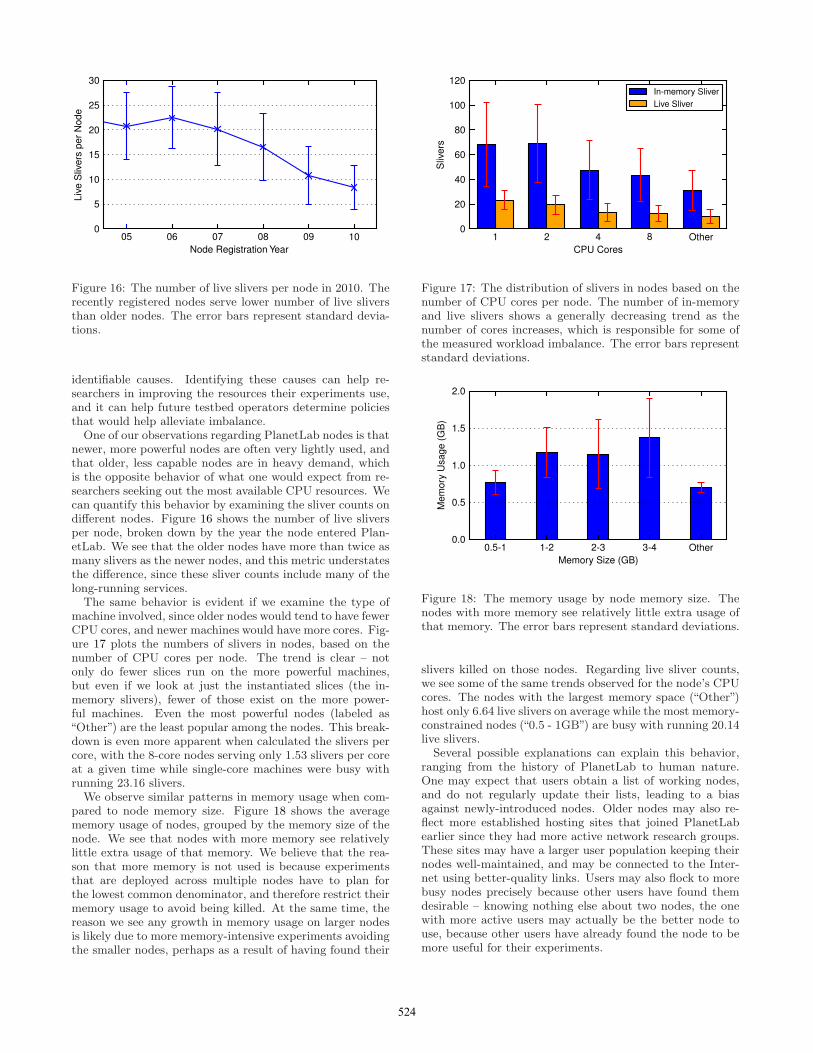
Figure 16: The number of live slivers per node in 2010. Therecently registered nodes serve lower number of live sliversthan older nodes. The error bars represent standard devia-tions.
identifiable causes. Identifying these causes can help re-searchers in improving the resources their experiments use,and it can help future testbed operators determine policiesthat would help alleviate imbalance.One of our observations regarding PlanetLab nodes is that
newer, more powerful nodes are often very lightly used, andthat older, less capable nodes are in heavy demand, whichis the opposite behavior of what one would expect from re-searchers seeking out the most available CPU resources. Wecan quantify this behavior by examining the sliver counts ondifferent nodes. Figure 16 shows the number of live sliversper node, broken down by the year the node entered Plan-etLab. We see that the older nodes have more than twice asmany slivers as the newer nodes, and this metric understatesthe difference, since these sliver counts include many of thelong-running services.The same behavior is evident if we examine the type of
machine involved, since older nodes would tend to have fewerCPU cores, and newer machines would have more cores. Fig-ure 17 plots the numbers of slivers in nodes, based on thenumber of CPU cores per node. The trend is clear – notonly do fewer slices run on the more powerful machines,but even if we look at just the instantiated slices (the in-memory slivers), fewer of those exist on the more power-ful machines. Even the most powerful nodes (labeled as“Other”) are the least popular among the nodes. This break-down is even more apparent when calculated the slivers percore, with the 8-core nodes serving only 1.53 slivers per coreat a given time while single-core machines were busy withrunning 23.16 slivers.We observe similar patterns in memory usage when com-
pared to node memory size. Figure 18 shows the averagememory usage of nodes, grouped by the memory size of thenode. We see that nodes with more memory see relativelylittle extra usage of that memory. We believe that the rea-son that more memory is not used is because experimentsthat are deployed across multiple nodes have to plan forthe lowest common denominator, and therefore restrict theirmemory usage to avoid being killed. At the same time, thereason we see any growth in memory usage on larger nodesis likely due to more memory-intensive experiments avoidingthe smaller nodes, perhaps as a result of having found their
1 2 4 8 Other
CPU Cores
0
20
40
60
80
100
120
Sliv
ers
In-memory Sliver
Live Sliver
Figure 17: The distribution of slivers in nodes based on thenumber of CPU cores per node. The number of in-memoryand live slivers shows a generally decreasing trend as thenumber of cores increases, which is responsible for some ofthe measured workload imbalance. The error bars representstandard deviations.
0.5-1 1-2 2-3 3-4 Other
Memory Size (GB)
0.0
0.5
1.0
1.5
2.0
Me
mo
ry U
sa
ge
(G
B)
Figure 18: The memory usage by node memory size. Thenodes with more memory see relatively little extra usage ofthat memory. The error bars represent standard deviations.
slivers killed on those nodes. Regarding live sliver counts,we see some of the same trends observed for the node’s CPUcores. The nodes with the largest memory space (“Other”)host only 6.64 live slivers on average while the most memory-constrained nodes (“0.5 - 1GB”) are busy with running 20.14live slivers.
Several possible explanations can explain this behavior,ranging from the history of PlanetLab to human nature.One may expect that users obtain a list of working nodes,and do not regularly update their lists, leading to a biasagainst newly-introduced nodes. Older nodes may also re-flect more established hosting sites that joined PlanetLabearlier since they had more active network research groups.These sites may have a larger user population keeping theirnodes well-maintained, and may be connected to the Inter-net using better-quality links. Users may also flock to morebusy nodes precisely because other users have found themdesirable – knowing nothing else about two nodes, the onewith more active users may actually be the better node touse, because other users have already found the node to bemore useful for their experiments.
524
DNS bandwidth uptime availability comb.
Field
0
5
10
15
20
25
30L
ive
Sliv
ers
wo
rkin
g
faili
ng
hig
h
low
sta
ble
unsta
ble
hig
h
low
all-
go
od
all-
ba
d
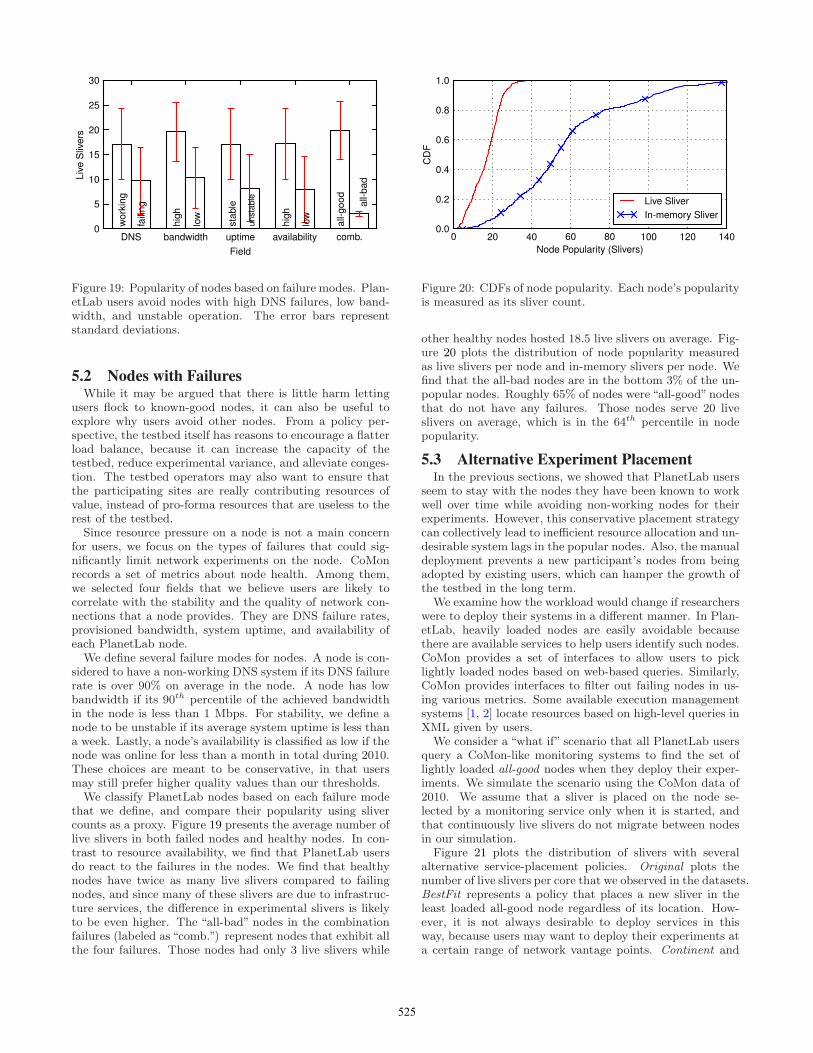
Figure 19: Popularity of nodes based on failure modes. Plan-etLab users avoid nodes with high DNS failures, low band-width, and unstable operation. The error bars representstandard deviations.
5.2 Nodes with FailuresWhile it may be argued that there is little harm letting
users flock to known-good nodes, it can also be useful toexplore why users avoid other nodes. From a policy per-spective, the testbed itself has reasons to encourage a flatterload balance, because it can increase the capacity of thetestbed, reduce experimental variance, and alleviate conges-tion. The testbed operators may also want to ensure thatthe participating sites are really contributing resources ofvalue, instead of pro-forma resources that are useless to therest of the testbed.Since resource pressure on a node is not a main concern
for users, we focus on the types of failures that could sig-nificantly limit network experiments on the node. CoMonrecords a set of metrics about node health. Among them,we selected four fields that we believe users are likely tocorrelate with the stability and the quality of network con-nections that a node provides. They are DNS failure rates,provisioned bandwidth, system uptime, and availability ofeach PlanetLab node.We define several failure modes for nodes. A node is con-
sidered to have a non-working DNS system if its DNS failurerate is over 90% on average in the node. A node has lowbandwidth if its 90th percentile of the achieved bandwidthin the node is less than 1 Mbps. For stability, we define anode to be unstable if its average system uptime is less thana week. Lastly, a node’s availability is classified as low if thenode was online for less than a month in total during 2010.These choices are meant to be conservative, in that usersmay still prefer higher quality values than our thresholds.We classify PlanetLab nodes based on each failure mode
that we define, and compare their popularity using slivercounts as a proxy. Figure 19 presents the average number oflive slivers in both failed nodes and healthy nodes. In con-trast to resource availability, we find that PlanetLab usersdo react to the failures in the nodes. We find that healthynodes have twice as many live slivers compared to failingnodes, and since many of these slivers are due to infrastruc-ture services, the difference in experimental slivers is likelyto be even higher. The “all-bad” nodes in the combinationfailures (labeled as “comb.”) represent nodes that exhibit allthe four failures. Those nodes had only 3 live slivers while
0 20 40 60 80 100 120 140
Node Popularity (Slivers)
0.0
0.2
0.4
0.6
0.8
1.0
CD
F
Live Sliver
In-memory Sliver
Figure 20: CDFs of node popularity. Each node’s popularityis measured as its sliver count.
other healthy nodes hosted 18.5 live slivers on average. Fig-ure 20 plots the distribution of node popularity measuredas live slivers per node and in-memory slivers per node. Wefind that the all-bad nodes are in the bottom 3% of the un-popular nodes. Roughly 65% of nodes were “all-good”nodesthat do not have any failures. Those nodes serve 20 liveslivers on average, which is in the 64th percentile in nodepopularity.
5.3 Alternative Experiment PlacementIn the previous sections, we showed that PlanetLab users
seem to stay with the nodes they have been known to workwell over time while avoiding non-working nodes for theirexperiments. However, this conservative placement strategycan collectively lead to inefficient resource allocation and un-desirable system lags in the popular nodes. Also, the manualdeployment prevents a new participant’s nodes from beingadopted by existing users, which can hamper the growth ofthe testbed in the long term.
We examine how the workload would change if researcherswere to deploy their systems in a different manner. In Plan-etLab, heavily loaded nodes are easily avoidable becausethere are available services to help users identify such nodes.CoMon provides a set of interfaces to allow users to picklightly loaded nodes based on web-based queries. Similarly,CoMon provides interfaces to filter out failing nodes in us-ing various metrics. Some available execution managementsystems [1, 2] locate resources based on high-level queries inXML given by users.
We consider a “what if” scenario that all PlanetLab usersquery a CoMon-like monitoring systems to find the set oflightly loaded all-good nodes when they deploy their exper-iments. We simulate the scenario using the CoMon data of2010. We assume that a sliver is placed on the node se-lected by a monitoring service only when it is started, andthat continuously live slivers do not migrate between nodesin our simulation.
Figure 21 plots the distribution of slivers with severalalternative service-placement policies. Original plots thenumber of live slivers per core that we observed in the datasets.BestFit represents a policy that places a new sliver in theleast loaded all-good node regardless of its location. How-ever, it is not always desirable to deploy services in thisway, because users may want to deploy their experiments ata certain range of network vantage points. Continent and
525
0 5 10 15 20 25 30
Live Slivers per Core
0.0
0.2
0.4
0.6
0.8
1.0C
DF
Original
100Km
Country
Continent
BestFit
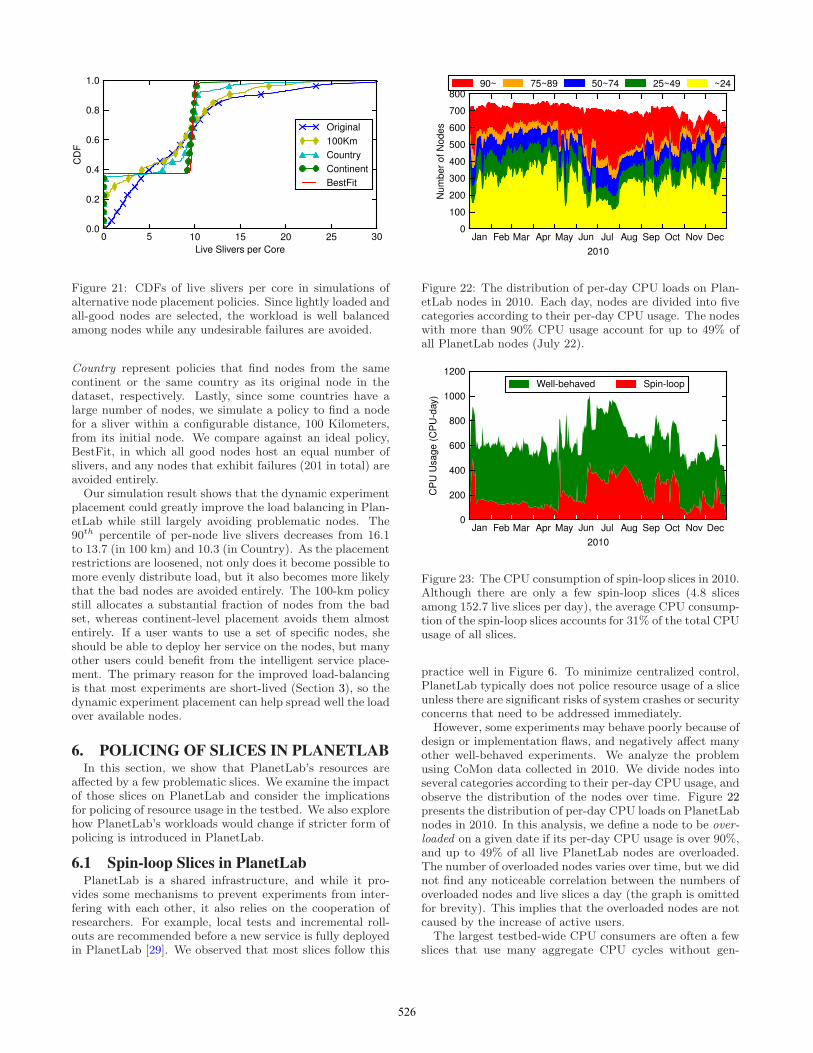
Figure 21: CDFs of live slivers per core in simulations ofalternative node placement policies. Since lightly loaded andall-good nodes are selected, the workload is well balancedamong nodes while any undesirable failures are avoided.
Country represent policies that find nodes from the samecontinent or the same country as its original node in thedataset, respectively. Lastly, since some countries have alarge number of nodes, we simulate a policy to find a nodefor a sliver within a configurable distance, 100 Kilometers,from its initial node. We compare against an ideal policy,BestFit, in which all good nodes host an equal number ofslivers, and any nodes that exhibit failures (201 in total) areavoided entirely.Our simulation result shows that the dynamic experiment
placement could greatly improve the load balancing in Plan-etLab while still largely avoiding problematic nodes. The90th percentile of per-node live slivers decreases from 16.1to 13.7 (in 100 km) and 10.3 (in Country). As the placementrestrictions are loosened, not only does it become possible tomore evenly distribute load, but it also becomes more likelythat the bad nodes are avoided entirely. The 100-km policystill allocates a substantial fraction of nodes from the badset, whereas continent-level placement avoids them almostentirely. If a user wants to use a set of specific nodes, sheshould be able to deploy her service on the nodes, but manyother users could benefit from the intelligent service place-ment. The primary reason for the improved load-balancingis that most experiments are short-lived (Section 3), so thedynamic experiment placement can help spread well the loadover available nodes.
6. POLICING OF SLICES IN PLANETLABIn this section, we show that PlanetLab’s resources are
affected by a few problematic slices. We examine the impactof those slices on PlanetLab and consider the implicationsfor policing of resource usage in the testbed. We also explorehow PlanetLab’s workloads would change if stricter form ofpolicing is introduced in PlanetLab.
6.1 Spin-loop Slices in PlanetLabPlanetLab is a shared infrastructure, and while it pro-
vides some mechanisms to prevent experiments from inter-fering with each other, it also relies on the cooperation ofresearchers. For example, local tests and incremental roll-outs are recommended before a new service is fully deployedin PlanetLab [29]. We observed that most slices follow this
Jan Feb Mar Apr May Jun Jul Aug Sep Oct Nov Dec
2010
0
100
200
300
400
500
600
700
800
Nu
mb
er
of
No
de
s
90~ 75~89 50~74 25~49 ~24
Figure 22: The distribution of per-day CPU loads on Plan-etLab nodes in 2010. Each day, nodes are divided into fivecategories according to their per-day CPU usage. The nodeswith more than 90% CPU usage account for up to 49% ofall PlanetLab nodes (July 22).
Jan Feb Mar Apr May Jun Jul Aug Sep Oct Nov Dec
2010
0
200
400
600
800
1000
1200
CP
U U
sa
ge
(C
PU
-day)
Well-behaved Spin-loop
Figure 23: The CPU consumption of spin-loop slices in 2010.Although there are only a few spin-loop slices (4.8 slicesamong 152.7 live slices per day), the average CPU consump-tion of the spin-loop slices accounts for 31% of the total CPUusage of all slices.
practice well in Figure 6. To minimize centralized control,PlanetLab typically does not police resource usage of a sliceunless there are significant risks of system crashes or securityconcerns that need to be addressed immediately.
However, some experiments may behave poorly because ofdesign or implementation flaws, and negatively affect manyother well-behaved experiments. We analyze the problemusing CoMon data collected in 2010. We divide nodes intoseveral categories according to their per-day CPU usage, andobserve the distribution of the nodes over time. Figure 22presents the distribution of per-day CPU loads on PlanetLabnodes in 2010. In this analysis, we define a node to be over-loaded on a given date if its per-day CPU usage is over 90%,and up to 49% of all live PlanetLab nodes are overloaded.The number of overloaded nodes varies over time, but we didnot find any noticeable correlation between the numbers ofoverloaded nodes and live slices a day (the graph is omittedfor brevity). This implies that the overloaded nodes are notcaused by the increase of active users.
The largest testbed-wide CPU consumers are often a fewslices that use many aggregate CPU cycles without gen-
526
Jan Feb Mar Apr May Jun Jul Aug Sep Oct Nov Dec
2010
0
100
200
300
400
500
600
700
800
Nu
mb
er
of
No
de
s90~ 75~89 50~74 25~49 ~24
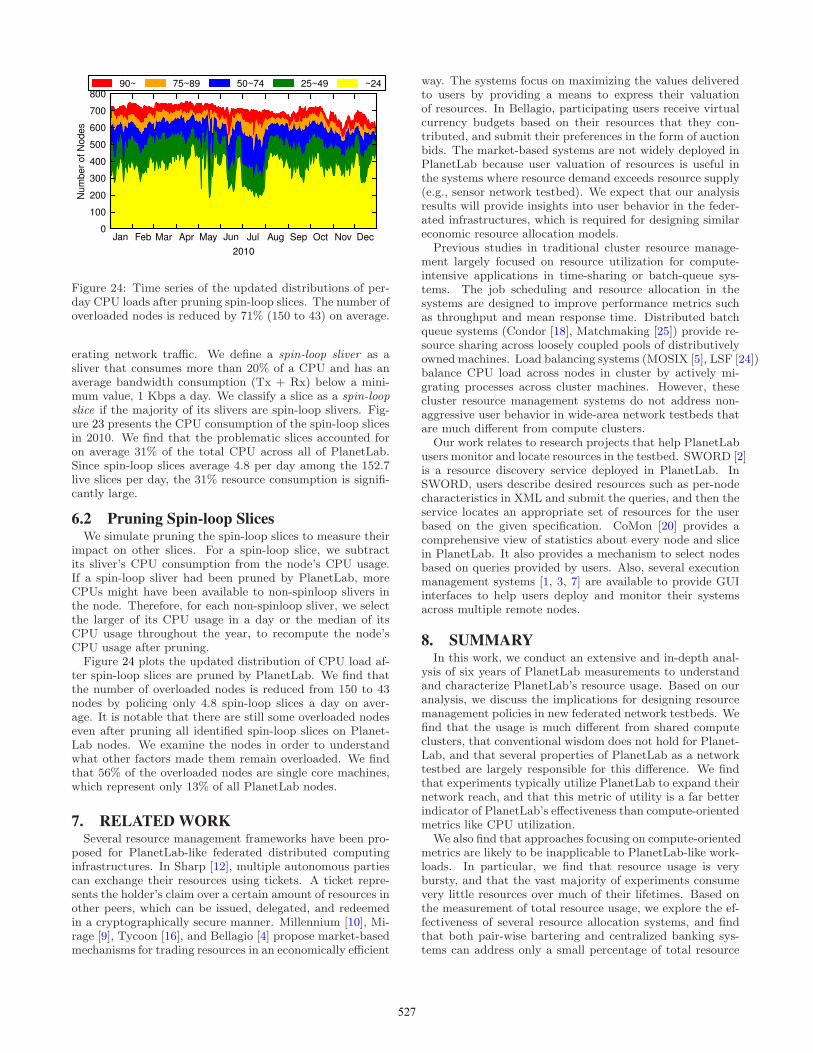
Figure 24: Time series of the updated distributions of per-day CPU loads after pruning spin-loop slices. The number ofoverloaded nodes is reduced by 71% (150 to 43) on average.
erating network traffic. We define a spin-loop sliver as asliver that consumes more than 20% of a CPU and has anaverage bandwidth consumption (Tx + Rx) below a mini-mum value, 1 Kbps a day. We classify a slice as a spin-loopslice if the majority of its slivers are spin-loop slivers. Fig-ure 23 presents the CPU consumption of the spin-loop slicesin 2010. We find that the problematic slices accounted foron average 31% of the total CPU across all of PlanetLab.Since spin-loop slices average 4.8 per day among the 152.7live slices per day, the 31% resource consumption is signifi-cantly large.
6.2 Pruning Spin-loop SlicesWe simulate pruning the spin-loop slices to measure their
impact on other slices. For a spin-loop slice, we subtractits sliver’s CPU consumption from the node’s CPU usage.If a spin-loop sliver had been pruned by PlanetLab, moreCPUs might have been available to non-spinloop slivers inthe node. Therefore, for each non-spinloop sliver, we selectthe larger of its CPU usage in a day or the median of itsCPU usage throughout the year, to recompute the node’sCPU usage after pruning.Figure 24 plots the updated distribution of CPU load af-
ter spin-loop slices are pruned by PlanetLab. We find thatthe number of overloaded nodes is reduced from 150 to 43nodes by policing only 4.8 spin-loop slices a day on aver-age. It is notable that there are still some overloaded nodeseven after pruning all identified spin-loop slices on Planet-Lab nodes. We examine the nodes in order to understandwhat other factors made them remain overloaded. We findthat 56% of the overloaded nodes are single core machines,which represent only 13% of all PlanetLab nodes.
7. RELATEDWORKSeveral resource management frameworks have been pro-
posed for PlanetLab-like federated distributed computinginfrastructures. In Sharp [12], multiple autonomous partiescan exchange their resources using tickets. A ticket repre-sents the holder’s claim over a certain amount of resources inother peers, which can be issued, delegated, and redeemedin a cryptographically secure manner. Millennium [10], Mi-rage [9], Tycoon [16], and Bellagio [4] propose market-basedmechanisms for trading resources in an economically efficient
way. The systems focus on maximizing the values deliveredto users by providing a means to express their valuationof resources. In Bellagio, participating users receive virtualcurrency budgets based on their resources that they con-tributed, and submit their preferences in the form of auctionbids. The market-based systems are not widely deployed inPlanetLab because user valuation of resources is useful inthe systems where resource demand exceeds resource supply(e.g., sensor network testbed). We expect that our analysisresults will provide insights into user behavior in the feder-ated infrastructures, which is required for designing similareconomic resource allocation models.
Previous studies in traditional cluster resource manage-ment largely focused on resource utilization for compute-intensive applications in time-sharing or batch-queue sys-tems. The job scheduling and resource allocation in thesystems are designed to improve performance metrics suchas throughput and mean response time. Distributed batchqueue systems (Condor [18], Matchmaking [25]) provide re-source sharing across loosely coupled pools of distributivelyowned machines. Load balancing systems (MOSIX [5], LSF [24])balance CPU load across nodes in cluster by actively mi-grating processes across cluster machines. However, thesecluster resource management systems do not address non-aggressive user behavior in wide-area network testbeds thatare much different from compute clusters.
Our work relates to research projects that help PlanetLabusers monitor and locate resources in the testbed. SWORD [2]is a resource discovery service deployed in PlanetLab. InSWORD, users describe desired resources such as per-nodecharacteristics in XML and submit the queries, and then theservice locates an appropriate set of resources for the userbased on the given specification. CoMon [20] provides acomprehensive view of statistics about every node and slicein PlanetLab. It also provides a mechanism to select nodesbased on queries provided by users. Also, several executionmanagement systems [1, 3, 7] are available to provide GUIinterfaces to help users deploy and monitor their systemsacross multiple remote nodes.
8. SUMMARYIn this work, we conduct an extensive and in-depth anal-
ysis of six years of PlanetLab measurements to understandand characterize PlanetLab’s resource usage. Based on ouranalysis, we discuss the implications for designing resourcemanagement policies in new federated network testbeds. Wefind that the usage is much different from shared computeclusters, that conventional wisdom does not hold for Planet-Lab, and that several properties of PlanetLab as a networktestbed are largely responsible for this difference. We findthat experiments typically utilize PlanetLab to expand theirnetwork reach, and that this metric of utility is a far betterindicator of PlanetLab’s effectiveness than compute-orientedmetrics like CPU utilization.
We also find that approaches focusing on compute-orientedmetrics are likely to be inapplicable to PlanetLab-like work-loads. In particular, we find that resource usage is verybursty, and that the vast majority of experiments consumevery little resources over much of their lifetimes. Based onthe measurement of total resource usage, we explore the ef-fectiveness of several resource allocation systems, and findthat both pair-wise bartering and centralized banking sys-tems can address only a small percentage of total resource
527
usage. This result implies that resource management sys-tems in federated network testbeds still need policies tofairly allocate available resources for the vast majority ofthe workload. We examine some policies for better resourcediscovery and, node management, and pruning of runawayexperiments.
9. ACKNOWLEDGMENTSWe would like to thank our shepherd, Olaf Maennel, as
well as the anonymous IMC reviewers. We also thank Ky-oungSoo Park, Michael Golightly, and Sunghwan Ihm forseveral beneficial discussions and comments on earlier draftsof this paper. This research was partially supported by theNSF Awards CNS-0615237 and CNS-0916204.
10. REFERENCES[1] J. R. Albrecht, R. Braud, D. Dao, N. Topilski,
C. Tuttle, A. C. Snoeren, and A. Vahdat. Remotecontrol: Distributed application configuration,management, and visualization with Plush. InProceedings of USENIX Large Installation SystemAdministration Conference (LISA), 2007.
[2] J. R. Albrecht, D. L. Oppenheimer, A. Vahdat, andD. A. Patterson. Design and implementation trade-offsfor wide-area resource discovery. ACM Transactionson Internet Technology (TOIT), 8(4), Sept. 2008.
[3] AppManager.http://appmanager.berkeley.intel-research.net/.
[4] A. AuYoung, B. N. Chun, A. C. Snoeren, andA. Vahdat. Resource allocation in federateddistributed computing infrastructures. In Workshopon Operating System and Architectural Support for theOndemand IT Infrastructure (OASIS), 2004.
[5] A. Barak and O. Laadan. The MOSIX multicomputeroperating system for high performance clustercomputing. Future Generation Computer Systems,13(4-5), Mar. 1998.
[6] A. Bavier, M. Bowman, B. Chun, D. Culler, S. Karlin,S. Muir, L. Peterson, T. Roscoe, T. Spalink, andM. Wawrzoniak. Operating system support forplanetary-scale network services. In Proceedings ofUSENIX NSDI, 2004.
[7] J. Cappos, S. Baker, J. Plichta, D. Nyugen,J. Hardies, M. Borgard, J. Johnston, and J. H.Hartman. Stork: Package management for distributedVM environments. In Proceedings of USENIX LargeInstallation System Administration Conference(LISA), 2007.
[8] J. Cappos, I. Beschastnikh, A. Krishnamurthy, andT. Anderson. Seattle: A platform for educationalcloud computing. In Proceedings of ACM TechnicalSymposium on Computer Science Education, 2009.
[9] B. N. Chun, P. Buonadonna, A. AuYoung, C. Ng,D. C. Parkes, J. Shneidman, A. C. Snoeren, andA. Vahdat. Mirage: A microeconomic resourceallocation system for sensornet testbeds. InProceedings of IEEE Workshop on EmbeddedNetworked Sensors, 2005.
[10] B. N. Chun and D. E. Culler. User-centricperformance analysis of market-based cluster batchschedulers. In Proceedings of IEEE InternationalSymposium on Cluster Computing and the Grid, 2002.
[11] M. J. Freedman, E. Freudenthal, and D. Mazieres.Democratizing content publication with Coral. InProceedings of USENIX NSDI, 2004.
[12] Y. Fu, J. S. Chase, B. N. Chun, S. Schwab, andA. Vahdat. SHARP: an architecture for secureresource peering. In Proceedings of ACM SOSP, 2003.
[13] GENI Aggregate Manager API.http://groups.geni.net/geni/wiki/GeniApi/.
[14] GENI: Global Environment for Network Innovations.http://www.geni.net/.
[15] T. Isdal, M. Piatek, A. Krishnamurthy, andT. Anderson. Privacy-preserving P2P data sharingwith OneSwarm. In Proceedings of ACM SIGCOMM,2010.
[16] K. Lai, L. Rasmusson, E. Adar, L. Zhang, and B. A.Huberman. Tycoon: An implementation of adistributed, market-based resource allocation system.Multiagent and Grid Systems, 1(3), Aug. 2005.
[17] S.-J. Lee, P. Sharma, S. Banerjee, S. Basu, andR. Fonseca. Measuring bandwidth between PlanetLabnodes. In Proceedings of Passive and ActiveMeasurement Conference (PAM), 2005.
[18] M. J. Litzkow, M. Livny, and M. W. Mutka. Condor -a hunter of idle workstations. In Proceedings of IEEEInternational Conference on Distributed ComputingSystems (ICDCS), 1988.
[19] D. Oppenheimer, B. Chun, D. Patterson, A. C.Snoeren, and A. Vahdat. Service placement in ashared wide-area platform. In Proceedings of USENIXAnnual Technical Conference, 2006.
[20] K. Park and V. S. Pai. CoMon: A mostly-scalablemonitoring system for PlanetLab. ACM SIGOPSOperating Systems Review, 40(1), Jan. 2006.
[21] K. Park and V. S. Pai. Scale and performance in theCoBlitz large-file distribution service. In Proceedingsof USENIX NSDI, 2006.
[22] L. Peterson, A. Bavier, M. E. Fiuczynski, and S. Muir.Experiences building PlanetLab. In Proceedings ofUSENIX OSDI, 2006.
[23] PlanetLab. http://www.planet-lab.org/.
[24] Platform Computing Load Sharing Facility (LSF).http://www.platform.com/.
[25] R. Raman, M. Livny, and M. H. Solomon.Matchmaking: Distributed resource management forhigh throughput computing. In Proceedings of IEEEInternational Symposium on High PerformanceDistributed Computing (HPDC), 1998.
[26] SETI@home. http://setiathome.berkeley.edu/.
[27] Sirius: A Calendar Service for PlanetLab.https://snowball.cs.uga.edu/~dkl/pslogin.php/.
[28] SliceStat: Slice monitoring sensor on PlanetLab.http://codeen.cs.princeton.edu/slicestat/.
[29] N. Spring, L. Peterson, A. Bavier, and V. Pai. UsingPlanetLab for network research: Myths, realities, andbest practices. ACM SIGOPS Operating SystemsReview, 40(1), Jan. 2006.
[30] L. Wang, K. Park, R. Pang, V. S. Pai, andL. Peterson. Reliability and security in the CoDeeNcontent distribution network. In Proceedings ofUSENIX Annual Technical Conference, 2004.
528
Summary Review Documentation for
“Understanding and Characterizing PlanetLab Resource Usage for Federated Network Testbeds”
Authors: W. Kim, A. Roopakalu, K. Li, V. Pai
Reviewer #1 Strengths: This is a very unique, extensive, and interesting dataset. PlanetLab as a platform has been a tremendous boost to networking/measurement research and a retrospective measurement study of usage there is very relevant. The problem of how a federated test bed will be used is important and timely given the interest in deploying more of these. Weaknesses: I do not see any strong weaknesses in terms of techniques/results, other than the description of some of the results can be improved and I would like to see some more in-depth analysis of a few more interesting aspects of the problem instead of too many figures making the same, somewhat obvious observations. Comments to Authors: In the introduction, I would tone down some of the claims about “conventional wisdom”/”tragedy of commons” etc, because it seems fairly obvious that the workloads for PlanetLab are very different from traditional compute clusters! I found Section 3.2 very confusing. Maybe this is a terminology/writing problem – you have “slice” but really you are doing a “sliver”/node level analysis here. The writing goes back and forth and its confusing me a bit. Also, what is the “average” being computed over - across time for each sliver or across nodes? Would it also be useful to just look at average over “active periods” instead of the overall average? In Section 3.2, how you generate this visualization is very confusing. I agree with the observation made in Section 3.4, but I feel that you are overselling the analysis by saying that this flies in the face of conventional wisdom etc. When you calculate the timeseries of bank/barter/slop etc. – are these based on “instantaneous” measurements or over a sliding window or cumulative over history? Fig 14 seems to suggest that most sites are incredibly altruistic – i.e. that they have a huge balance that they have not claimed. I wonder if you can correlate this with papers/projects that the sites have generated that use PlanetLab to verify. In Section 5.2, I found your choice “memory” imbalance very puzzling. I imagine that most PlanetLab workloads are not really memory bound, so it’s not terribly surprising that there is a memory imbalance. I would much rather see the corresponding result for network resources or CPU.
I agree with the overall notion of dynamic experiment placement; an obvious concern is w.r.t repeatability/correctness when you end up choosing different nodes over different runs of the same experiment/measurement. E.g., you could see network latency/congestion effects from different nodes being different. In fact, I am guessing this could be one motivation for manually choosing nodes. Could you comment on this, or try a dynamic-but-stable strategy, where the system also tries to find sites that overlap with the prior choice? Also, I have heard and seen anecdotal evidence that people manually choose nodes because many nodes are inherently “unreliable”. Can you comment on this? You have an amazing dataset! I really hope that this dataset will be made public. I would try to cut some of the figures that are making more obvious points to try and fit in other aspect. Here are some potential directions to increase the depth of analysis that I could think of: 1. I wonder if you could characterize the slices into common buckets of “operating models”. The goal is that if we have a few standard “configuration modes” and an interface for choosing these, then researchers could choose from these typical use cases for an easy to use dynamic resource allocation strategy. 2. There are two dimensions to your analysis space: Space (nodes) and Time. Would it help to try different ways of combining these — you have chosen specific points to e.g., average over time or max over time of sum over nodes etc. For example, it could be useful to look max over time max over nodes? I.e., when a slice is active does it hog a particular node? 3. Are there “runaway” experiments or slices that people have forgotten to turn off long after a deadline?
Reviewer #2 Strengths: PlanetLab is widely used. For every researcher working on PlanetLab there is a need to know what bias the system introduces. The paper looks at CPU and memory workloads. Weaknesses: The study is more a sophisticated sysadmin report for the PlanetLab central administration, than a measurement paper for the research community.
529
Comments to Authors: In the current form the paper is written more from a system administration perspective and not for a user point of view. The authors study mainly CPU-days and Memory-days of users using the system. The authors warn several times of measurement errors that could be created by an overloaded system. For example, on page 10, the authors say: “This latency may degrade responsiveness of network services or add measurement noise to running experiments”. Admittedly, it is a very difficult task to estimate any boundaries on network performance errors that might be created due to an overloaded system, but it would have been nice to see some form of quantification. It is certainly up to the experimenter to critically review the measurement results and understand the bias introduced by the system, but for a research paper it would have been nice to give at least an anecdotal flavor for what the upper bounds might be.
Reviewer #3 Strengths: Very cool data set, and an interesting topic. Clearly future testbeds can benefit from improved understanding of how PlanetLab has been put to use and working out over the past years.
Weaknesses: I find the authors discuss basic findings in too much depth, from too many angles, for too long, with too many plots, while I have a hard time following some of the more interesting analyses because of their resulting terseness.
Comments to Authors: My main problem with this paper is that I find some elementary findings eating too much space at the cost of interesting things that ended up overly terse. For example, one can sum up virtually all of Section 3 by the 80/20 rule - a small number of heavy users, along all dimensions, while everything else is intermittent. Do you really need 4 pages for that? Most of the paper is similarly one-dimensional.
When it matters, I found things brief and superficial. Your analysis of barter and banking systems for resource management, while interesting, feels quite simplistic. I feel that instead of adding a plot for virtually every paragraph of text, the paper would be a more productive experience for the reader if you had left out a good handful of plots and instead integrated analyses that go a bit beyond your dataset.
I disagree with your suggested expectation of a Tragedy of the Commons in PlanetLab. That model simply does not apply. General lack of resource-hogging is very much what I expected to see, simply from PlanetLab’s intended purpose.
It would really help if instead of the overlong Sections 3 and 4 you put in a little more background on PlanetLab. If it is clear from the outset that experimenters pick nodes manually, you are eliminating a lot of the guesswork.
I find Figures 11 and 12 unsurprising. It seems unreasonable to expect a single site to contribute equal amounts of resources as it consumes in the entire remaining network, so clearly the slop fraction is highest. Surely you could come up with better banking
schemes that factor this imbalance into the budget earning/spending calculation?
I do not understand your definition of bank. A provides resources in its nodes, and consumes resources elsewhere. Why is “bank” the minimum of the two, and not the difference? Any normal balance can be positive or negative. Did you just pick really unfortunate terminology?
I don’t understand Figure 13. So PlanetLab’s available CPU capacity was around 1,800 CPU-days per day, throughout. You also have the CPU consumptions accumulating at each node over the course of a month. I see no explanation on how the limits you mention would result in the curves you show. Is this simulation, as you are mentioning it in the next paragraph? I find the rest of that section too compressed to follow.
In Section 6.2 you refer back to Section 3, stating that you discussed how experiments follow the guideline of testing in-the-small and expanding gradually for d-day. You do not actually show that; you say it is true for one slice doing IPOP experiments (in Sec. 3.3).
Figure 23 is not surprising. If a program spins instead of blocking on I/O or otherwise behaving “nicely”, then obviously its CPU contribution skyrockets.
It would have been nice to see some orthogonal analyses. For example, do people signing up actually run experiments? How often do they succeed in deploying something long-running? How often was that actually the goal? PlanetLab requires experimental descriptions for the studies it hosts. Does this fit with high CPU consumption at all? I.e., do they suggest obvious bugs, or are they openly declared CPU crunching?
Reviewer #4 Strengths: Fantastic dataset; thorough analysis of resource usage and slice classes; resource management in federated distributed testbeds is an important and persistent problem. Weaknesses: Nothing obvious.
Comments to Authors: This is a great piece with many interesting findings on the use of PlanetLab and the effectiveness of policies and potential algorithms. There are a few issues with the presentation here and there, but all of them could be addressed in a camera-ready version.
It is surprising not to see references to all the work done in cluster-based and grid systems in you related work section (and only one in your overall reference list); particularly given your comments about how this is different from what you see in PlanetLab. A quick web search points to Hart’s paper on measuring TeraGrid, which would seem appropriate even if to say how they were different. What is the length of the measurement period (less than 5’, I know, but what). Is 0.1% CPU utilization a magic number? Seems alright to me but I tend to dislike these sort of constants.
530
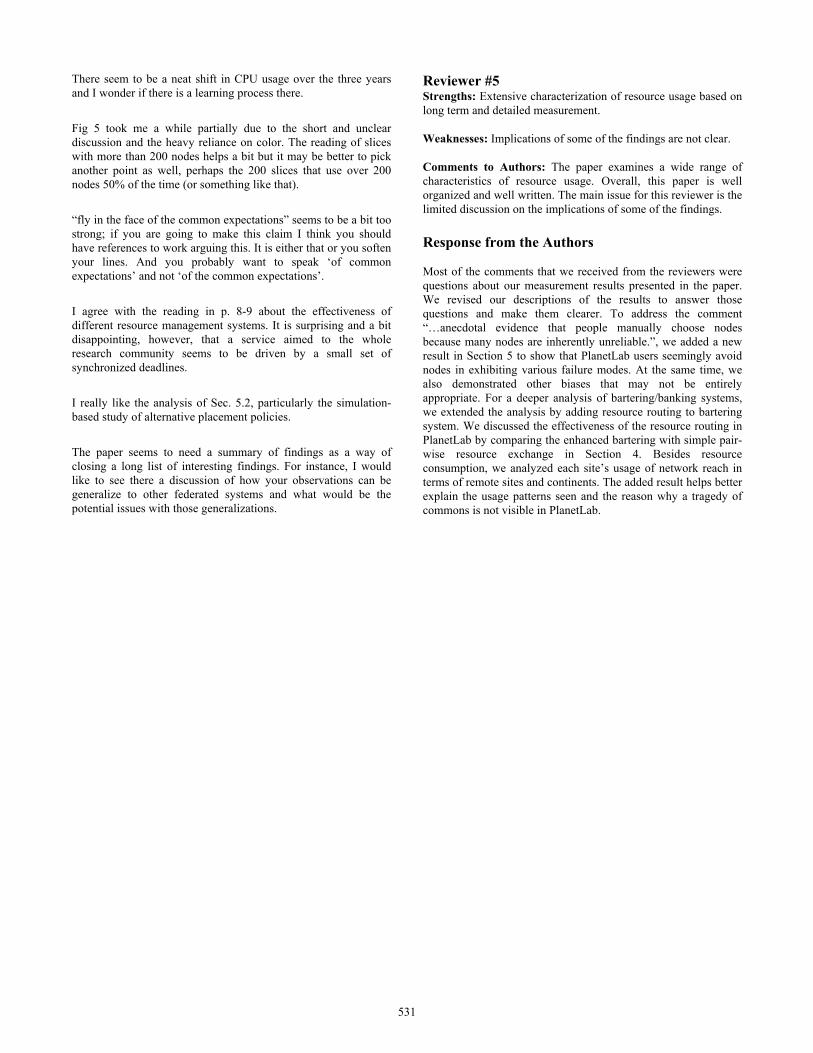
There seem to be a neat shift in CPU usage over the three years and I wonder if there is a learning process there.
Fig 5 took me a while partially due to the short and unclear discussion and the heavy reliance on color. The reading of slices with more than 200 nodes helps a bit but it may be better to pick another point as well, perhaps the 200 slices that use over 200 nodes 50% of the time (or something like that).
“fly in the face of the common expectations” seems to be a bit too strong; if you are going to make this claim I think you should have references to work arguing this. It is either that or you soften your lines. And you probably want to speak ‘of common expectations’ and not ‘of the common expectations’.
I agree with the reading in p. 8-9 about the effectiveness of different resource management systems. It is surprising and a bit disappointing, however, that a service aimed to the whole research community seems to be driven by a small set of synchronized deadlines.
I really like the analysis of Sec. 5.2, particularly the simulation-based study of alternative placement policies.
The paper seems to need a summary of findings as a way of closing a long list of interesting findings. For instance, I would like to see there a discussion of how your observations can be generalize to other federated systems and what would be the potential issues with those generalizations.
Reviewer #5 Strengths: Extensive characterization of resource usage based on long term and detailed measurement. Weaknesses: Implications of some of the findings are not clear. Comments to Authors: The paper examines a wide range of characteristics of resource usage. Overall, this paper is well organized and well written. The main issue for this reviewer is the limited discussion on the implications of some of the findings.
Response from the Authors Most of the comments that we received from the reviewers were questions about our measurement results presented in the paper. We revised our descriptions of the results to answer those questions and make them clearer. To address the comment “…anecdotal evidence that people manually choose nodes because many nodes are inherently unreliable.”, we added a new result in Section 5 to show that PlanetLab users seemingly avoid nodes in exhibiting various failure modes. At the same time, we also demonstrated other biases that may not be entirely appropriate. For a deeper analysis of bartering/banking systems, we extended the analysis by adding resource routing to bartering system. We discussed the effectiveness of the resource routing in PlanetLab by comparing the enhanced bartering with simple pair-wise resource exchange in Section 4. Besides resource consumption, we analyzed each site’s usage of network reach in terms of remote sites and continents. The added result helps better explain the usage patterns seen and the reason why a tragedy of commons is not visible in PlanetLab.
531