Embed Size (px)
Citation preview
Understanding Membrane Fouling atHigh Organic Loading Rates in theSubmerged Membrane BioreactorTreating Municipal Wastewater
R. Shane Trussell, P.E., Nam Jung Jang, Rion Merlo,Slawomir Hermanowicz, and David Jenkins
Department of Civil and Environmental EngineeringUniversity of California, Berkeley
March 8, 2005
Outline
• Introduction• Rationale• Materials and Methods• Results• Conclusions• Acknowledgements
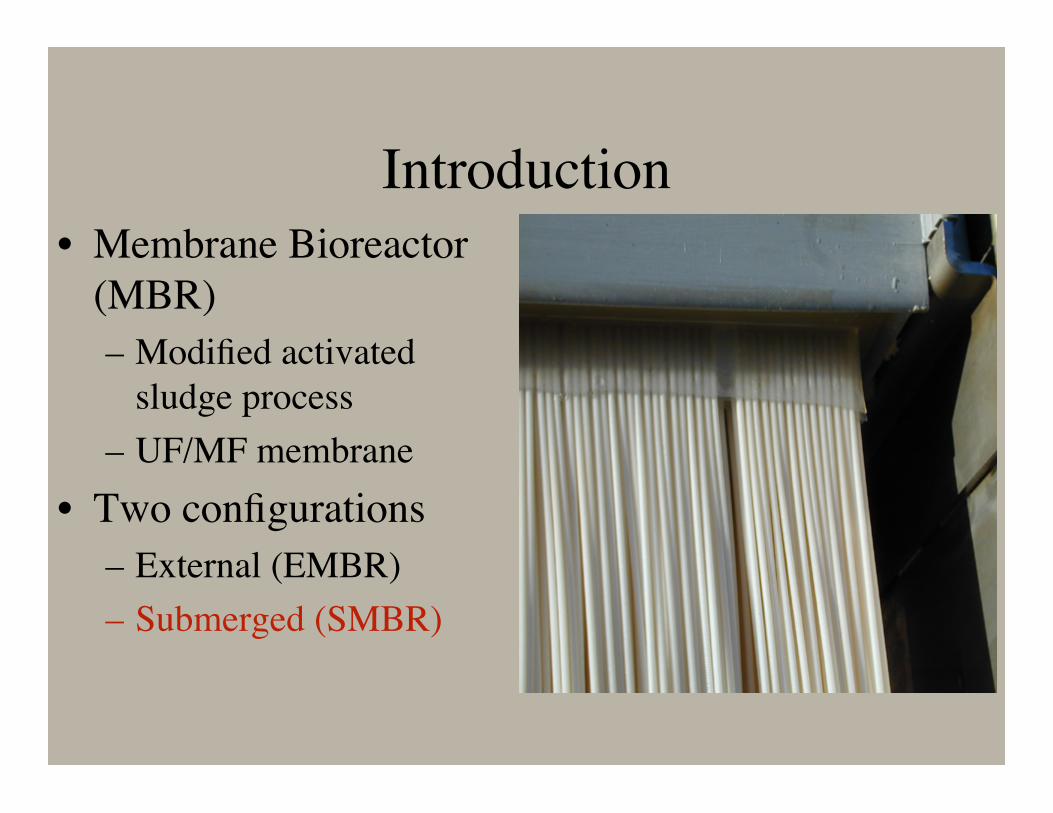
Introduction• Membrane Bioreactor
(MBR)– Modified activated
sludge process– UF/MF membrane
• Two configurations– External (EMBR)– Submerged (SMBR)
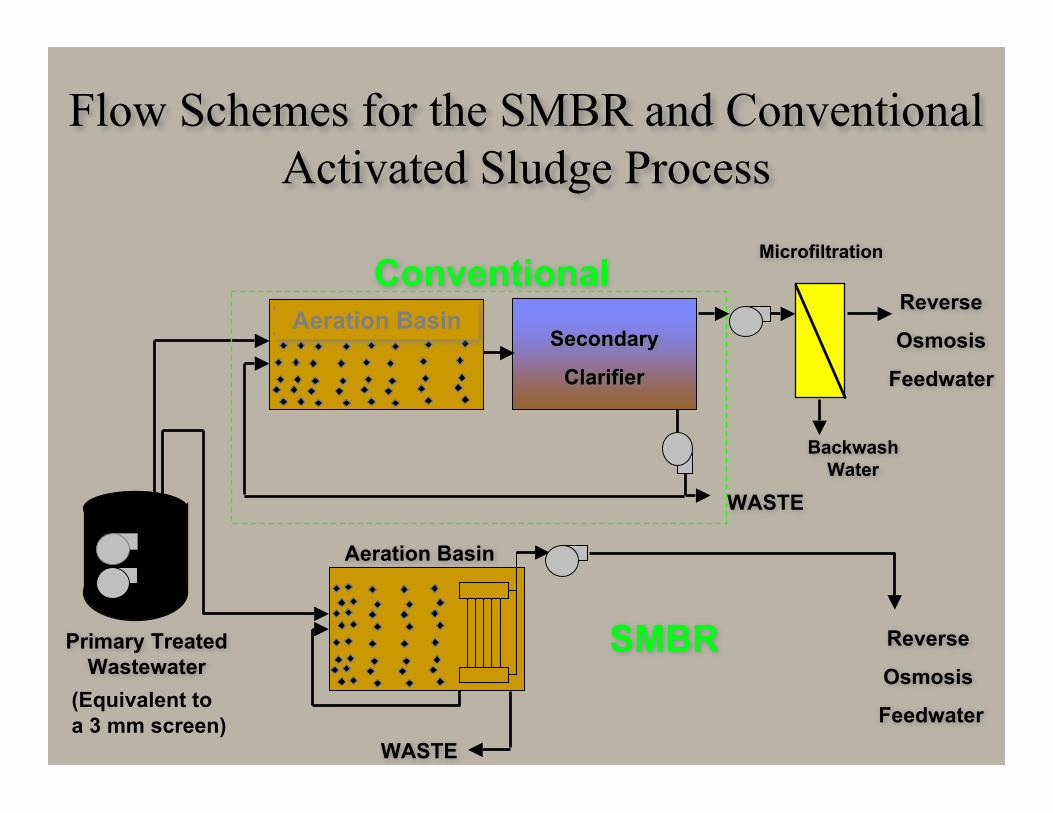
Primary TreatedWastewater
BackwashWater
Secondary
Clarifier
WASTE
Reverse
Osmosis
Feedwater
MicrofiltrationConventional
Aeration Basin
WASTE
Reverse
Osmosis
Feedwater
SMBR
Aeration Basin
(Equivalent toa 3 mm screen)
Flow Schemes for the SMBR and ConventionalActivated Sludge Process
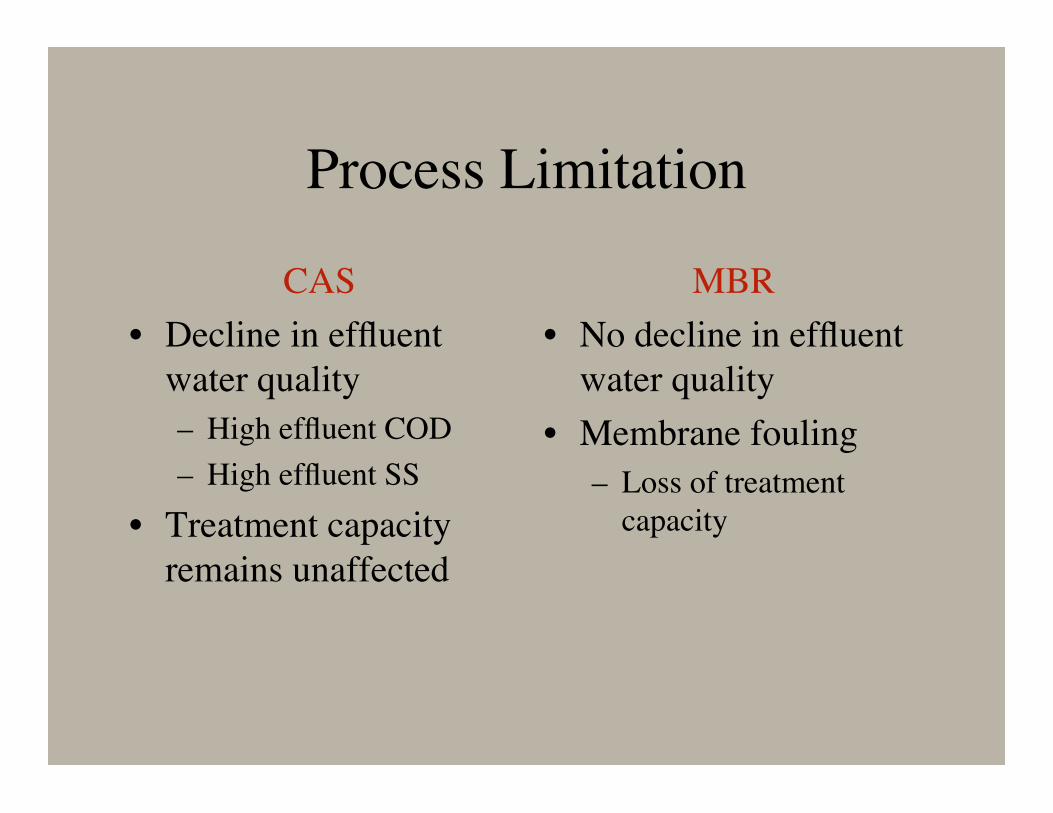
Process Limitation
CAS• Decline in effluent
water quality– High effluent COD– High effluent SS
• Treatment capacityremains unaffected
MBR• No decline in effluent
water quality• Membrane fouling
– Loss of treatmentcapacity
Outline
• Introduction• Rationale• Materials and Methods• Results• Conclusions• Acknowledgements
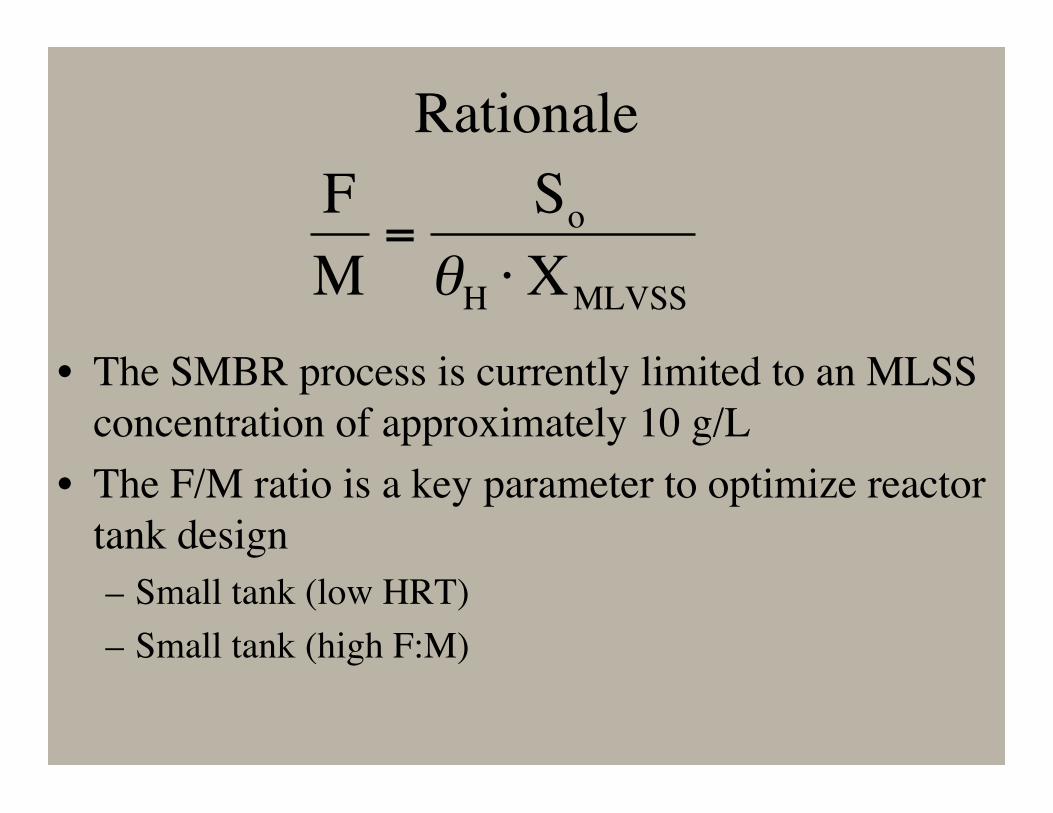
Rationale
• The SMBR process is currently limited to an MLSSconcentration of approximately 10 g/L
• The F/M ratio is a key parameter to optimize reactortank design– Small tank (low HRT)– Small tank (high F:M)
!
F
M=
So
"H#X
MLVSS
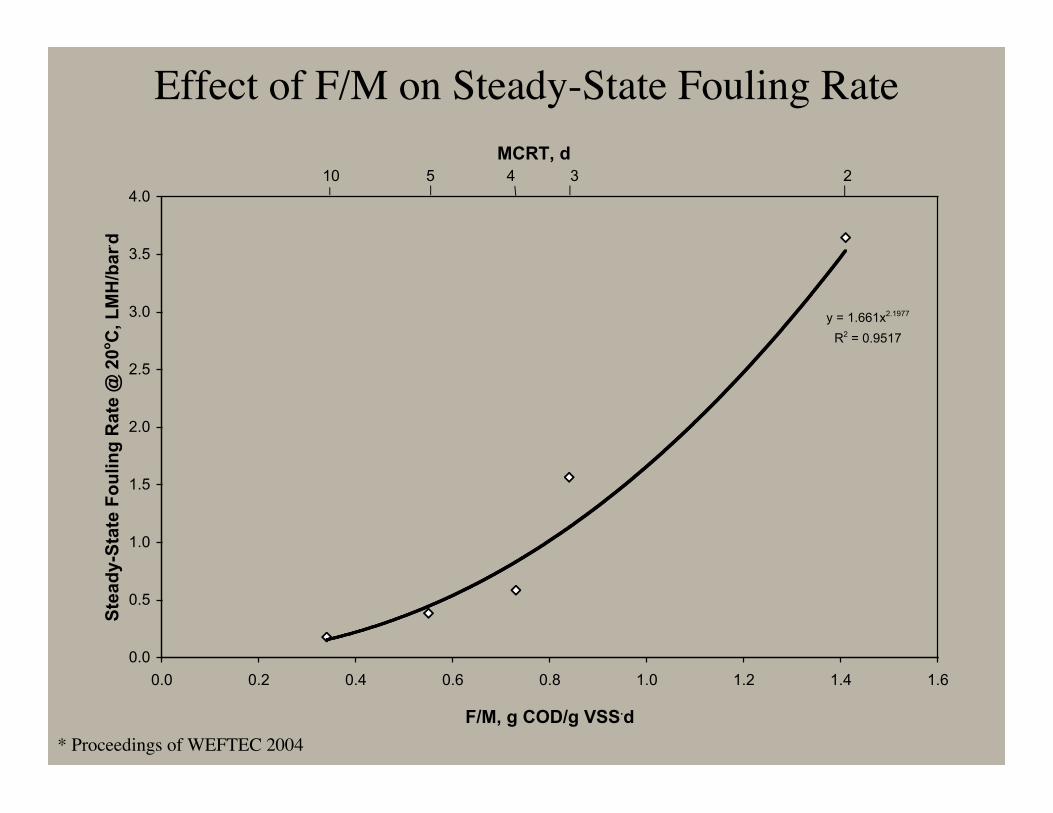
Effect of F/M on Steady-State Fouling Rate
y = 1.661x2.1977
R2 = 0.9517
0.0
0.5
1.0
1.5
2.0
2.5
3.0
3.5
4.0
0.0 0.2 0.4 0.6 0.8 1.0 1.2 1.4 1.6
F/M, g COD/g VSS.d
Ste
ad
y-S
tate
Fo
ulin
g R
ate
@ 2
0oC
, L
MH
/bar. d
3 210 5 4
MCRT, d
* Proceedings of WEFTEC 2004
Outline
• Introduction• Rationale• Materials and Methods• Results• Conclusions• Acknowledgements
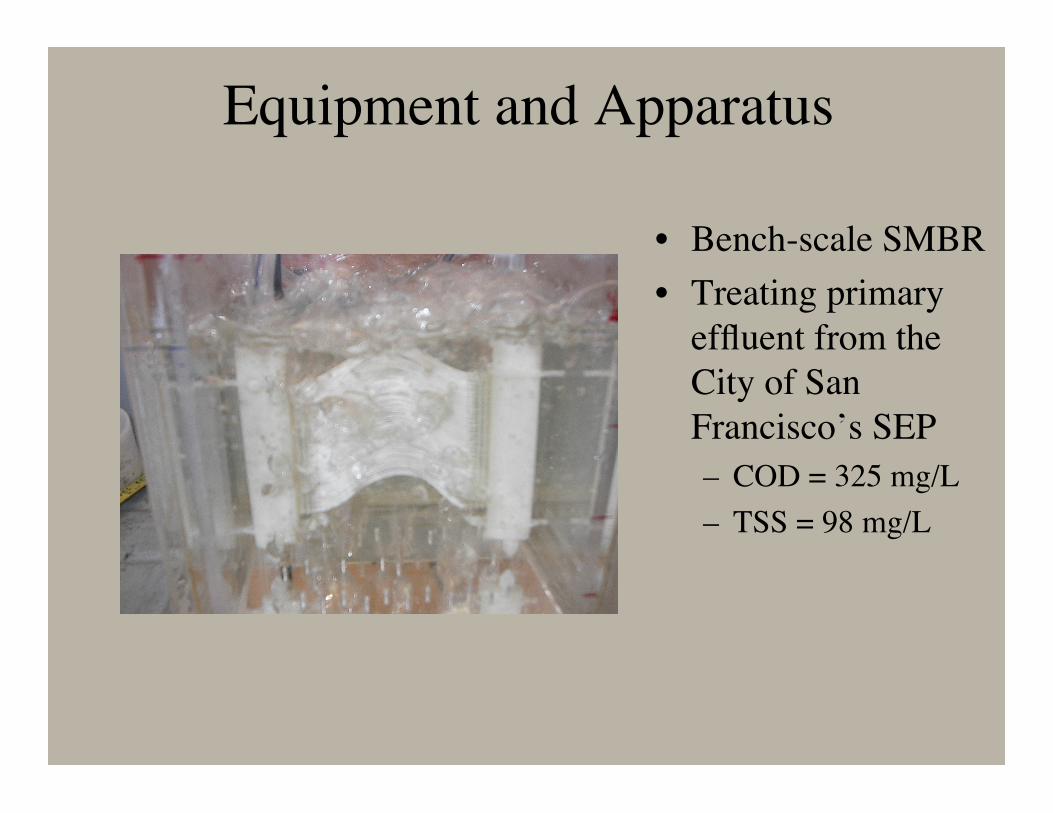
Equipment and Apparatus
• Bench-scale SMBR• Treating primary
effluent from theCity of SanFrancisco’s SEP– COD = 325 mg/L– TSS = 98 mg/L
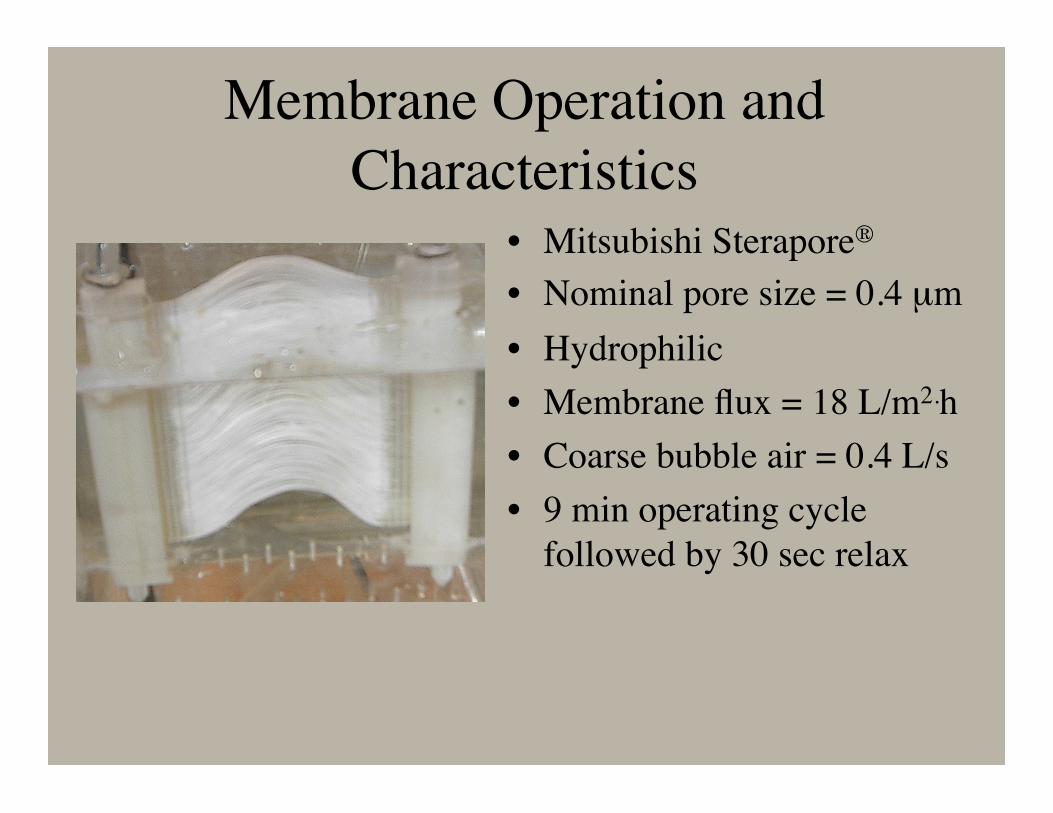
Membrane Operation andCharacteristics
• Mitsubishi Sterapore®
• Nominal pore size = 0.4 µm• Hydrophilic• Membrane flux = 18 L/m2.h• Coarse bubble air = 0.4 L/s• 9 min operating cycle
followed by 30 sec relax
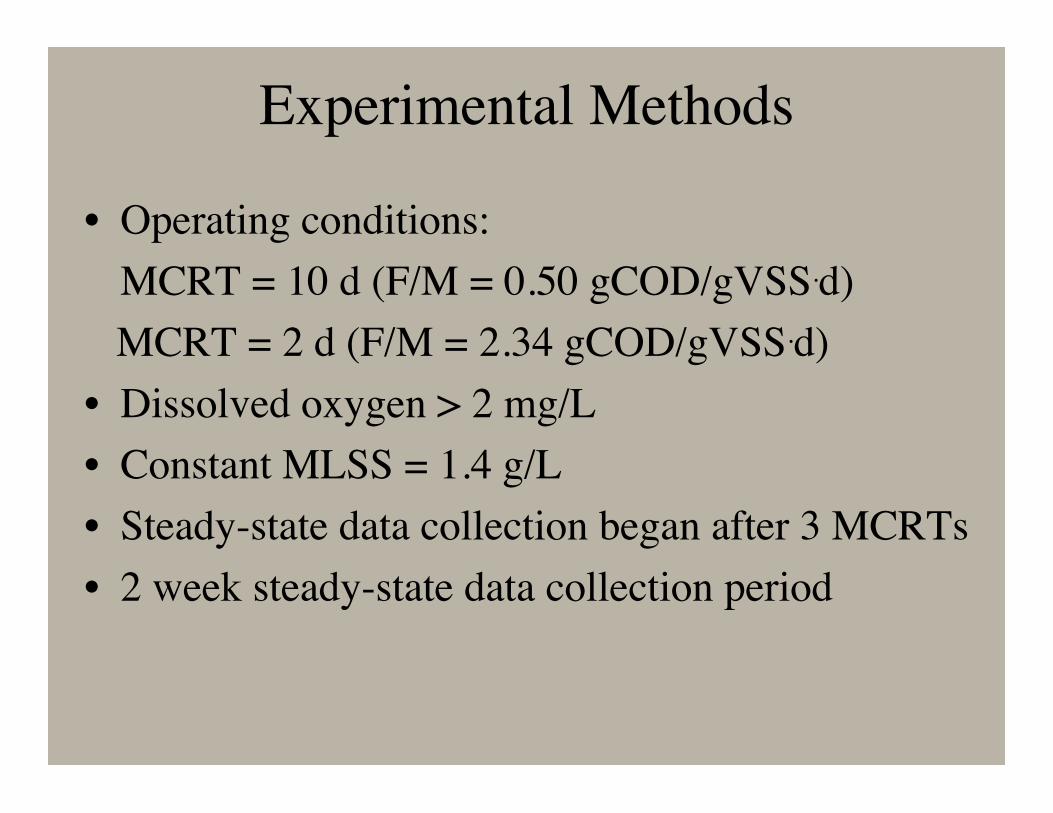
Experimental Methods
• Operating conditions:MCRT = 10 d (F/M = 0.50 gCOD/gVSS.d)
MCRT = 2 d (F/M = 2.34 gCOD/gVSS.d)• Dissolved oxygen > 2 mg/L• Constant MLSS = 1.4 g/L• Steady-state data collection began after 3 MCRTs• 2 week steady-state data collection period
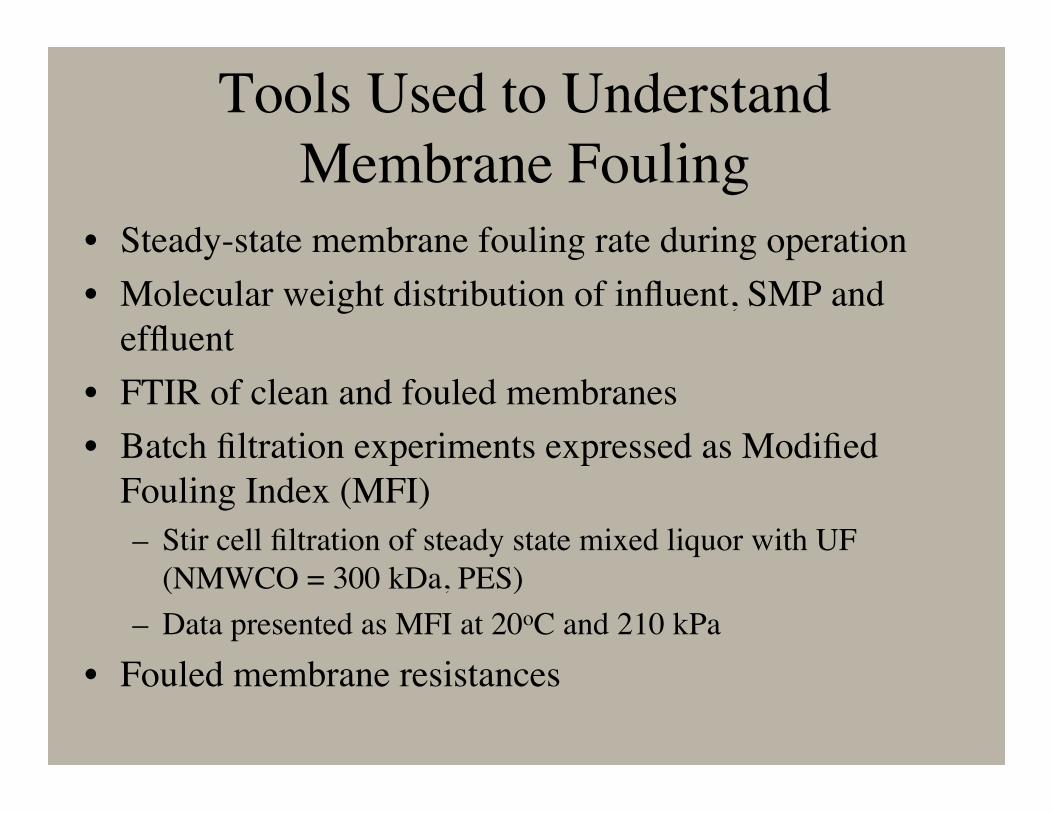
Tools Used to UnderstandMembrane Fouling
• Steady-state membrane fouling rate during operation• Molecular weight distribution of influent, SMP and
effluent• FTIR of clean and fouled membranes• Batch filtration experiments expressed as Modified
Fouling Index (MFI)– Stir cell filtration of steady state mixed liquor with UF
(NMWCO = 300 kDa, PES)– Data presented as MFI at 20oC and 210 kPa
• Fouled membrane resistances
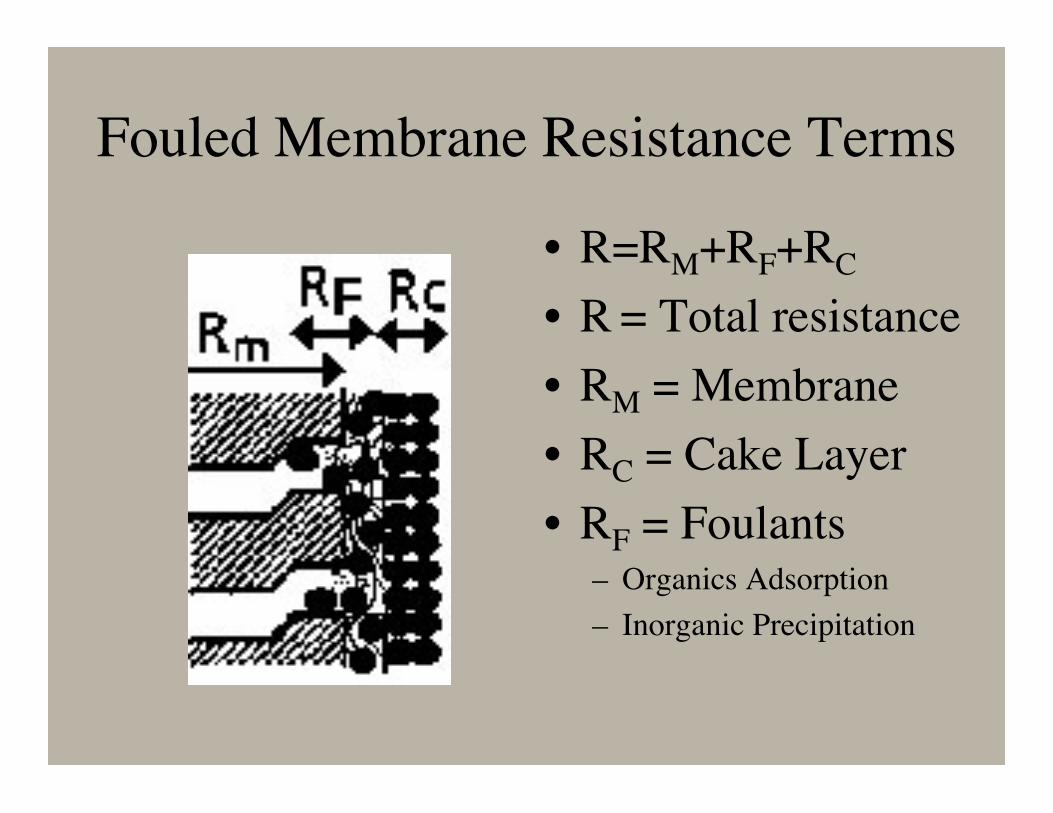
Fouled Membrane Resistance Terms
• R=RM+RF+RC
• R = Total resistance• RM = Membrane• RC = Cake Layer• RF = Foulants
– Organics Adsorption– Inorganic Precipitation
Outline
• Introduction• Rationale• Materials and Methods• Results• Conclusions• Acknowledgements

Membrane Performance at 10-d MCRT(F/M=0.50 gCOD/gVSS.d)
0
5
10
15
20
25
30
35
40
0 10 20 30 40 50 60 70 80
Days of Operation
Flu
x,
LM
H
0
100
200
300
400
500
600
Sp
ec
ific
Flu
x @
20
oC
, L
MH
/ba
r
Flux Specific Flux
Chemical Cleaning
Start up 66 Days at 10-d MCRT
(F/M = 0.50 gCOD/gVSS.d)
Steady-state fouling rate
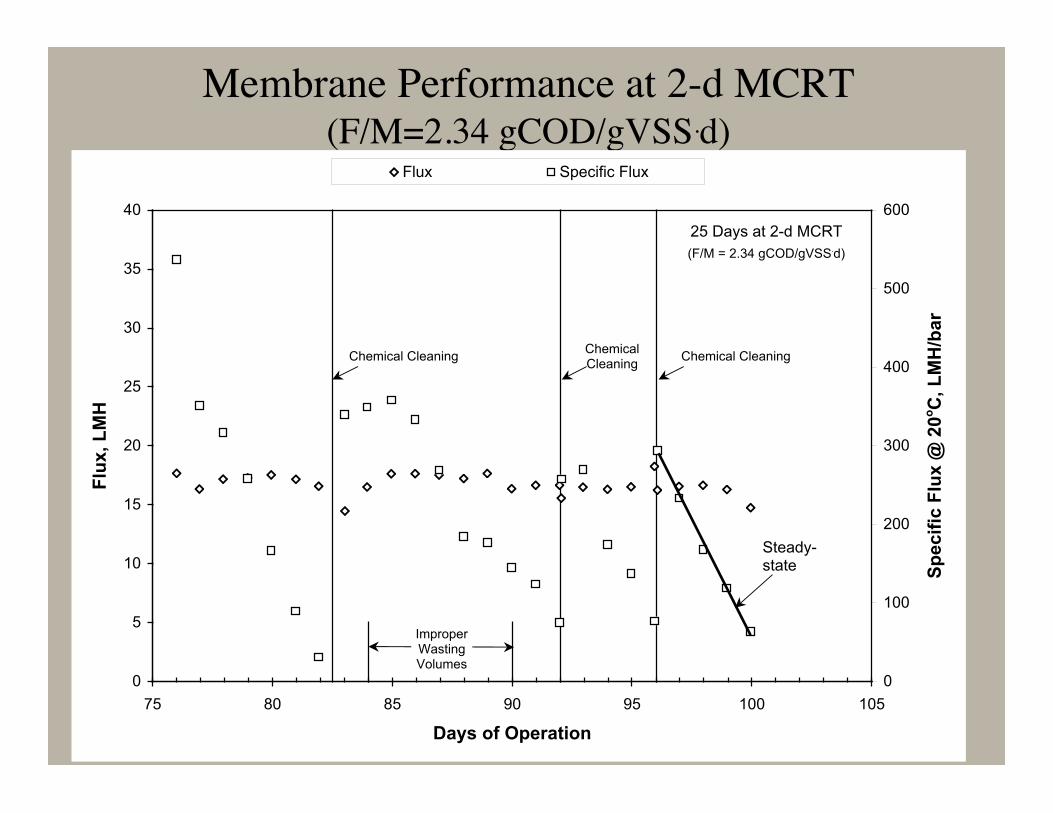
Membrane Performance at 2-d MCRT(F/M=2.34 gCOD/gVSS.d)
0
5
10
15
20
25
30
35
40
75 80 85 90 95 100 105
Days of Operation
Flu
x, L
MH
0
100
200
300
400
500
600
Sp
ecif
ic F
lux @
20
oC
, L
MH
/bar
Flux Specific Flux
ImproperWastingVolumes
Chemical Cleaning Chemical CleaningChemicalCleaning
25 Days at 2-d MCRT
(F/M = 2.34 gCOD/gVSS.d)
Steady-state
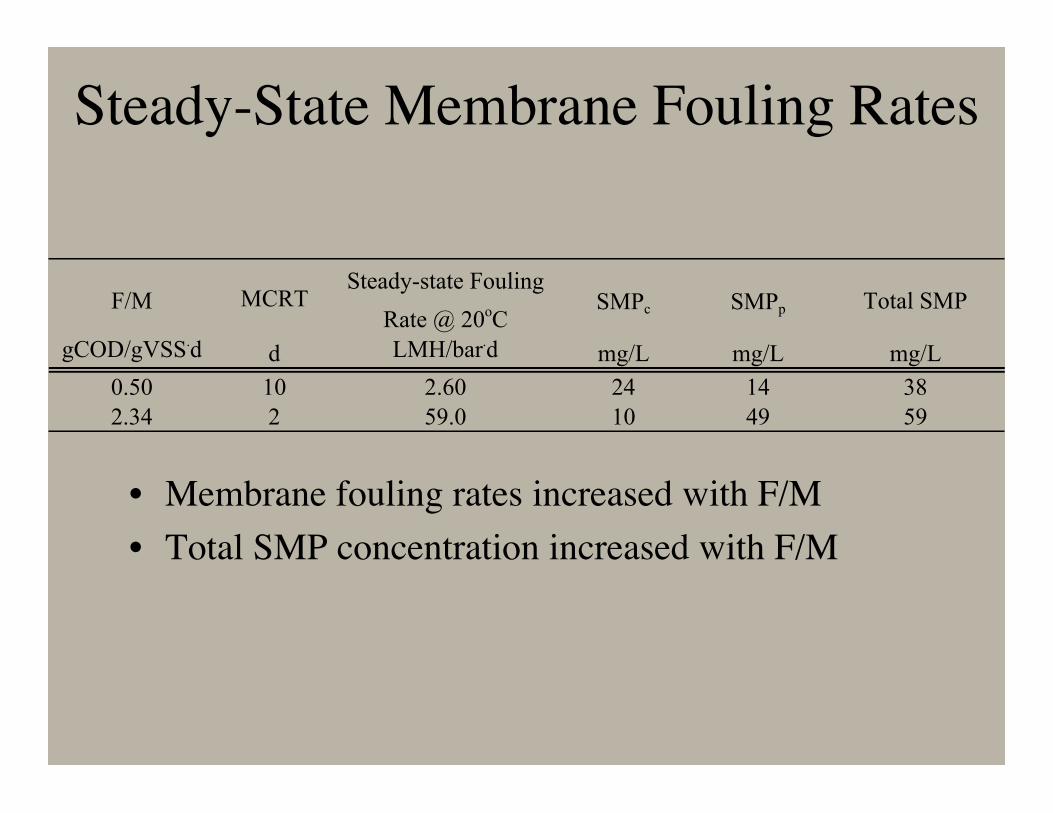
Steady-State Membrane Fouling Rates
• Membrane fouling rates increased with F/M• Total SMP concentration increased with F/M
F/M MCRTSteady-state Fouling
Rate @ 20oC
SMPc SMPp Total SMP
gCOD/gVSS.d d LMH/bar
.d mg/L mg/L mg/L
0.50 10 2.60 24 14 38
2.34 2 59.0 10 49 59
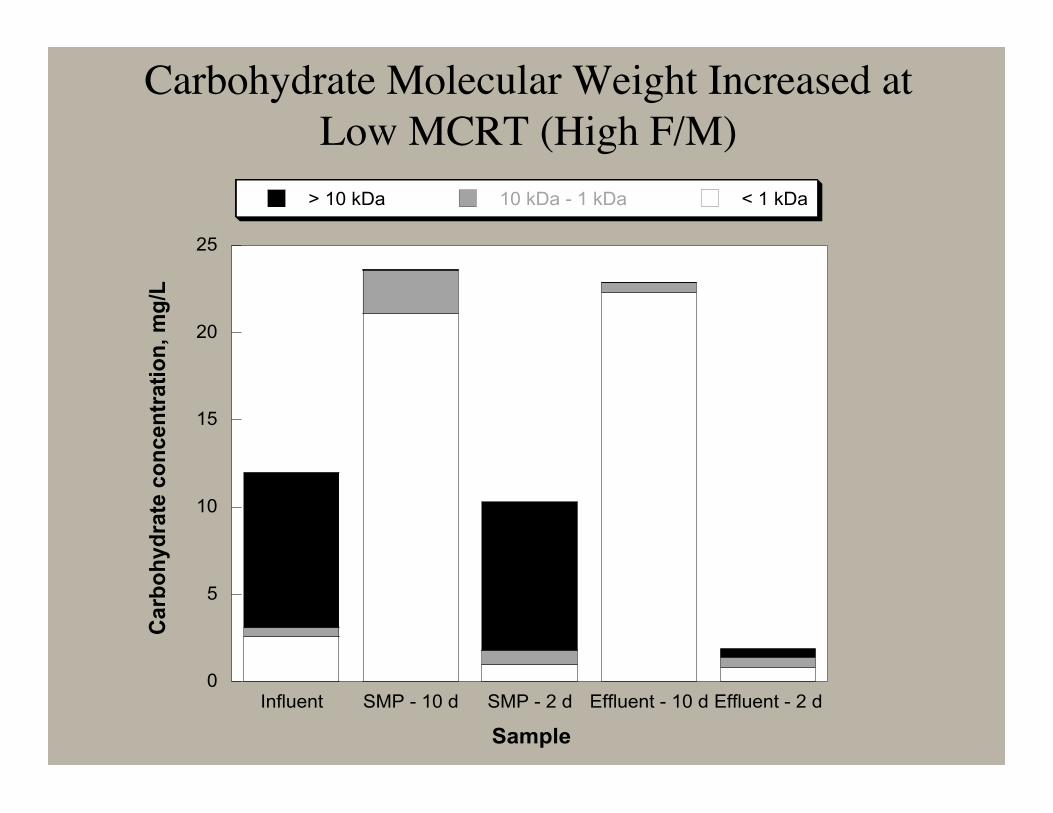
Carbohydrate Molecular Weight Increased atLow MCRT (High F/M)
0
5
10
15
20
25
Influent SMP - 10 d SMP - 2 d Effluent - 10 d Effluent - 2 d
> 10 kDa 10 kDa - 1 kDa < 1 kDa
Carb
oh
yd
rate
co
ncen
trati
on
, m
g/L
Sample
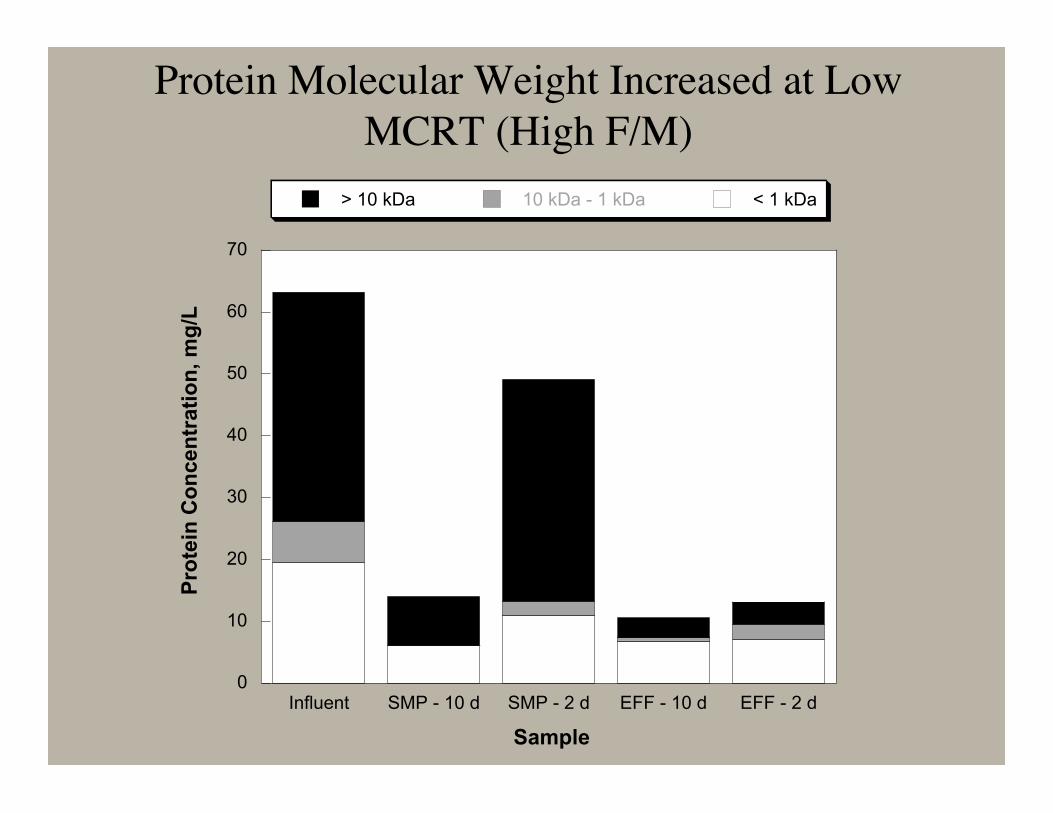
Protein Molecular Weight Increased at LowMCRT (High F/M)
0
10
20
30
40
50
60
70
Influent SMP - 10 d SMP - 2 d EFF - 10 d EFF - 2 d
> 10 kDa 10 kDa - 1 kDa < 1 kDaP
rote
in C
on
cen
trati
on
, m
g/L
Sample
10
100
20
40
60
80
4000 650100020003000
%T
Wavenumber[cm-1]
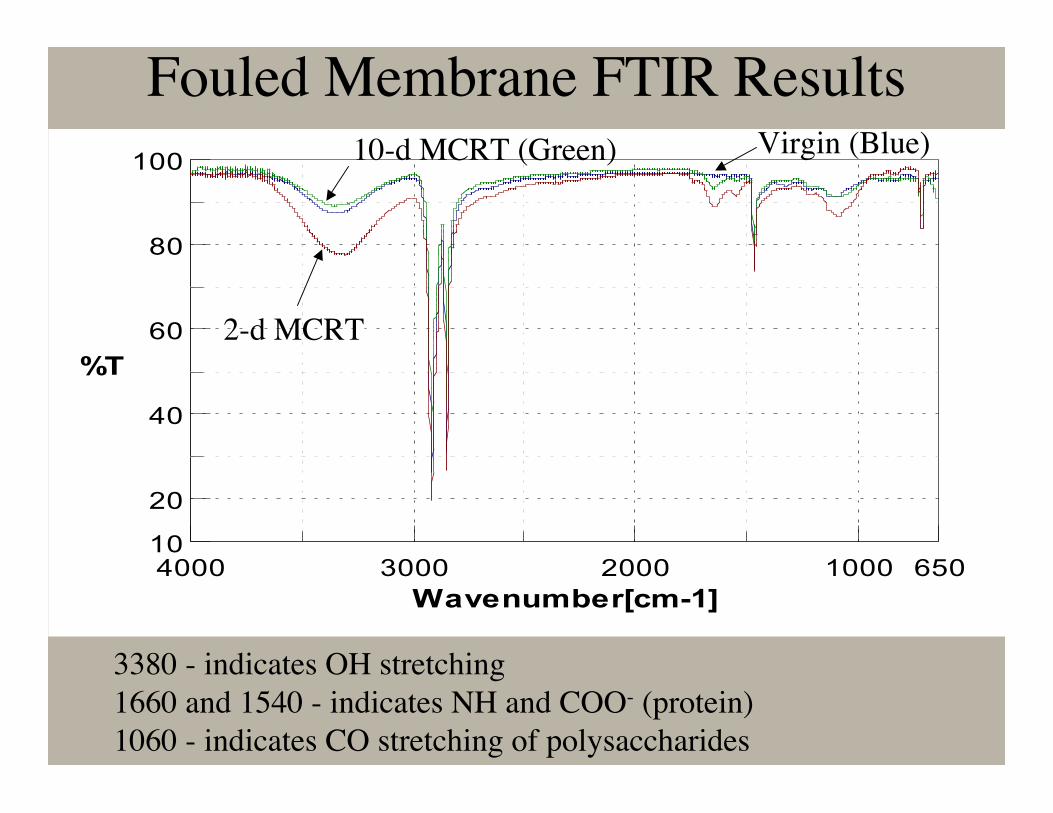
Fouled Membrane FTIR Results
2-d MCRT
10-d MCRT (Green) Virgin (Blue)
3380 - indicates OH stretching1660 and 1540 - indicates NH and COO- (protein)1060 - indicates CO stretching of polysaccharides
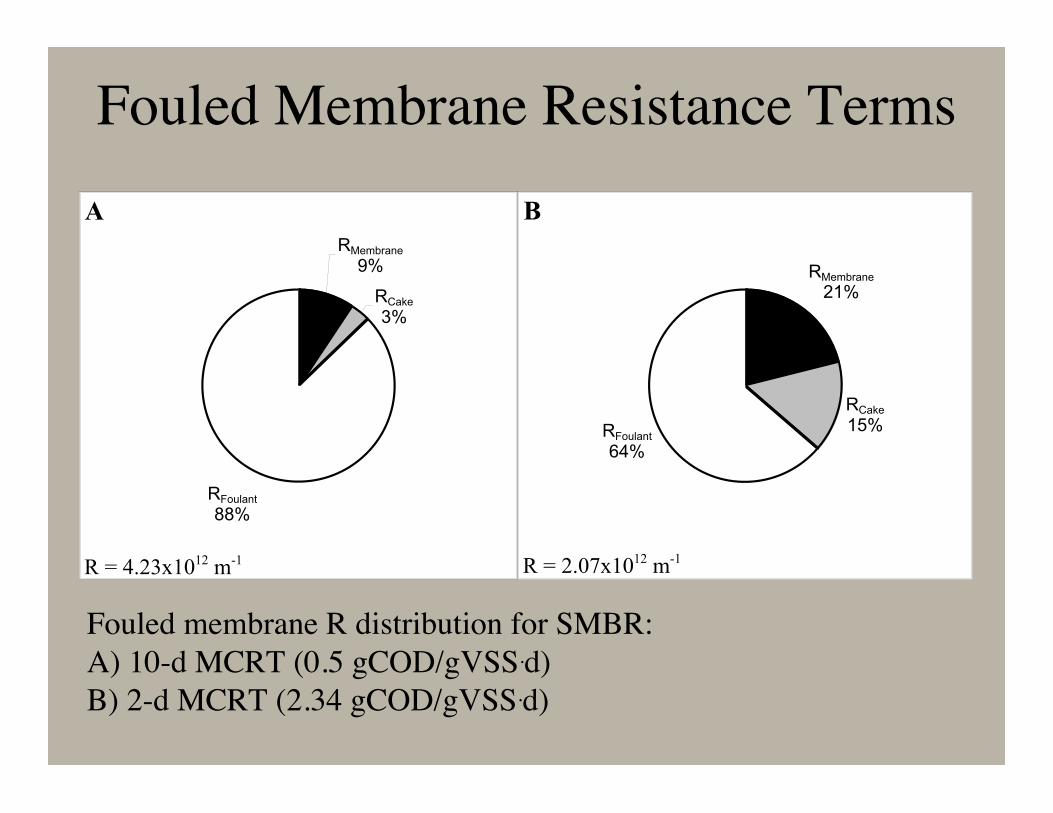
Fouled Membrane Resistance Terms
RMembrane
9%
RCake
3%
RFoulant
88%
R = 4.23x10¹²
m-1
A
RMembrane
21%
RCake
15%RFoulant
64%
R = 2.07x10¹²
m-1
B
Fouled membrane R distribution for SMBR:A) 10-d MCRT (0.5 gCOD/gVSS.d)B) 2-d MCRT (2.34 gCOD/gVSS.d)

Batch Filtration Results
Mixed Liquor Soluble SS Mixture Effect
2 47 27 12 8
10 17 11 2 4
MCRT, dModified Fouling Index, 10
-3 s/L
2
• MFI was higher for all fractions at MCRT = 2 d• SS represents the suspended solids alone (no soluble
component) and increased 6 times with MCRT decrease• Mixture effect was observed at both conditions

Outline
• Introduction• Rationale• Materials and Methods• Results• Conclusions• Acknowledgements
Conclusions
• High organic loading rates (F/M) increasedmembrane fouling rates
• Increased steady-state membrane fouling ratescorrelated with total SMP
• MW of carbohydrate and protein SMP increasedwith F/M
• Membrane rejected higher MW SMP• FTIR indicated protein and carbohydrate presence
on fouled membranes with stronger adsorptionsresulting from the 2-d MCRT condition
Conclusions• Membrane fouling was primarily due to the
adsorption of organics and RF was dominateresistance term of fouled membranes
• RC increased with F/M and this was attributed tochanges in floc properties that result in a “sticky”cake
• Sludge filtration resistance (MFI) increased withF/M
• MFI of suspended solids increased 6 times,supporting the increasing importance of the cakelayer with increasing F/M

ConclusionsPr
esen
t Wor
th, $
θH, time
CapitalO&M

Acknowledgements
• Nam Jung Jang Department of Environmental Science and
Engineering, Gwangju Institute of Science andTechnology, South Korea
• City and County of San Francisco’s WaterPollution Control Department
• Mitsubishi Corporation• ZENON Environmental, Inc.
Understanding Membrane Fouling atHigh Organic Loading Rates in theSubmerged Membrane BioreactorTreating Municipal Wastewater
R. Shane Trussell, P.E., Nam Jung Jang, Rion Merlo,Slawomir Hermanowicz, and David Jenkins
Department of Civil and Environmental EngineeringUniversity of California, Berkeley
March 8, 2005