Embed Size (px)
Citation preview
1
Analysis of fouling development under dynamic membrane filtration operation
Mubashir Saleem a, Luca Alibardi b*, Raffaello Cossu c, Maria Cristina Lavagnolo c, Alessandro
Spagni d
a Department of Civil, Environmental and Architectural Engineering, University of Padova, via
Marzolo 9, 35131 Padova, Italy
b Cranfield Water Science Institute, Cranfield University, Bedford, MK43 0AL, UK
c Department of Industrial Engineering, University of Padova, via Marzolo 9, 35131 Padova,
Italy
d Laboratory of Technologies for Waste, Wastewater and Raw Materials Management, Italian
National Agency for New Technologies, Energy and Sustainable Economic Development
(ENEA), via M.M. Sole 4, 40129 Bologna, Italy
* Corresponding author:
Luca Alibardi
Cranfield Water Science Institute, Cranfield University, Bedford, MK43 0AL, UK
Email: [email protected]
2
Abstract
This research is a contribution towards evaluating the appropriate fouling mechanism responsible
for the flux decline under dynamic membrane (DM) filtration and its formation mechanism by
using gravity-driven filtration in a specifically design experimental setup. Series of extended
short term filtration experiments were performed at varying operating conditions of mixed liquor
suspended solids (MLSS) concentrations, trans-membrane pressures (TMP) and mesh pore sizes.
Blocking models were applied to identify the fouling mechanisms occurring in DM
development. The results demonstrated that cake filtration model can adequately describe
fouling mechanisms during DM filtration. According to the Analysis of variance, DM
development, as described by flux (J) trends during filtration, was significantly affected by TSS
MLSS concentration only while effluent turbidity was significantly affected by MLSS
concentration and TMP. On the contrary, J and effluent turbidity trends during filtration were not
significantly influenced by mesh pore size, at least in the range used in this study (10-200 µm).
Keywords: Dynamic membrane, Fouling modelling, Mesh filtration, Curve fitting, Gravity
driven filtration.
3
1. Introduction
The use of membranes in wastewater treatment is finding growing application due to their
complete solid retention, flexibility in operation and small footprints. However, high capital and
operating cost and inevitable fouling phenomenon hinders their extensive application [1]. In this
regard, dynamic membranes (DMs) represent an attractive alternative to the use of conventional
microfiltration and ultrafiltration (MF/UF) membranes by positively employing the fouling cake
as a mean for solid liquid separation [2-4]. DM is a fouling surface that is formed by the
deposition of suspended solids, colloids or microbial cell particles over an underlying support
material (meshes, filter cloth etc.) [4-8]. Meshes of different porosity ranging from 10 to 500 µm
have been reported in literature as a suitable support material for developing DMs [7-10]. The
filtration mechanism of DMs is quite different to conventional MF/UF membranes in a way that,
after the formation of DM layer, the filtration resistance is exclusively caused by the cake layer
[7]. However, an excessive growth of a thick and dense fouling layer hinders a long term
filtration operation due to excessive loss of permeability [2, 12]. Therefore, the identification of
operating parameters (e.g. nature and characteristics of the constituting particles, underlying
support, suspended solids concentration, mesh pore sizes and hydrodynamic conditions)
affecting the DM development remains crucial for practical large scale applications [3, 12-15]
but the management of these parameters to ensure performance reproducibility and control of
transmembrane pressure (TMP) still represents a challenging task for DM implementation.
Mathematical modelling is a useful tool that has been widely applied to analyse fouling in
conventional membranes. Four models have been proposed to assess the fouling evolution over
time in the form of complete blocking, intermediate blocking, standard blocking and cake
filtration models. Complete pore blocking mechanism takes the assumption that the particles
reaching the membrane surface block membrane pores without superposing other particles
4
whereas, in intermediate blocking mechanism particles have an equal probability to deposit on
other particles that ultimately cause pore blocking. Standard blocking, assumes that the particles
deposit on the pore inner surface that gradually leads to pore constriction and ultimately to pore
blocking. Cake formation mechanism is based on the assumption that particles reaching the
membrane surface are larger than the membrane pore size and hence, they do not block them,
rather form a layer on the membrane surface.
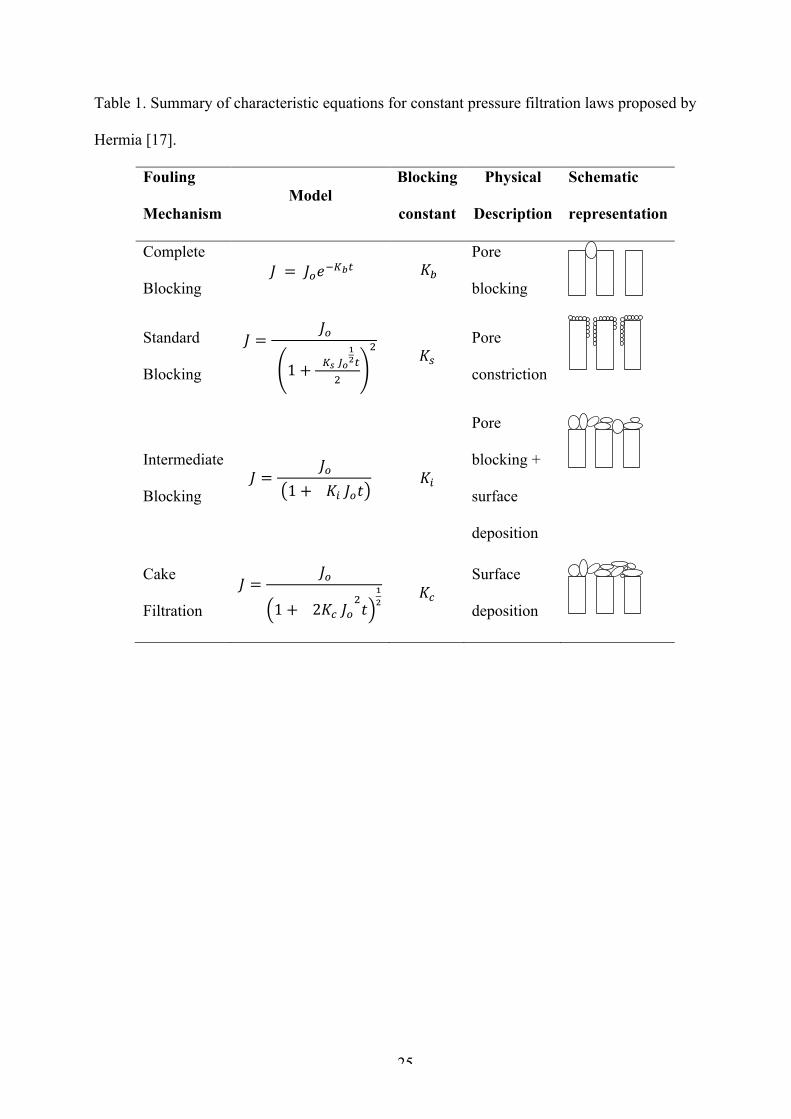
Hermia [17] derived mathematical equations describing flux evolution over time under constant
pressure filtration for these four blocking mechanisms (Table 1).
Some authors have stated that the fouling process could also be governed by a combination of
these mechanisms occurring simultaneously or at different stages during a filtrations operation
depending upon the characteristics of the membrane, feed and operating parameters like filtration
flux (J) and TMP [18-22].
These models [17] have found several applications in studying the fouling mechanisms in
conventional membrane filtration, andalthough fouling processes play a decisive role in DM
development, very few authors have tried to specifically understand how these phenomena occur
in DMs by model-based analyses [6, 7]. In fact, to the best knowledge of the authors, no studies
have been performed yet to specifically evaluate the fouling development in DM by using
mathematical modelling and, in particular, if the fouling models developed for membrane
filtration can also be applied for DMs. Furthermore, the use of mathematical modelling to
elucidate the formation mechanism of DMs in conjunction with the effect of changes in
operating conditions (TMP and suspended solids concentration) on model response and its
interpretation is still limited.
To date, studies have mainly been focused on evaluating the effect of different operating
conditions and process variables on the development and performance of DM [2, 3, 8-15, 23,
24], while very few studies have discussed the mechanism governing the formation of DMs [5-
5
7]. To the best knowledge of the authors, there is a lack of information about the effect of
changing parameters on the mechanisms involved in DM formation.
The aim of this study is to understand the main mechanisms governing DM formation and to
evaluate the possible effects of variation of operating parameters on DM development and
performance. Filtration tests were carried out with a set of diverse operating conditions in a
specifically designed experimental set-up. The results obtained from these experiments were
analysed by blocking models proposed by Hermia [17] to predict the most likely fouling
mechanism occurring in DM filtration.
2. Materials and methods
2.1. Experimental setup
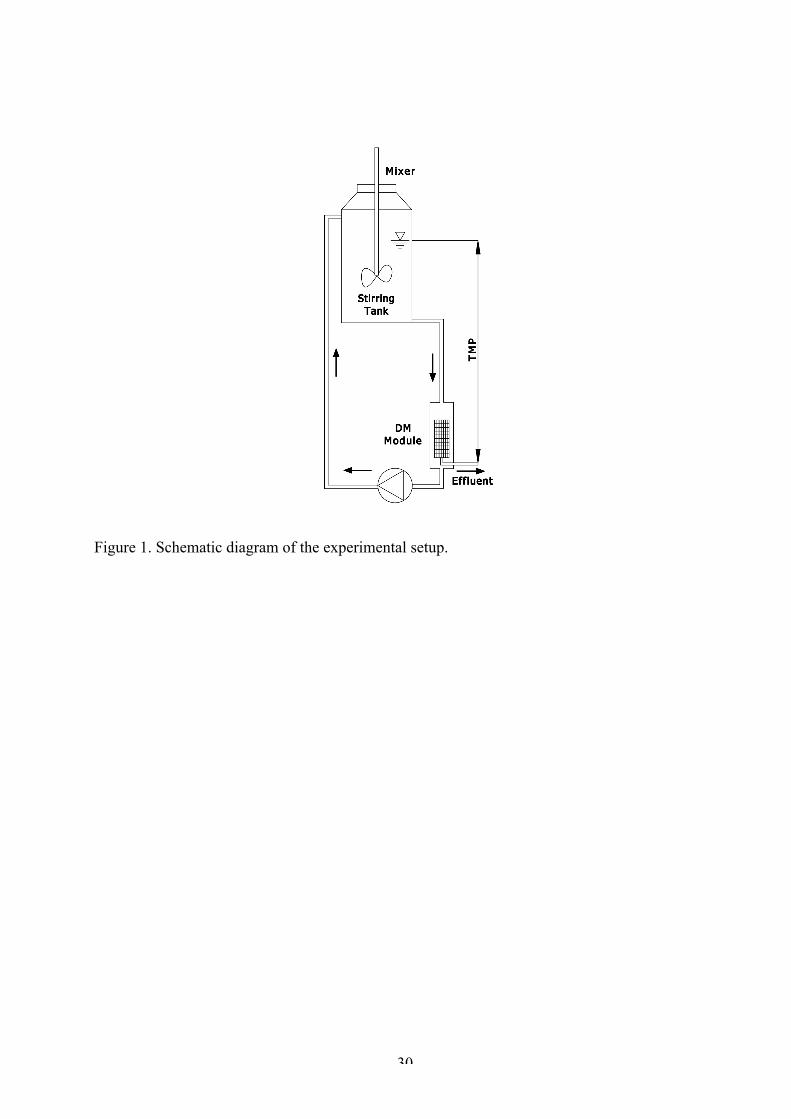
The study was conducted at laboratory-scale in a specifically designed apparatus (Figure 1). The
experimental setup consisted of a 10 L stirring tank connected to an external filtration vessel by
means of a peristaltic pump (Watson-Marlow 604U, Italy). The contents of the stirring tank were
kept completely mixed by using an overhead stirrer (LS F201A0151, VELP Scientifica, Italy)
operating at 200 rpm. The filtration vessel was made from a 1 mm thick Plexiglas tube having an
internal diameter of 42 mm and a length of 180 mm. The filtration module contains a nylon mesh
wound over a cylindrical support made of plastic with an external diameter of 35 mm and a
length of 68 mm. The openings (6 mm x 5 mm) of the supporting cylinder were uniformly
distributed with an effective filtration area of 58.3 cm2. The cylindrical support was placed
concentric to the filtration vessel in order to maintain a uniform hydraulic regime around the
mesh surface. The stirring tank was filled with anaerobic sludge with total solids (TS)
concentration of 12.3 g L-1 and volatile solids (VS) concentration of 7.13 g L-1
respectively. The
6
sludge was collected from a full-scale mesophilic sludge digester treating the excess sludge of
the municipal wastewater treatment plant of Padova, Italy. The required MLSS concentration
was then attained by concentrating the sludge through settling or diluting by adding the
supernatant of the same sludge.
2.2. Filtration experiments
A series of short term filtration experiments were performed at different operating conditions of
mesh pore sizes, mixed liquor suspended solids (MLSS) and TMP. Five different mesh pore
sizes (10, 52, 85, 135, 200 µm) were tested at three different MLSS concentrations (4, 8, 15 g/L)
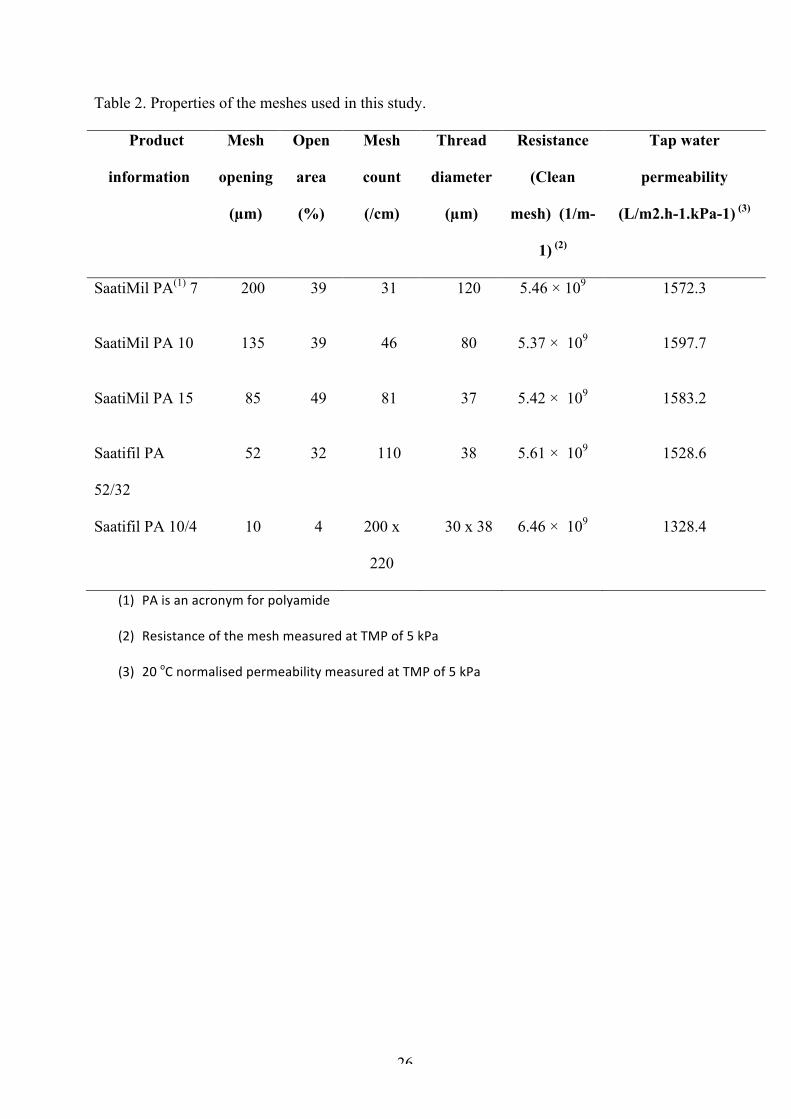
and three different TMPs (5, 10, 18 kPa). Details of the polyamide nylon meshes used in this
study are reported in Table 2. Combination of these parameters was organised in a set of 45
experiments (Table S1, supplementary material), each lasting for 5h. Constant pressure gravity-
driven filtration mode was employed. Each experiment was performed at constant TMP provided
by the hydrostatic water head maintained above the filtration module. Permeate and concentrate
were recirculated to the stirring tank in order to maintain (almost) constant the MLSS (with the
exception of the very small samples collected for analysis and of the mass of solids forming the
dynamic layer); the volume of the stirring tank (10 L) was chosen large enough in order to make
negligible the effect of solids loss during sampling and DM layer formation on the MLSS
concentration.
A constant cross flow velocity (CFV) of 30 m h-1 was maintained by the MLSS recirculation in
all the experimental runs. The application of cross-flow was necessary to avoid possible
sedimentation of the sludge inside the external module that could affect the MLSS concentration
close to the mesh support [9]. The applied CFV in this study was anyway two-three orders of
magnitude lower than the values usually applied in conventional membrane filtration [4] and it
7
was maintained as low as possible to reduce the effect of hydraulic shear on the developing DM
layer and to maintain the hydraulic regime as close as possible to dead-end filtration mode.
Although blocking models were derived for dead-end filtration system, the effect of hydraulic
shear generated by the very low CFV applied in this study was considered negligible therefore,
these models are applied to assess dynamic filtration development and performance. Geissler and
Werner [25] observed in fact that at low CFV the behaviour of fouling resistance in both cross-
flow filtration and dead-end filtration was similar under similar operational conditions for
conventional membranes.
Filtration flux was calculated by measuring the time to collect a known volume of permeate by
using a graduated cylinder. Effluent samples were collected at regular intervals and analysed for
total suspended solids (TSS) concentration and turbidity. TSS in the stirring tank were measured
before and after every experimental run to ensure constant concentration. TSS were measured
according to Standard Methods [26]. Turbidity measurements were performed by using a
turbidimeter (2100P, HACH).
2.3. Data analysis
Curve fitting of the experimental observations was performed with classical constant-pressure
dead-end filtration equations proposed by Hermia [17] and reported in Table 1. More precisely,
filtration flux (J) versus filtration time data was plotted and fitted in a Microsoft Excel
worksheet. Sum of squared errors (SSE) between numerical predictions and experimental
observation was calculated and minimised to optimise the parameters Kb, Ks, Ki, Kc for every
experimental run using the Solver add-in of Microsoft Excel. To evaluate accurate model
prediction for the observed data, two statistical indices, root-mean-square error (RMSE) and
adjusted coefficient of determination (R2adj), were used. The former statistical index shows the
spread of errors between modelled and observed data while the latter is used as a measure of the
8
strength of linear dependence between modelled and experimental observations. RMSE was
preferred over other estimation of residuals, such as the sum of square and the mean square error,
since it returns results in the same units of the models.
In order to assess the effect of the applied operating condition and their interactions on the
filtration behaviour, factorial analysis of variance (ANOVA) considering two-way interaction
between parameters was performed by using IBM SPSS Statistics software on measured J and
effluent turbidity values after specific time intervals of continuous filtration. Moreover, ANOVA
was also applied on the optimised values of blocking constants (K) for the model that best fits the
experimental data.
Due to the short duration of the experiment in this study (i.e. 5 h), the four basic fouling models
(Table 1) were independently applied as the aim of this study was to assess the effect of
operating conditions on fouling mechanism and DM filtration performance. This approach is
different to the other studies where combinations of fouling mechanisms were also applied [6, 7,
18] but it has been reported that combined models, although can improve data fit, could result in
inaccurate estimation of model parameters [18].
Regression analysis of J values measured at the end of the experiments vs different mesh
porosities used in this study was also carried out using IBM SPSS Statistics software.
3. Results and Discussion
3.1. Flux trends
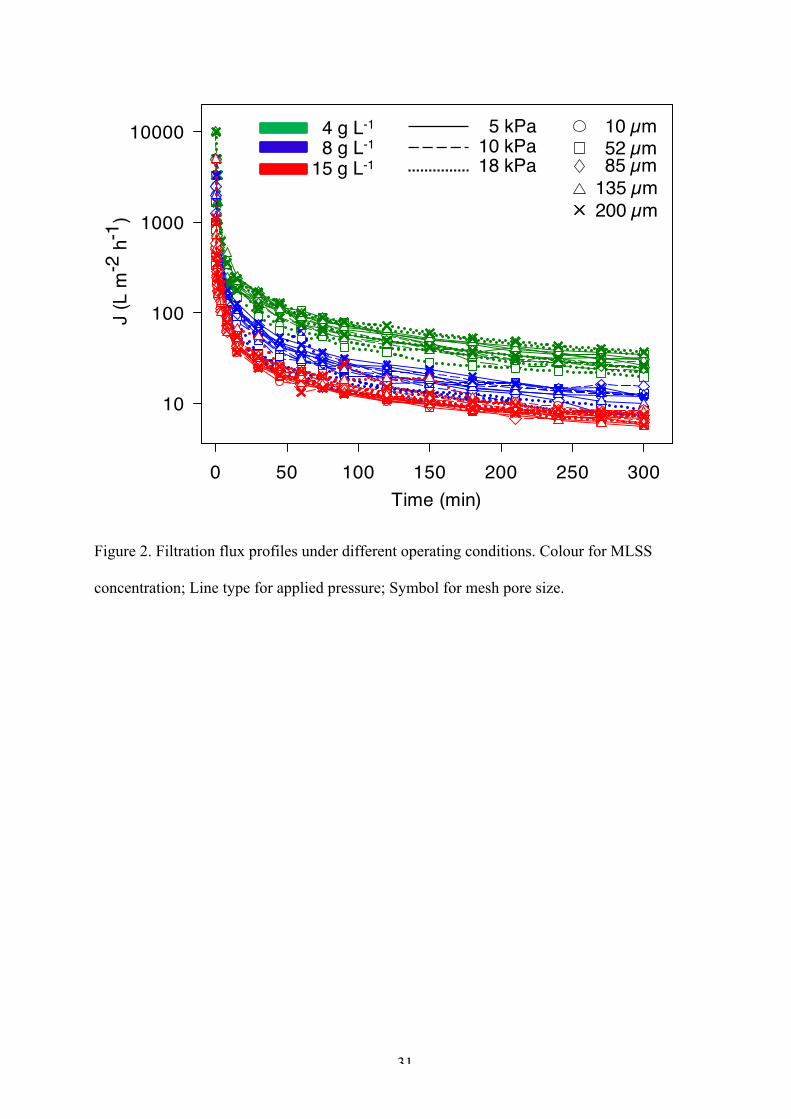
Flux profiles of dynamically formed membrane in all experiments demonstrated a similar
decreasing trend, irrespective of the variations in operating conditions (Figure 2). These trends
were similar to the flux decline trend observed for conventional MF/UF membranes during dead-
9
end filtration at constant TMP with a sharp decline in first few minutes, followed by a much
gradual decline in the later stages of the experiment. However, a significant difference was
observed in the magnitude of initial filtration flux and its rate of decline which were much higher
as compared to conventional membranes [27]. This behaviour was due to the difference in pore
size between conventional membranes and the nylon meshes used in this study. In fact, the
results showed very high initial filtration fluxes, ranging from 329 to 9880 Lm-2h-1 depending
upon the applied operating conditions. Nevertheless, the following rapid increase of the filtration
resistance (i.e. decrease of J) demonstrated the rapid development of the DM (within few
minutes of filtration). As a matter of fact, fluxes reduced to less than 20% of their initial values
(Jo) after only 4 minutes of filtration, and later on it further reduced to around 0.2 to 2% of Jo at
the end (5 h) of each experimental run (Figure 2). Due to these high variations in the filtration
flux values the ratio between the retentate and the permeate greatly varied throughout a single
experiment and also under different operating conditions applied in this study. However, after 90
minutes of continuous filtration the fluxes reduced to almost 90% of their initial flux values for
all the experiments and the retentate to permeate ratio after this time interval was fairly constant
averaging around 158 ± 6.4.
Figure 2 also illustrates three distinct levels of flux profiles grouped together with respect to
three different MLSS concentrations used in this study. Therefore, it can be observed that higher
MLSS concentration tend to increase the rate of fouling, reducing filtration fluxes right from the
beginning of the filtration test. Thus, the highest MLSS concentration showed the lowest values
of J0 (i.e. measured over the first min of filtration). The influence of MLSS concentration on
fouling development is also clearly evident by observing the trend in flux decline. In fact, as a
general behaviour, the higher the MLSS concentration, the lower the filtration flux (Figure 2).
On the contrary, the effect of TMP and pore size cannot be clearly identified by looking at the
flux profiles (Figure 2).
10
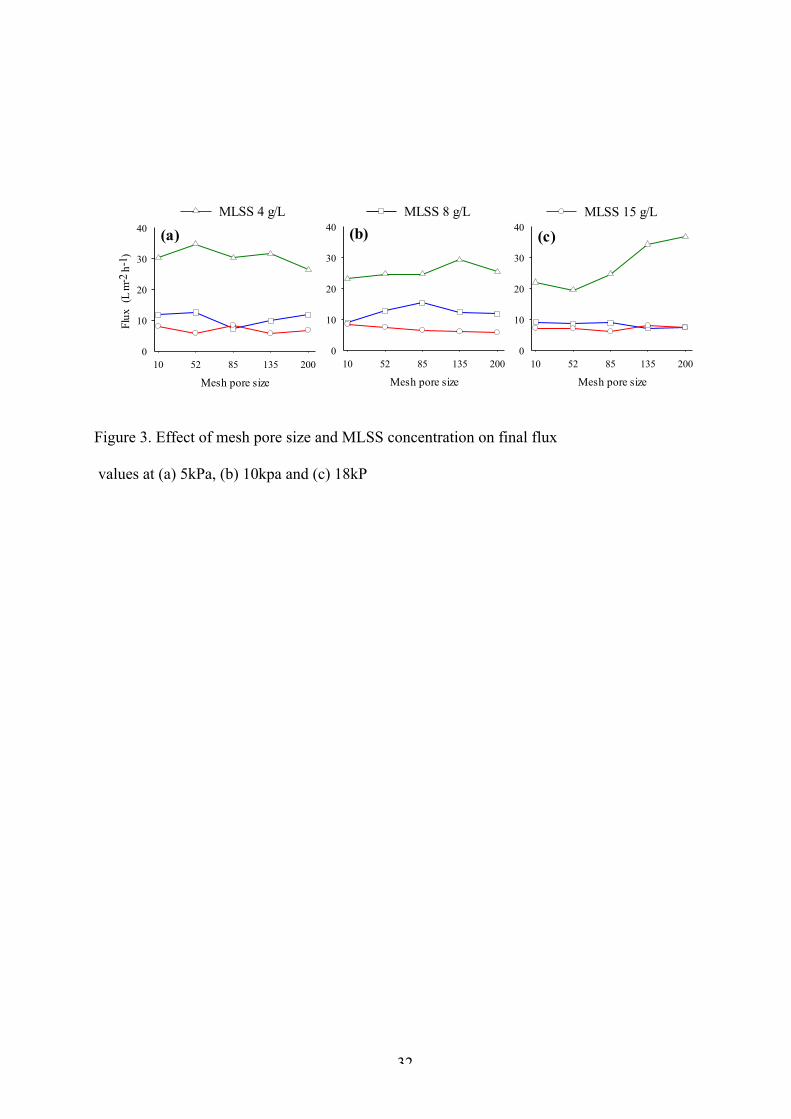
To support this argument, the final values of the flux measured at the end of the 45 experiments
were compared (Figure 3). Fouling development could be considered as an evolutionary process
and thus final values of filtration fluxes carry the history of the fouling process and represent the
effect of operating parameters on the filtration characteristics of DMs (Figure 3). Small
variations on final fluxes can be observed for experiments at same MLSS but different TMPs and
mesh porosities, with the exception for the trends measured using low MLSS concentration (i.e.
4g/L) at high TMP value (i.e. 18kPa) where with increasing mesh pore size seems to favour
higher final (after 5 h) filtration flux values (Figure 3c). Linear regression analysis of final fluxes
vs pore size confirms that data obtained by TMP 18 kPa and 4 g/L of MLSS returns a slope
(s=0.0953 L m-2 h-1 µm-1= 95,344 L m-3 h-1) significantly different to zero (p=0.026) while all
other regressions have slopes that are not significantly different to zero (data not showed).
Therefore, results suggest that pore size seems not to affect the final (i.e. after h) filtration fluxes
with the exception of sludge with low suspended solids concentration at high pressure.
Contrary to the results obtained in this study, Salerno et al. [28] found that the mesh pore size
(20 and 50 µm) significantly affected the permeate characteristics and flux while operating a
bench-scale aerobic dynamic membrane bioreactor. However, their system was operated very
differently to the conditions used during the experiments in this study (e.g. constant flux instead
of constant pressure, air scouring to control the cake layer). Therefore, while the mesh pore size
does not affect the permeate flux in well-defined operating conditions as those applied in the
present study, the support material could, however, affect the permeate characteristics for
different filtration systems.
The observation that low MLSS concentration at high TMP, is favourable for high filtration
fluxes is in agreement with the observation made by Li et al. [29], who, however, applied TMPs
up to 0.62 kPa (63 mm-H2O), which is much smaller as compared to the values applied in this
study.
11
3.2. Curve fitting estimation of fouling models
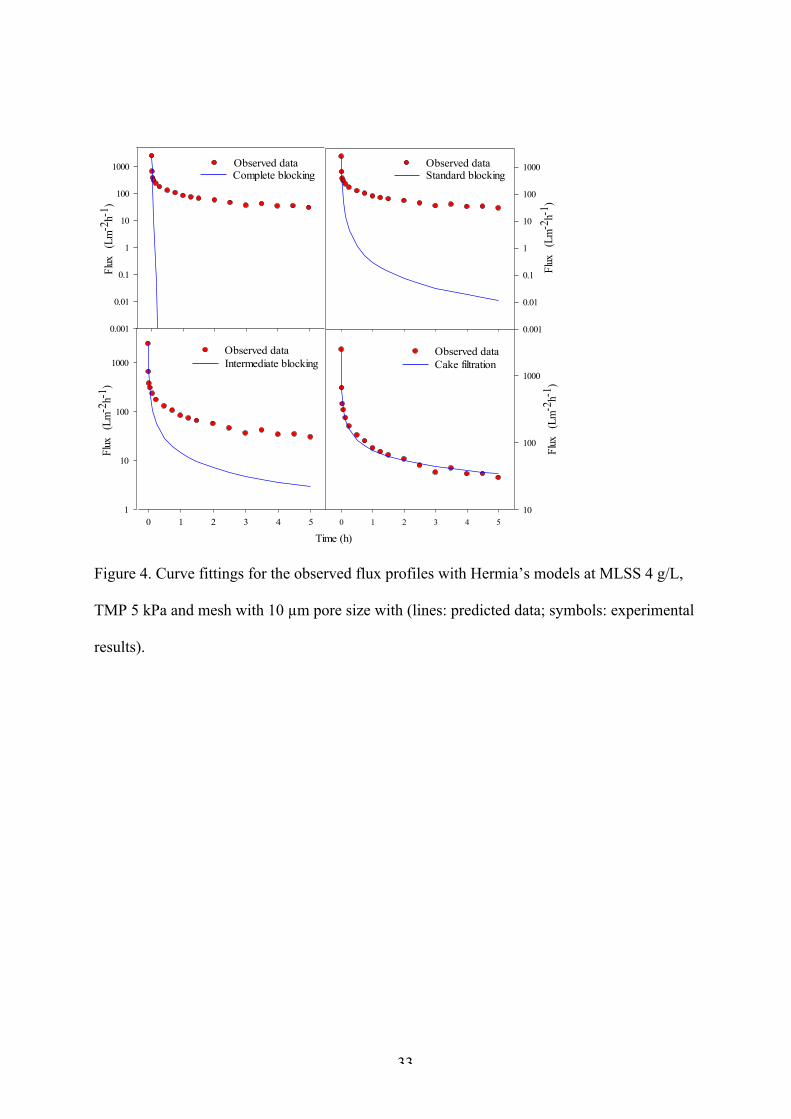
Curve fitting analyses of fluxes obtained from filtration experiments suggest that cake filtration
model best describes the fouling behaviour in DMs while imperfect agreements of intermediate
and standard blocking models with experimental data were observed. An example is reported in
Figure 4 for results obtained for the experiment at 4 g/L MLSS, 5 kPa TMP and with 10 µm
mesh pore size. In most of the experiments the observed data seem to have reasonable agreement
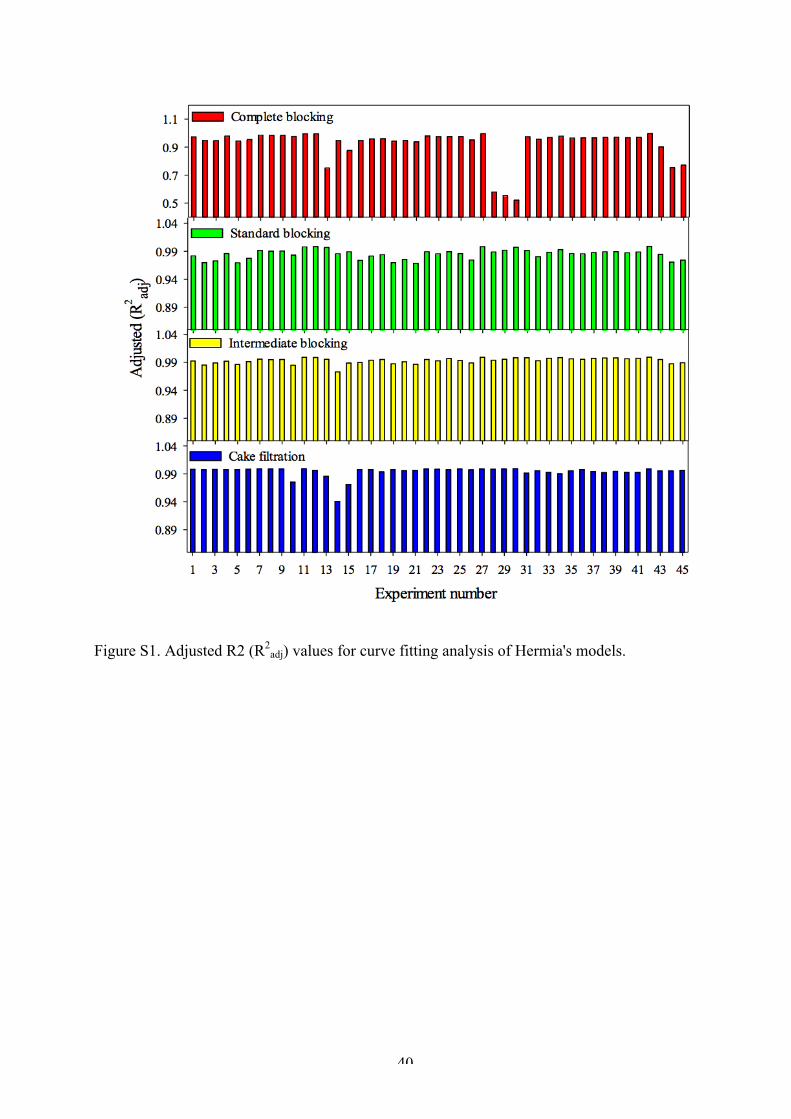
with modelled results shown by the measured R2adj
values which, excluding the complete
blocking model, were always above 0.94 (Figure S1, supplementary material). These results are
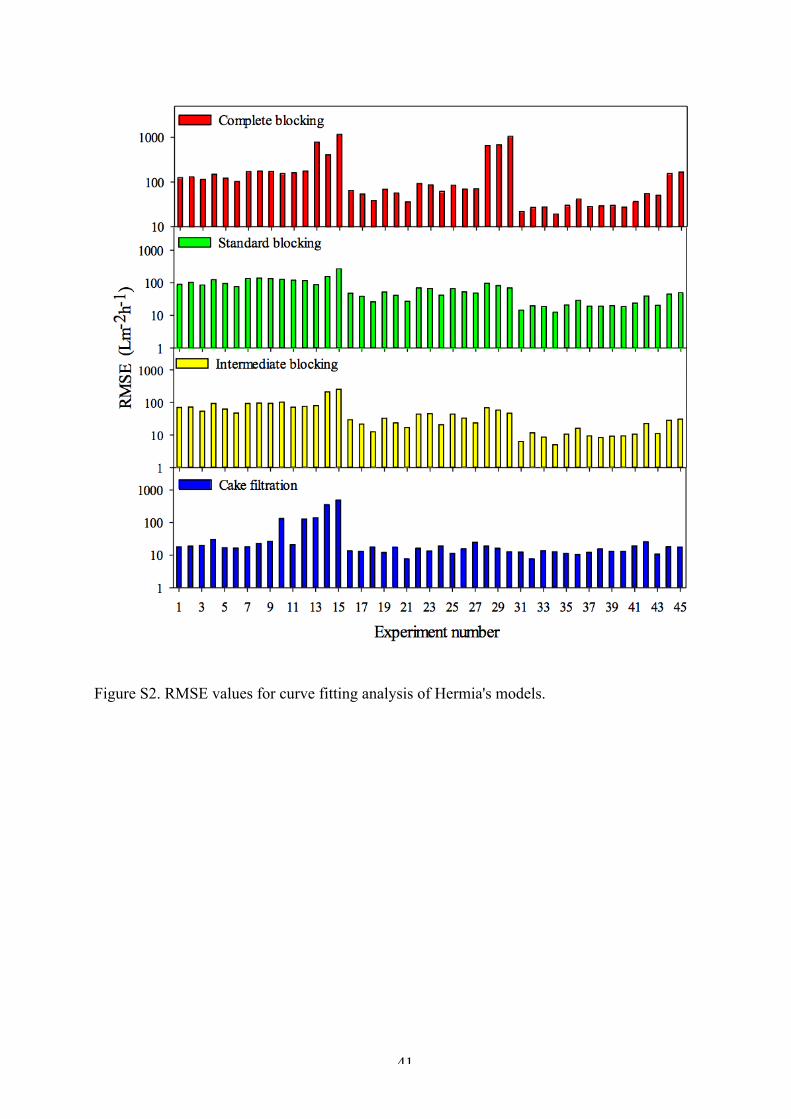
also confirmed by the RMSE values, which are the highest for pore blocking models and the
lowest for cake filtration model (Figure S3, supplementary material). However, the efficiency of
the four models in describing the experimental varied at changing operating conditions.
3.2.1. Complete blocking analysis
The result of curve fitting with complete blocking model usually showed poor data fits between
predicted and experimental values (Figure 4) as depicted by high RMSE values (Figure S3,
supplementary materials). It implies that fouling mechanism in DM filtration was not a result of
complete pore blocking by the particles reaching the mesh surface. Although this model failed to
depict fouling development in DMs, RMSE values changed with varying operating conditions
and the lowest values were observed for experiments with smaller pore size meshes (10 µm) and
high MLSS concentration (15 g L-1) (Figure S2, supplementary material).
Although complete blocking model showed the lowest efficiency in fitting the experimental data,
it is of note that R2adj often achieved values higher than 0.90 (Figure S1, supplementary
material), demonstrating that even this model can reasonable describe the fouling occurrence in
DMs.
12
3.2.2. Standard blocking analysis
Curve fitting of the experimental data obtained during this study by using the standard blocking
model was not completely satisfactory (Figure 4). Li et al. [6] assumed standard blocking fouling
to be the major blocking mechanism at the initial stage of DM filtration by reasoning that due to
large difference between mesh pore and particle size, all other blocking mechanisms were
improbable and thus fouling would be initiated by particle adhesion. However, model response
observed in this study do not support this hypothesis particularly at lower MLSS, higher TMP
and high mesh porosity as represented by high RMSE values (Figure S2, supplementary
material).
It was observed that the effect of MLSS concentration on model response seemed more
prominent as compared to TMP and mesh porosity. This is highlighted by comparing average
RMSE values at 4, 8 and 15 g/L of MLSS concentration which were 122, 55 and 24 Lm-2h-1,
respectively (Figure S2, supplementary materials), suggesting that the standard blocking model
improves the description of the experimental data increasing suspended solids concentration.
3.2.3. Intermediate blocking analysis
Model predictions made by intermediate blocking model were in much better agreement with the
experimental data as compared to complete pore blocking and standard blocking models for the
experimental conditions tested during this study (Figure 4). As for standard blocking models, the
value of RMSE obtained by using intermediate-blocking fouling model tends to reduce with the
increase in MLSS concentration and decrease in mesh pore size (Figure S2, supplementary
materials).
3.2.4. Cake filtration analysis
13
Cake filtration model shows the best fit of the experimental data during DM filtration (Figure 4)
as confirmed by the highest R2adj (usually > 0.99) and the lowest RMSE values (Figures S1 and
S2, supplementary materials). Therefore, the model analysis of the main fouling models confirms
that the assumption of cake filtration model (i.e. a cake layer that can act as a solid-liquid
separation medium) is actually valid in describing the behaviour of the flux trends in DM
development and filtration. DM filtration through a cake layer is also different from conventional
microfiltration membranes because in later case the initial rapid flux decline is mainly due to
pore constriction (standard blocking) caused by the particle deposition on the walls of the
membrane followed by a slower flux decline due to cake formation over the membrane surface
[30].
The response of cake filtration model on varying operating conditions showed (as for the other
fouling model) a similar trend of decreasing RMSE with an increase in MLSS concentration. It
follows, therefore, that the model slightly deviated from ideal cake filtration behaviour at low
MLSS concentration. This effect is confirmed by studies on conventional MF/UF membranes
indicating that membrane fouling and cake formation is enhanced at high MLSS concentration
[31].
The effect of the applied operating conditions (i.e. TMP, pore size and MLSS concentration) was
evaluated by ANOVA. The statistical analysis was performed on the optimised values of cake
blocking constants (Kc) since the results of curve fitting supported cake filtration model to be the
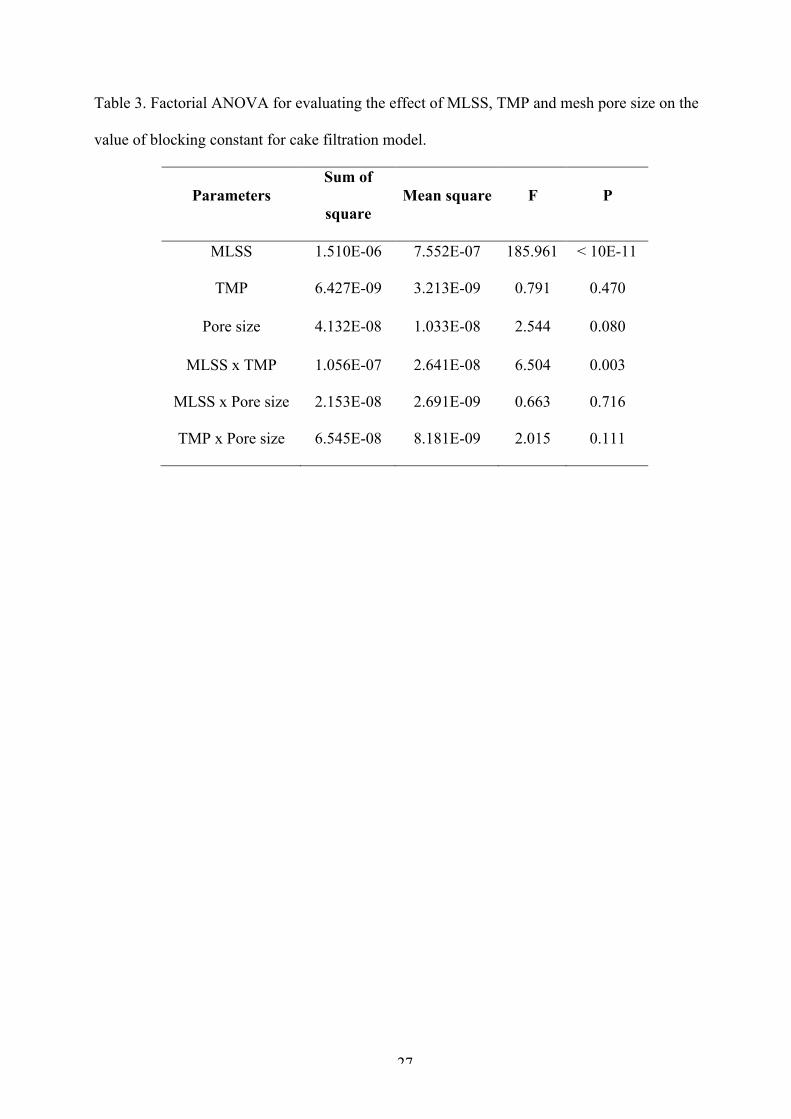
governing fouling mechanism in DM filtration. ANOVA analysis demonstrated that MLSS
concentration proved to have the most significant influence on the value of Kc (p < 10E-11) in F-
test among other parameters and their respective interactions (Table 3). Surprisingly, neither the
pore size nor the applied pressure demonstrated a statistically significant (p>0.05) effect on the
values of the measured cake fouling constants (at least for the applied conditions in this study).
The reason for such a significant influence of MLSS on fouling processes in DMs can be
14
explained by analysing the primary assumptions of cake filtration model [17], where Kc is
defined by the following expression:
(1)
Where, ! is the specific cake resistance, " is the filtrate density, # is the mass fraction of solids in
the filtrate, $ is filtrate viscosity, % is the surface area, & is the TMP and ' is the mass ratio
wet/dry of the cake. The MLSS concentration or mass fraction of solids in the filtrate has a dual
effect on the value of Kc: a direct proportional effect expressed by the parameter s, and an
indirect one by influencing other factors involved in the expression such as!, " and'.
As far as the TMP is concerned, no significant effect (p > 0.05) was found on the value of Kc.
However, the interaction of MLSS concentration and TMP was significant (p = 0.003 for
MLSS*TMP), demonstrating that the relationship between MLSS and Kc also depends on the
applied TMP (Table 3).
Pore size, therefore, does not significantly affect J trends during cake filtration (at least using Kc
values). This clearly demonstrated that the filtration by DMs is exclusively carried out by the
cake layer while the mesh only acts as supporting material.
ANOVA performed on final J (i.e. measured after 5 h filtration) confirms, once again, that
MLSS is the only statistically significant parameter characterising DM development, at least
under the applied operating conditions of this study (Table S2, Supplementary materials). In
addition, it is of note that the final J values were not statistically affected by the combined
MLSS*TMP parameter, suggesting that the cake fouling constant (Kc) better reassumes the
fouling phenomenon than a specific J values.
Liu et al. [7] proposed a four-stage formation mechanism of DMs over silk mesh, since they
observed the progressive development of DM which was characterised by the four classic
filtration models occurring sequentially. Li et al. [6], on the contrary, proposed a two-stage
)* =!"#$
%,&(1 − '#)
15
model to describe the cake formation and flux decline in DM operation by using different mesh
filters and under varying operating conditions. They proposed standard blocking as the
governing mechanism during the initial stage of filtration whereas the complete blocking and
cake filtration dominated in the final stage. This study, on the contrary, demonstrates that cake
filtration can adequately describe the J behaviour during DM formation and filtration at least
during short-term experiments and under the applied operating conditions.
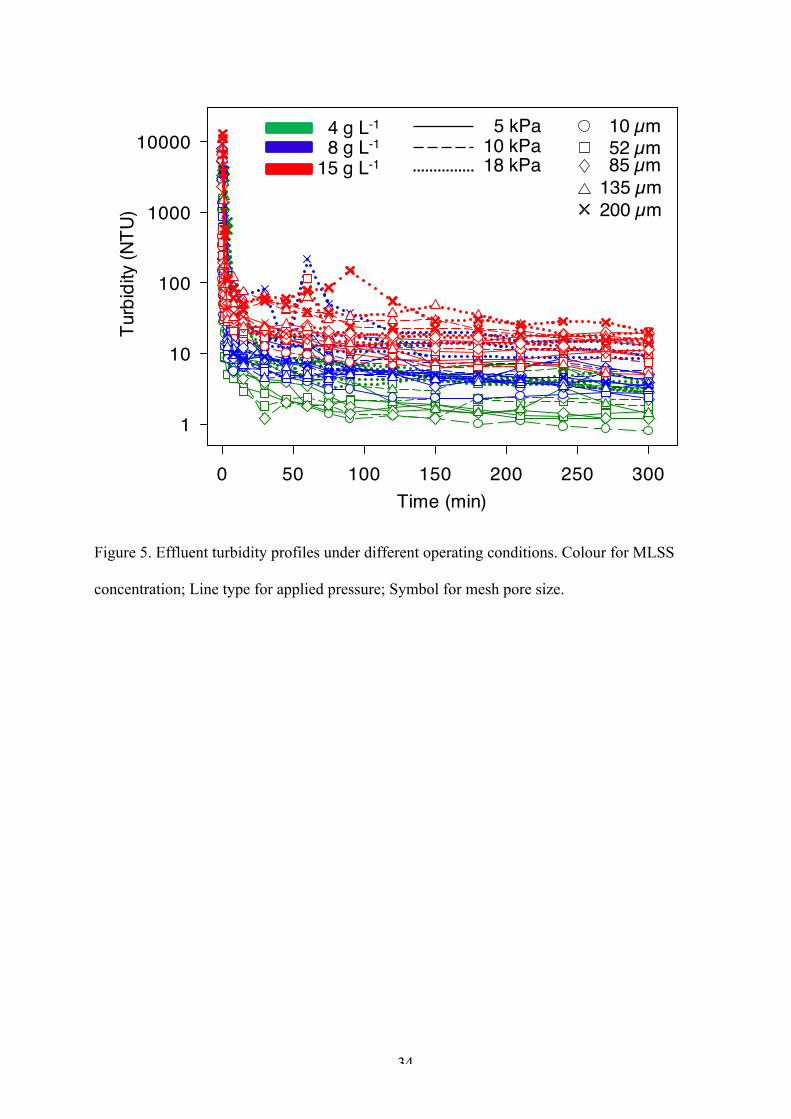
3.3. Effluent quality and suspended solids rejection
Dynamic membrane development was very rapid under all experimental conditions during this
study (See Section 3.1) thus resulting in an effluent quality that improved quickly both in terms
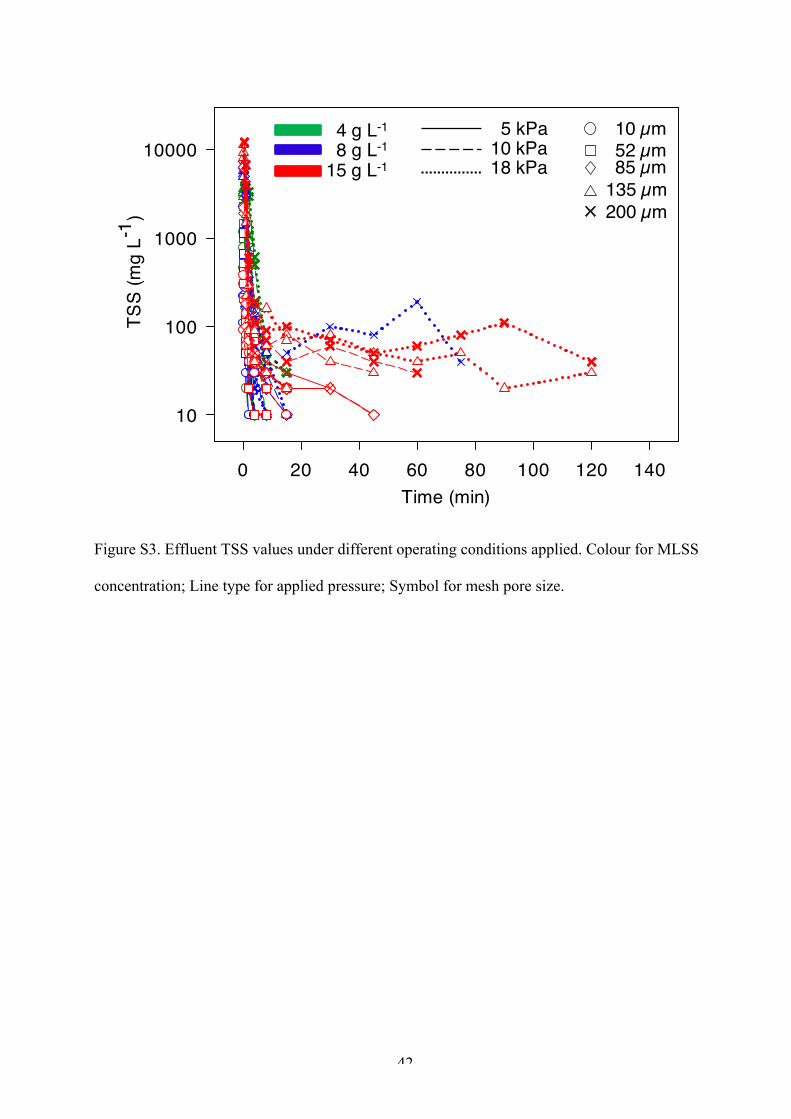
of turbidity and TSS concentration (Figure 5 and Figure S3, supplementary material). Moreover,
during filtration, the effluent turbidity decreased more rapidly than did the permeate flux
(Figures 2, 5). In fact, while J decreased to 2 % of the initial values (J0) in 5 h (see Section 3.1),
solids rejection was usually higher than 99% after only 8 minutes of filtration, corresponding to
values typically less than 100 NTU and 20 mg/L for turbidity (Figure 5) and TSS (Figure S3,
supplementary materials). Furthermore, whereas J continuously decreased during the filtration
phase, NTU values seemed to show almost stable values after the first few minutes.
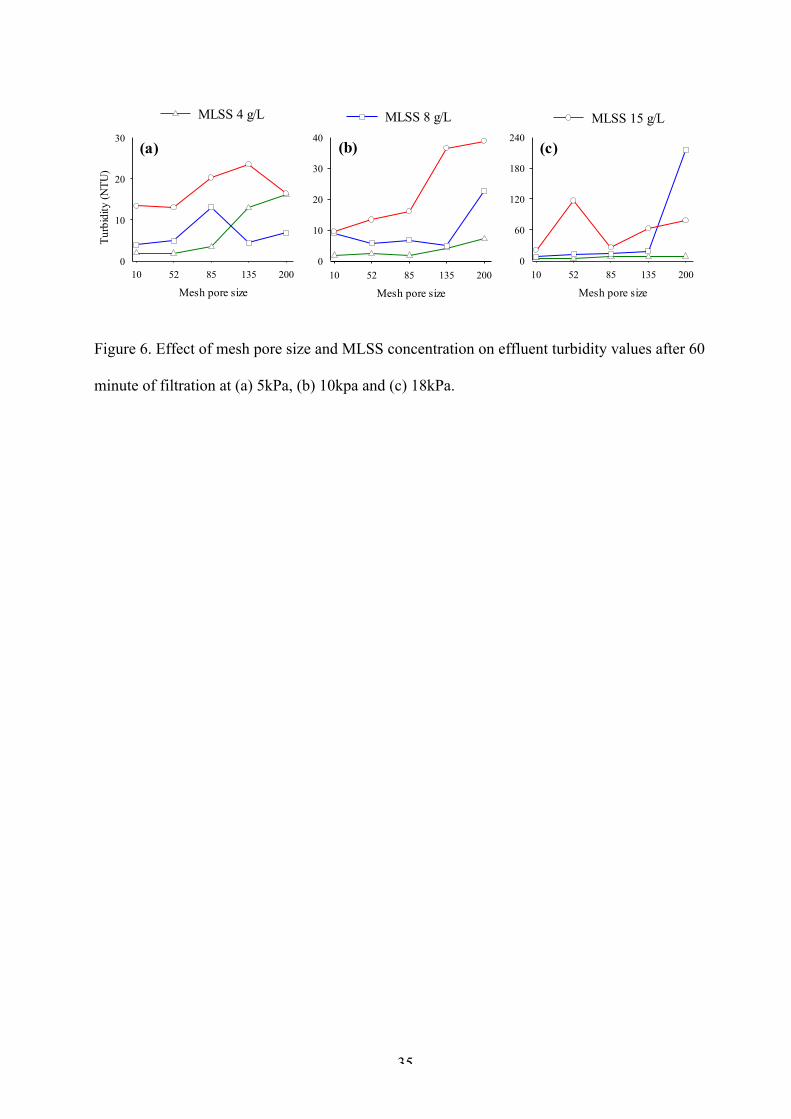
The effect of MLSS on effluent turbidity can be observed from Figure 5. The results demonstrate
that the lowest effluent turbidity values were obtained at lower MLSS concentrations while no
clear effects on turbidity can be observed for mesh sizes and TMPs. Turbidity values after 60
minutes of filtration at 4 g/L MLSS were well below 20 NTU for the majority of the experiments
(Figure 6). The negative impact of high MLSS concentration was also evident from the effluent
SS profile (Figure S3, supplementary materials).
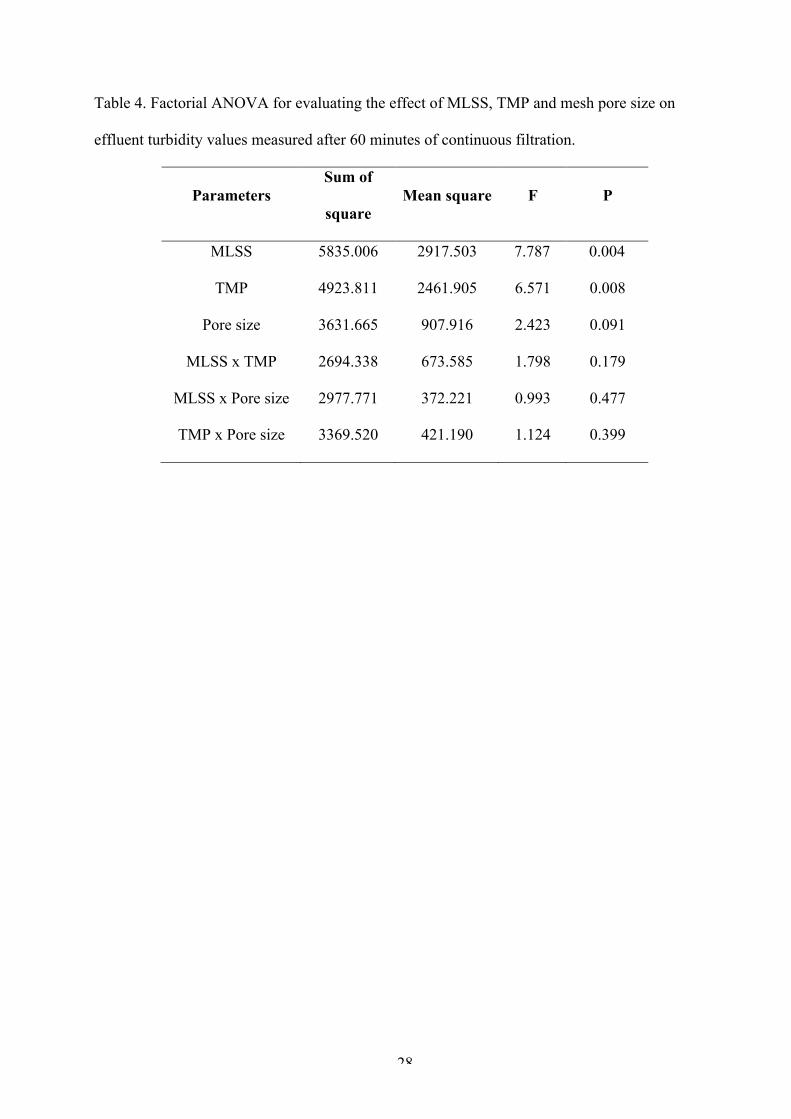
ANOVA performed on effluent turbidity values measured after 60 minutes of continuous
filtration with respect to varying operating conditions of the experiments confirms that MLSS
16
concentration plays a statistically significant role (Table 4). Moreover, contrary to the cake
filtration constant (Kc), turbidity was also significantly (p=0.08) affected by TMP (Table 4).
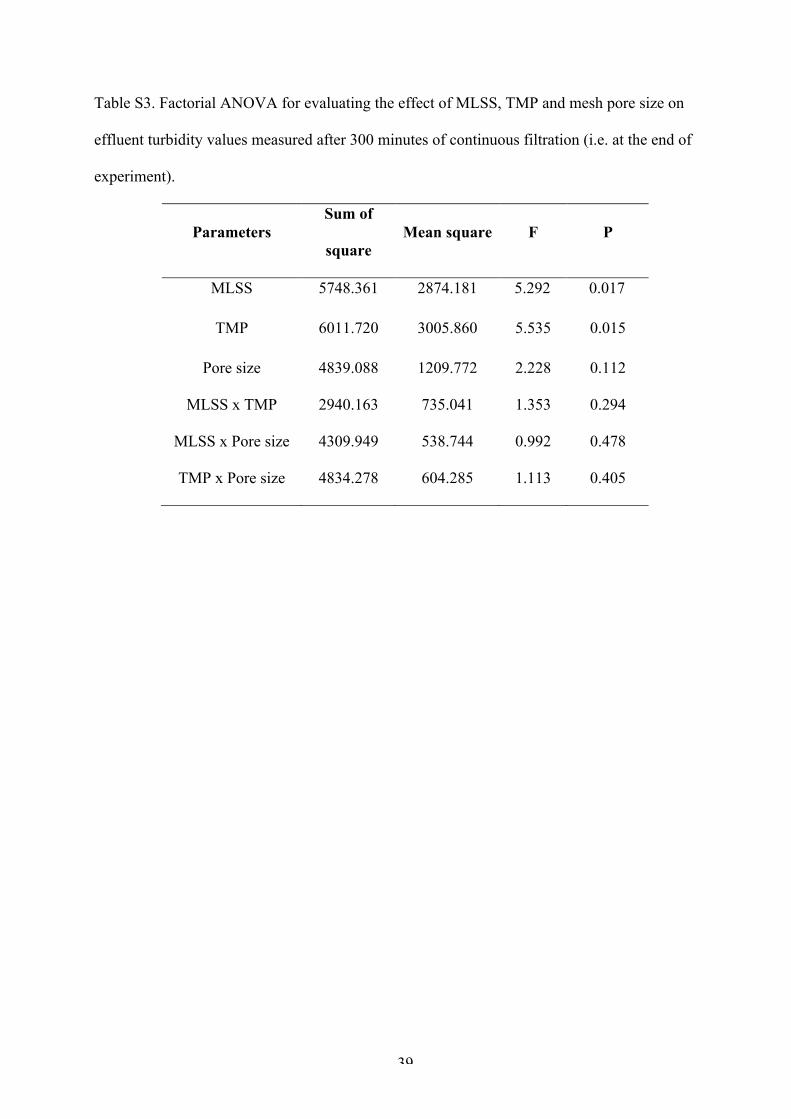
Similar results were obtained by ANOVA on the turbidity values measure at the end of the
filtration (i.e. after 5 h of filtration; Table S3, supplementary materials).
As a general trend, an increase in filtration resistance is followed by a concomitant reduction in
effluent fluxes (Figure 2) and improvement in effluent quality (Figure 6) in terms of solids
rejection [2, 7]. A slight deviation from this trend was observed in this study at high MLSS
concentration for which filtration resistance tends to follow the expected increasing trend.
However, effluent quality was slightly compromised as compared to the quality of the effluent at
low MLSS concentration (Figure 6). A plausible reason of lower effluent quality at high MLSS
concentration could be the presence of higher number of smaller sludge particles per unit volume
at high MLSS concentrations and thus, chances of these particles passing through the fouling
layer acting as a DM are higher at high MLSS concentrations.
High TMP, although not affecting the DM development (at least taken alone as indicated by
ANOVA on J and Kc), increases the drag force on the cake layer removing loosely bounded
particles by carrying them through the mesh and causes, thus, an increase in effluent turbidity.
Moreover, although DM can be formed more rapidly using higher MLSS concentration as
suggested by lower fluxes and higher Kc values (Figures 2-3), it also caused an increases of the
effluent TSS concentration as well as turbidity due to the higher amount of material that can be
pushed across the developing DM.
Very surprisingly, the effluent turbidity was not affected by the pore size after the formation of
DM (Table 4) confirming once more the negligible effect of the mesh pore size (from 10 to 200
µm) on cake filtration by DMs.
17
4. Conclusions
The results of short term filtration experiments performed in this study using anaerobic sludge at
varying operating conditions of MLSS, TMP and mesh pore size can be summarised under the
following conclusions:
• DM development under constant pressure was very rapid (less than 5 minutes) and was
mainly attributed to very high filtration fluxes observed at the beginning of every experiment.
• Initial filtration fluxes ranged from 329 to 9880 Lm-2h-1 and were followed by much
lower fluxes after the formation of the DM.
• MLSS concentration was found to be the major factor affecting the filtration performance
of DMs. Fluxes increased at decreasing MLSS. The relationship between MLSS and Kc also
depends on the applied TMP. On the contrary, pore size (in the range used in this study) did not
significantly affect DM development and J.
• The cake filtration mechanism can be effectively used to model DM formation and fluxes
behaviour.
• Turbidity reduction was very rapid and concomitant to DM development as a result of
which, suspended solid removal was usually higher than 99 % within 10 minutes of filtration.
Effluent quality in terms of turbidity was negatively related to MLSS concentration and TMP,
while was not affected by mesh pore size.
Acknowledgments
Mubashir Saleem gratefully acknowledges the financial support from Fondazione Cassa di
Risparmio di Padova e Rovigo (CARIPARO).
18
References
[1] P. Le-Clech, Membrane bioreactors and their uses in wastewater treatments, Appl. Microbiol.
Biot. 88 (2010) 1253–1260.
[2] L. Alibardi, R. Cossu, M. Saleem, A. Spagni, Development and permeability of a dynamic
membrane for anaerobic wastewater treatment, Bioresource Technol. 161 (2014) 236–244.
[3] Y. Zhang, Y. Zhao, H. Chu, B. Dong, X. Zhou, Characteristics of dynamic membrane
filtration: structure, operation mechanisms, and cost analysis, Chinese Sci. Bull. 59 (2014) 247–
260.
[4] M.E. Ersahin, H. Ozgun, R.K. Dereli, I. Ozturk, K. Roest, J.B. van Lier, A review on
dynamic membrane filtration: materials, applications and future perspectives, Bioresource
Technol. 122 (2012) 196-206.
[5] X. Zhang, Z. Wang, Z. Wu, F. Lu, J. Tong, L. Zang, Formation of dynamic membrane in an
anaerobic membrane bioreactor for municipal wastewater treatment, Chem. Eng. J. 165 (2010)
175–183.
[6] W. W. Li, G. P. Sheng, Y.K. Wang, X.W. Liu, J. Xu, H.Q. Yu, Filtration behaviors and
biocake formation mechanism of mesh filters used in membrane bioreactors, Sep. Purif. Technol.
81 (2011) 472-479.
[7] H. Liu, C.Y. Yang, W. Pu, J. Zhang, Formation mechanism and structure of dynamic
membrane in the dynamic membrane bioreactor, Chem. Eng. J. 148 (2009) 290-295.
[8] L. Alibardi, N. Bernava, R. Cossu, A. Spagni, Anaerobic dynamic membrane bioreactor for
wastewater treatment at ambient temperature, Chem. Eng. J. 284, (2016) 130–138.
[9] C. Loderer, B. Gahleitner, K. Steinbacher, C. Stelzer, W. Fuchs, Dynamic filtration – A novel
approach for critical flux determination using different textiles, Sep. Purif. Technol. 120 (2013)
410-414.
19
[10] D. Jeison, I. Diaz, J.B. van Lier, Anaerobic membrane bioreactors: are membranes really
necessary? Electron. J. Biotechn. 11 (2008) 1-7.
[11] Y. Kiso, Y-J. Jung, T. Ichinari, M. Park, T. Kitao, K-S. Nishimura, Wastewater treatment
performance of a filtration bio-reactor equiped with a mesh filter material, Water Res. 34 (2000)
4143-4150.
[12] M.R. Alavi Moghaddam, H. Satoh, T. Mino, Performance of coarse pore filtration activated
sludge system, Water Sci. Technol. 46 (2002) 71-76.
[13] M. E. Ersahin, J.B. Gimenez, H. Ozgun, Y. Tao, H. Spanjers, J.B. van Lier, Gas-lift
anaerobic dynamic membrane bioreactors for high strength synthetic wastewater treatment:
Effect of biogas sparging velocity and HRT on treatment performance, Chem. Eng. J.
http://dx.doi.org/10.1016/j.cej.2016.02.003
[14] M.E. Ersahin, H. Ozgun, J.B. van Lier, Effect of support material properties on dynamic
membrane filtration performance, Separ. Sci. Technol. 48 (2013) 2263-2269
[15] J. Ma, Z. Wang, Y. Xu, Q. Wang, Z. Wu, A. Grasmick, Organic matter recovery from
municipal wastewater by using dynamic membrane separation process, Chem. Eng. J. 219
(2013) 190–199.
[16] W-K. Chang, A.Y-J. Hub, R-Y. Hornga, W-Y. Tzoua, Membrane bioreactor with nonwoven
fabrics as solid–liquid separation media for wastewater treatment, Desalination, 202, (2006) 122-
128.
[17] Hermia, J. 1982. Constant pressure blocking filtration laws—Application to power-law non-
Newtonian fluids, T. I. Chem. Eng-Lond 60 (2007) 183–187.
[18] G. Sabia, M. Ferraris, A. Spagni, Model-based analysis of the effect of different operating
conditions on fouling mechanisms in a membrane bioreactor, Enviro. Sci. Pollut. R. 23 (2016)
1598–1609.
20
[19] E. Iritani, A review on modelling of pore-blocking behaviours of membranes during
pressurized membrane filtration, Dry. Technol. 31 (2013) 146–162.
[20] M Kim. B. Sankararao. S. Lee, C. Yoo, Prediction and Identification of Membrane Fouling
Mechanism in a Membrane Bioreactor Using a Combined Mechanistic Model, Ind. Eng. Chem.
Res. 52 (2013) 17198−17205.
[21] G. Bolton, D. LaCasse, R. Kuriyel, Combined models of membrane fouling: Development
and application to microfiltration and ultrafiltration of biological fluids, J. Membrane. Sci. 277
(2006) 75–84.
[22] Y. Ye, P. Le Cleck, V. Chen, A.G. Fane., B. Jefferson, Fouling mechanisms of alginate
solutions as model extracellular polymeric substances, Desalination 175 (2005) 7–20.
[23] M. Saleem, L. Alibardi, M.C. Lavagnolo, R. Cossu, A. Spagni, Effect of filtration flux on
the development and operation of a dynamic membrane for anaerobic wastewater treatment. J.
Environ. Manage. 180 (2016) 469-465.
[24] S. Liang, L. Qu, F. Meng, X. Han, J. Zhang, Effect of sludge properties on the filtration
characteristics of self-forming dynamic membranes (SFDMs) in aerobic bioreactors: Formation
time, filtration resistance, and fouling propensity, J. Membrane. Sci. 436 (2013) 186–94.
[25] S. Geissler, U. Werner, Dynamic model of crossflow microfiltration in flat-channel systems
under laminar flow conditions, Filtr. Separat. 32 (1995) 533-537.
[26] APHA-AWWA-WEF., 2005. Standard Methods for the Examination of Water and
Wastewater, 21st ed., American Public Health Association, American Water Works Association,
Water Environment Federation. Washington, D.C.
[27] J. Mendret, C, Guigui, P, Schmitz, C. Cabassud, In situ dynamic characterisation of fouling
under different pressure conditions during dead-end filtration: Compressibility properties of
particle cakes, J. Membrane. Sci. 333 (2009) 20–29.
21
[28] Salerno C., Vergine P., Berardi G., Pollice A., Influence of air scouring on the performance
of a self forming dynamic membrane bioreactor (SFD MBR) for municipal wastewater
treatment. (2016) In press: http://dx.doi.org/10.1016/J.biortech.2016.10.054.
[29] W.W. Li, Y-K. Wang, J. Xu, Y.R. Tong, L. Zhao, H. Peng, G.P. Sheng, H.Q. Yu, A dead-
end filtration method to rapidly and quantitatively evaluate the fouling resistance of nylon mesh
for membrane bioreactor, Sep. Purif. Technol. 89 (2012)107-111.
[30] J. Ho, S. Sung, Effects of solid concentrations and cross-flow hydrodynamics on
microfiltration of anaerobic sludge, J. Membrane. Sci. 345 (2009) 142–147.
[31] M. Lousada-Ferreira J.B. van Lier, J.H.J.M. van der Graaf, Impact of suspended solids
concentration on sludge filterability in full-scale membrane bioreactors, J. Membrane. Sci. 476
(2015) 68-75.
22
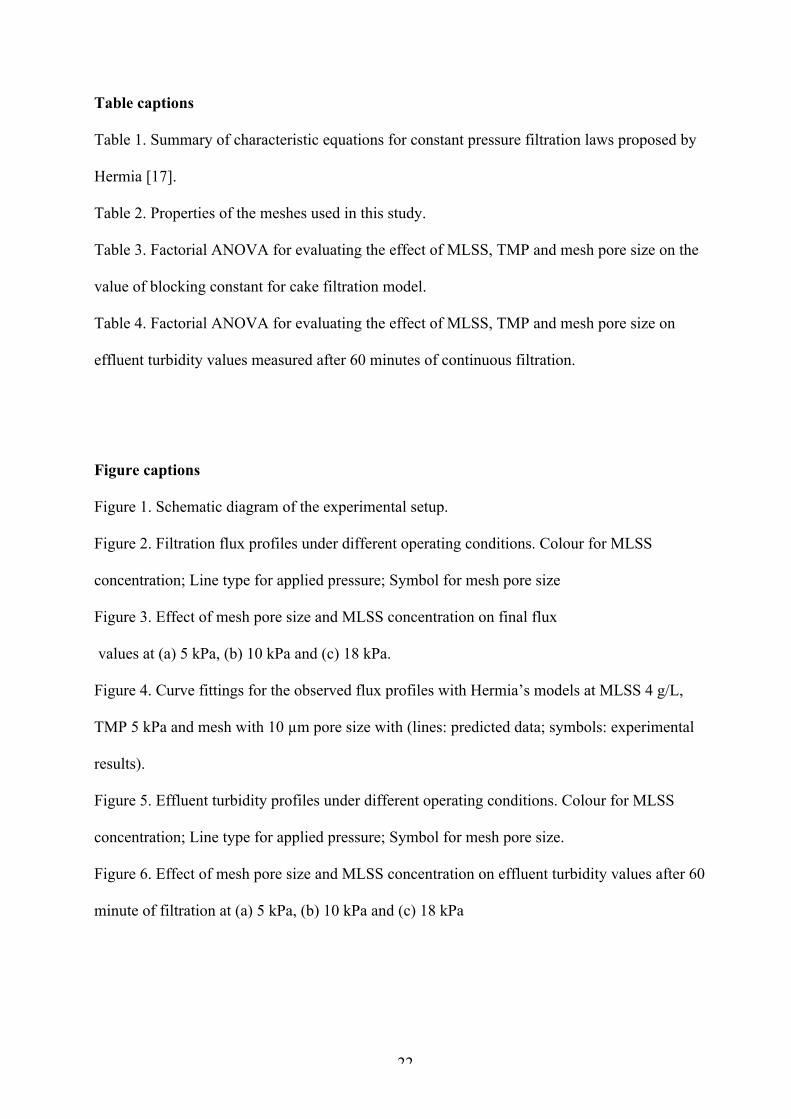
Table captions
Table 1. Summary of characteristic equations for constant pressure filtration laws proposed by
Hermia [17].
Table 2. Properties of the meshes used in this study.
Table 3. Factorial ANOVA for evaluating the effect of MLSS, TMP and mesh pore size on the
value of blocking constant for cake filtration model.
Table 4. Factorial ANOVA for evaluating the effect of MLSS, TMP and mesh pore size on
effluent turbidity values measured after 60 minutes of continuous filtration.
Figure captions
Figure 1. Schematic diagram of the experimental setup.
Figure 2. Filtration flux profiles under different operating conditions. Colour for MLSS
concentration; Line type for applied pressure; Symbol for mesh pore size
Figure 3. Effect of mesh pore size and MLSS concentration on final flux
values at (a) 5 kPa, (b) 10 kPa and (c) 18 kPa.
Figure 4. Curve fittings for the observed flux profiles with Hermia’s models at MLSS 4 g/L,
TMP 5 kPa and mesh with 10 µm pore size with (lines: predicted data; symbols: experimental
results).
Figure 5. Effluent turbidity profiles under different operating conditions. Colour for MLSS
concentration; Line type for applied pressure; Symbol for mesh pore size.
Figure 6. Effect of mesh pore size and MLSS concentration on effluent turbidity values after 60
minute of filtration at (a) 5 kPa, (b) 10 kPa and (c) 18 kPa
23
Supplementary material
Table captions
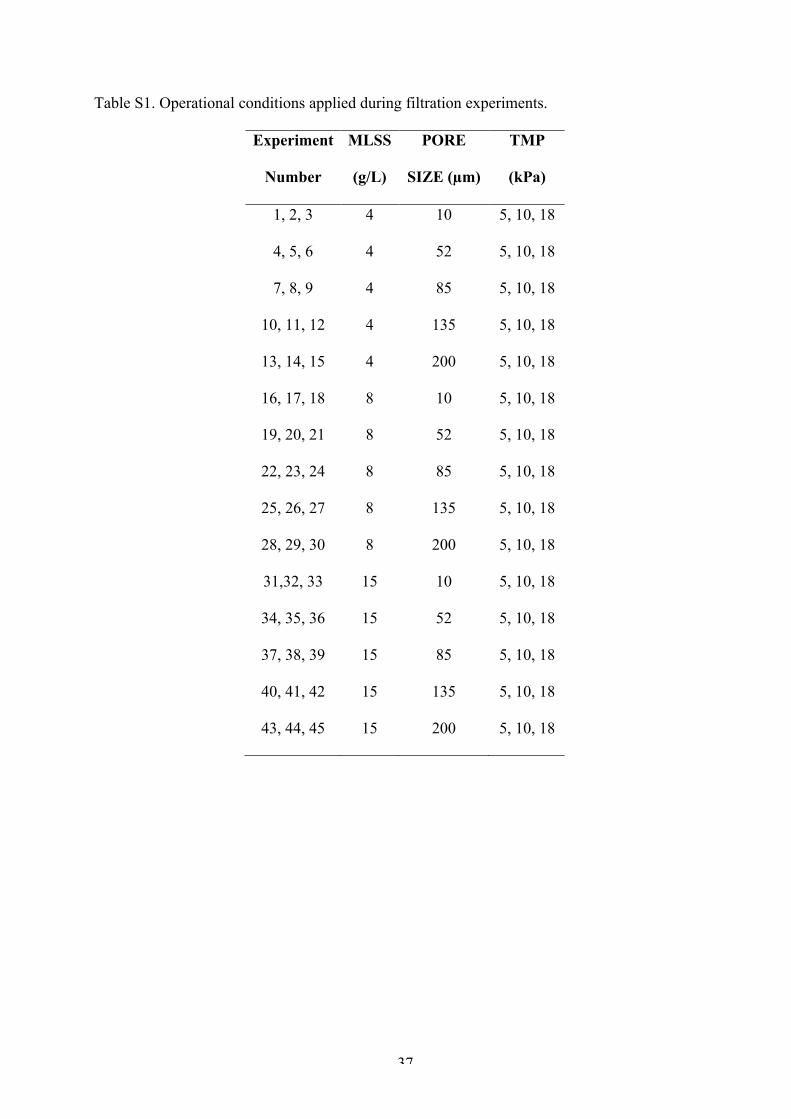
Table S1. Operational conditions applied during filtration experiments.
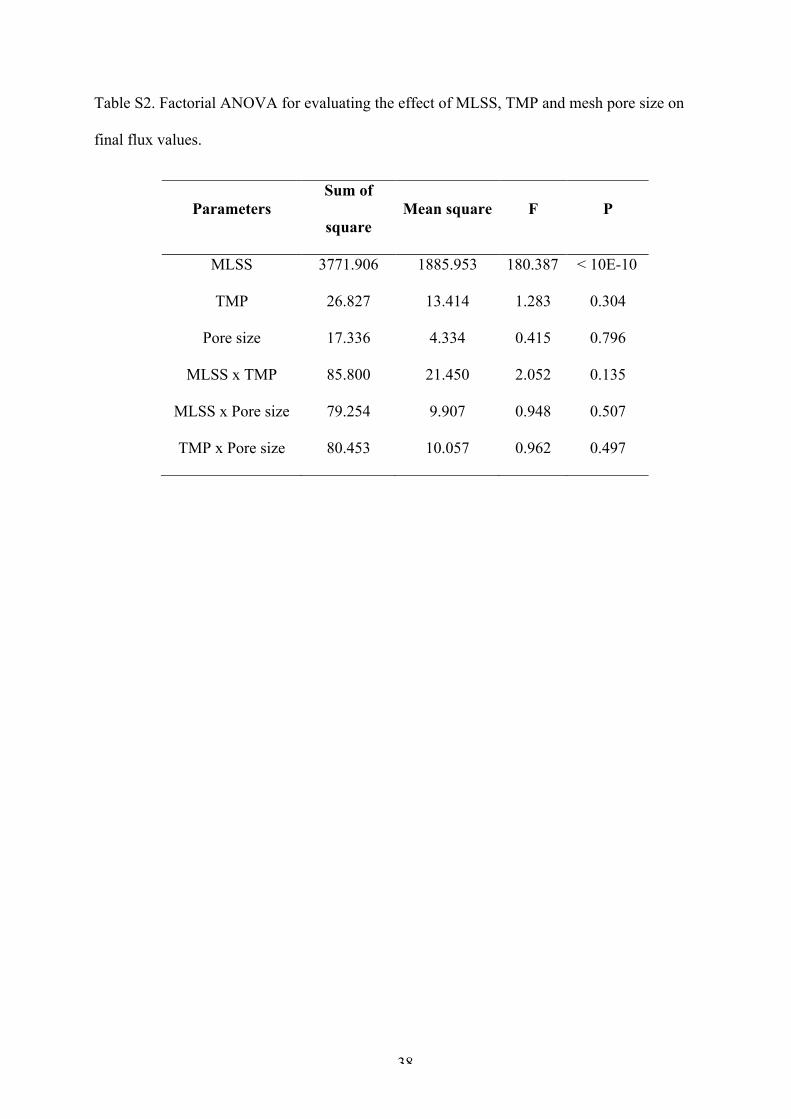
Table S2. Factorial ANOVA for evaluating the effect of MLSS, TMP and mesh pore size on
final flux values.
Table S3. Factorial ANOVA for evaluating the effect of MLSS, TMP and mesh pore size on
effluent turbidity values measured after 300 minutes of continuous filtration (i.e. at the end of
experiment).
Figure captions
Figure S1. Adjusted R2 (R2adj) values for curve fitting analysis of Hermia's models.
Figure S2. RMSE values for curve fitting analysis of Hermia's models.
Figure S3. Effluent TSS values under different operating conditions applied. Colour for MLSS
concentration; Line type for applied pressure; Symbol for mesh pore size.
24
Table captions
Table 1. Summary of characteristic equations for constant pressure filtration laws proposed by
Hermia [17].
Table 2. Properties of the meshes used in this study.
Table 3. Factorial ANOVA for evaluating the effect of MLSS, TMP and mesh pore size on the
value of blocking constant for cake filtration model.
Table 4. Factorial ANOVA for evaluating the effect of MLSS, TMP and mesh pore size on
effluent turbidity values measured after 60 minutes of continuous filtration.
25
Table 1. Summary of characteristic equations for constant pressure filtration laws proposed by
Hermia [17].
Fouling
Mechanism Model
Blocking
constant
Physical
Description
Schematic
representation
Complete
Blocking 1 = 1234567 )8
Pore
blocking
Standard
Blocking
1 = 12
1 + 5:;<=>7
,
, )?
Pore
constriction
Intermediate
Blocking 1 = 12
1 + )@12A )@
Pore
blocking +
surface
deposition
Cake
Filtration
1 = 12
1 + 2)*12,A
=> )*
Surface
deposition
26
Table 2. Properties of the meshes used in this study.
Product
information
Mesh
opening
(µm)
Open
area
(%)
Mesh
count
(/cm)
Thread
diameter
(µm)
Resistance
(Clean
mesh) (1/m-
1) (2)
Tap water
permeability
(L/m2.h-1.kPa-1) (3)
SaatiMil PA(1) 7 200 39 31 120 5.46 × 10⁹
1572.3
SaatiMil PA 10 135 39 46 80 5.37 × 10⁹
1597.7
SaatiMil PA 15 85 49 81 37 5.42 × 10⁹
1583.2
Saatifil PA
52/32
52 32 110 38 5.61 × 10⁹
1528.6
Saatifil PA 10/4 10 4 200 x
220
30 x 38 6.46 × 10⁹ 1328.4
(1) PAisanacronymforpolyamide
(2) ResistanceofthemeshmeasuredatTMPof5kPa
(3) 20oCnormalisedpermeabilitymeasuredatTMPof5kPa
27
Table 3. Factorial ANOVA for evaluating the effect of MLSS, TMP and mesh pore size on the
value of blocking constant for cake filtration model.
Parameters Sum of
square Mean square F P
MLSS 1.510E-06 7.552E-07 185.961 < 10E-11
TMP 6.427E-09 3.213E-09 0.791 0.470
Pore size 4.132E-08 1.033E-08 2.544 0.080
MLSS x TMP 1.056E-07 2.641E-08 6.504 0.003
MLSS x Pore size 2.153E-08 2.691E-09 0.663 0.716
TMP x Pore size 6.545E-08 8.181E-09 2.015 0.111
28
Table 4. Factorial ANOVA for evaluating the effect of MLSS, TMP and mesh pore size on
effluent turbidity values measured after 60 minutes of continuous filtration.
Parameters Sum of
square Mean square F P
MLSS 5835.006 2917.503 7.787 0.004
TMP 4923.811 2461.905 6.571 0.008
Pore size 3631.665 907.916 2.423 0.091
MLSS x TMP 2694.338 673.585 1.798 0.179
MLSS x Pore size 2977.771 372.221 0.993 0.477
TMP x Pore size 3369.520 421.190 1.124 0.399
29
Figure captions
Figure 1. Schematic diagram of the experimental setup.
Figure 2. Filtration flux profiles under different operating conditions. Colour for MLSS
concentration; Line type for applied pressure; Symbol for mesh pore size.
Figure 3. Effect of mesh pore size and MLSS concentration on final flux values at (a) 5 kPa, (b)
10 kPa and (c) 18 kPa.
Figure 4. Curve fittings for the observed flux profiles with Hermia’s models at MLSS 4 g/L,
TMP 5 kPa and mesh with 10 µm pore size with (lines: predicted data; symbols: experimental
results).
Figure 5. Effluent turbidity profiles under different operating conditions. Colour for MLSS
concentration; Line type for applied pressure; Symbol for mesh pore size.
Figure 6. Effect of mesh pore size and MLSS concentration on effluent turbidity values after 60
minute of filtration at (a) 5 kPa, (b) 10 kPa and (c) 18 kPa.
30
Figure 1. Schematic diagram of the experimental setup.
31
Figure 2. Filtration flux profiles under different operating conditions. Colour for MLSS
concentration; Line type for applied pressure; Symbol for mesh pore size.
!Time (min)0 50 100 150 200 250 300
J (L
m-2
h-1
)
10
100
1000
10000 10 µm52 µm85 µm
135 µm200 µm
5 kPa10 kPa18 kPa
4 g L-1
8 g L-1
15 g L-1
32
Mesh pore size
10 52 85 135 2000
10
20
30
40MLSS 15 g/L
Mesh pore size
10 52 85 135 2000
10
20
30
40MLSS 8 g/L
Mesh pore size
10 52 85 135 200
Flux
(L
m-2
h-1
)
0
10
20
30
40MLSS 4 g/L
(a) (b) (c)
Figure 3. Effect of mesh pore size and MLSS concentration on final flux
values at (a) 5kPa, (b) 10kpa and (c) 18kP
33
0 1 2 3 4 5
Flux
(L
m-2
h-1)
1
10
100
1000Observed dataIntermediate blocking
0 1 2 3 4 5
Flux
(L
m-2
h-1)
10
100
1000
Observed dataCake filtration
Time (h)Fl
ux
(Lm
-2h-1
)
0.001
0.01
0.1
1
10
100
1000Observed dataStandard blocking
0.001
0.01
0.1
1
10
100
1000 Observed dataComplete blocking
Flux
(L
m-2
h-1)
Figure 4. Curve fittings for the observed flux profiles with Hermia’s models at MLSS 4 g/L,
TMP 5 kPa and mesh with 10 µm pore size with (lines: predicted data; symbols: experimental
results).
34
Figure 5. Effluent turbidity profiles under different operating conditions. Colour for MLSS
concentration; Line type for applied pressure; Symbol for mesh pore size.
!Time (min)0 50 100 150 200 250 300
Turb
idity
(NTU
)
1
10
100
1000
1000010 µm52 µm85 µm
135 µm200 µm
5 kPa10 kPa18 kPa
4 g L-1
8 g L-1
15 g L-1
35
Mesh pore size
10 52 85 135 2000
60
120
180
240
MLSS 15 g/L
(c)
Mesh pore size
10 52 85 135 2000
10
20
30
40
MLSS 8 g/L
(b)
Mesh pore size
10 52 85 135 200
Turb
idity
(NTU
)
0
10
20
30
MLSS 4 g/L
(a)
Figure 6. Effect of mesh pore size and MLSS concentration on effluent turbidity values after 60
minute of filtration at (a) 5kPa, (b) 10kpa and (c) 18kPa.
36
Supplementary material
Table captions
Table S1. Operational conditions applied during filtration experiments.
Table S2. Factorial ANOVA for evaluating the effect of MLSS, TMP and mesh pore size on
final flux values.
Table S3. Factorial ANOVA for evaluating the effect of MLSS, TMP and mesh pore size on
effluent turbidity values measured after 300 minutes of continuous filtration (i.e. at the end of
experiment).
Figure captions
Figure S1. Adjusted R2 (R2adj) values for curve fitting analysis of Hermia's models.
Figure S2. RMSE values for curve fitting analysis of Hermia's models.
Figure S3. Effluent TSS values under different operating conditions applied. Colour for MLSS
concentration; Line type for applied pressure; Symbol for mesh pore size.
37
Table S1. Operational conditions applied during filtration experiments.
Experiment
Number
MLSS
(g/L)
PORE
SIZE (µm)
TMP
(kPa)
1, 2, 3 4 10 5, 10, 18
4, 5, 6 4 52 5, 10, 18
7, 8, 9 4 85 5, 10, 18
10, 11, 12 4 135 5, 10, 18
13, 14, 15 4 200 5, 10, 18
16, 17, 18 8 10 5, 10, 18
19, 20, 21 8 52 5, 10, 18
22, 23, 24 8 85 5, 10, 18
25, 26, 27 8 135 5, 10, 18
28, 29, 30 8 200 5, 10, 18
31,32, 33 15 10 5, 10, 18
34, 35, 36 15 52 5, 10, 18
37, 38, 39 15 85 5, 10, 18
40, 41, 42 15 135 5, 10, 18
43, 44, 45 15 200 5, 10, 18
38
Table S2. Factorial ANOVA for evaluating the effect of MLSS, TMP and mesh pore size on
final flux values.
Parameters Sum of
square Mean square F P
MLSS 3771.906 1885.953 180.387 < 10E-10
TMP 26.827 13.414 1.283 0.304
Pore size 17.336 4.334 0.415 0.796
MLSS x TMP 85.800 21.450 2.052 0.135
MLSS x Pore size 79.254 9.907 0.948 0.507
TMP x Pore size 80.453 10.057 0.962 0.497
39
Table S3. Factorial ANOVA for evaluating the effect of MLSS, TMP and mesh pore size on
effluent turbidity values measured after 300 minutes of continuous filtration (i.e. at the end of
experiment).
Parameters Sum of
square Mean square F P
MLSS 5748.361 2874.181 5.292 0.017
TMP 6011.720 3005.860 5.535 0.015
Pore size 4839.088 1209.772 2.228 0.112
MLSS x TMP 2940.163 735.041 1.353 0.294
MLSS x Pore size 4309.949 538.744 0.992 0.478
TMP x Pore size 4834.278 604.285 1.113 0.405
40
Figure S1. Adjusted R2 (R2adj) values for curve fitting analysis of Hermia's models.
41
Figure S2. RMSE values for curve fitting analysis of Hermia's models.
42
Figure S3. Effluent TSS values under different operating conditions applied. Colour for MLSS
concentration; Line type for applied pressure; Symbol for mesh pore size.
!Time (min)0 20 40 60 80 100 120 140
TSS
(mg
L-1)
10
100
1000
1000010 µm52 µm85 µm
135 µm200 µm
5 kPa10 kPa18 kPa
4 g L-1
8 g L-1
15 g L-1