Embed Size (px)
Citation preview
The Effect of Organic Loading on Process Performance and Membrane Fouling in a
Submerged Membrane Bioreactor Treating Municipal Wastewater
by
R. Shane Trussell1, Ph.D., P.E.
Rion P. Merlo2, Ph.D., P.E.
Slawomir W. Hermanowicz3, Ph.D.
and David Jenkins4, Ph.D.
1 Corresponding author: [email protected] Tel. 626-486-0560 x103 Fax. 626-486-0571, Principal, Trussell Technologies, Inc., 232 N. Lake Ave., Ste. 300, Pasadena, CA 91101 2 Senior Engineer, Brown and Caldwell, 201 N. Civic Dr., Ste. 115, Walnut Creek, CA 94596 3 Associate Professor, Department of Civil and Environmental Engineering, University of California, Berkeley, CA 94720 4 Professor in the Graduate School, Department of Civil and Environmental Engineering, University of California, Berkeley
2
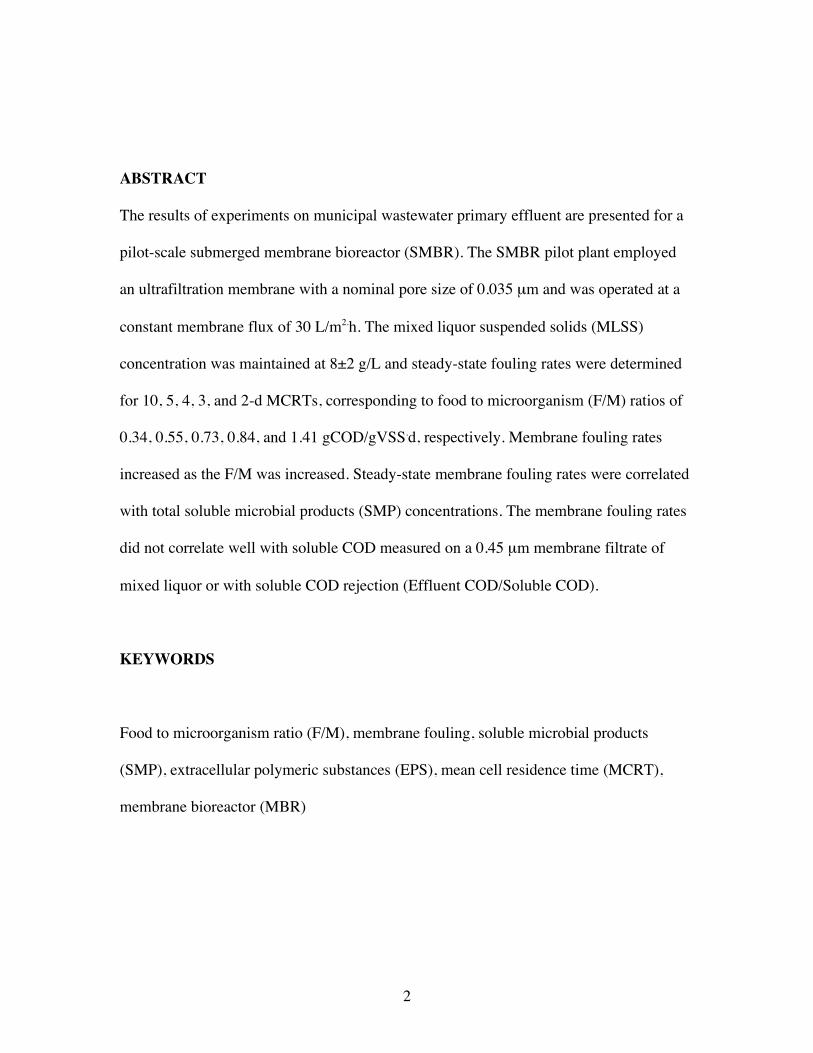
ABSTRACT
The results of experiments on municipal wastewater primary effluent are presented for a
pilot-scale submerged membrane bioreactor (SMBR). The SMBR pilot plant employed
an ultrafiltration membrane with a nominal pore size of 0.035 µm and was operated at a
constant membrane flux of 30 L/m2.h. The mixed liquor suspended solids (MLSS)
concentration was maintained at 8±2 g/L and steady-state fouling rates were determined
for 10, 5, 4, 3, and 2-d MCRTs, corresponding to food to microorganism (F/M) ratios of
0.34, 0.55, 0.73, 0.84, and 1.41 gCOD/gVSS.d, respectively. Membrane fouling rates
increased as the F/M was increased. Steady-state membrane fouling rates were correlated
with total soluble microbial products (SMP) concentrations. The membrane fouling rates
did not correlate well with soluble COD measured on a 0.45 µm membrane filtrate of
mixed liquor or with soluble COD rejection (Effluent COD/Soluble COD).
KEYWORDS
Food to microorganism ratio (F/M), membrane fouling, soluble microbial products
(SMP), extracellular polymeric substances (EPS), mean cell residence time (MCRT),
membrane bioreactor (MBR)
3
BACKGROUND
A submerged membrane bioreactor (SMBR) is a biological wastewater treatment process
in which ultrafiltration or microfiltration membranes immersed in the mixed liquor are
used for solid-liquid separation. The effect of biological conditions on reactor design,
process performance and membrane performance is poorly defined. The purpose of this
work was to determine the effect of biological conditions on mixed liquor properties and
their effects on the process and membrane performance.
Process Limitation: The principal SMBR process limitation is membrane fouling. When
a conventional activated sludge system with a gravity secondary clarifier (CAS) fails, the
effluent quality deteriorates. When an SMBR process fails, the effluent quality is
typically unaffected, but the effluent flow rate decreases due to severe membrane fouling.
Regardless of mean cell or hydraulic residence times, SMBR effluents contain
undetectable total suspended solids (TSS) concentrations (< 2 mg/L) and have low
chemical oxygen demand (COD) because of the filtration provided by the membrane
(Adham et al., 2001, Bouhabila et al., 2001, Bouhabila et al., 1998, Cicek et al., 2001,
Cicek et al., 1998, Cote et al., 1997, Cote et al., 1998, Muller et al., 1995, Rosenberger et
al., 2002, Trussell et al., 2000, Xing et al., 2000). At frequent intervals (min) in a
vacuum-driven SMBR operating cycle, the vacuum is released and most of the materials
accumulated on the membrane surface are removed by coarse bubble aeration, termed
relaxation. In an alternate mode of operation, product water is pumped in reverse back
through the membrane to encourage increased cake removal. Regardless of the mode of
operation, some TSS, colloidal particles and macromolecules remain on the membrane
4
and can lead to declining membrane permeability over time (Bouhabila et al., 2001,
Chang et al., 2002, Cicek et al., 2002, Tardieu et al., 1998). At much longer intervals
(months), the membrane is chemically cleaned to remove accumulated materials and
restore permeability. Rapid loss of membrane permeability increases cleaning frequency,
increases operating and maintenance (O&M) costs, decreases membrane lifetime and
may reduce plant capacity (Sablani et al., 2001). The fouling rate (loss of membrane
permeability over time) is a critical design parameter for determining whether an SMBR
is an economically feasible treatment alternative (Kaiya et al., 2000).
Rationale: To maintain membrane permeability, the SMBR process is limited to
maximum mixed liquor suspended solids (MLSS) concentrations of 10 - 20 g/L (Cote et
al., 1998, Mourato et al., 1999, Shimizu et al., 1996, Trussell et al., 2005, Ueda et al.,
1997). Current practice is to operate the SMBR process at constant MLSS levels of
approximately 10 g/L (typically 8 gVSS/L). A cost effective SMBR design requires
optimization of the process tank volume where a small process tank will provide
immediate capital cost savings, but will increase the organic loading (F/M). High F/M
may increase the O&M costs for maintaining membrane permeability (Cicek et al., 2001,
Trussell et al., 2005). The goal of this research was to provide a fundamental
understanding of SMBR performance at a range of F/M values so that economical design
and operation, especially at high F/M, would be possible.
5
MATERIALS AND METHODS
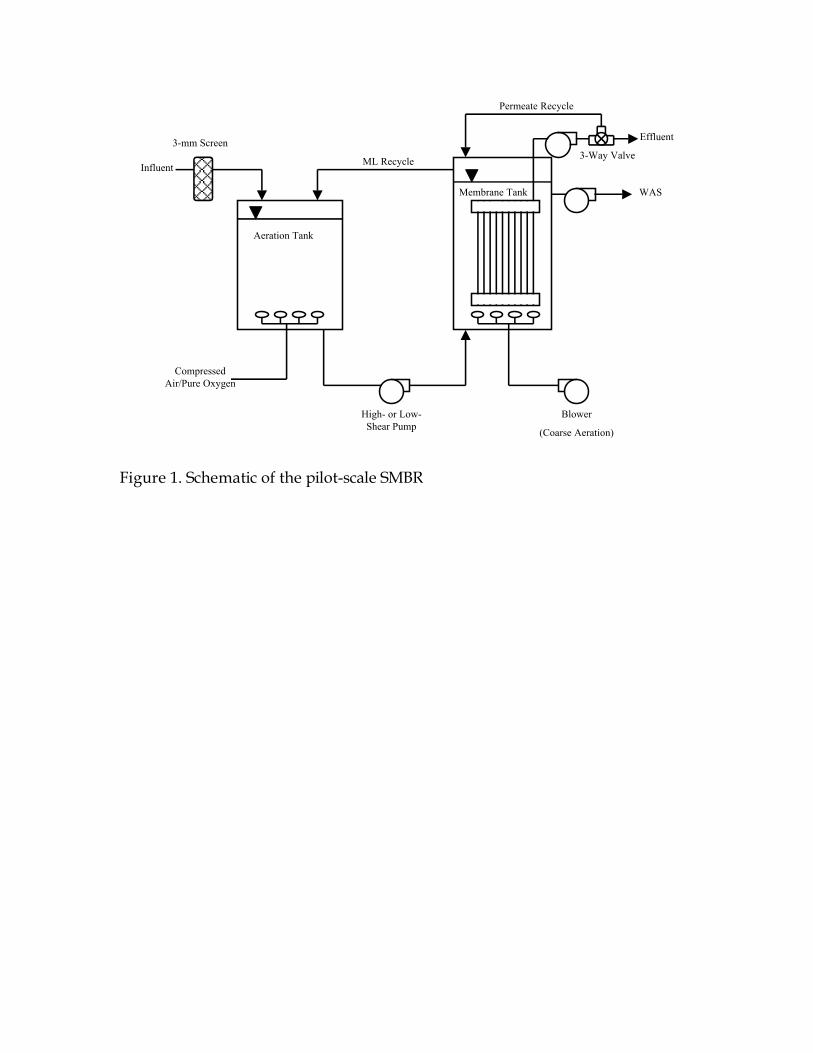
Pilot-Scale Submerged Membrane Bioreactor (SMBR): A pilot-scale SMBR (Figure 1),
designed to operate at a range of hydraulic residence times (θH) while maintaining a
constant membrane flux of 30.6 L/m2.h (LMH), was custom-built by ZENON
Environmental Services Inc. (Oakville, Ontario, Canada). The reactor working volume
was 1,514 L. One full-scale ultrafiltration module (ZENON 500c) was immersed in the
membrane tank and intermittent (10 s on/10s off) coarse-bubble aeration of 14 L/s
(G=630 s-1) was used to control membrane fouling. The membrane had a nominal pore
size of 0.035 µm and an absolute cutoff of 0.1 µm.
The membrane was operated at a constant, but higher, flow rate (flux) than required for
maintaining the desired θH. θH was controlled by recycling permeate through the system.
θH was adjusted to maintain an MLSS concentration of 8 g/L at each operating condition
in the range from 1 to 4 h. To minimize the effect of the permeate recycle on membrane
performance, the mixed liquor recycle rate, QR, between the aeration tank and the
membrane tank was constant and high, ranging between 5 and 26 Q with the highest
QR/Q being used at the highest θH-(highest permeate recycle flow). Because the
recirculation rate was high at all times, the MLSS concentrations were very similar in
both tanks with the MLSS concentration in the membrane tank 1.2 to 1.04 times the
MLSS concentration in the aeration tank.
The aeration tank was equipped with fine-bubble air diffusers. Aeration air was
supplemented with pure oxygen to maintain adequate dissolved oxygen (DO)
6
concentrations at the higher organic loading rates. All liquid stream flow data was
collected electronically and periodically checked using a graduated cylinder and
stopwatch. Vacuum pressure was measured with a pressure transducer and verified by an
analog vacuum gauge. Temperature was monitored using an in-tank analog thermometer
and was periodically verified using a mercury thermometer.
Feedwater Characteristics: The pilot-scale SMBR was fed with primary effluent from
the Southeast Water Pollution Control Plant (SEP), San Francisco, CA (Table 1). A
centrifugal pump was immersed in the SEP primary effluent channel and operated
continuously. A level sensor in the aeration tank opened and closed a feed valve to
maintain the desired liquid operating volume. The SMBR was shutdown for 5 h
approximately once each week while the feed line was soaked with a sodium
hypochlorite solution (2 g/L) to prevent biofilm growth that could seed the SMBR with
filaments (Gabb et al., 1989) and alter the feed composition.
Reactor Operation and Membrane Performance: The reactor was operated for 3 MCRTs
prior to steady-state data collection at each MCRT tested. ML DO concentration was ≥2
mg/L and Na2CO3 was added to the feed wastewater to control the aeration basin pH to
≥6.5 during nitrification. Sludge wasting was performed on a continuous basis by
pumping from the upper portion of the membrane tank.
The effects of F/M on membrane fouling were determined by holding the membrane flux
and MLSS concentration constant for all conditions tested. The steady-state membrane-
7
fouling rate, defined as the specific flux decline at 20oC over a 2-week period, was
determined at each MCRT once steady-state conditions were achieved. The membranes
were chemically cleaned with a 1,000 mg/L NaOCl solution for 12 h between each
operating condition.
Foam Control: The SMBR process traps microorganisms larger than the membrane pores
including those that float and may cause foam. Biological foaming caused by
nocardioform bacteria was controlled in the SMBR by mechanical means (Figure 2)
rather than with an NaOCl surface spray (Trussell et al., 2000). When the membrane tank
intermittent aeration was on, its liquid level was higher than that in the ML recycle line;
when the membrane tank intermittent aeration was off, its liquid level was lower than that
in the ML recycle line. This cycling of liquid levels pulled the foam into the ML recycle
line, mixing it into solution as it fell into the aeration tank where foaming was controlled
by continuous surface mixing.
MLSS and COD: MLSS and effluent COD were measured by Standard Methods,
Methods 2540D and 5220D, respectively (APHA, 1998). Mixed liquor was filtered
through a 0.45 µm membrane and the filtrate COD was defined as soluble COD.
Soluble Microbial Products (SMP): ML samples were collected, immediately cooled to
4oC, and analyzed within 2 h from the time of collection. Although SMP contains highly
complex organic molecules, polysaccharides and proteins were used to quantify and
better characterize the SMP because they comprise a major component of SMP found in
8
the literature (Barker and Stuckey, 1999). The untreated ML was centrifuged for 15 min
at 12,000 g, and the protein and carbohydrate concentrations were determined on the
supernatant to represent the soluble fraction (Soluble Microbial Products, SMP).
Supernatant carbohydrate and protein concentrations were measured colorimetrically by
the methods of Dubois et al. (1956) and Lowry et al. (1951), respectively.
RESULTS AND DISCUSSION
The pilot-scale SMBR was operated at 10, 5, 4, 3, and 2 d MCRTs to evaluate the effects
of F/M on process and membrane performance. Table 2 summarizes the pilot-scale
SMBR operating conditions. The highest F/M tested was 1.41 gCOD/gVSS.d (2-d
MCRT) and the lowest F/M tested was 0.34 gCOD/gVSS.d (10-d MCRT). Reported
SMBR F/Ms are typically much lower than those tested here. However, Ng and
Hermanowicz (2005) operated an SMBR on synthetic wastewater at F/Ms up to 11
gCOD/gVSS.d and Ognier et al. (2004) operated an external MBR (EMBR) on synthetic
wastewater at an F/M of 1.7 gCOD/gVSS.d.
Process Performance: The median MLSS concentrations for the pilot-scale SMBR
(Table 3) ranged from 6.9 to 8.6 g/L and the median percent volatile fraction was 85.5%
at all conditions tested. Effluent TSS concentrations were always below the detection
limit of 2 mg/L, indicating good membrane integrity.
The pilot-scale SMBR reduced the influent COD (median= 345 mg/L) to a median
effluent COD concentration (eff COD) of 24 mg/L (93% removal) and a 90th percentile
9
value of 32 mg/L at all conditions tested. In previous SMBR experiments on municipal
wastewater, Trussell et al. (2005) obtained an eff COD concentration of 22 mg/L and a
90th percentile value of 28 mg/L over the range of MCRT values from 1.5 d to 35 d. At
MCRTs below 2 d, Trussell et al. (2005) found that the eff COD increased to a median
value of 30 mg/L and a 90th percentile value of 32 mg/L. At an MCRT of 2 d, Cicek et al.
(2001) found that the median eff COD increased to 23 mg/L from 3.5 mg/L at a 5-d
MCRT treating synthetic wastewater. However, Holler and Trosch (2001) operated an
EMBR process on synthetic wastewater and found that overall COD removal was 95 to
99% and independent of F/M. For the data presented here, eff COD concentrations were
relatively constant (~24 mg/L) for MCRTs greater than 2 d (Table 4) while at 2-d MCRT
they increased to 34 mg/L. The soluble COD was relatively constant, ranging from 56 to
78 mg/L, and this is consistent with published literature for MCRTs less than 10 d (Cicek
et al., 2001). The ultrafiltration membrane rejected between 56 and 67 % of the soluble
COD in the mixed liquor, confirming that membrane filtration retains a portion of the
soluble organics in the bioreactor (Xing et al., 2003). Complete nitrification (NH4+ < 1
mg-N/L) occurred at all conditions except at 2-d MCRT (Table 4) where the effluent
NH4+ concentration was 7.0 mg/L.
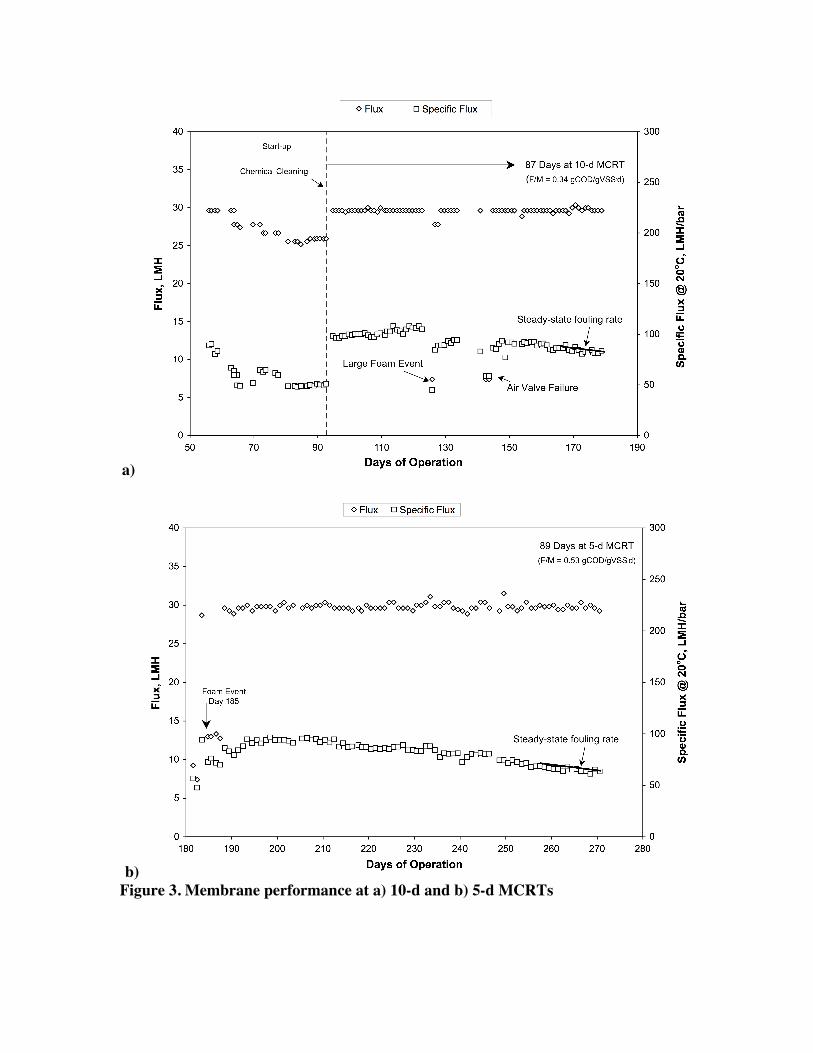
Membrane Performance: Figure 3 shows the SMBR membrane performance at a 10-d
MCRT (F/M = 0.34 gCOD/gVSS.d). The 90-d start-up period allowed adequate time for
conditioning the new membrane and establishing stable SMBR pilot operation. The
membrane was chemically cleaned on Day 93 prior to the start of the 10-d MCRT
operating period. Membrane flux was constant (30 LMH) except for the periods
10
immediately after foaming incidents and air valve failures (Days 124 and 135). The
specific flux decreased to 74% of its initial value after 87 d of operation and the steady-
state fouling rate at 20oC was 0.18 LMH/bar.d.
Membrane performance results for the 5-d MCRT (F/M = 0.55 gCOD/gVSS.d) are also
shown in Figure 3. Initially, residual NaOCl from chemical cleaning caused foaming and
the membrane flux was reduced to 13 LMH until 4 d after last foaming event (Day 185).
After stabilizing, the reactor was operated for 82 d at 30 LMH by which time the specific
flux had decreased to 67% of its initial value. The steady-state fouling rate at 20oC was
0.39 LMH/bar.d.
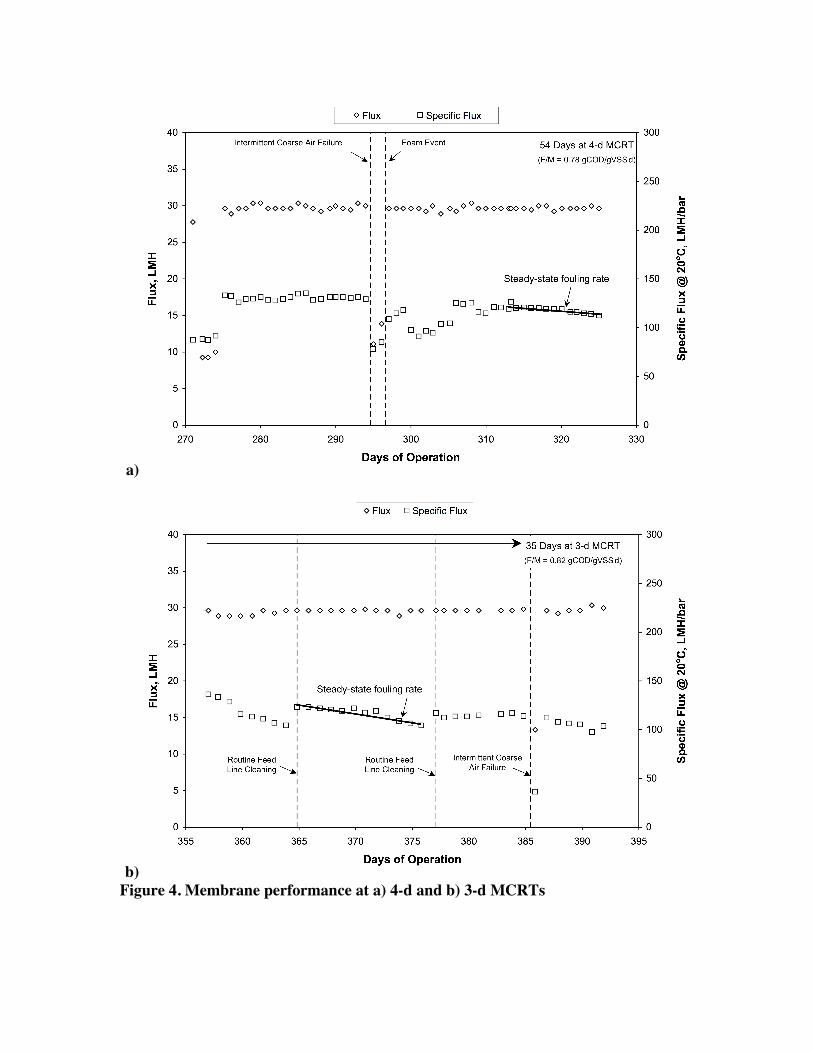
Figure 4 presents membrane performance results at the 4-d MCRT (F/M = 0.73
gCOD/gVSS.d). The membrane flux and coarse airflow rate were reduced following the
chemical cleaning (Day 180) and when malfunctions of the intermittent air valve caused
foaming (Days 295 to 297). The reactor was operated for 54 d by which time the specific
flux had decreased to 84% of its initial value. The steady-state fouling rate at 20oC was
0.59 LMH/bar.d.
The routine weekly feed line cleaning with NaOCl solution strongly influenced
membrane performance at the 3-d MCRT (F/M = 0.84 gCOD/gVSS.d) (Figure 4). The
specific flux increased significantly following each feed line cleaning. The weekly
cessations of permeate production from the SMBR provided an extended membrane
relaxation that helped to restore the membrane permeability. It is also possible, that at this
11
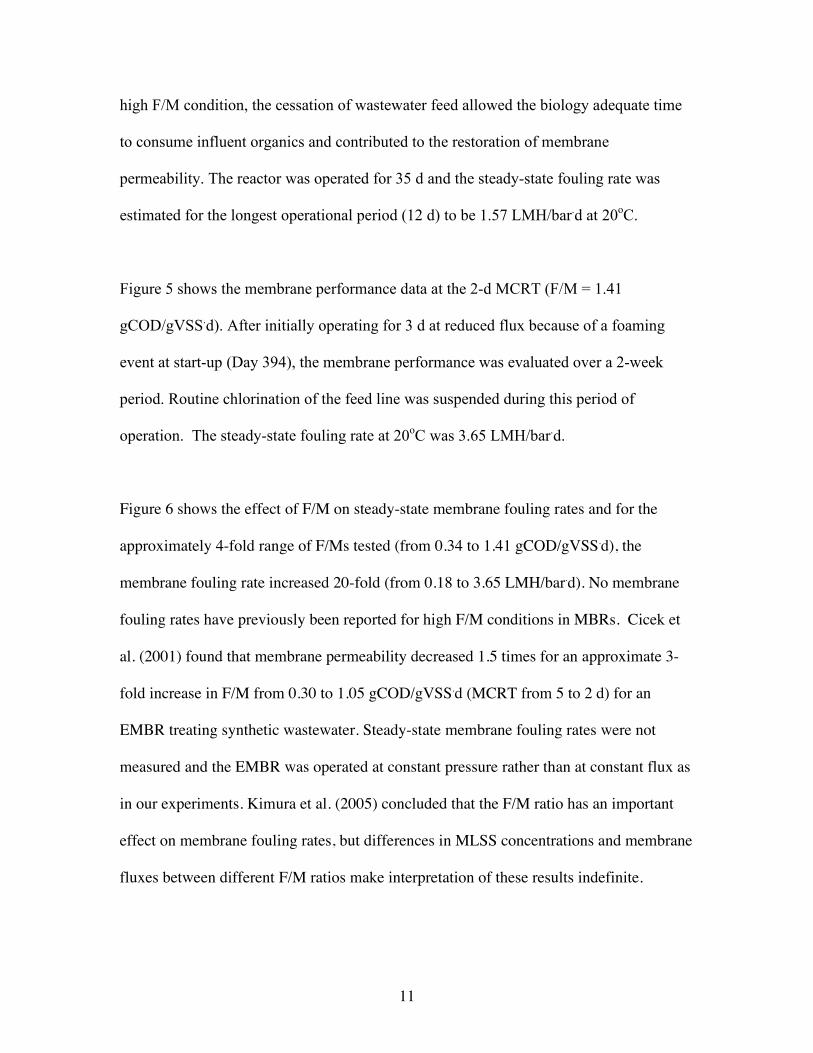
high F/M condition, the cessation of wastewater feed allowed the biology adequate time
to consume influent organics and contributed to the restoration of membrane
permeability. The reactor was operated for 35 d and the steady-state fouling rate was
estimated for the longest operational period (12 d) to be 1.57 LMH/bar.d at 20oC.
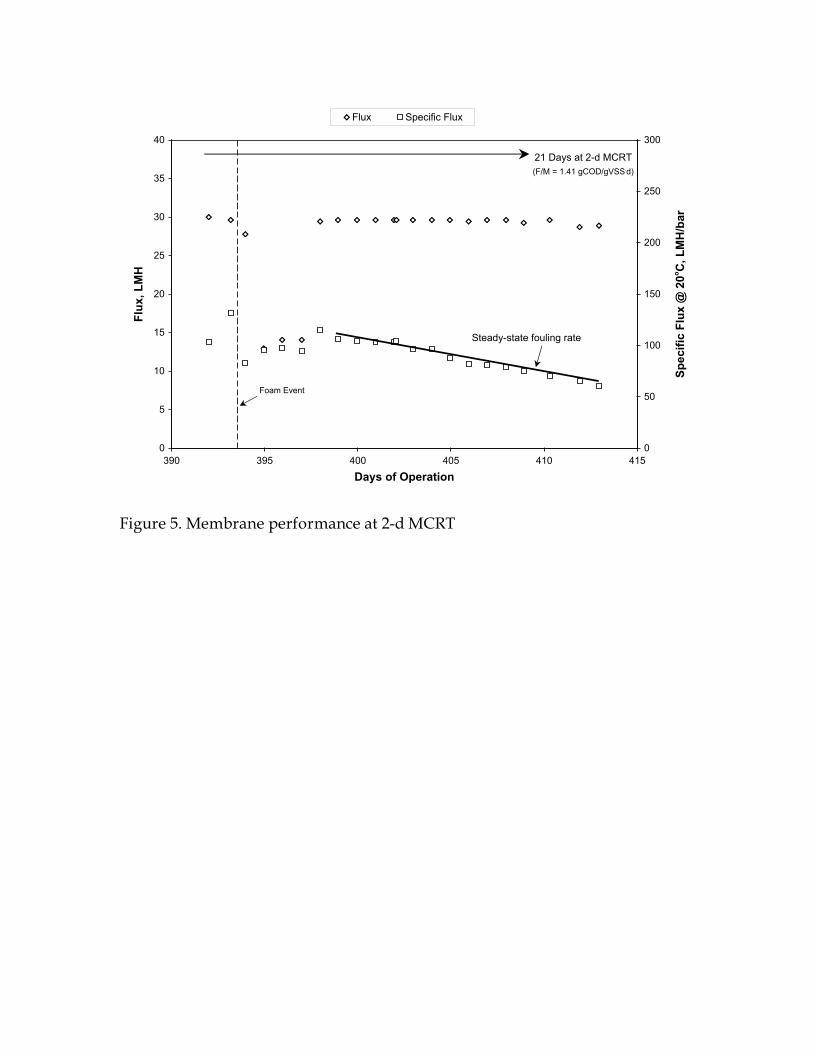
Figure 5 shows the membrane performance data at the 2-d MCRT (F/M = 1.41
gCOD/gVSS.d). After initially operating for 3 d at reduced flux because of a foaming
event at start-up (Day 394), the membrane performance was evaluated over a 2-week
period. Routine chlorination of the feed line was suspended during this period of
operation. The steady-state fouling rate at 20oC was 3.65 LMH/bar.d.
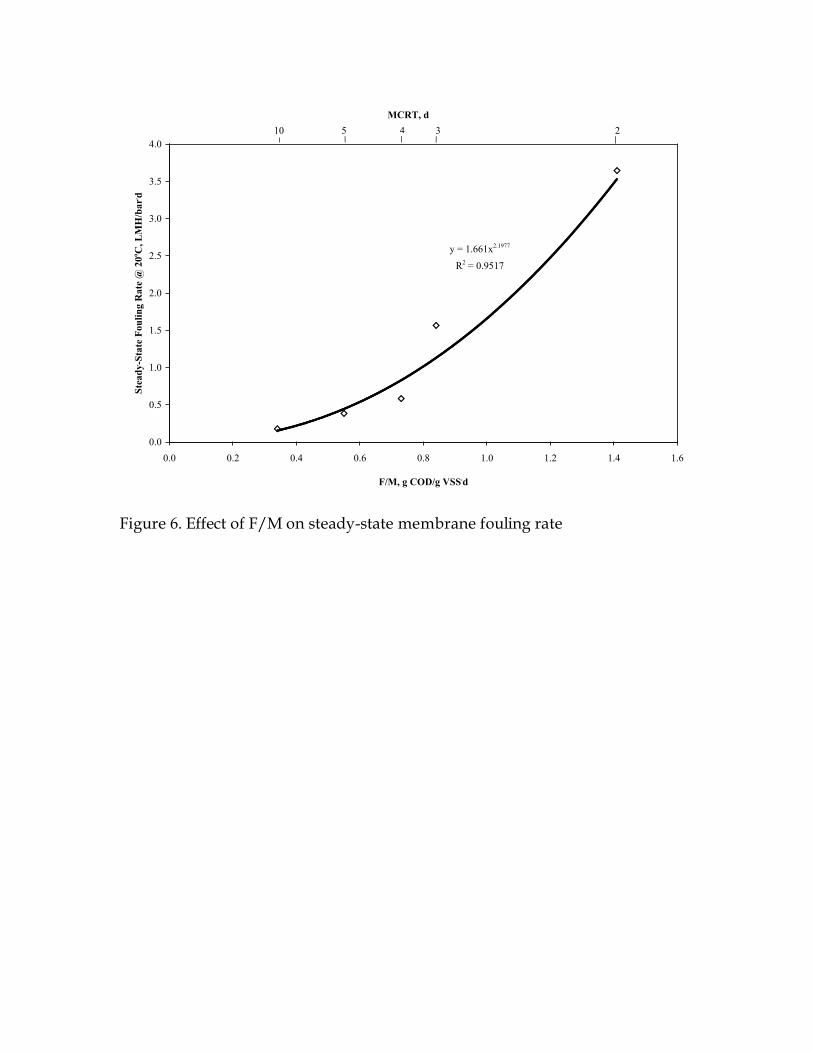
Figure 6 shows the effect of F/M on steady-state membrane fouling rates and for the
approximately 4-fold range of F/Ms tested (from 0.34 to 1.41 gCOD/gVSS.d), the
membrane fouling rate increased 20-fold (from 0.18 to 3.65 LMH/bar.d). No membrane
fouling rates have previously been reported for high F/M conditions in MBRs. Cicek et
al. (2001) found that membrane permeability decreased 1.5 times for an approximate 3-
fold increase in F/M from 0.30 to 1.05 gCOD/gVSS.d (MCRT from 5 to 2 d) for an
EMBR treating synthetic wastewater. Steady-state membrane fouling rates were not
measured and the EMBR was operated at constant pressure rather than at constant flux as
in our experiments. Kimura et al. (2005) concluded that the F/M ratio has an important
effect on membrane fouling rates, but differences in MLSS concentrations and membrane
fluxes between different F/M ratios make interpretation of these results indefinite.
12
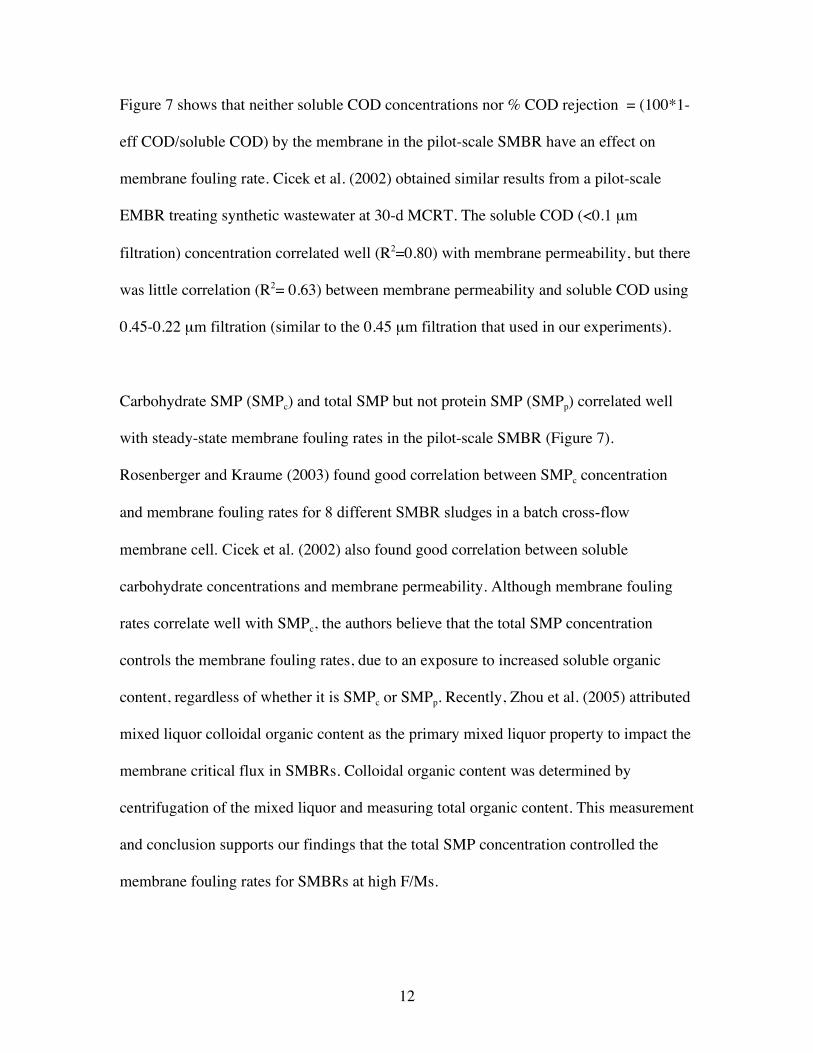
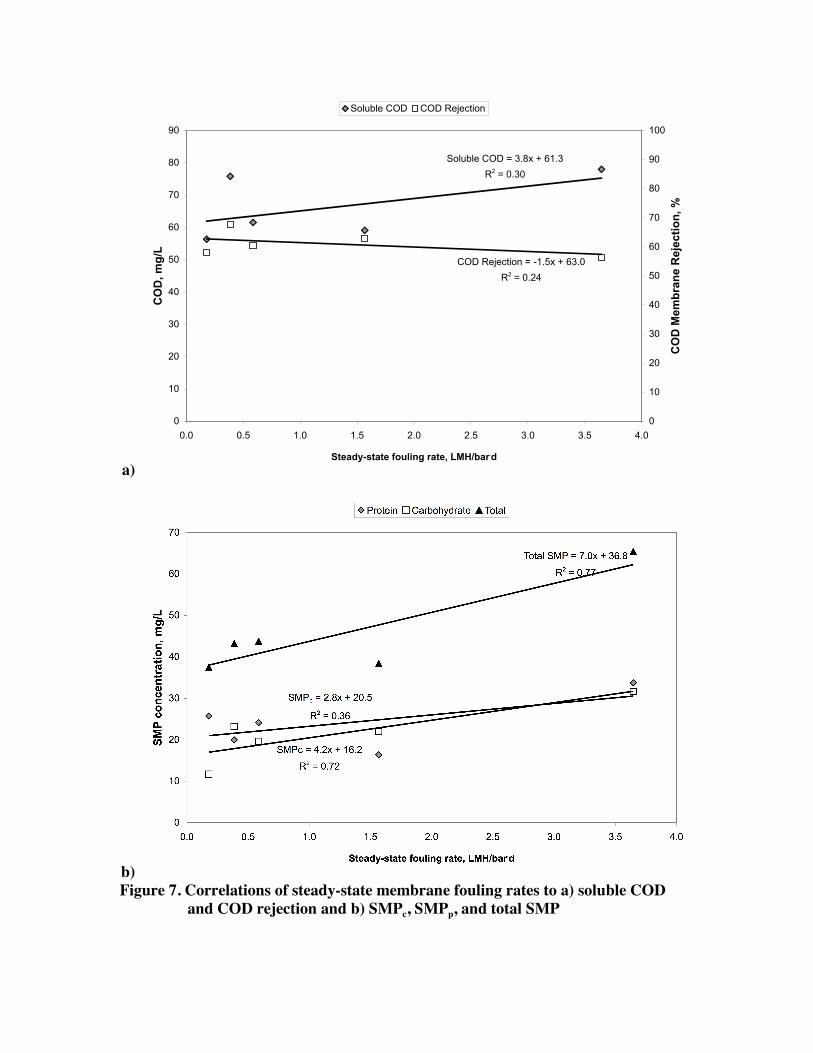
Figure 7 shows that neither soluble COD concentrations nor % COD rejection = (100*1-
eff COD/soluble COD) by the membrane in the pilot-scale SMBR have an effect on
membrane fouling rate. Cicek et al. (2002) obtained similar results from a pilot-scale
EMBR treating synthetic wastewater at 30-d MCRT. The soluble COD (<0.1 µm
filtration) concentration correlated well (R2=0.80) with membrane permeability, but there
was little correlation (R2= 0.63) between membrane permeability and soluble COD using
0.45-0.22 µm filtration (similar to the 0.45 µm filtration that used in our experiments).
Carbohydrate SMP (SMPc) and total SMP but not protein SMP (SMPp) correlated well
with steady-state membrane fouling rates in the pilot-scale SMBR (Figure 7).
Rosenberger and Kraume (2003) found good correlation between SMPc concentration
and membrane fouling rates for 8 different SMBR sludges in a batch cross-flow
membrane cell. Cicek et al. (2002) also found good correlation between soluble
carbohydrate concentrations and membrane permeability. Although membrane fouling
rates correlate well with SMPc, the authors believe that the total SMP concentration
controls the membrane fouling rates, due to an exposure to increased soluble organic
content, regardless of whether it is SMPc or SMPp. Recently, Zhou et al. (2005) attributed
mixed liquor colloidal organic content as the primary mixed liquor property to impact the
membrane critical flux in SMBRs. Colloidal organic content was determined by
centrifugation of the mixed liquor and measuring total organic content. This measurement
and conclusion supports our findings that the total SMP concentration controlled the
membrane fouling rates for SMBRs at high F/Ms.
13
CONCLUSIONS
A pilot-scale SMBR was operated at high F/M to evaluate process and membrane
performance. Over the range of F/M tested (0.34 to 1.41 gCOD/gVSS.d), effluent quality
was consistently excellent with CODs ranging from 22 to 34 mg/L and effluent TSS
levels below the detection limit (< 2 mg/L). Steady-state membrane fouling rates
increased 20-fold over a 4-fold increase in F/M. Soluble COD (0.45 µm membrane
filtrate of ML) and soluble COD rejection did not correlate with steady-state membrane
fouling rates while total SMP and SMPc concentrations correlated well with steady-state
membrane fouling rates. Although biological foaming is ubiquitous in systems with a
“trapping environment” like that of the SMBR (Jenkins et al., 2004, Narayanan, 2003),
mechanical mixing of the foam layer into solution controlled biological foaming in this
pilot-scale SMBR.
14
ACKNOWLEDGEMENTS
The project was funded in part by Water Environment Research Foundation (WERF)
Project No. 01-CTS-19-UR. The authors thank the following: Zenon Environmental
Services, Inc. for the pilot SMBR and technical support; the City and County of San
Francisco SEP Engineering, Operations, Maintenance, and Laboratory staff for support
and technical assistance; Ms. Eileen Deng for research assistance. Shane Trussell and
Rion Merlo were graduate students at the University of California at Berkeley when this
research was preformed.
REFERENCES
Adham, S., Gagliardo, P., Boulos, L., Oppenheimer, J. and Trussell, R. (2001) Feasibility
of the membrane bioreactor process for water reclamation. Water Science and
Technology, 43, 203.
APHA (1998) Standard Methods for the Examination of Water and Wastewater. 20th,
American Public Health Association, American Water Works Association, Water
Pollution Control Federation, Washington, D.C.
Barker, D. J. and Stuckey, D. C. (1999) A review of soluble microbial products (SMP) in
wastewater treatment systems. Water Research, 33, 3063.
Bouhabila, E., Ben Aim, R. and Buisson, H. (2001) Fouling characterisation in
membrane bioreactors. Separation and Purification Technology, 22-3, 123.
Bouhabila, E. H., Ben Aim, R. and Buisson, H. (1998) Microfiltration of activated sludge
using submerged membrane with air bubbling (application to wastewater
treatment). Desalination, 118, 315.
15
Chang, I. S., Le Clech, P., Jefferson, B. and Judd, S. (2002) Membrane fouling in
membrane bioreactors for wastewater treatment. Journal of Environmental
Engineering, 128, 1018.
Cicek, N., Macomber, J., Davel, J., Suidan, M. T., Audic, J. and Genestet, P. (2001)
Effect of solids retention time on the performance and biological characteristics of
a membrane bioreactor. Water Science and Technology, 43, 43.
Cicek, N., Suidan, M. T., Ginestet, P. and Audic, J. (2002) Role of soluble organic matter
on filtration performance of a membrane bioreactor. WEFTEC, Chicago, IL.
Cicek, N., Winnen, H., Suidan, M. T., Wrenn, B. E., Urbain, V. and Manem, J. (1998)
Effectiveness of the membrane bioreactor in the biodegradation of high molecular
weight compounds. Water Research, 32, 1553.
Cote, P., Buisson, H., Pound, C. and Arakaki, G. (1997) Immersed membrane activated
sludge for the reuse of municipal wastewater. Desalination, 113, 189.
Cote, P., Buisson, H. and Praderie, M. (1998) Immersed membranes activated sludge
process applied to the treatment of municipal wastewater. Water Science and
Technology, 38, 437.
Gabb, D. M. D., Ekama, G. A., Jenkins, D. and Marais, G. V. (1989) Incidence of
Sphaerotilus-Natans in Laboratory Scale Activated-Sludge Systems. Water
Science and Technology, 21, 29.
Holler, S. and Trosch, W. (2001) Treatment of urban wastewater in a membrane
bioreactor at high organic loading rates. Journal of Biotechnology, 92, 95.
16
Jenkins, D., Richard, M. G. and Daigger, G. T. (2004) Manual on the causes and control
of activated sludge bulking, foaming, and other solids separation problems. 3rd,
Lewis Publishers, Boca Raton, LA.
Kaiya, Y., Itoh, Y., Takizawa, S., Fujita, K. and Tagawa, T. (2000) Analysis of organic
matter causing membrane fouling in drinking water treatment. Water Science and
Technology, 41, 59.
Kimura, K., Yamato, N., Yamamura, H. and Watanabe, A. (2005) Membrane fouling in
pilot-scale membrane bioreactors (MBRs) treating municipal wastewater.
Environmental Science & Technology, 39, 6293.
Mourato, D., Thompson, D., Schneider, C., Wright, N., Devol, M. and Rogers, S. (1999)
Upgrade of a sequential batch reactor into a ZenoGem. WEFTEC, New Orleans,
LA.
Muller, E. B., Stouthamer, A. H., Vanverseveld, H. W. and Eikelboom, D. H. (1995)
Aerobic domestic wastewater treatment in a pilot-plant with complete sludge
retention by cross-flow filtration. Water Research, 29, 1179.
Narayanan, B. (2003) "The Role of Dispersed Nocardioform Filaments in Activated
Sludge Foaming", Ph.D. Thesis, University of California, Berkeley, Berkeley.
Ng, H. Y. and Hermanowicz, S. W. (2005) Membrane bioreactor operation at short solids
retention times: Performance and biomass characteristics. Water Research, 39,
981.
Rosenberger, S. and Kraume, M. (2003) Parameters influencing filterability of activated
sludge in membrane bioreactors. AWWA Membrane Technology Conference,
Atlanta, GA.
17
Rosenberger, S., Kruger, U., Witzig, R., Manz, W., Szewzyk, U. and Kraume, M. (2002)
Performance of a bioreactor with submerged membranes for aerobic treatment of
municipal waste water. Water Research, 36, 413.
Sablani, S. S., Goosen, M. F. A., Al-Belushi, R. and Wilf, M. (2001) Concentration
polarization in ultrafiltration and reverse osmosis: a critical review. Desalination,
141, 269.
Shimizu, Y., Uryu, K., Okuno, Y. and Watanabe, A. (1996) Cross-flow microfiltration of
activated sludge using submerged membrane with air bubbling. Journal of
Fermentation and Bioengineering, 81, 55.
Tardieu, E., Grasmick, A., Geaugey, V. and Manem, J. (1998) Hydrodynamic control of
bioparticle deposition in a MBR applied to wastewater treatment. Journal of
Membrane Science, 147, 1.
Trussell, R. S., Adham, S., Gagliardo, P., Merlo, R. and Trussell, R. R. (2000) WERF:
Application of membrane bioreactor (MBR) technology for wastewater treatment.
WEFTEC, Anaheim, CA.
Trussell, R. S., Adham, S. and Trussell, R. R. (2005) Process limits of municipal
wastewater treatment with the submerged membrane bioreactor. Journal of
Environmental Engineering-Asce, 131, 410.
Ueda, T., Hata, K., Kikuoka, Y. and Seino, O. (1997) Effects of aeration on suction
pressure in a submerged membrane bioreactor. Water Research, 31, 489.
Xing, C. H., Tardieu, E., Qian, Y. and Wen, X. H. (2000) Ultrafiltration membrane
bioreactor for urban wastewater reclamation. Journal of Membrane Science, 177,
73.
18
Xing, C. H., Wu, W. Z., Qian, Y. and Tardieu, E. (2003) Excess sludge production in
membrane bioreactors: A theoretical investigation. Journal of Environmental
Engineering-Asce, 129, 291.
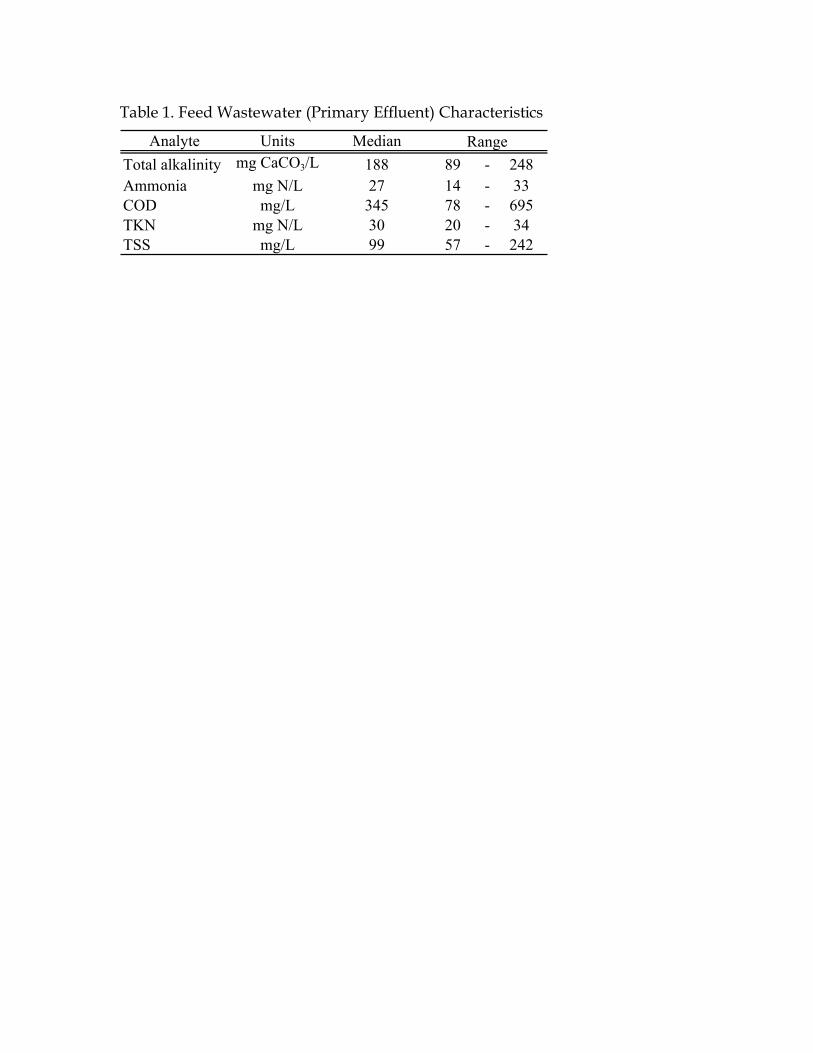
Table 1. Feed Wastewater (Primary Effluent) Characteristics
Analyte Units Median
Total alkalinity mg CaCO3/L 188 89 - 248
Ammonia mg N/L 27 14 - 33
COD mg/L 345 78 - 695
TKN mg N/L 30 20 - 34
TSS mg/L 99 57 - 242
Range
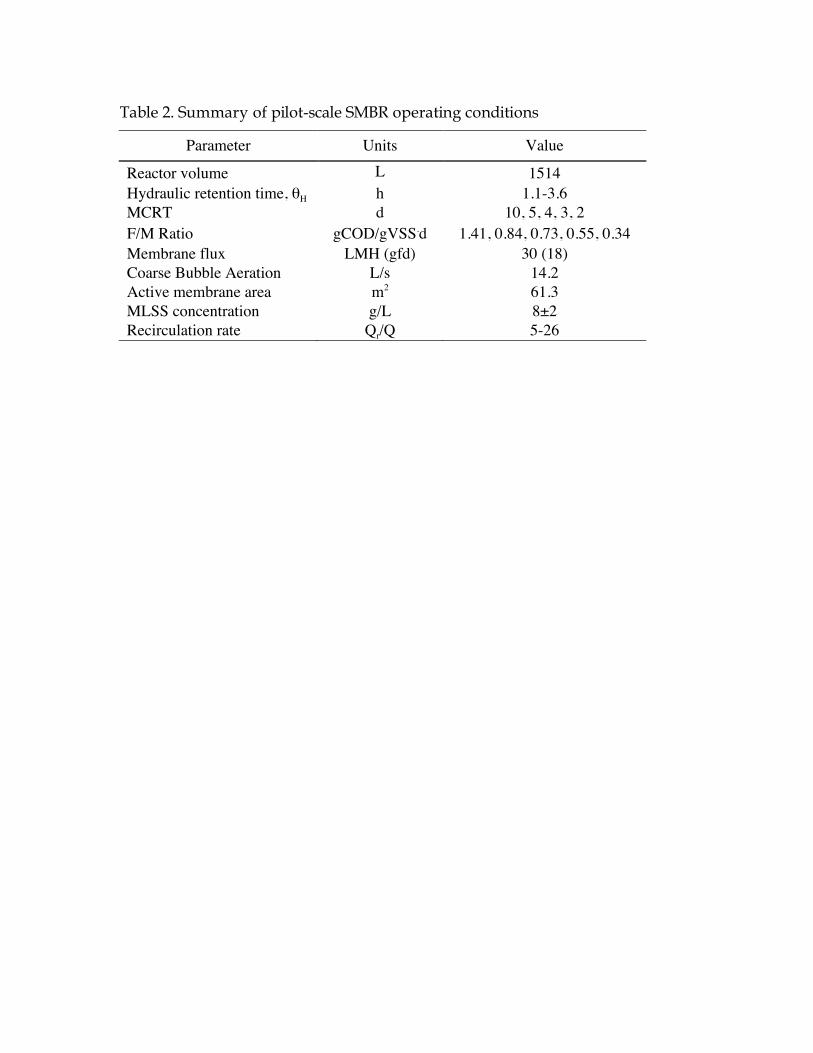
Table 2. Summary of pilot-scale SMBR operating conditions
Parameter Units Value
Reactor volume L 1514 Hydraulic retention time, θH h 1.1-3.6 MCRT d 10, 5, 4, 3, 2 F/M Ratio gCOD/gVSS.d 1.41, 0.84, 0.73, 0.55, 0.34 Membrane flux LMH (gfd) 30 (18) Coarse Bubble Aeration Rate
L/s 14.2 Active membrane area m2 61.3 MLSS concentration g/L 8±2 Recirculation rate Qr/Q 5-26
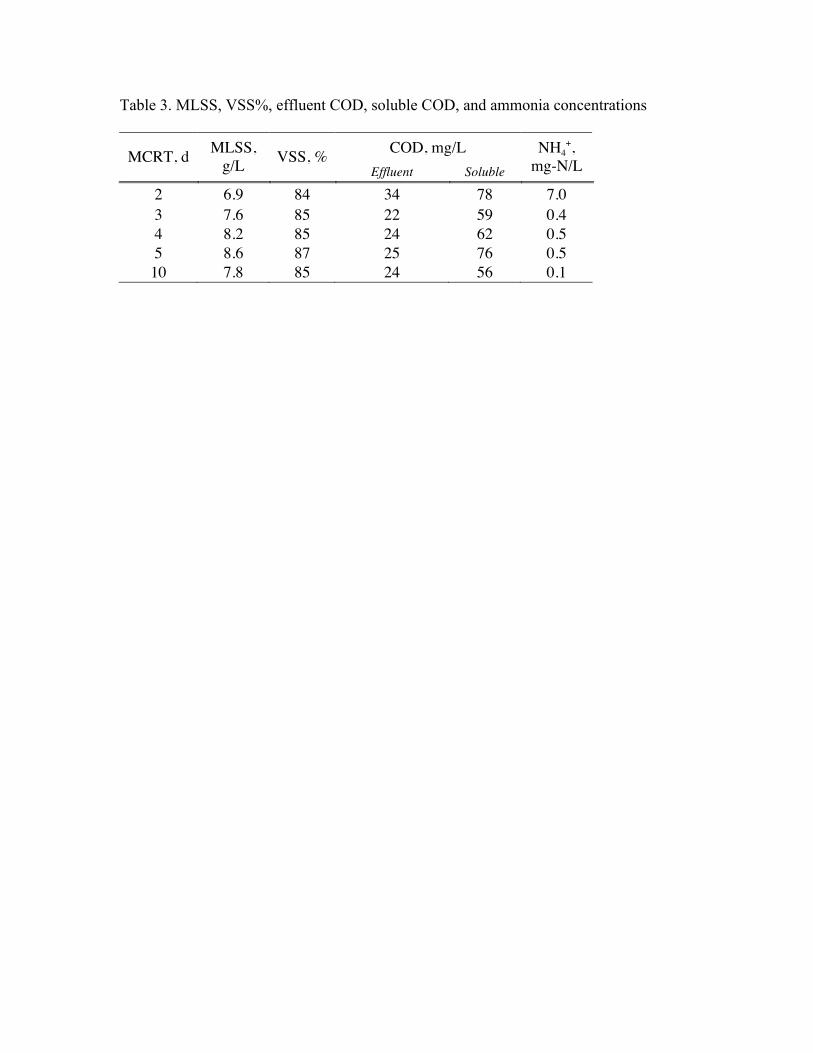
Table 3. MLSS, VSS%, effluent COD, soluble COD, and ammonia concentrations
COD, mg/L MCRT, d MLSS, g/L VSS, %
Effluent Soluble NH4
+, mg-N/L
2 6.9 84 34 78 7.0 3 7.6 85 22 59 0.4 4 8.2 85 24 62 0.5 5 8.6 87 25 76 0.5 10 7.8 85 24 56 0.1
Influent
3-mm Screen
Compressed
Air/Pure Oxygen
3-Way Valve
Effluent
WAS
Blower
(Coarse Aeration)
Aeration Tank
Membrane Tank
High- or Low-
Shear Pump
Permeate Recycle
ML Recycle
Figure 1. Schematic of the pilot-scale SMBR
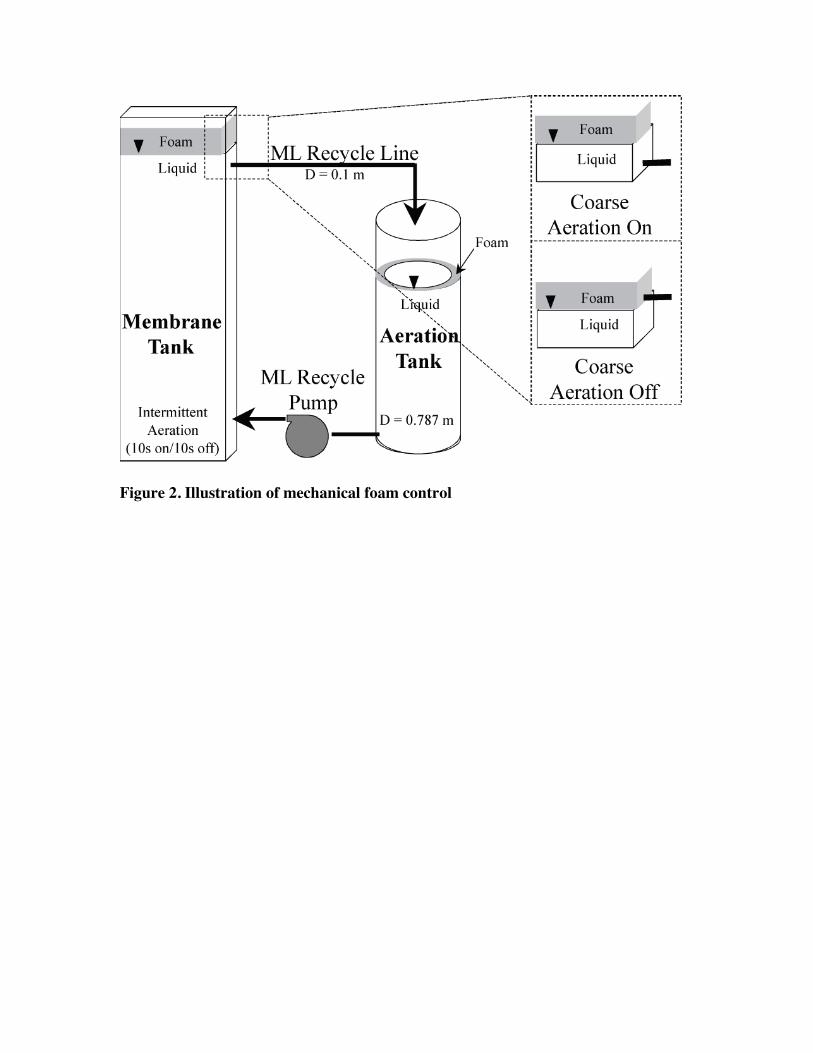
Figure 2. Illustration of mechanical foam control
a)
b) Figure 3. Membrane performance at a) 10-d and b) 5-d MCRTs
a)
b) Figure 4. Membrane performance at a) 4-d and b) 3-d MCRTs
0
5
10
15
20
25
30
35
40
390 395 400 405 410 415
Days of Operation
Flu
x, L
MH
0
50
100
150
200
250
300
Sp
ecif
ic F
lux @
20
oC
, L
MH
/bar
Flux Specific Flux
Foam Event
21 Days at 2-d MCRT
(F/M = 1.41 gCOD/gVSS.d)
Steady-state fouling rate
Figure 5. Membrane performance at 2-d MCRT
y = 1.661x2.1977
R2 = 0.9517
0.0
0.5
1.0
1.5
2.0
2.5
3.0
3.5
4.0
0.0 0.2 0.4 0.6 0.8 1.0 1.2 1.4 1.6
F/M, g COD/g VSS.d
Ste
ad
y-S
tate
Fo
uli
ng
Ra
te @
20
oC
, L
MH
/ba
r. d3 210 5 4
MCRT, d
Figure 6. Effect of F/M on steady-state membrane fouling rate
a)
Soluble COD = 3.8x + 61.3
R2 = 0.30
COD Rejection = -1.5x + 63.0
R2 = 0.24
0
10
20
30
40
50
60
70
80
90
0.0 0.5 1.0 1.5 2.0 2.5 3.0 3.5 4.0
Steady-state fouling rate, LMH/bar.d
CO
D, m
g/L
0
10
20
30
40
50
60
70
80
90
100
CO
D M
em
bra
ne R
eje
cti
on
, %
Soluble COD COD Rejection
b) Figure 7. Correlations of steady-state membrane fouling rates to a) soluble COD and COD rejection and b) SMPc, SMPp, and total SMP