Embed Size (px)
Citation preview

University of South FloridaScholar Commons
Graduate Theses and Dissertations Graduate School
7-7-2014
Two Essays on Corporate FinanceQiancheng ZhengUniversity of South Florida, [email protected]
Follow this and additional works at: https://scholarcommons.usf.edu/etd
Part of the Finance and Financial Management Commons
This Dissertation is brought to you for free and open access by the Graduate School at Scholar Commons. It has been accepted for inclusion inGraduate Theses and Dissertations by an authorized administrator of Scholar Commons. For more information, please [email protected].
Scholar Commons CitationZheng, Qiancheng, "Two Essays on Corporate Finance" (2014). Graduate Theses and Dissertations.https://scholarcommons.usf.edu/etd/5337

Two Essays on Corporate Finance
by
Qiancheng Zheng
A dissertation submitted in partial fulfillment of the requirements for the degree of
Doctor of Philosophy Department of Finance
College of Business University of South Florida
Major Professor: Ninon Sutton, Ph.D. Jianping Qi, Ph.D.
Christos Pantzalis, Ph.D. Daniel Bradley, Ph.D.
Date of Approval: July 7, 2014
Keywords: Alliances; Mergers and Acquisitions; Initial Public Offerings; Signaling; Innovations; Spillover effect
Copyright © 2014, Qiancheng Zheng

ACKNOWLEDGMENTS
I would like to take this opportunity to thank my dissertation committee: Dr. Ninon Sutton
(chair), Dr. Jianping Qi, Dr. Christos Pantzalis, and Dr. Daniel J. Bradley for all their insightful
comments and invaluable guidance. I am very grateful to my dissertation committee chair, Dr.
Ninon Sutton, for the inspiring discussions and thoughtful suggestions on my dissertation essays. I
would also like to especially thank Dr. Jianping Qi, for being extremely generous with his time and
advice. I want to thank the entire faculty of the Department of Finance at University of South
Florida and especially, Dr. Scott Besley, Dr. Delroy M. Hunter, and Dr. Lei Wedge, for their
comments and support, as well as fellow doctoral students and administrative staff for making my
doctoral study productive and delightful.
I also want to thank my grandparents, father (Guixian Zheng), mother (Wangying Chen),
sister and brother for always being there for me with their unconditional love and support. Special
thanks also go to my dear wife (Weiwei) and my lovely daughters (Vivian and Chloe) for their
patience, encouragement and love. It would have not been possible for me to go through this
journey without my family. Therefore, this dissertation is dedicated to all my family members.
i
TABLE OF CONTENTS
List of Tables ........................................................................................................................................... iii Abstract .................................................................................................................................................... .v The Value of Strategic Alliances in Acquisitions and IPOs .................................................................... 1 1. Introduction ............................................................................................................................ 1 2. Related Literature and Hypotheses Development ................................................................. 4 3. Data and Methodology ......................................................................................................... 10 3.1. Alliances sample...................................................................................................... 10 3.2. Takeover sample ..................................................................................................... 11 3.3. IPO Sample ............................................................................................................. 11 3.4. Variables .................................................................................................................. 12 3.4.1. Dependent variables ............................................................................... 12 3.4.2. Independent variables ............................................................................. 12 3.4.3. Control variables ..................................................................................... 14 3.5. Empirical methods ................................................................................................. 16 4. Empirical Results on Target Premiums ............................................................................... 17 4.1. Univariate results on target premiums ................................................................... 17 4.2. OLS Regressions of the takeover premium .......................................................... 21 4.3. Subsample analysis and robustness checks ........................................................... 24 4.4. Additional analyses ................................................................................................. 25 5. Valuation Premiums for IPOs With and Without Strategic Alliances ............................... 26 6. The Effect of Alliances on the Choice of IPO versus Acquisition .................................... 27 7. Conclusion ............................................................................................................................ 29 8. References ............................................................................................................................. 31 For Better or For Worse: The Spillover Effect of Innovation Events on Alliance Partners .............. 49 1. Introduction ........................................................................................................................... 49 2. Prior Literature on Innovations and Strategic Alliances ...................................................... 52 3. Empirical Setting .................................................................................................................... 56 4. Data and Methods .................................................................................................................. 58 4.1. Innovation sample .................................................................................................. 58 4.2. Alliances sample ..................................................................................................... 59 4.3. Event study method ............................................................................................... 60 5. The Value of Innovations and Spillover on Alliance Partners............................................. 61 5.1. Wealth effect on strategic alliance announcements .............................................. 61 5.2. Wealth effect and spillover on alliance partners around radical innovations ...... 62 5.3. Wealth effect and spillover on partners around breakthrough innovations ........ 65 5.4. Wealth effect and spillover on partners around incremental innovations ........... 66 5.5. Wealth loss and spillover on partners around FDA warning letters.................... 67
ii
5.6. Wealth loss and spillover on partners around NME drug withdrawals............... 67 6. Tests for Information Leakage/Anticipation and Return Reversals ................................... 69 7. Cross-Sectional Analyses of Innovation Abnormal Returns and Spillovers ....................... 72 8. Conclusion .............................................................................................................................. 75 9. References ............................................................................................................................... 76 Appendices .............................................................................................................................................. 99 Appendix 1.A: Variable Definitions .......................................................................................... 99 Appendix 2.A: Variable Definitions ....................................................................................... 102 Appendix 2.B: NDA Approvals by Therapeutic Potential and Chemical Type ................... 104 Appendix 2.C: FDA Glossary of Terms for Drugs ................................................................ 105
iii
LIST OF TABLES
Table 1.1: Descriptive Statistics for Target Sample, 1990-2010............................................................ 37 Table 1.2: Target Premiums by Target, Acquirer, Deal and Alliance Characteristics .......................... 39 Table 1.3: OLS Regressions of Target Premiums.................................................................................. 41 Table 1.4: Subsample Analyses for Public and Unlisted Targets .......................................................... 42 Table 1.5: IPO Valuation Regressions ................................................................................................... 46 Table 1.6: Logistic Regressions of Choice on IPO vs. Acquisition ...................................................... 47 Table 1.7: Hazard Rate Analysis of Time to IPO vs. Time to Acquisition .......................................... 48 Table 2.1: Summary of New Drug Applications and Approvals by Year ............................................ 81 Table 2.2: Market Reaction to Strategic Alliances Announcements ..................................................... 82 Table 2.3: Wealth Effect of Radical Innovation and Spillover on Partners ......................................... 83 Table 2.4: Wealth Effect of Breakthrough Innovation and Spillover on Partners .............................. 85 Table 2.5: Wealth Effect of Incremental Innovation and Spillover on Partners ................................. 85 Table 2.6: Wealth Loss of FDA Warning Letters and Spillover on Partners....................................... 86 Table 2.7: Wealth Loss of NME Drug Withdrawals and Spillover on Partners .................................. 87 Table 2.8: Tests for Anticipation/Leakage and Reversal for Orphan Drug Announcements ............ 88 Table 2.9: Tests for Anticipation/Leakage and Reversal for NME Drug Announcements ............... 90 Table 2.10: Tests for Anticipation/Leakage and Reversal for NDA Drug Announcements ............. 92 Table 2.11: Tests for Anticipation/Leakage and Reversal for FDA Warnings.................................... 93 Table 2.12: Tests for Anticipation/Leakage and Reversal for NME withdrawals............................... 94 Table 2.13: Innovator Announcements CARs Cross-sectional Analysis ............................................. 95

iv
Table 2.14: Partner Announcements CARs Cross-sectional Analysis .................................................. 97
v
ABSTRACT
In the first essay titled “The Value of Strategic Alliances in Acquisitions and IPOs,” I
investigate how firms’ strategic alliance experience affects their valuations as acquisition targets or in
IPOs. I propose that strategic alliance experience serves as a valuable signaling device for target and
IPO firms, particularly those with more intangible assets and greater opacity. The results show that
takeover targets with alliance experience receive higher premiums than those without such
experience. More recent alliance experience as well as alliance experience in the same industry also
contributes to a larger target gain. Similarly, IPO firms that have alliance experience are shown to
obtain higher valuations than those without the experience. Finally, alliance experience increases the
likelihood that private firms exit by going public rather than being acquired.
In the second essay titled “For Better or For Worse: The Spillover Effect of Innovation
Events on Alliance Partners,” I examine the spillover effects of breakthrough innovations on the
strategic alliance partners of the innovative firm. I find direct stock market evidence that the
shareholders of strategic alliance partners significantly benefit from the spillover effects of these
innovations. Multivariate analyses indicate that young and newly listed innovator firms with better
growth opportunities generate bigger abnormal returns when announcing innovation events and
bring larger spillover effects for their alliance partners with similar characteristics. In addition, I
explore the risks associated with alliance partnerships, showing that FDA warning letters cause
significant wealth losses for both the innovative firm and their alliance partners.
1
THE VALUE OF STRATEGIC ALLIANCES IN ACQUISITIONS AND IPOS
1. INTRODUCTION
The information asymmetry surrounding firms presents a valuation challenge to potential
outside investors. This valuation challenge is particularly daunting for unlisted (private or subsidiary)
firms. Faced with significant valuation difficulty, potential acquirers or IPO investors may discount
the amount that they are willing to pay for the firm. For example, Officer (2007) notes that the
premiums paid for unlisted targets are significantly lower than those paid for comparable public
targets. While unlisted firms are generally more difficult to value, those that have a history of
collaboration with other firms may have reduced levels of information asymmetry. In particular, the
previous alliances that these firms have had with other firms can send positive signals about their
value and reduce the asymmetric information problem for outside investors. According to a recent
Wall Street Journal article, industry giants, such as General Mills and Procter & Gamble, are using
their partnerships with a “crowdfunding” site to get to know more about certain start-ups and
“...CircleUp’s partnerships with big conglomerates could be ‘a good thing for a business that’s
looking to get acquired, eventually’...”1
Indeed, several studies have shown that strategic alliances are common forms of
collaboration that create value for the firms involved (e.g., Chan, Kensinger, Keown, and Martin,
1 See “P&G, General Mills Tap Into Startups,” Wall Street Journal, February 14, 2013. According to this article, “…Cincinnati-based P&G said it offers the founders of startups listed on CircleUp mentoring as well as help setting up licensing deals or joint ventures. A P&G spokeswoman also confirmed that P&G may occasionally acquire a startup's business or technology.”

2
1997; Bodnaruk, Massa, and Simonov, 2013). In examining alliances between biotech and
pharmaceutical companies, Nicholson, Danzon, and McCullough (2005) find that the valuations of
biotech firms increase after they have formed their first alliance, suggesting that the alliance sends a
positive signal to investors. Furthermore, Ivanov and Lewis (2008) show that IPO firms with
alliances obtain higher valuations on the day of the offering and also have more positive long-run
return performance. Thus, if alliances increase the perceived value of a firm by alleviating the
asymmetric information faced by outside investors, alliances may play an important role in
influencing the valuation the firm receives as an acquisition target, and in the case of a private firm,
in its exit via either a takeover or an IPO. The exit outcomes of private, or more generally, unlisted
firms are of particular interest because of the greater informational asymmetry surrounding these
firms and, consequently, the greater benefit of strategic alliances as signals.
Building on the literature, this paper examines the value of strategic alliances in mergers and
acquisitions as well as in initial public offerings. I are interested in examining the signaling effects of
alliances for not just public targets but also unlisted targets; the latter provide unique valuation
challenges for potential acquirers because of their lack of publicly available information. I also
compare the value of alliance experience for firms with different levels of asymmetric information
(i.e., unlisted, newly public, and more mature public targets) to explore the contingent effect of firm
stages on the role of strategic alliances in acquisition premiums. Moreover, I perform subsample
analyses on different types of alliances, such as horizontal versus non-horizontal alliances, strategic
alliances versus joint ventures, R&D alliances, and marketing alliances, since certain types of alliance
partnerships may be more valuable than others.
Using a sample of 29,089 completed acquisitions of public and unlisted targets announced
during 1990-2010, our results show that the premiums paid for takeover targets with prior strategic
alliance experience are significantly higher than those without such experience, especially for targets

3
that are unlisted. While strategic alliance experience increases the premium on average by 3.70% for
public targets (7.98% for new IPO targets and 1.37% for mature public targets), the increase is 10.38%
for unlisted targets. Alliance experience provides a stronger positive signal for unlisted firms and
IPO targets because they have less publicly available information and hence are more difficult to
value, consistent with signaling theory. Also consistent is our finding that alliance experience that is
in the more recent past or that is in a related industry results in a higher premium, as the signal it
provides is more timely or relevant.
I next examine whether strategic alliances provide value for entrepreneurial firms that go
public. Using a sample of 3,039 IPOs, I find that the valuation premiums for IPOs with alliance
partners are 2.13 times higher than those without alliance partners. Furthermore, in examining how
alliance experience influences the exit choice of private firms, I find that the firms with alliance
relationships are more likely to exit via IPOs rather than being acquired by other firms. Thus,
strategic alliances appear to provide value to the sellers by alleviating the information asymmetry
challenge faced by outside investors.
The key contribution of our research is to show that firms’ alliance experience serves as a
signaling device to reduce information asymmetry and increase their valuations. Indeed, alliance
experience positively affects the willingness of acquirers or IPO investors to pay higher premiums
for allied target or IPO firms. By exploring the more nuanced effects of specific types of alliance ties,
the paper also advances our understanding of the various contingencies and boundary conditions of
the role of strategic alliances in acquisitions and IPO valuations. This paper is also the first, to our
knowledge, to combine comprehensive data on acquisitions, strategic alliances, and IPOs to examine
the possible impact of alliance experience on entrepreneurial firms’ choices of exit.
The rest of the paper proceeds as follows. Section 2 reviews the related literature and
develops our hypotheses on the signaling role of strategic alliances. Section 3 describes the data
4
sample for mergers and acquisitions, strategic alliances, and IPOs, as well as the dependent,
independent, and control variables. Section 4 reports the univariate results and multivariate
regression results that demonstrate the effects of alliance experience on target premiums. Section 5
presents evidence on the beneficial role of strategic alliance experience on IPO valuations. Section 6
examines the impact of alliance experience on the private firms’ choices of exit via IPOs or
acquisitions. Section 7 concludes.
2. RELATED LITERATURE AND HYPOTHESES DEVELOPMENT
Researchers in finance have only recently begun to investigate the value implications of
strategic alliances. Chan et al. (1997) examine the share price response to formation of strategic
alliances and find positive stock price reactions and better subsequent operating performance for
firms entering alliances. Allen and Phillips (2000) study corporate equity ownership and find that the
largest increases in targets’ stock prices, investment, and profitability occur when block equity
purchases are combined with strategic alliances or other product market relationships. Robinson
(2008) develops and tests a model to address why firms sometimes prefer alliances over internally
organized projects and shows that strategic alliances help to overcome managers’ incentive problems.
Palia, Ravid, and Reisel (2008) analyze the motivation of internal project financing versus funding
via outside alliances, and find that project risk is an important consideration. In a similar vein,
Bodnaruk et al. (2013) argue that alliances help to improve firm operating flexibility and reduce
agency costs related to free cash flows and capital allocation within the firm. Fang, Francis, Hasan,
and Wang (2012) find that firms with alliance experience enjoy a lower cost of bank debt and are less
likely to use collateral and covenants in their loan contracts.

5
Exploring the role of strategic alliances on IPO performance, Ivanov and Lewis (2008)
examine 2,165 IPOs with positive EBITDA, including 280 IPOs with strategic alliance experience.
Their findings show that IPO firms with alliance experience receive higher valuations on the
offering day and exhibit better long-run returns, but these firms also have a higher degree of
underpricing. Lindsey (2008) finds that strategic alliances improve the probability of exit by venture
backed firms, via either IPOs or acquisitions. Furthermore, strategic alliances are shown by Ozmel,
Robinson, and Stuart (2013) to serve as an alternative source of funding to venture capital for early
stage high-tech firms. Relatedly, Reuer, Tong and Wu (2012) study the signaling role played by
prominent venture capitalists, underwriters, and alliances in takeovers of IPO targets, and find that
such associations increase the acquisition premium for the newly public firms.
While the previous research provides useful evidence on the value of alliances, the literature
has not addressed the role of alliances for unlisted targets which would likely benefit more from the
signaling effect, given their general lack of publicly available information. Also unexamined is the
contingent effect of various types of alliance partners as signals in acquisitions or IPOs, as well as
the differential signaling value of alliance experience between the relatively more recent and distant
past and between related and unrelated industries. Finally, it remains an open question whether
strategic alliance experience influences private firms’ exit choice of IPO versus takeover.
It is well recognized that participants in the takeover and capital markets possess different
information sets. Thus, acquirers or IPO investors may face the “lemons” problem (Akerlof, 1970)
when offering to buy or invest in another firm. A number of solutions have been suggested to
alleviate this problem. In the so-called market solution, acquirers select targets that are publicly
traded, which have much more publicly available information for correct valuation. Empirical
evidence, however, widely documents that the acquisition of public firms often generates negative
abnormal returns for the acquirers around the acquisition announcements (see Fuller, Netter, and
6
Stegemoller, 2002, among others). An alternative proposed in the literature is the ownership solution,
in which the acquirer buys a certain equity stake of the target as “toehold” before bidding for the
firm (Betton, Eckbo, and Thorburn, 2009). Although toehold positions increase the odds of winning
a bid for the toehold investors, studies have shown that the equity investments cause the toehold
acquirer to bid more aggressively and end up overpaying in the acquisitions (“owner’s curse”). A
third way to mitigate the information asymmetry challenge is a contractual relationship between the
acquirer and the target. For example, a contingent payment or earnout contract allows the acquirer
to contingent certain payments on the target’s subsequent performance. Under the earnout contract,
incumbent management of the target firm remains in place in the acquired firm, overseeing its
operations and fulfilling the incomplete contracts (Kohers and Ang, 2000). Another important
contractual relationship is a strategic alliance or a joint venture between the acquirer and the target
before the acquisition. Empirical evidence on the acquisitions of prior alliance partners in the
pharmaceutical industry indicates that alliances reduce the information asymmetry and the likelihood
of overpayment by the acquirers (Higgins and Rodriguez, 2006). By focusing on the attempts of
acquirers to mitigate the asymmetric information problem, however, the existing evidence sheds
little light on the potential benefit of strategic alliances for acquisition targets.
The information asymmetry problem is costly for high quality target firms as they would
suffer from being “pooled” with low quality firms. Thus, as pointed out first by Spence (1973), the
good may take certain actions to differentiate themselves from the bad. For high quality targets,
particularly those having more opaque, less tangible, or harder-to-assess assets, strategic alliances
may serve as a credible signal to convey their higher quality to potential acquirers (Reuer and Shen,
2004). Strategic alliances typically involve some formal contractual agreements between the partners,
which can be important reference points for acquirers. These contracts are legally binding, often
involving a large amount of funding from more established partners to smaller partners, or the
7
licensing of some key innovative products from one partner to another. By providing an inter-
organizational endorsement, strategic alliances helps the involved targets differentiate themselves
through various relational assets (Stuart, Hoang, and Hybels, 1999). Given the potential certification
or endorsement benefits provided by strategic alliances for the targets in reducing the asymmetric
information and adverse selection discount, I hypothesize:
Hypothesis 1 (H1): Strategic alliance experience of target firms serves as a valuable signal, resulting in higher
premiums paid by acquiring firms.
Strategic alliances are especially helpful for unlisted targets having little or no publicly
available information, and for unlisted targets with intangible assets, the ability to signal their quality
through external endorsements by alliance partners is even more valuable. The literature in alliance
formation and partner selection has highlighted that one of the most fundamental drivers for firms
to forge alliances with other firms is to reduce firm-specific uncertainty associated with R&D and
boundary spanning activities that are mostly internal to the firm (Beckman, Haunschild, and Phillips,
2004; Gulati, Lavie, and Singh, 2009). Since acquisitions involve decision-making with incomplete
knowledge and information, acquirers are most concerned about the firm-specific uncertainty and
strive to mitigate this problem by looking for external signals such as strategic alliances. While
uncertainty exists with or without information asymmetry, the term “firm-specific uncertainty” used
here refers to all that results in the so-called “hard-to-value” phenomenon, including that arising
from asymmetric information. I capture the relative degree of firm-specific uncertainty by several
attributes of firms, such as privately held or publicly traded firms, newly or more mature public firms
among public targets, and firms with more or less intangible resources (e.g., R&D development
capabilities and high-tech intensive assets). To the extent that targets’ alliance partnerships help to
mitigate firm-specific uncertainty associated with such attributes, I expect:
8
Hypothesis 2 (H2): The signaling effect of targets’ alliance experience is stronger when firm-specific uncertainty is
greater in the acquisition process.
The signaling value of alliance experience is likely to exhibit a temporal dynamic in that the
signal conveyed by a more recent alliance experience would be more relevant and valuable to
acquirers than one from a more distant past. Consistent with this view, Gulati (1995) suggests that
the likelihood of two firms entering a new alliance diminishes as the elapsed time increases since
their last alliance. Research on organizational change also argues that, as organizations, firms tend to
have short memories (e.g., Amburgey, Kelly, and Barnett, 1993; Gulati, 1999). Similarly, strategic
alliance experience has been shown to be helpful for R&D development, but the value of this
experience depreciates over time (Sampson, 2005). The average age of the strategic alliances is also
negatively associated with new product development (Rothaermel, 2001). Thus, I conjecture:
Hypothesis 3 (H3): The signaling effect of targets’ alliance experience decreases as the time duration between their
alliance experience and the acquisition announcement increases.
In the context of initial public offerings, scholars have examined the endorsement effect of
strategic alliances in public offerings of new ventures in the biotechnology industry. For example,
Stuart et al. (1999) find that biotechnology startup firms with ties to more established and prominent
pharmaceutical companies go public faster and earn greater valuation at IPOs than firms without
such ties. In a paper on the contingent effects of inter-organizational partnership on IPO success,
Gulati and Higgins (2003) highlight the moderating role of different equity market conditions on the
signaling value of various ties for young biotechnology firms. Pollock and Gulati (2007) further find
that pre-IPO alliances have a visibility enhancing effect on alliance formations for the firms after
IPOs.
9
Clearly, private firms with strategic alliance partners are likely to have more resources
available and more visibility than those with no alliances. 2 Their relationships with established
partners can serve the role of certification as well as that of monitoring to reduce potential agency
problems at the project level (Bodnaruk et al., 2013). A strategic alliance contract can also signal that
the private firm has certain (perhaps intangible) assets that are valued by the established partners.
Consistent with these predictions, Ivanov and Lewis (2008) find that alliance experience provides
higher IPO valuations to “successful” firms, those with positive EBITDA. I add to their work by
examining a broader sample of not just profitable but also unprofitable IPO firms which may be at
an earlier stage of growth. It is reasonable to expect that the signaling and certification role of
strategic alliances would be at least as pronounced for unprofitable (and likely younger) IPOs.
Hypothesis 4 (H4): IPO firms with alliance experience are more likely to receive higher valuations than those without
such experience.
Although takeover is very profitable and is the more likely form of exit by an entrepreneurial
firm, going public is generally viewed as an even more profitable and more successful mode of exit
for the firm. Gompers and Lerner (2004) suggest that a new venture that goes public usually yields
the highest return for its investors. In line with this view, Brau, Francis, and Kohers (2003)
document that insiders of private firms who choose exit by IPO earn a 22% higher premium than
those who sell out to acquirers (13.3 vs. 10.9, p-value < 0.1). Concerning the choice of exit via an
IPO or an acquisition, Poulsen and Stegemoller (2008) find that firms with more growth
opportunities, more capital constraints, and less information asymmetry (larger and VC-backed firms)
are more likely to go public. In a theoretical analysis, Bayar and Chemmanur (2011) argue that the
2 In the context of biotechnology strategic alliances, Robinson and Stuart (2007) provide a good example for the certification role of large alliance partners in the IPO book building process: “…in the alliance between Bristol-Myers Squibb (BMS) and Cadus, BMS purchased a total of $20 million of Cadus equity in three separate transactions… Finally, at Cadus’s IPO in July 1996, BMS converted its B shares into 1.607 million common shares and purchased an additional $2.5 million worth of common shares in the IPO.”
10
IPO investors’ prior assessment of the private firm’s value, the private benefits of control to the
firm’s insiders, and the degree of product market competition are important factors driving the firm
to choose an IPO exit.
I extend this research by examining the impact of strategic alliance experience on the choice
of private firms going public versus being acquired. Our thesis is that private firms with strategic
alliances are more likely to go public because the signaling benefit provided by the alliances is more
valuable to prospective IPO investors than to potential acquirers. A priori, public market investors
are likely less informed than a potential acquirer about a private firm because of free riders and
duplication costs in their information production. To the extent that an alliance sends a credible,
public signal about the value of the private firm, it helps to mitigate such free-rider and duplication
cost problems for public market investors. Thus, by reducing the information cost more for
potential IPO investors than for acquirers, an alliance increases the relative attractiveness of the IPO
choice.
Hypothesis 5 (H5): The probability of going public versus being acquired is greater for private firms with alliance
partners than for those without partners.
3. DATA AND METHODOLOGY
3.1. Alliances sample
I use the Strategic Alliances and Joint Venture section of the Securities Data Company (SDC)
database to obtain our original alliance sample. From that sample, I select all strategic alliances and
joint ventures where both partners are U.S. firms. I match the alliance partners with the takeover
and IPO samples described below, and obtain all targets and IPO firms that have alliance experience
as well as those that do not have this experience. I only keep alliances that are within five years of
11
the acquisition announcements or IPOs, based on the previous research that suggests an estimated
duration of about five years for strategic alliances (Chan et al., 1997).
3.2. Takeover sample
The takeover sample is obtained from the M&A section of the SDC Platinum database, with
announcement dates between January 1, 1990 and December 31, 2010. Bidders and targets are both
U.S. firms. The acquirers are publicly listed, but the targets can be public or unlisted (private or
subsidiary) firms. The acquisitions must be completed, and the acquirers must own more than 50%
after the transaction. To be included in the sample, the transaction value reported in SDC must be
over $1 million.3 The resulting sample consists of 4,767 public targets and 24,612 unlisted targets.
Among the 4,767 public targets, 1,277 firms have alliance experience and the remaining 3,490 firms
do not. Among the 24,612 unlisted targets, 986 targets have alliance experience while 23,626 targets
do not. Following Song and Walking (2000), I define a horizontal takeover as one between a target
and a bidder that share the same three-digit primary SIC code. Otherwise, the takeover is classified
as being non-horizontal. By this criterion, 12,082 acquisitions are horizontal while 14,766 are non-
horizontal.
3.3. IPO sample
I collect our initial IPO sample from the SDC New Issues database. After eliminating
closed-end funds, spin-offs, unit issues, real estate investment trusts, limited partnerships, financial
firms (SIC 6000–6999), as well as offers that are priced at less than $5 per share, I obtain a total of
3,093 IPOs. In this sample, 706 IPO firms have various numbers of strategic alliance partners while
2,387 do not have any.
3 In robustness tests, I also use a $10 million transaction value cut-off and the main results do not change.
12
3.4. Variables
3.4.1. Dependent variables
The main dependent variable for the acquisition sample is the target premium, defined here
as the transaction value to sales ratio (Premium), following Brau, Sutton and Hatch (2010) and
Koeplin, Sarin, and Shapiro (2000).4 The transaction value is the amount paid for the target firm,
and sales is defined as the target’s revenue in the year prior to the takeover announcement.
Following Pollock, Chen, Jackson, and Hambrick (2010), I measure IPO valuation as the logarithm of
the IPO firm’s market capitalization at the end of its first day of trading — the total number of
shares outstanding multiplied by the first trading day’s closing share price. I calculate the mean and
the median valuation for our IPO sample. For the logistic regression analysis on the choice of IPO
versus acquisition, our dependent variable is an indicator variable which equals one if the private
firm successfully goes public, and zero if otherwise. For the hazard rate analysis of time to IPO and
time to acquisition, the dependent variable is the hazard rate of an unlisted firm going public or
being acquired in a given year after it is founded, where the firm’s founding date is from SDC
VentureXpert database.
3.4.2. Independent variables
To capture previous alliance experience, I use allied target/IPO as an indicator variable which
takes the value of one if at least one alliance was formed between the target or IPO firm and
another company within five years preceding the acquisition announcement or the IPO issue date,
and zero if otherwise. Total alliances is a categorical variable that measures the total number of
4 Financial statement data is largely unavailable for private firms. Sales is the best available variable to use for the premium measure for two reasons: first, sales is the most widely available data item for our sample, and second, sales is generally less subject to manipulation than other income statement measures such as earnings. As a robustness check for the sample of public targets, I also use an alternative measure of premium: the percentage difference between purchase price and target valuation four weeks prior to the date of acquisition announcement in SDC database. The results are similar to those using our original measure of premium.
13
alliances a target firm has in the last five years, with 0 indicating no alliance in the time period, 1
indicating one alliance partner, 2 indicting two to five alliance partners, and 3 indicating more than
five partners. I create this variable to test whether more alliance experience impacts target premiums.
I also use logarithms of the alliance count in IPO valuation regression as well as the analysis on the
choice of IPO vs. acquisition.
Previous research suggests that the signaling value of alliance partnership is contingent upon
specific types of ties, or the actual content of information that flows across different network ties
(e.g., Podolny and Baron, 1997; Uzzi, 1996; Gulati and Higgins, 2003). To investigate more in-depth
the impact of various alliance relationships, I include as independent variables a number of variables
related to the nature of alliances. Specifically, horizontal alliance is an indicator variable that equals one
if the target or IPO firm shares the same three-digit SIC code as its alliance partner. This variable is
used to test the hypothesis that alliances formed in the same industry send a stronger signal about
the target or IPO firm’s quality. I also test the effects of other alliance characteristics, such as public
versus private alliance partners, cross technology transfer agreements, research and development
agreements, and manufacturing agreements. For targets with multiple alliance partners during the
five years prior to acquisitions, the variable R&D alliance measures the percentage of the target or
IPO firm’s research and development that is attributable to the agreement with the partners.
Marketing agreement measures the percentage of joint sales and services, OEM, as well as valued-added
resale agreements. Likewise, the percentage of supply collaboration between target or IPO firms and
their alliance partners is captured by supply agreement, the frequency of funding relationships between
the two is measured by funding agreement, and the frequency of technology or product market
exploration collaboration agreements between them is measured by exploration agreement. In the
takeover sample, I also control for cases in which the acquirer is a strategic alliance partner of its
target.

14
High tech target/IPO is an indicator variable which takes the value of one if the target or IPO
is from a high-tech industry, and zero if otherwise. This independent variable is used as a proxy for
the level of firm-specific uncertainty in the acquisition or IPO process. The inherent risk associated
with technological innovation makes the intangible assets of high-tech firms particularly difficult to
value (see Kohers and Kohers, 2001; Benou, Gleason, and Madura, 2007). Alliance duration (in days)
is a continuous variable which measures the number of days between the target or IPO firm’s
announcement of the alliance partnership and the acquisition announcement or the IPO issue date.
For targets or IPOs with multiple alliance partners, this variable takes the average alliance duration
of all these alliances. This variable is created to test the “duration” hypothesis, which proposes that
the signaling value of an alliance relationship for an acquisition target or an IPO firm decreases as
the duration of this relationship prior to the acquisition or IPO increases.
3.4.3. Control variables
Previous studies have shown more acquisition activities taking place when stock market
valuations are high (Andrade, Mitchell, and Stafford, 2001). Similarly, IPOs experienced a hot
market during the period of 1999 and 2000 (see Bradley, Jordan, and Ritter, 2008). Bubble period is an
indicator variable which takes the value of one if the merger or IPO was announced during the stock
market bubble period of 1999-2000, and is zero if otherwise. Private target is an indicator variable
which equals one if an unlisted target is a private firm, and is zero if it is a subsidiary. Following
previous merger studies, I use a horizontal merger indicator variable that is equal to one if the target
and the acquirer have the same three-digit SIC code, and is zero if otherwise. Target size is the natural
logarithm of the target’s total assets. To control for the influence of investment banks, I employ IB-
advisor as an indicator variable which equals one if the target hires an investment bank advisor, and is
zero if none is hired. Similarly, I control for the impact of VC-backing by including the dummy
variable for the target or IPO firm that is supported by venture capital. In addition, stock is a dummy
15
variable indicating that stock is the method of payment, and mix indicates the payment method by a
mixture of cash and stock. It is also important to control for targets’ growth opportunities since
firms with better growth opportunities are possibly more attractive as alliance partners. Thus, in a
subsample analysis involving public targets, I control for targets’ Tobin’s Q within one year prior to
being acquired. Tobin’s Q is calculated using the method proposed by Chung and Pruitt (1994). In
addition, I add analyst coverage of the targets during the year prior to acquisitions as another control
for targets’ perceived quality, where the data on the number of analysts is from the Institutional
Brokers Estimate System (I/B/E/S).
For the IPO valuation regressions, I control for hot IPO market since prior research (e.g.,
Stuart et al., 1999; Gulati and Higgins, 2003) has suggested that market conditions have an important
impact on investors’ valuations of the firms that go public. The hot IPO market variable is
constructed by calculating the monthly average change between the offer price and the closing bid
price on the first day of aftermarket trading during 1990-2010, following Ritter (1984). I also control
for IPO proceeds, which is the total amount the IPO firm collects from the offering. Additionally, I
control for underpricing, share overhang, and partial adjustment in the IPO valuation regressions because
previous research has shown that first day return, share retention and partial adjustment are
potentially associated with IPO market valuations (e.g., Ljungqvist and Wilhelm, 2003; Bradley and
Jordan, 2002). I create a dummy variable for top tier underwriters when the IPOs were taken public
by an investment bank with a Carter-Manaster ranking of 8 or above on a 1-9 point scale, based on
Carter and Manaster (1990) and the literature on the role of prestigious underwriters in IPOs. Given
that our sample includes multiple industries, it is of interest to see whether certain high-tech
industries fare better than others during the IPO process. For this purpose, I include high-tech
dummy variables, such as biotech, computer equipment, electronics, communications, and other high-tech, based
on SDC special high-tech classification code, following Kohers and Kohers (2001).
16
On the likelihood of exit via IPO or acquisition, I add other control variables such as leverage,
market return, industry return, industry market to book ratio (M/B), industry long-term debt to equity ratio,
industry net profit margin, industry return on assets, and R&D intensity by three-digit SIC code.5 For the
detailed descriptions of all these variables, see the Appendix 1.A: Variable Definitions.
3.5. Empirical methods
In the multivariate analysis, I use OLS regressions to investigate the factors that contribute
to the variation in target premiums. The baseline model (1) in Table 1.3 is specified as follows:
TARGET PREMIUM = 𝛽0 + 𝛽1(ALLIED TARGET) + 𝛽2(PRIVATE TARGET) + 𝛽3(IB-ADVISOR) + 𝛽4 (ALLIANCE DURATION) + 𝛽5 (STOCK) + 𝛽6 (MIX) + 𝛽7 (HORIZONTAL MERGER) + 𝛽8(TARGET SIZE) + 𝛽9 (VC-BACKING) + 𝜀𝑖 .
Similarly, I use OLS regressions to investigate the factors that contribute to the variation in
IPO valuations. The baseline model (1) in Table 1.5 is specified as follows:
IPO VALUATION = 𝛽0 + 𝛽1(ALLIED IPO) + 𝛽2(SHARE OVERHANG) + 𝛽3(OFFER PRICE) + 𝛽4 (ALLIANCE DURATION) + 𝛽5(UNDERPRICING) + 𝛽6(TOP TIER UNDERWRITER) + 𝛽7(PARTIAL ADJUSTMENT) + 𝛽8 (HOT IPO MARKET) + 𝛽9 (LOG(PROCEEDS)) + 𝛽10 (VC-BACKING) + 𝛽11 (HIGH TECH DUMMIES) + 𝜀𝑖 .
In investigating the choice of IPO versus acquisition, I use a logistic regression model to
examine the determinants of the likelihood to go public or be acquired. The baseline model (1) in
Table 1.6 is specified as follows, where Pi is the probability of going public:
LOG (𝑃𝑖 1− 𝑃𝑖⁄ ) = 𝛽0 + 𝛽1(ALLIED FIRM) + 𝛽2 (LEVERAGE) + 𝛽3(MARKET RETURN) + 𝛽4 (LOG(AGE)) + 𝛽5 (INDUSTRY ROA) + 𝛽6 (INDUSTRY M/B)+ 𝛽7(INDUSTRY RETURN) + 𝛽8 (LOG(ASSETS)) + 𝛽9 (VC-BACKING) + 𝛽10 (ALLIANCE DURATION) + 𝛽11 (OTHER CONTROLS) + 𝜀𝑖 . As a robustness check for the analysis on the choice of IPO versus acquisition, I also fit a
Cox proportional hazard model to examine the time to IPO versus time to acquisition.6 The model
can be specified as: ℎ(𝑡,𝑿) = ℎ0(𝑡) exp(𝜷𝑿) . The Cox model states that the hazard rate of a
5 To control for the possible effect of outliers, all the industry level variables are winsorized at the 1% and 99%. 6 I also use a piecewise exponential hazard model to analyze the effect of alliances on the choice of IPO vs. acquisition. The results are similar to those that use the logistic and Cox proportional hazard models, and are available upon request.
17
particular event at time t is the product of two quantities. The first of these, ℎ0(𝑡), is called the
baseline hazard function. The second quantity is the exponential expression to the linear sum of 𝜷𝑿,
which is over the j explanatory variables similar to those in the logistic model. The baseline hazard
function is an unspecified function, which makes the Cox model a semiparametric model and also
can incorporate time-varying covariates (Cox and Oakes, 1984; Kleinbaum and Klein, 2005).
4. EMPIRICAL RESULTS ON TARGET PREMIUMS
4.1. Univariate results on target premiums
In Panels A of Table 1.1, I report the descriptive statistics for the target sample and related
deal characteristics. The deal characteristics show that targets with alliance experience more
frequently hire investment bank advisors, have bigger deal value, and are acquired more in the form
of horizontal mergers than targets without alliance experience. An examination of the sample firm
characteristics shows that targets with alliance partners are more likely to be public firms, have
greater total assets, have larger net sales, have higher Tobin’s Q, are covered by more analysts, are
more likely to be in the high-tech industry, and have a higher probability of VC support.
Panel B of Table 1.1 shows the alliance frequency distribution of 2,241 targets that have
alliance partners in our sample. Similar to the definition of horizontal mergers, I define a horizontal
alliance as one between two partners that share the same three-digit primary SIC code. The mean
value for the frequency of horizontal alliance of all targets is 0.58, indicating that 58% of alliance
partners are in the same industries as the target firms. Each target firm in this sample has, on average,
2.5 alliance partners during the five years prior to the acquisition announcement. In addition, I
present various characteristics of alliances, such as the mean value for frequency of public alliance
partners involved (0.82), only private alliance partners involved (0.17), cross technology transfer
18
agreements (0.19), research and development agreements (0.24), and the average alliance duration
before the acquisition (763 days). About 8.0% of the targets are acquired by their alliance partners.
About 88.8% of the alliances are strategic alliances, while 11.2% of the inter-firm collaborations take
the form of joint ventures.
Table 1.2 compares the premiums for targets with and without alliance experience by the
types of targets, the methods of payment, and the characteristics of alliance. In Panel A of Table 1.2,
for public targets, the overall mean (median) premium is 7.68 (2.21) if the targets have alliance
experience but only 3.99 (1.87) if they do not. The T test for the mean difference and the Kruskal-
Wallis test for the median difference indicate that the differences between the targets with and
without alliance experience are statistically significant at the 1% level. I further divide the public
targets into IPO targets, those acquired within five years of going public, and mature public targets,
those acquired after five years as a public firm. For IPO targets, the mean (median) premium is
13.44 (3.78) for allied targets, and 5.45 (2.40) for non-allied targets. The differences between the IPO
targets with and without alliance experience are also statistically significant at the 1% level. For
mature public targets, the premium difference between targets with and without alliance experience
is much smaller, at 1.37, significant at the 10% level. Thus, younger, less mature IPO targets appear
to benefit relatively more from alliance experience than more mature public targets, consistent with
signaling theory.
Also consistent with signaling theory are our findings that unlisted targets benefit more from
alliance experience. For unlisted firms, the mean (median) premium is 16.72 (2.49) for allied targets,
and 6.34 (1.10) for non-allied targets. These differences in the mean and median premiums are
significant at the 1% level.7 A further examination reveals that the results for unlisted targets are
driven by private targets, which receive an average (median) premium of 21.11 (2.93) if they have
7 To control for the possible effect of outliers, the transaction value to sales ratio is winsorized at the 1% and 99%.
19
alliance experience, but only 7.04 (1.18) if they do not have any. Alliance experience does not have
the same positive influence for subsidiary targets. The mean premiums for allied and unallied
subsidiary targets are similar, while the median premium for non-allied subsidiaries (1.53) is
significantly higher than that for allied subsidiary targets (0.94). The signaling effect of alliance
partnerships may be unimportant for a subsidiary target due to its link to the parent firm. The parent
may also sell the subsidiary at a discount, for example, if it needs a large infusion of cash (Officer,
2007).8 Another result in Panel A is that allied targets in horizontal mergers have higher premiums
than non-allied counterpart, with both significant mean and median differences (p value= 0.01).
Overall, the results provide preliminary support for our hypothesis that alliance experience enables
targets, especially private targets, to receive higher premiums in acquisitions.
Target premiums by the methods of payment follow a largely analogous pattern. For every
method of payment, the mean (median) premium is significantly higher for unlisted targets with
alliance experience than without the experience. The mean (median) difference in the premium for
allied targets versus non-allied targets is 2.60 (0.88) in cash offers, 6.63 (0.73) in stock offers, and
0.70 (0.85) in mixed offers. In general, cash offer premiums are less than stock offer premiums for
both targets with and without alliance experience, consistent with Brau et al.’s (2003) argument that
the seller’s risk decreases with a higher level of cash vis-à-vis stock payment.
In Panel B of Table 1.2, I compare target premiums by the characteristics of the targets’
alliance partners. I compare alliances formed within one year of the acquisition announcement with
those formed between one and two years (i.e., less than two years but more than one year), as well as
those between two and five years, from the merger announcement. I find a large and significant
difference (mean = 9.82, median = 0.46) in target premiums between the targets with the alliance
8 Since targets’ sales are the most widely available data for analysis of premiums (Brau et al., 2010), I use the transaction value to sales ratio (premium) as dependent variable in most of our analysis. As a robustness check, I also use offer price to book value of equity as dependent variable. The basic results remain unchanged and are available upon request.
20
duration measure of less than one year and those with the duration of one to two years. The
premium difference is even larger (mean = 14.40, median = 0.88) between the duration of less than
one year and that of two to five years. There is also a significant premium difference (mean = 4.56,
median = 0.42) between the targets with the duration of one to two years and those with the
duration of two to five years. These comparisons provide preliminary support for our duration
hypothesis (H3) that alliances formed in the more distance past (i.e.., with a longer duration) are less
valuable as signals for target quality. I also examine the public alliance partner effect, where the public
status of targets’ alliance partners is defined as being public both as of the alliance announcement
date (based on SDC alliance data) and as of the acquisition announcement date (based on
Compustat and CRSP data). Targets with public partners do tend to have higher premiums,
especially for private targets, with a mean difference of 8.50 (p value = 0.01) compared to other
targets with non-public alliance partners. This result is consistent with Reuer et al.’s (2012) finding
of a stronger signaling effect of more prominent alliances, those involving public alliance partners.
Panel C of Table 1.2 investigates the effects of partner acquisitions and brokering. In a
partner acquisition, the target is acquired by one of its previous alliance partners, while in a
brokerage acquisition, the acquirer and the target share a common alliance partner. A prior
partnership between the acquirer and the target could reduce information asymmetry and hence the
adverse selection problem (e.g., Higgins and Rodriguez, 2006). A common alliance partner for the
acquirer and the target could potentially also reduce information asymmetry via a brokering effect
(e.g., Lindsey, 2008). Among all allied targets, 113 targets are acquired by their alliance partners and
have premium data available. Based on mean differences, partner acquisitions have a 2.85 higher
premium than other allied targets, although not statistically significant. Based on median differences,
partner acquisitions have a 0.23 higher premium (p value = 0.10). This suggests that targets acquired
by their partners receive higher premiums, although not substantially so. The brokering effect is

21
more ambiguous, however, with brokerage acquisitions having a lower mean premium than other
allied targets but a similar median premium. In any event, the effects of partner and brokerage
acquisitions are not strong enough to subdue the signaling benefits of other alliance types.
In a related test, I find that targets with horizontal alliance partners have higher premiums.
In particular, targets that have horizontal alliances and are acquired in a horizontal acquisition
(alliance-acquisition align) receive a substantially higher premium, with a statistically significant mean
difference of 8.08 (p = 0.01) and a median difference of 1.05 (p = 0.01). The higher premium
suggests that the intra-industry alliance experience of targets sends an important positive signal and
is highly valued by acquirers in the same industry. Subsequent multivariate results confirm this
interesting finding.
4.2. OLS Regressions of the takeover premium
In this section, I test our hypotheses in a multivariate framework using OLS regressions. The
results are presented in Table 1.3. The sample excludes partner and brokerage acquisitions to ensure
that the signaling effects of alliance partners are not confounded by such ties. I also include industry
and year fixed effects to control for possible impacts of industry and time periods. The primary
variable of interest in model 1 is the allied target dummy. The coefficient for this variable is positive
and significant at the 1% level in model 1, thereby confirming our main hypothesis (H1) that alliance
experience serves as a valuable signal. To further examine whether alliance experience is more
valuable when information asymmetry is greater, model 1 includes an indicator variable private target
as a proxy for asymmetric information, and model 2 includes an interaction term between private
target and allied target. Both the indicator variables and the interaction term are positive and significant
at the 1% level, providing support for our hypothesis (H2) that the targets’ alliance experience has a
stronger signaling effect when the target exhibits more firm-specific uncertainty or opacity. All
22
models in this table also test the duration hypothesis (H3). The alliance duration variable is negative
in all models and significant at the 1% level in most, supporting our hypothesis that more time-
distanced alliances are less valuable as a signal. This result is also consistent with Gualti’s (1995)
finding on the temporal dynamics of prior alliance ties, and Sampson’s (2005) argument that the
experience effect depreciates over time.
In model 3 of Table 1.3, I use an alternative variable for targets with alliance experience. The
coefficient for total alliances is 4.85 (p = 0.001), which is smaller than the coefficient of 15.74 (p =
0.001) for the allied target variable in model 1. Thus, additional alliance partnerships do not matter
much for a higher acquisition premium. So long as a target firm has the endorsement of one alliance
partner, the discount effect on the target is substantially diminished. This result is consistent with the
conclusion in the previous literature that the first alliance is the most important (Nicholson et al.,
2005) and that the marginal value of additional VCs is declining (Pollock et al., 2010).
In models 4 through 11 of Table 1.3, I include variables related to certain characteristics of
the alliances, to proxy for the informational content of network ties (Gulati and Higgins, 2003). In
model 4, the main variable is horizontal alliance. The result shows that alliance experience in the same
industry is valuable for enhancing the target premiums. Model 5 adds the interaction term between
horizontal alliances and horizontal mergers, alliance-acquisition align, which has a positive and
significant coefficient of 5.24 (p = 0.01), in addition to the still highly significant and positive
coefficient for allied target. Thus, alliance experience in the same industry appears to be especially
valuable for enhancing the target premiums in intra-industry acquisitions. This finding provides
further support for our main signaling hypothesis (H1) since alliance partnerships in the same
industry are likely to send a more relevant signal to within-industry acquirers.
Model 6 tests the interaction term between non-horizontal ally and diversifying acquisition,
indicating that the target’s alliance partner(s) do not share the same 3-digit SIC code with the target
23
and the target is later acquired in a diversifying acquisition. The coefficient for this interaction term,
non-horizontal ally*diversify, is positive (5.93) and significant (p = 0.01), suggesting that acquirers
making diversifying acquisitions are willing to pay higher premiums for targets with alliance
experience in a different industry. It is possible that these targets are more versatile, having broader
experience that is of interest to the acquirers in their diversifying acquisitions. While this finding is
consistent with Reuer et al.’s (2012) evidence that alliance experience is of a greater signaling value to
targets in inter-industry acquisitions, I further identify the kind of alliance experience that is more
valuable for targets in diversifying acquisitions.
Model 7 of Table 1.3 tests the impact of strategic alliance and shows a positive and significant
coefficient of 7.33 (p < 0.001), indicating the positive effect of strategic alliance relative to joint
venture. Model 8 tests the effect of alliance partners that are public firms and shows that such
alliances increase target premiums, with a coefficient of 2. 67 (p value = 0.05).9 Models 9 through 11
test the effect of three other types of alliances: R&D alliance, licensing agreement, and
manufacturing agreement. The results for these alliance types are generally insignificant, with the
exception of the licensing agreement alliance. The coefficient for licensing agreement is 3.89 and
significant at the 0.01 level. Recent research on the value of different types of alliance partnerships
has shown that downstream alliances (or exploitation alliances such as manufacturing and marketing
agreements) are more valuable for smaller firms (e.g., Alvarez and Barney, 2001; Katila, Rosenberger,
and Eisenhardt, 2008; Yang, Zheng, and Zhao, 2013), whereas upstream alliances (or exploration
alliances such as R&D alliances) are more valuable for larger firms (Yamakawa, Yang, and Lin, 2011).
Since the sample for Table 1.3 includes all firms, large or small, the effects of different types of
9 I define an alliance partner as public if it is publicly listed both as of the alliance announcement date (based on SDC alliance data) and as of the acquisition announcement date (based on Compustat and CRSP data). As an alternative, I also defined public alliance partner based on SDC alliance data only to avoid any survivorship bias from using the Compustat and CRSP database. While the alternative definition provides a higher number of alliance partners defined as public, the results using these two alternative definitions of public alliance partners are similar.

24
alliances are not obvious. The subsample analyses in Table 1.4 show a clearer picture of their
differential effects. In sum, the results in the models of Table 1.3 support the three hypotheses (H1,
H2, and H3), indicating significant benefits of alliance experience in acquisitions.
4.3. Subsample analysis and robustness checks
In this section, I present the results from additional multivariate regression tests for the
purpose of robustness checks. First, I separate our sample by public versus unlisted targets and test
the impact of the main alliance variables on the premiums of these two types of targets. I further
divide public targets into IPO targets and more mature targets. Unlike public targets, I cannot
control for certain firm-specific characteristics of unlisted targets (e.g., Tobin’s Q). Thus, following
previous research such as Rau and Vermaelen (1998), Barber, Lyon, and Tsai (1999), and Kohers
and Kohers (2001), I use a matched sample method for unlisted targets to control for the potential
endogeneity issue. I match each allied unlisted target with, on average, five non-allied targets based
on size (75% to 125% of the size of the allied unlisted target), industry (based on four-digit SIC
code), VC-backing status, and time frame (in the vicinity of five years around the acquisition
announcement of the allied unlisted target).
Panels A through D in Table 1.4 report the results of the subsample analyses. Consistent
with signaling theory, strategic alliances are more important for unlisted than public targets, and for
IPO than mature public targets. Indeed, the coefficient for allied target is notably larger for the
unlisted target subsample (33.87 in model 1 of Panel B) than for the public target subsample (4.98 in
model 1 of Panel A), and also larger for the IPO target subsample (13.14 in model 1 of Panel C)
than for the mature public target subsample (-1.89 in model 1 of Panel D). The coefficients for VC-
backing and IB-advisor show largely a similar pattern. These results suggest that targets with less
publicly available information, unlisted rather than public targets and IPO rather than more mature
25
targets, are in the greater need of endorsement from outside parties, and therefore, do benefit more
from alliance partnerships. Notably, for IPO targets, all the main alliance variables, such as allied
targets, total alliances, horizontal alliances, strategic alliances, and public alliance partners, are
positive and significant, while for mature public targets, only specific types of alliances, such as R&D
alliances and licensing agreements, are positive and significant. For mature public firms, the
coefficient for R&D alliance is positive and highly significant (4.52, p = 0.01), suggesting that for
larger and more mature firms, upstream alliances such as R&D alliances are more valuable for
potential acquirers. This type of alliance may send a stronger signal of growth possibly because large
firms are less subject to the concerns of knowledge appropriation and alliance uncertainty. The
result is consistent with the recent research suggesting that firm age has an important impact on
firms’ alliance-formation choices and subsequent firm performance (Yamakawa et al., 2011).
4.4. Additional analyses
For additional robustness checks, I conduct a number of other empirical tests.10 First, to
provide further evidence on the value of strategic alliances for high asymmetric information targets,
I divide our sample by high-tech versus non-high-tech targets and run the regression models from
Table 1.4. For both the high tech and non-high tech subsamples, the coefficients for the target’s
allied dummy (allied target) are positive and significant. However, the coefficients for the alliance
dummy and other alliance-related variables are larger for the high-tech than for the non-high-tech
subsample. This difference suggests that alliance experience is more important for targets with
greater firm-specific uncertainty, providing further support for our hypothesis (H2).
Next, I examine an alternative explanation for the higher premium for targets with alliance
experience. When purchasing targets with alliance partners, the acquirer may gain knowledge about
10 For the sake of brevity, the results of these additional tests are not shown but are available upon request.

26
the R&D activities and technological pursuits of the partner firm. Thus, the partner may try to
discourage the target from agreeing to the takeover. The acquirer may then have to pay a higher
premium to entice the target to accept the deal. To empirically examine this possibility, I analyze the
market reaction for the (non-acquiring) alliance partners of all the targets in our sample. If the
acquirer was expected to gain a competitive advantage over the non-acquired partner, the partners’
market reaction around the merger announcement would be negative. However, the results show
that, around the acquisition announcement dates, targets’ alliance partners have positive returns on
average, though statistically insignificant in general. Furthermore, I run regression analyses using the
abnormal returns for alliance partners as the dependent variable, along with other control variables
such as an equity ownership dummy, a horizontal alliance indicator, the premium paid, method of
payment, etc. The results show that the equity ownership dummy is positive but not significant in all
models. This indicates that even for targets’ alliance partners with equity investment in the targets,
there is no evidence of strategic information transfer from the acquisitions.
5. VALUATION PREMIUMS FOR IPOS WITH AND WITHOUT STRATEGIC
ALLIANCES
This section examines the role of strategic alliances in the IPO process. Our hypothesis (H4)
predicts that IPO firms with alliance experience receive higher valuations than those without such
experience. Our IPO valuation variable is the logarithm of the IPO’s market capitalization at the
end of its first day of trading — the total number of its shares outstanding multiplied by the closing
share price at the first trading day (Pollock et al., 2010).
I examine the role of alliance partners on IPO valuations by OLS regressions of IPO
valuations on main alliance variables and other control variables. Column 1 of Table 1.5 presents
27
the results for baseline regression model of IPO valuations. The main alliance indicator variable,
allied IPO, has a positive and significant coefficient of 0.10 (with a p-value of 0.01). This indicates
that IPOs with prior alliance experience gain significantly higher valuation in the public markets than
IPOs without such experience, after controlling for other relevant factors. Alliance experience
appears to send a positive signal to IPO investors, in addition to other indicators such as proceeds,
offer price, and share overhang that are also significantly associated with IPO valuations. Notably,
alliance experience has a greater coefficient than VC-backing and top tier underwriter (both with p
value = 0.01). In column 2, I use an alternative alliance variable, the logarithm of one plus the total
number of alliance partners, to capture the incremental effect of multiple alliance partners.
Compared to the alliance experience indicator variable (allied IPO), the coefficient for log (total alliances)
is 0.08 (p value =0.001), indicating that multiple alliance partners have little incremental effect on
IPO valuation. In columns 3 through 10, I test the impact of various types of alliance partners on
IPO valuations. Alliances in the same industry, strategic alliances, public alliances, as well as R&D
alliances, all have positive impact on IPO valuation (columns 3, 4, 5, 8, and 10). The overall results
in Table 1.5 support our hypothesis (H4) that alliance partnerships provide IPO firms with higher
valuations in the public markets.
6. THE EFFECT OF ALLIANCES ON THE CHOICE OF IPO VERSUS ACQUISITION
In this section, I examine the role of alliance partners on the likelihood of exit by private
firms via IPOs or acquisitions. Table 1.6 reports the results of the logistic regressions for the choice
of IPO versus acquisition. The baseline model in column 1 tests the impact of the main independent
variable, allied firm, on the choice of IPO versus acquisition. The positive and highly significant
coefficient 2.43 (p-value = 0.001) indicates that private firms with alliance experience are more likely
28
to go public, instead of being acquired. Going public is generally viewed as a more successful and
profitable form of exit by a private firm. By sending a positive signal to public market investors,
alliance experience increases the probability that the private firm goes public. Furthermore,
consistent with our duration hypothesis, the alliance duration variable has a negative and significant
coefficient of -0.62, indicating that the impact of alliance experience on the decision to go public
decreases as the duration increases. The results for the control variables are consistent with the
previous literature (e.g., Brau et al., 2003; Poulson and Stegemoller, 2008). For example, private
firms with VC backing are more likely to go public than to be acquired. Larger firms, higher
log(assets), are more likely to go public, especially when the industry return is high. A higher industry
market to book ratio (industry M/B), higher industry net profit margin (industry NPM), or higher
R&D intensity (industry RDS) also positively predicts the propensity of going public by private firms.
In column 2, the logarithm of the alliance count variable (log(Total alliances)) has a smaller coefficient
(0.68, p value = 0.001) than the alliance experience indicator variable (allied target), indicating that the
number of alliance partners do not have an incremental effect on the probability of going public.
Columns 2 through 6 in Table 1.6 test the specific impact of various types of alliance
partners on the choice of IPO versus acquisition. The results show that except for manufacturing
agreements and supply agreements, all other types of alliance partnerships, including horizontal
alliance, public alliance partner, strategic alliance, R&D alliance, licensing agreement, and marketing
agreement, have positive and significant impacts on the probability of going public. There is some
evidence that certain types of alliances have more positive effects than others. For example,
strategic alliances have a much higher positive effect (1.84, p value = 0.001) than joint ventures on
the likelihood of going public. Private firms with public alliance partners are also more likely to go
public. Taken together, the results in this section support our hypothesis (H5) that private firms
have a higher probability of going public if they have prior alliances than if they do not have any.

29
To ensure the robustness of this set of result on the choice of IPO vs. acquisitions, I also
employ the method of event history analysis. I fit a Cox proportional hazard model, where the
dependent variable is the hazard of a private firm going public in a given year after it is founded. I
treat acquisition events as competing risks to avoid the loss of timing information. The firm’s
founding date is from SDC VentureXpert database. Following the sampling procedure of Ozmel et
al. (2013), I include only venture-backed firms in the tests to minimize the scope for heterogeneity in
firm quality. The independent variables and control variables in these hazard models are similar to
those in the logistical regression models in Table 1.6.
Table 1.7 reports the Cox proportional hazard regression analyses regarding the effect of
alliance partnerships on the time to IPO (hr_iva). In model 1, I include only the alliance experience
indicator variable, allied firm. The coefficient shows that alliances have a large positive effect (2.10, p
value = 0.001) on the hazard rate of going public.11 After controlling for other variables as in model
1 of Table VI, the effect is even greater. Thus, alliance experience appears to increase the speed of
going public for firms in our sample, consistent with the results from the logistic regression models.
All other covariates also have similar patterns to those in the logistic regression models.
7. CONCLUSION
Using a comprehensive sample that captures the strategic alliance experience of target and
IPO firms during the period of 1990-2010, this paper shows that alliance experience enables target
and IPO firms to obtain higher valuation premiums. Our evidence supports the hypothesis that
strategic alliance experience serves as a credible signal for target and IPO firms. Indeed, target and
11 The coefficients for hazard models have been transformed into hazard ratios, which give the percentage change in the hazard of going public with one-unit change in the corresponding covariates. The equation is as follows: hazard ratio = exp(β), where β is the original raw coefficients for the corresponding covariates. The similar transformation is employed in Ozmel et al. (2013), among others.

30
IPO firms with more intangible assets and greater firm-specific uncertainty appear to benefit more
from the signaling effect. Alliance experience that is more recent or that is in the same industry also
has a higher signaling value.
This paper contributes to the literature by highlighting the importance of strategic alliances,
particularly for firms that otherwise would face significant valuation challenges because of greater
firm-specific uncertainty or information asymmetry. I shed new light on the determinants of target
and IPO valuations, adding to the work of Officer (2007), Bargeron et al. (2008), Bauguess et al.
(2009), and Gulati and Higgins (2003). While Officer (2007) points out that information asymmetry
may explain part of the acquisition discount for unlisted targets, I emphasize the role of strategic
alliances as signal in mitigating this asymmetric information discount. Furthermore, our findings
show that the signaling value of alliance relationships is contingent on the stages of the firm. For
instance, the signaling value of alliance experience is greater for unlisted than public targets, and
among public targets, it is greater for newly public than more mature targets. The other findings of
this paper suggest that the signaling value of alliances depends also on the types of partnership ties.
For example, certain alliance contracts, such as R&D partnerships, can signal asset quality even for
established firms.
Concerning the role of alliances in private firms’ choice of going public versus being
acquired, this paper provides evidence that alliances increase the relative likelihood that these firms
choose to go public. Since IPO is commonly viewed as a more successful form of exit by private
firms, our results suggest that strategic alliances provide the additional benefit for private firms. In
this context, this paper contributes to the emerging literature on exit choice (e.g., Brau et al., 2003)
by demonstrating the importance of external ties in the decision to go public or be acquired.

31
8. REFERENCES
Akerlof, G., 1970, “The market for lemons: quality uncertainty and the market mechanism,”
Quarterly Journal of Economics 84 (3), 488–500.
Allen, J. W., Phillips, G.M., 2000, “Corporate equity ownership and product market relationships,”
Journal of Finance 55, 2791–2815.
Alvarez, S.A., Barney, J.B. 2001, “How entrepreneurial firms can benefit from alliances with large
partners,” Academy of Management Executive 15(1): 139–148.
Amburgey, T. L., Kelly, D.W., Barnett, P., 1993, “Resetting the clock: The dynamics of
organizational change and failure,” Administrative Science Quarterly, 38: 51–73.
Andrade, G., Mitchell, M., Stafford, E., 2001, “New evidence and perspectives on mergers,” Journal
of Economic Perspectives 15(2), 103–120.
Barber, B. M., Lyon, J.D., Tsai, C.L., 1999, “Improved methods for tests of long-run abnormal
returns,” Journal of Finance 54, 165-201.
Bargeron, L., Schlingemann, F., Stulz, R., Zutter, C., 2008, “Why do private acquirers pay so little
compared to public acquirers?” Journal of Financial Economics 89, 375–390.
Bauguess, S., Moeller S., Schlingemann, F., Zutter, C., 2009, “Ownership structure and target
returns,” Journal of Corporate Finance 15, 48–65.
Bayar, O., Chemmanur, T. J., 2011, “IPOs versus acquisitions and the valuation premium puzzle: a
theory of exit choice by entrepreneurs and venture capitalists,” Journal of Financial and
Quantitative Analysis 46, 1755-1793.

32
Beckman, C.M., Haunschild, P.R., Phillips, D.J., 2004, “Friends or strangers? Firm-specific
uncertainty, market uncertainty, and network partner selection,” Organization Science 15(3):
259–275.
Benou, G., Gleason, K., Madura, J., 2007, “Impact of visibility and investment advisor credibility on
the valuation effects of high-tech cross-border acquisitions,” Financial Management 36, 69-89.
Betton, S., Eckbo, B. E., Thorburn, K.S., 2009, “Merger negotiations and the toehold puzzle,”
Journal of Financial Economics 91, 158–178.
Bodnaruk, A., Massa, M., Simonov, A., 2013, “Alliances and corporate governance,” Journal of
Financial Economics 107, 671-693.
Bradley, D.J., Jordan, B.D., 2002, “Partial adjustment to public information and IPO underpricing,”
Journal of Financial and Quantitative Analysis 37, 595–616.
Bradley, D.J., Jordan, B., Ritter, J., 2008, “Analyst behavior following IPOs: the "bubble period"
evidence,” Review of Financial Studies 58, 101–133.
Brau, J.C., Francis, B., Kohers, N., 2003, “The choice of IPO versus takeover: empirical evidence,”
Journal of Business 76(4), 583-612.
Brau, J.C., Sutton, N., Hatch, N., 2010, “Dual-track versus single-track sell-outs: an empirical
analysis of competing harvest strategies,” Journal of Business Venturing 25, 389-402.
Carter, R.B., Manaster, S. 1990, “Initial public offerings and underwriter reputation,” Journal of
Finance 45: 1045–1067.
Chan, S., Kensinger, J., Keown, A., Martin, J., 1997, “Do strategic alliances create value?” Journal of
Financial Economics 46, 199-221.
Chung, K., Pruitt, S. 1994, “A simple approximation of Tobin’s q,” Financial Management, 23(3): 70–
74.
Cox, D.R., Oakes, D., 1984, “Analysis of survival data,” Chapman and Hall, London.
33
Fama, E.F., French, K.R., 1997, “Industry Costs of Equity,” Journal of Financial Economics, XLIII,
153–194.
Fang, Y., Francis, B., Hasan, I., Wang, H., 2012, “Product market relationship and cost of bank
loans: evidence from strategic alliances,” Journal of Empirical Finance 19, 653-674.
Fuller, K., Netter, J., Stegemoller, M., 2002, “What do returns to acquiring firms tell us? Evidence
from firms that make many acquisitions,”Journal of Finance 57, 1763–1793.
Gompers, P., Lerner, J., 2004, “Chapter 8: Why are investments staged?” in: The Venture Capital Cycle,
MIT Press, Cambridge, MA; London.
Gulati, R. 1995, “Social structure and alliance formation patterns: A longitudinal analysis,”
Administrative Science Quarterly, 40: 619–652.
Gulati, R. 1999, “Network location and learning: The influence of network resources and firm
capabilities in alliance formation,” Strategic Management Journal, 20: 397–420.
Gulati, R., Higgins, M.C., 2003, “Which ties matter when? The contingent effects of
interorganizational partnerships on IPO success,” Strategic Management Journal, 24: 127–144.
Gulati R, Lavie, D, Singh, H., 2009, “The nature of partnering experience and the gains from
alliances,” Strategic Management Journal 30(11): 1213–1233.
Higgins, M., Rodriguez, D., 2006, “The outsourcing of R&D through acquisitions in the
pharmaceutical industry,” Journal of Financial Economics 80, 351–383.
Ivanov, V., Lewis, C., 2008, “The effect of strategic alliances on initial public offerings,” Vanderbilt
University Working paper.
Katila, R., Rosenberger, J.D., Eisenhardt, K.M., 2008, “Swimming with sharks: technology ventures,
defense mechanisms and corporate relationships,” Administrative Science Quarterly 53(2): 295–
332.
34
Kleinbaum, D.G., Klein, M., 2005, “Survival analysis: A self-learning Text,” New York, NY:
Springer-Verlag.
Koeplin, J., Sarin, A., Shapiro, A., 2000, “The private company discount,” Journal of Applied Corporate
Finance 12(4), 94–101.
Kohers, N., Ang, J., 2000, “Earnouts in mergers: agreeing to disagree and agreeing to stay,” Journal of
Business 73, 445-476.
Kohers, N., Kohers T., 2001, “Takeovers of technology firms: expectations versus reality,” Financial
Management 30, 5-30.
Lindsey, L., 2008, “Blurring firm boundaries: the role of venture capital in strategic alliance,” Journal
of Finance 63, 1137–1168.
Ljungqvist, A., Wilhelm, W.J., 2003, “IPO pricing in the dot-com bubble,” Journal of Finance 58, 723–
752.
Nicholson, S., Danzon, P., McCullough, J., 2005, “Biotech-pharmaceutical alliances as a signal of
asset and firm quality,” Journal of Business 78, 1433-1464.
Officer, M.S., 2007, “The price of corporate liquidity: acquisition discounts for unlisted targets,”
Journal of Financial Economics 83, 571–598.
Ozmel, U., Robinson, D., Stuart, T., 2013, “Strategic alliances, venture capital, and exit decisions in
early stage high-tech firms,” Journal of Financial Economics 107, 655-670.
Palia, D., S. Ravid, A., Reisel, N., 2008, “Choosing to cofinance: analysis of project specific alliances
in the movie industry,” Review of Financial Studies 21(2), 483–511.
Podolny, J.M., Baron, J.N., 1997, “Resources and relationships: social networks and mobility in the
workplace,” American Sociological Review 62: 673–693.
35
Pollock, T.G., Chen, G., Jackson, E.M., Hambrick D.C., 2010, “How much prestige is enough?
Assessing the value of multiple types of high-status affiliates for young firms,” Journal of
Business Venturing 25, 6–23.
Pollock, T.G., Gulati, R. 2007, “Standing out from the crowd: The visibility enhancing effects of
IPO-related signals on alliance formations by entrepreneurial firms,” Strategic Organization, 5:
339–372.
Poulsen, A.B., Stegemoller, M., 2008, “Moving from private to public ownership: selling out to
public firms versus initial pubic offerings,” Financial Management. 37, 81-101.
Rau, P.R., Vermaelen, T., 1998, “Glamour, value and the post-acquisition performance of acquiring
firms,” Journal of Financial Economics 49, 223-252.
Reuer, J.J., Shen, J., 2004, “Sequential divestiture through initial public offerings,” Journal of Economic
Behavior & Organization 54(2), 249–266.
Reuer, J.J., Tong, T.W., Wu, C-W., 2012, “A signaling theory of acquisition premiums: Evidence
from IPO targets,” Academy of Management Journal 55(3): 667–683.
Ritter, J.R., 1984, “The ‘hot issue’ market of 1980,” Journal of Business 57(2): 215–241.
Robinson, D., 2008, “Strategic alliances and the boundaries of the firm,” Review of Financial Studies 21,
649-681.
Robinson, D., Stuart, T., 2007, “Financial contracting in biotech strategic alliances,” Journal of Law
and Economics 50 (3), 559-596.
Rothaermel, F.T., 2001, “Incumbent’s advantage through exploiting complementary assets via
interfirm cooperation,” Strategic Management Journal 22(6–7): 687–699.
Sampson, R.C., 2005, “Experience effects and collaborative returns in R&D alliances,” Strategic
Management Journal 26(11) 1009–1031.
36
Song, M. H., Walking, R.A., 2000, “Abnormal returns to rivals of acquisition targets: a test of the
acquisitions probability hypothesis,” Journal of Financial Economics 55(2), 143–171.
Spence, A.M., 1973, “Job marketing signaling,” Quarterly Journal of Economics 83, 355–377.
Stuart, T.E., Hoang, H., Hybels, R.C., 1999, “Interorganizational endorsements and the performance
of entrepreneurial ventures,” Administrative Science Quarterly 44, 315-349.
Uzzi, B. 1996, “The sources and consequences of embeddedness for the economic performance of
organizations: the network effect,” American Sociological Review 61: 674–698.
Yamakawa, Y., Yang, H., Lin, Z.J., 2011, “Exploration versus exploitation in alliance portfolio:
performance implications of organizational, strategic, and environmental fit,” Research Policy
40(2): 287–296.
Yang, H., Zheng, Y., Zhao, X., 2013, “Exploration or exploitation? Small firms' alliance strategies
with large firms,” Strategic Management Journal. doi: 10.1002/smj.2082.
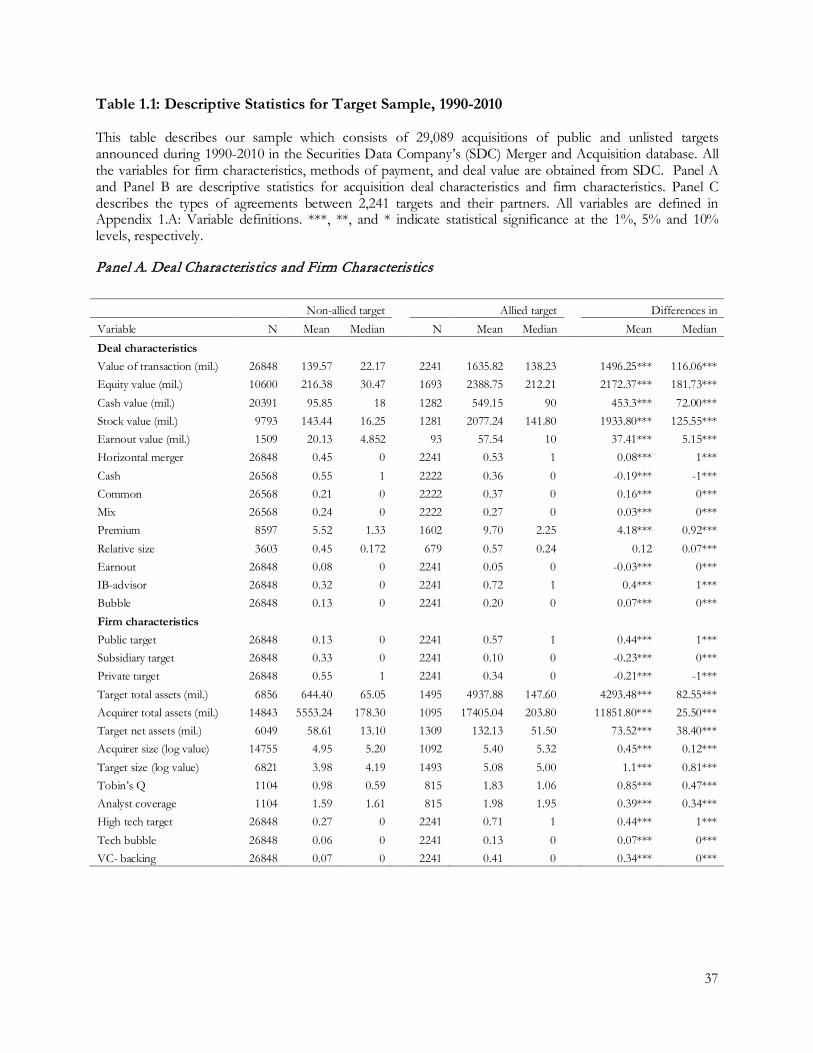
37
Table 1.1: Descriptive Statistics for Target Sample, 1990-2010
This table describes our sample which consists of 29,089 acquisitions of public and unlisted targets announced during 1990-2010 in the Securities Data Company’s (SDC) Merger and Acquisition database. All the variables for firm characteristics, methods of payment, and deal value are obtained from SDC. Panel A and Panel B are descriptive statistics for acquisition deal characteristics and firm characteristics. Panel C describes the types of agreements between 2,241 targets and their partners. All variables are defined in Appendix 1.A: Variable definitions. ***, **, and * indicate statistical significance at the 1%, 5% and 10% levels, respectively. Panel A. Deal Characteristics and Firm Characteristics
Non-allied target Allied target Differences in Variable N Mean Median
N Mean Median
Mean Median
Deal characteristics Value of transaction (mil.) 26848 139.57 22.17
2241 1635.82 138.23
1496.25*** 116.06***
Equity value (mil.) 10600 216.38 30.47
1693 2388.75 212.21
2172.37*** 181.73*** Cash value (mil.) 20391 95.85 18
1282 549.15 90
453.3*** 72.00***
Stock value (mil.) 9793 143.44 16.25
1281 2077.24 141.80
1933.80*** 125.55*** Earnout value (mil.) 1509 20.13 4.852
93 57.54 10
37.41*** 5.15***
Horizontal merger 26848 0.45 0
2241 0.53 1
0.08*** 1*** Cash 26568 0.55 1
2222 0.36 0
-0.19*** -1***
Common 26568 0.21 0
2222 0.37 0
0.16*** 0*** Mix 26568 0.24 0
2222 0.27 0
0.03*** 0***
Premium 8597 5.52 1.33
1602 9.70 2.25
4.18*** 0.92*** Relative size 3603 0.45 0.172
679 0.57 0.24
0.12 0.07***
Earnout 26848 0.08 0
2241 0.05 0
-0.03*** 0*** IB-advisor 26848 0.32 0
2241 0.72 1
0.4*** 1***
Bubble 26848 0.13 0
2241 0.20 0
0.07*** 0*** Firm characteristics
Public target 26848 0.13 0
2241 0.57 1
0.44*** 1*** Subsidiary target 26848 0.33 0
2241 0.10 0
-0.23*** 0***
Private target 26848 0.55 1
2241 0.34 0
-0.21*** -1*** Target total assets (mil.) 6856 644.40 65.05
1495 4937.88 147.60
4293.48*** 82.55***
Acquirer total assets (mil.) 14843 5553.24 178.30
1095 17405.04 203.80
11851.80*** 25.50*** Target net assets (mil.) 6049 58.61 13.10
1309 132.13 51.50
73.52*** 38.40***
Acquirer size (log value) 14755 4.95 5.20
1092 5.40 5.32
0.45*** 0.12*** Target size (log value) 6821 3.98 4.19
1493 5.08 5.00
1.1*** 0.81***
Tobin’s Q 1104 0.98 0.59 815 1.83 1.06 0.85*** 0.47*** Analyst coverage 1104 1.59 1.61 815 1.98 1.95 0.39*** 0.34*** High tech target 26848 0.27 0
2241 0.71 1
0.44*** 1***
Tech bubble 26848 0.06 0
2241 0.13 0
0.07*** 0*** VC- backing 26848 0.07 0 2241 0.41 0 0.34*** 0***
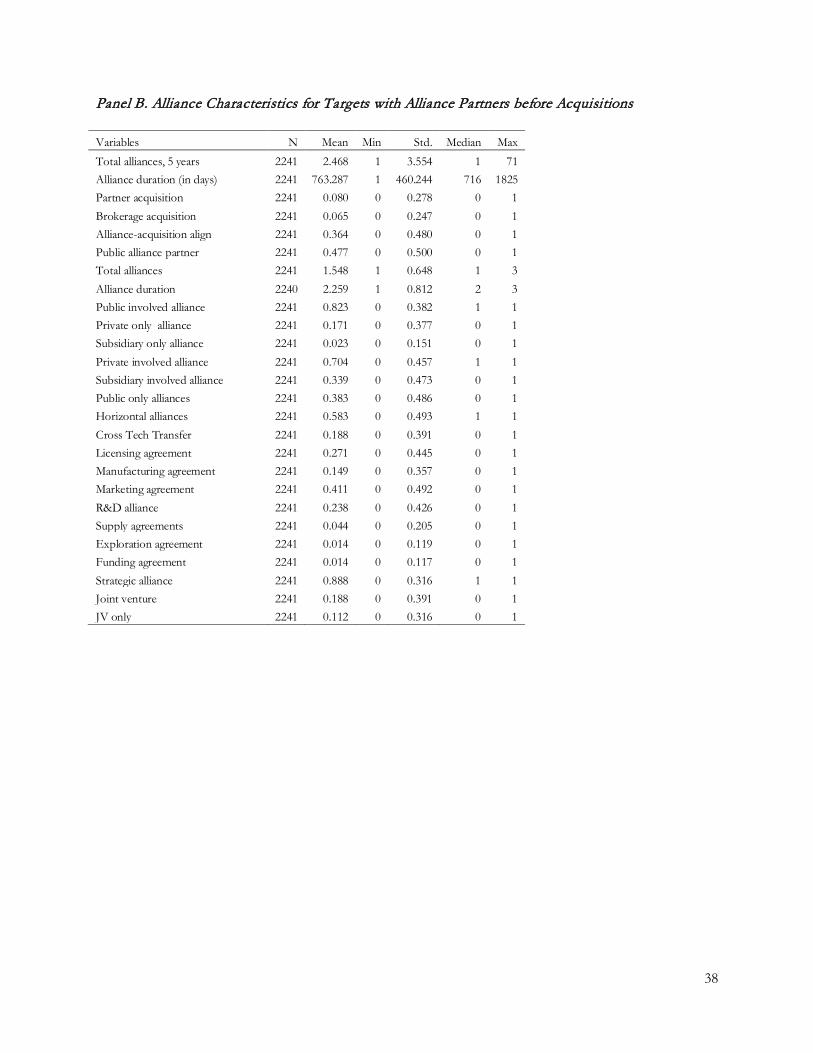
38
Panel B. Alliance Characteristics for Targets with Alliance Partners before Acquisitions
Variables N Mean Min Std. Median Max Total alliances, 5 years 2241 2.468 1 3.554 1 71 Alliance duration (in days) 2241 763.287 1 460.244 716 1825 Partner acquisition 2241 0.080 0 0.278 0 1 Brokerage acquisition 2241 0.065 0 0.247 0 1 Alliance-acquisition align 2241 0.364 0 0.480 0 1 Public alliance partner 2241 0.477 0 0.500 0 1 Total alliances 2241 1.548 1 0.648 1 3 Alliance duration 2240 2.259 1 0.812 2 3 Public involved alliance 2241 0.823 0 0.382 1 1 Private only alliance 2241 0.171 0 0.377 0 1 Subsidiary only alliance 2241 0.023 0 0.151 0 1 Private involved alliance 2241 0.704 0 0.457 1 1 Subsidiary involved alliance 2241 0.339 0 0.473 0 1 Public only alliances 2241 0.383 0 0.486 0 1 Horizontal alliances 2241 0.583 0 0.493 1 1 Cross Tech Transfer 2241 0.188 0 0.391 0 1 Licensing agreement 2241 0.271 0 0.445 0 1 Manufacturing agreement 2241 0.149 0 0.357 0 1 Marketing agreement 2241 0.411 0 0.492 0 1 R&D alliance 2241 0.238 0 0.426 0 1 Supply agreements 2241 0.044 0 0.205 0 1 Exploration agreement 2241 0.014 0 0.119 0 1 Funding agreement 2241 0.014 0 0.117 0 1 Strategic alliance 2241 0.888 0 0.316 1 1 Joint venture 2241 0.188 0 0.391 0 1 JV only 2241 0.112 0 0.316 0 1
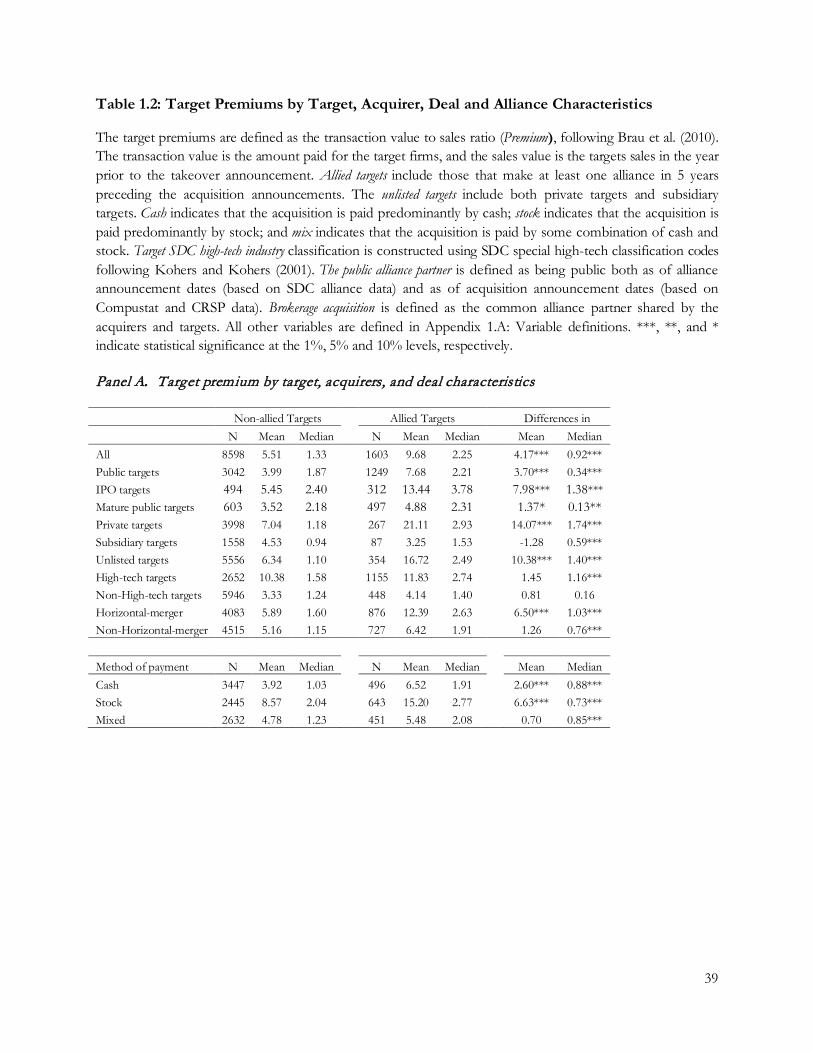
39
Table 1.2: Target Premiums by Target, Acquirer, Deal and Alliance Characteristics
The target premiums are defined as the transaction value to sales ratio (Premium), following Brau et al. (2010). The transaction value is the amount paid for the target firms, and the sales value is the targets sales in the year prior to the takeover announcement. Allied targets include those that make at least one alliance in 5 years preceding the acquisition announcements. The unlisted targets include both private targets and subsidiary targets. Cash indicates that the acquisition is paid predominantly by cash; stock indicates that the acquisition is paid predominantly by stock; and mix indicates that the acquisition is paid by some combination of cash and stock. Target SDC high-tech industry classification is constructed using SDC special high-tech classification codes following Kohers and Kohers (2001). The public alliance partner is defined as being public both as of alliance announcement dates (based on SDC alliance data) and as of acquisition announcement dates (based on Compustat and CRSP data). Brokerage acquisition is defined as the common alliance partner shared by the acquirers and targets. All other variables are defined in Appendix 1.A: Variable definitions. ***, **, and * indicate statistical significance at the 1%, 5% and 10% levels, respectively.
Panel A. Target premium by target, acquirers, and deal characteristics
Non-allied Targets Allied Targets Differences in
N Mean Median
N Mean Median
Mean Median
All 8598 5.51 1.33
1603 9.68 2.25
4.17*** 0.92*** Public targets 3042 3.99 1.87
1249 7.68 2.21
3.70*** 0.34***
IPO targets 494 5.45 2.40 312 13.44 3.78 7.98*** 1.38*** Mature public targets 603 3.52 2.18 497 4.88 2.31 1.37* 0.13** Private targets 3998 7.04 1.18
267 21.11 2.93
14.07*** 1.74***
Subsidiary targets 1558 4.53 0.94
87 3.25 1.53
-1.28 0.59*** Unlisted targets 5556 6.34 1.10
354 16.72 2.49
10.38*** 1.40***
High-tech targets 2652 10.38 1.58 1155 11.83 2.74 1.45 1.16*** Non-High-tech targets 5946 3.33 1.24 448 4.14 1.40 0.81 0.16 Horizontal-merger 4083 5.89 1.60
876 12.39 2.63
6.50*** 1.03***
Non-Horizontal-merger 4515 5.16 1.15
727 6.42 1.91
1.26 0.76***
Method of payment N Mean Median
N Mean Median
Mean Median Cash 3447 3.92 1.03
496 6.52 1.91
2.60*** 0.88***
Stock 2445 8.57 2.04
643 15.20 2.77
6.63*** 0.73*** Mixed 2632 4.78 1.23 451 5.48 2.08 0.70 0.85***

40
Panel B. Target premium by alliance duration and partner public status (within allied targets)
Alliance duration effects N Mean Median (1) Targets w/ alliances within 1 year 330 19.9 2.85 (2) Targets w/ alliances within 1-2 years 425 10.1 2.39 (3) Targets w/ alliances within 2-5 years 846 5.53 1.97 Diff (1-2) 9.82*** 0.46** Diff (2-3)
4.56*** 0.42***
Diff (1-3) 14.40*** 0.88*** Public alliance partner effect N Mean Median (1) Targets w/ other partners 806 9.91 2.07 (2) Targets w/ public partners 797 9.45 2.44 Diff (2-1) -0.47 0.36** N Mean Median (1) Public targets with other partners 609 6.87 2.00 (2) Public targets with public partners 640 8.46 2.39 Diff (2-1) 1.60 0.39** N Mean Median (1) Other targets with other partners 1491 9.09 2.21 (2) Private targets with public partners 112 17.59 3.41 Diff (2-1) 8.50*** 1.20*** N Mean Median (1) Subsidiary targets with other partners 42 3.36 1.54 (2) Subsidiary targets with public partners 45 3.16 1.53 Diff (2-1) -0.20 -0.01
Panel C. Target premium by acquirer, target and partner relationships (within allied targets) Partner acquisition effect N Mean Median
(1) Non-partner acquisition 1490 9.48 2.23 (2) Partner acquisition 113 12.33 2.46 Diff (2-1) 2.85 0.23* Brokerage acquisition effect N Mean Median (1) Acquirer & target do not share partners 1483 9.91 2.22 (2) Acquirer & target share partners 120 6.83 2.66 Diff (2-1)
-3.08* 0.45
Alliance alignment effect N Mean Median Non-horizontal alliances 659 6.70 1.87 Horizontal alliances 944 11.76 2.60 Diff (2-1) 5.05*** 0.74*** Alliance-acquisition align N Mean Median Alliance-acquisition non-align 1007 6.67 1.92 Alliance-acquisition align 596 14.76 2.98 Diff (2-1) 8.08*** 1.05***

41
Table 1.3: OLS Regressions of Target Premiums
The dependent variable is the ratio of the transaction value to the sales value (Premium). The sample includes all targets, except for partner acquisitions and brokerage acquisitions. Partner acquisition is defined as the acquisitions where acquirers acquire targets who were the acquirers’ alliance partner prior to the acquisitions. Brokerage acquisition is defined as the acquisitions where acquirers and targets share common alliance partner. Allied target is an indicator variable which takes the value one if at least one alliance has been made between the target and another company in 5 years preceding the acquisition announcement, and zero otherwise. The public alliance partner is defined as alliance partners being public as of alliance announcement dates based on SDC alliance data) and as of acquisition announcement dates (based on Compustat and CRSP data). Industry fixed effects are based on Fama-French 12 industry classifications. All variables are defined in Appendix 1.A: Variable definitions. T-statistics are in parentheses. ***, **, and * indicate statistical significance at the 1%, 5% and 10% levels, respectively. (1) (2) (3) (4) (5) (6) (7) (8) (9) (10) (11) Variables premium premium premium premium premium premium premium premium premium premium premium Alliance duration -6.12*** -5.76*** -3.20*** -1.67*** -6.18*** -6.16*** -2.63*** -0.84** -0.45 -0.80** -0.52 (-7.17) (-6.72) (-5.06) (-3.83) (-7.23) (-7.19) (-4.45) (-2.05) (-1.19) (-2.11) (-1.43) VC-backing 3.95*** 3.95*** 3.88*** 4.22*** 3.96*** 3.97*** 3.88*** 4.11*** 4.19*** 4.08*** 4.22*** (4.66) (4.67) (4.56) (4.98) (4.68) (4.69) (4.56) (4.83) (4.93) (4.80) (4.96) Private target 2.14*** 1.35* 2.03*** 2.07*** 2.20*** 2.20*** 2.09*** 2.01*** 2.03*** 2.04*** 2.02*** (2.80) (1.72) (2.66) (2.71) (2.88) (2.89) (2.73) (2.62) (2.64) (2.66) (2.64) Stock 6.13*** 6.11*** 6.24*** 6.27*** 6.12*** 6.14*** 6.30*** 6.37*** 6.37*** 6.35*** 6.37*** (8.33) (8.30) (8.46) (8.50) (8.32) (8.35) (8.54) (8.62) (8.62) (8.60) (8.63) Mix 0.98 0.92 1.08 1.08 0.96 1.00 1.21* 1.14 1.11 1.13 1.10 (1.33) (1.26) (1.47) (1.47) (1.31) (1.36) (1.65) (1.56) (1.52) (1.54) (1.50) Target size -2.04*** -2.00*** -2.09*** -2.00*** -2.02*** -2.00*** -1.98*** -2.00*** -1.98*** -1.98*** -1.99*** (-11.29) (-11.05) (-11.46) (-11.03) (-11.17) (-11.03) (-10.96) (-11.02) (-10.92) (-10.93) (-10.96) IB-Advisor 2.88*** 2.83*** 3.09*** 3.06*** 2.87*** 2.88*** 3.00*** 3.08*** 3.10*** 3.08*** 3.10*** (3.67) (3.61) (3.93) (3.89) (3.66) (3.68) (3.81) (3.92) (3.94) (3.91) (3.93) Horizontal merger 0.77 0.72 0.79 0.58 0.17 0.76 0.71 0.72 0.70 0.72 (1.32) (1.24) (1.36) (1.00) (0.28) (1.30) (1.21) (1.22) (1.19) (1.23) Allied target 15.74*** 13.51*** 13.71*** 13.56*** (7.33) (6.14) (6.14) (6.07) Allied*private 10.73*** (4.63) Total alliances 4.85*** (5.30) Horizontal alliance 6.33*** 0.80 (4.78) (0.44) Alliance-acquisition align 5.24*** (2.71) Non-horizontal-ally -5.47*** (-3.72) Diversifying -5.18** (-2.44) Non-horizontal-ally*diversify 5.93*** (2.63) Strategic alliance 7.33*** (4.67) Public alliance partner 2.67** (2.04) R&D alliance 0.68 (0.41) Licensing agreement 3.89*** (2.58) Manufacturing agreement 2.17 (1.19) Constant 4.39 4.31 4.43 4.13 4.48 9.73 4.08 4.11 4.03 4.06 4.05 (0.38) (0.37) (0.38) (0.35) (0.38) (0.83) (0.35) (0.35) (0.34) (0.35) (0.35) Industry fixed effects Yes Yes Yes Yes Yes Yes Yes Yes Yes Yes Yes Year fixed effects Yes Yes Yes Yes Yes Yes Yes Yes Yes Yes Yes N 7,100 7,100 7,100 7,100 7,100 7,100 7,100 7,100 7,100 7,100 7,100 Adjusted R2 0.12 0.12 0.11 0.11 0.12 0.12 0.11 0.11 0.11 0.11 0.11

42
Table 1.4: Subsample Analyses for Public and Unlisted Targets
The dependent variable is the ratio of the transaction value to the sales value (Premium). Partner acquisitions and brokerage acquisitions are excluded from all the subsamples in this table. Models in Panel A include only the subsample of publicly traded targets. Models in Panel B include only unlisted (i.e., private and subsidiary) targets. Models in Panel C include only IPO targets defined as those being acquired within five years after publicly listed based on Compustat and CRSP database. Models in Panel D include mature public targets defined as those being acquired after publicly listed for more than five years. Tobin’s Q is calculated following Chung and Pruitt (1994). Analyst coverage is the logarithm of one plus the number of analysts covering the targets within one year prior to the acquisitions. Industry fixed effects are based on Fama-French 12 industry classifications. T-statistics are in parentheses. ***, **, and * indicate statistical significance at the 1%, 5% and 10% levels, respectively. Panel A. Public Targets
(1) (2) (3) (4) (5) (6) (7) (8) (9) Variables premium premium premium premium premium premium premium premium premium Alliance duration -1.94** -1.92*** -0.75* -0.95 -0.59 -0.45 -0.53 -0.31 -0.25 (-2.26) (-3.00) (-1.68) (-1.62) (-1.38) (-1.12) (-1.30) (-0.80) (-0.56) VC-backing -0.45 -0.61 -0.33 -0.50 -0.51 -0.43 -0.48 -0.45 -0.41 (-0.45) (-0.61) (-0.33) (-0.50) (-0.51) (-0.42) (-0.47) (-0.45) (-0.40) Tobin’s Q 5.46*** 5.42*** 5.49*** 5.48*** 5.51*** 5.54*** 5.50*** 5.54*** 5.54*** (18.80) (18.68) (19.02) (18.82) (19.07) (19.22) (19.03) (19.21) (19.20) Analyst Coverage -1.32* -1.35* -1.33* -1.27* -1.24* -1.26* -1.24* -1.25* -1.25* (-1.81) (-1.86) (-1.82) (-1.74) (-1.70) (-1.73) (-1.70) (-1.71) (-1.72) Stock 0.48 0.49 0.39 0.56 0.59 0.50 0.54 0.57 0.56 (0.43) (0.44) (0.35) (0.50) (0.52) (0.44) (0.48) (0.51) (0.50) Mix -1.15 -1.10 -1.21 -1.00 -1.04 -1.08 -1.03 -1.08 -1.10 (-0.96) (-0.92) (-1.01) (-0.84) (-0.87) (-0.90) (-0.86) (-0.90) (-0.91) Target size -0.05 -0.16 -0.02 -0.04 -0.09 -0.06 -0.06 -0.05 -0.03 (-0.15) (-0.43) (-0.04) (-0.10) (-0.24) (-0.16) (-0.15) (-0.13) (-0.09) Horizontal merger 2.64*** 2.74*** 2.51*** 2.64*** 2.57*** 2.61*** 2.60*** 2.62*** 2.60*** (3.14) (3.26) (2.97) (3.13) (3.05) (3.10) (3.09) (3.11) (3.09) IB-Advisor 2.98 2.90 2.90 3.03 2.85 2.98 2.92 3.04 3.01 (1.34) (1.31) (1.31) (1.36) (1.28) (1.34) (1.31) (1.36) (1.35) Allied target 4.98** (2.23) Total alliances 3.00*** (3.27) Horizontal alliance 2.96** (2.19) Strategic alliance 2.58 (1.63) Public alliance partner 2.36* (1.81) R&D alliance 2.58 (1.62) Licensing agreement 2.95** (1.97) Cross tech transfer 1.45 (0.83) Marketing agreement 0.17 (0.13) Constant -3.01 -1.95 -3.10 -3.60 -2.48 -2.97 -2.85 -3.32 -3.49 (-0.39) (-0.25) (-0.40) (-0.46) (-0.32) (-0.38) (-0.36) (-0.42) (-0.45) Industry fixed effects Yes Yes Yes Yes Yes Yes Yes Yes Yes Year fixed effects Yes Yes Yes Yes Yes Yes Yes Yes Yes N 1,777 1,777 1,777 1,777 1,777 1,777 1,777 1,777 1,777 Adjusted R2 0.29 0.30 0.29 0.29 0.29 0.29 0.29 0.29 0.29

43
Panel B. Unlisted Targets
The allied unlisted targets sample and non-allied unlisted targets control group are formed using the matched-sample method. For each allied unlisted target, I match it with on average around five non-allied targets based on size (75% to 125% of the size of the allied unlisted targets), industry (based on four-digit SIC code), VC-backing status, high-tech status, and in the vicinity of 5 years around the acquisition announcement of allied unlisted target. (1) (2) (3) (4) (5) (6) (7) (8) (9) (10) (11) Variables premium premium premium premium premium premium premium premium premium premium premium Alliance duration -13.77*** -13.97*** -6.45** -3.41* -7.33** -1.36 -0.43 -0.76 -0.24 -0.62 -0.45 (-3.89) (-3.95) (-2.43) (-1.70) (-2.44) (-0.76) (-0.28) (-0.48) (-0.15) (-0.41) (-0.26) VC-backing 9.29*** 9.48*** 9.18*** 9.84*** 9.02*** 9.22*** 9.30*** 9.21*** 9.45*** 9.28*** 9.29*** (2.73) (2.79) (2.68) (2.86) (2.63) (2.68) (2.70) (2.67) (2.74) (2.69) (2.70) Stock 12.40*** 12.47*** 13.09*** 13.69*** 12.93*** 13.37*** 13.66*** 13.58*** 13.74*** 13.58*** 13.60*** (3.33) (3.35) (3.50) (3.65) (3.45) (3.55) (3.63) (3.61) (3.65) (3.62) (3.62) Mix 0.39 0.37 0.96 1.23 0.90 1.08 1.01 1.04 1.04 1.08 1.07 (0.13) (0.12) (0.31) (0.40) (0.29) (0.35) (0.33) (0.34) (0.34) (0.35) (0.35) Target size -1.96** -1.99** -2.30** -2.16** -1.85* -2.14** -2.12** -2.11** -2.17** -2.11** -2.11** (-2.00) (-2.04) (-2.34) (-2.19) (-1.87) (-2.17) (-2.15) (-2.14) (-2.19) (-2.14) (-2.14) IB-advisor 1.36 1.42 2.46 2.71 1.92 2.64 2.68 2.67 2.76 2.63 2.65 (0.46) (0.48) (0.83) (0.91) (0.64) (0.88) (0.89) (0.89) (0.92) (0.88) (0.88) Horizontal merger 2.34 2.53 1.99 2.08 2.54 2.47 2.47 2.52 2.48 2.46 (0.86) (0.92) (0.72) (0.76) (0.92) (0.90) (0.90) (0.92) (0.90) (0.90) Allied target 33.87*** 36.25*** (4.08) (4.20) Allied*diversifying -6.33 (-0.89) Diversifying -1.21 (-0.36) Total alliances 10.23*** (2.63) Horizontal alliance 11.74** (2.04) Strategic alliance 18.61** (2.55) Public alliance partner 4.03 (0.73) R&D alliance -2.68 (-0.33) Licensing agreement 1.81 (0.24) Cross tech transfer -5.09 (-0.68) Manufacturing agreement 0.30 (0.03) Marketing agreement -0.96 (-0.16) Constant 12.74 14.73 13.01 12.14 13.15 12.00 11.50 11.35 11.18 11.27 11.12 (0.94) (1.08) (0.95) (0.89) (0.96) (0.88) (0.84) (0.83) (0.82) (0.82) (0.81) Industry fixed effects Yes Yes Yes Yes Yes Yes Yes Yes Yes Yes Yes Year fixed effects Yes Yes Yes Yes Yes Yes Yes Yes Yes Yes Yes N 828 828 828 828 828 828 828 828 828 828 828 Adjusted R2 0.10 0.10 0.08 0.08 0.08 0.08 0.08 0.08 0.08 0.08 0.08
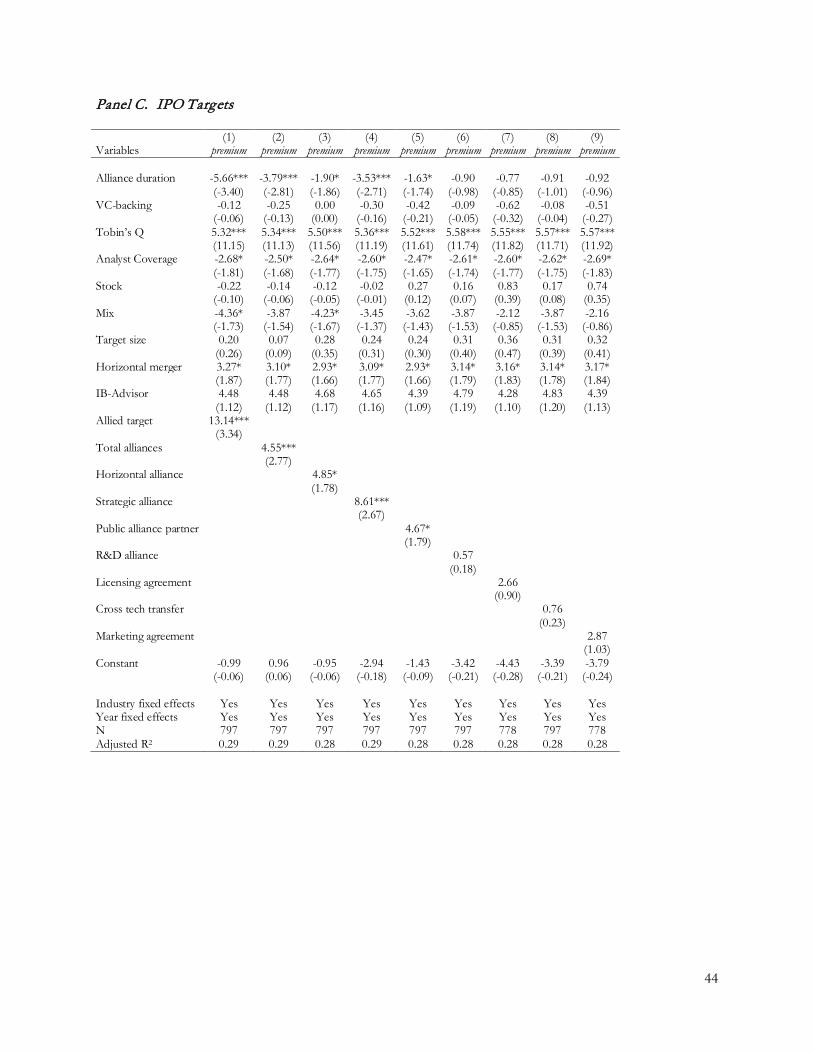
44
Panel C. IPO Targets
(1) (2) (3) (4) (5) (6) (7) (8) (9) Variables premium premium premium premium premium premium premium premium premium Alliance duration -5.66*** -3.79*** -1.90* -3.53*** -1.63* -0.90 -0.77 -0.91 -0.92 (-3.40) (-2.81) (-1.86) (-2.71) (-1.74) (-0.98) (-0.85) (-1.01) (-0.96) VC-backing -0.12 -0.25 0.00 -0.30 -0.42 -0.09 -0.62 -0.08 -0.51 (-0.06) (-0.13) (0.00) (-0.16) (-0.21) (-0.05) (-0.32) (-0.04) (-0.27) Tobin’s Q 5.32*** 5.34*** 5.50*** 5.36*** 5.52*** 5.58*** 5.55*** 5.57*** 5.57*** (11.15) (11.13) (11.56) (11.19) (11.61) (11.74) (11.82) (11.71) (11.92) Analyst Coverage -2.68* -2.50* -2.64* -2.60* -2.47* -2.61* -2.60* -2.62* -2.69* (-1.81) (-1.68) (-1.77) (-1.75) (-1.65) (-1.74) (-1.77) (-1.75) (-1.83) Stock -0.22 -0.14 -0.12 -0.02 0.27 0.16 0.83 0.17 0.74 (-0.10) (-0.06) (-0.05) (-0.01) (0.12) (0.07) (0.39) (0.08) (0.35) Mix -4.36* -3.87 -4.23* -3.45 -3.62 -3.87 -2.12 -3.87 -2.16 (-1.73) (-1.54) (-1.67) (-1.37) (-1.43) (-1.53) (-0.85) (-1.53) (-0.86) Target size 0.20 0.07 0.28 0.24 0.24 0.31 0.36 0.31 0.32 (0.26) (0.09) (0.35) (0.31) (0.30) (0.40) (0.47) (0.39) (0.41) Horizontal merger 3.27* 3.10* 2.93* 3.09* 2.93* 3.14* 3.16* 3.14* 3.17* (1.87) (1.77) (1.66) (1.77) (1.66) (1.79) (1.83) (1.78) (1.84) IB-Advisor 4.48 4.48 4.68 4.65 4.39 4.79 4.28 4.83 4.39 (1.12) (1.12) (1.17) (1.16) (1.09) (1.19) (1.10) (1.20) (1.13) Allied target 13.14*** (3.34) Total alliances 4.55*** (2.77) Horizontal alliance 4.85* (1.78) Strategic alliance 8.61*** (2.67) Public alliance partner 4.67* (1.79) R&D alliance 0.57 (0.18) Licensing agreement 2.66 (0.90) Cross tech transfer 0.76 (0.23) Marketing agreement 2.87 (1.03) Constant -0.99 0.96 -0.95 -2.94 -1.43 -3.42 -4.43 -3.39 -3.79 (-0.06) (0.06) (-0.06) (-0.18) (-0.09) (-0.21) (-0.28) (-0.21) (-0.24) Industry fixed effects Yes Yes Yes Yes Yes Yes Yes Yes Yes Year fixed effects Yes Yes Yes Yes Yes Yes Yes Yes Yes N 797 797 797 797 797 797 778 797 778 Adjusted R2 0.29 0.29 0.28 0.29 0.28 0.28 0.28 0.28 0.28

45
Panel D. Mature Public Targets
(1) (2) (3) (4) (5) (6) (7) (8) (9) Variables premium premium premium premium premium premium premium premium premium Alliance duration 0.76 -0.58 -0.20 0.39 -0.08 -0.19 -0.23 0.03 0.34 (0.77) (-0.83) (-0.45) (0.63) (-0.17) (-0.47) (-0.54) (0.06) (0.74) VC-backing -0.54 -0.64 -0.46 -0.50 -0.55 -0.54 -0.66 -0.61 -0.46 (-0.46) (-0.54) (-0.39) (-0.42) (-0.47) (-0.47) (-0.56) (-0.52) (-0.39) Tobin’s Q 5.24*** 5.20*** 5.20*** 5.24*** 5.19*** 5.18*** 5.16*** 5.22*** 5.22*** (13.20) (13.13) (13.15) (13.18) (13.08) (13.14) (13.06) (13.21) (13.19) Analyst Coverage -0.20 -0.33 -0.33 -0.21 -0.24 -0.32 -0.25 -0.22 -0.22 (-0.26) (-0.42) (-0.41) (-0.27) (-0.30) (-0.40) (-0.31) (-0.28) (-0.28) Stock -0.29 -0.23 -0.44 -0.33 -0.27 -0.45 -0.25 -0.26 -0.25 (-0.22) (-0.18) (-0.34) (-0.25) (-0.21) (-0.35) (-0.20) (-0.20) (-0.19) Mix -1.41 -1.40 -1.45 -1.45 -1.37 -1.39 -1.35 -1.37 -1.35 (-1.11) (-1.11) (-1.15) (-1.14) (-1.08) (-1.10) (-1.07) (-1.08) (-1.06) Target size -0.26 -0.33 -0.25 -0.27 -0.30 -0.32 -0.33 -0.31 -0.26 (-0.63) (-0.79) (-0.59) (-0.66) (-0.73) (-0.77) (-0.81) (-0.74) (-0.63) Horizontal merger 2.12** 2.23** 2.07** 2.11** 2.13** 2.13** 2.16** 2.16** 2.12** (2.38) (2.50) (2.32) (2.37) (2.39) (2.39) (2.43) (2.42) (2.37) IB-Advisor 1.68 1.64 1.70 1.68 1.64 1.89 1.52 1.65 1.57 (0.59) (0.58) (0.60) (0.59) (0.57) (0.67) (0.53) (0.58) (0.55) Allied target -1.89 (-0.71) Total alliances 1.33 (1.23) Horizontal alliance 2.12 (1.46) Strategic alliance -0.97 (-0.56) Public alliance partner 1.31 (0.95) R&D alliance 4.52*** (2.70) Licensing agreement 3.87** (2.44) Cross tech transfer 1.84 (1.01) Marketing agreement -1.34 (-0.94) Constant -1.74 -1.16 -1.86 -1.52 -1.08 -0.89 -0.59 -1.26 -1.36 (-0.22) (-0.14) (-0.23) (-0.19) (-0.13) (-0.11) (-0.07) (-0.16) (-0.17) Industry fixed effects Yes Yes Yes Yes Yes Yes Yes Yes Yes Year fixed effects Yes Yes Yes Yes Yes Yes Yes Yes Yes N 1,019 1,019 1,019 1,019 1,019 1,019 1,019 1,019 1,019 Adjusted R2 0.19 0.20 0.20 0.19 0.20 0.20 0.20 0.20 0.20

46
Table 1.5: IPO Valuation Regressions The dependent variable, Log(IPO market cap.) or imcapd, is the logarithm of the IPO’s market capitalization at the end of its first day trading. All other variables are defined in Appendix 1.A: Variable definitions. T-statistics are in parentheses. ***, **, and * indicate statistical significance at the 1%, 5% and 10% levels, respectively. (1) (2) (3) (4) (5) (6) (7) (8) (9) (10) Variables imcapd imcapd imcapd imcapd imcapd imcapd imcapd imcapd imcapd imcapd VC-backing 0.05*** 0.05*** 0.05*** 0.05*** 0.05*** 0.05*** 0.06*** 0.05*** 0.06*** 0.06*** (3.69) (3.79) (3.91) (3.76) (3.89) (3.99) (4.02) (3.98) (4.03) (4.03) Offer price 0.01*** 0.01*** 0.01*** 0.01*** 0.01*** 0.01*** 0.01*** 0.01*** 0.01*** 0.01*** (2.83) (2.85) (2.77) (2.88) (2.66) (2.74) (2.79) (2.81) (2.75) (2.76) Log (proceeds) 0.92*** 0.92*** 0.93*** 0.92*** 0.92*** 0.93*** 0.93*** 0.92*** 0.93*** 0.93*** (81.68) (81.69) (81.89) (81.95) (81.88) (81.90) (81.87) (81.83) (81.83) (81.89) Share overhang 0.18*** 0.18*** 0.18*** 0.18*** 0.18*** 0.18*** 0.18*** 0.18*** 0.18*** 0.18*** (68.93) (68.79) (68.91) (68.92) (69.08) (69.08) (69.17) (69.21) (69.18) (69.16) Alliance duration -0.02 -0.01 0.01 -0.01 0.01* 0.02** 0.02*** 0.02** 0.02*** 0.02** (-1.14) (-0.59) (1.53) (-0.72) (1.71) (2.07) (2.64) (2.40) (3.20) (2.10) Underpricing 0.15*** 0.15*** 0.15*** 0.15*** 0.15*** 0.15*** 0.15*** 0.15*** 0.15*** 0.15*** (15.84) (15.82) (15.81) (15.80) (15.87) (15.96) (15.93) (15.91) (15.95) (15.96) Partial adjustment 0.35*** 0.35*** 0.35*** 0.35*** 0.35*** 0.36*** 0.35*** 0.36*** 0.36*** 0.35*** (11.46) (11.40) (11.51) (11.38) (11.51) (11.60) (11.49) (11.55) (11.57) (11.44) Top tier underwriter 0.06*** 0.06*** 0.06*** 0.05*** 0.06*** 0.06*** 0.06*** 0.06*** 0.06*** 0.06*** (3.72) (3.68) (3.73) (3.61) (3.73) (3.69) (3.71) (3.74) (3.77) (3.69) Market return 0.05 0.05 0.05 0.05 0.06 0.06 0.05 0.06 0.05 0.05 (0.35) (0.39) (0.39) (0.38) (0.41) (0.44) (0.36) (0.42) (0.38) (0.40) Log (Age) -0.01 -0.01 -0.01 -0.01 -0.01 -0.01 -0.01 -0.01 -0.01 -0.01 (-1.27) (-1.32) (-1.45) (-1.30) (-1.48) (-1.50) (-1.52) (-1.47) (-1.52) (-1.51) Hot IPO market 0.00*** 0.00*** 0.00*** 0.00*** 0.00*** 0.00*** 0.00*** 0.00*** 0.00*** 0.00*** (3.22) (3.29) (3.31) (3.29) (3.33) (3.29) (3.32) (3.36) (3.32) (3.31) Biotech 0.02 0.02 0.03 0.02 0.03 0.02 0.03 0.02 0.03 0.03 (1.07) (1.21) (1.43) (1.17) (1.34) (0.94) (1.47) (1.29) (1.48) (1.38) Computer equipment 0.09*** 0.08*** 0.09*** 0.08*** 0.09*** 0.09*** 0.09*** 0.09*** 0.09*** 0.09*** (4.62) (4.45) (4.74) (4.29) (4.76) (4.93) (4.93) (4.96) (5.08) (4.73) Electronics 0.02 0.02 0.03 0.02 0.02 0.02 0.02 0.02 0.02 0.02 (0.93) (0.93) (1.04) (0.93) (0.93) (0.92) (1.00) (0.95) (1.01) (0.93) Communications -0.03 -0.03 -0.02 -0.03 -0.02 -0.02 -0.02 -0.02 -0.02 -0.02 (-1.41) (-1.35) (-1.14) (-1.38) (-1.18) (-1.02) (-1.11) (-1.03) (-1.06) (-1.13) Other high-tech 0.07 0.08 0.09 0.08 0.09 0.08 0.09 0.08 0.09 0.09 (0.75) (0.81) (0.90) (0.79) (0.89) (0.83) (0.87) (0.84) (0.87) (0.87) Allied IPO 0.10*** (3.38) Log(Total alliances) 0.08*** (3.46) Log(Horizontal alliances) 0.05** (2.27) Log(Strategic alliances) 0.09*** (4.01) Log(Public alliances) 0.05** (2.26) Log(R&D alliances) 0.05** (2.02) Log(Cross tech transfers) 0.05 (1.61) Log(Licensing agreements) 0.04* (1.72) Log(Manufacturing agreements) -0.00 (-0.07) Log(Marketing agreements) 0.05* (1.90) Constant 7.74*** 7.78*** 7.74*** 7.74*** 7.74*** 7.74*** 7.74*** 7.74*** 7.74*** 7.74*** (166.08) (65.18) (165.85) (166.26) (165.84) (165.77) (165.76) (165.76) (165.65) (165.77) Year fixed effects Yes Yes Yes Yes Yes Yes Yes Yes Yes Yes N 2,427 663 2,427 2,427 2,427 2,427 2,427 2,427 2,427 2,427 Adjusted R2 0.95 0.96 0.95 0.95 0.95 0.95 0.95 0.95 0.95 0.95

47
Table 1.6: Logistic Regressions of Choice on IPO vs. Acquisition
The dependent variable (ipo) is one if the firm goes public and zero if the firm is acquired. All variables are defined in Appendix 1.A: Variable definitions. Industry fixed effects are based on Fama-French 12 industry classifications. T-statistics are in parentheses. ***, **, and * indicate statistical significance at the 1%, 5% and 10% levels, respectively. (1) (2) (3) (4) (5) (6) (7) (8) (9) (10) Variables ipo ipo ipo ipo ipo ipo ipo ipo ipo ipo Alliance duration -0.62*** -0.10 0.17** 0.14** -0.36*** 0.26*** 0.26*** 0.32*** 0.25*** 0.33*** (-5.37) (-1.25) (2.48) (2.16) (-3.54) (4.42) (4.38) (5.84) (4.03) (6.10) Log(Assets) 0.36*** 0.35*** 0.35*** 0.35*** 0.36*** 0.35*** 0.35*** 0.35*** 0.36*** 0.36*** (10.56) (10.49) (10.72) (10.56) (10.73) (10.70) (10.77) (10.77) (10.82) (10.82) Log (Age) -0.10 -0.16* -0.19** -0.19** -0.13 -0.20** -0.20** -0.20** -0.20** -0.20** (-1.21) (-1.92) (-2.31) (-2.38) (-1.55) (-2.44) (-2.46) (-2.48) (-2.44) (-2.51) Leverage -0.81*** -0.80*** -0.81*** -0.81*** -0.82*** -0.80*** -0.80*** -0.81*** -0.81*** -0.81*** (-5.53) (-5.52) (-5.60) (-5.58) (-5.61) (-5.57) (-5.58) (-5.60) (-5.58) (-5.61) Market return -0.99 -0.92 -0.93 -0.79 -0.98 -0.73 -0.81 -0.76 -0.75 -0.77 (-1.39) (-1.33) (-1.35) (-1.15) (-1.40) (-1.05) (-1.18) (-1.11) (-1.09) (-1.12) Industry M/B 0.03 0.04 0.04 0.04 0.04 0.04 0.04 0.05* 0.05* 0.04* (1.25) (1.44) (1.50) (1.56) (1.41) (1.62) (1.61) (1.70) (1.67) (1.65) Industry return 0.64** 0.63** 0.65** 0.60** 0.65** 0.57* 0.62** 0.59** 0.60** 0.59* (2.04) (2.05) (2.15) (1.98) (2.10) (1.90) (2.06) (1.97) (1.99) (1.96) Industry DER 0.12 0.12 0.06 0.10 0.15 0.11 0.10 0.09 0.11 0.09 (0.61) (0.62) (0.31) (0.48) (0.73) (0.56) (0.49) (0.46) (0.55) (0.45) Industry NPM -0.00 -0.00 -0.00 -0.00 -0.01 -0.00 -0.00 -0.00 -0.00 -0.00 (-0.35) (-0.14) (-0.03) (-0.18) (-0.41) (-0.30) (-0.22) (-0.20) (-0.29) (-0.16) Industry ROA 0.20** 0.17* 0.18* 0.17* 0.19** 0.15 0.16* 0.15 0.16* 0.16* (2.03) (1.76) (1.89) (1.76) (1.97) (1.63) (1.70) (1.62) (1.67) (1.67) Industry RDS -0.01 0.00 0.01 0.01 -0.01 -0.00 0.00 0.01 0.00 0.01 (-0.21) (0.12) (0.24) (0.18) (-0.18) (-0.12) (0.10) (0.16) (0.08) (0.22) Allied firm 2.43*** (9.24) Total alliances 0.68*** (6.69) Horizontal alliance 0.66*** (3.86) Public alliance partner 0.88*** (5.26) Strategic alliance 1.84*** (7.85) R&D alliance 0.54*** (2.71) Licensing agreement 0.60*** (3.04) Manufacturing agreement 0.42 (1.38) Marketing agreement 0.53*** (2.92) Supply agreement 0.22 (0.53) Constant -0.81 -0.78 -0.73 -0.75 -0.81 -0.74 -0.70 -0.74 -0.73 -0.73 (-0.97) (-0.93) (-0.86) (-0.90) (-0.96) (-0.87) (-0.84) (-0.88) (-0.87) (-0.87) Industry fixed effects Yes Yes Yes Yes Yes Yes Yes Yes Yes Yes Year fixed effects Yes Yes Yes Yes Yes Yes Yes Yes Yes Yes N 2,362 2,362 2,362 2,362 2,362 2,362 2,362 2,362 2,362 2,362 Pseudo R2 0.299 0.288 0.274 0.279 0.290 0.272 0.273 0.270 0.272 0.270 Log Likelihood -1098 -1115 -1137 -1130 -1112 -1140 -1139 -1143 -1140 -1144
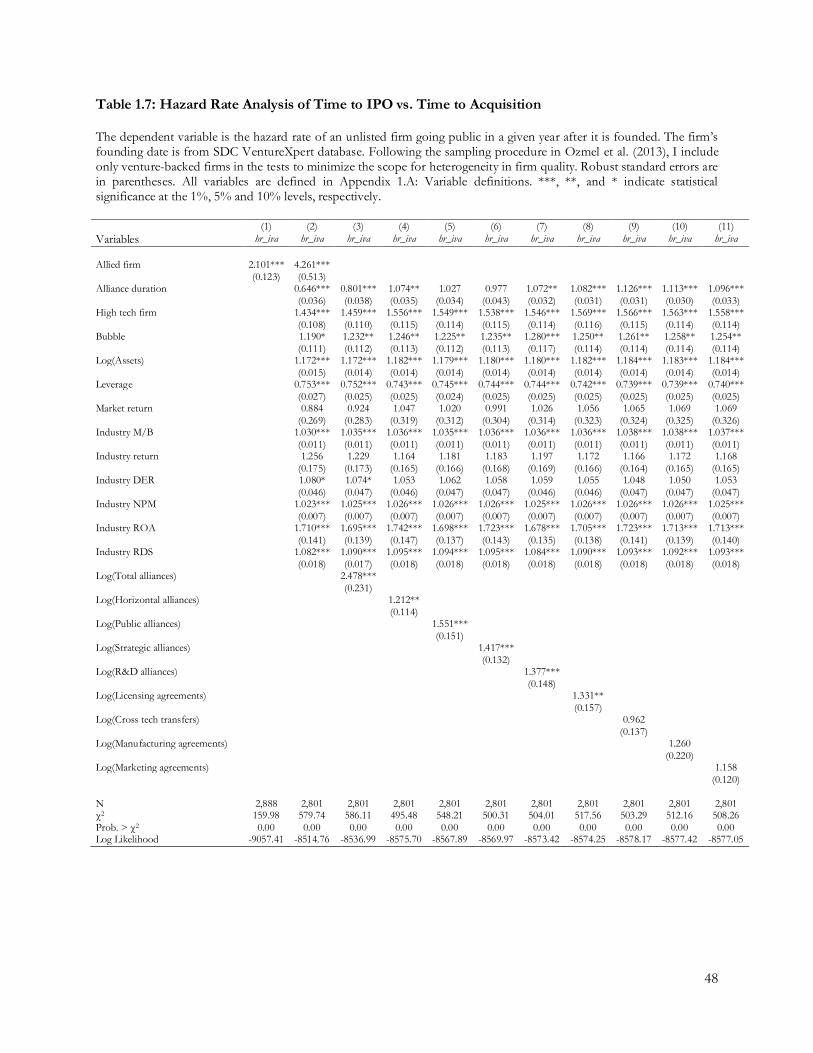
48
Table 1.7: Hazard Rate Analysis of Time to IPO vs. Time to Acquisition
The dependent variable is the hazard rate of an unlisted firm going public in a given year after it is founded. The firm’s founding date is from SDC VentureXpert database. Following the sampling procedure in Ozmel et al. (2013), I include only venture-backed firms in the tests to minimize the scope for heterogeneity in firm quality. Robust standard errors are in parentheses. All variables are defined in Appendix 1.A: Variable definitions. ***, **, and * indicate statistical significance at the 1%, 5% and 10% levels, respectively. (1) (2) (3) (4) (5) (6) (7) (8) (9) (10) (11) Variables hr_iva hr_iva hr_iva hr_iva hr_iva hr_iva hr_iva hr_iva hr_iva hr_iva hr_iva Allied firm 2.101*** 4.261*** (0.123) (0.513) Alliance duration 0.646*** 0.801*** 1.074** 1.027 0.977 1.072** 1.082*** 1.126*** 1.113*** 1.096*** (0.036) (0.038) (0.035) (0.034) (0.043) (0.032) (0.031) (0.031) (0.030) (0.033) High tech firm 1.434*** 1.459*** 1.556*** 1.549*** 1.538*** 1.546*** 1.569*** 1.566*** 1.563*** 1.558*** (0.108) (0.110) (0.115) (0.114) (0.115) (0.114) (0.116) (0.115) (0.114) (0.114) Bubble 1.190* 1.232** 1.246** 1.225** 1.235** 1.280*** 1.250** 1.261** 1.258** 1.254** (0.111) (0.112) (0.113) (0.112) (0.113) (0.117) (0.114) (0.114) (0.114) (0.114) Log(Assets) 1.172*** 1.172*** 1.182*** 1.179*** 1.180*** 1.180*** 1.182*** 1.184*** 1.183*** 1.184*** (0.015) (0.014) (0.014) (0.014) (0.014) (0.014) (0.014) (0.014) (0.014) (0.014) Leverage 0.753*** 0.752*** 0.743*** 0.745*** 0.744*** 0.744*** 0.742*** 0.739*** 0.739*** 0.740*** (0.027) (0.025) (0.025) (0.024) (0.025) (0.025) (0.025) (0.025) (0.025) (0.025) Market return 0.884 0.924 1.047 1.020 0.991 1.026 1.056 1.065 1.069 1.069 (0.269) (0.283) (0.319) (0.312) (0.304) (0.314) (0.323) (0.324) (0.325) (0.326) Industry M/B 1.030*** 1.035*** 1.036*** 1.035*** 1.036*** 1.036*** 1.036*** 1.038*** 1.038*** 1.037*** (0.011) (0.011) (0.011) (0.011) (0.011) (0.011) (0.011) (0.011) (0.011) (0.011) Industry return 1.256 1.229 1.164 1.181 1.183 1.197 1.172 1.166 1.172 1.168 (0.175) (0.173) (0.165) (0.166) (0.168) (0.169) (0.166) (0.164) (0.165) (0.165) Industry DER 1.080* 1.074* 1.053 1.062 1.058 1.059 1.055 1.048 1.050 1.053 (0.046) (0.047) (0.046) (0.047) (0.047) (0.046) (0.046) (0.047) (0.047) (0.047) Industry NPM 1.023*** 1.025*** 1.026*** 1.026*** 1.026*** 1.025*** 1.026*** 1.026*** 1.026*** 1.025*** (0.007) (0.007) (0.007) (0.007) (0.007) (0.007) (0.007) (0.007) (0.007) (0.007) Industry ROA 1.710*** 1.695*** 1.742*** 1.698*** 1.723*** 1.678*** 1.705*** 1.723*** 1.713*** 1.713*** (0.141) (0.139) (0.147) (0.137) (0.143) (0.135) (0.138) (0.141) (0.139) (0.140) Industry RDS 1.082*** 1.090*** 1.095*** 1.094*** 1.095*** 1.084*** 1.090*** 1.093*** 1.092*** 1.093*** (0.018) (0.017) (0.018) (0.018) (0.018) (0.018) (0.018) (0.018) (0.018) (0.018) Log(Total alliances) 2.478*** (0.231) Log(Horizontal alliances) 1.212** (0.114) Log(Public alliances) 1.551*** (0.151) Log(Strategic alliances) 1.417*** (0.132) Log(R&D alliances) 1.377*** (0.148) Log(Licensing agreements) 1.331** (0.157) Log(Cross tech transfers) 0.962 (0.137) Log(Manufacturing agreements) 1.260 (0.220) Log(Marketing agreements) 1.158 (0.120) N 2,888 2,801 2,801 2,801 2,801 2,801 2,801 2,801 2,801 2,801 2,801 χ2 159.98 579.74 586.11 495.48 548.21 500.31 504.01 517.56 503.29 512.16 508.26 Prob. > χ2 0.00 0.00 0.00 0.00 0.00 0.00 0.00 0.00 0.00 0.00 0.00 Log Likelihood -9057.41 -8514.76 -8536.99 -8575.70 -8567.89 -8569.97 -8573.42 -8574.25 -8578.17 -8577.42 -8577.05
49
FOR BETTER OR FOR WORSE:
THE SPILLOVER EFFECT OF INNOVATION EVENTS ON ALLIANCE PARTNERS
1. INTRODUCTION
The search for the source of innovations has triggered a prolific new stream of literature in
finance. Innovations are not generated with one unified model. While many firms develop their
innovations in house through their own R&D labs, other firms outsource innovative ideas externally
by acquiring innovations or forming strategic alliance partners. Prior research has examined
acquisitions of innovative firms and found mixed evidence regarding the impact of these
acquisitions on the productivity of acquiring firms12. The role of strategic alliances, especially R&D
alliances, has predominantly been associated with increasing innovative outputs, as measured by
patent activity (see Sampson (2005) and Danzon et al. (2005)). While patent-related innovations can
potentially be a source of value for shareholders, the direct link between patents and their financial
wealth consequence is not clear. For example, for biotech firms, Pharmaceutical Research and
Manufacturers of America, PhRMA, (2013) estimates the probability of a patented compound
entering and making it through the drug discovery process to eventual FDA approval is as low as
0.01% (1 in 10,000). It takes an average of 10-15 years and costs an average of $1.2 billion to
develop a new drug (DiMasi and Grabowski, 2007), and only two in ten FDA approved drugs
generate revenues that exceed average R&D costs. Chandy et al. (2006) also document that some 12 See, for example, Higgins and Rodriguez (2006); Atanassov, 2013; Seru (2013); and Sevilir and Tian, 2012, among others.
50
firms are significantly better at converting patented ideas into launched commercial products (drugs).
Given the substantial risks and potential benefits associated with innovation, little is known about
how investors of these innovative firms react to commercialized innovations. Furthermore, despite
the growing recognition of strategic alliances as a source of value creation for partnering firms, the
impact of breakthrough innovations on the shareholder wealth of alliance partners is not clear. This
paper is the first attempt to provide systematic evidence on the stock market reactions on
breakthrough innovations by firms with strategic alliance partners, and the spillover effect of
innovations on their alliance partners. 13
Another unsettled issue in strategic alliance research is the divisions of gains captured by
different alliances partners. Based on shareholders returns at the alliance announcements, research
has documented asymmetric value creation for different types of alliances and individual partner
characteristics. For example, Chan et al. (1997) find that smaller strategic alliance partners have
higher abnormal stock returns at the alliance announcements than larger alliance partners, albeit the
dollar gains for two parties are similar. Moreover, their research finds that horizontal technological
alliances receive larger abnormal returns than non-horizontal and non-technological alliances. On
the other side, Das et al. (1998) and Kalaignanam et al. (2007) find asymmetric gains to the larger
and smaller alliance partners. All the prior research along this line addresses the divisions of gains
among alliance partners by examining the abnormal returns around alliance announcements. No
research to date has attempted to investigate this important issue in another setting such as
innovation announcements. This paper contributes to the current literature by providing evidence
on the spillover gains to partners during major innovation announcements, and sheds new light on
the issue of division of gains among alliance partners.
13 Related to our paper is a case study by Huberman and Regev (2001), which provides a good illustrative example for our study. However, their paper focuses on contagious market speculation caused by a “non-event”, instead of real innovation events.

51
To test the effects of innovation on firms and their alliance partners, I use a comprehensive
data set from the Food and Drug Administration (FDA) website. I find economically and statistically
significant gains for shareholders of pharmaceutical companies at the announcements of FDA drug
approvals, consistent with Liu (2006) who examines stock market reactions to innovations news
such as FDA approvals based on a sample of news reports during 1983-1993. The gains vary for
different types of innovations-- from breakthrough innovations to incremental innovations. More
importantly, I find direct stock market evidence that the shareholders of these innovative firms’
strategic alliance partners also significantly benefit from spillovers effect of these innovations. Cross-
sectional multivariate analyses further reveal that young and newly listed innovators generate larger
stock market response. Innovators with more growth opportunities make innovation
announcements that cause bigger spillover effects on young, newly listed partners with more growth
opportunities. Furthermore, I explore the risks associated with these innovators and their alliance
partners by examining the stock market reactions to the FDA regulatory actions on some of drugs
that cause adverse reactions for some customers. I find significant wealth loss for shareholders of
these pharmaceutical companies and their alliance partners when the FDA issues warning letters
regarding some of the adverse drug events and drug withdrawals. The wealth loss to innovators and
their alliance partners around these negative events highlights the risk associated with innovations
and also lends further support to the important roles of strategic alliance partnerships in innovations.
Our findings specifically contribute to the current literature on innovations in the following
ways. First, I test the value effects of innovation in a new setting by extending the concept beyond
patent data to commercialized products. Second, I provide evidence that investors of innovative
firms recognize the upside, as well as the dark side, of innovations in a sophisticated way, as shown
by the different scales of abnormal returns around various types of innovation-related events. Third,
our findings on the spillover effects of innovations on strategic alliance partners provide direct

52
evidence on the important role of strategic alliances on the R&D process of innovative firms. As
such, I contribute to the literature on the external boundaries of firms in highly R&D intensive
industries. Fourth, I shed light on an ongoing debate on asymmetric gains among alliance partners in
a setting distinctive from prior research.
The remainder of the paper proceeds as follows. I discuss the relevant literature on
innovations and strategic alliances and develop a few propositions in the next section. Section 3
explains the empirical settings and methods, and section 4 introduces the basic data sources and
defines the main variables. Section 5 presents several sets of event study results on innovations and
adverse events. I conduct tests for some conjectures regarding information leakage/anticipation and
return reversal in Section 6, and cross-sectional multivariate analyses in Section 7. Section 8
concludes the paper.
2. PRIOR LITERATURE ON INNOVATIONS AND STRATEGIC ALLIANCES
Our paper relates and contributes to a few areas of the literature on innovations. The first
and most closely related literature is on the market value of innovations. How do innovations create
value for shareholders? Although theoretical work has established that innovation is a major driver
of economic growth (Solow, 1957; Romer, 1987, 1990), there is limited evidence on the stock
market value of innovations measured by patents. Some researchers find that the cross-sectional
variation in firms’ stock market value has little to do with firms’ inventive endeavors measured by its
R&D and patent output (Pakes, 1985). Furthermore, the economic value of some patents is
extremely high, whereas many other patents are worth relatively little (Austin, 1993). Chan,
Lakonishok, and Sougiannis (2001) find that “…evidence does not support a direct link between
R&D spending and future stock returns.” However, using Tobin’s Q as a metric for shareholder

53
value, Hall, Jaffe, and Trajtenberg (2005) find that the ratios of R&D to assets, patents to R&D, and
citations to patents, as well as the number of patents and patent citations positively affect firms’
stock market valuations. Following this methodology, Hirshleifer et al. (2013) find that innovation
efficiency, patents or citations scaled by R&D, predicts future market returns after controlling for
firm characteristics and risk. Most of the research along this line examines the stock market
valuation on innovations within a longer time framework. I attempt to make a contribution to
research alone this line by providing some systematic evidence on investors’ interpretation of
innovation announcements using event study methodology in a relatively short-term framework.
The second stream of related literature is on the issue of external boundaries for firms
conducting innovations. In the theoretical framework of incomplete contracts, Aghion and Tirole
(1994) show that, due to the inefficiency of allocating property rights to the customers of
innovations (big manufacturers who commercialize the innovations), it might be optimal for a firm
to allocate property rights to the research unit and choose co-financing between the customers and
investors. Taking the issue of firm boundaries to a slightly distinct framework, Rhodes-Kropf and
Robinson (2008) propose that mergers and acquisitions (M&A) bring together firms with
complementary assets and are more likely to enhance innovations. Subsequent empirical research,
such as Higgins and Rodriguez (2006) and Sevilir and Tian (2012), documents that established firms
can obtain valuable innovations and enhance firm value through M&A. However, from a corporate
governance perspective, Atanassov (2013) document that antitakeover legislations stifle innovations.
In a similar view, Seru (2013) shows that moral hazard problems stifle innovations in conglomerates.
Thus, the effect of M&A on corporate innovations is still inconclusive and unsettled in the literature.
An alternative mechanism for more efficient corporate innovations is a collaborative
partnership between two firms, such as strategic alliances and joint ventures. Instead of a simple
one-shot transaction deal or a complete integration by acquisitions, alliance partnerships are set by

54
two or more parties to last for a few years to achieve a specific purpose. Alliances are widely used in
many industries, especially in highly innovative and R&D-intensive industries (Robinson, 2008).
There is a robust literature on the value-enhancing benefits of this partnership arrangement.
For example, McConnell and Nantell (1985), Chan, et al. (1997) find significant positive stock
market abnormal returns for firms entering a joint ventures or strategic alliance partnerships. In a
paper about block ownership by corporations and product market relationships, Allen and Phillips
(2000) document that when there is a preexisting strategic alliance or other collaboration relationship
between the purchasing and target firms, the target firms experience the largest increases in stock
prices, investment, and profitability. More recently, Lindsey (2008) finds that strategic alliances
among venture backed firms increase the chance of these firms’ exit via either IPOs or acquisitions.
Bodnaruk, Massa and Simonov (2013) argue that alliances improve corporate governance by
enhancing firm operating flexibility and reducing agency costs related to free cash flows and capital
allocation within the firm. Ozmel, Robinson, and Stuart (2013) show that strategic alliances for bio-
tech startups provide an alternative source of funding to venture capital for these early stage high-
tech firms.
On the impact of strategic alliances and innovations, there is some evidence that inter-firm
alliances promote knowledge flows between alliance partners. For example, Sampson (2005)
provides evidence on the significant value of strategic alliance experience on R&D output measured
by patents. Also using patent data as proxies for knowledge flow, Gomes-Casseres et al. (2006)
demonstrate that sharing technological knowledge happens more frequently between allied firms
than two non-allied firms. Examining productivity in the biopharmaceutical industry, Danzon et al.
(2005) find that products developed in alliances are more likely to be a commercial success,
especially if one of the partners is a large firm.
55
This paper is also related to studies that investigate the stock market reactions to innovation
events and alliance announcements. Using the short-term cumulative returns, a handful of papers
have examined the market reactions to new product introductions (e.g., Chaney et al. 1991), good
news in R&D (Liu, 2006), delays in new product introductions (Hendricks and Singhal, 1997), as
well as product recalls (Jarrell and Peltzman, 1985) and drug withdrawals (Ahmed et al. 2002).
Another related paper by Boone and Ivanov (2012) examines the spillover effect of corporate
bankruptcy on strategic alliance partners and find that non-bankrupt partners experience a negative
stock price reaction around their alliance partners’ bankruptcy filing announcements. However, none
of the prior research has looked at the spillover effect of breakthrough innovation on alliance
partners (except for the case study by Huberman and Regev (2001)). Given the recent research on
innovation based on NBER patent data, this paper provides an alternative perspective by
investigating the market perception of both positive and negative innovation events using FDA data.
Furthermore, it is unclear in the current literature how the shareholder wealth gains are
divided among the alliance partners. Based on shareholder returns at the alliance announcement,
Chan et al. (1997) find that larger and smaller strategic alliance partners have quite different
abnormal stock returns, although the dollar gains for two parties are similar. Yet other papers by
Das et al. (1998) and Kalaignanam et al. (2007) find asymmetric gains to the larger and smaller
alliance partners. Moreover, some research also suggests that different types of alliance partnerships
are associated with various benefits for alliance partners and should have varying stock market
valuations. Most prior research addressing the divisions of gains among alliance partners examine
the abnormal returns at alliance announcements. Our paper takes a different perspective by
investigating the spillover gains to partners at major innovation announcements.
56
3. EMPIRICAL SETTING
I set up our empirical tests in the U.S. pharmaceutical industry, which is one of the most
highly research-intensive industries in the U.S. According a report by Congressional Budget Office
(CBO), “...Pharmaceutical firms invest as much as five times more in research and development,
relative to their sales, than the average U.S. manufacturing firm.”14 In 2012, it is estimated that
PhRMA member companies invested $48.5 billion in biopharmaceutical R&D (PhRMA, 2013). A
number of notable prior research papers have studied innovation related issues in this industry15.
The most appealing characteristic of the pharmaceutical industry for the purpose of this study is that
the FDA has a fairly comprehensive and carefully compiled documentation of the history of the
innovative drug development. FDA is a government regulatory agency and its various
announcements regarding the drug innovations and adverse events related to drugs have large
impact on both the customers and the financial market investors. Thus, it provides a relatively clean
lab for testing the value and risk of significant innovations.
Another very attractive feature of the pharmaceutical industry is that the FDA drug data
make it possible to differentiate between incremental innovations, breakthrough innovations, and
radical innovations in the sense of Chandy and Tellis (2000). An incremental innovation is one that
makes only minor advancement on technology and minor improvement on customer benefit. A
breakthrough innovation is a one that involves significant new scientific principles or elements that
are substantially different from the existing innovations, or provide substantially greater customer
14 in “Research and Development in the Pharmaceutical Industry.” Washington, DC: CBO, October 2006. http://www.cbo.gov/sites/default/files/cbofiles/ftpdocs/76xx/doc7615/10-02-drugr-d.pdf. 15 Just to name a few from a long list of recently published papers in the pharmaceutical industry setting: Huberman and Regev (2001), Acemoglu and Linn (2004), Nicholson, Danzon, and McCullough (2005), Higgins and Rodriguez (2006), Gomes-Casseres, Jaffe, and Hagedoorn (2006), Lerner and Malmendier (2010), and Ozmel, Robinson, and Stuart (2013).
57
benefits than existing products. A radical innovation is an innovation that is a substantial technology
breakthrough and a significant market breakthrough.
In this paper, I define the FDA approval for Abbreviated New Drug Application (ANDA)
as an incremental innovation. An ANDA is an application for FDA approval of a generic drug
product, which is similar to the brand name drug in its biochemical ingredients and treatment effect,,
but costs much less than the brand name drug for the customers. A FDA approval for New Drug
Application (NDA) is defined as a breakthrough innovation. In a NDA application, the companies
sponsoring the drug innovation submit their clinical trial data to the FDA for review. As Appendix
2.B shows, there are seven chemical types for these NDAs; except for the first chemical type (New
Molecular Entity), all the other chemical types are defined as breakthrough innovations16. A small
portion of these NDAs are Biologic License Application (BLA) for FDA licenses of some Biological
products. I define two types of FDA approvals as radical innovations, FDA approvals for New
Molecular Entity (NME), which is an active ingredient that has never before been marketed in the
U.S. in any form; and FDA approvals for orphan drugs, which are drugs and biologics “…intended
for the safe and effective treatment, diagnosis or prevention of rare diseases/disorders that affect
fewer than 200,000 people in the U.S.”17 These two types of FDA approvals are defined as radical
innovations for two main reasons along the definitions of radical innovations. First, they are proved
by the FDA agency and a wider scientific community as technology breakthroughs in finding safe
and effective medical treatments for some commonly known difficult diseases such as various types
of cancers, diabetes, AIDS, and Alzheimer's Disease, etc. Secondly, these two types of FDA
approvals for manufacturing and marketing usually bring large amount of revenues for the
innovating firms. According to the drug.com website, about sixty drugs have a yearly sales value
16 These six chemical types include: 1- New ester, new salt, or other noncovalent derivative; 2 - New formulation; 3 - New combination; 4 - New manufacturer; 5 - New indication (Beginning in 1994, Type 6 NDAs were tracked as efficacy supplements); 6 - Drug already marketed, but without an approved NDA. See Appendix 2.B for more details. 17 See FDA website: http://www.fda.gov/ForIndustry/DevelopingProductsforRareDiseasesConditions/default.htm.
58
above 1 billion18. For the orphan drugs, even though the market size is relatively small 19, the
revenues from these drugs are quite substantial. Over 50%, sometimes over 70%, of leading biotech-
pharmaceutical companies' revenues comes from orphan drugs (Lazonick and Tulum, 2011).
Not all innovations related news is good news. Sometimes the FDA approved drugs cause
adverse drug reactions or even deaths for customers, and the FDA responds to these kinds of
reports by issuing warning letters to the relevant pharmaceutical companies that manufacture or
market these drugs. A small percentage of these warning letters result in the eventual withdrawals of
these drugs. I examine the stock market reactions for these two types of adverse events related to
pharmaceutical companies and their alliance partners.
4. DATA AND METHODS
4.1. Innovation sample
The main samples of FDA approvals are from the FDA website, cross-checked with news
reports about FDA approvals from the Wall Street Journal, New York Times, PR Newswire, Business Wire,
The Associated Press, and Pharmaceutical Newsletter, etc. I keep all approvals sponsored by U.S. public
pharmaceutical firms that have data on the Center for Research in Security Prices (CRSP). The time
periods for different innovation samples vary slightly due to the data availability of these different
FDA approvals. More specifically, FDA Orphan Drug (OD) approvals are from the FDA Orphan
Drug Product designation database from 1983 to 2013. Fewer than ten orphan drugs are developed
by the industry in almost a decade between 1973 and 1983. After the enactment of the Orphan Drug
18 See http://www.drugs.com/stats/top100/2012/sales. 19 Not small in absolute sense: about 7000 rare diseases are afflicting a total of 25 million Americans (1 in 12 of the total population), according to the 2005 report by Genetic and Rare Disease Center of the NIH. The average annual cost of Amgen’s Epogen and Neupogen (for anemia) is $5000 to $20,000; Genentech’s Rituxan (for rheumatoid arthritis), $15,000–20,000; Genzyme’s Cerezyme (for Gaucher’s disease), 150,000–225,000 (Lazonick and Tulum 2011).
59
Act of 1983, about 400 orphan drugs have been developed by pharmaceutical companies. The NME
innovators are all U.S. pharmaceutical companies that received FDA NME drug approvals from
1980 to 2013. The time period from 1980 to 1990 has fewer strategic alliances because the number
of strategic alliance partnerships starts really to grow at a much faster rate since the 1990s. This
explains the reason that fewer than half of companies with innovation announcements have alliance
partners. For FDA NME approvals, I also search news reports for approvals and employ major
news report dates for FDA approvals as a robustness check. The breakthrough innovation sample
includes all FDA Original New Drug Approvals (NDAs and BLAs) from 1990 to 201320. Table 2.1
summarizes the number of NDA applications and FDA approvals, as wells as NME approvals by
year. Overall, about 71.64% of the NDA applications are approved, and about 28.28% of NDA
approvals are NME approvals. The applications and approvals seem to follow a quite even path over
the years, with no apparent peak in any single year.
4.2. Alliances sample
The Strategic Alliances and Joint Venture section of the Thomson Financial Securities Data
Company (SDC) database is the source for our original alliance sample. I keep strategic alliances and
joint ventures with all alliance partners being domestic firms. The alliance sample is merged with the
various innovation samples , to get alliance characteristics of these innovator firms. Based on the
previous research (Chan et al., 1997), I infer that alliances formed within five years and above five
years are likely to result in different spillover effects. Therefore, I define alliances formed within five
years as short-term alliances and those formed above five years as long-term alliances.
I also examine the effect of alliance characteristics by differentiating alliance types such as
horizontal alliances, strategic alliances, joint ventures, research and development agreements, licensing agreements, and
20 See Appendix 2.A and 2.B for the distributions of NDAs and definitions of other FDA terms.
60
manufacturing agreements. Specifically, strategic alliances are collaborative agreements for some common
goals among two or more distinctive firms whereas join ventures involve creating an independent legal
entity that operating separately from original cooperative partners. Horizontal alliance is defined as
alliance where two partners have same three-digit SIC code, R&D Alliances indicates that the
pharmaceutical firm has a research and development agreement with the partners. Likewise, licensing
alliances indicates that the pharmaceutical firm has a licensing agreement with the partners.
Manufacturing agreements indicates that the pharmaceutical firm has a manufacturing agreement with
the partners.
4.3. Event study method
Following Brown and Warner’s (1985) standard event study methodology, I measure stock
market abnormal returns as cumulative abnormal returns (CARs) for the eleven-day period (-5, +5),
five-day period (-2, +2), and three-day period (-1, +1) around the announcement dates. The
abnormal return for security i on day t (𝐴𝑅𝑖𝑡) is the actual return, 𝑅𝑖𝑡 , less the security’s expected
return, (∝�i + β�iRmt ) ,
𝐴𝑅𝑖𝑡 = 𝑅𝑖𝑡 - ( ∝�𝑖 + �̂�𝑖𝑅𝑚𝑡 ) ,
where ∝�i and �̂�𝑖 are constant and coefficient obtained from the Ordinary Least Square regression of
security returns on market returns during the estimation period, and 𝑅𝑚𝑡 is the return on the market
index for day t. The CRSP value-weighted market index return is estimated over the days -50 to -
200, where day zero denotes the day on which FDA approval or other news is declared.
61
5. THE VALUE OF INNOVATIONS AND SPILLOVER ON ALLIANCE
PARTNERS
In this section, I examine the wealth effects of innovation announcements as well as the
spillover effect on alliance partners for the following types of innovations: radical innovations (FDA
orphan drug and NME drug approvals), breakthrough innovations (NDA and BLA approvals), and
incremental innovations (ANDA approvals). I also examine the wealth effects of negative
innovation-related announcements, i.e., FDA warning letters and NME drug withdrawals, for
announcing firms and their alliance partners.
5.1. Wealth effect on strategic alliance announcements
As a prelude to the innovation spillover effect on alliance partners, I first examine the
abnormal returns around alliance partnership announcements to show that how investors gauge the
value-enhancing effect of various collaborative agreements among pharmaceutical companies and
their partners. Table 2.2 shows the stock market reactions on alliance announcements on three event
windows: (-5, +5), (-2, +2), (-1, +1). I focus on the three day event window in this section, since
almost all of the event windows display similar patterns. The mean initial alliance announcement
abnormal return is 1.87% for the whole sample, 1.90% for strategic alliances, and 1.50% for joint
ventures. This result is higher than the abnormal returns in Boone and Ivanov (2012), but is
consistent with the announcement returns for subsample of high-tech alliances (Chan et al. 1997).
The three-day mean CAR for long-term strategic alliance announcements, although positive, is not
statistically significant, possibly due to the market’s uncertainty about the value of strategic alliances
formed in the earlier years of the sample. Given that alliances really started to grow exponentially
after the 1980’s, the market may have taken a while to recognize the value-increasing role of alliance

62
partnerships. This result that short-term alliances with eventual duration greater than five years have
higher announcement returns is consistent with Boone and Ivanov (2012) who use four years as a
cut off point for long term and short term distinction. For other types of alliances, horizontal
alliances fare a little better than the overall sample, which confirms that the market perceives
alliances formed in the same industry have higher potential value for partnering firms.
Manufacturing alliances also have slightly higher announcement returns (2.45%), whereas R&D
alliances have the highest abnormal return (2.80%) among all types of alliances. As I will see in later
sections, the alliance announcement returns indeed have some degree of predictability for the
spillover effects of innovations on alliance partners.
5.2. Wealth effect and spillover on alliance partners around radical innovations
In this section, I start to examine the announcement returns of radical innovations, defined
as the FDA orphan drug approvals and NME drug approvals. Panel A of Table 2.3 shows the
results for the wealth effect of FDA orphan drug approvals and the spillover effect on alliance
partners. The overall sample of orphan drug innovators gains an abnormal return of 2.81% in a
three day event window, statistically significant at the 1% level. If I use the average market
capitalization ($10,782 million) of the pharmaceutical companies as Nicholson et al. (2005)
calculated for a sample of 421 publicly traded firms between 1991 and 2000, the 2.81% gain
translates into $302 million dollar wealth creation. The orphan drug innovators with strategic alliance
partners have a slightly lower average abnormal return of 2.39%, which possibly indicates that the
investors are sophisticated enough to know that these radical innovations are not accomplished
solely by these innovators and attribute some of the wealth to their alliance partners. Indeed, the
strategic alliance partners of the innovators also experience positive stock market reactions for
different types of alliances, although the significant announcement returns appear mainly in a wider

63
event window and are relatively smaller than the CARs for the innovators. More specifically, the
average spillover effect on strategic alliance partners of orphan drug innovators is 1.79% in the five-
day event window, which is statistically significant at a 5% level, translating into a $193 million
wealth gain. The shorter three-day event window also have a positive return of 1.56%, although not
statistically significant (p = 0.14). The spillover effect on horizontal alliance partners of orphan drug
innovators follow a similar pattern, but is larger in scale (2.79% for a five-day event widow),
consistent with prior literature showing that the market perceives within-industry alliance
partnerships as more valuable. Overall, the results in Panel A of Table 3 provide strong support for
the positive market perception of radical innovations for innovative firms as well as the spillover
effect on alliance partners.
Turning to Panel B, C and D of Table 2.3, I present the announcement returns of the FDA
NME approvals. Panel B shows the announcement CARs for of FDA NME approvals before
deleting confounding effects; Panel C presents the wealth effect of FDA NME approvals after
deleting confounding effects; and Panel D shows the results using news report dates. The examples
of confounding events are litigation and lawsuits, unfavorable analyst coverage, uneven stock season,
small stocks under alliance termination threats, etc.21 The abnormal returns for NME innovators
and their alliance partners largely follow a similar patterns as orphan drug innovators, but vary in
scale and statistical significance to different degrees. For all NME innovators, the abnormal returns
range from 4.14% to 4.30% in a three-day event window, which is much higher than the wealth
creation for orphan drug innovators. For NME innovators with alliance partners, the abnormal
return is again lower than that of the overall sample, ranging from 1.74% to 3.76%, depending on
the exclusion of firms with apparent confounding events. Furthermore, the statistical significance
varies quite a bit for different sample selection criteria and announcement dates. For the alliance
21 I currently only consider the confounding events for the innovators, not for alliance partners.
64
partners of the NME innovators, although the announcement returns follow a similar pattern as in
the orphan drug innovations, the significance levels vary for different situations as well. There are
three possible explanations for the above results.
The first possibility is that there are other confounding events for NME innovators and their
alliance partners around the radical innovation announcements. If a pharmaceutical company gets a
FDA approval for NME drug and has a large negative stock return on the announcement day, it
would be very likely that this company has some other negative news happening during the event
window or the stock market does not like this particular drug for some reason. For example, on July
16, 1998, Celgene Corp. was approved by FDA for a brand name drug called “Thalomid”, and PR
Newswire reported this exciting approval news on the same day, but also stated that this drug is
controversial and potentially dangerous, and numerous other news reports also caution the risk
associated with this drug22. In the three-day event window, Celgene Corp.’s stock return is about -
11%, a huge wealth loss resulted from seemingly good news.
The second possible reason is that for these radical innovations, there are hundreds of news
reports about the various stages of clinical trial results, expert opinions, and FDA reviews and so on
prior the FDA approvals. The informational content of FDA approvals is therefore greatly mitigated
by all these earlier news reports. The EntreMed featured in Huberman and Regev (2001) paper is a
good example in this respect: “A Sunday New York Times article on a potential development of new
cancer-curing drugs caused EntreMed’s stock price to rise from 12.063 at the Friday close, to open
at 85 and close near 52 on Monday.” Although this is a non-innovative event, from this example, I
can get an idea how the stock price would react to real innovative events prior to FDA approvals.
22 USA Today reported on July 17, 1998 the FDA approval with a title “Infamous thalidomide approved FDA's limits on distribution aim to prevent birth defects”; earlier in January, 1998, New York Times covered this drug and stated that it is “…the world's most notorious agent of birth defects”. Surprisingly, this drug has not been withdrawn from the U.S. market despite hundreds of negative news reports and warnings, and most recently is trying to get Canadian drug agency approval for marketing it in Canada. See, for example, “Thalidomide users are warned about clot risk”, Nanaimo Daily News (British Columbia), May 2, 2013.

65
Another example is Eli Lilly & Co.’s Humalog, which was approved by the FDA on June 17, 1996,
but a Lexis-Nexis search on this drug shows that there are about thirty good news reports about the
blockbuster drug prior to the final approval date.
The third possible reason for the difference in statistical significance associated with
abnormal returns around FDA NME drug approvals is insider trading which makes the drug stock
very volatile around FDA approvals of the blockbuster drugs. Both popular press and academic
research has shown that there are severe information leaks on drug stocks and R&D-intensive firms.
A Wall Street Journal article states that “...So many drug stocks are moving on rumors about the
inner workings of the Food and Drug Administration that the federal agency has hired a law firm to
help it guard against leaks.”23 However, there is no sign of actually stopping insider trading on drug
stocks, as indicated in the more recent Wall Street Journal reports on this issue24. In a large sample
of insider-trading events, Coff and Lee (2003) find that insider trading is used as to appropriate rent
from R&D intensive firms. Our subsequent tests on information leakage/anticipation and return
reversals in Section 6 provide supports for these conjectures.
Overall, the results in Panel B, C, and D of Table 2.3 display that there are substantial
abnormal returns from radical innovations for these innovating firms and also various degrees of
spillovers on the alliance partners of the innovators as well.
5.3. Wealth effect and spillover on partners around breakthrough innovations
The issues discussed above for NME radical innovations are much less severe for the more
“ordinary” breakthrough innovations such as NDAs. For the FDA NDA approvals, the innovation
announcement returns are smaller in the three-day event window: 1.23% for overall NDA approval
sample (p = 0.001); and 1.14% for the NDA innovators with alliance partners (p = 0.001). There are 23 See “FDA Looks to Stop Leaks on Drug Stocks”, Wall Street Journal, June 19, 1991. 24 See, for example, “Probe Deepens of Alleged Inside Trades at FDA”, Wall Street Journal, June 03, 2011.
66
also significant spillover effects on alliance partners, 0.62% in a three-day event window, which is
roughly half of the abnormal return of that of the innovators (p = 0.07). Strategic alliance partners
gain a 0.59% of the abnormal returns in a three-window, with a p value of 0.03. Short-term as well
as long-term strategic alliance partners both have significant announcement returns from their
partners’ NDA approvals, while it takes relatively more time for long-term alliance partners to
realize the gains (eleven-day event window). Taken together, the results in Table 2.4 show that the
wealth effect of breakthrough innovations is large for the innovators and this wealth effect also
benefits the innovators’ alliance partners.
5.4. Wealth effect and spillover on partners around incremental innovations
Table 2.5 presents the results on the abnormal returns around incremental innovations
announcements, i.e. FDA ANDA approvals. The pattern of abnormal returns and spillover effect
resembles those of breakthrough innovation announcements, whereas smaller in scale. The average
three-day CAR is 0.56% (p = 0.001) for all ANDA innovators, and 0.38% (p = 0.001) for ANDA
innovators with alliance partners. Strategic alliance partners have a spillover of 0.22% (p = 0.08),
whereas long-term alliance partners have a spillover of 0.49% (p= 0.01) in a three-day event window.
Surprisingly, the joint ventures partners of the ANDA innovators have a significant negative
spillover from these incremental innovation announcements, which could possibly result from some
confounding events such as litigations or other negative issues among the partners. To summarize,
the results in Table 2.5 once again reinforce the similar conclusion from previous sections:
incremental innovations also result in substantial financial gains for innovators and their alliance
partners, although alliance partners gain less in all situations, highlighting the asymmetric gains from
alliance partnerships.

67
5.5. Wealth loss and spillover on partners around FDA warning letters
In this section and the next section, I examine the wealth loss caused by some adverse events
related to pharmaceutical innovations and test if our premise of spillover effect on alliance partners
still holds in these events. Panel A of Table 2.6 shows the results for wealth loss for pharmaceutical
companies and their alliance partners around FDA posted warning letters. In a three-day event
window and five-day event window, there are significant negative abnormal returns of -0.43% (p =
0.08) and -0.59% (p = 0.05) respectively around the FDA warning letter posted dates for the overall
sample of 462 observations. For FDA warned firms with alliance partners, the negative CAR is -0.48%
in the three-day even window, although not statistically significant (p = 0.12). For five-day and
eleven-day event windows, the wealth losses are -0.84% (p = 0.04) and -1.42% (p = 0.01)
respectively. Therefore, there is substantial wealth loss for firms getting FDA warning letters.
Interestingly, alliance partners of these FDA warned firms lose almost the same amount from the
bad news: -0.46% (p = 0.10) for a three-day window and -0.74% (p = 0.05) for a five-day event
window. As a robustness check, I also examined the cross-sectional mean abnormal returns of all
alliance partners in Panel B of Table 2.6, instead of only looking at the portfolios formed by firms
getting FDA warning letters. The results are largely similar to that of Panel A. Collectively, the
results in Table 2.6 demonstrate that innovation is a risky business with many uncertainties, and
there could be the substantial wealth loss associated with both innovations and alliance partnerships.
5.6. Wealth loss and spillover on partners around NME drug withdrawals
Another adverse event related to drug development is the possibility of drug withdrawals.
Popular press has featured some high profile drug withdrawals that caused the huge loss of wealth
for some pharmaceutical companies. For example, Bristol Myers Squibb (BMS)’s withdrawal of
application for Vanlev caused its stock price to plummet by $15, or 23%, a total wealth loss of $30
68
billion for the drug giant25. Ahmed et al. (2002) find that shareholders suffer massive wealth losses
around the drug withdrawals and also positive CARs for the competitors of the firms that have drug
withdrawals. I hand collect a sample of 39 NME drug withdrawals from Wall Street Journal (37 cases)
and New York Times (2 cases) and test the spillover effect of the drug withdrawals on alliance
partners. The results in Table 2.7 demonstrate that the shareholder wealth loss is consistent with
Ahmed et al. (2005), but is even slightly larger (9.27%, p = 0.01) because their sample also contains
other drug withdrawals other than NME drugs, which cause relatively smaller damage for affected
firms. There are 18 firms that have NME drug withdrawals and also have strategic alliance partners.
The wealth loss for shareholders of these firms is relatively smaller: - 3.69%, p = 0.02. Looking at
Panel A for alliance partners formed portfolios based the firms withdrawn drugs, the spillover
effects are negative in most cases, although not statistically significant in general. The lack of
statistical significance is possibly due to the small sample size and the fact that withdrawn drugs are
usually approved a few years ago and the drug withdrawal may not affect the partner much if the
partnership is not based on that particular drug since their partnership could be based on a different
drug development. Turning to Panel B of Table 2.7 which examines the cross-sectional mean
abnormal return of alliance partners, I find some evidence of significant negative spillover on
horizontal alliance partners in a three-day window: -1.37%, p = 0.10. Moreover, in a eleven-day
window, short-term strategic alliances suffer a large -5.23% wealth loss from their partners’ drug
withdrawals. Jointly, Table 2.7 shows that there are sometimes large wealth losses from alliance
partners’ extreme adverse events.
25 See “IBM, Intel Drop on Profit News As Rally in Stocks Comes to a Halt”, Wall Street Journal, April 20, 2000.
69
6. TESTS FOR INFORMATION LEAKAGE/ANTICIPATION AND RETURN
REVERSALS
As I discuss in Section 5.2, there are various news reports about the different stages of
clinical trial results, expert opinions, and FDA reviews prior to the FDA approvals. Therefore, there
might be some anticipation in the stock market regarding these FDA approvals. Moreover, the
possibility of information leakage for the purpose of insider trading also exists for the drug stocks,
given the documented larger insider gains of R&D intensive firms (Aboody and Lev, 2000).
At the same time, it is also of interest to examine if there is any return reversal after these
innovation events. Liu (2006) finds evidence of a negative drift after R&D news events and
attributes the drift to investors’ expectation errors on these news events. That is, given the inherent
uncertainty in risky new endeavors, it is difficult for investors to precisely evaluate the economic
value of these innovative events. Mispricing for innovation events is more likely for firms with a
weak technology base, high B/M ratio, and larger size. I therefore test for the possibilities of
information leakage/anticipation prior to various innovation events and return reversals after these
events by looking at CARs with different event windows.
To conduct these tests, I use the same market model and daily stock returns from CRSP files
to calculate cumulative abnormal returns (CARs) for various pre-event windows such as (-10,-2), (-
20,-2), (-30,-2), (-60,-2), (-90,-2), (-120,-2), (-20,-11), (-60,-11), and (2,10) for information
leakage/anticipation effects, and post-event windows such as (2,30), (2,60), (2,90), (2,120), (31,60),
(61,90), and (91,120) for return reversal effect. The significance test statistics include Patell Z, Cross-
sectional t-stat as well as its standardized counterpart a.k.a. Boehmer’s et al. (1991) t-stat.
The tests results for all Orphan Drug announcements are presented in Panel A of Table 2.8.
There is little evidence of either information leakage/anticipation effect or return reversal effects.
70
The only exception is during event window ((61, 90)), where the CAR is negative and significant,
which possibly indicates either some return reversal or some other negative events. Since the CARs
for different event windows, such as (31, 60), (31, 60), and (91, 120), are not consistently significant
and negative, I cannot make any meaningful inference regarding the return reversals for Orphan
drug announcements. I also test the subsample of OD innovators with alliance partners to see if
there is any different pattern since those OD innovators with partners might share information with
their alliance partners and therefore are more likely to have information leakage effect prior to the
announcements. As I can see from Panel B of Table 2.8, the CARs and their statistical significances
for pre-event windows and post-event windows are not that different from those for all OD
innovators. Thus, I conclude that OD innovation announcements do not have discernable pre-
announcement information leakage or post-announcement return reversals. The lack of consistent
evidence on information leak/anticipation and return reversals for these OD innovators suggests
that the stock market reaction is generally well captured during the announcement period. It
provides further support for the wealth effect and spillover on partners I find in Panel A of Table
2.3.
In Table 2.9, I provide results for the similar tests for NME drug announcements. The
information leakage/anticipation effect for this type of innovation news is more noticeable. During
the event windows (-10, -2) and (-20, -2), the CARs are 0.77%, and 0.99%, and statistically
significant at the 5% level. The difference between NME drug announcements and Orphan drug
announcements is that the former has a relatively longer and established history, and has a larger
number of announcements per year. It is quite likely that investors, especially insiders, pay more
attention to this kind of announcement than an OD announcement, since OD news tends to be
more uncertain with more unpredictable outcomes. So the stock market reaction to NME
announcements is not as concentrated on the announcement period, consistent with the lower
71
statistical significance in Panel B of Table 2.3. Furthermore, there is evidence of return reversals for
the NME drug announcements, which is consistent with the findings in Liu (2006), who uses
different types of innovation announcements. The return reversals could be attributed to the
investors’ expectation errors due to overoptimism for some of these drug announcements. It may
also relate to some subsequent negative news announcements regarding these NME drugs. Panel B
of Table 2.9 presents the results for the subsample of NME innovators with alliance partners to see
if there is any different pattern. The CARs and their statistical significances for pre-event windows
and post-event windows are similar to those for all NME innovators. In sum, NME innovation
announcements do have some discernable pre-announcement information leakage/anticipation or
post-announcement return reversals.
Table 2.10 shows the results for the similar tests for NDA drug announcements. As I
discussed earlier in the paper, these NDA drugs are breakthrough innovations, but are more
“ordinary” innovations in nature and much larger in terms of the number of approvals per year.
Presumably, the gains from insider trading on these drugs might not be large enough to provide high
incentives for insiders to gather insider information. Not surprisingly, I do not see any significant
information leakage and anticipation for this type of innovation announcements. There is, however,
some consistent evidence of return reversals on these drug approvals, possibly for the similar reason
of expectation errors or other subsequent negative news.
Tables 2.11 and 2.12 present the results for the test of information leakage/anticipation and
return reversals for the FDA warnings and NME withdrawals. Both types of adverse news events
demonstrate some information leakage/anticipation effects. For FDA warnings, the event windows
(-30, -2) and (-60, -2) have CARs of -1.53% and -1.29% and are statistically significant at the 1% and
5% levels, respectively, based on the Boehmer’s et al (1991) t-statistics. For NME withdrawals,
evidence of the information leakage/anticipation is relatively weaker. The CARs for event windows
72
(-90, -2) and (-120, -2) are -5.70% and -12.2%, but the statistical significance level are lower and not
that consistent across different test statistics. The possible reason is that for the FDA warnings, the
sample size is much larger, and there are various formal communications, such as Form 483,
regarding the adverse events related to the eventual warning letters26. Some of the communications
in Form 483 might contain quite damaging information for the firms receiving these letters. On the
other hand, I do not find consistent evidence of return reversals for both FDA warning letters and
NME withdrawals, which means that all the stock market reaction on these negative news events for
the innovators is captured by the announcement period CARs.
Overall, the tests for information leakage/anticipation and return reversals show that the
effects depend on the types of the innovation events. Some of the events have more information
leakage/anticipation effect because of the higher information-gathering incentives brought by larger
insider gains, whereas other events are more likely to cause return reversals due to investors’
expectation errors on these drug stocks.
7. CROSS-SECTIONAL ANALYSES OF INNOVATION ABNORMAL RETURNS AND
SPILLOVERS
To gain further insight into the cross-sectional variation in the stock market response to
innovation events, I conduct regression analyses of the innovation abnormal returns for innovators
and spillover effects on their alliance partners in this section.
In Table 2.13, I regress the cumulative abnormal returns for each innovator firm measured
from a three-day event window (-1, +1) against innovation event variables, innovator firm
characteristics, and alliance characteristics variables. The innovation events variables tested in this 26 See http://www.linkedin.com/groups/What-s-difference-between-Form-3826946.S.107029617 for the discussion regarding FDA Form 483.
73
table include dummy variables radical innovation, radical innovation 1 (OD drug), and radical innovation 2
(NME drug). Radical innovation indicates that the innovation announcement is a FDA Orphan Drug
(OD) or NME drug approval. The other two dummy variables, radical innovation 1 (OD drug) and
radical innovation 2 (NME drug), indicate the innovation announcements fall into the subcategories of
two types of radical innovations. The innovator firm characteristics of interest are newly listed
innovator firm (IPO innovator), innovator size, Tobin’s Q, and innovator with only one alliance partner
(single alliance innovator). The alliance characteristics variables capture the various types of contracts or
agreements between innovator firms and their alliance partners. The variables include strategic alliance,
R&D agreement, horizontal alliance, joint venture, public alliance, among others. All variables are defined in
Appendix 2.A: Variable definitions. The sample for Table 2.13 includes announcements events for
radical innovations (FDA Orphan Drug approvals and FDA NME drug approvals), and
breakthrough innovations (FDA Original New Drug Approvals). These innovation events generate
larger abnormal returns and have relatively larger spillover effect than incremental innovation events
such as FDA ANDA approvals.
Panel A of Table 2.13 shows descriptive statistics and Panel B presents the cross-sectional
regression analysis of the innovator’s cumulative abnormal return (CAR) during the three-day event
window (Innovator CAR (3-day), or icar3). One of the main results in this table is that radical
innovations, especially FDA NME approvals, generate substantially larger abnormal returns than
other types of more “ordinary” innovations. The regression coefficients for the variable radical
innovation are positive and statistically significant at the 5% level in most regression models. When I
separate the radical innovations into OD drug and NME drug approvals in regression models 7 to
11, I see that the larger abnormal returns mainly come from the latter. Secondly, innovators that are
publicly listed for 5 or less years and smaller innovators experience higher stock market gains when
they announce innovation events. In particular, in models 1 to 4, the coefficients for innovator size
74
are negative and statistically significant at the 1% level. In models 5 to 11, the coefficients for IPO
innovator are positive and statistically significant in most models. Third, consistent with the univariate
results, innovators with alliance partners experience smaller abnormal returns, suggesting that the
alliance partners may be sharing in some of the gain from the innovation event. The coefficients for
all kinds of alliance characteristics are negative and many are statistically significant.
I now turn to the regression analyses of the innovation spillover effect on alliance partners.
In Table 2.14, Panel A is the descriptive statistics and Panel B presents the cross-sectional regression
analysis of the average partners’ cumulative abnormal returns (partner CAR(3-day), or pmcar3) during
the three-day event window 27 . The main independent variables are similar to those for the
regressions of the innovators’ abnormal returns. However, since the goal is to investigate the
spillover effect of innovation events on alliance partners, I include the innovators’ CARs in the
regressions to test the degree of surprise contained in the innovation announcements, following the
previous literature such as Kohers and Kohers (2004), Oxley, Sampson, and Silverman (2009), and
Chen, Ho, and Ik (2005). The coefficients for innovators’ abnormal returns (Innovator CAR (3-day))
are positive and highly statistically significant at the 1% level for all regression models in Panel B.
The spillover effect on alliance partners is even stronger for radical innovations with a large degree
of surprise, as shown by the significant, positive interaction between radical innovations and
innovator CAR. In addition, I control for some other variables, such as size, Tobin's Q, and alliance
characteristics. As far as partner characteristics are concerned, IPO partners tend to experience
larger spillover; partners’ Tobin’s Q contributes to larger spillover; and newly listed partners tend to
experience larger spillover gains. The innovators’ Tobin’s Q is also positively associated with the
spillover effect for partners. Moreover, the more partners the innovator has (Log(Num ptn per
27 I also use 5-day and 11-day event window CARs as dependent variables and find similar results, although there is slight difference in statistical significance levels, which is consistent with the univariate results in Table 3. The innovator CARs, partners CARs, Tobin’s Q, and size variables are all winsorized at 1% and 99% percent level to reduce the impact of outliers.
75
innovator)), the less spillover there is for each partner. Along the same lines, partners who only have
one alliance (with the innovator) also get larger spillover during the 3-day event window (Model 3).
Finally, the negative and statistically significant (1%) coefficients for the variable Log(Alliance duration)
in all models show that short-term, or more recent alliance partners experience larger spillover
effects..
Taken together, the cross-sectional analyses further support the univariate results regarding
the abnormal returns to innovators and spillover effect to their alliance partners around the
innovation announcements. The results in this section also shed light on some other important
variables, such as firm age, firm size, and Tobin’s Q in leading to the stock market response of
innovation events for innovators and their alliance partners.
8. CONCLUSION
This paper explores the relationship of firm boundaries and the market value of innovations.
I advance the proposition that firms reap large stock market wealth from their innovation
announcements. I take the proposition to a novel setting with comprehensive innovation
documentation. I classify the innovations in the pharmaceutical industry as radical, breakthrough,
and incremental innovations based on their scientific and technological achievements and customer
benefit enhancements. I find corresponding abnormal announcement returns for these three types
of innovations. More importantly, I provide direct stock market evidence that the alliance partners
of these pharmaceutical innovators also benefit from the spillover effect of these innovations,
although the gains are smaller than that for the innovators. Cross-sectional analyses of the abnormal
returns to innovators and spillover effect on partners demonstrate that young and newly listed
innovators with better growth opportunities play a more important role in leading to greater degree
76
of surprises and associated spillover effect. I also examine the risk associated with these innovations
by looking at the wealth losses and spillover to alliance partners around two sets of adverse events
related to the pharmaceutical innovators, and found substantial wealth loss for them and their
alliance partners.
Our findings make significant contributions to the current literature on innovations by
shifting the setting of innovations from patent data to pharmaceutical drug development. I find that
the stock market highly values strategic alliance partnership among high-tech industries such as
biopharmaceutical industry. I also differentiate the innovations along the technological breakthrough
and market breakthrough dimensions and find that investors value these innovations accordingly.
The spillover effects of innovations on strategic alliance partners provide direct evidence on the
close relationship between innovations and alliance partnerships. I also examine the division of gains
among alliance partners in a new setting and find evidence supporting the asymmetric gains
hypothesis between commercializing pharmaceutical firms and their research partners.
9. REFERENCES
Aboody, D., Lev, B., 2000, “Information Asymmetry, R&D, and Insider Gains,”Journal of Finance 55
(2000), 2747-2766.
Acemoglu, D., Linn J., 2004, “Market Size in Innovation: Theory and Evidence from the
Pharmaceutical Industry,” Quarterly Journal of Economics, 119(3): 1049–90.
Aghion, P., Jean, T., 1994, “The management of innovation, Quarterly Journal of Economics 109, 1185-
1209.
Ahmed P, Gardella, J., Nanda, S., 2002, “Wealth effects of drug withdrawals on firms and their
competitors,” Financial Management 21–41.

77
Atanassov, J., 2013, “Do hostile takeovers stifle innovation? Evidence from antitakeover legislation
and corporate patenting,”Journal of Finance. Forthcoming.
Austin, D. H., 1993, “An Event-Study Approach to Measuring Innovative Output: The Case of
Biotechnology,”American Economic Review 83(2), 253-258.
Bodnaruk, A., Massa, M., Simonov, A., 2013, “Alliances and corporate governance,” Journal of
Financial Economics 107, 671-693.
Boone, A.L., Ivanov, V., 2012, “Bankruptcy spillover effects on strategic alliance partners,” Journal of
Financial Economics 103,551–569.
Chan, S. H., Kensinger, J.W., A. Keown. J., Martin, J., 1997, “Do Strategic Alliances Create Value? ”
Journal of Financial Economics 46: 199-221.
Chan, L.K.C., Lakonishok, J., Sougiannis, T., 2001, “The stock market valuation of research and
development expenditures,” Journal of Finance 56, 2431–2456.
Chandy, R., Hopstaken, B., Narasimhan, O., Prabhu, J., 2006, “From Invention to Innovation:
Conversion Ability in Product Development,” Journal of Marketing Research, 43 (August), 494-
508.
Chandy, R.K., Tellis, G. J., 2000, “The Incumbent’s Curse? Incumbency, Size, and Radical Product
Innovation,” Journal of Marketing 64 (July), 1–17.
Chaney, P.K., Devinney, T. M., Winer, R.S., 1991, “The Impact of New Product Introductions on
the Market Value of Firms,” Journal of Business, 64 (4), 573-610.
Chen, S.-S., Ho, K.W., Ik, K.H., 2005, “The Wealth Effect of New Product Introductions on
Industry Rivals,” Journal of Business 78 (3): 969-996.
Coff, R.W., Lee, P.M., 2003, “Insider trading as a vehicle to appropriate rent from R&D,” Strategic
Management Journal 24(2): 183–190.
78
Danzon, P.M., Nicholson, S., Pereira, N.S., 2005, “Productivity in pharmaceutical biotechnology
R&D: the role of experience and alliances,” Journal of Health Economics 24 (2), 317-339.
Das, S., Sen, P.K., Sengupta, S., 1998, “Impact of strategic alliances on firm valuation,” Academy of
Management Journal 41(1): 27-41.
DiMasi, J.A., Grabowski, H.G., 2007, “The Cost of Biopharmaceutical R&D: Is Biotech Different?”
Managerial and Decision Economics 28: 469–479.
Gomes-Casseres, B., Hagedoorn. J., Jaffe, A., 2006, “Do alliances promote knowledge flows?”
Journal of Financial Economics, 80: 5-33.
Hall, B.H., Jaffe, A., Trajtenberg, M., 2005, “Market Value and Patent Citations,” RAND Journal of
Economics, 36 (1), 16-38.
Hendricks, K.B., Singhal, V.R., 1997, “ Delays in New Product Introductions and the Market Value
of the Firm: The Consequences of Being Late to the Market, ”Management Science, 43 (4), 422-
436.
Higgins, M., Rodriguez, D., 2006, “The outsourcing of R&D through acquisition in the
pharmaceutical industry,” Journal of Financial Economics 80:351-383.
Hirshleifer, D.A., Hsu, P.-H., Li, D.. 2013, “Innovative efficiency and stock returns,” Journal of
Financial Economics 107: 632–654.
Huberman, G., Regev, T., 2001, “Contagious Speculation and a Cure for Cancer: A Nonevent That
Made Stock Prices Soar,” Journal of Finance 56: 387-396.
Jarrell, G., Peltzman, S., , 1985, “The Impact of Product Recalls on the Wealth of the Sellers,”
Journal of Political Economy 93, 512-536.
Kalaignanam, K., Shankar, V., Varadarajan, R., 2007, “Asymmetric new product development
alliances: win-win or win-lose partnerships?” Management Science 53(3): 357-374.
79
Kohers, N. Kohers, T.., 2004, “Information sensitivity of high-tech industries: evidence from
merger announcements,” Applied Financial Economics, 14, 525–36.
Lazonick, W. Tulum, Ö., 2011, “US Biopharmaceutical Finance and the Sustainability of the
Biotech Business Model,” Research Policy 40(9), 1170-1187.
Lerner, J, Malmendier, U., 2010, “Contractibility the design of research agreements,” American
Economic Review: 100(1): 214–246.
Lindsey, L., 2008, “Blurring firm boundaries: the role of venture capital in strategic alliance,” Journal
of Finance 63, 1137–1168.
Liu, Q., 2006, “How good is good news? Technology depth, book-to-market ratio, and innovative
events,” Journal of Accounting, Auditing & Finance 21, 293–321.
McConnell, J. J., Nantell, T. J., 1985, “Corporate combinations and common stock returns: The case
of joint ventures,” Journal of Finance 40(2) 519–536.
Nicholson, S., Danzon, P., McCullough, J., 2005, “Biotech-pharmaceutical alliances as a signal of
asset and firm quality,” Journal of Business 78, 1433-1464.
Ozmel, U., Robinson, D., Stuart, T., 2013, “Strategic alliances, venture capital, and exit decisions in
early stage high-tech firms,” Journal of Financial Economics 107, 655-670.
Oxley, J.E., Sampson, R.C., Silverman, B.S., 2009, “Arms Race or Détente? How Interfirm Alliance
Announcements Change the Stock Market Valuation of Rivals,” Management Science (55:8), pp.
1321-1337.
Pakes, A., 1985, “On Patents, R & D, and the Stock Market Rate of Return,” Journal of Political
Economy, 93 (2), 390-409.

80
Pharmaceutical Research and Manufacturers of America, PhRMA, 2013, “Biopharmageuticals In
Perspective,”
http://phrma.org/sites/default/files/pdf/CHART%20PACK_online%20version_13APR04_forweb.p
df. Accessed May 2, 2013.
Rhodes-Kropf, M., Robinson, D., 2008, “The Market for Mergers and the Boundaries of the Firm,”
Journal of Finance, Vol. 63, 1169-1211.
Robinson, D., 2008, “Strategic alliances and the boundaries of the firm,” Review of Financial Studies 21,
649-681.
Romer, P., 1987, “Growth based on increasing returns due to specialization,” American Economic
Review 77, 56-62.
Romer, P., 1990, “Endogenous technological change,” Journal of Political Economy 98, 71-102.
Sampson, R.C., 2005, “Experience effects and collaborative returns in R&D alliances,”Strategic
Management Journal 26(11) 1009-1031.
Seru, A., 2012, “Firm Boundaries Matter: Evidence from Conglomerates and R&D Activity,” Journal
of Financial Economics, forthcoming.
Sevilir, M., Tian, X., 2012, “Acquiring innovation,”Working paper. Available at SSRN:
http://ssrn.com/abstract=1731722.
Solow, R., 1957, “Technical change and the aggregate production function,” Review of Economics and
Statistics 39, 312-320.
Sternitzke, C. 2010, “Knowledge sources, patent protection, and commercialization of
pharmaceutical innovations,” Research Policy 39, 810-821.

81
Table 2.1: Summary of New Drug Applications and Approvals by Year
The data on New Drug Application (NDA) received and approved is from the FDA website. A FDA NDA approval involves submitting data from specific technical viewpoints for review, including chemistry, pharmacology, medical, biopharmaceutics, and statistics. New Molecular Entity (NME) is an active ingredient that has never before been marketed in the U.S. in any form. Year NDAs Received NDAs Approved NMEs Approved 1980 162 114 12 1981 129 96 27 1982 202 116 28 1983 269 94 14 1984 217 142 22 1985 148 100 30 1986 120 98 20 1987 142 69 21 1988 126 67 21 1989 118 87 22 1990 98 64 23 1991 112 63 30 1992 100 91 26 1993 99 70 25 1994 114 62 22 1995 121 82 28 1996 120 131 53 1997 128 121 39 1998 121 90 30 1999 139 83 35 2000 115 98 27 2001 98 66 24 2002 105 78 17 2003 109 72 21 2004 115 119 36 2005 116 80 20 2006 124 101 22 2007 123 78 18 2008 140 89 24 2009 146 90 26 2010 103 93 21 2011 105 99 30 2012 102 96 34 Total 4168 2999 848
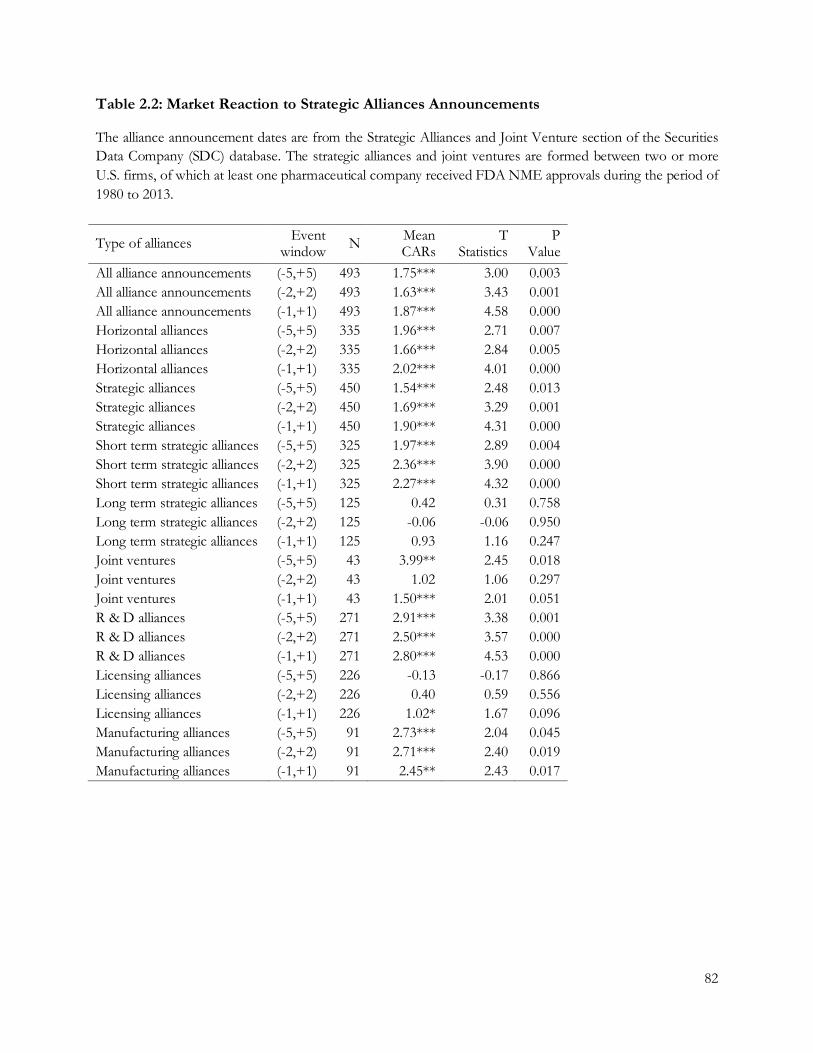
82
Table 2.2: Market Reaction to Strategic Alliances Announcements
The alliance announcement dates are from the Strategic Alliances and Joint Venture section of the Securities Data Company (SDC) database. The strategic alliances and joint ventures are formed between two or more U.S. firms, of which at least one pharmaceutical company received FDA NME approvals during the period of 1980 to 2013.
Type of alliances Event window N Mean
CARs T
Statistics P
Value All alliance announcements (-5,+5) 493 1.75*** 3.00 0.003 All alliance announcements (-2,+2) 493 1.63*** 3.43 0.001 All alliance announcements (-1,+1) 493 1.87*** 4.58 0.000 Horizontal alliances (-5,+5) 335 1.96*** 2.71 0.007 Horizontal alliances (-2,+2) 335 1.66*** 2.84 0.005 Horizontal alliances (-1,+1) 335 2.02*** 4.01 0.000 Strategic alliances (-5,+5) 450 1.54*** 2.48 0.013 Strategic alliances (-2,+2) 450 1.69*** 3.29 0.001 Strategic alliances (-1,+1) 450 1.90*** 4.31 0.000 Short term strategic alliances (-5,+5) 325 1.97*** 2.89 0.004 Short term strategic alliances (-2,+2) 325 2.36*** 3.90 0.000 Short term strategic alliances (-1,+1) 325 2.27*** 4.32 0.000 Long term strategic alliances (-5,+5) 125 0.42 0.31 0.758 Long term strategic alliances (-2,+2) 125 -0.06 -0.06 0.950 Long term strategic alliances (-1,+1) 125 0.93 1.16 0.247 Joint ventures (-5,+5) 43 3.99** 2.45 0.018 Joint ventures (-2,+2) 43 1.02 1.06 0.297 Joint ventures (-1,+1) 43 1.50*** 2.01 0.051 R & D alliances (-5,+5) 271 2.91*** 3.38 0.001 R & D alliances (-2,+2) 271 2.50*** 3.57 0.000 R & D alliances (-1,+1) 271 2.80*** 4.53 0.000 Licensing alliances (-5,+5) 226 -0.13 -0.17 0.866 Licensing alliances (-2,+2) 226 0.40 0.59 0.556 Licensing alliances (-1,+1) 226 1.02* 1.67 0.096 Manufacturing alliances (-5,+5) 91 2.73*** 2.04 0.045 Manufacturing alliances (-2,+2) 91 2.71*** 2.40 0.019 Manufacturing alliances (-1,+1) 91 2.45** 2.43 0.017
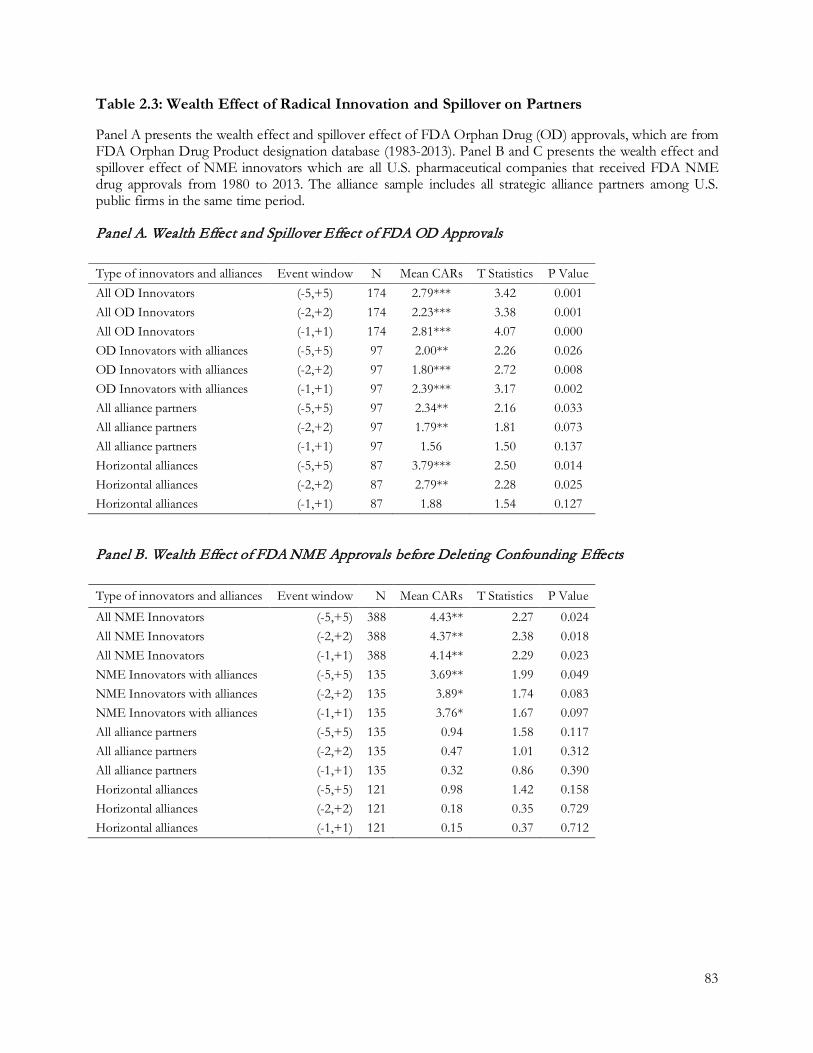
83
Table 2.3: Wealth Effect of Radical Innovation and Spillover on Partners
Panel A presents the wealth effect and spillover effect of FDA Orphan Drug (OD) approvals, which are from FDA Orphan Drug Product designation database (1983-2013). Panel B and C presents the wealth effect and spillover effect of NME innovators which are all U.S. pharmaceutical companies that received FDA NME drug approvals from 1980 to 2013. The alliance sample includes all strategic alliance partners among U.S. public firms in the same time period. Panel A. Wealth Effect and Spillover Effect of FDA OD Approvals
Type of innovators and alliances Event window N Mean CARs T Statistics P Value All OD Innovators (-5,+5) 174 2.79*** 3.42 0.001 All OD Innovators (-2,+2) 174 2.23*** 3.38 0.001 All OD Innovators (-1,+1) 174 2.81*** 4.07 0.000 OD Innovators with alliances (-5,+5) 97 2.00** 2.26 0.026 OD Innovators with alliances (-2,+2) 97 1.80*** 2.72 0.008 OD Innovators with alliances (-1,+1) 97 2.39*** 3.17 0.002 All alliance partners (-5,+5) 97 2.34** 2.16 0.033 All alliance partners (-2,+2) 97 1.79** 1.81 0.073 All alliance partners (-1,+1) 97 1.56 1.50 0.137 Horizontal alliances (-5,+5) 87 3.79*** 2.50 0.014 Horizontal alliances (-2,+2) 87 2.79** 2.28 0.025 Horizontal alliances (-1,+1) 87 1.88 1.54 0.127
Panel B. Wealth Effect of FDA NME Approvals before Deleting Confounding Effects
Type of innovators and alliances Event window N Mean CARs T Statistics P Value
All NME Innovators (-5,+5) 388 4.43** 2.27 0.024 All NME Innovators (-2,+2) 388 4.37** 2.38 0.018 All NME Innovators (-1,+1) 388 4.14** 2.29 0.023 NME Innovators with alliances (-5,+5) 135 3.69** 1.99 0.049 NME Innovators with alliances (-2,+2) 135 3.89* 1.74 0.083 NME Innovators with alliances (-1,+1) 135 3.76* 1.67 0.097 All alliance partners (-5,+5) 135 0.94 1.58 0.117 All alliance partners (-2,+2) 135 0.47 1.01 0.312 All alliance partners (-1,+1) 135 0.32 0.86 0.390 Horizontal alliances (-5,+5) 121 0.98 1.42 0.158 Horizontal alliances (-2,+2) 121 0.18 0.35 0.729 Horizontal alliances (-1,+1) 121 0.15 0.37 0.712

84
Panel C. Wealth Effect of FDA NME Approvals after Deleting Confounding Effects Type of innovators and alliances Event window N Mean CARs T Statistics P Value All NME Innovators (-5,+5) 380 4.57** 2.30 0.022 All NME Innovators (-2,+2) 380 4.49** 2.39 0.017 All NME Innovators (-1,+1) 380 4.30** 2.33 0.021 NME Innovators with alliances (-5,+5) 113 2.28*** 3.27 0.001 NME Innovators with alliances (-2,+2) 113 1.91*** 3.30 0.001 NME Innovators with alliances (-1,+1) 113 1.74*** 4.85 0.000 All alliance partners (-5,+5) 113 0.83 1.06 0.293 All alliance partners (-2,+2) 113 0.17 0.32 0.752 All alliance partners (-1,+1) 113 0.17 0.43 0.671 Horizontal alliances (-5,+5) 102 1.01 1.10 0.274 Horizontal alliances (-2,+2) 102 0.09 0.15 0.883 Horizontal alliances (-1,+1) 102 0.16 0.35 0.728 Panel D. Wealth Effect of FDA NME Approvals (News Report Dates) Type of innovators and alliances Event window N Mean CARs T Statistics P Value NME Innovators with alliances (-5,+5) 124 3.67* 1.82 0.072 NME Innovators with alliances (-2,+2) 124 3.79 1.57 0.119 NME Innovators with alliances (-1,+1) 124 3.67 1.50 0.137 All alliance partners (-5,+5) 124 1.25*** 2.54 0.012 All alliance partners (-2,+2) 124 0.90*** 2.82 0.006 All alliance partners (-1,+1) 124 0.52** 1.95 0.053 Horizontal alliances (-5,+5) 96 1.30** 2.04 0.044 Horizontal alliances (-2,+2) 96 0.82* 1.87 0.065 Horizontal alliances (-1,+1) 96 0.62* 1.77 0.080
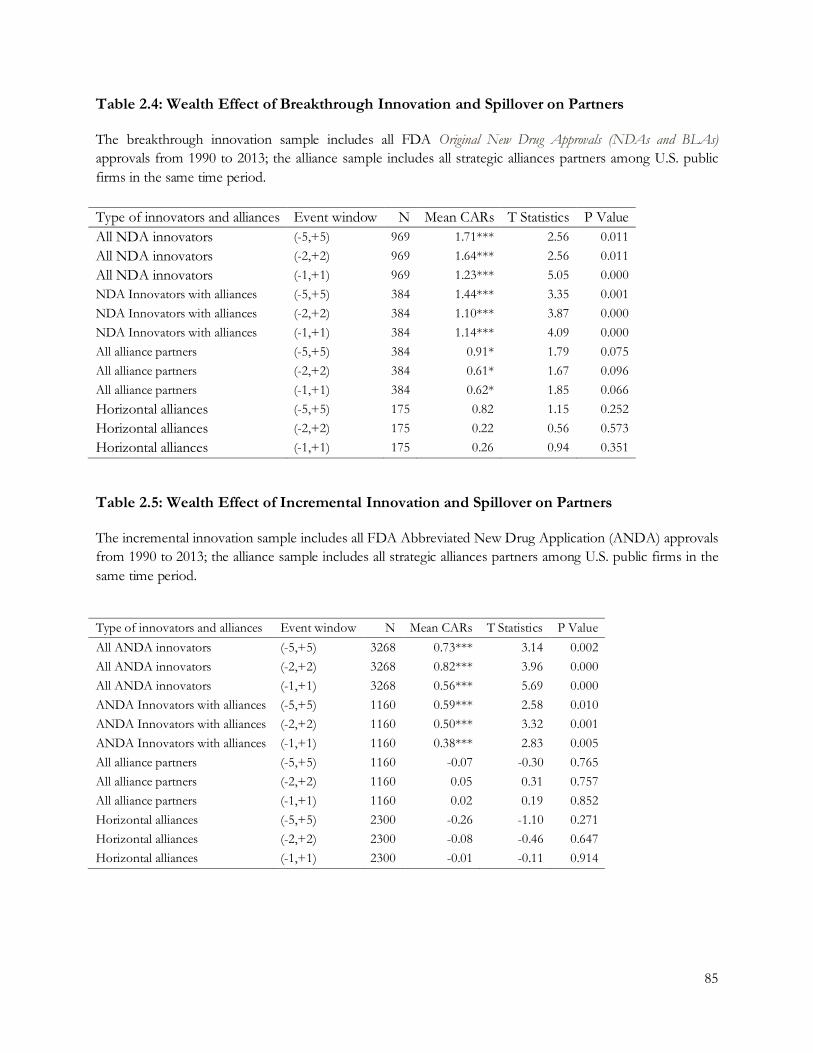
85
Table 2.4: Wealth Effect of Breakthrough Innovation and Spillover on Partners
The breakthrough innovation sample includes all FDA Original New Drug Approvals (NDAs and BLAs) approvals from 1990 to 2013; the alliance sample includes all strategic alliances partners among U.S. public firms in the same time period. Type of innovators and alliances Event window N Mean CARs T Statistics P Value All NDA innovators (-5,+5) 969 1.71*** 2.56 0.011 All NDA innovators (-2,+2) 969 1.64*** 2.56 0.011 All NDA innovators (-1,+1) 969 1.23*** 5.05 0.000 NDA Innovators with alliances (-5,+5) 384 1.44*** 3.35 0.001 NDA Innovators with alliances (-2,+2) 384 1.10*** 3.87 0.000 NDA Innovators with alliances (-1,+1) 384 1.14*** 4.09 0.000 All alliance partners (-5,+5) 384 0.91* 1.79 0.075 All alliance partners (-2,+2) 384 0.61* 1.67 0.096 All alliance partners (-1,+1) 384 0.62* 1.85 0.066 Horizontal alliances (-5,+5) 175 0.82 1.15 0.252 Horizontal alliances (-2,+2) 175 0.22 0.56 0.573 Horizontal alliances (-1,+1) 175 0.26 0.94 0.351
Table 2.5: Wealth Effect of Incremental Innovation and Spillover on Partners
The incremental innovation sample includes all FDA Abbreviated New Drug Application (ANDA) approvals from 1990 to 2013; the alliance sample includes all strategic alliances partners among U.S. public firms in the same time period.
Type of innovators and alliances Event window N Mean CARs T Statistics P Value All ANDA innovators (-5,+5) 3268 0.73*** 3.14 0.002 All ANDA innovators (-2,+2) 3268 0.82*** 3.96 0.000 All ANDA innovators (-1,+1) 3268 0.56*** 5.69 0.000 ANDA Innovators with alliances (-5,+5) 1160 0.59*** 2.58 0.010 ANDA Innovators with alliances (-2,+2) 1160 0.50*** 3.32 0.001 ANDA Innovators with alliances (-1,+1) 1160 0.38*** 2.83 0.005 All alliance partners (-5,+5) 1160 -0.07 -0.30 0.765 All alliance partners (-2,+2) 1160 0.05 0.31 0.757 All alliance partners (-1,+1) 1160 0.02 0.19 0.852 Horizontal alliances (-5,+5) 2300 -0.26 -1.10 0.271 Horizontal alliances (-2,+2) 2300 -0.08 -0.46 0.647 Horizontal alliances (-1,+1) 2300 -0.01 -0.11 0.914
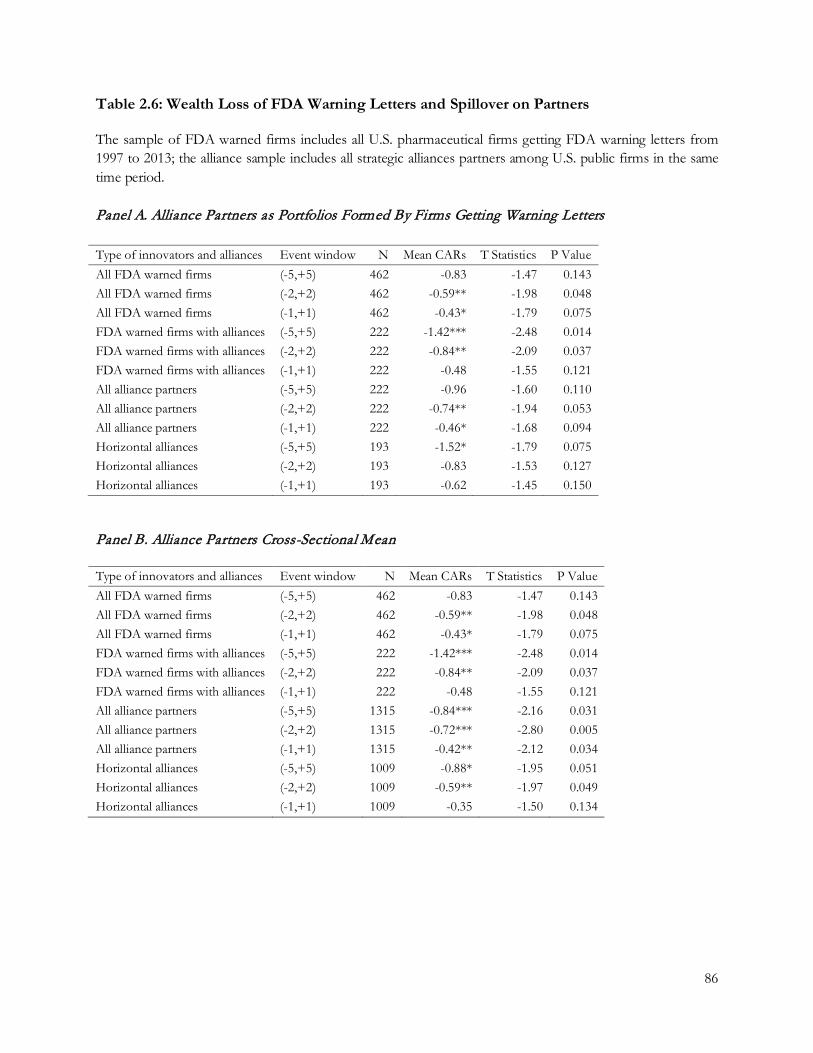
86
Table 2.6: Wealth Loss of FDA Warning Letters and Spillover on Partners
The sample of FDA warned firms includes all U.S. pharmaceutical firms getting FDA warning letters from 1997 to 2013; the alliance sample includes all strategic alliances partners among U.S. public firms in the same time period. Panel A. Alliance Partners as Portfolios Formed By Firms Getting Warning Letters
Type of innovators and alliances Event window N Mean CARs T Statistics P Value All FDA warned firms (-5,+5) 462 -0.83 -1.47 0.143 All FDA warned firms (-2,+2) 462 -0.59** -1.98 0.048 All FDA warned firms (-1,+1) 462 -0.43* -1.79 0.075 FDA warned firms with alliances (-5,+5) 222 -1.42*** -2.48 0.014 FDA warned firms with alliances (-2,+2) 222 -0.84** -2.09 0.037 FDA warned firms with alliances (-1,+1) 222 -0.48 -1.55 0.121 All alliance partners (-5,+5) 222 -0.96 -1.60 0.110 All alliance partners (-2,+2) 222 -0.74** -1.94 0.053 All alliance partners (-1,+1) 222 -0.46* -1.68 0.094 Horizontal alliances (-5,+5) 193 -1.52* -1.79 0.075 Horizontal alliances (-2,+2) 193 -0.83 -1.53 0.127 Horizontal alliances (-1,+1) 193 -0.62 -1.45 0.150
Panel B. Alliance Partners Cross-Sectional Mean Type of innovators and alliances Event window N Mean CARs T Statistics P Value All FDA warned firms (-5,+5) 462 -0.83 -1.47 0.143 All FDA warned firms (-2,+2) 462 -0.59** -1.98 0.048 All FDA warned firms (-1,+1) 462 -0.43* -1.79 0.075 FDA warned firms with alliances (-5,+5) 222 -1.42*** -2.48 0.014 FDA warned firms with alliances (-2,+2) 222 -0.84** -2.09 0.037 FDA warned firms with alliances (-1,+1) 222 -0.48 -1.55 0.121 All alliance partners (-5,+5) 1315 -0.84*** -2.16 0.031 All alliance partners (-2,+2) 1315 -0.72*** -2.80 0.005 All alliance partners (-1,+1) 1315 -0.42** -2.12 0.034 Horizontal alliances (-5,+5) 1009 -0.88* -1.95 0.051 Horizontal alliances (-2,+2) 1009 -0.59** -1.97 0.049 Horizontal alliances (-1,+1) 1009 -0.35 -1.50 0.134
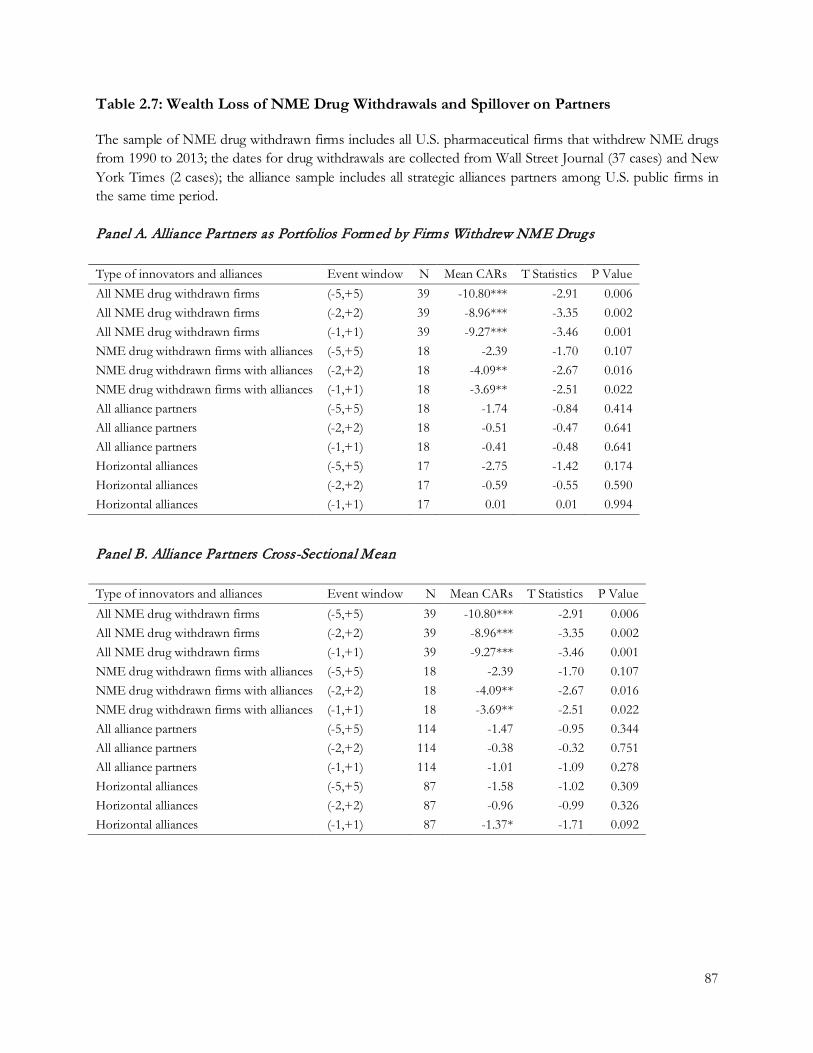
87
Table 2.7: Wealth Loss of NME Drug Withdrawals and Spillover on Partners
The sample of NME drug withdrawn firms includes all U.S. pharmaceutical firms that withdrew NME drugs from 1990 to 2013; the dates for drug withdrawals are collected from Wall Street Journal (37 cases) and New York Times (2 cases); the alliance sample includes all strategic alliances partners among U.S. public firms in the same time period. Panel A. Alliance Partners as Portfolios Formed by Firms Withdrew NME Drugs
Type of innovators and alliances Event window N Mean CARs T Statistics P Value All NME drug withdrawn firms (-5,+5) 39 -10.80*** -2.91 0.006 All NME drug withdrawn firms (-2,+2) 39 -8.96*** -3.35 0.002 All NME drug withdrawn firms (-1,+1) 39 -9.27*** -3.46 0.001 NME drug withdrawn firms with alliances (-5,+5) 18 -2.39 -1.70 0.107 NME drug withdrawn firms with alliances (-2,+2) 18 -4.09** -2.67 0.016 NME drug withdrawn firms with alliances (-1,+1) 18 -3.69** -2.51 0.022 All alliance partners (-5,+5) 18 -1.74 -0.84 0.414 All alliance partners (-2,+2) 18 -0.51 -0.47 0.641 All alliance partners (-1,+1) 18 -0.41 -0.48 0.641 Horizontal alliances (-5,+5) 17 -2.75 -1.42 0.174 Horizontal alliances (-2,+2) 17 -0.59 -0.55 0.590 Horizontal alliances (-1,+1) 17 0.01 0.01 0.994
Panel B. Alliance Partners Cross-Sectional Mean
Type of innovators and alliances Event window N Mean CARs T Statistics P Value All NME drug withdrawn firms (-5,+5) 39 -10.80*** -2.91 0.006 All NME drug withdrawn firms (-2,+2) 39 -8.96*** -3.35 0.002 All NME drug withdrawn firms (-1,+1) 39 -9.27*** -3.46 0.001 NME drug withdrawn firms with alliances (-5,+5) 18 -2.39 -1.70 0.107 NME drug withdrawn firms with alliances (-2,+2) 18 -4.09** -2.67 0.016 NME drug withdrawn firms with alliances (-1,+1) 18 -3.69** -2.51 0.022 All alliance partners (-5,+5) 114 -1.47 -0.95 0.344 All alliance partners (-2,+2) 114 -0.38 -0.32 0.751 All alliance partners (-1,+1) 114 -1.01 -1.09 0.278 Horizontal alliances (-5,+5) 87 -1.58 -1.02 0.309 Horizontal alliances (-2,+2) 87 -0.96 -0.99 0.326 Horizontal alliances (-1,+1) 87 -1.37* -1.71 0.092
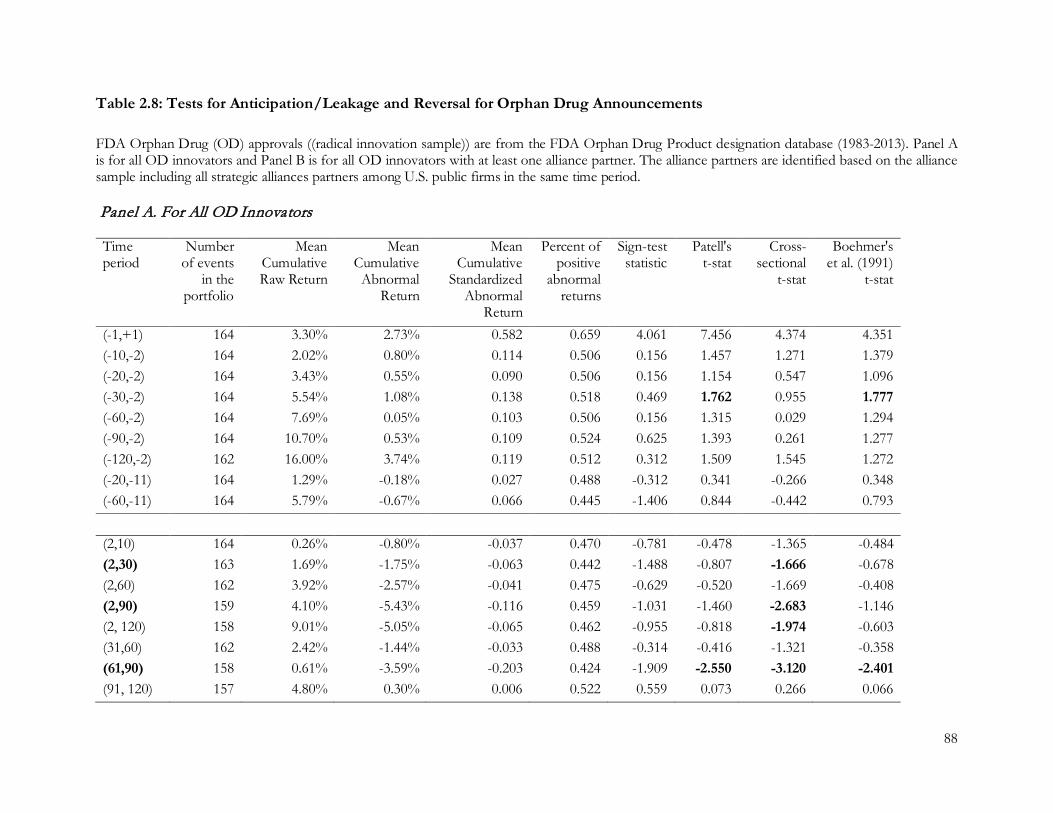
88
Table 2.8: Tests for Anticipation/Leakage and Reversal for Orphan Drug Announcements
FDA Orphan Drug (OD) approvals ((radical innovation sample)) are from the FDA Orphan Drug Product designation database (1983-2013). Panel A is for all OD innovators and Panel B is for all OD innovators with at least one alliance partner. The alliance partners are identified based on the alliance sample including all strategic alliances partners among U.S. public firms in the same time period. Panel A. For All OD Innovators
Time period
Number of events
in the portfolio
Mean Cumulative Raw Return
Mean Cumulative
Abnormal Return
Mean Cumulative
Standardized Abnormal
Return
Percent of positive
abnormal returns
Sign-test statistic
Patell's t-stat
Cross-sectional
t-stat
Boehmer's et al. (1991)
t-stat
(-1,+1) 164 3.30% 2.73% 0.582 0.659 4.061 7.456 4.374 4.351 (-10,-2) 164 2.02% 0.80% 0.114 0.506 0.156 1.457 1.271 1.379 (-20,-2) 164 3.43% 0.55% 0.090 0.506 0.156 1.154 0.547 1.096 (-30,-2) 164 5.54% 1.08% 0.138 0.518 0.469 1.762 0.955 1.777 (-60,-2) 164 7.69% 0.05% 0.103 0.506 0.156 1.315 0.029 1.294 (-90,-2) 164 10.70% 0.53% 0.109 0.524 0.625 1.393 0.261 1.277 (-120,-2) 162 16.00% 3.74% 0.119 0.512 0.312 1.509 1.545 1.272 (-20,-11) 164 1.29% -0.18% 0.027 0.488 -0.312 0.341 -0.266 0.348 (-60,-11) 164 5.79% -0.67% 0.066 0.445 -1.406 0.844 -0.442 0.793 (2,10) 164 0.26% -0.80% -0.037 0.470 -0.781 -0.478 -1.365 -0.484 (2,30) 163 1.69% -1.75% -0.063 0.442 -1.488 -0.807 -1.666 -0.678 (2,60) 162 3.92% -2.57% -0.041 0.475 -0.629 -0.520 -1.669 -0.408 (2,90) 159 4.10% -5.43% -0.116 0.459 -1.031 -1.460 -2.683 -1.146 (2, 120) 158 9.01% -5.05% -0.065 0.462 -0.955 -0.818 -1.974 -0.603 (31,60) 162 2.42% -1.44% -0.033 0.488 -0.314 -0.416 -1.321 -0.358 (61,90) 158 0.61% -3.59% -0.203 0.424 -1.909 -2.550 -3.120 -2.401 (91, 120) 157 4.80% 0.30% 0.006 0.522 0.559 0.073 0.266 0.066
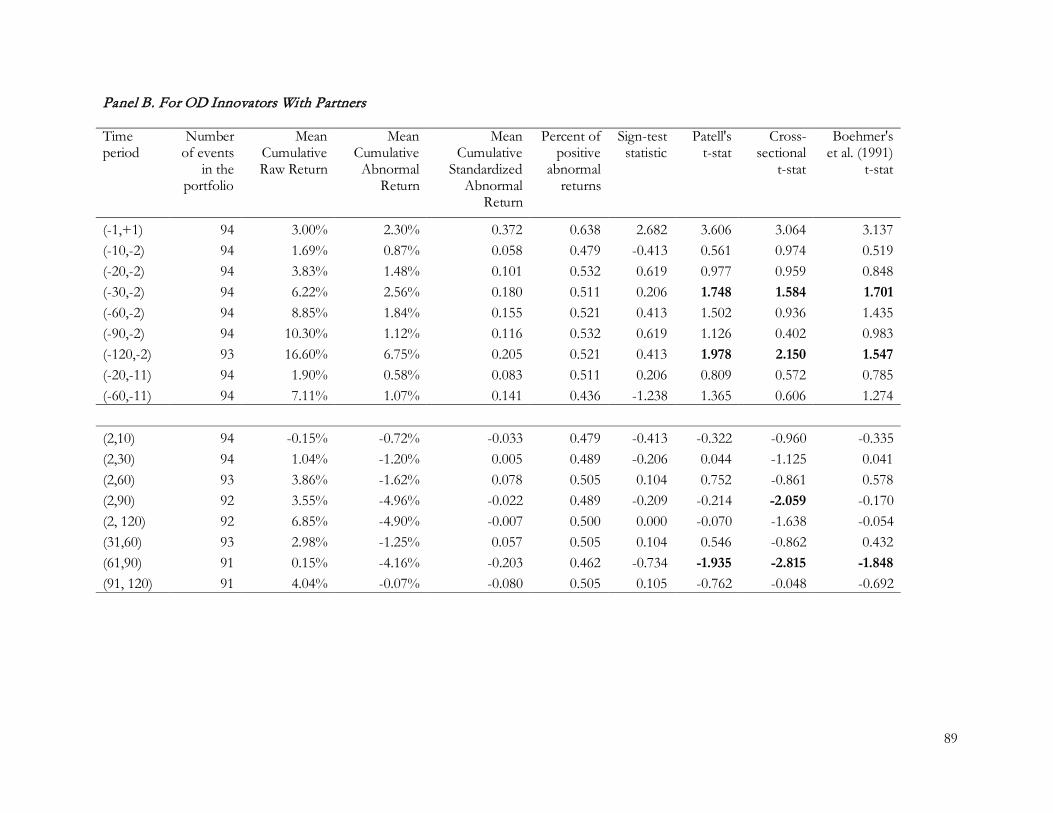
89
Panel B. For OD Innovators With Partners
Time period
Number of events
in the portfolio
Mean Cumulative Raw Return
Mean Cumulative
Abnormal Return
Mean Cumulative
Standardized Abnormal
Return
Percent of positive
abnormal returns
Sign-test statistic
Patell's t-stat
Cross-sectional
t-stat
Boehmer's et al. (1991)
t-stat
(-1,+1) 94 3.00% 2.30% 0.372 0.638 2.682 3.606 3.064 3.137 (-10,-2) 94 1.69% 0.87% 0.058 0.479 -0.413 0.561 0.974 0.519 (-20,-2) 94 3.83% 1.48% 0.101 0.532 0.619 0.977 0.959 0.848 (-30,-2) 94 6.22% 2.56% 0.180 0.511 0.206 1.748 1.584 1.701 (-60,-2) 94 8.85% 1.84% 0.155 0.521 0.413 1.502 0.936 1.435 (-90,-2) 94 10.30% 1.12% 0.116 0.532 0.619 1.126 0.402 0.983 (-120,-2) 93 16.60% 6.75% 0.205 0.521 0.413 1.978 2.150 1.547 (-20,-11) 94 1.90% 0.58% 0.083 0.511 0.206 0.809 0.572 0.785 (-60,-11) 94 7.11% 1.07% 0.141 0.436 -1.238 1.365 0.606 1.274 (2,10) 94 -0.15% -0.72% -0.033 0.479 -0.413 -0.322 -0.960 -0.335 (2,30) 94 1.04% -1.20% 0.005 0.489 -0.206 0.044 -1.125 0.041 (2,60) 93 3.86% -1.62% 0.078 0.505 0.104 0.752 -0.861 0.578 (2,90) 92 3.55% -4.96% -0.022 0.489 -0.209 -0.214 -2.059 -0.170 (2, 120) 92 6.85% -4.90% -0.007 0.500 0.000 -0.070 -1.638 -0.054 (31,60) 93 2.98% -1.25% 0.057 0.505 0.104 0.546 -0.862 0.432 (61,90) 91 0.15% -4.16% -0.203 0.462 -0.734 -1.935 -2.815 -1.848 (91, 120) 91 4.04% -0.07% -0.080 0.505 0.105 -0.762 -0.048 -0.692
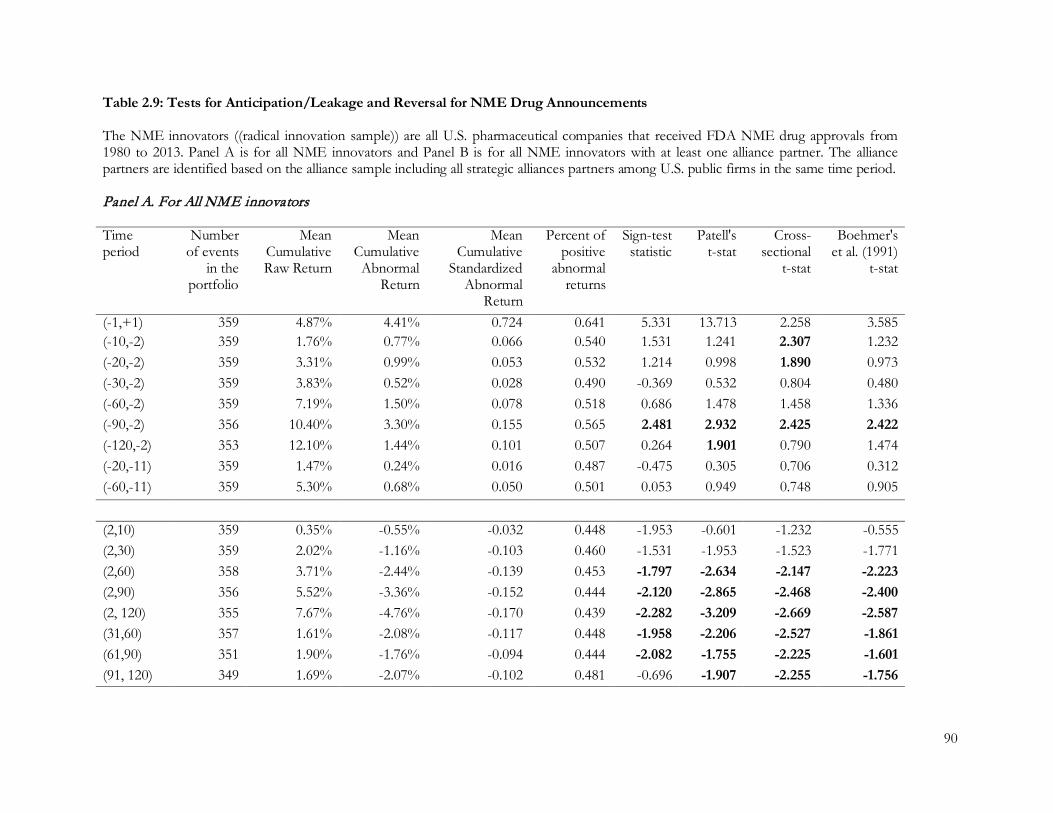
90
Table 2.9: Tests for Anticipation/Leakage and Reversal for NME Drug Announcements
The NME innovators ((radical innovation sample)) are all U.S. pharmaceutical companies that received FDA NME drug approvals from 1980 to 2013. Panel A is for all NME innovators and Panel B is for all NME innovators with at least one alliance partner. The alliance partners are identified based on the alliance sample including all strategic alliances partners among U.S. public firms in the same time period. Panel A. For All NME innovators
Time period
Number of events
in the portfolio
Mean Cumulative Raw Return
Mean Cumulative
Abnormal Return
Mean Cumulative
Standardized Abnormal
Return
Percent of positive
abnormal returns
Sign-test statistic
Patell's t-stat
Cross-sectional
t-stat
Boehmer's et al. (1991)
t-stat
(-1,+1) 359 4.87% 4.41% 0.724 0.641 5.331 13.713 2.258 3.585 (-10,-2) 359 1.76% 0.77% 0.066 0.540 1.531 1.241 2.307 1.232 (-20,-2) 359 3.31% 0.99% 0.053 0.532 1.214 0.998 1.890 0.973 (-30,-2) 359 3.83% 0.52% 0.028 0.490 -0.369 0.532 0.804 0.480 (-60,-2) 359 7.19% 1.50% 0.078 0.518 0.686 1.478 1.458 1.336 (-90,-2) 356 10.40% 3.30% 0.155 0.565 2.481 2.932 2.425 2.422 (-120,-2) 353 12.10% 1.44% 0.101 0.507 0.264 1.901 0.790 1.474 (-20,-11) 359 1.47% 0.24% 0.016 0.487 -0.475 0.305 0.706 0.312 (-60,-11) 359 5.30% 0.68% 0.050 0.501 0.053 0.949 0.748 0.905 (2,10) 359 0.35% -0.55% -0.032 0.448 -1.953 -0.601 -1.232 -0.555 (2,30) 359 2.02% -1.16% -0.103 0.460 -1.531 -1.953 -1.523 -1.771 (2,60) 358 3.71% -2.44% -0.139 0.453 -1.797 -2.634 -2.147 -2.223 (2,90) 356 5.52% -3.36% -0.152 0.444 -2.120 -2.865 -2.468 -2.400 (2, 120) 355 7.67% -4.76% -0.170 0.439 -2.282 -3.209 -2.669 -2.587 (31,60) 357 1.61% -2.08% -0.117 0.448 -1.958 -2.206 -2.527 -1.861 (61,90) 351 1.90% -1.76% -0.094 0.444 -2.082 -1.755 -2.225 -1.601 (91, 120) 349 1.69% -2.07% -0.102 0.481 -0.696 -1.907 -2.255 -1.756
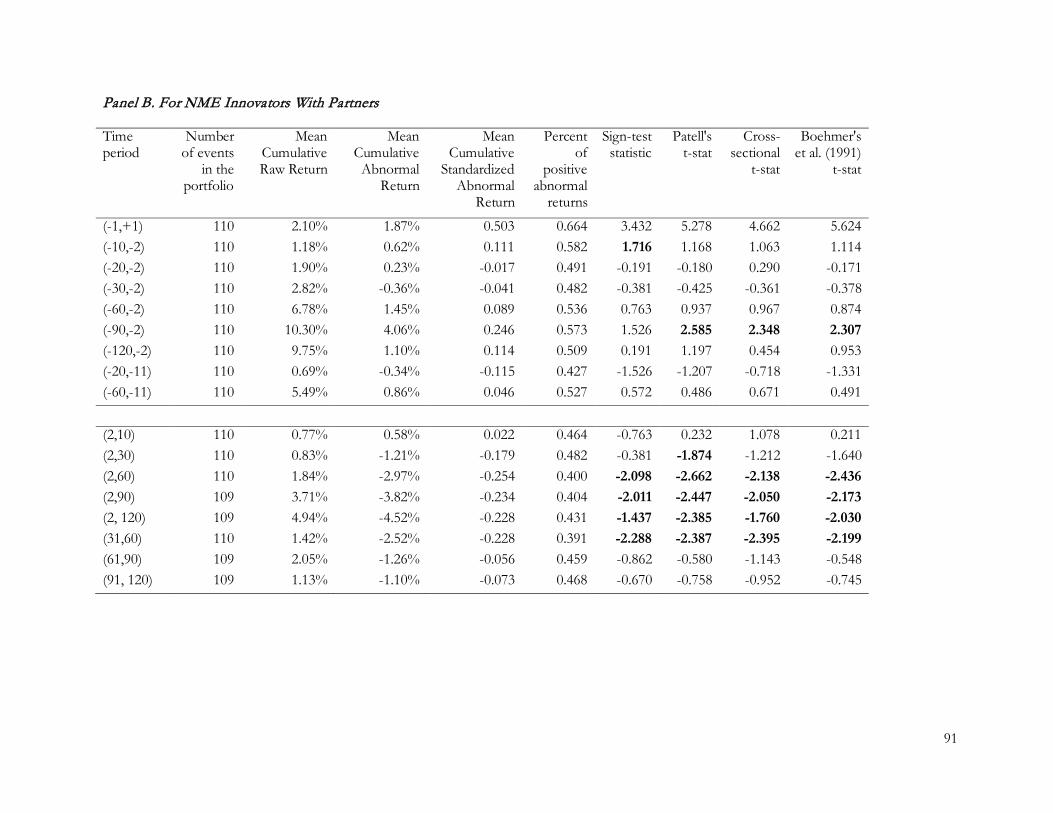
91
Panel B. For NME Innovators With Partners
Time period
Number of events
in the portfolio
Mean Cumulative Raw Return
Mean Cumulative
Abnormal Return
Mean Cumulative
Standardized Abnormal
Return
Percent of
positive abnormal
returns
Sign-test statistic
Patell's t-stat
Cross-sectional
t-stat
Boehmer's et al. (1991)
t-stat
(-1,+1) 110 2.10% 1.87% 0.503 0.664 3.432 5.278 4.662 5.624 (-10,-2) 110 1.18% 0.62% 0.111 0.582 1.716 1.168 1.063 1.114 (-20,-2) 110 1.90% 0.23% -0.017 0.491 -0.191 -0.180 0.290 -0.171 (-30,-2) 110 2.82% -0.36% -0.041 0.482 -0.381 -0.425 -0.361 -0.378 (-60,-2) 110 6.78% 1.45% 0.089 0.536 0.763 0.937 0.967 0.874 (-90,-2) 110 10.30% 4.06% 0.246 0.573 1.526 2.585 2.348 2.307 (-120,-2) 110 9.75% 1.10% 0.114 0.509 0.191 1.197 0.454 0.953 (-20,-11) 110 0.69% -0.34% -0.115 0.427 -1.526 -1.207 -0.718 -1.331 (-60,-11) 110 5.49% 0.86% 0.046 0.527 0.572 0.486 0.671 0.491 (2,10) 110 0.77% 0.58% 0.022 0.464 -0.763 0.232 1.078 0.211 (2,30) 110 0.83% -1.21% -0.179 0.482 -0.381 -1.874 -1.212 -1.640 (2,60) 110 1.84% -2.97% -0.254 0.400 -2.098 -2.662 -2.138 -2.436 (2,90) 109 3.71% -3.82% -0.234 0.404 -2.011 -2.447 -2.050 -2.173 (2, 120) 109 4.94% -4.52% -0.228 0.431 -1.437 -2.385 -1.760 -2.030 (31,60) 110 1.42% -2.52% -0.228 0.391 -2.288 -2.387 -2.395 -2.199 (61,90) 109 2.05% -1.26% -0.056 0.459 -0.862 -0.580 -1.143 -0.548 (91, 120) 109 1.13% -1.10% -0.073 0.468 -0.670 -0.758 -0.952 -0.745
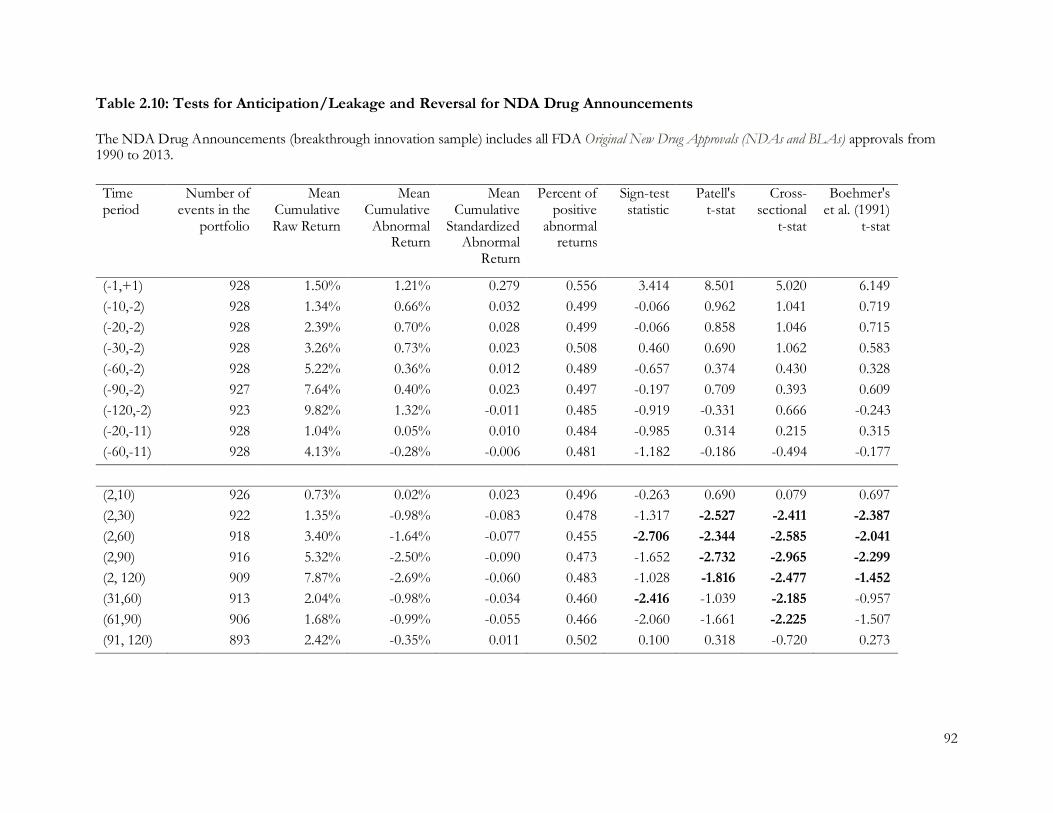
92
Table 2.10: Tests for Anticipation/Leakage and Reversal for NDA Drug Announcements
The NDA Drug Announcements (breakthrough innovation sample) includes all FDA Original New Drug Approvals (NDAs and BLAs) approvals from 1990 to 2013. Time period
Number of events in the
portfolio
Mean Cumulative Raw Return
Mean Cumulative
Abnormal Return
Mean Cumulative
Standardized Abnormal
Return
Percent of positive
abnormal returns
Sign-test statistic
Patell's t-stat
Cross-sectional
t-stat
Boehmer's et al. (1991)
t-stat
(-1,+1) 928 1.50% 1.21% 0.279 0.556 3.414 8.501 5.020 6.149 (-10,-2) 928 1.34% 0.66% 0.032 0.499 -0.066 0.962 1.041 0.719 (-20,-2) 928 2.39% 0.70% 0.028 0.499 -0.066 0.858 1.046 0.715 (-30,-2) 928 3.26% 0.73% 0.023 0.508 0.460 0.690 1.062 0.583 (-60,-2) 928 5.22% 0.36% 0.012 0.489 -0.657 0.374 0.430 0.328 (-90,-2) 927 7.64% 0.40% 0.023 0.497 -0.197 0.709 0.393 0.609 (-120,-2) 923 9.82% 1.32% -0.011 0.485 -0.919 -0.331 0.666 -0.243 (-20,-11) 928 1.04% 0.05% 0.010 0.484 -0.985 0.314 0.215 0.315 (-60,-11) 928 4.13% -0.28% -0.006 0.481 -1.182 -0.186 -0.494 -0.177 (2,10) 926 0.73% 0.02% 0.023 0.496 -0.263 0.690 0.079 0.697 (2,30) 922 1.35% -0.98% -0.083 0.478 -1.317 -2.527 -2.411 -2.387 (2,60) 918 3.40% -1.64% -0.077 0.455 -2.706 -2.344 -2.585 -2.041 (2,90) 916 5.32% -2.50% -0.090 0.473 -1.652 -2.732 -2.965 -2.299 (2, 120) 909 7.87% -2.69% -0.060 0.483 -1.028 -1.816 -2.477 -1.452 (31,60) 913 2.04% -0.98% -0.034 0.460 -2.416 -1.039 -2.185 -0.957 (61,90) 906 1.68% -0.99% -0.055 0.466 -2.060 -1.661 -2.225 -1.507 (91, 120) 893 2.42% -0.35% 0.011 0.502 0.100 0.318 -0.720 0.273

93
Table 2.11: Tests for Anticipation/Leakage and Reversal for FDA Warnings
The sample of FDA warned firms includes all U.S. pharmaceutical firms getting FDA warning letters from 1997 to 2013. Time period
Number of events
in the portfolio
Mean Cumulative Raw Return
Mean Cumulative
Abnormal Return
Mean Cumulative
Standardized Abnormal
Return
Percent of positive
abnormal returns
Sign-test statistic
Patell's t-stat
Cross-sectional
t-stat
Boehmer's et al.
(1991) t-stat
(-1,+1) 462 -0.17% -0.38% -0.077 0.461 -1.675 -1.661 -1.602 -1.475 (-10,-2) 462 0.59% 0.09% -0.044 0.498 -0.093 -0.935 0.239 -0.895 (-20,-2) 462 1.52% -0.29% -0.082 0.478 -0.930 -1.759 -0.468 -1.536 (-30,-2) 462 1.22% -1.53% -0.151 0.422 -3.350 -3.244 -2.020 -2.801 (-60,-2) 461 4.22% -1.29% -0.120 0.472 -1.210 -2.587 -1.141 -2.206 (-90,-2) 458 8.11% -1.00% -0.067 0.476 -1.024 -1.441 -0.682 -1.200 (-120,-2) 458 10.70% -0.22% 0.016 0.489 -0.465 0.349 -0.117 0.289 (-20,-11) 462 0.99% -0.35% -0.067 0.470 -1.303 -1.449 -0.691 -1.246 (-60,-11) 461 3.75% -1.37% -0.114 0.461 -1.675 -2.450 -1.322 -2.164 (2,10) 462 0.12% -0.40% -0.050 0.444 -2.419 -1.083 -0.892 -0.965 (2,30) 462 1.49% -0.27% -0.057 0.481 -0.837 -1.228 -0.348 -1.163 (2,60) 462 2.31% -0.38% -0.042 0.474 -1.117 -0.893 -0.344 -0.827 (2,90) 462 2.57% -1.23% -0.068 0.476 -1.024 -1.469 -0.875 -1.328 (2, 120) 462 5.36% -1.63% -0.100 0.461 -1.675 -2.157 -0.930 -1.901 (31,60) 457 1.02% -0.12% 0.015 0.505 0.234 0.316 -0.177 0.299 (61,90) 455 0.48% -0.44% -0.032 0.488 -0.516 -0.686 -0.607 -0.637 (91, 120) 453 2.98% -0.10% -0.029 0.490 -0.423 -0.613 -0.142 -0.593
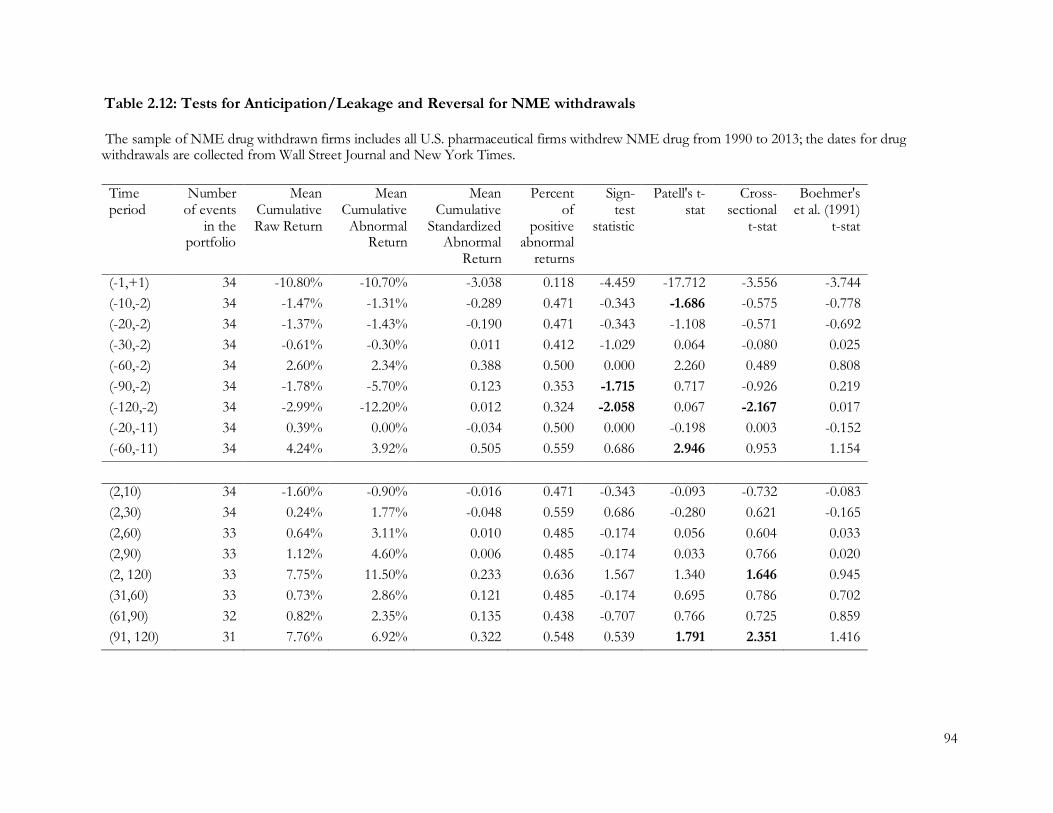
94
Table 2.12: Tests for Anticipation/Leakage and Reversal for NME withdrawals
The sample of NME drug withdrawn firms includes all U.S. pharmaceutical firms withdrew NME drug from 1990 to 2013; the dates for drug withdrawals are collected from Wall Street Journal and New York Times.
Time period
Number of events
in the portfolio
Mean Cumulative Raw Return
Mean Cumulative
Abnormal Return
Mean Cumulative
Standardized Abnormal
Return
Percent of
positive abnormal
returns
Sign-test
statistic
Patell's t-stat
Cross-sectional
t-stat
Boehmer's et al. (1991)
t-stat
(-1,+1) 34 -10.80% -10.70% -3.038 0.118 -4.459 -17.712 -3.556 -3.744 (-10,-2) 34 -1.47% -1.31% -0.289 0.471 -0.343 -1.686 -0.575 -0.778 (-20,-2) 34 -1.37% -1.43% -0.190 0.471 -0.343 -1.108 -0.571 -0.692 (-30,-2) 34 -0.61% -0.30% 0.011 0.412 -1.029 0.064 -0.080 0.025 (-60,-2) 34 2.60% 2.34% 0.388 0.500 0.000 2.260 0.489 0.808 (-90,-2) 34 -1.78% -5.70% 0.123 0.353 -1.715 0.717 -0.926 0.219 (-120,-2) 34 -2.99% -12.20% 0.012 0.324 -2.058 0.067 -2.167 0.017 (-20,-11) 34 0.39% 0.00% -0.034 0.500 0.000 -0.198 0.003 -0.152 (-60,-11) 34 4.24% 3.92% 0.505 0.559 0.686 2.946 0.953 1.154 (2,10) 34 -1.60% -0.90% -0.016 0.471 -0.343 -0.093 -0.732 -0.083 (2,30) 34 0.24% 1.77% -0.048 0.559 0.686 -0.280 0.621 -0.165 (2,60) 33 0.64% 3.11% 0.010 0.485 -0.174 0.056 0.604 0.033 (2,90) 33 1.12% 4.60% 0.006 0.485 -0.174 0.033 0.766 0.020 (2, 120) 33 7.75% 11.50% 0.233 0.636 1.567 1.340 1.646 0.945 (31,60) 33 0.73% 2.86% 0.121 0.485 -0.174 0.695 0.786 0.702 (61,90) 32 0.82% 2.35% 0.135 0.438 -0.707 0.766 0.725 0.859 (91, 120) 31 7.76% 6.92% 0.322 0.548 0.539 1.791 2.351 1.416
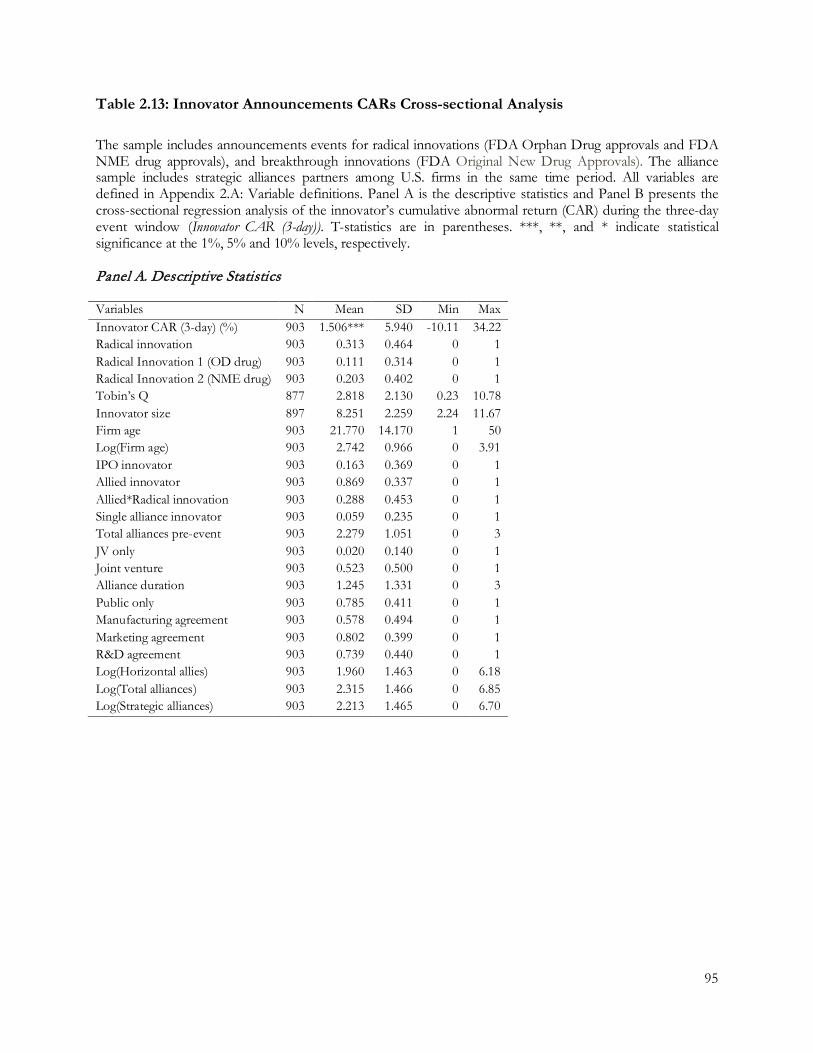
95
Table 2.13: Innovator Announcements CARs Cross-sectional Analysis
The sample includes announcements events for radical innovations (FDA Orphan Drug approvals and FDA NME drug approvals), and breakthrough innovations (FDA Original New Drug Approvals). The alliance sample includes strategic alliances partners among U.S. firms in the same time period. All variables are defined in Appendix 2.A: Variable definitions. Panel A is the descriptive statistics and Panel B presents the cross-sectional regression analysis of the innovator’s cumulative abnormal return (CAR) during the three-day event window (Innovator CAR (3-day)). T-statistics are in parentheses. ***, **, and * indicate statistical significance at the 1%, 5% and 10% levels, respectively. Panel A. Descriptive Statistics Variables N Mean SD Min Max Innovator CAR (3-day) (%) 903 1.506*** 5.940 -10.11 34.22 Radical innovation 903 0.313 0.464 0 1 Radical Innovation 1 (OD drug) 903 0.111 0.314 0 1 Radical Innovation 2 (NME drug) 903 0.203 0.402 0 1 Tobin’s Q 877 2.818 2.130 0.23 10.78 Innovator size 897 8.251 2.259 2.24 11.67 Firm age 903 21.770 14.170 1 50 Log(Firm age) 903 2.742 0.966 0 3.91 IPO innovator 903 0.163 0.369 0 1 Allied innovator 903 0.869 0.337 0 1 Allied*Radical innovation 903 0.288 0.453 0 1 Single alliance innovator 903 0.059 0.235 0 1 Total alliances pre-event 903 2.279 1.051 0 3 JV only 903 0.020 0.140 0 1 Joint venture 903 0.523 0.500 0 1 Alliance duration 903 1.245 1.331 0 3 Public only 903 0.785 0.411 0 1 Manufacturing agreement 903 0.578 0.494 0 1 Marketing agreement 903 0.802 0.399 0 1 R&D agreement 903 0.739 0.440 0 1 Log(Horizontal allies) 903 1.960 1.463 0 6.18 Log(Total alliances) 903 2.315 1.466 0 6.85 Log(Strategic alliances) 903 2.213 1.465 0 6.70
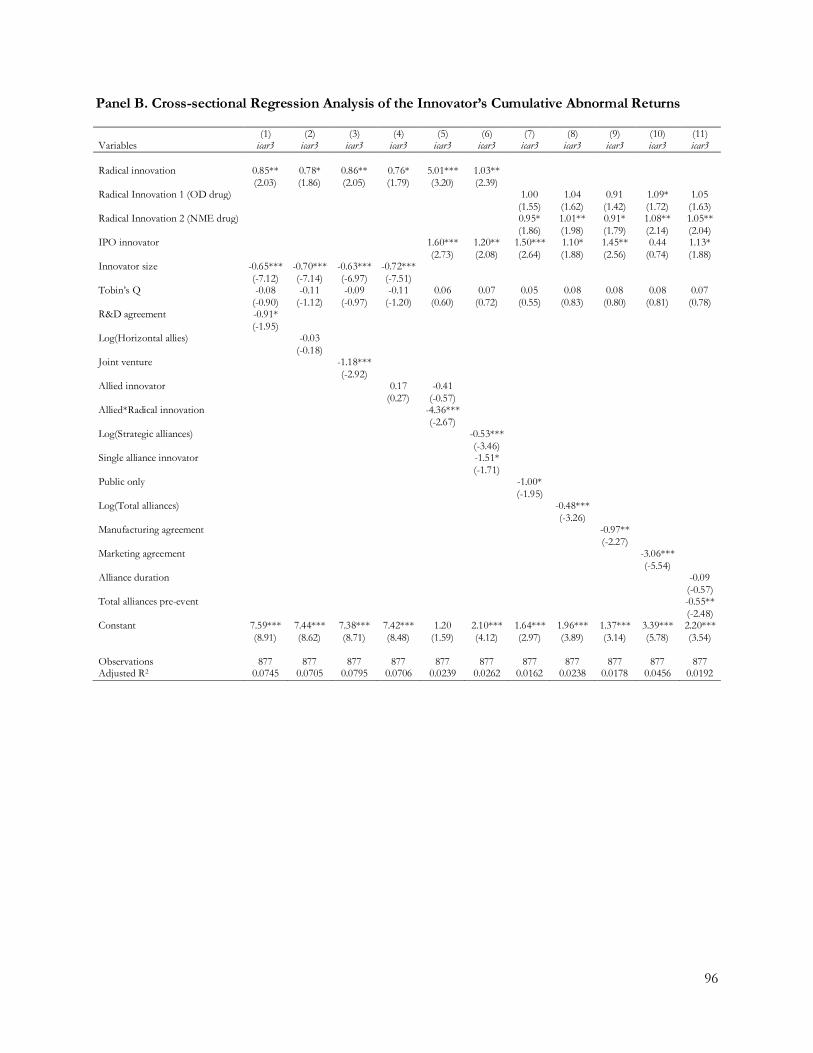
96
Panel B. Cross-sectional Regression Analysis of the Innovator’s Cumulative Abnormal Returns (1) (2) (3) (4) (5) (6) (7) (8) (9) (10) (11) Variables icar3 icar3 icar3 icar3 icar3 icar3 icar3 icar3 icar3 icar3 icar3 Radical innovation 0.85** 0.78* 0.86** 0.76* 5.01*** 1.03** (2.03) (1.86) (2.05) (1.79) (3.20) (2.39) Radical Innovation 1 (OD drug) 1.00 1.04 0.91 1.09* 1.05 (1.55) (1.62) (1.42) (1.72) (1.63) Radical Innovation 2 (NME drug) 0.95* 1.01** 0.91* 1.08** 1.05** (1.86) (1.98) (1.79) (2.14) (2.04) IPO innovator 1.60*** 1.20** 1.50*** 1.10* 1.45** 0.44 1.13* (2.73) (2.08) (2.64) (1.88) (2.56) (0.74) (1.88) Innovator size -0.65*** -0.70*** -0.63*** -0.72*** (-7.12) (-7.14) (-6.97) (-7.51) Tobin’s Q -0.08 -0.11 -0.09 -0.11 0.06 0.07 0.05 0.08 0.08 0.08 0.07 (-0.90) (-1.12) (-0.97) (-1.20) (0.60) (0.72) (0.55) (0.83) (0.80) (0.81) (0.78) R&D agreement -0.91* (-1.95) Log(Horizontal allies) -0.03 (-0.18) Joint venture -1.18*** (-2.92) Allied innovator 0.17 -0.41 (0.27) (-0.57) Allied*Radical innovation -4.36*** (-2.67) Log(Strategic alliances) -0.53*** (-3.46) Single alliance innovator -1.51* (-1.71) Public only -1.00* (-1.95) Log(Total alliances) -0.48*** (-3.26) Manufacturing agreement -0.97** (-2.27) Marketing agreement -3.06*** (-5.54) Alliance duration -0.09 (-0.57) Total alliances pre-event -0.55** (-2.48) Constant 7.59*** 7.44*** 7.38*** 7.42*** 1.20 2.10*** 1.64*** 1.96*** 1.37*** 3.39*** 2.20*** (8.91) (8.62) (8.71) (8.48) (1.59) (4.12) (2.97) (3.89) (3.14) (5.78) (3.54) Observations 877 877 877 877 877 877 877 877 877 877 877 Adjusted R2 0.0745 0.0705 0.0795 0.0706 0.0239 0.0262 0.0162 0.0238 0.0178 0.0456 0.0192
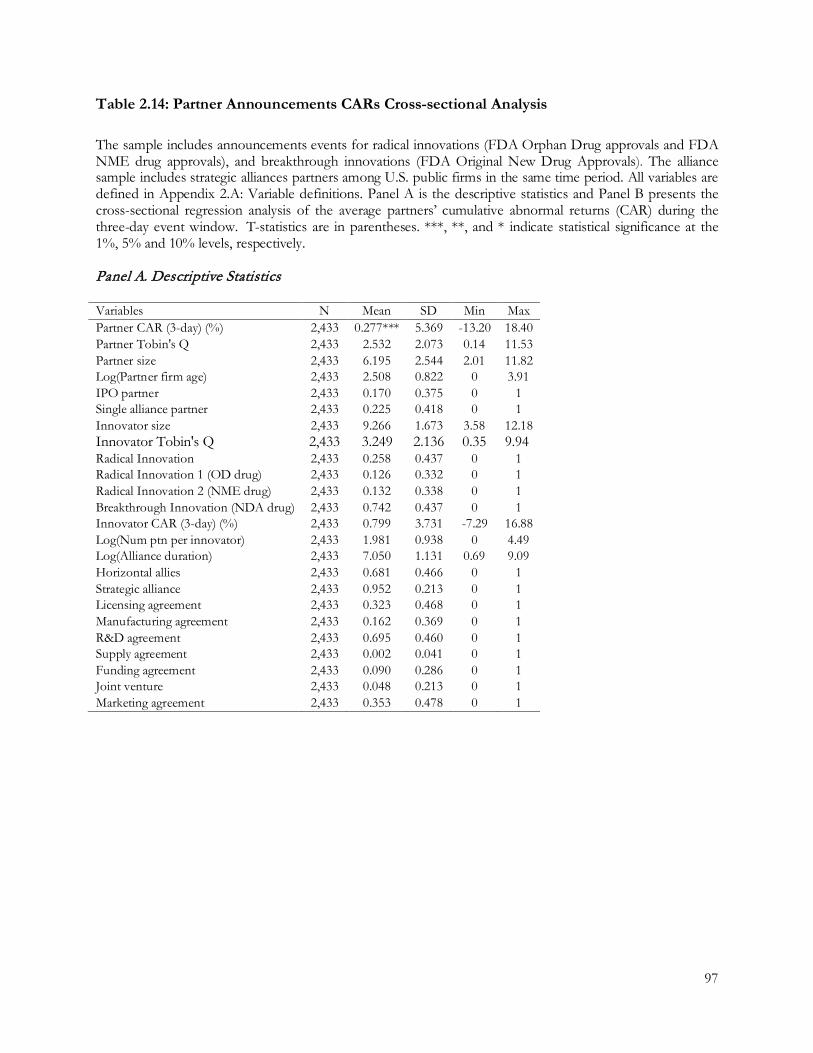
97
Table 2.14: Partner Announcements CARs Cross-sectional Analysis
The sample includes announcements events for radical innovations (FDA Orphan Drug approvals and FDA NME drug approvals), and breakthrough innovations (FDA Original New Drug Approvals). The alliance sample includes strategic alliances partners among U.S. public firms in the same time period. All variables are defined in Appendix 2.A: Variable definitions. Panel A is the descriptive statistics and Panel B presents the cross-sectional regression analysis of the average partners’ cumulative abnormal returns (CAR) during the three-day event window. T-statistics are in parentheses. ***, **, and * indicate statistical significance at the 1%, 5% and 10% levels, respectively. Panel A. Descriptive Statistics
Variables N Mean SD Min Max Partner CAR (3-day) (%) 2,433 0.277*** 5.369 -13.20 18.40 Partner Tobin's Q 2,433 2.532 2.073 0.14 11.53 Partner size 2,433 6.195 2.544 2.01 11.82 Log(Partner firm age) 2,433 2.508 0.822 0 3.91 IPO partner 2,433 0.170 0.375 0 1 Single alliance partner 2,433 0.225 0.418 0 1 Innovator size 2,433 9.266 1.673 3.58 12.18 Innovator Tobin's Q 2,433 3.249 2.136 0.35 9.94 Radical Innovation 2,433 0.258 0.437 0 1 Radical Innovation 1 (OD drug) 2,433 0.126 0.332 0 1 Radical Innovation 2 (NME drug) 2,433 0.132 0.338 0 1 Breakthrough Innovation (NDA drug) 2,433 0.742 0.437 0 1 Innovator CAR (3-day) (%) 2,433 0.799 3.731 -7.29 16.88 Log(Num ptn per innovator) 2,433 1.981 0.938 0 4.49 Log(Alliance duration) 2,433 7.050 1.131 0.69 9.09 Horizontal allies 2,433 0.681 0.466 0 1 Strategic alliance 2,433 0.952 0.213 0 1 Licensing agreement 2,433 0.323 0.468 0 1 Manufacturing agreement 2,433 0.162 0.369 0 1 R&D agreement 2,433 0.695 0.460 0 1 Supply agreement 2,433 0.002 0.041 0 1 Funding agreement 2,433 0.090 0.286 0 1 Joint venture 2,433 0.048 0.213 0 1 Marketing agreement 2,433 0.353 0.478 0 1
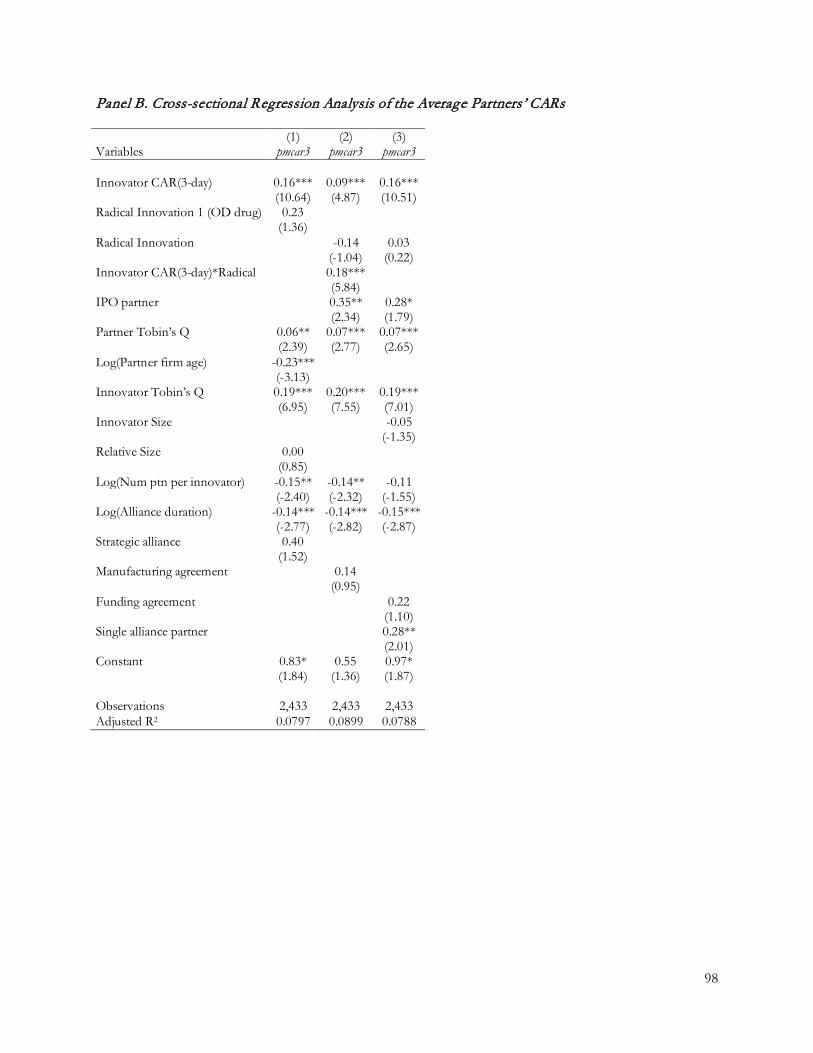
98
Panel B. Cross-sectional Regression Analysis of the Average Partners’ CARs (1) (2) (3) Variables pmcar3 pmcar3 pmcar3 Innovator CAR(3-day) 0.16*** 0.09*** 0.16*** (10.64) (4.87) (10.51) Radical Innovation 1 (OD drug) 0.23 (1.36) Radical Innovation -0.14 0.03 (-1.04) (0.22) Innovator CAR(3-day)*Radical 0.18*** (5.84) IPO partner 0.35** 0.28* (2.34) (1.79) Partner Tobin’s Q 0.06** 0.07*** 0.07*** (2.39) (2.77) (2.65) Log(Partner firm age) -0.23*** (-3.13) Innovator Tobin’s Q 0.19*** 0.20*** 0.19*** (6.95) (7.55) (7.01) Innovator Size -0.05 (-1.35) Relative Size 0.00 (0.85) Log(Num ptn per innovator) -0.15** -0.14** -0.11 (-2.40) (-2.32) (-1.55) Log(Alliance duration) -0.14*** -0.14*** -0.15*** (-2.77) (-2.82) (-2.87) Strategic alliance 0.40 (1.52) Manufacturing agreement 0.14 (0.95) Funding agreement 0.22 (1.10) Single alliance partner 0.28** (2.01) Constant 0.83* 0.55 0.97* (1.84) (1.36) (1.87) Observations 2,433 2,433 2,433 Adjusted R2 0.0797 0.0899 0.0788
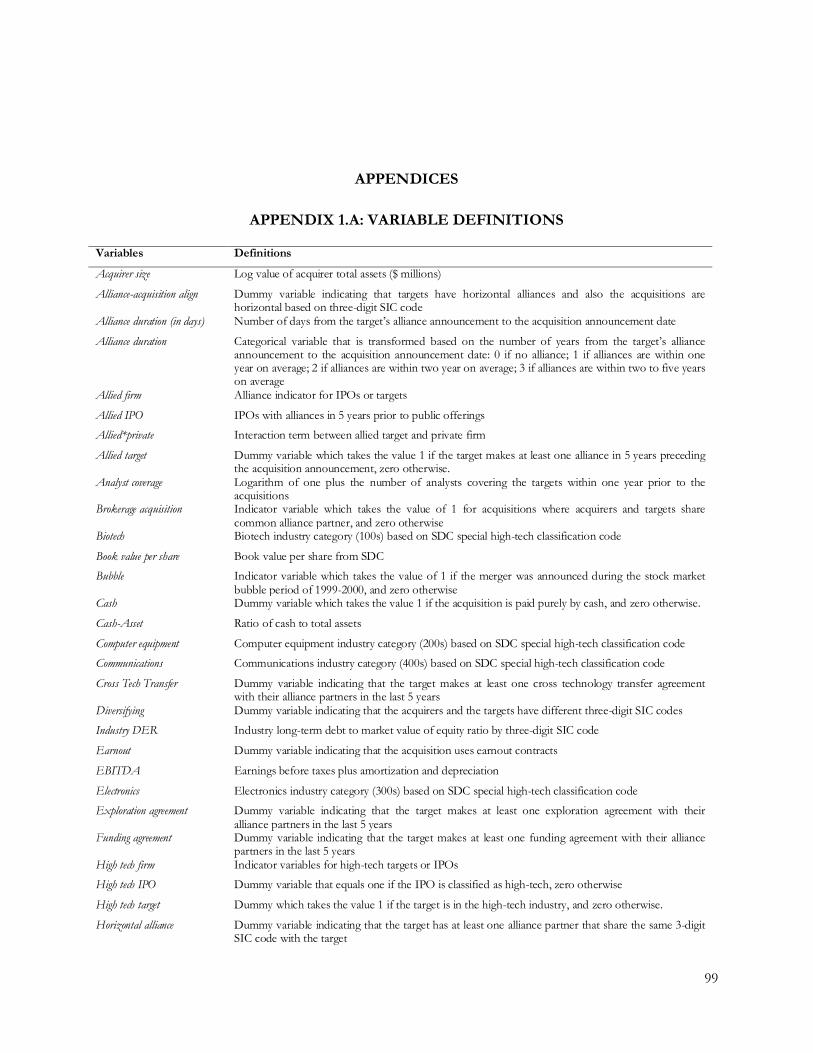
99
APPENDICES
APPENDIX 1.A: VARIABLE DEFINITIONS
Variables Definitions
Acquirer size Log value of acquirer total assets ($ millions)
Alliance-acquisition align Dummy variable indicating that targets have horizontal alliances and also the acquisitions are horizontal based on three-digit SIC code
Alliance duration (in days) Number of days from the target’s alliance announcement to the acquisition announcement date
Alliance duration Categorical variable that is transformed based on the number of years from the target’s alliance announcement to the acquisition announcement date: 0 if no alliance; 1 if alliances are within one year on average; 2 if alliances are within two year on average; 3 if alliances are within two to five years on average
Allied firm Alliance indicator for IPOs or targets
Allied IPO IPOs with alliances in 5 years prior to public offerings
Allied*private Interaction term between allied target and private firm
Allied target
Dummy variable which takes the value 1 if the target makes at least one alliance in 5 years preceding the acquisition announcement, zero otherwise.
Analyst coverage Logarithm of one plus the number of analysts covering the targets within one year prior to the acquisitions
Brokerage acquisition Indicator variable which takes the value of 1 for acquisitions where acquirers and targets share common alliance partner, and zero otherwise
Biotech Biotech industry category (100s) based on SDC special high-tech classification code
Book value per share Book value per share from SDC
Bubble Indicator variable which takes the value of 1 if the merger was announced during the stock market bubble period of 1999-2000, and zero otherwise
Cash Dummy variable which takes the value 1 if the acquisition is paid purely by cash, and zero otherwise.
Cash-Asset Ratio of cash to total assets
Computer equipment Computer equipment industry category (200s) based on SDC special high-tech classification code
Communications Communications industry category (400s) based on SDC special high-tech classification code
Cross Tech Transfer Dummy variable indicating that the target makes at least one cross technology transfer agreement with their alliance partners in the last 5 years
Diversifying Dummy variable indicating that the acquirers and the targets have different three-digit SIC codes
Industry DER Industry long-term debt to market value of equity ratio by three-digit SIC code
Earnout Dummy variable indicating that the acquisition uses earnout contracts
EBITDA Earnings before taxes plus amortization and depreciation
Electronics Electronics industry category (300s) based on SDC special high-tech classification code
Exploration agreement Dummy variable indicating that the target makes at least one exploration agreement with their alliance partners in the last 5 years
Funding agreement Dummy variable indicating that the target makes at least one funding agreement with their alliance partners in the last 5 years
High tech firm Indicator variables for high-tech targets or IPOs
High tech IPO Dummy variable that equals one if the IPO is classified as high-tech, zero otherwise
High tech target Dummy which takes the value 1 if the target is in the high-tech industry, and zero otherwise.
Horizontal alliance Dummy variable indicating that the target has at least one alliance partner that share the same 3-digit SIC code with the target
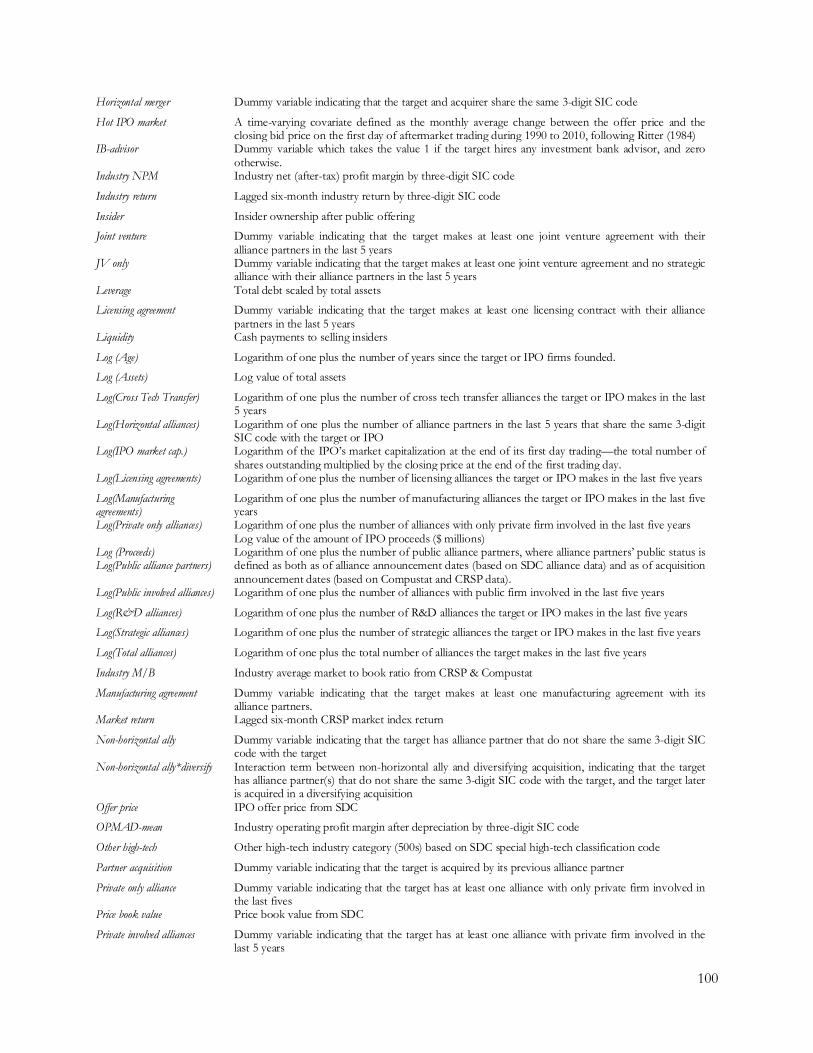
100
Horizontal merger Dummy variable indicating that the target and acquirer share the same 3-digit SIC code
Hot IPO market A time-varying covariate defined as the monthly average change between the offer price and the closing bid price on the first day of aftermarket trading during 1990 to 2010, following Ritter (1984)
IB-advisor Dummy variable which takes the value 1 if the target hires any investment bank advisor, and zero otherwise.
Industry NPM Industry net (after-tax) profit margin by three-digit SIC code
Industry return Lagged six-month industry return by three-digit SIC code
Insider Insider ownership after public offering
Joint venture Dummy variable indicating that the target makes at least one joint venture agreement with their alliance partners in the last 5 years
JV only Dummy variable indicating that the target makes at least one joint venture agreement and no strategic alliance with their alliance partners in the last 5 years
Leverage Total debt scaled by total assets
Licensing agreement Dummy variable indicating that the target makes at least one licensing contract with their alliance partners in the last 5 years
Liquidity Cash payments to selling insiders
Log (Age) Logarithm of one plus the number of years since the target or IPO firms founded.
Log (Assets) Log value of total assets
Log(Cross Tech Transfer) Logarithm of one plus the number of cross tech transfer alliances the target or IPO makes in the last 5 years
Log(Horizontal alliances) Log(IPO market cap.)
Logarithm of one plus the number of alliance partners in the last 5 years that share the same 3-digit SIC code with the target or IPO Logarithm of the IPO’s market capitalization at the end of its first day trading—the total number of shares outstanding multiplied by the closing price at the end of the first trading day.
Log(Licensing agreements) Logarithm of one plus the number of licensing alliances the target or IPO makes in the last five years
Log(Manufacturing agreements)
Logarithm of one plus the number of manufacturing alliances the target or IPO makes in the last five years
Log(Private only alliances) Log (Proceeds) Log(Public alliance partners)
Logarithm of one plus the number of alliances with only private firm involved in the last five years Log value of the amount of IPO proceeds ($ millions) Logarithm of one plus the number of public alliance partners, where alliance partners’ public status is defined as both as of alliance announcement dates (based on SDC alliance data) and as of acquisition announcement dates (based on Compustat and CRSP data).
Log(Public involved alliances) Logarithm of one plus the number of alliances with public firm involved in the last five years
Log(R&D alliances) Logarithm of one plus the number of R&D alliances the target or IPO makes in the last five years
Log(Strategic alliances) Logarithm of one plus the number of strategic alliances the target or IPO makes in the last five years
Log(Total alliances) Logarithm of one plus the total number of alliances the target makes in the last five years
Industry M/B Industry average market to book ratio from CRSP & Compustat
Manufacturing agreement Dummy variable indicating that the target makes at least one manufacturing agreement with its alliance partners.
Market return Lagged six-month CRSP market index return
Non-horizontal ally Dummy variable indicating that the target has alliance partner that do not share the same 3-digit SIC code with the target
Non-horizontal ally*diversify Interaction term between non-horizontal ally and diversifying acquisition, indicating that the target has alliance partner(s) that do not share the same 3-digit SIC code with the target, and the target later is acquired in a diversifying acquisition
Offer price IPO offer price from SDC
OPMAD-mean Industry operating profit margin after depreciation by three-digit SIC code
Other high-tech Other high-tech industry category (500s) based on SDC special high-tech classification code
Partner acquisition Dummy variable indicating that the target is acquired by its previous alliance partner
Private only alliance Dummy variable indicating that the target has at least one alliance with only private firm involved in the last fives
Price book value Price book value from SDC
Private involved alliances Dummy variable indicating that the target has at least one alliance with private firm involved in the last 5 years
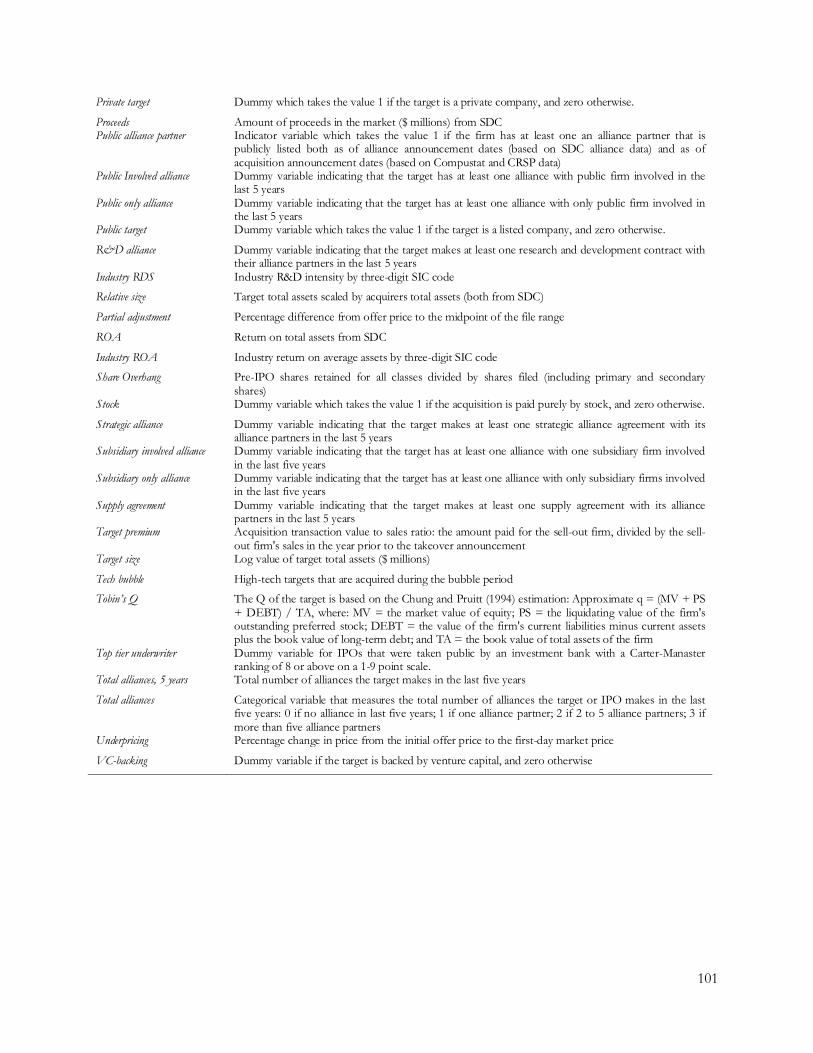
101
Private target Dummy which takes the value 1 if the target is a private company, and zero otherwise.
Proceeds Public alliance partner
Amount of proceeds in the market ($ millions) from SDC Indicator variable which takes the value 1 if the firm has at least one an alliance partner that is publicly listed both as of alliance announcement dates (based on SDC alliance data) and as of acquisition announcement dates (based on Compustat and CRSP data)
Public Involved alliance Dummy variable indicating that the target has at least one alliance with public firm involved in the last 5 years
Public only alliance Dummy variable indicating that the target has at least one alliance with only public firm involved in the last 5 years
Public target Dummy variable which takes the value 1 if the target is a listed company, and zero otherwise.
R&D alliance Dummy variable indicating that the target makes at least one research and development contract with their alliance partners in the last 5 years
Industry RDS Industry R&D intensity by three-digit SIC code
Relative size Target total assets scaled by acquirers total assets (both from SDC)
Partial adjustment Percentage difference from offer price to the midpoint of the file range
ROA Return on total assets from SDC
Industry ROA Industry return on average assets by three-digit SIC code
Share Overhang Pre-IPO shares retained for all classes divided by shares filed (including primary and secondary shares)
Stock Dummy variable which takes the value 1 if the acquisition is paid purely by stock, and zero otherwise.
Strategic alliance Dummy variable indicating that the target makes at least one strategic alliance agreement with its alliance partners in the last 5 years
Subsidiary involved alliance Dummy variable indicating that the target has at least one alliance with one subsidiary firm involved in the last five years
Subsidiary only alliance Dummy variable indicating that the target has at least one alliance with only subsidiary firms involved in the last five years
Supply agreement Dummy variable indicating that the target makes at least one supply agreement with its alliance partners in the last 5 years
Target premium Acquisition transaction value to sales ratio: the amount paid for the sell-out firm, divided by the sell-out firm's sales in the year prior to the takeover announcement
Target size Log value of target total assets ($ millions)
Tech bubble High-tech targets that are acquired during the bubble period
Tobin’s Q The Q of the target is based on the Chung and Pruitt (1994) estimation: Approximate q = (MV + PS + DEBT) / TA, where: MV = the market value of equity; PS = the liquidating value of the firm's outstanding preferred stock; DEBT = the value of the firm's current liabilities minus current assets plus the book value of long-term debt; and TA = the book value of total assets of the firm
Top tier underwriter Dummy variable for IPOs that were taken public by an investment bank with a Carter-Manaster ranking of 8 or above on a 1-9 point scale.
Total alliances, 5 years Total number of alliances the target makes in the last five years
Total alliances Categorical variable that measures the total number of alliances the target or IPO makes in the last five years: 0 if no alliance in last five years; 1 if one alliance partner; 2 if 2 to 5 alliance partners; 3 if more than five alliance partners
Underpricing Percentage change in price from the initial offer price to the first-day market price
VC-backing Dummy variable if the target is backed by venture capital, and zero otherwise

102
APPENDIX 2.A: VARIABLE DEFINITIONS Variables Definitions Allied innovator Breakthrough Innovation (NDA drug)
Alliance indicator for innovators Dummy variable indicating that the innovation is a FDA Original New Drug (NDA) approval
Cross Tech Transfer Dummy variable indicating that the innovator makes at least one cross technology transfer agreement with their alliance partners in the past
Exploration agreement Dummy variable indicating that the innovator makes at least one exploration agreement with their alliance partners in the past
Funding agreement Dummy variable indicating that the innovator makes at least one funding agreement with their alliance partners in the past
Horizontal alliance Dummy variable indicating that the innovator has at least one alliance partner that share the same 3-digit SIC code with the innovator
Innovator size Log value of acquirer total assets ($ millions) Innovator CAR (3-day) Innovator’s cumulative abnormal return (CAR) during the three-day event window Innovator CAR(3-day)*OD Interaction variable between Innovator CAR (3-day) and Radical Innovation 1 (OD drug) Innovator CAR(3-day)*NME Interaction variable between Innovator CAR (3-day) and Radical Innovation 2 (NME drug) Innovator CAR(3-day)*Radical Interaction variable between Innovator CAR (3-day) and Radical Innovation IPO innovator/partner Innovators or partners that have innovation events within five years after publicly listed based on
Compustat and CRSP database Joint venture Dummy variable indicating that the innovator makes at least one joint venture agreement with
their alliance partners in the past JV only Dummy variable indicating that the innovator makes at least one joint venture agreement and no
strategic alliance with their alliance partners in the past Licensing agreement Dummy variable indicating that the innovator makes at least one licensing contract with their
alliance partners in the past Log(Alliance duration) Logarithm of the number of days from alliance formation to innovation event Log( Firm Age) Logarithm of one plus the number of years since the innovator firms listed on CRSP&Compustat. Log(Cross Tech Transfer) Logarithm of one plus the number of cross tech transfer alliances the innovator makes in the past Log(Horizontal alliances) Logarithm of one plus the number of alliance partners in the past that share the same 3-digit SIC
code with the innovator. Log(Licensing agreements) Logarithm of one plus the number of licensing alliances the innovator makes in in the past Log(Manufacturing agreements) Logarithm of one plus the number of manufacturing alliances the innovator makes in in the past Log(Num ptn per innovator) Logarithm of the number of partners per innovator on one innovation event Log(R&D alliances) Logarithm of one plus the number of R&D alliances the innovator makes in in the past Log(Strategic alliances) Logarithm of one plus the number of strategic alliances the innovator makes in in the past Log(Total alliances) Logarithm of one plus the total number of alliances the innovator makes in in the past Manufacturing agreement Dummy variable indicating that the innovator makes at least one manufacturing agreement with its
alliance partners. Partner CAR(3-day) Average partner cumulative abnormal return (CAR) during the three-day event window for each
innovation event Radical Innovation Dummy variable indicating that the innovation is a FDA Orphan Drug (OD) or NME drug
approval Radical Innovation 1 (OD drug) Dummy variable indicating that the innovation is a FDA Orphan Drug (OD) approval Radical Innovation 2 (NME drug) Dummy variable indicating that the innovation is a FDA NME drug approval R&D agreement Dummy variable indicating that the innovator makes at least one research and development
contract with their alliance partners in the past Relative size Single alliance innovator
Partner market equity capitalization scaled by innovator market equity capitalization (both from Compustat) at the end of the year of the innovation event Dummy variable indicating that an innovator have only one alliance partner
Single alliance partner Dummy variable indicating that an alliance partner have only one innovator as partner Strategic alliance Dummy variable indicating that the innovator makes at least one strategic alliance agreement with
its alliance partners in the past Supply agreement Dummy variable indicating that the innovator makes at least one supply agreement with its alliance
partners in the past Innovator/Partner Tobin’s Q The Q of the innovator or Partner is based on the Chung and Pruitt (1994) estimation:
Approximate q = (MV + PS + DEBT) / TA, where: MV = the market value of equity; PS = the

103
liquidating value of the firm's outstanding preferred stock; DEBT = the value of the firm's current liabilities minus current assets plus the book value of long-term debt; and TA = the book value of total assets of the firm
Total alliances pre-event Categorical variable that measures the total number of alliances the innovator makes in the past: 0 if no alliance in last five years; 1 if one alliance partner; 2 if 2 to 5 alliance partners; 3 if more than five alliance partners
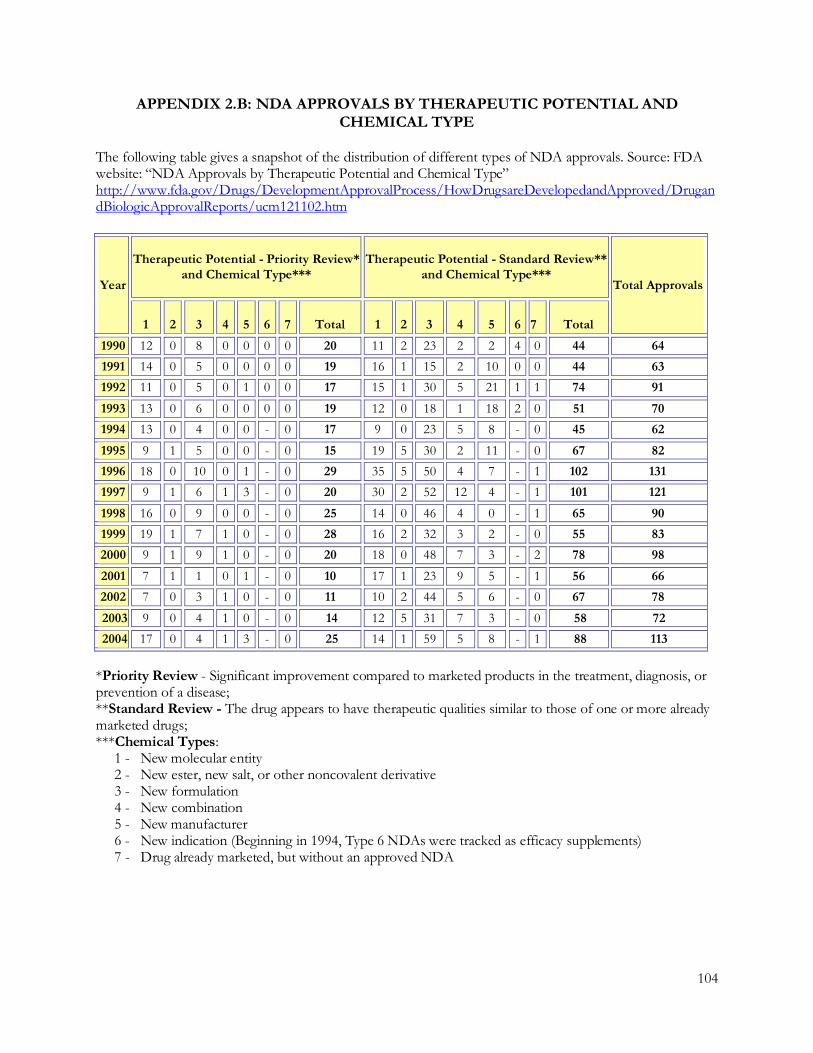
104
APPENDIX 2.B: NDA APPROVALS BY THERAPEUTIC POTENTIAL AND CHEMICAL TYPE
The following table gives a snapshot of the distribution of different types of NDA approvals. Source: FDA website: “NDA Approvals by Therapeutic Potential and Chemical Type” http://www.fda.gov/Drugs/DevelopmentApprovalProcess/HowDrugsareDevelopedandApproved/DrugandBiologicApprovalReports/ucm121102.htm
Year
Therapeutic Potential - Priority Review* and Chemical Type***
Therapeutic Potential - Standard Review** and Chemical Type***
Total Approvals
1 2 3 4 5 6 7 Total 1 2 3 4 5 6 7 Total
1990 12 0 8 0 0 0 0 20 11 2 23 2 2 4 0 44 64 1991 14 0 5 0 0 0 0 19 16 1 15 2 10 0 0 44 63 1992 11 0 5 0 1 0 0 17 15 1 30 5 21 1 1 74 91
1993 13 0 6 0 0 0 0 19 12 0 18 1 18 2 0 51 70 1994 13 0 4 0 0 - 0 17 9 0 23 5 8 - 0 45 62
1995 9 1 5 0 0 - 0 15 19 5 30 2 11 - 0 67 82 1996 18 0 10 0 1 - 0 29 35 5 50 4 7 - 1 102 131 1997 9 1 6 1 3 - 0 20 30 2 52 12 4 - 1 101 121
1998 16 0 9 0 0 - 0 25 14 0 46 4 0 - 1 65 90 1999 19 1 7 1 0 - 0 28 16 2 32 3 2 - 0 55 83 2000 9 1 9 1 0 - 0 20 18 0 48 7 3 - 2 78 98
2001 7 1 1 0 1 - 0 10 17 1 23 9 5 - 1 56 66 2002 7 0 3 1 0 - 0 11 10 2 44 5 6 - 0 67 78
2003 9 0 4 1 0 - 0 14 12 5 31 7 3 - 0 58 72 2004 17 0 4 1 3 - 0 25 14 1 59 5 8 - 1 88 113 *Priority Review - Significant improvement compared to marketed products in the treatment, diagnosis, or prevention of a disease; **Standard Review - The drug appears to have therapeutic qualities similar to those of one or more already marketed drugs; ***Chemical Types: 1 - New molecular entity 2 - New ester, new salt, or other noncovalent derivative 3 - New formulation 4 - New combination 5 - New manufacturer 6 - New indication (Beginning in 1994, Type 6 NDAs were tracked as efficacy supplements) 7 - Drug already marketed, but without an approved NDA
105
APPENDIX 2.C: FDA GLOSSARY OF TERMS FOR DRUGS Abbreviated New Drug Application (ANDA) An Abbreviated New Drug Application (ANDA) contains data that, when submitted to FDA's Center for Drug Evaluation and Research, Office of Generic Drugs, provides for the review and ultimate approval of a generic drug product. Generic drug applications are called "abbreviated" because they are generally not required to include preclinical (animal) and clinical (human) data to establish safety and effectiveness. Instead, a generic applicant must scientifically demonstrate that its product is bioequivalent (i.e., performs in the same manner as the innovator drug). Once approved, an applicant may manufacture and market the generic drug product to provide a safe, effective, low cost alternative to the American public. Active Ingredient An active ingredient is any component that provides pharmacological activity or other direct effect in the diagnosis, cure, mitigation, treatment, or prevention of disease, or to affect the structure or any function of the body of man or animals. Biologic License Application (BLA) Biological products are approved for marketing under the provisions of the Public Health Service (PHS) Act. The Act requires a firm who manufactures a biologic for sale in interstate commerce to hold a license for the product. A biologics license application is a submission that contains specific information on the manufacturing processes, chemistry, pharmacology, clinical pharmacology and the medical affects of the biologic product. If the information provided meets FDA requirements, the application is approved and a license is issued allowing the firm to market the product. Brand Name Drug A brand name drug is a drug marketed under a proprietary, trademark-protected name. Chemical Type The Chemical Type represents the newness of a drug formulation or a new indication for an existing drug formulation. For example, Chemical Type 1 is assigned to an active ingredient that has never before been marketed in the United States in any form. (list of Chemical Types and their meanings). Company The company (also called applicant or sponsor) submits an application to FDA for approval to market a drug product in the United States. Generic Drug A generic drug is the same as a brand name drug in dosage, safety, strength, how it is taken, quality, performance, and intended use. Before approving a generic drug product, FDA requires many rigorous tests and procedures to assure that the generic drug can be substituted for the brand name drug. The FDA bases evaluations of substitutability, or "therapeutic equivalence," of generic drugs on scientific evaluations. By law, a generic drug product must contain the identical amounts of the same active ingredient(s) as the brand name product. Drug products evaluated as "therapeutically equivalent" can be expected to have equal effect and no difference when substituted for the brand name product. New Drug Application (NDA) When the sponsor of a new drug believes that enough evidence on the drug's safety and effectiveness has been obtained to meet FDA's requirements for marketing approval, the sponsor submits to FDA a new drug application (NDA). The application must contain data from specific technical viewpoints for review, including chemistry, pharmacology, medical, biopharmaceutics, and statistics. If the NDA is approved, the product may be marketed in the United States. For internal tracking purposes, all NDA's are assigned an NDA number. New Molecular Entity (NME) A New Molecular Entity is an active ingredient that has never before been marketed in the United States in any form.