Embed Size (px)
Citation preview
FOCUS on Health Spending @ OECD Health Statistics 2015 2
With increases in health spending in line with overall economic growth, health expenditure as a share of GDP has remained stable in recent years. This is in contrast to the years preceding the economic crisis, when health spending
outpaced the rest of the economy. In 2013, health spending (excluding investment) as a share of GDP was 8.9%2, ranging from 5.1% in Turkey to 16.4% in the United States (Figure 2).
A third of OECD countries saw health spending fall in 2013
Many countries continue to see health spending below 2009 levels
Since 2009, there has been a difference of health spending growth between European Union countries and the rest of the OECD. While both groups of countries showed similar levels of growth prior to the crisis, many European countries faced dramatic reductions in health spending from 2010 onwards with some subject to ongoing contraction over a number of years. Average health spending growth across the EU members of the OECD climbed just above zero in 2013 after three successive years of reductions. Across the rest of the OECD, average health spending growth also fell significantly in
2010 (from 3.3% in 2009 to 1.6% in 2010), but since then has averaged between 2% and 3% each year.
Greece, Italy and Portugal saw further reductions in per capita health spending in 2013 (Table 1). For Greece, the 2.5% drop in real terms signalled a fourth consecutive fall in health spending, leaving per capita levels at around 75% of those in 2009. Portugal and Italy have both seen health spending contract for three years in a row. Preliminary estimates for Italy also suggest a further fall in spending occurred in 2014. Austria and the Netherlands posted real term drops in health spending for the first time in 2013. In all, per capita health spending fell in 10 OECD countries (out of the 30 OECD countries reporting 2013 figures), all in Europe but New Zealand.
Figure 2. Health spending (excluding investment) as a share of GDP, OECD countries, 2013
16
.4
11
.1
11
.1
11
.0
11
.0
10
.9
10
.4
10
.2
10
.2
10
.2
10
.1
9.5
9
.2
9.0
8
.9
8.9
8
.9
8.8
8
.8
8.7
8
.7
8.6
8
.5
8.1
7
.6
7.5
7
.4
7.4
7
.1
6.9
6
.6
6.4
6
.2
6.0
5
.1
0.0
5.0
10.0
15.0
Public expenditure Private expenditure
1 Preliminary estimate. 2 Data refer to 2012.
5 of 40
C H A P T E R 1 5 ■ H E A L T H I N S U R A N C E I : H E A L T H E C O N O M I C S A N D P R I V A T E H E A L T H I N S U R A N C E
Public Finance and Public Policy Jonathan Gruber Fourth Edition Copyright © 2012 Worth Publishers
15.1
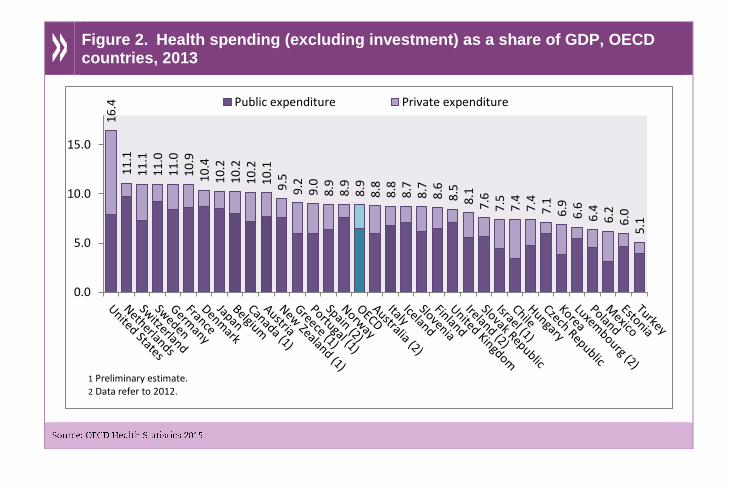
Distribution of National Health Expenditures in the
United States, 2010
Category Share of Spending
Hospital care 31%
Physician, clinical care 20
Prescription drugs 10
Nursing home care 6
Other personal health care 15
Other health spending 16
6 of 40
C H A P T E R 1 5 ■ H E A L T H I N S U R A N C E I : H E A L T H E C O N O M I C S A N D P R I V A T E H E A L T H I N S U R A N C E
Public Finance and Public Policy Jonathan Gruber Fourth Edition Copyright © 2012 Worth Publishers
15.1
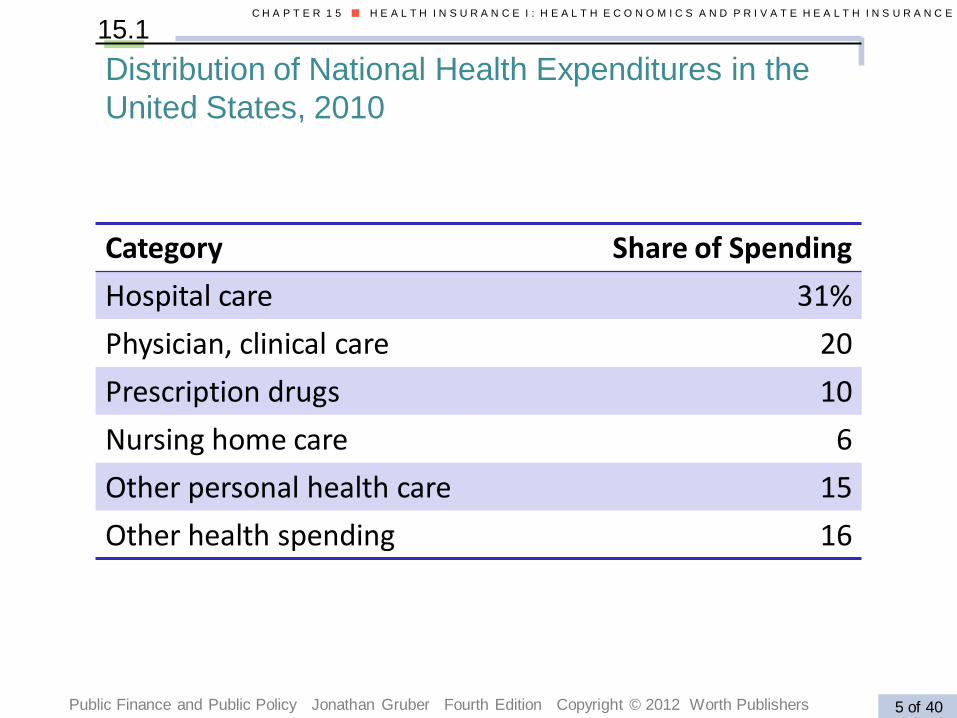
Americans’ Source of Health Insurance Coverage,
2010
People (millions)
Population %
Private 201.0 64.0
Employment-based 176.3 55.3
Direct purchase 26.8 9.8%
Public 87.4 31.0
Medicare 43 14.5
Medicaid 42.6 15.9
TRICARE/CHAMPVA 11.6 4.2
Uninsured 46.2 16.3
11 of 40
C H A P T E R 1 5 ■ H E A L T H I N S U R A N C E I : H E A L T H E C O N O M I C S A N D P R I V A T E H E A L T H I N S U R A N C E
Public Finance and Public Policy Jonathan Gruber Fourth Edition Copyright © 2012 Worth Publishers
15.1
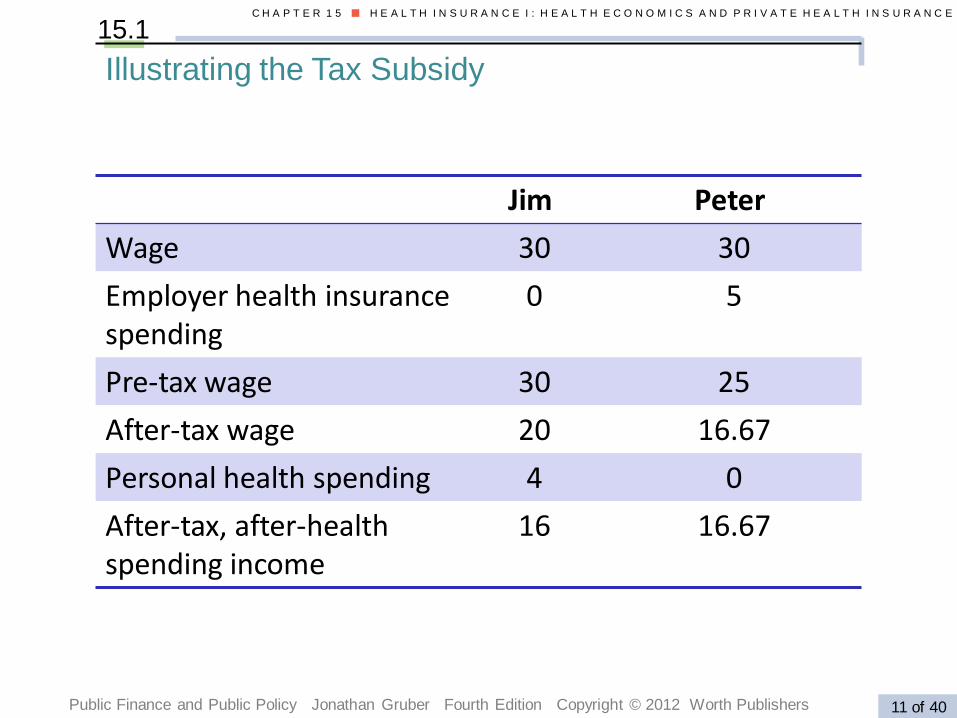
Illustrating the Tax Subsidy
Jim Peter
Wage 30 30
Employer health insurancespending
0 5
Pre-tax wage 30 25
After-tax wage 20 16.67
Personal health spending 4 0
After-tax, after-health spending income
16 16.67
12 of 40
C H A P T E R 1 5 ■ H E A L T H I N S U R A N C E I : H E A L T H E C O N O M I C S A N D P R I V A T E H E A L T H I N S U R A N C E
Public Finance and Public Policy Jonathan Gruber Fourth Edition Copyright © 2012 Worth Publishers
15.1
Why Employers Provide Private Insurance,
Part II: The Tax Subsidy
The subsidy to employer-provided health insurance is generally not well understood.
• Subsidy to employees not employers.
• Employer is indifferent between payments in wages and in health insurance (both are tax deductible).
• Worker prefers to be paid in health insurance rather than wages, the worker reduces her tax payments.
• To end the tax subsidy, don’t increase the corporate tax paid by the firm; instead, include employer spending on health insurance as part of an employee’s taxable income.
Public Finance and Public Policy Jonathan Gruber Third Edition Copyright © 2010 Worth Publishers 10 of 32
C H A P T E R 1 6 ■ H E A L T H I N S U R A N C E I I : M E D I C A R E , M E D I C A I D , A N D H E A L T H C A R E R E F O R M
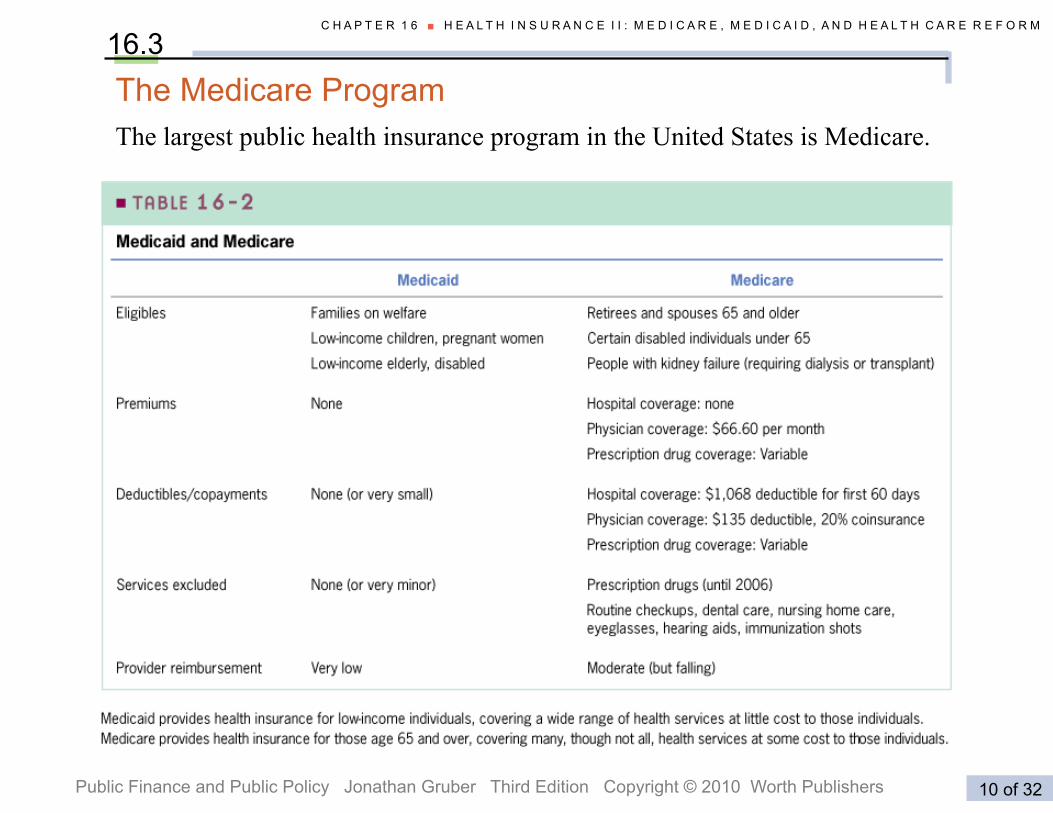
16.3 The Medicare Program The largest public health insurance program in the United States is Medicare.
Public Finance and Public Policy Jonathan Gruber Third Edition Copyright © 2010 Worth Publishers 20 of 39
C H A P T E R 1 5 ■ H E A L T H I N S U R A N C E I : H E A L T H E C O N O M I C S A N D P R I V A T E H E A L T H I N S U R A N C E
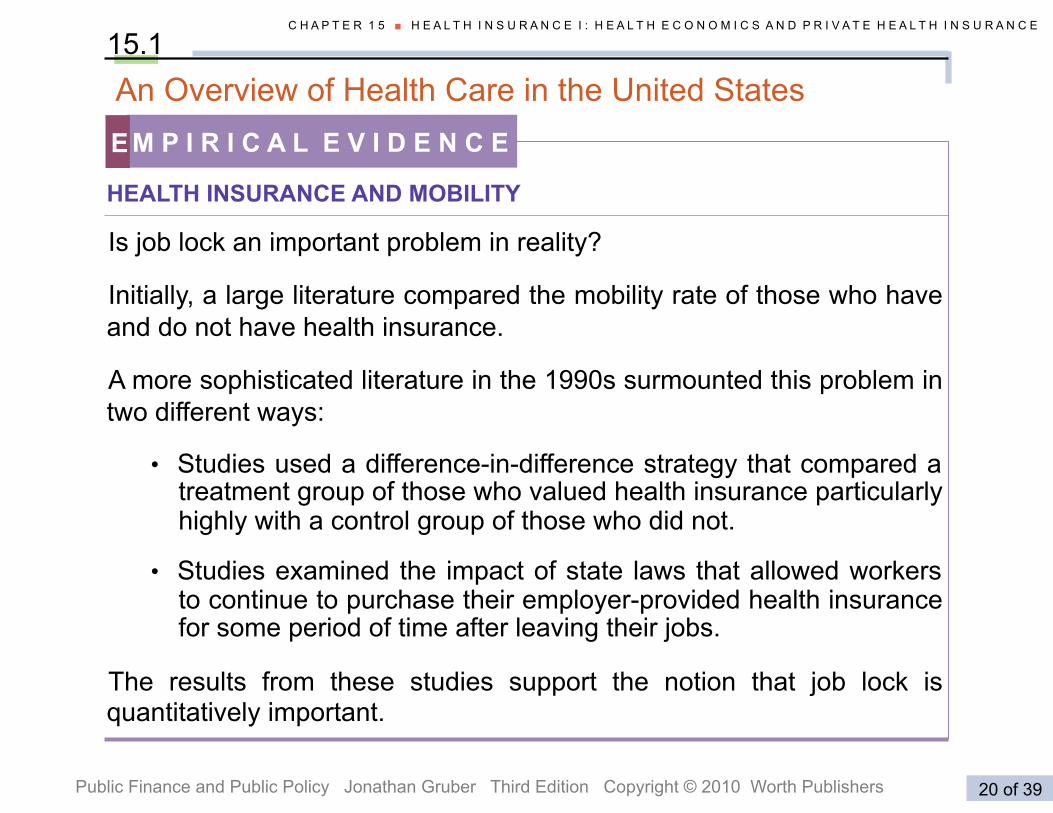
15.1 An Overview of Health Care in the United States
HEALTH INSURANCE AND MOBILITY
Is job lock an important problem in reality?
Initially, a large literature compared the mobility rate of those who have and do not have health insurance.
A more sophisticated literature in the 1990s surmounted this problem in two different ways:
• Studies used a difference-in-difference strategy that compared a treatment group of those who valued health insurance particularly highly with a control group of those who did not.
• Studies examined the impact of state laws that allowed workers to continue to purchase their employer-provided health insurance for some period of time after leaving their jobs.
The results from these studies support the notion that job lock is quantitatively important.
M P I R I C A L E V I D E N C E E
24 of 40
C H A P T E R 1 5 ■ H E A L T H I N S U R A N C E I : H E A L T H E C O N O M I C S A N D P R I V A T E H E A L T H I N S U R A N C E
Public Finance and Public Policy Jonathan Gruber Fourth Edition Copyright © 2012 Worth Publishers
Price of visit
Number of visitsto doctor’s office
0
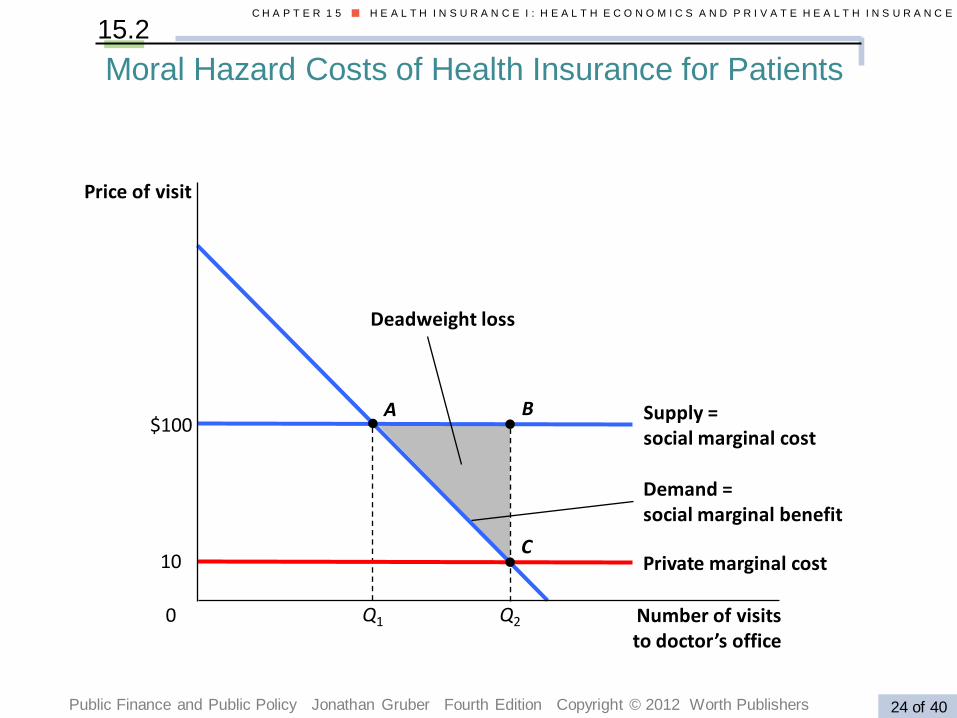
Moral Hazard Costs of Health Insurance for Patients
15.2
Deadweight loss
Supply = social marginal cost
Demand = social marginal benefit
Private marginal cost
Q1 Q2
10
$100A B
C
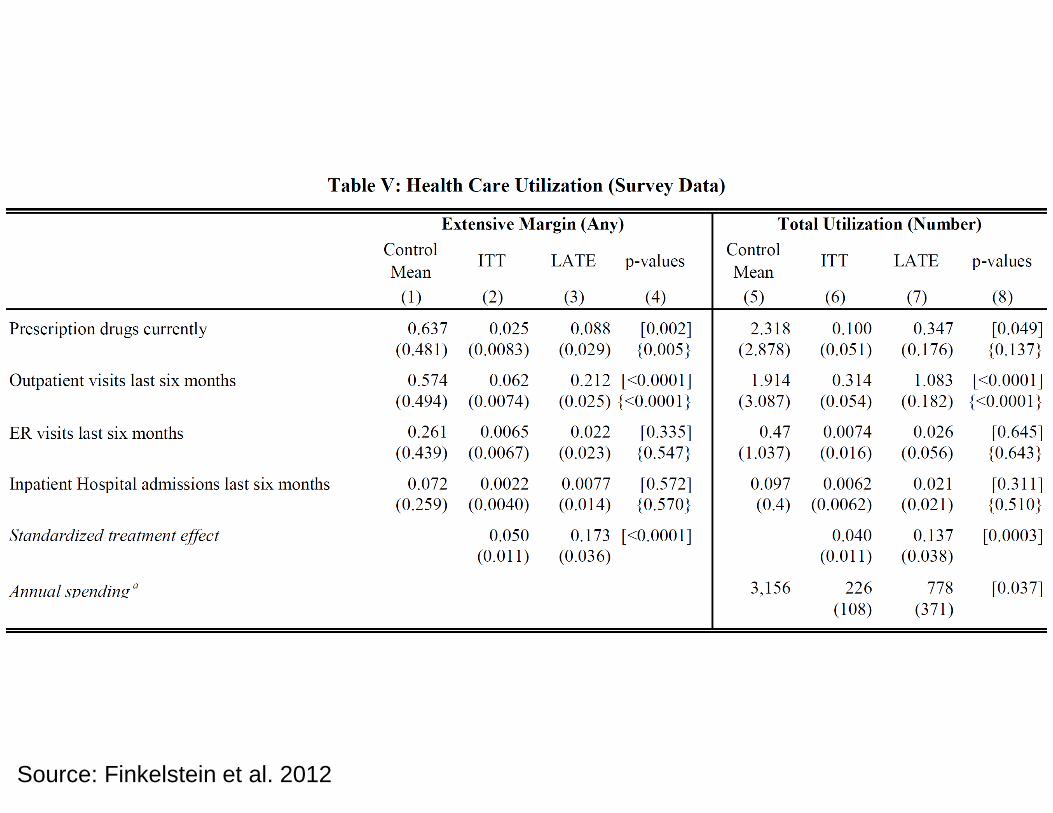
Source: Finkelstein et al. 2012
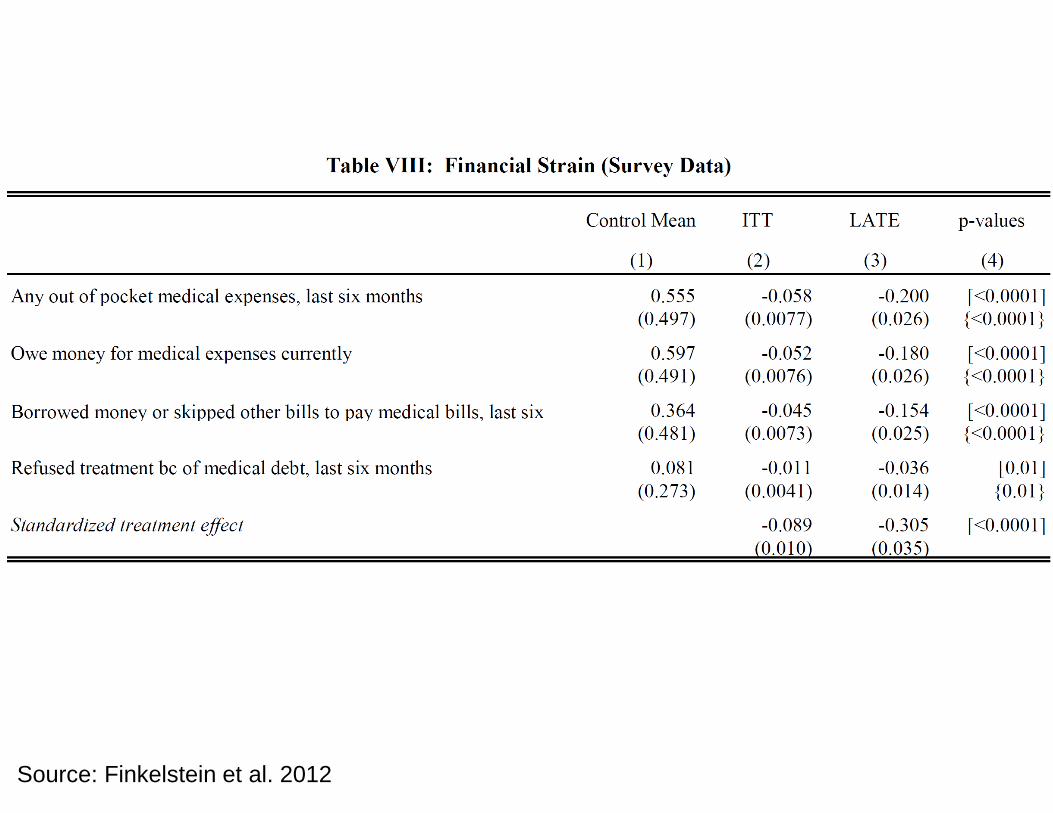
Source: Finkelstein et al. 2012
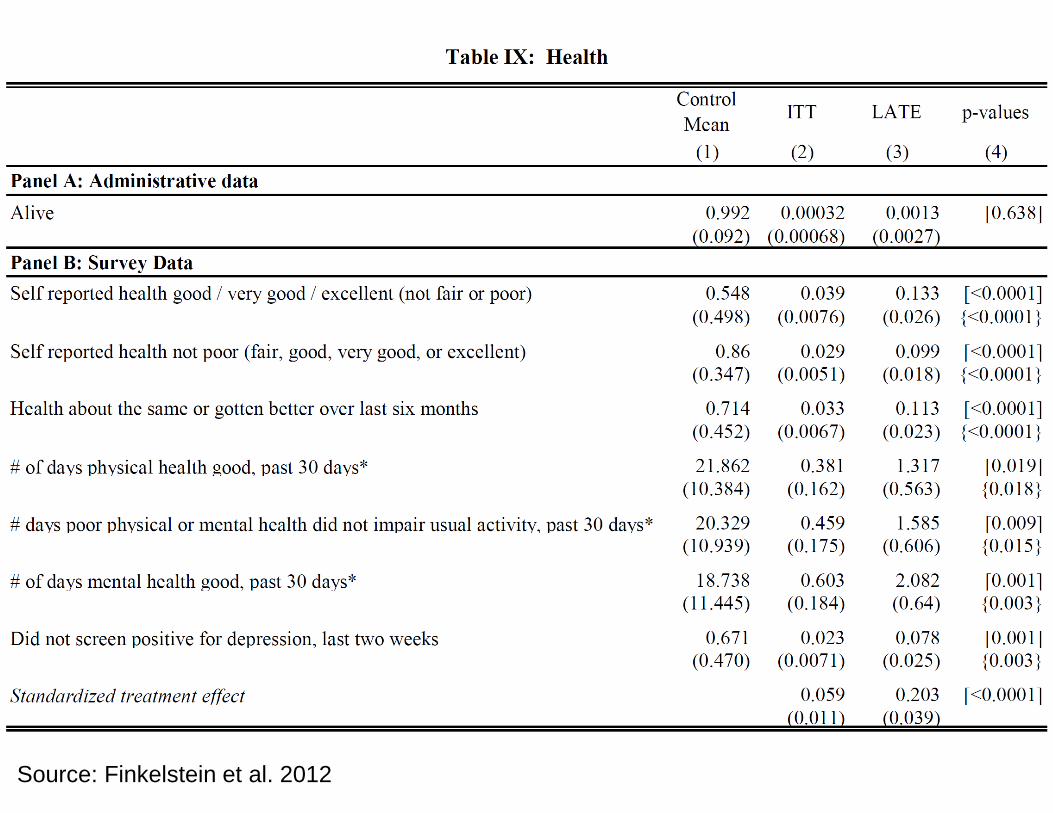
Source: Finkelstein et al. 2012
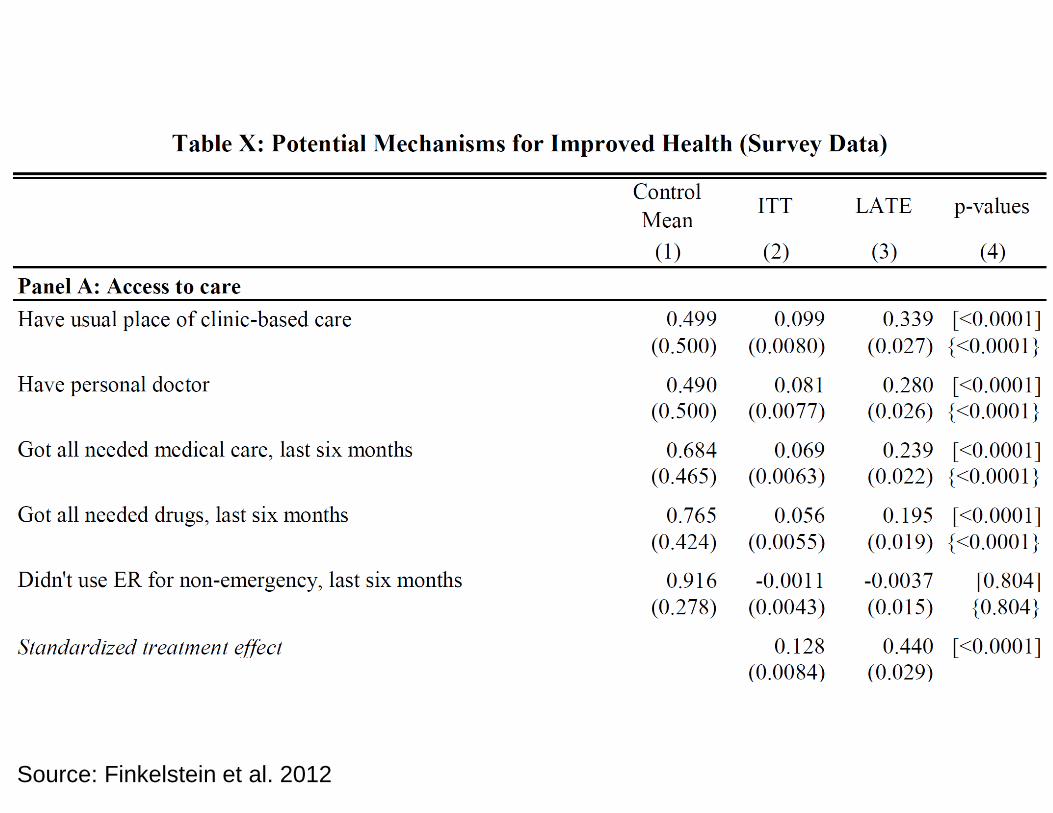
Source: Finkelstein et al. 2012
12 of 42
C H A P T E R 1 6 ■ H E A L T H I N S U R A N C E I I : M E D I C A R E , M E D I C A I D , A N D H E A L T H C A R E R E F O R M
Public Finance and Public Policy Jonathan Gruber Fourth Edition Copyright © 2012 Worth Publishers
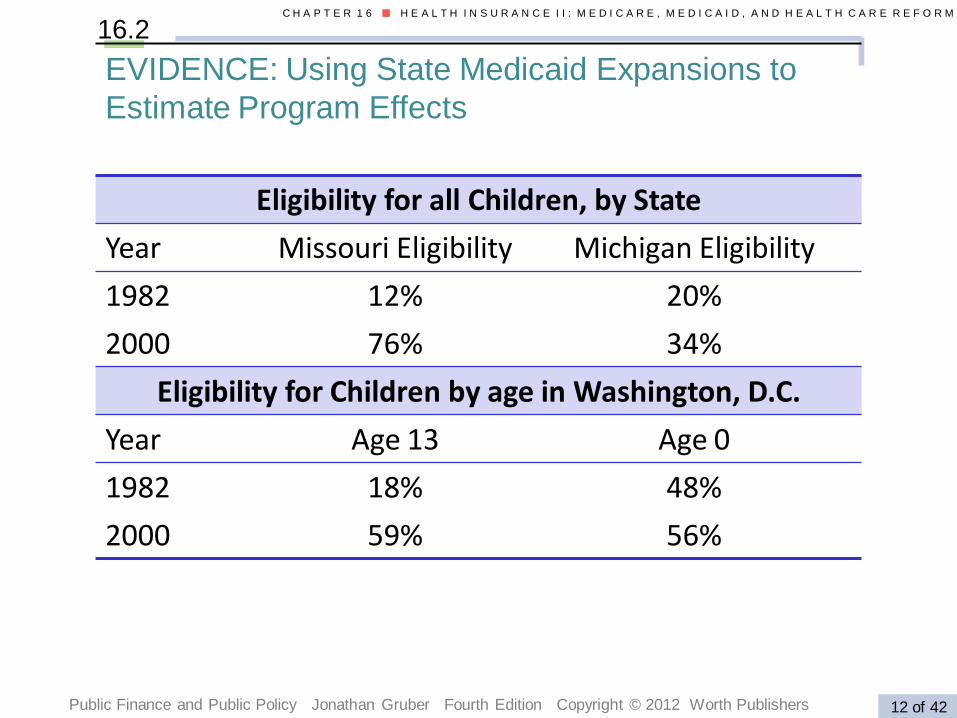
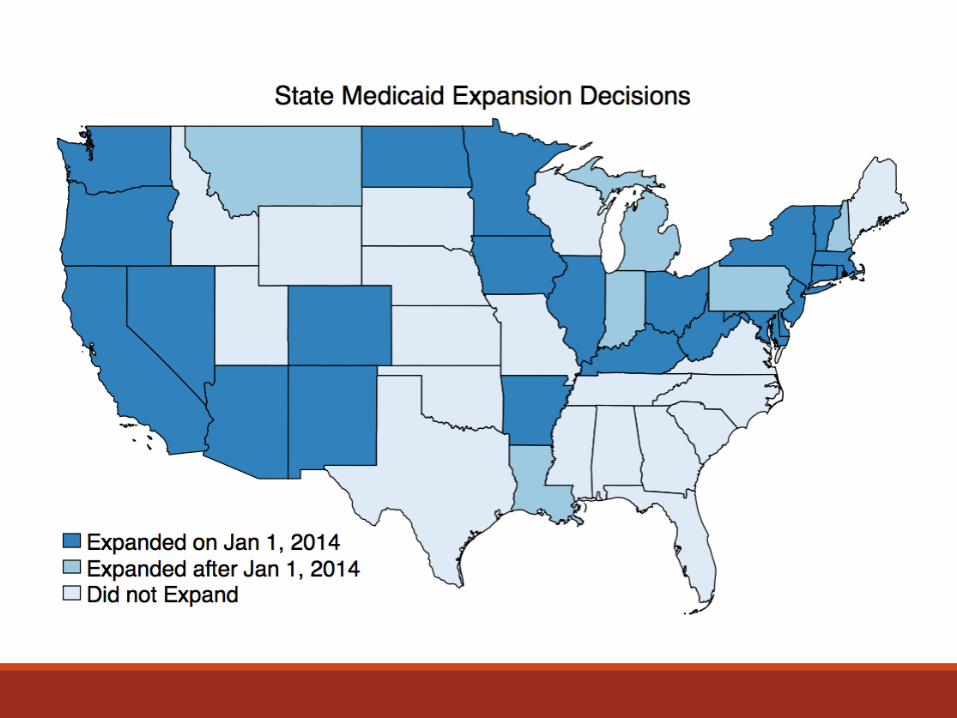
16.2
EVIDENCE: Using State Medicaid Expansions to
Estimate Program Effects
Eligibility for all Children, by State
Year Missouri Eligibility Michigan Eligibility
1982 12% 20%
2000 76% 34%
Eligibility for Children by age in Washington, D.C.
Year Age 13 Age 0
1982 18% 48%
2000 59% 56%
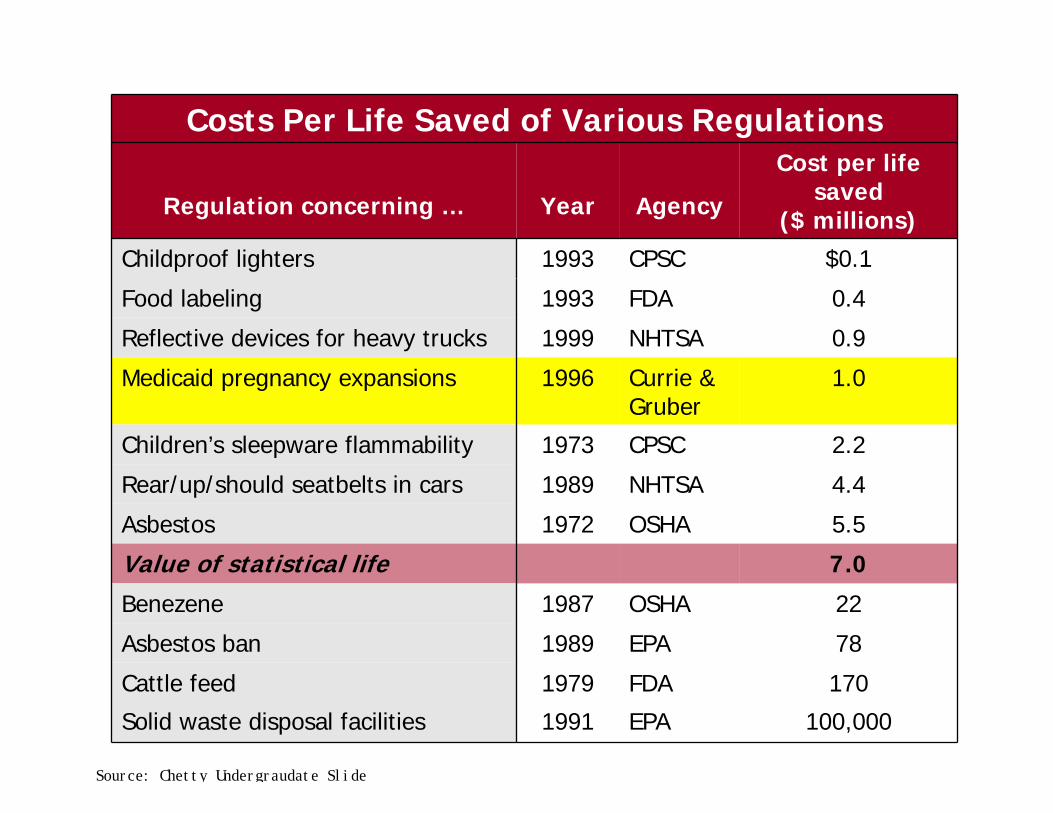
Costs Per Life Saved of Various Regulations
Regulation concerning … Year Agency
Cost per life saved
($ millions)
Childproof lighters 1993 CPSC $0.1
Food labeling 1993 FDA 0.4
Reflective devices for heavy trucks 1999 NHTSA 0.9
Medicaid pregnancy expansions 1996 Currie & Gruber
1.0
Children’s sleepware flammability 1973 CPSC 2.2
Rear/up/should seatbelts in cars 1989 NHTSA 4.4
Asbestos 1972 OSHA 5.5
Value of statistical life 7.0
Benezene 1987 OSHA 22
Asbestos ban 1989 EPA 78
Cattle feed 1979 FDA 170
Solid waste disposal facilities 1991 EPA 100,000
Source: Chetty Undergraudate Slide
9
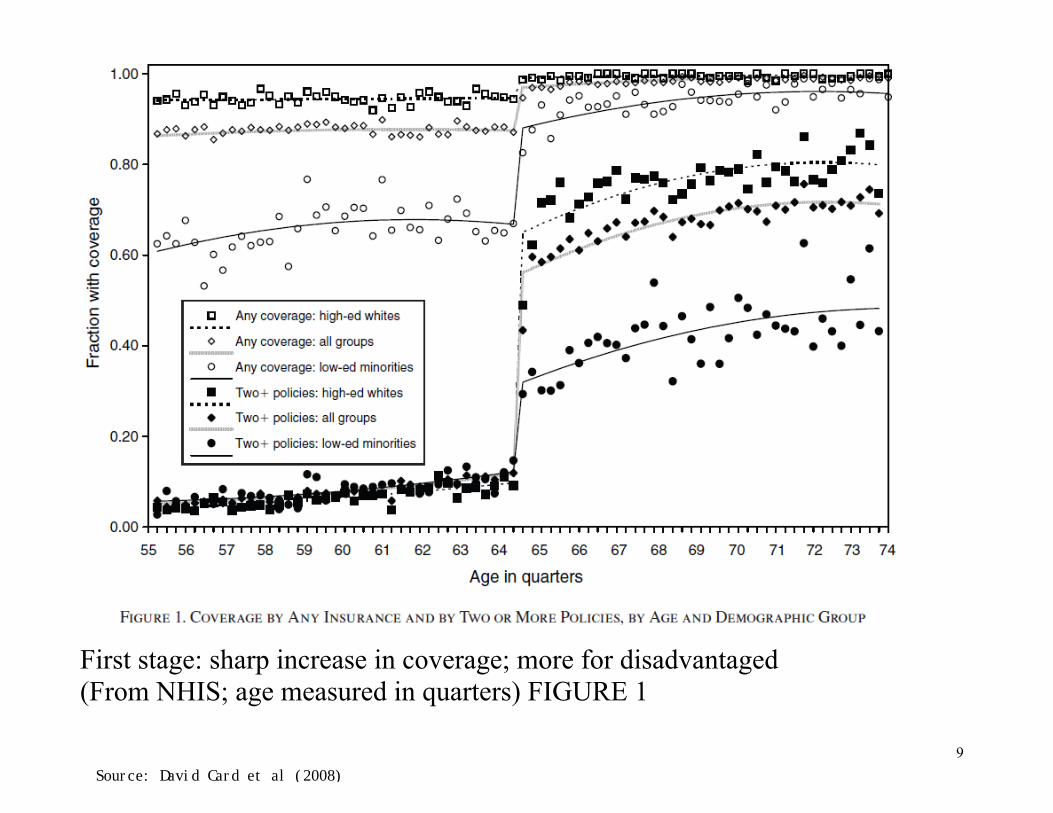
First stage: sharp increase in coverage; more for disadvantaged (From NHIS; age measured in quarters) FIGURE 1
Source: David Card et al (2008)
13
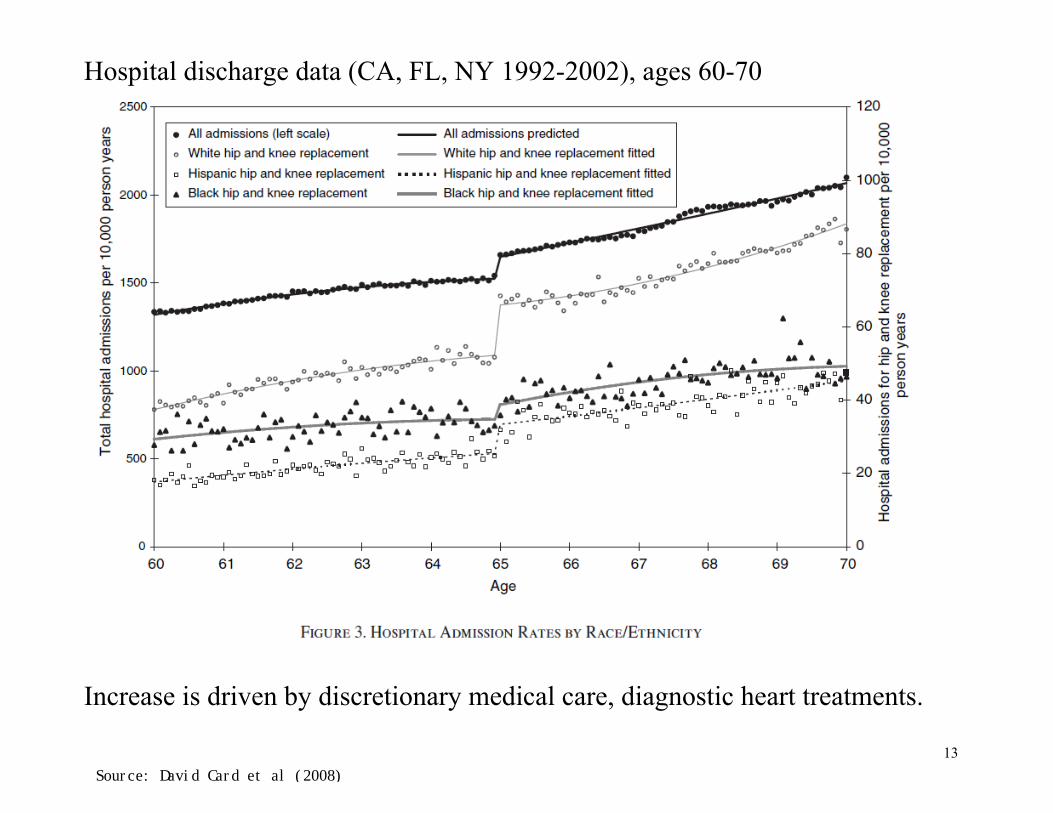
Hospital discharge data (CA, FL, NY 1992-2002), ages 60-70
Increase is driven by discretionary medical care, diagnostic heart treatments.
Source: David Card et al (2008)
22
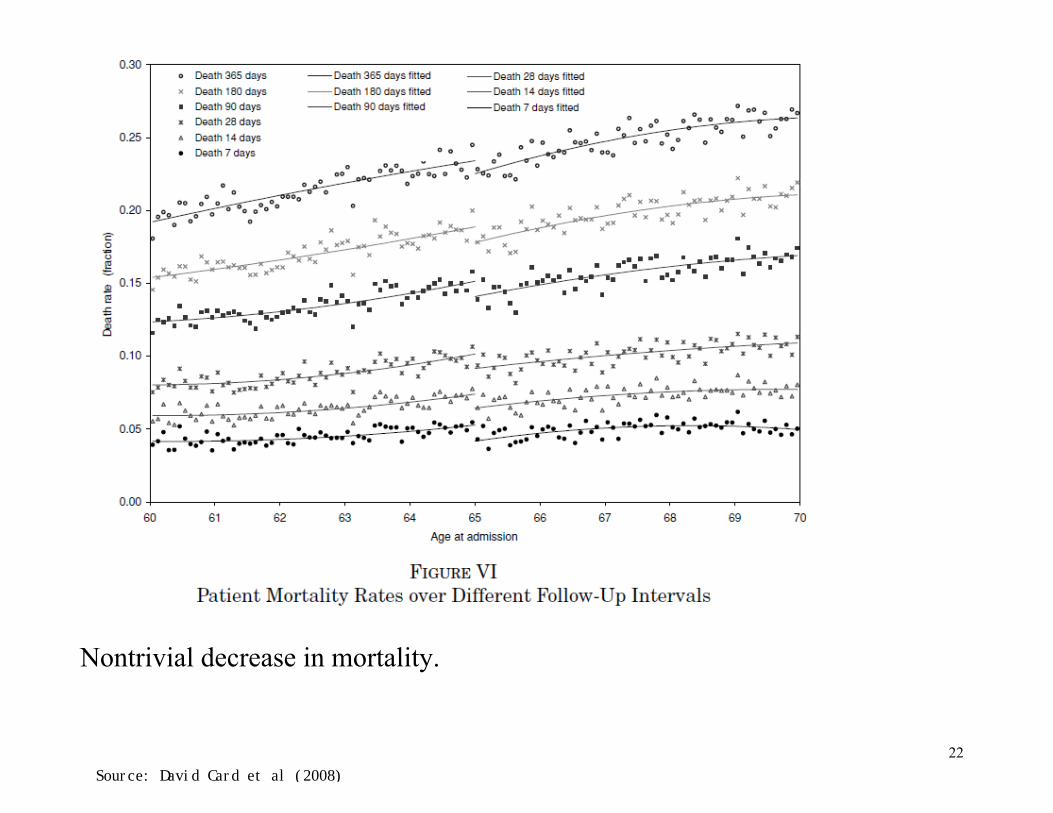
Nontrivial decrease in mortality.
Source: David Card et al (2008)
25 of 40
C H A P T E R 1 5 ■ H E A L T H I N S U R A N C E I : H E A L T H E C O N O M I C S A N D P R I V A T E H E A L T H I N S U R A N C E
Public Finance and Public Policy Jonathan Gruber Fourth Edition Copyright © 2012 Worth Publishers
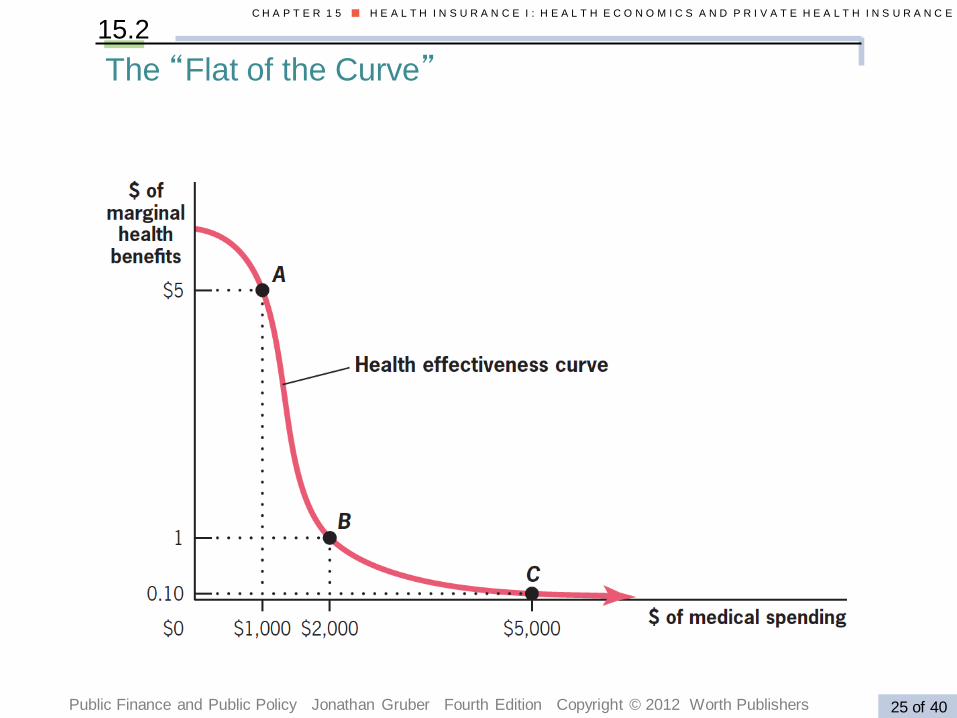
15.2
The “Flat of the Curve”
37 of 42
C H A P T E R 1 6 ■ H E A L T H I N S U R A N C E I I : M E D I C A R E , M E D I C A I D , A N D H E A L T H C A R E R E F O R M
Public Finance and Public Policy Jonathan Gruber Fourth Edition Copyright © 2012 Worth Publishers
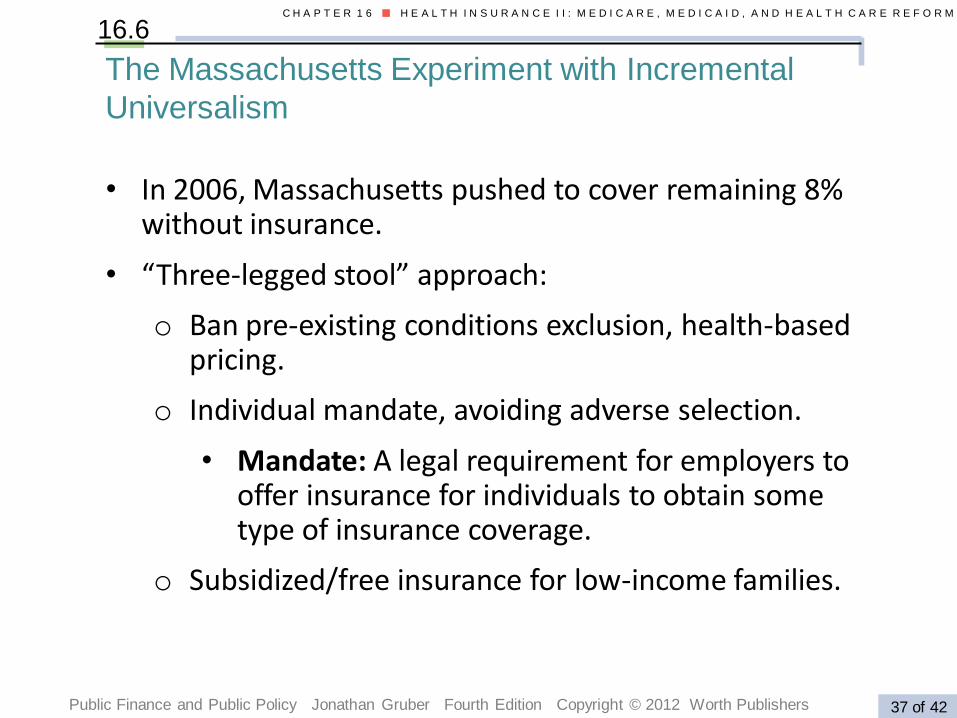
16.6
• In 2006, Massachusetts pushed to cover remaining 8% without insurance.
• “Three-legged stool” approach:
o Ban pre-existing conditions exclusion, health-based pricing.
o Individual mandate, avoiding adverse selection.
• Mandate: A legal requirement for employers to offer insurance for individuals to obtain some type of insurance coverage.
o Subsidized/free insurance for low-income families.
The Massachusetts Experiment with Incremental
Universalism
38 of 42
C H A P T E R 1 6 ■ H E A L T H I N S U R A N C E I I : M E D I C A R E , M E D I C A I D , A N D H E A L T H C A R E R E F O R M
Public Finance and Public Policy Jonathan Gruber Fourth Edition Copyright © 2012 Worth Publishers
16.6
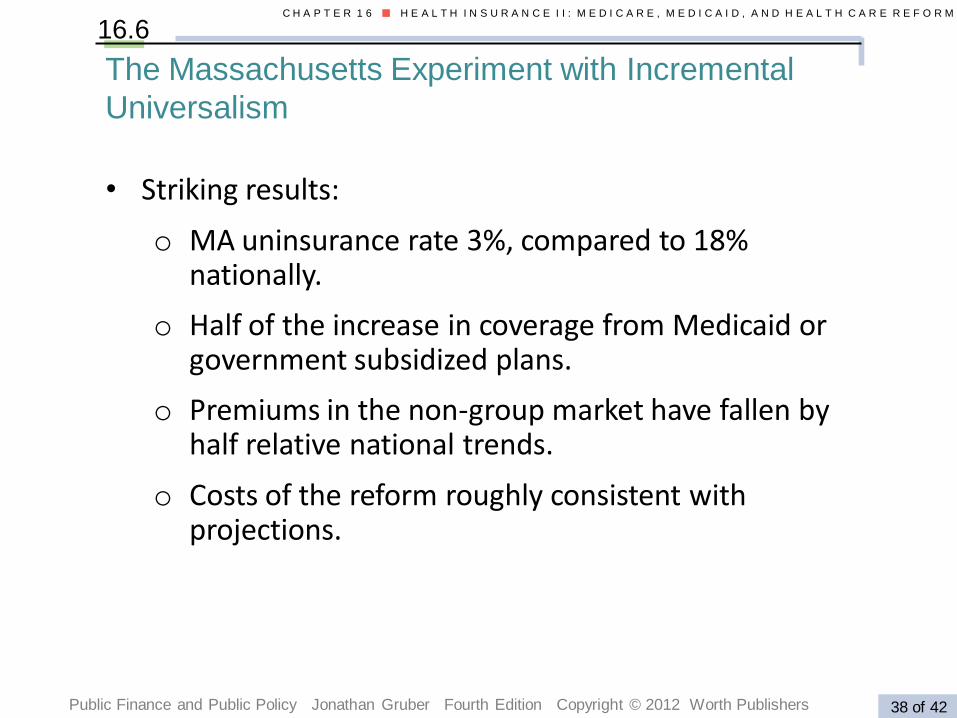
• Striking results:
o MA uninsurance rate 3%, compared to 18% nationally.
o Half of the increase in coverage from Medicaid or government subsidized plans.
o Premiums in the non-group market have fallen by half relative national trends.
o Costs of the reform roughly consistent with projections.
The Massachusetts Experiment with Incremental
Universalism
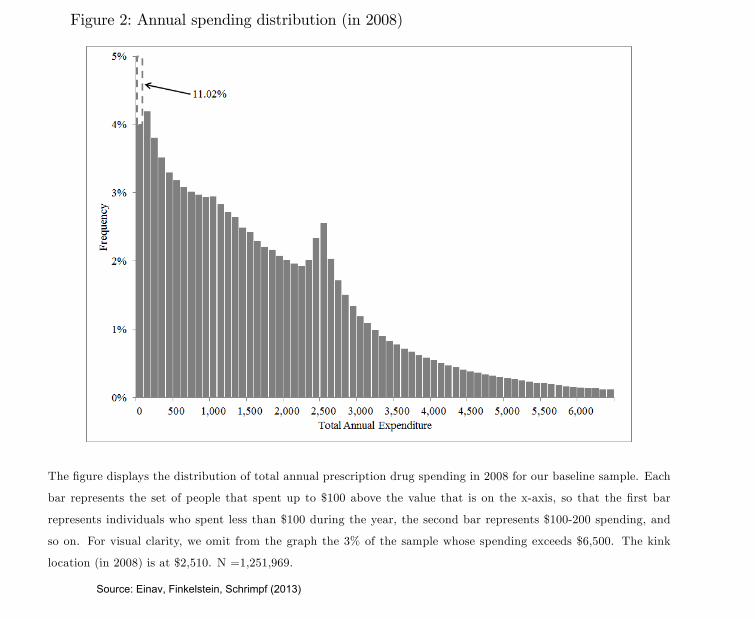
Figure 2: Annual spending distribution (in 2008)
The �gure displays the distribution of total annual prescription drug spending in 2008 for our baseline sample. Each
bar represents the set of people that spent up to $100 above the value that is on the x-axis, so that the �rst bar
represents individuals who spent less than $100 during the year, the second bar represents $100-200 spending, and
so on. For visual clarity, we omit from the graph the 3% of the sample whose spending exceeds $6,500. The kink
location (in 2008) is at $2,510. N =1,251,969.
36
Source: Einav, Finkelstein, Schrimpf (2013)
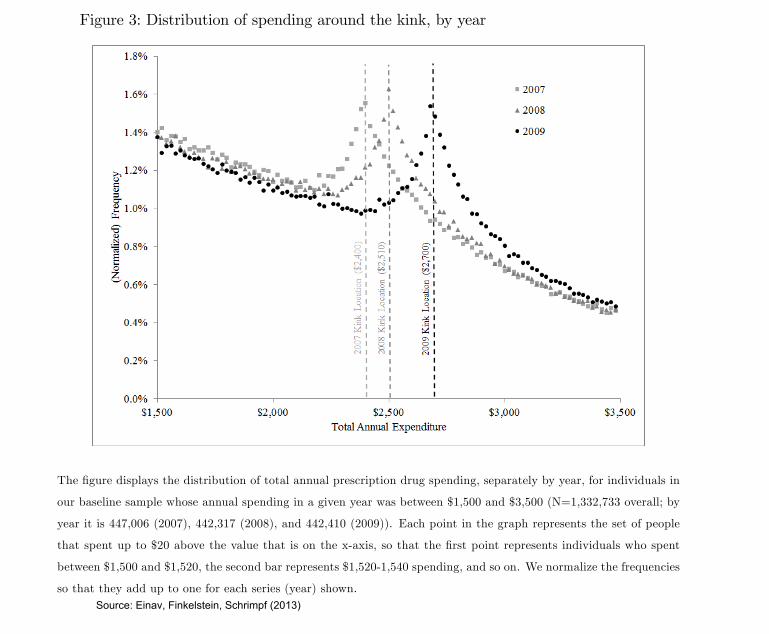
Figure 3: Distribution of spending around the kink, by year
The �gure displays the distribution of total annual prescription drug spending, separately by year, for individuals in
our baseline sample whose annual spending in a given year was between $1,500 and $3,500 (N=1,332,733 overall; by
year it is 447,006 (2007), 442,317 (2008), and 442,410 (2009)). Each point in the graph represents the set of people
that spent up to $20 above the value that is on the x-axis, so that the �rst point represents individuals who spent
between $1,500 and $1,520, the second bar represents $1,520-1,540 spending, and so on. We normalize the frequencies
so that they add up to one for each series (year) shown.
37
Source: Einav, Finkelstein, Schrimpf (2013)
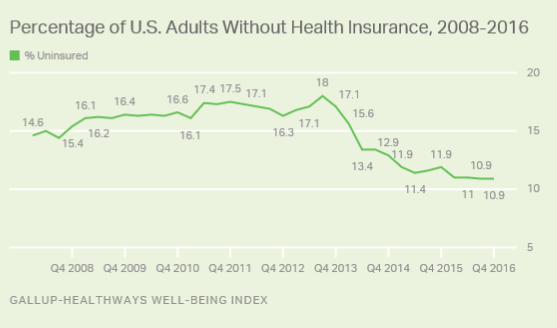
The uninured rate ha fallen 6.2 percentage point from 17.1% in the fourth quarter of 2013. Thiwa jut efore the implementation of the Affordale Care Act' individual mandate, which compelAmerican to carr health inurance or incur a fine. The highet uninured rate that Gallup hameaured ince 2008 wa 18.0% in the third quarter of 2013, efore the health inuranceexchange opened on Oct. 1 of that ear.
The 2016 fourth-quarter reult are aed on approximatel 43,000 interview with U.. adult aged18 and older from Nov. 1 to Dec. 30, conducted a part of the Gallup-Healthwa Well-eing Index.Gallup and Healthwa ak 500 randoml elected U.. adult dail whether the have healthinurance, allowing for trended meaurement of the hare of American who have health inuranceover time.
Low-Income Adult and Hipanic ee Larget Change
The larget decline in the uninured rate ince the individual mandate took effect have eenamong two group with the highet uninured rate at that time -- low-income (now at 20.8%) andHipanic (27.4%) adult. While uninured rate among oth group have declined aout 10percentage point etween the fourth quarter of 2013 and 2016, the maintain the highet
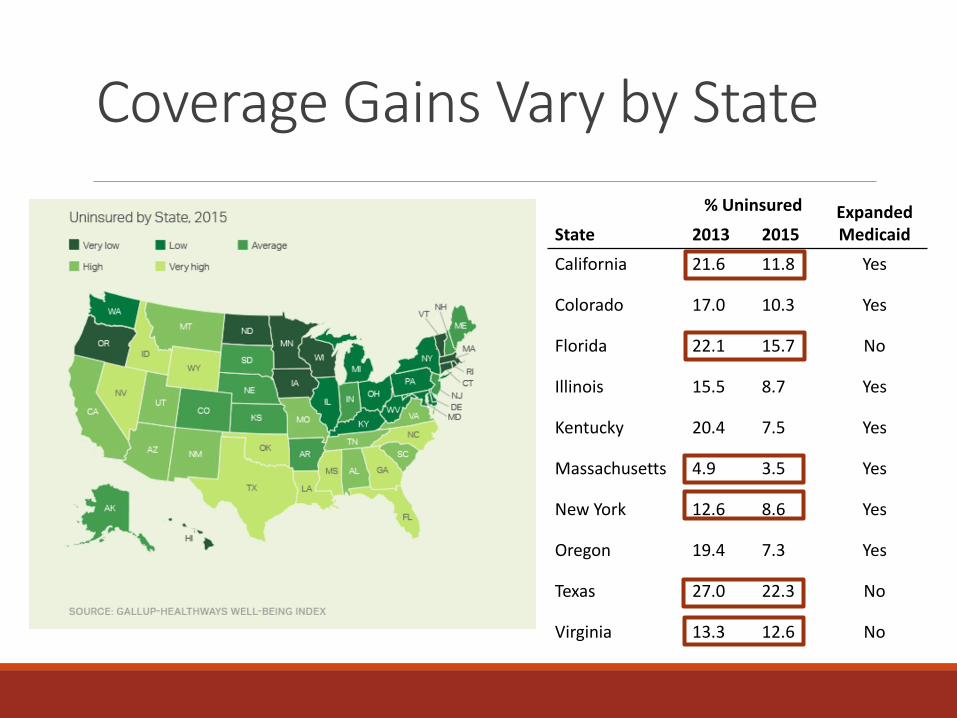
Coverage Gains Vary by State
% Uninsured Expanded Medicaid State 2013 2015
California 21.6 11.8 Yes
Colorado 17.0 10.3 Yes
Florida 22.1 15.7 No
Illinois 15.5 8.7 Yes
Kentucky 20.4 7.5 Yes
Massachusetts 4.9 3.5 Yes
New York 12.6 8.6 Yes
Oregon 19.4 7.3 Yes
Texas 27.0 22.3 No
Virginia 13.3 12.6 No
There was a pause in midlife mortality decline in the 1960s,largely explicable by historical patterns of smoking (13). Otherwise,the post-1999 episode in midlife mortality in the United States is bothhistorically and geographically unique, at least since 1950. The turn-around is not a simple cohort effect; Americans born between 1945and 1965 did not have particularly high mortality rates before midlife.Fig. 2 presents the three causes of death that account for the
mortality reversal among white non-Hispanics, namely suicide, drugand alcohol poisoning (accidental and intent undetermined), andchronic liver diseases and cirrhosis. All three increased year-on-yearafter 1998. Midlife increases in suicides and drug poisonings havebeen previously noted (14–16). However, that these upward trendswere persistent and large enough to drive up all-cause midlife mor-tality has, to our knowledge, been overlooked. For context, Fig. 2 alsopresents mortality from lung cancer and diabetes. The obesity epi-demic has (rightly) made diabetes a major concern for midlifeAmericans; yet, in recent history, death from diabetes has not beenan increasing threat. Poisonings overtook lung cancer as a cause ofdeath in 2011 in this age group; suicide appears poised to do so.Table 1 shows changes in mortality rates from 1999 to 2013 for
white non-Hispanic men and women ages 45–54 and, for com-parison, changes for black non-Hispanics and for Hispanics. Thetable also presents changes in mortality rates for white non-His-panics by three broad education groups: those with a high schooldegree or less (37% of this subpopulation over this period), thosewith some college, but no bachelor’s (BA) degree (31%), and thosewith a BA or more (32%). The fraction of 45- to 54-y-olds in thethree education groups was stable over this period. Each cell showsthe change in the mortality rate from 1999 to 2013, as well as itslevel (deaths per 100,000) in 2013.Over the 15-y period, midlife all-cause mortality fell by more
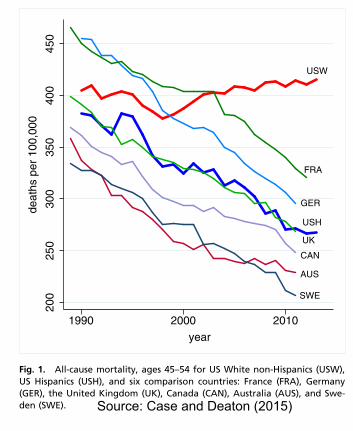
than 200 per 100,000 for black non-Hispanics, and by more than60 per 100,000 for Hispanics. By contrast, white non-Hispanicmortality rose by 34 per 100,000. The ratio of black non-Hispanicto white non-Hispanic mortality rates for ages 45–54 fell from
2.09 in 1999 to 1.40 in 2013. CDC reports have highlighted thenarrowing of the black−white gap in life expectancy (12). How-ever, for ages 45–54, the narrowing of the mortality rate ratio inthis period was largely driven by increased white mortality; ifwhite non-Hispanic mortality had continued to decline at 1.8%per year, the ratio in 2013 would have been 1.97. The role playedby changing white mortality rates in the narrowing of the black−white life expectancy gap (2003−2008) has been previouslynoted (17). It is far from clear that progress in black longevityshould be benchmarked against US whites.The change in all-cause mortality for white non-Hispanics 45–54 is
largely accounted for by an increasing death rate from externalcauses, mostly increases in drug and alcohol poisonings and in sui-cide. (Patterns are similar for men and women when analyzed sep-arately.) In contrast to earlier years, drug overdoses were notconcentrated among minorities. In 1999, poisoning mortality for ages45–54 was 10.2 per 100,000 higher for black non-Hispanics thanwhite non-Hispanics; by 2013, poisoning mortality was 8.4 per100,000 higher for whites. Death from cirrhosis and chronic liverdiseases fell for blacks and rose for whites. After 2006, death ratesfrom alcohol- and drug-induced causes for white non-Hispanicsexceeded those for black non-Hispanics; in 2013, rates for white non-Hispanic exceeded those for black non-Hispanics by 19 per 100,000.The three numbered rows of Table 1 show that the turnaround
in mortality for white non-Hispanics was driven primarily by in-creasing death rates for those with a high school degree or less.All-cause mortality for this group increased by 134 per 100,000between 1999 and 2013. Those with college education less than aBA saw little change in all-cause mortality over this period; thosewith a BA or more education saw death rates fall by 57 per100,000. Although all three educational groups saw increases inmortality from suicide and poisonings, and an overall increase inexternal cause mortality, increases were largest for those with theleast education. The mortality rate from poisonings rose morethan fourfold for this group, from 13.7 to 58.0, and mortality fromchronic liver diseases and cirrhosis rose by 50%. The final tworows of the table show increasing educational gradients from 1999
USW
FRA
GER
USH
UK
CAN
AUS
SWE
200
250
300
350
400
450
deat
hs p
er 1
00,0
00
1990 2000 2010
year
Fig. 1. All-cause mortality, ages 45–54 for US White non-Hispanics (USW),US Hispanics (USH), and six comparison countries: France (FRA), Germany(GER), the United Kingdom (UK), Canada (CAN), Australia (AUS), and Swe-den (SWE).
poisonings
lung cancer
suicides
chronic liver diseases
diabetes
1015
2025
30de
aths
per
100
,000
2000 2005 2010 2015year
Fig. 2. Mortality by cause, white non-Hispanics ages 45–54.
Case and Deaton PNAS | December 8, 2015 | vol. 112 | no. 49 | 15079
SOCIALSC
IENCE
SSE
ECO
MMEN
TARY
Source: Case and Deaton (2015)