Embed Size (px)
Citation preview
T R E N D S I N H I G H E R E D U C A T I O N S E R I E S
Trends in Student Aid2009
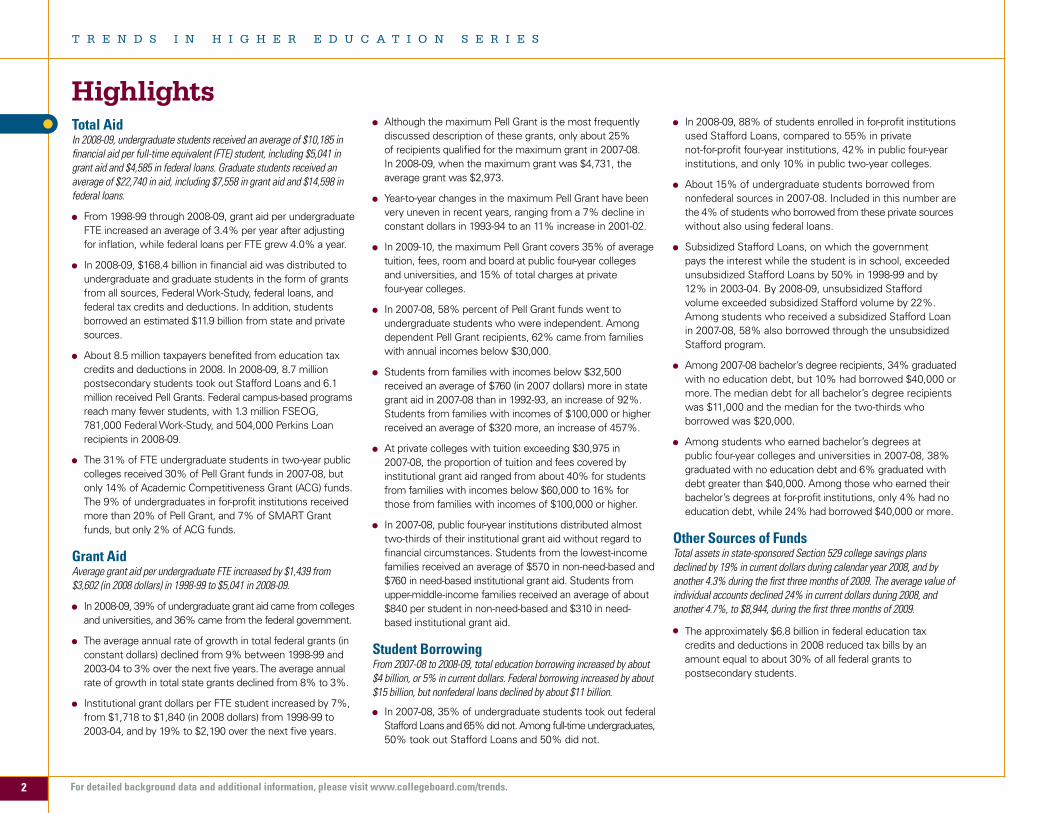
HighlightsTotal AidIn 2008-09, undergraduate students received an average of $10,185 in financial aid per full-time equivalent (FTE) student, including $5,041 in grant aid and $4,585 in federal loans. Graduate students received an average of $22,740 in aid, including $7,558 in grant aid and $14,598 in federal loans.
From 1998-99 through 2008-09, grant aid per undergraduate FTE increased an average of 3.4% per year after adjusting for inflation, while federal loans per FTE grew 4.0% a year.
In 2008-09, $168.4 billion in financial aid was distributed to undergraduate and graduate students in the form of grants from all sources, Federal Work-Study, federal loans, and federal tax credits and deductions. In addition, students borrowed an estimated $11.9 billion from state and private sources.
About 8.5 million taxpayers benefited from education tax credits and deductions in 2008. In 2008-09, 8.7 million postsecondary students took out Stafford Loans and 6.1 million received Pell Grants. Federal campus-based programs reach many fewer students, with 1.3 million FSEOG, 781,000 Federal Work-Study, and 504,000 Perkins Loan recipients in 2008-09.
The 31% of FTE undergraduate students in two-year public colleges received 30% of Pell Grant funds in 2007-08, but only 14% of Academic Competitiveness Grant (ACG) funds. The 9% of undergraduates in for-profit institutions received more than 20% of Pell Grant, and 7% of SMART Grant funds, but only 2% of ACG funds.
Grant AidAverage grant aid per undergraduate FTE increased by $1,439 from $3,602 (in 2008 dollars) in 1998-99 to $5,041 in 2008-09.
In 2008-09, 39% of undergraduate grant aid came from colleges and universities, and 36% came from the federal government.
The average annual rate of growth in total federal grants (in constant dollars) declined from 9% between 1998-99 and 2003-04 to 3% over the next five years. The average annual rate of growth in total state grants declined from 8% to 3%.
Institutional grant dollars per FTE student increased by 7%,
from $1,718 to $1,840 (in 2008 dollars) from 1998-99 to 2003-04, and by 19% to $2,190 over the next five years.
Although the maximum Pell Grant is the most frequently discussed description of these grants, only about 25% of recipients qualified for the maximum grant in 2007-08. In 2008-09, when the maximum grant was $4,731, the average grant was $2,973.
Year-to-year changes in the maximum Pell Grant have been very uneven in recent years, ranging from a 7% decline in constant dollars in 1993-94 to an 11% increase in 2001-02.
In 2009-10, the maximum Pell Grant covers 35% of average tuition, fees, room and board at public four-year colleges and universities, and 15% of total charges at private four-year colleges.
In 2007-08, 58% percent of Pell Grant funds went to undergraduate students who were independent. Among dependent Pell Grant recipients, 62% came from families with annual incomes below $30,000.
Students from families with incomes below $32,500 received an average of $760 (in 2007 dollars) more in state grant aid in 2007-08 than in 1992-93, an increase of 92%. Students from families with incomes of $100,000 or higher received an average of $320 more, an increase of 457%.
At private colleges with tuition exceeding $30,975 in 2007-08, the proportion of tuition and fees covered by institutional grant aid ranged from about 40% for students from families with incomes below $60,000 to 16% for those from families with incomes of $100,000 or higher.
In 2007-08, public four-year institutions distributed almost two-thirds of their institutional grant aid without regard to financial circumstances. Students from the lowest-income families received an average of $570 in non-need-based and $760 in need-based institutional grant aid. Students from upper-middle-income families received an average of about $840 per student in non-need-based and $310 in need-based institutional grant aid.
Student BorrowingFrom 2007-08 to 2008-09, total education borrowing increased by about $4 billion, or 5% in current dollars. Federal borrowing increased by about $15 billion, but nonfederal loans declined by about $11 billion.
In 2007-08, 35% of undergraduate students took out federal Stafford Loans and 65% did not. Among full-time undergraduates, 50% took out Stafford Loans and 50% did not.
In 2008-09, 88% of students enrolled in for-profit institutions used Stafford Loans, compared to 55% in private not-for-profit four-year institutions, 42% in public four-year institutions, and only 10% in public two-year colleges.
About 15% of undergraduate students borrowed from nonfederal sources in 2007-08. Included in this number are the 4% of students who borrowed from these private sources without also using federal loans.
Subsidized Stafford Loans, on which the government pays the interest while the student is in school, exceeded unsubsidized Stafford Loans by 50% in 1998-99 and by 12% in 2003-04. By 2008-09, unsubsidized Stafford volume exceeded subsidized Stafford volume by 22%. Among students who received a subsidized Stafford Loan in 2007-08, 58% also borrowed through the unsubsidized Stafford program.
Among 2007-08 bachelor’s degree recipients, 34% graduated with no education debt, but 10% had borrowed $40,000 or more. The median debt for all bachelor’s degree recipients was $11,000 and the median for the two-thirds who borrowed was $20,000.
Among students who earned bachelor’s degrees at public four-year colleges and universities in 2007-08, 38% graduated with no education debt and 6% graduated with debt greater than $40,000. Among those who earned their bachelor’s degrees at for-profit institutions, only 4% had no education debt, while 24% had borrowed $40,000 or more.
Other Sources of FundsTotal assets in state-sponsored Section 529 college savings plans declined by 19% in current dollars during calendar year 2008, and by another 4.3% during the first three months of 2009. The average value of individual accounts declined 24% in current dollars during 2008, and another 4.7%, to $8,944, during the first three months of 2009.
The approximately $6.8 billion in federal education tax credits and deductions in 2008 reduced tax bills by an amount equal to about 30% of all federal grants to postsecondary students.
2
T R E N D S I N H I G H E R E D U C A T I O N S E R I E S
For detailed background data and additional information, please visit www.collegeboard.com/trends.
Highlights . . . . . . . . . . . . . . . . . . . . . . . . . . . . . . . . . . . . . . . . . . . 2
Contents . . . . . . . . . . . . . . . . . . . . . . . . . . . . . . . . . . . . . . . . . . . . 3
Introduction . . . . . . . . . . . . . . . . . . . . . . . . . . . . . . . . . . . . . . . . . 4
Total Student Aid — Adjusted for Inflation . . . . . . . . . . . . . . . . 6
Total Undergraduate and Graduate Student Aid by Type . . . . . 7
Federal Aid Recipients . . . . . . . . . . . . . . . . . . . . . . . . . . . . . . . . . 8
Types of Grants . . . . . . . . . . . . . . . . . . . . . . . . . . . . . . . . . . . . . . 9
Types of Loans . . . . . . . . . . . . . . . . . . . . . . . . . . . . . . . . . . . . . . . 9
Undergraduate Debt . . . . . . . . . . . . . . . . . . . . . . . . . . . . . . . . . 10
Undergraduate Borrowing . . . . . . . . . . . . . . . . . . . . . . . . . . . . 10
Graduate Student Debt . . . . . . . . . . . . . . . . . . . . . . . . . . . . . . . .11
Federal Aid by Sector . . . . . . . . . . . . . . . . . . . . . . . . . . . . . . . . 12
Total Grants and Total Loans . . . . . . . . . . . . . . . . . . . . . . . . . . . 12
Total Aid per Full-Time Equivalent Student . . . . . . . . . . . . . . . 13
Pell Grants . . . . . . . . . . . . . . . . . . . . . . . . . . . . . . . . . . . . . . . . . 14
State Grants to Undergraduate Students . . . . . . . . . . . . . . . . 15
Institutional Grant Aid: Public Colleges and Universities . . . . . . . . . . . . . . . . . . . . . . . . . 16
Institutional Grant Aid: Private Four-Year Colleges and Universities . . . . . . . . . . . . . . . . 17
College Savings Plans . . . . . . . . . . . . . . . . . . . . . . . . . . . . . . . . 18
Notes and Sources . . . . . . . . . . . . . . . . . . . . . . . . . . . . . . . . . . 19
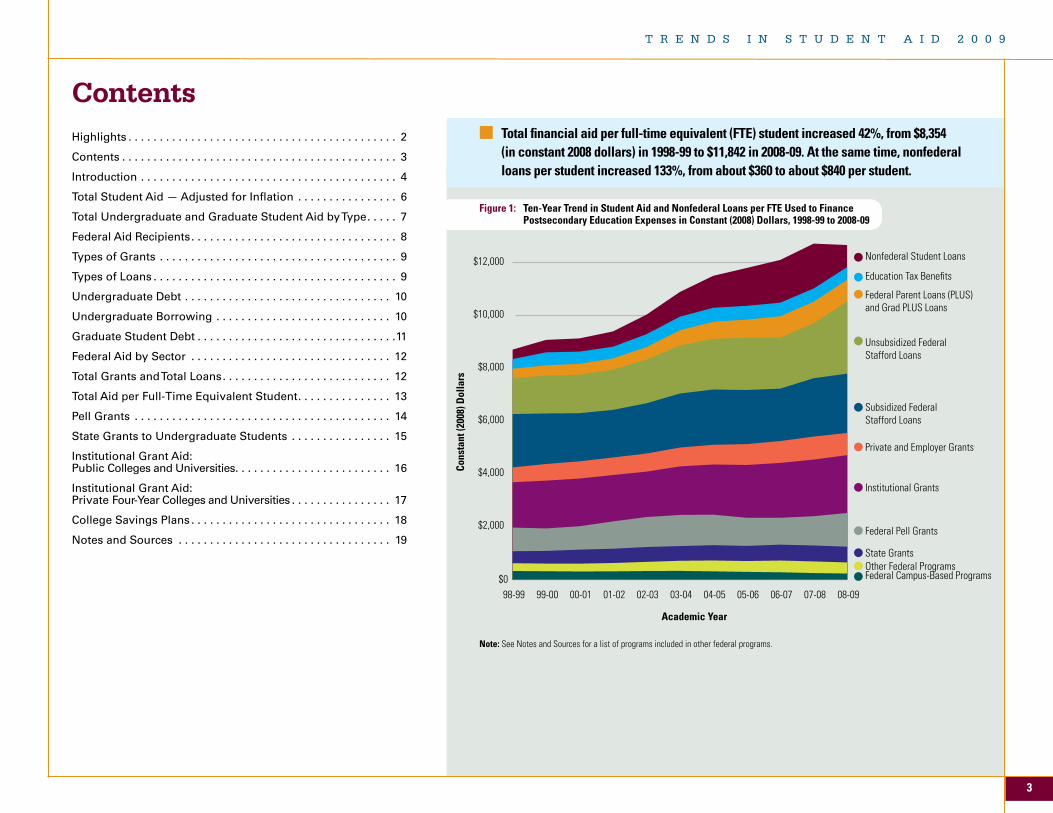
ContentsTotal financial aid per full-time equivalent (FTE) student increased 42%, from $8,354 (in constant 2008 dollars) in 1998-99 to $11,842 in 2008-09. At the same time, nonfederal loans per student increased 133%, from about $360 to about $840 per student.
Figure 1: Ten-Year Trend in Student Aid and Nonfederal Loans per FTE Used to Finance Postsecondary Education Expenses in Constant (2008) Dollars, 1998-99 to 2008-09
Note: See Notes and Sources for a list of programs included in other federal programs.
$0
$2,000
$4,000
$6,000
$8,000
$10,000
$12,000
08-0907-0806-0705-0604-0503-0402-0301-0200-0199-0098-99
Academic Year
Cons
tant
(200
8) D
olla
rs
Federal Campus-Based Programs
Nonfederal Student Loans
Education Tax Benefits
Unsubsidized Federal Stafford Loans
Subsidized Federal Stafford Loans
Private and Employer Grants
Institutional Grants
Federal Pell Grants
State Grants
Federal Parent Loans (PLUS) and Grad PLUS Loans
Other Federal Programs
3
T R E N D S I N S T U D E N T A I D 2 0 0 9
The College Board releases Trends in Student Aid 2009 at a time of major change in the student aid system. As we go to press, the House of Representatives has just passed legislation that would substantially simplify the application process for federal student aid and assure consistent increases in the level of the maximum Pell Grant. The legislation would also change the financing structure of federal student loans.
These and other potential changes follow a number of recent innovations to the federal student aid system. As of July 1, 2009, student borrowers can repay their federal loans through the Income-Based Repayment Plan, which limits monthly payments to no more than 15% of the amount by which the borrower’s income exceeds the federal poverty level. Pell Grants are now available for year-round study, and Congress increased the maximum Pell Grant from $4,731 in 2008-09 to $5,350 in 2009-10. As of January 2010, some students will be able to automatically transfer data from their income tax forms to their financial aid applications, reducing the confusion and the time involved in the process. Limits on the amount students can borrow through the unsubsidized Stafford Loan program also have been increased, and Congress has imposed some new regulations on the private student loan market.
Trends in Student Aid provides extensive data describing student aid of all types from all sources. It does not attempt to evaluate student aid programs or policies, but provides detailed information that can inform policymakers, researchers, student advocates and others in their efforts to assess and improve the effectiveness of student aid in increasing educational opportunities. The data reported this year do not reflect all of the recent changes now in effect, and if many of the proposals currently under consideration are implemented, the landscape could change quite a bit. Future editions of Trends in Student Aid will track these changes.
Trends in Student Aid reports on the different types of financial aid distributed to students and the various sources of that aid. The federal government, state governments, colleges and universities, and employers and other private entities are all partners in the student aid system, which provides grants, loans, tax benefits and work aid. Growth in aggregate amounts of aid may be misleading in an environment of rising enrollments and increasing college prices. To understand the impact of financial aid on educational opportunities, it is important to examine the amount
of aid per student, the breakdown of aid between undergraduateand graduate students, and the distribution of aid across institution types and by student characteristics.
Every year since 1983, the College Board has published a new edition of Trends in Student Aid, providing detailed updated information on the sources, forms and amounts of financial aid available to assist students and families in paying for postsecondary education. A new website, introduced in 2008, makes data easily available for reference and downloading. All of the graphs and the selected tables included in the print version can also be found online, along with substantial additional information. Go to www.collegeboard.com/trends to access data from both Trends in Student Aid and its companion publication, Trends in College Pricing.
Total Student AidTable 1 reports on the total funds available to postsecondary students, both undergraduate and graduate, to supplement family and student payments over the decade from 1998-99 to 2008-09. Figure 1, modified from previous years, shows receipt of these funds — both student aid dollars and the money students borrow from nonfederal sources — on a per full-time equivalent (FTE) student basis. Together with students’ savings and earnings, as well as support from parental earnings, savings and borrowing from other sources, these funds contribute to making higher education financially accessible.
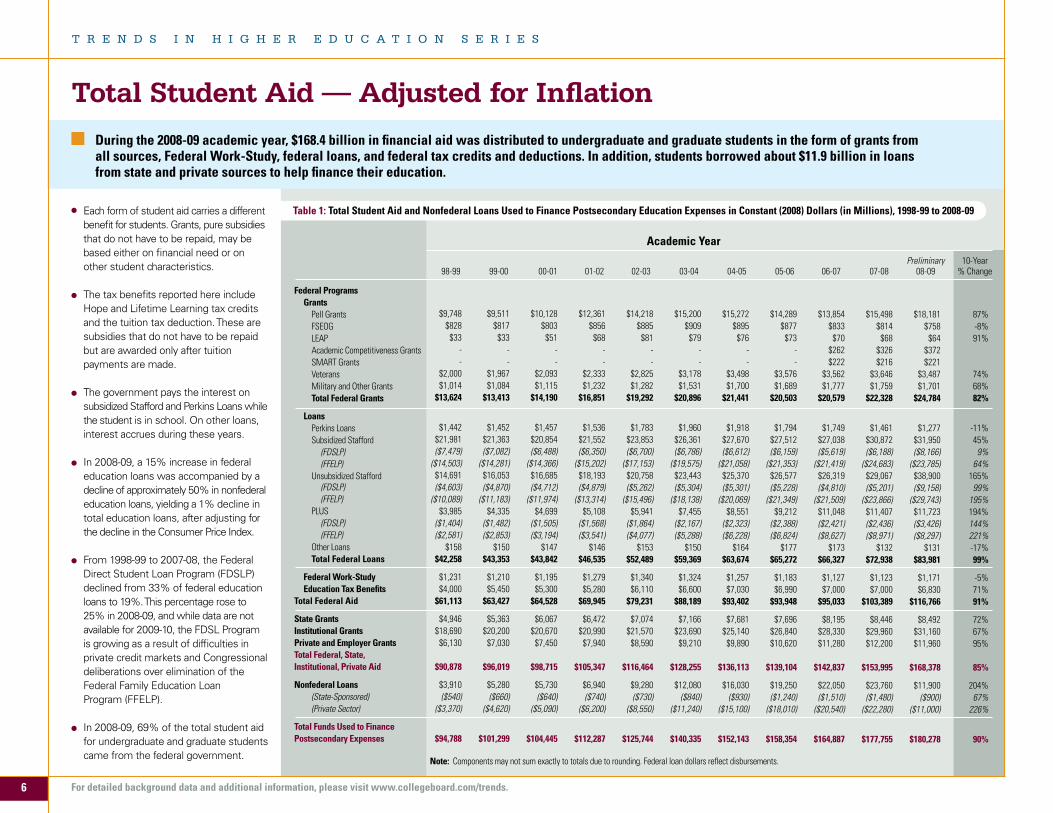
We report on percentage increases of each type and source of aid over the decade. However, the percentage increases have very different implications depending on the starting level. The 204% constant dollar increase in nonfederal loans represents an $8 billion increase from $3.9 billion in 1998-99 to $11.9 billion in 2008-09. In contrast, the 99% increase in federal loans represents a $41.7 billion increase from $42.3 billion to $83.9 billion. It is also important to consider these increases with a perspective on enrollment growth. In 2008-09, total FTE enrollment included 3.3 million more students than it had a decade earlier, a 31% increase.
The figures in Table 1 have been adjusted for inflation. Similar tables with data in current dollars (unadjusted) and broken down between undergraduate and graduate students are available online.
Types of Student AidFrom the student’s perspective, grant aid, which is a pure subsidy not requiring repayment, is the most desirable form of financial aid. Education tax credits and deductions are also pure subsidies, although the fact that the savings generally materialize months after the bills have been paid makes them less effective in facilitating college access.
A variety of forms of loans are described in this publication. Subsidized Stafford Loans and Perkins Loans provide the greatest benefit for students because the government pays the interest while the student is in school. Unsubsidized Stafford Loans and PLUS Loans for parents of undergraduate students and for graduate students also carry a federal guarantee and interest rates that are limited by legislation. In contrast, nonfederal education loans from banks and other lending institutions are not subsidized at all. Their value is only in providing liquidity for students who have no other means of accessing funds. We report on nonfederal student loans because of their importance, but do not include them in our measures of student aid because they do not carry any subsidy.
A small amount of student aid comes from the Federal Work-Study (FWS) Program, under which the federal government provides funds to institutions to subsidize the wages they pay to some student workers with documented financial need. Although these funds are packaged along with grants and loans to help students pay their bills, from the student’s perspective, they are simply wages received for services performed.
As Figures 2a and 2b reveal, the composition of the aid received by graduate students is quite different from the composition of the aid on which undergraduates rely. Federal loans play a much larger role for graduate students, while federal grants provide more support to undergraduates. The teaching and research assistantships from which many graduate students benefit are a form of compensation and are not included here.
Federal AidThe allocation of federal student aid funds differs across programs. Need-based aid relies on the information provided by students and parents on the Free Application for Federal Student Aid (FAFSA) and the formula known as the Federal Methodology (FM). Pell Grants are distributed based on the expected family contribution (EFC) determined by this formula
Introduction
4
T R E N D S I N H I G H E R E D U C A T I O N S E R I E S
For detailed background data and additional information, please visit www.collegeboard.com/trends.
and do not depend on the charges at the particular school attended. Subsidized Stafford Loan eligibility is based on both the EFC and the cost of attendance at the student’s institution. A student who is found to have financial need at a high-priced institution might not have measured need and therefore might not receive a subsidized Stafford Loan if she attended a less expensive college or university. Campus-based federal funds including FWS, Federal Supplemental Educational Opportunity Grants (FSEOG), and Perkins Loans are also need-based. However, these funds are distributed to institutions based on a complex formula, and the institutions allocate them to students with financial need. Unsubsidized Stafford Loans are available to all students regardless of their financial circumstances; PLUS Loans require only the absence of adverse credit — a criterion that has affected more applicants during the recent financial crisis. Figure 9 illustrates the distribution of these various forms of aid to students at different types of institutions that results from these various allocation methods.
If the current efforts by the Obama administration and some members of Congress to simplify the aid application process and the federal need-analysis formula are successful, the allocation of federal student aid funds will certainly change to some extent.
Grant AidGrant aid comes from the federal government, state governments, employers and other private sources, and from colleges and universities in the form of discounts from the published price. As Figure 5 shows, these sources have contributed fairly stable portions of total grant aid over the course of the 1998-99 to 2008-09 decade.
Pell Grants, targeted at low- and moderate-income students, are designed to provide access to postsecondary education for those least able to afford it. Figure 12a provides details on Pell Grants over time. While federal expenditures on Pell Grants increased by 87%, from $9.7 billion to $18.2 billion in constant 2008 dollars over the most recent decade, the combination of rising college prices and an increase in the number of recipients from 3.9 million to 6.1 million has diluted the value of these grants to individual students.
The maximum Pell Grant level is currently determined annually through the Congressional appropriations process, resulting in very uneven growth. The Obama Administration has proposed increasing the maximum Pell Grant by 1% per year beyond the
increase in the Consumer Price Index (CPI). This policy would increase predictability, but would have an indeterminate effect on award levels over time.
The maximum Pell Grant is awarded to students whose incomes are too low to generate any expected family contribution and is the most frequently cited descriptor of Pell funding levels. However, only about one-fourth of Pell Grant recipients qualify for the maximum grant. In 2008-09, the average grant of $2,973 was a better representation of the subsidy received by the typical Pell Grant recipient than the $4,731 maximum grant.
The largest portion of grant aid comes from colleges and universities. The data available on institutional grant aid are less precise than those on state and federal awards. In addition to the estimates of total institutional aid found in Table 1, this year we include more detailed data from the recently released National Postsecondary Student Aid Study (NPSAS). The NPSAS defines need-based aid as only those funds awarded on the basis of financial need. Aid that meets need but is awarded based on academic or other criteria is classified as non-need-based. This definition contrasts with that used by the College Board’s Annual Survey of Colleges, which categorizes aid based on the financial need of the recipient, regardless of the motivation for the award. In reporting NPSAS data, we describe the allocation of grant aid by parent income levels.
An estimated 16% of all grant aid comes from employers and private sources. No reliable data are available on the precise amount of funding from these sources. We base our estimates on a combination of data from the NPSAS and from membership surveys conducted by the National Scholarship Providers Association.
LoansThe federal government, the primary source of education loans, offers several different types of loans. There are two types of funding for Stafford Loans, the major federal education loan program. Under the William D. Ford Federal Direct Student Loan Program (FDSLP), students borrow directly from the government. Under the Federal Family Education Loan Program (FFELP), the federal government guarantees loans issued by private lenders. The division of loans between these two programs can be found in Table 1. The percentage of federal loans provided through the FDSL Program declined from 33% in 1998-99 to 19% in 2007-08. A combination of the difficulties in private credit markets, decreases in federal subsidies to lenders, and anticipation of the possible elimination of the FFEL Program led many schools to switch to direct lending, and in 2008-09, 25% of federal loans came through the FDSL Program.
All Stafford Loans issued in 2006-07 and 2007-08 carried interest rates of 6.8%. The interest rate on unsubsidized Stafford Loans remains fixed at 6.8%, but the rate on subsidized Stafford Loans declined to 6.0% in 2008-09 and to 5.6% in 2009-10. It is scheduled to decline to 4.5% in 2010-11 and 3.4% in 2011-12. Interest rates on both Stafford and PLUS Loans varied with market rates before 2006-07.
The private loan market is an important supplementary source of funds for students. These loans generally have higher interest rates and less favorable repayment terms than federal loans; they are not included in the new federal Income-Based Repayment Plan. The recent difficulties facing credit markets in general, combined with increases in the availability of federal loans for students, are reflected in diminished use of private education loans in 2008-09. There is no reliable source for exact information on total borrowing from these sources. Since 1995-96, the College Board Trends staff has conducted an annual survey of private lenders to compile the best possible estimate of this lending. We estimate that private loan volume was almost 50% lower in 2008-09 than in the preceding year. It is important to remember that our estimates in this area are much less precise than the data we report on student financial aid.
The Consumer Price IndexWe provide much of our data in constant dollars, adjusting values for changes in the CPI. We use the change in the CPI from July 2007 to July 2008 to measure inflation between 2007-08 and 2008-09. While CPI adjustment is necessary to make meaningful comparisons of values over long periods of time, comparisons of one-year changes in constant dollars may be confusing. Large fluctuations in energy prices have led to an unusually volatile CPI recently. The 5.6% increase in the CPI from July 2007 to July 2008 was the highest annual inflation rate since 1982. As a result, constant dollar increases for academic year 2008-09 were small relative to current dollar increases. Between July 2008 and July 2009, the CPI declined by 2.1%, which will result in constant dollar increases that are large relative to current dollar increases.
The tables supporting all of the graphs in the Trends publications, PDF versions of the publications, PowerPoint files containing individual slides for all of the graphs, and other detailed data on student aid and college pricing are available on our website at www.collegeboard.com/trends. Please feel free to cite or reproduce the data in Trends for noncommercial purposes with proper attribution.
5
T R E N D S I N S T U D E N T A I D 2 0 0 9
Academic Year Preliminary 10-Year 98-99 99-00 00-01 01-02 02-03 03-04 04-05 05-06 06-07 07-08 08-09 % Change
Note: Components may not sum exactly to totals due to rounding. Federal loan dollars reflect disbursements.
$9,748$828
$33--
$2,000$1,014
$13,624
$1,442$21,981($7,479)
($14,503)$14,691($4,603)
($10,089)$3,985
($1,404)($2,581)
$158$42,258
$1,231$4,000
$61,113
$4,946$18,690
$6,130
$90,878
$3,910($540)
($3,370)
$94,788
$9,511$817
$33--
$1,967$1,084
$13,413
$1,452$21,363($7,082)
($14,281)$16,053($4,870)
($11,183)$4,335
($1,482)($2,853)
$150$43,353
$1,210$5,450
$63,427
$5,363$20,200
$7,030
$96,019
$5,280($660)
($4,620)
$101,299
$10,128$803
$51--
$2,093$1,115
$14,190
$1,457$20,854($6,488)
($14,366)$16,685($4,712)
($11,974)$4,699
($1,505)($3,194)
$147$43,842
$1,195$5,300
$64,528
$6,067$20,670
$7,450
$98,715
$5,730($640)
($5,090)
$104,445
$12,361$856
$68--
$2,333$1,232
$16,851
$1,536$21,552($6,350)
($15,202)$18,193($4,879)
($13,314)$5,108
($1,568)($3,541)
$146$46,535
$1,279$5,280
$69,945
$6,472$20,990
$7,940
$105,347
$6,940($740)
($6,200)
$112,287
$14,218$885
$81--
$2,825$1,282
$19,292
$1,783$23,853($6,700)
($17,153)$20,758($5,262)
($15,496)$5,941
($1,864)($4,077)
$153$52,489
$1,340$6,110
$79,231
$7,074$21,570
$8,590
$116,464
$9,280($730)
($8,550)
$125,744
$15,200$909$79
--
$3,178$1,531
$20,896
$1,960$26,361($6,786)
($19,575)$23,443($5,304)
($18,138)$7,455
($2,167)($5,288)
$150$59,369
$1,324$6,600
$88,189
$7,166$23,690
$9,210
$128,255
$12,080($840)
($11,240)
$140,335
$15,272$895$76
--
$3,498$1,700
$21,441
$1,918$27,670($6,612)
($21,058)$25,370($5,301)
($20,069)$8,551
($2,323)($6,228)
$164$63,674
$1,257$7,030
$93,402
$7,681$25,140$9,890
$136,113
$16,030($930)
($15,100)
$152,143
$14,289$877$73
--
$3,576$1,689
$20,503
$1,794$27,512($6,159)
($21,353)$26,577($5,228)
($21,349)$9,212
($2,388)($6,824)
$177$65,272
$1,183$6,990
$93,948
$7,696$26,840$10,620
$139,104
$19,250($1,240)
($18,010)
$158,354
$13,854$833$70
$262$222
$3,562$1,777
$20,579
$1,749$27,038($5,619)
($21,419)$26,319($4,810)
($21,509)$11,048($2,421)($8,627)
$173$66,327
$1,127$7,000
$95,033
$8,195$28,330$11,280
$142,837
$22,050($1,510)
($20,540)
$164,887
$15,498$814$68
$326$216
$3,646$1,759
$22,328
$1,461$30,872($6,188)
($24,683)$29,067($5,201)
($23,866)$11,407($2,436)($8,971)
$132$72,938
$1,123$7,000
$103,389
$8,446$29,960$12,200
$153,995
$23,760($1,480)
($22,280)
$177,755
$18,181$758$64
$372$221
$3,487$1,701
$24,784
$1,277$31,950($8,166)
($23,785)$38,900($9,158)
($29,743)$11,723($3,426)($8,297)
$131$83,981
$1,171$6,830
$116,766
$8,492$31,160$11,960
$168,378
$11,900($900)
($11,000)
$180,278
87%-8%91%
74%68%82%
-11%45%9%
64%165%99%
195%194%144%221%-17%99%
-5%71%91%
72%67%95%
85%
204%67%
226%
90%
Federal Programs Grants Pell Grants FSEOG LEAP Academic Competitiveness Grants SMART Grants Veterans Military and Other Grants Total Federal Grants
Loans Perkins Loans Subsidized Stafford (FDSLP) (FFELP) Unsubsidized Stafford (FDSLP) (FFELP) PLUS (FDSLP) (FFELP) Other Loans Total Federal Loans
Federal Work-Study Education Tax Benefits Total Federal Aid
State Grants Institutional Grants Private and Employer Grants Total Federal, State, Institutional, Private Aid
Nonfederal Loans (State-Sponsored) (Private Sector)
Total Funds Used to Finance Postsecondary Expenses
Table 1: Total Student Aid and Nonfederal Loans Used to Finance Postsecondary Education Expenses in Constant (2008) Dollars (in Millions), 1998-99 to 2008-09
During the 2008-09 academic year, $168.4 billion in financial aid was distributed to undergraduate and graduate students in the form of grants from all sources, Federal Work-Study, federal loans, and federal tax credits and deductions. In addition, students borrowed about $11.9 billion in loans from state and private sources to help finance their education.
Total Student Aid — Adjusted for Inflation
Each form of student aid carries a different benefit for students. Grants, pure subsidies that do not have to be repaid, may be based either on financial need or on other student characteristics.
The tax benefits reported here include
Hope and Lifetime Learning tax credits and the tuition tax deduction. These are subsidies that do not have to be repaid but are awarded only after tuition payments are made.
The government pays the interest on subsidized Stafford and Perkins Loans while the student is in school. On other loans, interest accrues during these years.
In 2008-09, a 15% increase in federal education loans was accompanied by a decline of approximately 50% in nonfederal education loans, yielding a 1% decline in total education loans, after adjusting for the decline in the Consumer Price Index.
From 1998-99 to 2007-08, the Federal Direct Student Loan Program (FDSLP) declined from 33% of federal education loans to 19%. This percentage rose to 25% in 2008-09, and while data are not available for 2009-10, the FDSL Program is growing as a result of difficulties in private credit markets and Congressional deliberations over elimination of the Federal Family Education Loan Program (FFELP).
In 2008-09, 69% of the total student aid for undergraduate and graduate students came from the federal government.
6
T R E N D S I N H I G H E R E D U C A T I O N S E R I E S
For detailed background data and additional information, please visit www.collegeboard.com/trends.
• Infall2008,anestimated12.3million(87%)ofthe14.2millionfull-timeequivalent(FTE)postsecondary students were undergraduates and 1.9million(13%)weregraduatestudents.
• Graduatestudentsincludeboththoseenrolledinmaster’s and doctoral degree programs and those in professional programs in fields such as law and medicine, who are much more dependent on studentloans.(SeeFigures8aand8bfordetails.)
• Undergraduateandgraduatestudentsare distributed differently across sectors. Forty-one percent of undergraduate FTE enrollment is in the public four-year sector, 31% in the public two-year sector, 18% in private not-for-profit four-year institutions and 9% in the for-profit sector. Fifty percent of graduate FTE enrollment is in the public four-year sector, 42% in private not-for-profit four-year institutions and 8% in the for-profit sector.
• Undergraduatestudentsareconsidereddependent, with their aid eligibility a function of their own and their parents’ financial circumstances, unless they are at least 24 years of age or are orphans or wards of the court, married, veterans, on active duty or have legal dependents.Incontrast,allgraduatestudentsareindependent for purposes of financial aid, so their eligibility for need-based financial aid depends only on their own income and assets for most programs.
ALSO IMPORTANT
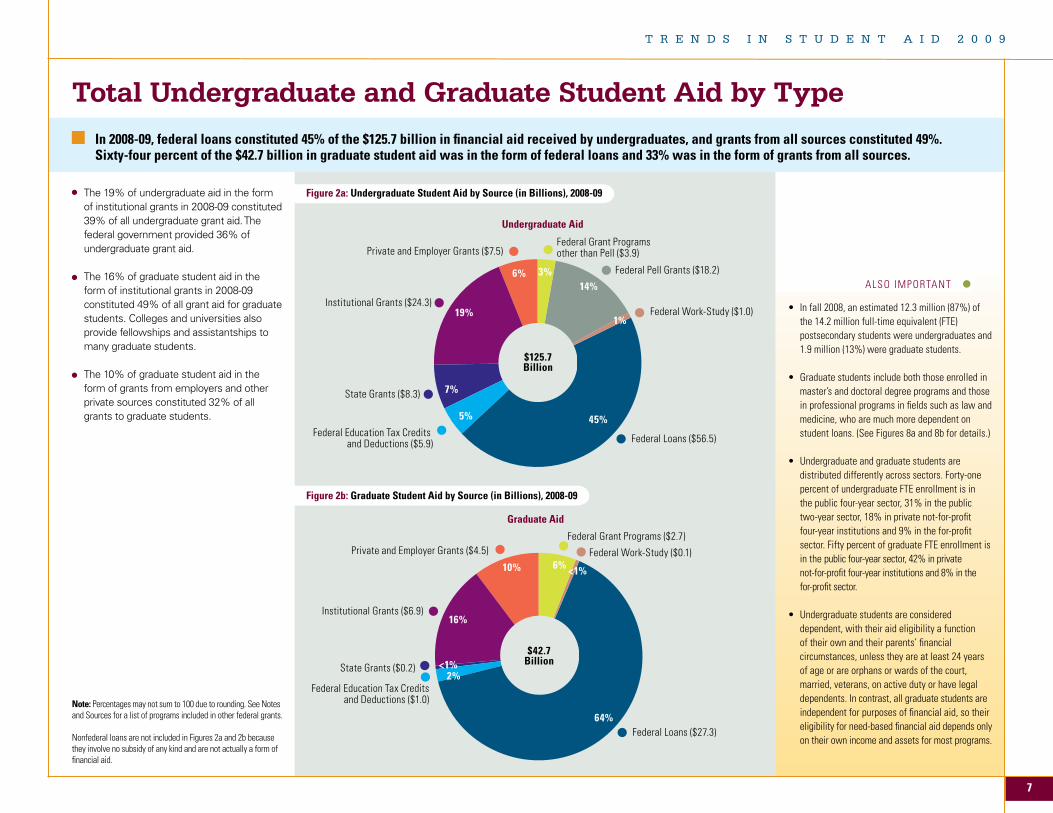
Total Undergraduate and Graduate Student Aid by TypeIn 2008-09, federal loans constituted 45% of the $125.7 billion in financial aid received by undergraduates, and grants from all sources constituted 49%. Sixty-four percent of the $42.7 billion in graduate student aid was in the form of federal loans and 33% was in the form of grants from all sources.
Figure 2a: Undergraduate Student Aid by Source (in Billions), 2008-09
Note: Percentages may not sum to 100 due to rounding. See Notes and Sources for a list of programs included in other federal grants.
Nonfederal loans are not included in Figures 2a and 2b because they involve no subsidy of any kind and are not actually a form of financial aid.
The 19% of undergraduate aid in the form of institutional grants in 2008-09 constituted 39% of all undergraduate grant aid. The federal government provided 36% of undergraduate grant aid.
The 16% of graduate student aid in the form of institutional grants in 2008-09 constituted 49% of all grant aid for graduate students. Colleges and universities also provide fellowships and assistantships to many graduate students.
The 10% of graduate student aid in the form of grants from employers and other private sources constituted 32% of all grants to graduate students.
Undergraduate Aid
Institutional Grants ($24.3)
$125.7Billion
Private and Employer Grants ($7.5)Federal Grant Programsother than Pell ($3.9)
Federal Pell Grants ($18.2)
Federal Work-Study ($1.0)
Federal Loans ($56.5)
State Grants ($8.3)
Federal Education Tax Credits and Deductions ($5.9)
3%14%
1%
45%
6%
19%
7%
5%
Graduate Aid
Institutional Grants ($6.9)
$42.7Billion
Private and Employer Grants ($4.5)Federal Grant Programs ($2.7)
Federal Work-Study ($0.1)
Federal Loans ($27.3)
State Grants ($0.2)
Federal Education Tax Creditsand Deductions ($1.0)
6% <1%
64%
10%
16%
2%<1%
Figure 2b: Graduate Student Aid by Source (in Billions), 2008-09
T R E N D S I N S T U D E N T A I D 2 0 0 9
7
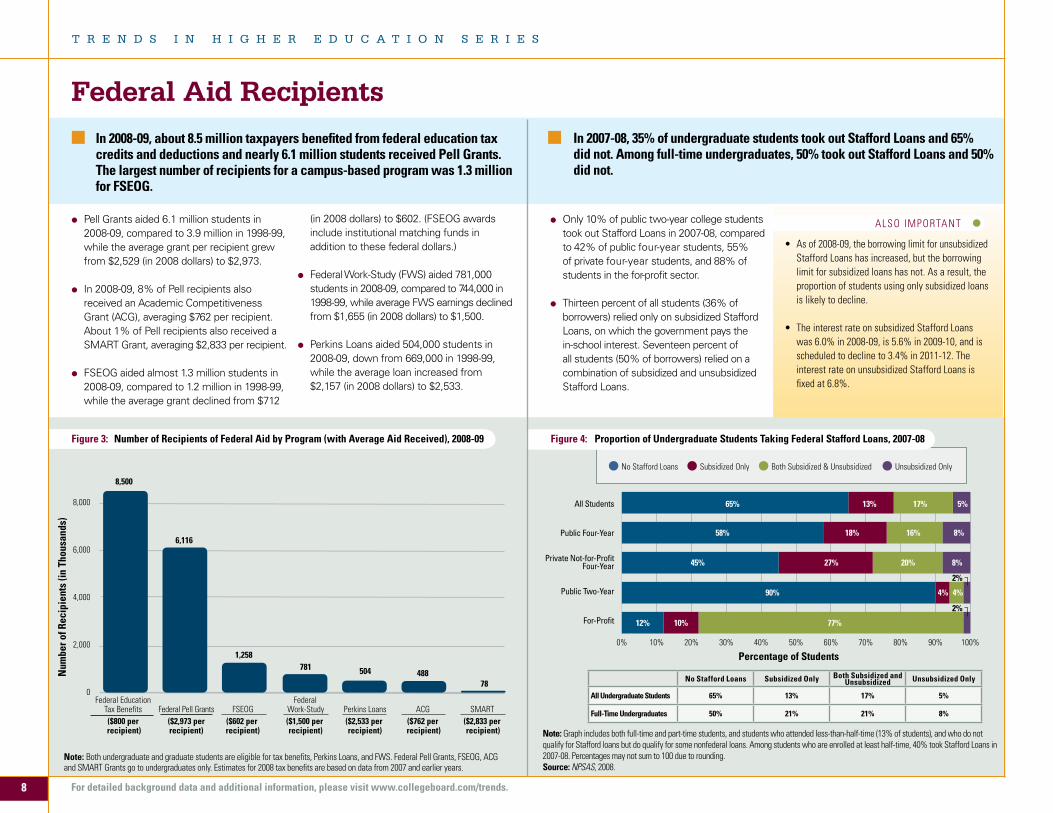
Federal Aid Recipients
Pell Grants aided 6.1 million students in 2008-09, compared to 3.9 million in 1998-99, while the average grant per recipient grew from $2,529 (in 2008 dollars) to $2,973.
In 2008-09, 8% of Pell recipients also received an Academic Competitiveness Grant (ACG), averaging $762 per recipient. About 1% of Pell recipients also received a SMART Grant, averaging $2,833 per recipient.
FSEOG aided almost 1.3 million students in 2008-09, compared to 1.2 million in 1998-99, while the average grant declined from $712
Figure 3: Number of Recipients of Federal Aid by Program (with Average Aid Received), 2008-09
In 2008-09, about 8.5 million taxpayers benefited from federal education tax credits and deductions and nearly 6.1 million students received Pell Grants. The largest number of recipients for a campus-based program was 1.3 million for FSEOG.
In 2007-08, 35% of undergraduate students took out Stafford Loans and 65% did not. Among full-time undergraduates, 50% took out Stafford Loans and 50% did not.
Figure 4: Proportion of Undergraduate Students Taking Federal Stafford Loans, 2007-08
(in 2008 dollars) to $602. (FSEOG awards include institutional matching funds in addition to these federal dollars.)
Federal Work-Study (FWS) aided 781,000 students in 2008-09, compared to 744,000 in 1998-99, while average FWS earnings declined from $1,655 (in 2008 dollars) to $1,500.
Perkins Loans aided 504,000 students in 2008-09, down from 669,000 in 1998-99, while the average loan increased from $2,157 (in 2008 dollars) to $2,533.
Only 10% of public two-year college students took out Stafford Loans in 2007-08, compared to 42% of public four-year students, 55% of private four-year students, and 88% of students in the for-profit sector.
Thirteen percent of all students (36% of borrowers) relied only on subsidized Stafford Loans, on which the government pays the in-school interest. Seventeen percent of all students (50% of borrowers) relied on a combination of subsidized and unsubsidized Stafford Loans.
0
2,000
4,000
6,000
8,000
8,500
4885047811,258
6,116
78
Num
ber o
f Rec
ipie
nts
(in T
hous
ands
)
Federal Education Federal Tax Benefits Federal Pell Grants FSEOG Work-Study Perkins Loans ACG SMART ($800 per ($2,973 per ($602 per ($1,500 per ($2,533 per ($762 per ($2,833 per recipient) recipient) recipient) recipient) recipient) recipient) recipient)
Note: Both undergraduate and graduate students are eligible for tax benefits, Perkins Loans, and FWS. Federal Pell Grants, FSEOG, ACG and SMART Grants go to undergraduates only. Estimates for 2008 tax benefits are based on data from 2007 and earlier years.
Note:Graphincludesbothfull-timeandpart-timestudents,andstudentswhoattendedless-than-half-time(13%ofstudents),andwhodonotqualify for Stafford loans but do qualify for some nonfederal loans. Among students who are enrolled at least half-time, 40% took Stafford Loans in 2007-08. Percentages may not sum to 100 due to rounding.Source: NPSAS, 2008.
• Asof2008-09,theborrowinglimitforunsubsidizedStafford Loans has increased, but the borrowing limit for subsidized loans has not. As a result, the proportion of students using only subsidized loans is likely to decline.
• TheinterestrateonsubsidizedStaffordLoans was 6.0% in 2008-09, is 5.6% in 2009-10, and is scheduled to decline to 3.4% in 2011-12. The interest rate on unsubsidized Stafford Loans is fixed at 6.8%.
ALSO IMPORTANT
0% 10% 20% 30% 40% 50% 60% 70% 80% 90% 100%
Percentage of Students
All Students
Public Four-Year
Private Not-for-ProfitFour-Year
Public Two-Year
For-Profit
5%
8%
8%
4% 4%
10% 77%
65%
58%
45%
90%
12%
13%
18%
27%
17%
16%
20%
2%
2%
No Stafford Loans Subsidized Only Both Subsidized and Unsubsidized Unsubsidized Only
All Undergraduate Students 65% 13% 17% 5%
Full-Time Undergraduates 50% 21% 21% 8%
No Stafford Loans Subsidized Only Both Subsidized & Unsubsidized Unsubsidized Only
8
T R E N D S I N H I G H E R E D U C A T I O N S E R I E S
For detailed background data and additional information, please visit www.collegeboard.com/trends.
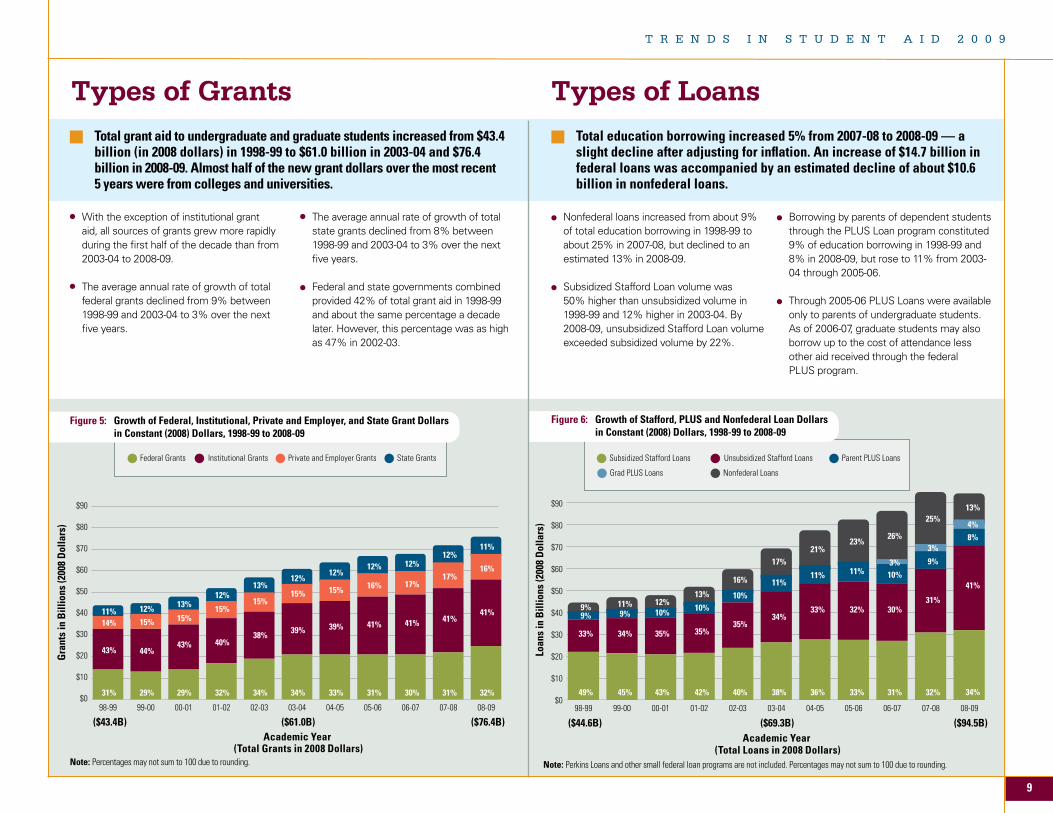
With the exception of institutional grant aid, all sources of grants grew more rapidly during the first half of the decade than from 2003-04 to 2008-09.
The average annual rate of growth of total federal grants declined from 9% between 1998-99 and 2003-04 to 3% over the next five years.
Total grant aid to undergraduate and graduate students increased from $43.4 billion (in 2008 dollars) in 1998-99 to $61.0 billion in 2003-04 and $76.4 billion in 2008-09. Almost half of the new grant dollars over the most recent 5 years were from colleges and universities.
Total education borrowing increased 5% from 2007-08 to 2008-09 — a slight decline after adjusting for inflation. An increase of $14.7 billion in federal loans was accompanied by an estimated decline of about $10.6 billion in nonfederal loans.
Nonfederal loans increased from about 9% of total education borrowing in 1998-99 to about 25% in 2007-08, but declined to an estimated 13% in 2008-09.
Subsidized Stafford Loan volume was 50% higher than unsubsidized volume in 1998-99 and 12% higher in 2003-04. By 2008-09, unsubsidized Stafford Loan volume exceeded subsidized volume by 22%.
Borrowing by parents of dependent students through the PLUS Loan program constituted 9% of education borrowing in 1998-99 and 8% in 2008-09, but rose to 11% from 2003-04 through 2005-06.
Through 2005-06 PLUS Loans were available only to parents of undergraduate students. As of 2006-07, graduate students may also borrow up to the cost of attendance less other aid received through the federal PLUS program.
Types of Grants Types of Loans
$0
$10
$20
$30
$40
$50
$60
$70
$80
$90
08-0907-0806-0705-0604-0503-0402-0301-0200-0199-0098-99
Academic Year (Total Grants in 2008 Dollars)
($43.4B) ($61.0B) ($76.4B)
Gra
nts
in B
illio
ns (2
008
Dol
lars
)
11%14%
43%
31%
12%
15%
44%
29%
13%
15%
43%
29%
12%
15%
40%
32%
13%
15%
38%
34%
11%
16%
41%
32%
12%
17%
41%
31%
12%
17%
41%
30%
12%
16%
41%
31%
12%
15%
39%
33%
12%
15%
39%
34%
Figure 6: Growth of Stafford, PLUS and Nonfederal Loan Dollars in Constant (2008) Dollars, 1998-99 to 2008-09
Figure 5: Growth of Federal, Institutional, Private and Employer, and State Grant Dollars in Constant (2008) Dollars, 1998-99 to 2008-09
Note: Perkins Loans and other small federal loan programs are not included. Percentages may not sum to 100 due to rounding.Note: Percentages may not sum to 100 due to rounding.
$0
$10
$20
$30
$40
$50
$60
$70
$80
$90
08-0907-0806-0705-0604-0503-0402-0301-0200-0199-0098-99
Academic Year (Total Loans in 2008 Dollars)
($44.6B) ($69.3B) ($94.5B)
Loan
s in
Bill
ions
(200
8 D
olla
rs)
9%9%
33%
49%
11%9%
34%
45%
12%10%
35%
43%
13%
10%
35%
42%
16%
10%
35%
40%
13%
41%
34%
25%
31%
32%
26%
30%
31%
23%
11%
32%
33%
21%
11%
33%
36%
17%
11%
34%
38%
10%3% 9%
3%8%4%
The average annual rate of growth of total state grants declined from 8% between 1998-99 and 2003-04 to 3% over the next five years.
Federal and state governments combined provided 42% of total grant aid in 1998-99 and about the same percentage a decade later. However, this percentage was as high as 47% in 2002-03.
Federal Grants InstitutionalGrants Private and Employer Grants State Grants Subsidized Stafford Loans Unsubsidized Stafford Loans Parent PLUS Loans
Grad PLUS Loans Nonfederal Loans
T R E N D S I N S T U D E N T A I D 2 0 0 9
9
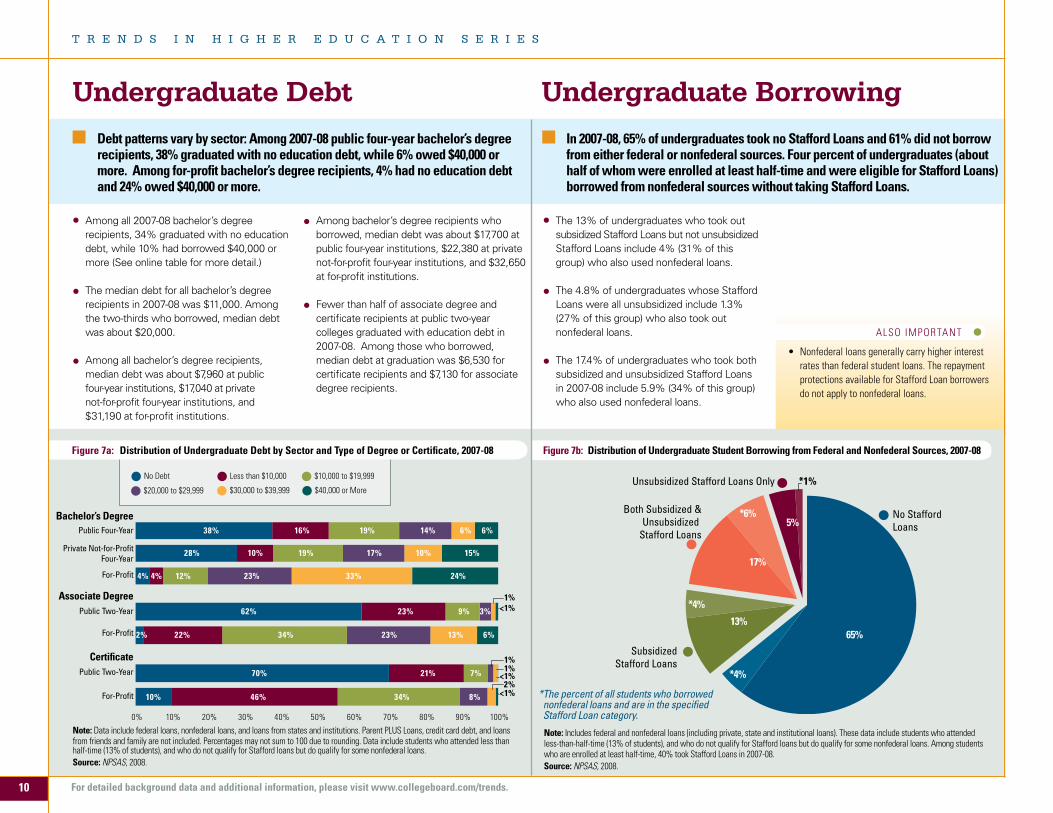
Figure 7a: Distribution of Undergraduate Debt by Sector and Type of Degree or Certificate, 2007-08 Figure 7b: Distribution of Undergraduate Student Borrowing from Federal and Nonfederal Sources, 2007-08
Among all 2007-08 bachelor’s degree recipients, 34% graduated with no education debt, while 10% had borrowed $40,000 or more (See online table for more detail.)
The median debt for all bachelor’s degree recipients in 2007-08 was $11,000. Among the two-thirds who borrowed, median debt was about $20,000.
Among all bachelor’s degree recipients, median debt was about $7,960 at public four-year institutions, $17,040 at private not-for-profit four-year institutions, and $31,190 at for-profit institutions.
The 13% of undergraduates who took out subsidized Stafford Loans but not unsubsidized Stafford Loans include 4% (31% of this group) who also used nonfederal loans.
The 4.8% of undergraduates whose Stafford Loans were all unsubsidized include 1.3% (27% of this group) who also took out nonfederal loans.
The 17.4% of undergraduates who took both subsidized and unsubsidized Stafford Loans in 2007-08 include 5.9% (34% of this group) who also used nonfederal loans.
Undergraduate Debt Undergraduate Borrowing Debt patterns vary by sector: Among 2007-08 public four-year bachelor’s degree recipients, 38% graduated with no education debt, while 6% owed $40,000 or more. Among for-profit bachelor’s degree recipients, 4% had no education debt and 24% owed $40,000 or more.
In 2007-08, 65% of undergraduates took no Stafford Loans and 61% did not borrow from either federal or nonfederal sources. Four percent of undergraduates (about half of whom were enrolled at least half-time and were eligible for Stafford Loans) borrowed from nonfederal sources without taking Stafford Loans.
4% 12% 23% 33% 24%
15%10%17%19%10%28%
38% 16% 19% 14% 6% 6%
1%<1%
4%
0% 10% 20% 30% 40% 50% 60% 70% 80% 90% 100%
For-Profit
Private Not-for-ProfitFour-Year
Public Four-Year
62% 23% 9% 3%
1%<1%
22% 34% 23% 13% 6%2%For-Profit
Public Two-Year
Bachelor’s Degree
Associate Degree
Certificate
For-Profit
Public Two-Year
10% 46% 34% 8%
70% 21% 7%2%
<1%
1%
Among bachelor’s degree recipients who borrowed, median debt was about $17,700 at public four-year institutions, $22,380 at private not-for-profit four-year institutions, and $32,650 at for-profit institutions.
Fewer than half of associate degree and certificate recipients at public two-year colleges graduated with education debt in 2007-08. Among those who borrowed, median debt at graduation was $6,530 for certificate recipients and $7,130 for associate degree recipients.
Note: Data include federal loans, nonfederal loans, and loans from states and institutions. Parent PLUS Loans, credit card debt, and loans from friends and family are not included. Percentages may not sum to 100 due to rounding. Data include students who attended less than half-time(13%ofstudents),andwhodonotqualifyforStaffordloansbutdoqualifyforsomenonfederalloans.Source: NPSAS, 2008.
Note: Includesfederalandnonfederalloans(includingprivate,stateandinstitutionalloans).Thesedataincludestudentswhoattendedless-than-half-time(13%ofstudents),andwhodonotqualifyforStaffordloansbutdoqualifyforsomenonfederalloans.Amongstudentswho are enrolled at least half-time, 40% took Stafford Loans in 2007-08. Source: NPSAS, 2008.
Unsubsidized Stafford Loans Only
Both Subsidized &Unsubsidized
Stafford Loans
Subsidized Stafford Loans
No Stafford Loans
65%13%
17%
5%
*1%
*4%
*6%
*4%
• Nonfederalloansgenerallycarryhigherinterestrates than federal student loans. The repayment protections available for Stafford Loan borrowers do not apply to nonfederal loans.
ALSO IMPORTANT
* The percent of all students who borrowed nonfederal loans and are in the specified Stafford Loan category.
No Debt Less than $10,000 $10,000 to $19,999
$20,000 to $29,999 $30,000 to $39,999 $40,000 or More
10
T R E N D S I N H I G H E R E D U C A T I O N S E R I E S
For detailed background data and additional information, please visit www.collegeboard.com/trends.
ALSO IMPORTANT
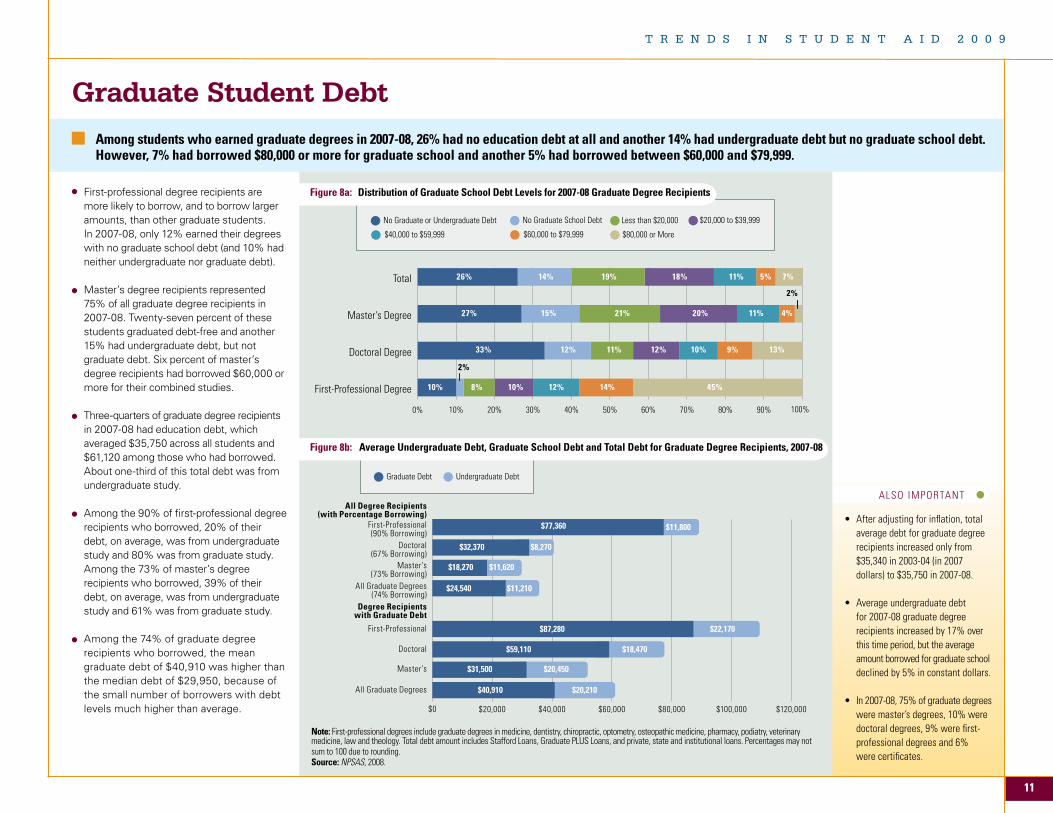
• Afteradjustingforinflation,totalaverage debt for graduate degree recipients increased only from $35,340in2003-04(in2007 dollars)to$35,750in2007-08.
• Averageundergraduatedebtfor 2007-08 graduate degree recipients increased by 17% over this time period, but the average amount borrowed for graduate school declined by 5% in constant dollars.
• In2007-08,75%ofgraduatedegreeswere master’s degrees, 10% were doctoral degrees, 9% were first- professional degrees and 6% were certificates.
Note: First-professional degrees include graduate degrees in medicine, dentistry, chiropractic, optometry, osteopathic medicine, pharmacy, podiatry, veterinary medicine, law and theology. Total debt amount includes Stafford Loans, Graduate PLUS Loans, and private, state and institutional loans. Percentages may not sum to 100 due to rounding. Source: NPSAS, 2008.
Graduate Student DebtAmong students who earned graduate degrees in 2007-08, 26% had no education debt at all and another 14% had undergraduate debt but no graduate school debt. However, 7% had borrowed $80,000 or more for graduate school and another 5% had borrowed between $60,000 and $79,999.
Figure 8a: Distribution of Graduate School Debt Levels for 2007-08 Graduate Degree Recipients
Figure 8b: Average Undergraduate Debt, Graduate School Debt and Total Debt for Graduate Degree Recipients, 2007-08
First-professional degree recipients are more likely to borrow, and to borrow larger amounts, than other graduate students. In 2007-08, only 12% earned their degrees with no graduate school debt (and 10% had neither undergraduate nor graduate debt).
Master’s degree recipients represented 75% of all graduate degree recipients in 2007-08. Twenty-seven percent of these students graduated debt-free and another 15% had undergraduate debt, but not graduate debt. Six percent of master’s degree recipients had borrowed $60,000 or more for their combined studies.
Three-quarters of graduate degree recipients in 2007-08 had education debt, which averaged $35,750 across all students and $61,120 among those who had borrowed. About one-third of this total debt was from undergraduate study.
Among the 90% of first-professional degree recipients who borrowed, 20% of their debt, on average, was from undergraduate study and 80% was from graduate study. Among the 73% of master’s degree recipients who borrowed, 39% of their debt, on average, was from undergraduate study and 61% was from graduate study.
Among the 74% of graduate degree recipients who borrowed, the mean graduate debt of $40,910 was higher than the median debt of $29,950, because of the small number of borrowers with debt levels much higher than average. $0 $20,000 $40,000 $60,000 $80,000 $100,000 $120,000
$77,360 $11,800
$32,370 $8,270
$11,620
$11,210
$18,270
$24,540
First-Professional(90% Borrowing)
Doctoral(67% Borrowing)
Master’s(73% Borrowing)
All Graduate Degrees(74% Borrowing)
First-Professional
Doctoral
Master’s
All Graduate Degrees
$87,280 $22,170
$59,110 $18,470
$31,500 $20,450
$40,910 $20,210
All Degree Recipients(with Percentage Borrowing)
Degree Recipientswith Graduate Debt
0% 10% 20% 30% 40% 50% 60% 70% 80% 90%
First-Professional Degree
Doctoral Degree
Master's Degree
Total 26% 14% 19% 18% 11% 5% 7%
27% 15% 21% 20% 11% 4%
2%
33% 12% 11% 12% 10% 9% 13%
10%
2%
8% 10% 12% 14% 45%
100%
No Graduate or Undergraduate Debt No Graduate School Debt Less than $20,000 $20,000 to $39,999
$40,000 to $59,999 $60,000 to $79,999 $80,000 or More
Graduate Debt Undergraduate Debt
T R E N D S I N S T U D E N T A I D 2 0 0 9
11
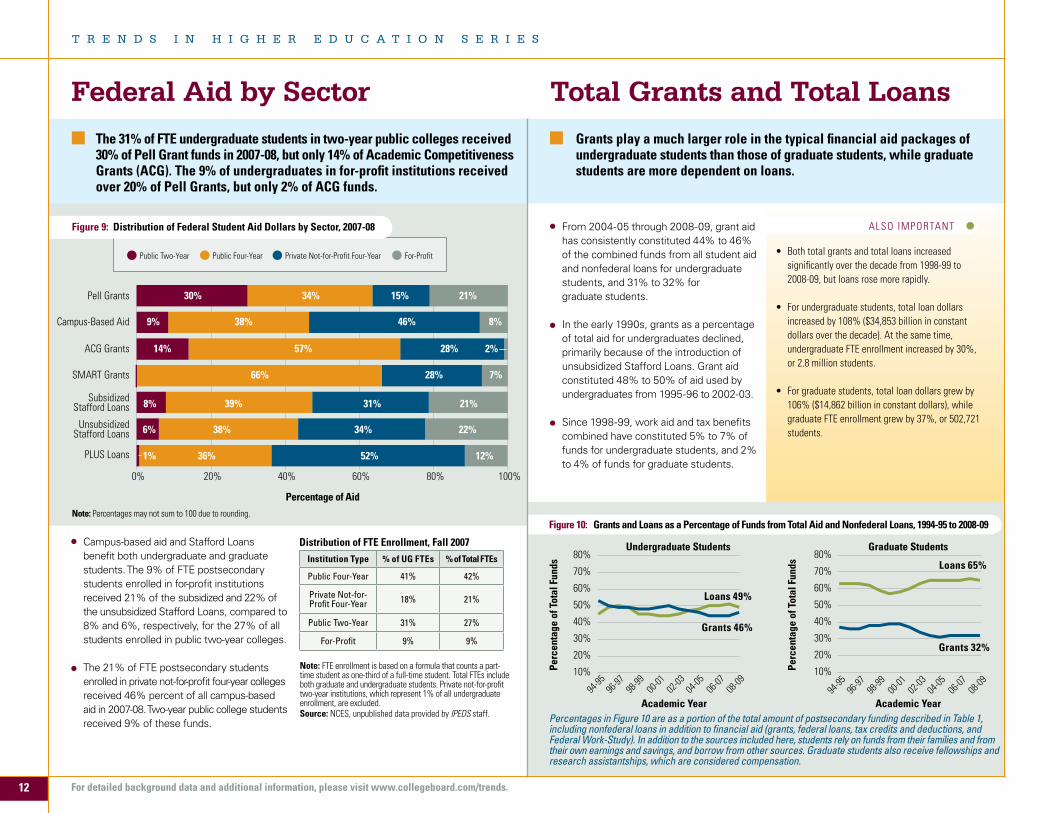
The 31% of FTE undergraduate students in two-year public colleges received 30% of Pell Grant funds in 2007-08, but only 14% of Academic Competitiveness Grants (ACG). The 9% of undergraduates in for-profit institutions received over 20% of Pell Grants, but only 2% of ACG funds.
Grants play a much larger role in the typical financial aid packages of undergraduate students than those of graduate students, while graduate students are more dependent on loans.
Federal Aid by Sector Total Grants and Total Loans
Figure 10: Grants and Loans as a Percentage of Funds from Total Aid and Nonfederal Loans, 1994-95 to 2008-09
From 2004-05 through 2008-09, grant aid has consistently constituted 44% to 46% of the combined funds from all student aid and nonfederal loans for undergraduate students, and 31% to 32% for graduate students.
In the early 1990s, grants as a percentage of total aid for undergraduates declined, primarily because of the introduction of unsubsidized Stafford Loans. Grant aid constituted 48% to 50% of aid used by undergraduates from 1995-96 to 2002-03.
Since 1998-99, work aid and tax benefits combined have constituted 5% to 7% of funds for undergraduate students, and 2% to 4% of funds for graduate students.
• Bothtotalgrantsandtotalloansincreasedsignificantly over the decade from 1998-99 to 2008-09, but loans rose more rapidly.
• Forundergraduatestudents,totalloandollarsincreasedby108%($34,853billioninconstantdollarsoverthedecade).Atthesametime,undergraduate FTE enrollment increased by 30%, or 2.8 million students.
• Forgraduatestudents,totalloandollarsgrewby106%($14,862billioninconstantdollars),whilegraduate FTE enrollment grew by 37%, or 502,721 students.
Campus-based aid and Stafford Loans benefit both undergraduate and graduate students. The 9% of FTE postsecondary students enrolled in for-profit institutions received 21% of the subsidized and 22% of the unsubsidized Stafford Loans, compared to 8% and 6%, respectively, for the 27% of all students enrolled in public two-year colleges.
The 21% of FTE postsecondary students enrolled in private not-for-profit four-year colleges received 46% percent of all campus-based aid in 2007-08. Two-year public college students received 9% of these funds. Percentages in Figure 10 are as a portion of the total amount of postsecondary funding described in Table 1,
including nonfederal loans in addition to financial aid (grants, federal loans, tax credits and deductions, and Federal Work-Study). In addition to the sources included here, students rely on funds from their families and from their own earnings and savings, and borrow from other sources. Graduate students also receive fellowships and research assistantships, which are considered compensation.
10%
20%
30%
40%
50%
60%
70%
80%Undergraduate Students
Academic Year 94
-9596
-9798
-99 00
-01 02
-03 06
-0704
-05 08
-09 94
-9596
-9798
-99 00
-01 02
-03 06
-0704
-05 08
-0910%
20%
30%
40%
50%
60%
70%
80%Graduate Students
Academic Year
Loans 49%
Grants 46%
Loans 65%
Grants 32%
Perc
enta
ge o
f Tot
al F
unds
Perc
enta
ge o
f Tot
al F
unds
Figure 9: Distribution of Federal Student Aid Dollars by Sector, 2007-08
Percentage of Aid
0% 20% 40% 60% 80% 100%
Pell Grants
Campus-Based Aid
PLUS Loans
SubsidizedStafford Loans
UnsubsidizedStafford Loans
SMART Grants
ACG Grants
30% 34% 15% 21%
9% 38% 46% 8%
14% 57% 2%28%
66% 7%28%
6% 38% 34% 22%
8% 39% 31% 21%
36%1% 52% 12%
Institution Type
Public Four-Year
% of UG FTEs % of Total FTEs
Private Not-for-Profit Four-Year
Public Two-Year
For-Profit
41%
18%
31%
9%
42%
21%
27%
9%
Note: Percentages may not sum to 100 due to rounding.
Note: FTE enrollment is based on a formula that counts a part-time student as one-third of a full-time student. Total FTEs include both graduate and undergraduate students. Private not-for-profit two-year institutions, which represent 1% of all undergraduate enrollment, are excluded.Source: NCES, unpublished data provided by IPEDS staff.
ALSO IMPORTANT
Public Two-Year Public Four-Year Private Not-for-Profit Four-Year For-Profit
Distribution of FTE Enrollment, Fall 2007
Institution Type % of UG FTEs % of Total FTEs
Public Four-Year 41% 42%
Private Not-for-Profit Four-Year 18% 21%
Public Two-Year 31% 27%
For-Profit 9% 9%
12
T R E N D S I N H I G H E R E D U C A T I O N S E R I E S
For detailed background data and additional information, please visit www.collegeboard.com/trends.
ALSO IMPORTANT
08-0906-0704-0502-0300-0198-9996-9794-95
Aver
age
Aid
in C
onst
ant (
2008
) Dol
lars
Academic Year
98-99:$3,602
03-04:$4,477
08-09:$5,041
$3,086
94-95:$3,195
$2,684
$3,602$4,585
$0
$2,000
$4,000
$6,000
$8,000
$10,000
$12,000
$14,000
Academic Year
$0
$2,000
$4,000
$6,000
$8,000
$10,000
$12,000
$14,000
Aver
age
Aid
in C
onst
ant (
2008
) Dol
lars
94-95:$8,197
98-99:$9,411
03-04:$11,430
08-09:$14,598
$4,812
$6,675 $6,475
$7,558
08-0906-0704-0502-0300-0198-9996-9794-95
Total Aid per Full-Time Equivalent Student
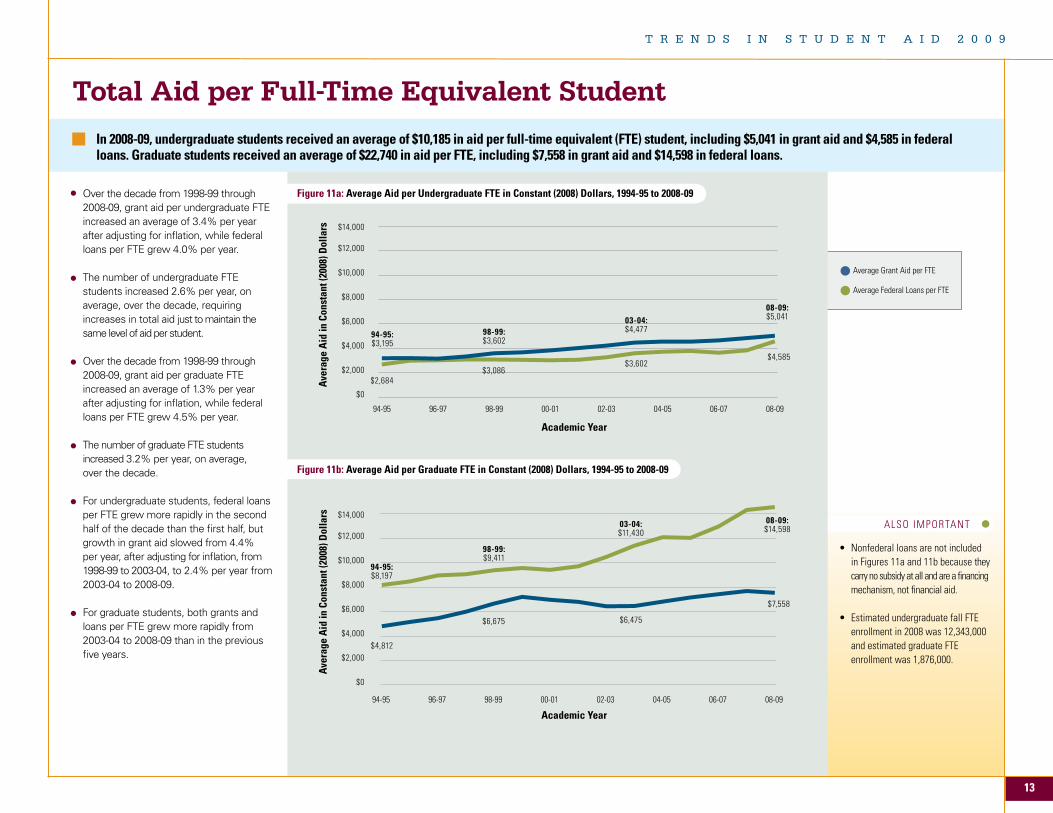
Over the decade from 1998-99 through 2008-09, grant aid per undergraduate FTE increased an average of 3.4% per year after adjusting for inflation, while federal loans per FTE grew 4.0% per year.
The number of undergraduate FTE students increased 2.6% per year, on average, over the decade, requiring increases in total aid just to maintain the same level of aid per student.
Over the decade from 1998-99 through 2008-09, grant aid per graduate FTE increased an average of 1.3% per year after adjusting for inflation, while federal loans per FTE grew 4.5% per year.
The number of graduate FTE students increased 3.2% per year, on average, over the decade.
For undergraduate students, federal loans per FTE grew more rapidly in the second half of the decade than the first half, but growth in grant aid slowed from 4.4% per year, after adjusting for inflation, from 1998-99 to 2003-04, to 2.4% per year from 2003-04 to 2008-09.
For graduate students, both grants and loans per FTE grew more rapidly from 2003-04 to 2008-09 than in the previous five years.
Figure 11a: Average Aid per Undergraduate FTE in Constant (2008) Dollars, 1994-95 to 2008-09
In 2008-09, undergraduate students received an average of $10,185 in aid per full-time equivalent (FTE) student, including $5,041 in grant aid and $4,585 in federal loans. Graduate students received an average of $22,740 in aid per FTE, including $7,558 in grant aid and $14,598 in federal loans.
• Nonfederalloansarenotincludedin Figures 11a and 11b because they carry no subsidy at all and are a financing mechanism, not financial aid.
• EstimatedundergraduatefallFTE enrollment in 2008 was 12,343,000 and estimated graduate FTE enrollment was 1,876,000.
Figure 11b: Average Aid per Graduate FTE in Constant (2008) Dollars, 1994-95 to 2008-09
Average Grant Aid per FTE
Average Federal Loans per FTE
T R E N D S I N S T U D E N T A I D 2 0 0 9
13
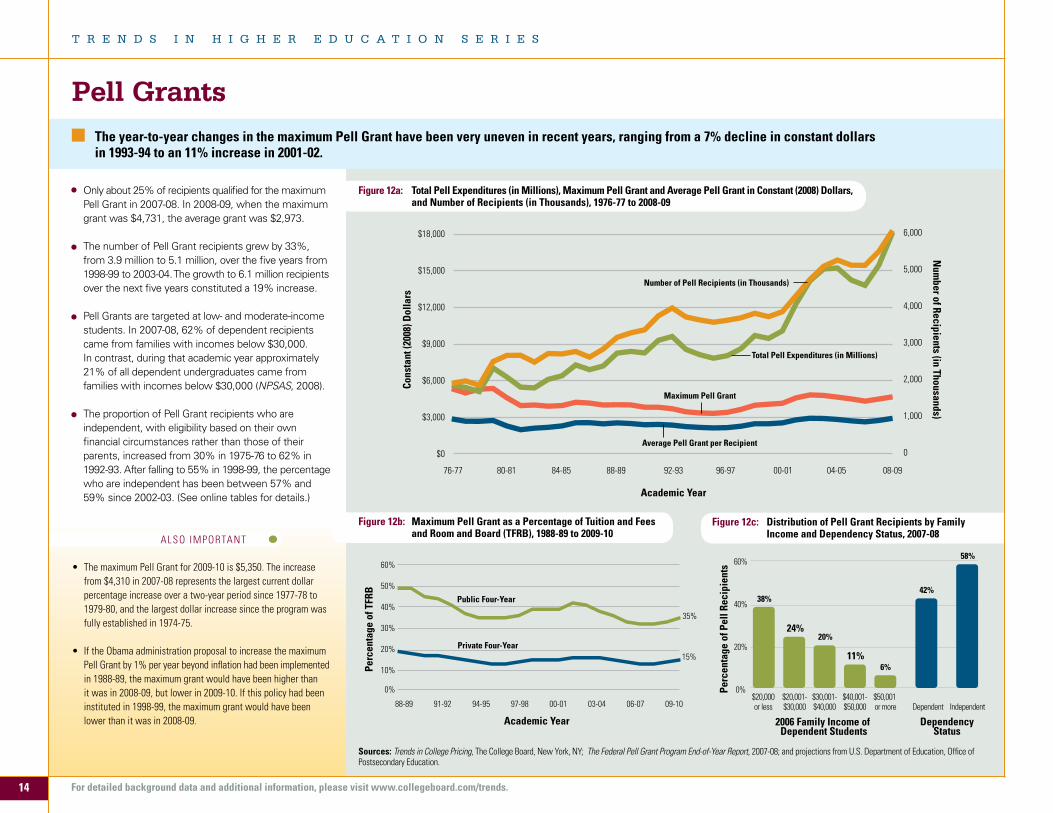
Pell GrantsThe year-to-year changes in the maximum Pell Grant have been very uneven in recent years, ranging from a 7% decline in constant dollars in 1993-94 to an 11% increase in 2001-02.
Only about 25% of recipients qualified for the maximum Pell Grant in 2007-08. In 2008-09, when the maximum grant was $4,731, the average grant was $2,973.
The number of Pell Grant recipients grew by 33%, from 3.9 million to 5.1 million, over the five years from 1998-99 to 2003-04. The growth to 6.1 million recipients over the next five years constituted a 19% increase.
Pell Grants are targeted at low- and moderate-income students. In 2007-08, 62% of dependent recipients came from families with incomes below $30,000. In contrast, during that academic year approximately 21% of all dependent undergraduates came from families with incomes below $30,000 (NPSAS, 2008).
The proportion of Pell Grant recipients who are independent, with eligibility based on their own financial circumstances rather than those of their parents, increased from 30% in 1975-76 to 62% in 1992-93. After falling to 55% in 1998-99, the percentage who are independent has been between 57% and 59% since 2002-03. (See online tables for details.)
Figure 12c: Distribution of Pell Grant Recipients by Family Income and Dependency Status, 2007-08
Sources: Trends in College Pricing, The College Board, New York, NY; The Federal Pell Grant Program End-of-Year Report,2007-08;andprojectionsfromU.S.DepartmentofEducation,OfficeofPostsecondary Education.
Perc
enta
ge o
f TFR
B
Academic Year
Public Four-Year
Private Four-Year
0%
10%
20%
30%
40%
50%
60%
09-1006-0703-0400-0197-9894-9591-9288-89
35%
15%
Figure 12a: Total Pell Expenditures (in Millions), Maximum Pell Grant and Average Pell Grant in Constant (2008) Dollars, and Number of Recipients (in Thousands), 1976-77 to 2008-09
Figure 12b: Maximum Pell Grant as a Percentage of Tuition and Fees and Room and Board (TFRB), 1988-89 to 2009-10
0%
20%
40%
60%
2006 Family Income of Dependent Students
DependencyStatus
Perc
enta
ge o
f Pel
l Rec
ipie
nts
38%
24%20%
11%6%
42%
58%
IndependentDependent$50,001 or more
$40,001-$50,000
$30,001-$40,000
$20,001-$30,000
$20,000or less
Cons
tant
(200
8) D
olla
rs
Num
ber of Recipients (in Thousands)
$0
$3,000
$6,000
$9,000
$12,000
$15,000
$18,000
Maximum Pell Grant
Average Pell Grant per Recipient
Total Pell Expenditures (in Millions)
Number of Pell Recipients (in Thousands)
Academic Year
0
1,000
2,000
3,000
4,000
5,000
6,000
08-0904-0500-0196-9792-9388-8984-8580-8176-77
ALSO IMPORTANT
• ThemaximumPellGrantfor2009-10is$5,350.Theincreasefrom $4,310 in 2007-08 represents the largest current dollar percentage increase over a two-year period since 1977-78 to 1979-80, and the largest dollar increase since the program was fully established in 1974-75.
• IftheObamaadministrationproposaltoincreasethemaximumPell Grant by 1% per year beyond inflation had been implemented in 1988-89, the maximum grant would have been higher than itwasin2008-09,butlowerin2009-10.Ifthispolicyhadbeeninstituted in 1998-99, the maximum grant would have been lower than it was in 2008-09.
14
T R E N D S I N H I G H E R E D U C A T I O N S E R I E S
For detailed background data and additional information, please visit www.collegeboard.com/trends.
ALSO IMPORTANT
• Theproportionofstateaidallocatedonthebasisof financial circumstances declined from 90% in 1992-93 to 86% in 1995-96, 78% in 1999-2000, 74% in 2003-04 and 72%in2007-08.(NASSGAP,2009)
• StatemeritaidprogramsareconcentratedinSouthernstates, where incomes tend to be lower than the national average. Relatively few students in these states are in the top segment of the national income distribution.
• Federalgrantaidismoretargetedatlow-incomestudentsthanisstategrantaid.In2007-08,only2%offederalgrantsto dependent students went to students from families in theupperhalfoftheincomedistribution.(NPSAS,2008)
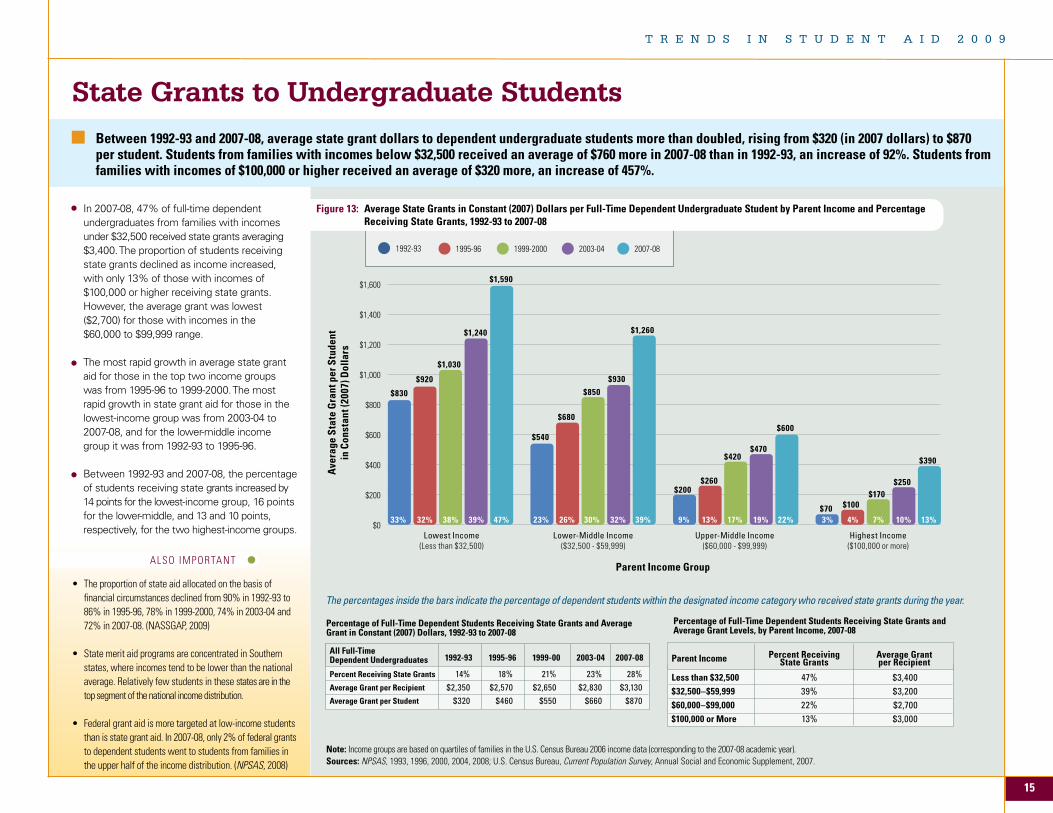
In 2007-08, 47% of full-time dependent undergraduates from families with incomes under $32,500 received state grants averaging $3,400. The proportion of students receiving state grants declined as income increased, with only 13% of those with incomes of $100,000 or higher receiving state grants. However, the average grant was lowest ($2,700) for those with incomes in the $60,000 to $99,999 range.
The most rapid growth in average state grant aid for those in the top two income groups was from 1995-96 to 1999-2000. The most rapid growth in state grant aid for those in the lowest-income group was from 2003-04 to 2007-08, and for the lower-middle income group it was from 1992-93 to 1995-96.
Between 1992-93 and 2007-08, the percentage of students receiving state grants increased by 14 points for the lowest-income group, 16 points for the lower-middle, and 13 and 10 points, respectively, for the two highest-income groups.
0
Ave
rage
Sta
te G
rant
per
Stu
dent
in C
onst
ant (
2007
) Dol
lars
Lowest Income(Less than $32,500)
Parent Income Group
Lower-Middle Income($32,500 - $59,999)
Upper-Middle Income($60,000 - $99,999)
Highest Income($100,000 or more)
33% 32% 38% 39% 47% 23% 26% 30% 32% 39% 9% 13% 17% 19% 22% 3% 4% 7% 10% 13%
$830
$920
$1,030
$1,240
$1,590
$540
$680
$850$930
$1,260
$200$260
$420$470
$600
$70 $100$170
$250
$390
$200
$400
$600
$800
$1,000
$1,200
$1,400
$1,600
$0
Note: IncomegroupsarebasedonquartilesoffamiliesintheU.S.CensusBureau2006incomedata(correspondingtothe2007-08academicyear).Sources: NPSAS, 1993, 1996, 2000, 2004, 2008; U.S. Census Bureau, Current Population Survey, Annual Social and Economic Supplement, 2007.
State Grants to Undergraduate StudentsBetween 1992-93 and 2007-08, average state grant dollars to dependent undergraduate students more than doubled, rising from $320 (in 2007 dollars) to $870 per student. Students from families with incomes below $32,500 received an average of $760 more in 2007-08 than in 1992-93, an increase of 92%. Students from families with incomes of $100,000 or higher received an average of $320 more, an increase of 457%.
Figure 13: Average State Grants in Constant (2007) Dollars per Full-Time Dependent Undergraduate Student by Parent Income and Percentage Receiving State Grants, 1992-93 to 2007-08
Percent Receiving State Grants
Average Grant per Recipient
Average Grant per Student
14%$2,350
$320
18%$2,570
$460
21%$2,650
$550
23%$2,830
$660
28%$3,130
$870
All Full-TimeDependent Undergraduates 1992-93 1995-96 1999-00 2003-04 2007-08
Less than $32,500$32,500–$59,999$60,000–$99,000$100,000 or More
47%39%22%13%
$3,400$3,200$2,700$3,000
Percent ReceivingState Grants
Average Grantper RecipientParent Income
Percentage of Full-Time Dependent Students Receiving State Grants and Average Grant in Constant (2007) Dollars, 1992-93 to 2007-08
Percentage of Full-Time Dependent Students Receiving State Grants and Average Grant Levels, by Parent Income, 2007-08
1992-93 1995-96 1999-2000 2003-04 2007-08
The percentages inside the bars indicate the percentage of dependent students within the designated income category who received state grants during the year.
T R E N D S I N S T U D E N T A I D 2 0 0 9
15
ALSO IMPORTANT
• Thedatareportedherearebasedonthe National Postsecondary Student Aid Study, which categorizes need-based and non-need-based aid depending on the criteria used for allocating the funds. As the figures reveal, much of the non-need-based aid goes to students who have financial need. Some other surveys of institutional grant aid categorize all aid that meets financial need as “need-based,” regardless of the criteria used to award that aid.
• Almosthalfof2007-08undergraduatestudentswere independent. These students cannot be classified by parental income and their grant aid is not represented by the information reported here. This information also does not describe the aid patterns of part-time students.Note:Dataarebasedondependentstudentswhoattendedexclusivelyfull-timein2007-08.Incomegroupsarebasedonquartilesof
familiesintheU.S.CensusBureau2006incomedata(correspondingtothe2007-08academicyear).Incomerangesin2007-08are:lessthan $32,500; $32,500 to $59,999; $60,000 to $99,999; and $100,000 or more.Sources: NPSAS, 2008; U.S. Census Bureau, Current Population Survey, Annual Social and Economic Supplement, 2007.
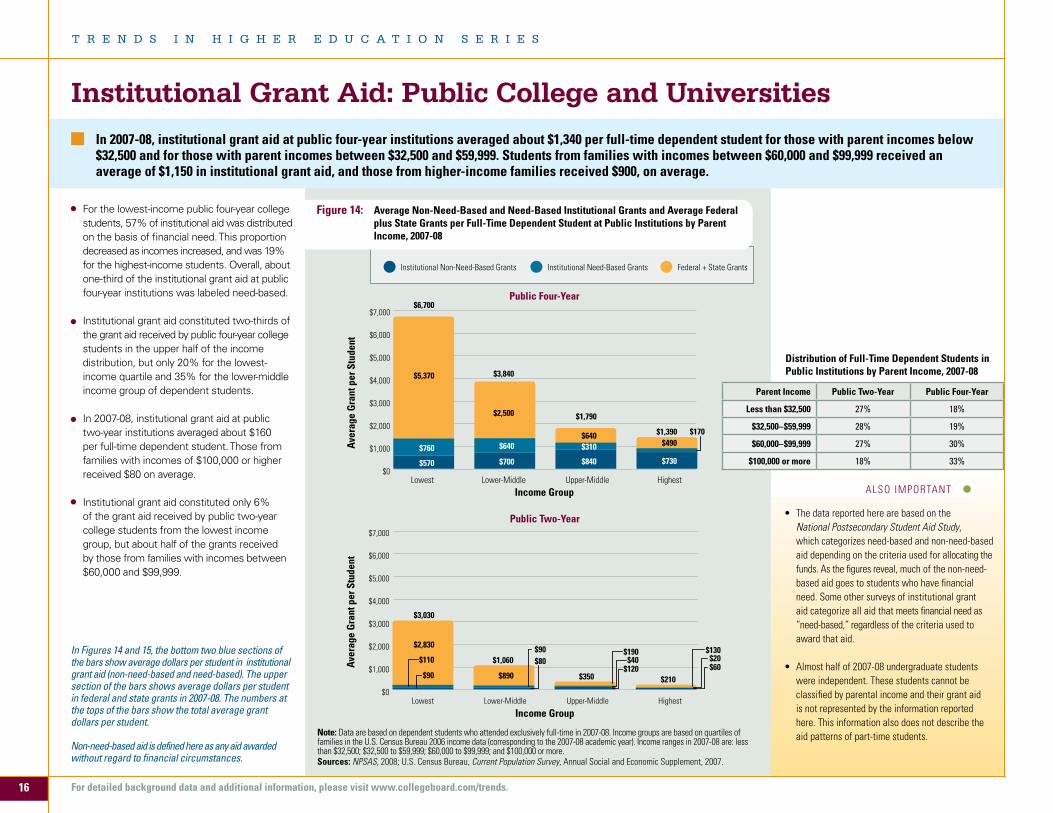
In Figures 14 and 15, the bottom two blue sections of the bars show average dollars per student in institutional grant aid (non-need-based and need-based). The upper section of the bars shows average dollars per student in federal and state grants in 2007-08. The numbers at the tops of the bars show the total average grant dollars per student.
Non-need-based aid is defined here as any aid awarded without regard to financial circumstances.
Institutional Grant Aid: Public College and UniversitiesIn 2007-08, institutional grant aid at public four-year institutions averaged about $1,340 per full-time dependent student for those with parent incomes below $32,500 and for those with parent incomes between $32,500 and $59,999. Students from families with incomes between $60,000 and $99,999 received an average of $1,150 in institutional grant aid, and those from higher-income families received $900, on average.
Figure 14: Average Non-Need-Based and Need-Based Institutional Grants and Average Federal plus State Grants per Full-Time Dependent Student at Public Institutions by Parent Income, 2007-08
Aver
age
Gra
nt p
er S
tude
nt
Income Group
Public Two-Year
Aver
age
Gra
nt p
er S
tude
nt
$0
$1,000
$2,000
$3,000
$4,000
$5,000
$6,000
$7,000
$0
$1,000
$2,000
$3,000
$4,000
$5,000
$6,000
$7,000
Lowest Lower-Middle Upper-Middle HighestIncome Group
Public Four-Year
$570
$760
$5,370
$700
$640
$2,500
$840
$310$640
$730
$170$490
$6,700
$3,840
$1,790
$1,390
Lowest Lower-Middle Upper-Middle Highest
$90
$110
$2,830
$3,030
$350 $210
$80$90
$890
$1,060 $40$120
$190$20$60
$130
Aver
age
Gra
nt p
er S
tude
nt
Income Group
Public Two-Year
Aver
age
Gra
nt p
er S
tude
nt
$0
$1,000
$2,000
$3,000
$4,000
$5,000
$6,000
$7,000
$0
$1,000
$2,000
$3,000
$4,000
$5,000
$6,000
$7,000
Lowest Lower-Middle Upper-Middle HighestIncome Group
Public Four-Year
$570
$760
$5,370
$700
$640
$2,500
$840
$310$640
$730
$170$490
$6,700
$3,840
$1,790
$1,390
Lowest Lower-Middle Upper-Middle Highest
$90
$110
$2,830
$3,030
$350 $210
$80$90
$890
$1,060 $40$120
$190$20$60
$130
InstitutionalNon-Need-BasedGrants InstitutionalNeed-BasedGrants Federal + State Grants
Parent Income Public Two-Year Public Four-Year
Less than $32,500 27% 18%
$32,500–$59,999 28% 19%
$60,000–$99,999 27% 30%
$100,000 or more 18% 33%
Distribution of Full-Time Dependent Students in Public Institutions by Parent Income, 2007-08
For the lowest-income public four-year college students, 57% of institutional aid was distributed on the basis of financial need. This proportion decreased as incomes increased, and was 19% for the highest-income students. Overall, about one-third of the institutional grant aid at public four-year institutions was labeled need-based.
Institutional grant aid constituted two-thirds of the grant aid received by public four-year college students in the upper half of the income distribution, but only 20% for the lowest-income quartile and 35% for the lower-middle income group of dependent students.
In 2007-08, institutional grant aid at public two-year institutions averaged about $160 per full-time dependent student. Those from families with incomes of $100,000 or higher received $80 on average.
Institutional grant aid constituted only 6% of the grant aid received by public two-year college students from the lowest income group, but about half of the grants received by those from families with incomes between $60,000 and $99,999.
16
T R E N D S I N H I G H E R E D U C A T I O N S E R I E S
For detailed background data and additional information, please visit www.collegeboard.com/trends.
ALSO IMPORTANT
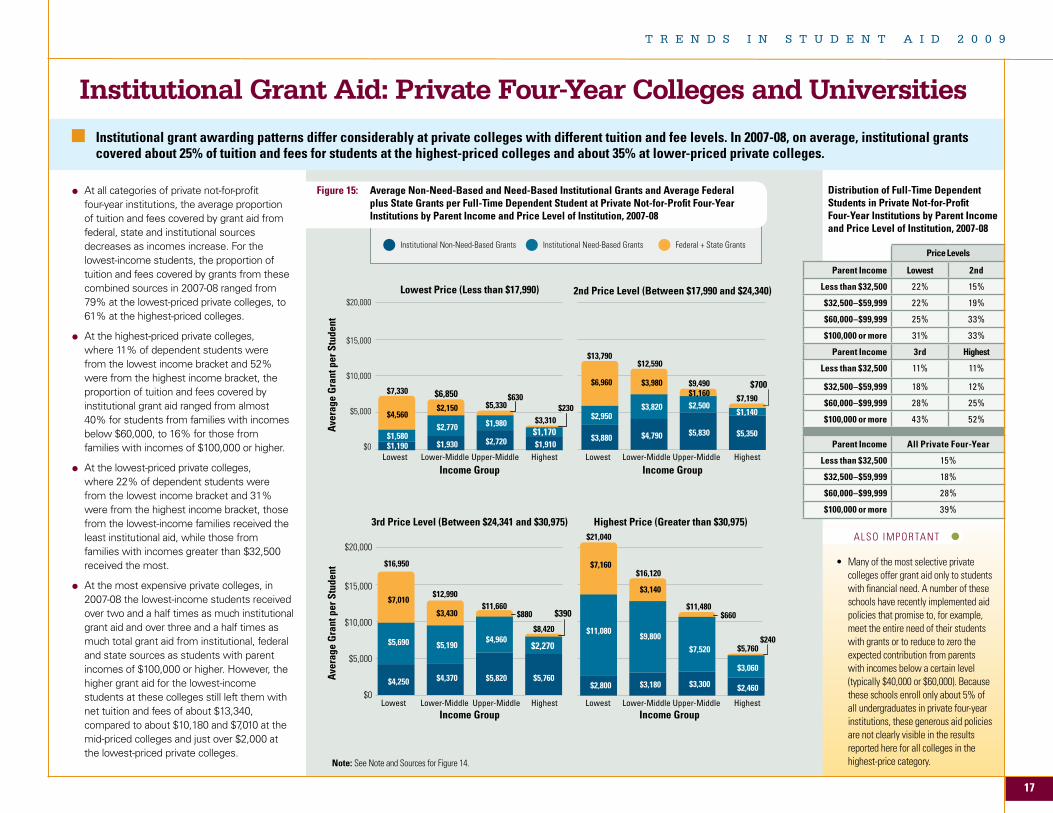
• Manyofthemostselectiveprivatecolleges offer grant aid only to students with financial need. A number of these schools have recently implemented aid policies that promise to, for example, meet the entire need of their students with grants or to reduce to zero the expected contribution from parents with incomes below a certain level (typically$40,000or$60,000).Becausethese schools enroll only about 5% of all undergraduates in private four-year institutions, these generous aid policies are not clearly visible in the results reported here for all colleges in the highest-price category.
Institutional Grant Aid: Private Four-Year Colleges and Universities
Institutional grant awarding patterns differ considerably at private colleges with different tuition and fee levels. In 2007-08, on average, institutional grants covered about 25% of tuition and fees for students at the highest-priced colleges and about 35% at lower-priced private colleges.
At all categories of private not-for-profit four-year institutions, the average proportion of tuition and fees covered by grant aid from federal, state and institutional sources decreases as incomes increase. For the lowest-income students, the proportion of tuition and fees covered by grants from these combined sources in 2007-08 ranged from 79% at the lowest-priced private colleges, to 61% at the highest-priced colleges.
At the highest-priced private colleges, where 11% of dependent students were from the lowest income bracket and 52% were from the highest income bracket, the proportion of tuition and fees covered by institutional grant aid ranged from almost 40% for students from families with incomes below $60,000, to 16% for those from families with incomes of $100,000 or higher.
At the lowest-priced private colleges, where 22% of dependent students were from the lowest income bracket and 31% were from the highest income bracket, those from the lowest-income families received the least institutional aid, while those from families with incomes greater than $32,500 received the most.
At the most expensive private colleges, in 2007-08 the lowest-income students received over two and a half times as much institutional grant aid and over three and a half times as much total grant aid from institutional, federal and state sources as students with parent incomes of $100,000 or higher. However, the higher grant aid for the lowest-income students at these colleges still left them with net tuition and fees of about $13,340, compared to about $10,180 and $7,010 at the mid-priced colleges and just over $2,000 at the lowest-priced private colleges.
Note: See Note and Sources for Figure 14.
Figure 15: Average Non-Need-Based and Need-Based Institutional Grants and Average Federal plus State Grants per Full-Time Dependent Student at Private Not-for-Profit Four-Year Institutions by Parent Income and Price Level of Institution, 2007-08
Income Group
Lowest Lower-Middle Upper-Middle HighestIncome Group
3rd Price Level (Between $24,341 and $30,975)
$20,000
$15,000
$10,000
$5,000
$0$4,250
$5,690
$7,010
$16,950
$4,370
$5,190
$3,430
$12,990
$5,820
$4,960
$880$11,660
$5,760
$2,270
$390
$8,420
Income Group
Highest Price (Greater than $30,975)
Lowest Lower-Middle Upper-Middle Highest
$2,800
$11,080
$7,160
$21,040
$3,180
$9,800
$3,140
$16,120
$660
$3,300
$7,520
$11,480
$2,460
$3,060
$5,760$240
Income Group
Aver
age
Gra
nt p
er S
tude
ntAv
erag
e G
rant
per
Stu
dent
Lowest Lower-Middle Upper-Middle Highest
2nd Price Level (Between $17,990 and $24,340)
$3,880
$2,950
$6,960
$13,790
$4,790
$3,820
$3,980
$12,590
$5,830
$2,500$1,160$9,490
$5,350
$1,140
$700$7,190
Lowest Lower-Middle Upper-Middle Highest
Lowest Price (Less than $17,990)
$1,190$1,580
$4,560
$1,930
$2,770
$2,150
$6,850
$2,720
$1,980
$630$5,330
$1,910$1,170
$230$3,310
$7,330
$20,000
$15,000
$10,000
$5,000
$0
InstitutionalNon-Need-BasedGrants InstitutionalNeed-BasedGrants Federal + State Grants
Distribution of Full-Time Dependent Students in Private Not-for-Profit Four-Year Institutions by Parent Income and Price Level of Institution, 2007-08
Price Levels
Parent Income Lowest 2nd
Less than $32,500 22% 15%
$32,500–$59,999 22% 19%
$60,000–$99,999 25% 33%
$100,000 or more 31% 33%
Parent Income 3rd Highest
Less than $32,500 11% 11%
$32,500–$59,999 18% 12%
$60,000–$99,999 28% 25%
$100,000 or more 43% 52%
Parent Income All Private Four-Year
Less than $32,500 15%
$32,500–$59,999 18%
$60,000–$99,999 28%
$100,000 or more 39%
T R E N D S I N S T U D E N T A I D 2 0 0 9
17
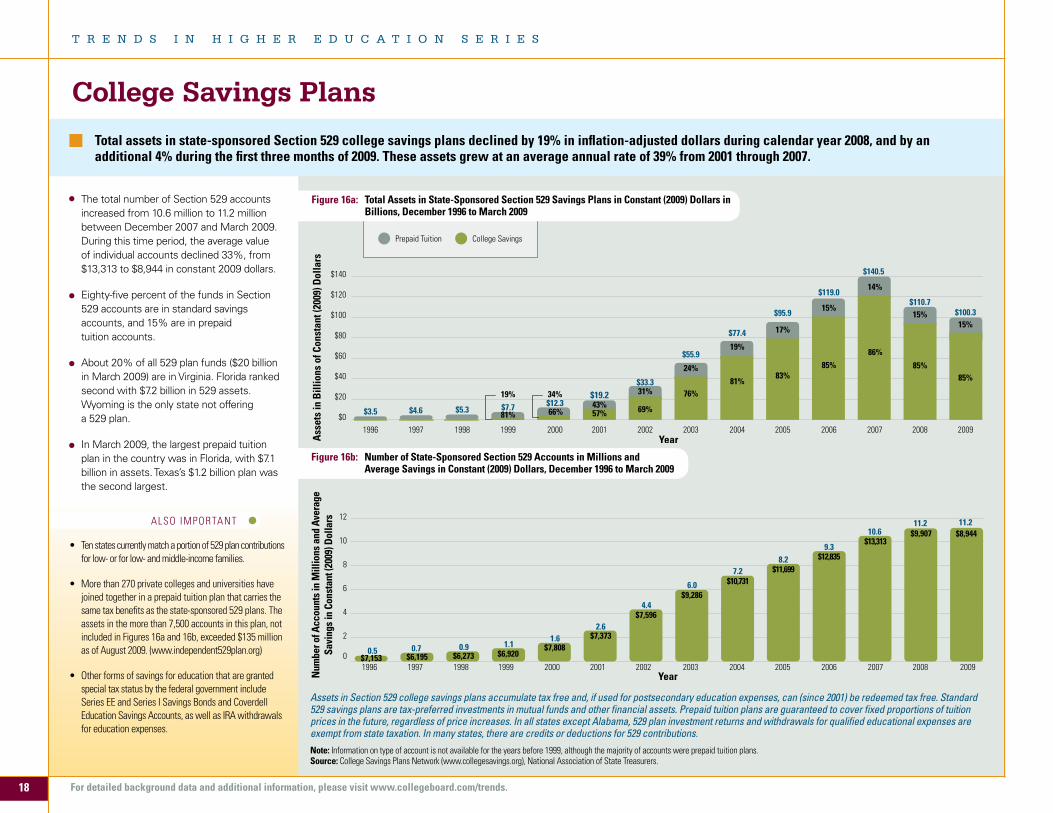
The total number of Section 529 accounts increased from 10.6 million to 11.2 million between December 2007 and March 2009. During this time period, the average value of individual accounts declined 33%, from $13,313 to $8,944 in constant 2009 dollars.
Eighty-five percent of the funds in Section 529 accounts are in standard savings accounts, and 15% are in prepaid tuition accounts.
About 20% of all 529 plan funds ($20 billion in March 2009) are in Virginia. Florida ranked second with $7.2 billion in 529 assets. Wyoming is the only state not offering a 529 plan.
In March 2009, the largest prepaid tuition plan in the country was in Florida, with $7.1 billion in assets. Texas’s $1.2 billion plan was the second largest.
• Tenstatescurrentlymatchaportionof529plancontributionsfor low- or for low- and middle-income families.
• Morethan270privatecollegesanduniversitieshavejoinedtogetherinaprepaidtuitionplanthatcarriesthesame tax benefits as the state-sponsored 529 plans. The assets in the more than 7,500 accounts in this plan, not included in Figures 16a and 16b, exceeded $135 million asofAugust2009.(www.independent529plan.org)
• Otherformsofsavingsforeducationthataregrantedspecial tax status by the federal government include SeriesEEandSeriesISavingsBondsandCoverdellEducationSavingsAccounts,aswellasIRAwithdrawalsfor education expenses.
ALSO IMPORTANT
Note: Informationontypeofaccountisnotavailablefortheyearsbefore1999,althoughthemajorityofaccountswereprepaidtuitionplans. Source: CollegeSavingsPlansNetwork(www.collegesavings.org),NationalAssociationofStateTreasurers.
Figure 16a: Total Assets in State-Sponsored Section 529 Savings Plans in Constant (2009) Dollars in Billions, December 1996 to March 2009
College Savings Plans
Total assets in state-sponsored Section 529 college savings plans declined by 19% in inflation-adjusted dollars during calendar year 2008, and by an additional 4% during the first three months of 2009. These assets grew at an average annual rate of 39% from 2001 through 2007.
$0
$20
$40
$60
$80
$100
$120
$140
Ass
ets
in B
illio
ns o
f Con
stan
t (20
09) D
olla
rs
Year1996 20072006200520042003200220012000199919981997 2008
$3.5
$140.5
$55.9
$33.3$19.2
$12.3$7.7$5.3$4.6
$110.7
19%
81%
34%
66% 57%43% 69%
31% 76%
24%81%
19%
83%
17%
85%
15%
86%
14%
85%
15%
2009
$77.4
$95.9
$119.0
$100.3
85%
15%N
umbe
r of A
ccou
nts
in M
illio
ns a
nd A
vera
geSa
ving
s in
Con
stan
t (20
09) D
olla
rs
Year
0
2
4
6
8
10
12
1996 20072006200520042003200220012000199919981997 2008
0.5
10.6
9.38.2
7.2
6.0
4.4
2.61.6
1.10.90.7
11.2
$7,153 $6,195 $6,273 $6,920$7,808
$7,373
$7,596
$9,286
$10,731$11,699
$12,835
$13,313$9,907
2009
11.2$8,944
Figure 16b: Number of State-Sponsored Section 529 Accounts in Millions and Average Savings in Constant (2009) Dollars, December 1996 to March 2009
Assets in Section 529 college savings plans accumulate tax free and, if used for postsecondary education expenses, can (since 2001) be redeemed tax free. Standard 529 savings plans are tax-preferred investments in mutual funds and other financial assets. Prepaid tuition plans are guaranteed to cover fixed proportions of tuition prices in the future, regardless of price increases. In all states except Alabama, 529 plan investment returns and withdrawals for qualified educational expenses are exempt from state taxation. In many states, there are credits or deductions for 529 contributions.
Prepaid Tuition College Savings
18
T R E N D S I N H I G H E R E D U C A T I O N S E R I E S
For detailed background data and additional information, please visit www.collegeboard.com/trends.
Data DefinitionsFederally Supported Programs:Several of the federally supported programs include small amounts of funding from sources other than the federal government. For example, Federal Work-Study (FWS) includes contributions by institutions and off-campus employers although most of the funds in the program are federal. Perkins Loans are funded from federal and institutional capital contributions as well as collections from borrowers. Since FY 2006, no funds have been appropriated for new federal capital contributions. Institutional matching funds required by the Federal Supplemental Educational Opportunity Grant (FSEOG) program since 1989-90 are reported under institutional grants.
LEAP. Formerly known as the State Student Incentive Grant (SSIG) program, the Leveraging Educational Assistance Partnership (LEAP) monies reported under federally supported aid include federal monies only; the state share is included in the state grant category.Veterans. Benefits are payments for postsecondary education and training to veterans and their dependents.Military. Includes educational expenditures under the F. Edward Hebert Armed Forces Health Professions Scholarship Program; Reserve Officers’ Training Corps programs for the Air Force, Army, and Navy/Marines; and higher education tuition assistance for the active duty Armed Forces.Other Grants. Includes Higher Education Grants for Indian Students; American Indian Scholarships; Indian Health Service Scholarships; National Science Foundation predoctoral fellowships (minority and general graduate); National Health Service Corps Scholarships; National Institutes of Health predoctoral individual awards; the Jacob K. Javits Fellowship Program; and college grants provided to volunteers in the AmeriCorps national service programs (funding began in 1994-95).Stafford, PLUS and Perkins Loans. Data provided by the Department of Education on education loan disbursements. Prior to 2007, Trends in Student Aid reported loan commitments, a larger number than disbursements including some loans approved but never disbursed. Earlier data have been adjusted to reflect only disbursements.Other Loans. Includes loans from the Health Professions Student Loan Program, Disadvantaged Student Loans, and the Nursing Student Loan Program.
Education Tax Benefits. Data on education tax credits are IRS estimates of the volume of Hope and Lifetime Learning credits claimed on taxable returns for tax years 1988 and later. Tax deductions are based on IRS Statistics of Income, with associated savings estimated by the College Board based on the marginal tax rates applied to the taxable income of the taxpayers in each income bracket claiming the deduction. Amounts are attributed to the academic year beginning in the calendar year during which the tax benefit was claimed. Estimates for 2008 are based on earlier data.
Subsidized Stafford Loans: Need-based student loans for which the federal government pays the interest while the student is in school and during a six-month grace period thereafter.
Unsubsidized Stafford Loans: Non-need-based student loans guaranteed by the federal government but with interest accruing during the in-school time period.
Full-Time Equivalent (FTE) Students: Enrollment numbers based on a federal formula that counts each part-time student as equivalent to one-third of a full-time student.
Graduate and Undergraduate Aid: The breakdown of aid between undergraduate and graduate students is estimated based on the National Postsecondary Student Aid Study (NPSAS) when not available from other sources.
Loan Totals: Nonfederal loans from private lenders are included in Table 1 as an important source of funding for students, but are not considered financial aid because they provide no subsidy to students. Figures 1, 6, 8, and 10 include nonfederal loans to give a more complete picture of student borrowing. Figures 2a, 2b, 11a and 11b measure financial aid amounts and therefore exclude nonfederal loans.
Inflation Adjustment: The Consumer Price Index for all urban dwellers (CPI-U) is used to adjust for inflation. We use the CPI-U in July of the year in which the academic year begins. See ftp://ftp.bls.gov/pub/special.requests/cpi/cpiai.txt for changes in the CPI-U over time.
Sources Campus-Based Aid (FWS, Perkins, and FSEOG) and ACG/SMART Grants: U.S. Department of Education, Annual Federal Program Databooks.Debt for Graduate and Undergraduate Students: Data come from the NPSAS, 2004 and 2008.Education Tax Benefits: Income Tax Returns, All Returns, Tables 1.3, 1.4, and 3.3 and additional Statistics of Income sources. Federal Family Education Loan and Ford Direct Student Loan Programs: Unpublished data from the U.S. Department of Education, Policy, Budget and Analysis staff and the National Student Loan Data System (NSLDS).Full-Time Equivalent (FTE) Enrollment: Based on unpublished computations by Integrated Postsecondary Education Data System (IPEDS) staff at the National Center for Education Statistics (NCES). Institutional Grants: Estimates based on IPEDS data through FY 2007 and data from the College Board’s Annual Survey of Colleges. These figures represent best approximations and are updated each year as additional information becomes available. LEAP and State Grant Programs: 2008-09: Estimates based on an annual College Board survey of all states, the District of Columbia and Puerto Rico. 1988-89 to 2007-08: 20th through 39th Annual Survey Reports of the National Association of State Student Grant and Aid Programs. LEAP figures are from unpublished data from the LEAP program manager at the U.S. Department of Education, Federal Student Aid Business Operations.Military: F. Edward Hebert Armed Forces Health Professions Scholarship amounts from the Office of the Assistant Secretary for Defense (Health Affairs). ROTC program data from the Air Force, Army and Navy program offices.Nonfederal Loans: Estimates based on an informal annual College Board survey of major private education loan providers, supplemented by data from annual reports, from NPSAS, 2008 and from Student Lending Analytics, and on information collected from staff of state-sponsored private loan programs or state grant agencies.Other Grants and Loans: Data collected through conversations and correspondence with the officials of the agencies that sponsor the programs. Pell Grant Program: Data from Policy, Budget, and Analysis Staff, U.S. Department of Education. Other data from Pell Grant End-of-Year Reports. Private and Employer Grants: Estimates based on data included in the National Postsecondary Student Aid Study (NPSAS) and on National Scholarship Provider’s Association surveys of major private student grant providers, supplemented by information from annual reports of selected scholarship providers and data from institutional financial aid offices. State Savings Plans: Data on assets in state savings plans and guaranteed tuition plans were provided by the National Association of State Treasurers/College Savings Plans Network. Veterans Benefits: Benefits Program series (annual publication for each fiscal year), Office of Budget and Finance, U.S. Veterans Administration and unpublished data from the same agency.
For more details on data sources and methodology, please see the Trends in Student Aid website at www.collegeboard.com/trends.
Notes and Sources
T R E N D S I N S T U D E N T A I D 2 0 0 9
19
T R E N D S I N H I G H E R E D U C A T I O N S E R I E S
This report provides the most recent and complete statistics available on student aid in the United States. Detailed historical data are available online at www.collegeboard.com/trends.
Trends in Student Aid was authored by College Board senior policy analyst Sandy Baum and consultants Kathleen Payea and Patricia Steele, with assistance from Jennifer Ma and senior adviser for student aid policy Kathleen Little.
Contact information for the authors:Sandy Baum, [email protected] Kathleen Payea, [email protected] Steele, [email protected]
Trends in Student Aid and its companion report, Trends in College Pricing, are supplemented by a website that makes detailed data available for reference and downloading. PDF versions of these reports, along with PowerPoint slides of all of the graphs, are available on the Web: www.collegeboard.com/trends.
Additional hard copies of the report can be ordered online or via e-mail: [email protected]. Tables, graphs, and data in this report or excerpts thereof may be reproduced or cited, for noncommercial purposes only, provided that the following attribution is included:
Source: Trends in Student Aid. © 2009 The College Board. www.collegeboard.com
AcknowledgmentsThe publication would not have been possible without the cooperation and support of many people at the College Board, including Tom Rudin, Sally Mitchell, Marilyn Cushman, Eleanor Vogelsang, Jonathan Van Arsdell and Edna DiFeo of the Washington Office. We would also like to thank Edna Johnson, the Marketing & Publication Services staff and the External Communications division. We are very grateful to Keryl Holman, Kimberly Gray Fess and the staff at Hawthorne Visual for their expert graphic design assistance.
We are grateful to all of those who contributed to the data collection for this publication, including state agency and special-aid program contacts, private lenders and experts from the U.S. Department of Education. Special thanks to Dan Madzelan, Mary Miller, Donald Conner, Greg Gerrans and Frank Morgan of the U.S. Department of Education, as well as Mike Solomon of the Illinois Student Aid Commission, Amy Weinstein of the National Scholarship Provider’s Association, Chris Hunter of the National Association of State Treasurers and Tim Ranzetta of Student Lending Analytics for their assistance.
The College BoardThe College Board is a not-for-profit membership association whose mission is to connect students to college success and opportunity. Founded in 1900, the College Board is composed of more than 5,600 schools, colleges, universities and other educational organizations. Each year, the College Board serves seven million students and their parents, 23,000 high schools, and 3,800 colleges through major programs and services in college readiness, college admission, guidance, assessment, financial aid, enrollment and teaching and learning. Among its best-known programs are the SAT®, the PSAT/NMSQT®, and the Advanced Placement Program® (AP®). The College Board is committed to the principles of excellence and equity and that commitment is embodied in all of its programs, services, activities and concerns.
The Washington Office of the College Board conducts research relevant to public policy issues in education. The office is located at 1233 20th Street NW, Suite 600, Washington, DC 20036-2375. Phone: 202-741-4700.
For further information, visitwww.collegeboard.com.
© 2009 The College Board. College Board, Advanced Placement Program, AP, SAT and the acorn logo are registered trademarks of the College Board. inspiring minds is a trademark owned by the College Board. PSAT/NMSQT is a registered trademark of the College Board and National Merit Scholarship Corporation. All other products and services may be trademarks of their respective owners.
090343272