Embed Size (px)
Citation preview

Trends inStudent Aid 2016
Trends in Higher Education Series

See the Trends in Higher Education website at trends.collegeboard.org
for figures and tables in this report and for more information and data.
About the College BoardThe College Board is a mission-driven not-for-profit organization that connects
students to college success and opportunity. Founded in 1900, the College
Board was created to expand access to higher education. Today, the membership
association is made up of over 6,000 of the world’s leading educational institutions
and is dedicated to promoting excellence and equity in education. Each year, the
College Board helps more than seven million students prepare for a successful
transition to college through programs and services in college readiness and
college success — including the SAT® and the Advanced Placement Program®.
The organization also serves the education community through research and
advocacy on behalf of students, educators, and schools. For further information,
visit www.collegeboard.org.
Trends in Higher EducationThe Trends in Higher Education publications include the annual Trends in College Pricing
and Trends in Student Aid reports and the Education Pays series, along with other research
reports and topical analysis briefs. These reports are designed to provide a foundation of
evidence to strengthen policy discussions and decisions.
The tables supporting all of the graphs in this report, a PDF version of the report, and
a PowerPoint file containing individual slides for all of the graphs are available on
our website trends.collegeboard.org.
Please feel free to cite or reproduce the data in this report for noncommercial purposes with proper attribution.
For inquiries or requesting hard copies, please contact: [email protected].
© 2016 The College Board. College Board, Advanced Placement Program, SAT, and the acorn logo are registered
trademarks of the College Board. All other products and services may be trademarks of their respective owners.

3
Highlights
Data on student aid for 2015-16 confirm that the dramatic increases in aid awarded in 2009-10 and 2010-11 were products of extreme economic circumstances, not harbingers of long-run changes in financing for postsecondary education. Both total federal education loans and federal loans per full-time equivalent (FTE) student declined for the fifth consecutive year in 2015-16. Total expenditures on federal Pell Grants peaked in 2010-11and have declined in each year since, but state grant aid hasincreased each year since 2011-12.
This year’s data confirm the importance of focusing not only on the financing of undergraduate education, but also on graduate education. Unlike loans to undergraduate students, both federal loans per graduate student and total graduate student federal borrowing rose in 2015-16, after a four-year decline. Graduate students have much higher average debt levels than undergraduate students and, while they have relatively low default rates, the generous availability of federal loans makes it critical to watch these patterns closely in future years.
TYPES OF STUDENT AIDIn 2015-16, undergraduate students received an average of $14,460 per FTE student in financial aid, including $8,390 in grants from all sources, $4,720 in federal loans, $1,290 in education tax credits and deductions, and $60 in Federal Work-Study (FWS).
– Graduate students received an average of $27,740 per FTEstudent in financial aid, including $9,300 in grants, $17,460 infederal loans, $890 in tax credits and deductions, and $90 in FWS.
– Undergraduate and graduate students received a total of $240.9billion in grants from all sources, FWS, federal loans, and federaltax credits and deductions. In addition, students borrowed about$11 billion from nonfederal sources.
– In 2015-16, loans from federal and nonfederal sources combinedconstituted 36% of the funds used by undergraduates tosupplement student and family resources — less than in anyother year over the past two decades. Grants constituted 55% ofthese funds — more than in any other year over this time period.
– In 2015-16, loans constituted 64% of the funds used bygraduate students to supplement their own resources; grantsconstituted 33%.
– Total federal grants to undergraduate students increased from$20.6 billion (in 2015 dollars) in 2005-06 to $41.7 billion in 2015-16,after peaking at $51.9 billion in 2010-11.
– Total federal loans to undergraduates increased by 25% between2005-06 and 2015-16, growing by 62% over the first five years, butdeclining by 23% between 2010-11 and 2015-16.
– FWS and Federal Supplemental Educational Opportunity Grants(FSEOG) combined provided $1.5 billion in 2015-16 — 1% of totalaid to undergraduate students.
– Federal education tax credits and deductions reach morestudents than subsidized and unsubsidized Direct Loanscombined, and almost twice as many students as Pell Grants.
SOURCES OF GRANT AIDGrant aid per FTE undergraduate student increased by $750 (10%) in 2015 dollars between 2010-11 and 2015-16, after increasing by $2,390 (46%) over the preceding five years.
– Grant aid per FTE graduate student increased by $1,830 (24%)in 2015 dollars between 2010-11 and 2015-16 after increasing by$1,150 (18%) over the preceding five years.
– In 2015-16, 34% of grant aid came from the federal government,43% from colleges and universities, 14% from employers andother private sources, and 8% from states.
– Total grant aid for postsecondary students increased by 89%between 1995-96 and 2005-06 (after adjusting for inflation) andby another 79% between 2005-06 and 2015-16, reaching a total of$125.9 billion.
– Almost all of the growth in total grant aid between 2005-06 and2015-16 was in the first half of the decade as FTE postsecondaryenrollment increased by 21%. From 2010-11 to 2015-16, enrollmentdeclined by 6% and grant aid increased by 5%.
– Total veterans education benefits increased from $4.5 billion (in2015 dollars) in 2005-06 to $12.1 billion in 2010-11 and to $14.3billion in 2015-16.
– Institutional grant aid from colleges and universities grew from$29.1 billion (in 2015 dollars) in 2005-06 to $42.0 billion in 2010-11and to $54.7 billion in 2015-16.
– Between 2008-09 and 2013-14, the increase in averageinstitutional grant aid for first-time full-time students at privatenonprofit master’s universities more than covered the increasein tuition and fees. Increases in grants covered 95% of the tuitionincrease at private bachelor’s and 73% at research institutions.
– Between 2008-09 and 2013-14, the increase in averageinstitutional grant aid covered 53% of the increase in tuition andfees at public doctoral and 34% at public master’s institutions.
– States provided grant aid averaging $750 per FTE undergraduate student in 2014-15, $10 below the 2007-08 peak, but an increase from $690 (in 2014 dollars) in 2011-12. State grant aid per FTE undergraduate student ranged from under $200 in 11 states to over $1,000 in 12 states.

4
PELL GRANTSTotal Pell Grant expenditures increased from $15.5 billion (in 2015 dollars) in 2005-06 to $39.1 billion in 2010-11, but declined to $28.2 billion by 2015-16.
– The number of Pell Grant recipients declined in 2015-16 for the fourth consecutive year, but the 7.6 million recipients represented a 46% increase from 5.2 million a decade earlier.
– The percentage of undergraduates receiving Pell Grants increased from 25% in 2005-06 to 37% in 2010-11, and was 33% in 2015-16.
– In 2014-15, 27% of recipients received the maximum Pell Grant of $5,730.
– The average Pell Grant per recipient was $2,371 (in 2015 dollars) in 1995-96. It increased to $3,000 in 2005-06, peaked at $4,196 in 2010-11, and decreased to $3,724 in 2015-16.
– Despite increasing by 21% in inflation-adjusted dollars between 2006-07 and 2016-17, the maximum Pell Grant covered 70% of average public four-year tuition and fees in 2006-07, but only 60% in 2016-17. It covered 18% of average private nonprofit four-year tuition and fees in 2006-07, and 17% in 2016-17.
DISTRIBUTION OF STUDENT AIDIn 2014-15, 45% of Pell Grant recipients were dependent students; three-quarters of this group came from families with incomes below $40,000.
– In 2014-15, 22% of all Pell Grant recipients were over the age of 30.
– In 2014, 24% of the savings from education tax credits and deductions went to households with adjusted gross income (AGI) between $100,000 and $180,000 and 23% went to households with AGI below $25,000.
– In 1994-95, only 13% of state grant aid for undergraduates was awarded without regard to students’ financial circumstances. By 2004-05, this percentage had risen to 27% and it was 24% in 2014-15.
– In 2014-15, 26 states considered students’ financial circumstances in allocating at least 95% of their state grant aid, but 14 states considered financial circumstances for less than half of their grants.
STUDENT BORROWINGIn 2015-16, total annual education borrowing declined for the fifth consecutive year. Students and parents borrowed $106.8 billion, down from a peak of $124.2 billion (in 2015 dollars) in 2010-11.
– Undergraduate students and parents borrowed 7% more in 2015-16 than in 2005-06, but 18% less than in 2010-11. Graduate students borrowed 40% more in 2015-16 than in 2005-06, but 6% less than in 2010-11.
– Total borrowing of federal Direct Subsidized and Unsubsidized Loans fell by 23% ($22.3 billion in 2015 dollars) between 2010-11 and 2015-16, but was still 26% ($15.1 billion) higher than in 2005-06.
– From 2010-11 to 2015-16, federal loans per FTE undergraduate student declined from $5,680 (in 2015 dollars) to $4,720. Federal loans per FTE graduate student fell from $18,700 to $17,460.
– In 2015-16, 31% of undergraduate students borrowed an average of $6,610 in Direct Loans, a decline from 37% borrowing an average of $6,920 in 2010-11, but an increase from 2005-06, when 29% of undergraduates borrowed an average of $6,060.
– Total Parent PLUS Loan borrowing rose from $10 billion (in 2015 dollars) in 2005-06 to $11.6 billion in 2010-11 and to $12 billion in 2015-16.
– Borrowing through the Grad PLUS program, which has supplemented Stafford Loans for graduate students since 2006-07, increased by 17% between 2010-11 and 2015-16.
– Nonfederal education loans fell from about $20.9 billion (in 2015 dollars) in 2005-06 to $7.9 billion in 2010-11. In 2015-16, the volume of these loans was an estimated $11.0 billion.
STUDENT DEBTIn 2015, 38% of all borrowers with outstanding student loan debt owed less than $10,000 and 16%, including 10% of undergraduate borrowers and 43% of graduate borrowers, owed $40,000 or more.
– In 2014-15, the 61% of bachelor’s degree recipients from public and private nonprofit institutions who borrowed graduated with an average of $28,100 in debt. Debt levels grew rapidly at public four-year colleges between 2009-10 and 2014-15, but grew slowly at private nonprofit institutions.
– In 2016, 25% of borrowers in repayment on outstanding federal Direct Student Loans were enrolled in plans that limit their monthly payments to an affordable percentage of their incomes. These borrowers held 43% of outstanding loan balances.
– Undergraduates who attended selective colleges and students who borrowed for graduate school have the largest debts and the lowest default rates. Students who borrowed to attend for-profit and public two-year colleges have the smallest debts and the highest default rates.
– Average debt for borrowers entering repayment in 2013-14 with only graduate school debt was $45,890, compared with $19,650 overall.
– Among borrowers who took out loans for graduate study only, 5% defaulted within five years, compared with 28% among all borrowers.
– Twenty-four percent of federal student loan borrowers who left school without a degree or certificate and entered repayment in 2011-12 defaulted on their loans within two years. Among those who completed their programs, the default rate was 9%.
– Default rates are highest for borrowers who leave school owing less than $5,000 and decline as loan balances increase.

5
Contents3 Highlights
7 Introduction
9 Total Student Aid TABLE 1 Total Student Aid and Nonfederal Loans in 2015 Dollars over Time
TABLE 2 Total Student Aid and Nonfederal Loans in Current Dollars over Time
10 Aid per Student FIGURE 1 Average Aid per Student over Time
TABLE 3 Average Aid per Student over Time: All Postsecondary Students, Undergraduate Students, and Graduate Students
11 Total Undergraduate Student Aid by Type
FIGURE 2A Total Undergraduate Student Aid by Source and Type, 2015-16
TABLE 1A Total Undergraduate Student Aid by Source and Type over Time
12 Total Graduate Student Aid by Type
FIGURE 2B Total Graduate Student Aid by Source and Type, 2015-16
TABLE 1B Total Graduate Student Aid by Source and Type over Time
13 Composition of Grants, Loans, and Other Aid
FIGURE 3 Composition of Total Aid and Nonfederal Loans over Time
TABLE 4 Total Aid and Nonfederal Loans in Current and Constant Dollars over Time: All Students, Undergraduate Students, and Graduate Students
14 Sources of Grant Aid FIGURE 4 Total Grant Aid by Source over Time
15 Types of Loans FIGURE 5 Total Federal and Nonfederal Loans by Type over Time
16 Federal Aid FIGURE 6A Number of Recipients by Federal Aid Program, 2015-16
FIGURE 6B Percentage Distribution of Federal Aid Funds by Sector, 2014-15
TABLE 5 Federal Aid per Recipient by Program over Time in Current and Constant Dollars
TABLE 7 Percentage Distribution of Federal Aid Funds by Sector over Time
17 Federal Loans FIGURE 7A Total Amount Borrowed in Federal Loans over Time
FIGURE 7B Average Annual Amount Borrowed in Federal Loans over Time
TABLE 6 Federal Loans in Current and Constant Dollars over Time: All Postsecondary Students, Undergraduate Students, and Graduate Students
18 Student Loans: Borrowing and Balances
FIGURE 8 Distribution of Borrowers by Average Balance, 2015
FIGURE 9 Percentage of Undergraduates Borrowing Federal Loans over Time
FIGURE 2013_9B Percentage of Undergraduate Students Borrowing Private Loans over Time
FIGURE 2013_9C Percentage of Undergraduate Students Borrowing Private Loans by Sector, Dependency Status, and Family Income, 2011-12
FIGURE 2015_19A Distribution of Outstanding Education Debt by Income Quartile, 2013
19 Outstanding Federal Loans FIGURE 10A Distribution of Outstanding Federal Direct Loan Dollars and Recipients by Repayment Plan
FIGURE 10B Repayment Status of Federal Education Loan Portfolio
20 Federal Student Loans: Balances and Default Rates
FIGURE 11A Median Debt by Institution Type, 2013-14
FIGURE 11B Five-Year Student Loan Default Rates by Institution Type over Time
FIGURE 2015_14B Aggregate Outstanding Federal Student Loan Balances by Sector over Time
21 Federal Student Loan Default Rates
FIGURE 12A Two-Year Default Rates by Sector and Completion Status
FIGURE 12B Share of Defaulters and Three-Year Default Rates by Loan Balance
FIGURE 2015_12 Federal Student Loan Default Rates by Sector over Time
FIGURE 2015_14A Two-Year Student Loan Default Rates by Degree Completion Status over Time
22 Cumulative Debt: Bachelor’s Degree Recipients
FIGURE 13 Cumulative Debt of Bachelor’s Degree Recipients at Four-Year Institutions over Time
FIGURE 2011_9A Cumulative Debt Among 2009 Bachelor’s Degree Completers by Sector
FIGURE 2014_14A Cumulative Debt of Bachelor’s Degree Recipients by Sector over Time
FIGURE 2014_14B Cumulative Debt of Bachelor’s Degree Recipients by Dependency Status and Family Income over Time
FIGURE 2015_16A Cumulative Debt of Bachelor’s Degree Recipients by Age
FIGURE 2015_16B Cumulative Debt of Bachelor’s Degree Recipients by Dependency Status
FIGURE 2015_17A Cumulative Debt of 2011-12 Bachelor’s Degree Recipients by Time Elapsed Between First Enrollment and Degree Completion
FIGURE 2015_17B Cumulative Debt of 2011-12 Bachelor’s Degree Recipients by Sector
FIGURE 2015_18 Cumulative Debt of 2011-12 Bachelor’s Degree Recipients by Race/Ethnicity
Figures and tables that are available online only at trends.collegeboard.org.

6
Contents — Continued
Cumulative Debt: Other Undergraduates
FIGURE 2011_9B Cumulative Debt Among 2009 Four-Year Institution Non-Completers by Sector
FIGURE 2014_15A Cumulative Debt of Associate Degree Recipients by Sector over Time
FIGURE 2014_15B Cumulative Debt of Certificate Recipients by Sector over Time
Cumulative Debt: Graduate Degree Recipients
FIGURE 2014_16A Cumulative Debt for Undergraduate and Graduate Studies over Time
FIGURE 2014_16B Composition of Cumulative Debt of 2011-12 Graduate Degree Recipients
FIGURE 2014_17A Doctoral Degree Recipient Debt, Percentage Borrowing and Average Borrowed, 2011-12
FIGURE 2014_17B Master’s Degree Recipient Debt, Percentage Borrowing and Average Borrowed, 2011-12
23 Sources of Grant Aid: Public Institutions
FIGURE 14 Sources of Grant Aid: Public Institutions
FIGURE 2015_22B Sources of Grant Aid by Dependency Status and Family Income, Public Four-Year Institutions, 2011-12
24 Sources of Grant Aid: Private Nonprofit Institutions
FIGURE 15 Sources of Grant Aid: Private Nonprofit Institutions
FIGURE 2015_22A Sources of Grant Aid by Dependency Status and Family Income, Private Nonprofit Four-Year Institutions, 2011-12
Grant Aid FIGURE 2015_20 Average Grant Aid at Four-Year Institutions: Need-Based, Non-Need-Based Meeting Need, and Exceeding Need, 2011-12
FIGURE 2015_21A Sources of Grant Aid for Full-Time Undergraduates by Sector, 2011-12
FIGURE 2015_21B Sources of Grant Aid by Dependency Status and Family Income, Public Two-Year and For-Profit Institutions, 2011-12
25 Pell Grants FIGURE 16 Undergraduate Enrollment and Percentage Receiving Pell Grants over Time
FIGURE 17 Maximum and Average Pell Grants over Time
26 Pell Grants FIGURE 18 Total Pell Grant Expenditures and Number of Recipients over Time
TABLE 8 Federal Pell Grant Awards in Current and Constant Dollars over Time
27 Pell Grants FIGURE 19 Maximum Pell Grant and Published Prices at Four-Year Institutions over Time
COLLEGE PRICING (TABLE 2)
Tuition and Fees and Room and Board over Time
28 Pell Grants FIGURE 20A Distribution of Pell Grant Recipients by Age, 2014-15
FIGURE 20B Distribution of Pell Grant Recipients by Dependency Status and Family Income, 2014-15
29 State Grants FIGURE 21A Need-Based and Non-Need-Based State Grants per Undergraduate Student over Time
FIGURE 21B Percentage of State Grant Based on Need by State, 2014-15
30 State Grants FIGURE 22A State Grant Aid per Undergraduate Student by State, 2014-15
FIGURE 22B State Grant Expenditures as a Percentage of Total State Support for Higher Education by State, 2014-15
FIGURE 2014_28 Average State Grant per Student by Dependency Status and Family Income over Time
31 Institutional Grants FIGURE 23 Average Institutional Grant Aid per First-Time Full-Time Student over Time
FIGURE 2014_29A Institutional Grant Aid by Dependency Status and Family Income at Public Four-Year Institutions, 2011-12
FIGURE 2014_30 Institutional Grant Aid by Tuition Level and Family Income at Private Nonprofit Four-Year Institutions, 2011-12
32 Education Tax Credits and Tuition Deductions
FIGURE 24A Distribution of Education Tax Benefits by Income, 2014
FIGURE 24B Total Education Tax Credits and Tuition Deductions over Time
College Savings Plans FIGURE 2015_32A Income Distribution of Families With and Without College Savings Accounts
FIGURE 2015_32B Total Assets in 529 College Savings Plans over Time
33 Notes and Sources TABLE A1 Consumer Price Index over Time
Figures and tables that are available online only at trends.collegeboard.org.

7
Introduction
Current perceptions of college affordability, student aid, and student debt are, to a great extent, outgrowths of the financial crisis of 2008 and the ensuing recession. Rapid changes in college enrollment and in the resources available to pay for higher education produced tremendous anxiety about the financial aid system and the general problems of college finance. During the recent recession, both enrollment and tuition prices increased rapidly, the size of the Pell Grant program nearly doubled, and education borrowing grew dramatically. Some of these trends have abated or even reversed in recent years, but the perception that higher education finance is in a state of escalating crisis persists.
Despite improvements in the economy, significant financial strains remain for student and families, for colleges and universities, and for the federal and state budgets on which we rely to fund significant portions of the cost of higher education.
Still, the data tell a somewhat more encouraging and more complicated story than popular discussions of affordability convey. As it has for over 30 years, Trends in Student Aid provides detailed information about the aid that undergraduate and graduate students receive from federal and state governments, their institutions, and their employers and other private sources. Together with its companion publication, Trends in College Pricing, this report can help inform the public discourse about how students pay for college.
Most of the conversation about financing higher education focuses on undergraduate students. This is not surprising since 86% of postsecondary students are undergraduates and undergraduate education is now considered necessary for economic success for most people. As Trends in Student Aid documents, the vast majority of grant aid goes to undergraduates. But graduate study is a prerequisite for many professions and master’s degrees are sometimes referred to as the “new” bachelor’s degrees. The federal government provides generous access to loans for graduate students and monitoring the amounts these students borrow and the outcomes they achieve is increasingly important.
THE CONTEXT OF COLLEGE FINANCE
The data in Trends in Student Aid 2016 indicate that student aid patterns continue to reflect the recovering economy. Undergraduate student borrowing, in total as well as per student and per borrower, continues to decline. The same is true of both total expenditures and the number of Pell Grant recipients. Yet grant aid in 2015-16 constitutes a higher percentage of the funds undergraduates use to supplement their own and their families’ resources than at any other time in at least 20 years. In contrast, graduate student borrowing is no longer declining, and the trend is worth watching closely in the coming years.
Total education borrowing fell in 2015-16 for the fifth consecutive year, leading to a 15% decline from the 2010-11 peak (Figure 5). Undergraduates and their parents borrowed 18% less in 2015-16 than five years earlier; graduate students borrowed 6% less. The Pell Grant program distributed 28% less in inflation-adjusted dollars in 2015-16 than in 2010-11 — but still 82% more than in 2005-06.
Continuing problems in the for-profit sector of postsecondary education, with declining enrollments and large institutions closing their doors, are likely to have a notable impact on the student aid scenario for some time to come. The rapid growth in this sector over the past decade, the high levels of debt accrued by these students, and the disproportionate share of student loan defaults associated with for-profit students have contributed significantly to the overall impression of skyrocketing student debt and prevalent student distress. If the institutions that survive and thrive in this sector are those that serve students well, the overall sense of crisis in higher education may well diminish.
STUDENT BORROWING AND STUDENT DEBT
As Figures 1 and 7B reveal, graduate students on average borrow much larger amounts than undergraduates. The share of aid in the form of grants rather than loans has increased steadily for undergraduates over the past decade. Graduate students are much more dependent than undergraduates on loan financing. The median debt level of $45,890 for those entering repayment in 2014 who borrowed only for graduate school, reported in Figure 11A, was about twice as high as for undergraduates at four-year institutions. Despite these differences in borrowing, graduate students are less likely to default on their loans. However, current law allows graduate students to borrow up to the cost of attendance less other financial aid for as long as they are in school. It also allows them to enroll in income-driven repayment plans and have remaining debt forgiven after 25 years. The implications of these policies for the long term are not yet clear, but it would not be surprising if difficulties emerge for both students and taxpayers.
TYPES OF STUDENT AID
Trends in Student Aid reports on a complex array of grant, loan, tax-based, and work programs that support postsecondary students. Grants and loans get most of the attention, but federal subsidies to students through tax credits and deductions now reach almost 14 million students at a total cost of more than $18 billion per year. Although many students and institutions value the Federal Work-Study program, only 632,000 students benefited from the $982 million federal allocation to this program in 2015-16 (Figure 6A and Table 1).

8
THE DISTRIBUTION OF STUDENT AID
The effectiveness of student aid in increasing educational opportunities depends to a great extent on how the funds are distributed to students in different financial circumstances. For many students with limited resources, grant aid makes pursuing postsecondary education a possibility for them. For some others, grant aid makes going to a particular institution or type of institution feasible. For the remaining students, aid is a pure subsidy, reducing the price of the educational paths they would take even without assistance.
Federal Pell Grants, which are targeted to low- and moderate-income students, constituted 26% of the grant aid received by undergraduates in 2015-16 (Table 1A). The distribution of federal education tax credits and deductions is quite different. As Figure 24A reveals, 24% of tax credits and 57% of savings from the tuition tax deductions go to taxpayers with incomes between $100,000 and $180,000.
About three-quarters of state grant dollars are allocated on the basis of financial need, but patterns vary considerably across states: 26 states considered students’ financial circumstances in allocating at least 95% of their state grant aid in 2014-15, while 14 states considered these circumstances for less than half of their aid (Figure 21B).
Monitoring the distribution of student aid is at least as important as monitoring its level in assessing how well these funds serve to help students overcome the financial barriers to postsecondary access and success.
THE STUDENT AID SYSTEM
Grant aid and tax benefits lower the overall price of education for students and families, making the net price of college less than the published price. Education loans do not lower the price, but they do make it possible to spread payments out over time. Work-study earnings frequently replace other earnings, but may increase the employment opportunities available for students. Understanding what the components of the system are; how grants, loans, tax benefits, and work-study aid are distributed; and how they have changed over time is critical.
But the growth in aid dollars has meaning only in the context of the growth in the price of college and in the number of students enrolling — information included in Trends in College Pricing 2016.
The student aid system is continually evolving. The federal government has recently made considerable progress in simplifying the application process. A potential policy direction on which consensus is growing is that instead of automatically
enrolling borrowers in a 10-year level payment plan if they do not actively choose an alternative, the federal government could enroll all borrowers in an income-driven plan basing monthly payments on their incomes. Enrollment in these plans is growing rapidly and, in 2015, 25% of borrowers, holding 43% of outstanding debt in repayment, participated in them (Figure 10A). But as this option becomes the norm, it will be critical to review the details of the plans, including the provisions for determining both monthly payments and eventual loan forgiveness.
Much of the data on which Trends in Student Aid is based comes from the Federal Student Aid office of the Department of Education, which provides precise information about the volume of federal student aid disbursed. The figures for 2014-15 in Trends in Student Aid 2016 are revisions of the numbers we published last year, based on the Department of Education’s updated data. Next year we will revise the 2015-16 figures in accordance with their updates.
Some of the other figures reported here are less precise. For example, the latest data on federal tax credits and deductions are for calendar year 2014. We have developed a methodology to translate IRS data into estimates of the benefits of these policies for tax filers. Similarly, our estimate of the volume of nonfederal student loans is based on reports from MeasureOne about their share of the market. We base our estimate of private grant aid on information from the 2012 National Postsecondary Student Aid Study and more recent information from the College Board’s Annual Survey of Colleges. These and other figures represent best estimates of the amount of aid students receive, rather than exact reporting.
Each year we review our data sources and methodology and make some modifications. Last year we moved from defining four-year colleges as those awarding any bachelor’s degrees, in accordance with the National Center for Education Statistics, to defining this sector as including only institutions where at least half the degrees awarded are bachelor’s degrees or higher. In Trends in Student Aid 2016, we have modified our analysis of federal tax credits and deductions based on new evidence.
The tables supporting all of the graphs in the Trends publications, PDF versions of the publications, PowerPoint files containing individual slides for all of the graphs, and other detailed data on student aid and college pricing are available on our website at trends.collegeboard.org. Please feel free to cite or reproduce the data in Trends for noncommercial purposes with proper attribution.

9For detailed data behind the graphs and additional information, please visit: trends.collegeboard.org.
Total Student Aid In 2015-16, undergraduate and graduate students received $240.9 billion in student aid in the form of grants from all sources, Federal Work-Study, federal loans, and federal tax credits and deductions.
– The federal government’s share of total student aid increased from 67% in 2005-06 to 74% in 2010-11, but had fallen back to 66% by 2015-16.
– The share of federal student aid in the form of grants increased from 21% in 2005-06 to 28% in 2010-11 and was 27% in 2015-16. Loans declined from 70% to 60% to 61% of federal aid over these years.
– Nonfederal education loans are loans students borrow from banks, credit unions, and other private lenders, including some states and postsecondary institutions. These loans, which are
not part of the student aid system and typically do not involve subsidies, fell from about $21 billion (in 2015 dollars) in 2005-06 to $8 billion in 2010-11 and were about $11 billion in 2015-16.
ALSO IMPORTANT:
– In 2015-16, undergraduate students received 76% ($184.1 billion) of total student aid, including 96% of federal grants and 63% of federal loans. They received 85% of total grant aid from all sources and 65% of all loans, including nonfederal loans. The remainder of the aid funded graduate students. (Tables 1A and 1B online)
TABLE 1 Student Aid and Nonfederal Loans in 2015 Dollars (in Millions), 2005-06 to 2015-16
Academic Year
05-06 06-07 07-08 08-09 09-10 10-11 11-12 12-13 13-14 14-15Preliminary
15-1610-Year
% ChangeFederal Aid
GrantsPell Grants $15,503 $15,031 $16,815 $19,845 $33,238 $39,055 $35,467 $33,397 $32,158 $30,678 $28,232 82%FSEOG $951 $904 $883 $822 $815 $829 $777 $764 $749 $734 $737 −22%LEAP $79 $76 $74 $69 $70 $67 — — — — — —Academic Competitiveness Grants — $284 $354 $368 $531 $606 — — — — — — SMART Grants — $240 $235 $217 $398 $474 — — — — — — Veterans and Military $4,501 $4,565 $4,694 $5,165 $9,959 $12,138 $11,924 $13,503 $13,554 $13,737 $14,281 217%Total Federal Grants $21,034 $21,100 $23,055 $26,487 $45,011 $53,169 $48,169 $47,664 $46,461 $45,150 $43,250 106%
LoansPerkins Loans $1,946 $1,898 $1,585 $1,043 $907 $938 $1,002 $1,052 $1,197 $1,162 $1,166 −40%Subsidized Stafford $29,850 $29,335 $33,338 $35,835 $42,190 $44,457 $42,861 $28,960 $27,015 $24,704 $22,981 −23%Unsubsidized Stafford $28,835 $28,555 $31,381 $43,859 $51,607 $51,649 $49,604 $58,849 $56,523 $52,820 $50,795 76%Parent PLUS $9,995 $9,535 $8,816 $8,341 $9,866 $11,594 $11,701 $10,231 $10,506 $10,735 $11,999 20%Grad PLUS — $2,452 $3,528 $4,694 $6,299 $7,618 $7,901 $7,921 $8,283 $8,363 $8,886 — Total Federal Loans $70,626 $71,775 $78,648 $93,772 $110,868 $116,256 $113,068 $107,012 $103,525 $97,785 $95,826 36%
Federal Work-Study $1,202 $1,142 $1,116 $1,057 $1,078 $1,067 $1,027 $1,005 $1,002 $983 $982 −18%Education Tax Benefits $7,814 $7,721 $7,650 $11,623 $18,191 $21,689 $20,543 $18,435 $18,477 $18,255 $18,226 133%
Total Federal Aid $100,675 $101,738 $110,469 $132,939 $175,148 $192,180 $182,807 $174,117 $169,464 $162,172 $158,284 57%State Grants $8,602 $8,963 $9,220 $9,188 $9,834 $10,117 $9,929 $9,991 $10,153 $10,526 $10,526 22%Institutional Grants $29,082 $30,683 $32,703 $34,374 $38,844 $41,954 $44,009 $47,151 $49,368 $51,502 $54,705 88%Private and Employer Grants $11,517 $12,243 $13,199 $13,486 $13,786 $14,548 $14,884 $15,188 $16,398 $16,801 $17,426 51%
Total Federal, State, Institutional, and Other Aid $149,877 $153,627 $165,591 $189,987 $237,613 $258,799 $251,629 $246,446 $245,384 $241,001 $240,941 61%
Nonfederal Loans $20,873 $23,725 $25,606 $12,553 $8,976 $7,947 $7,984 $9,469 $9,726 $10,276 $10,970 −47%State- and Institution-Sponsored $1,331 $1,442 $1,432 $1,378 $1,441 $1,346 $1,276 $1,198 $1,165 $1,132 $1,080 −19%Private Sector $19,542 $22,282 $24,175 $11,175 $7,536 $6,601 $6,708 $8,271 $8,561 $9,144 $9,890 −49%
Total Student Aid and Nonfederal Loans $170,750 $177,352 $191,197 $202,540 $246,589 $266,747 $259,613 $255,915 $255,110 $251,276 $251,911 48%
NOTES: Table 1 excludes a variety of small federal grant and loan programs. The latest available data for education tax benefits are for calendar year 2014. Later figures are estimates. Federal Supplemental Educational Opportunity Grant (FSEOG) and Federal Work-Study (FWS) funds reflect federal allocations and do not include the required matching funds from institutions. Components may not sum to totals because of rounding.
SOURCES: See page 34 for a list of sources for data included in Table 1.

10 For detailed data behind the graphs and additional information, please visit: trends.collegeboard.org.
Aid per StudentIn 2015-16, undergraduate students received an average of $14,460 in aid per full-time equivalent (FTE) student, including $8,390 in grants from all sources, $4,720 in federal loans, and $1,350 in a combination of tax credits and deductions and Federal Work-Study (FWS).
– Between 2010-11 and 2015-16, federal loans per FTE undergraduate student declined by $960, from $5,680 (in 2015 dollars) to $4,720.
– Grant aid per undergraduate student increased by $750 (in 2015 dollars) between 2010-11 and 2015-16.
– In 2015-16, graduate students received an average of $27,740 in aid per FTE student, including $9,300 in grants from all sources, $17,460 in federal loans, and $980 in a combination of tax credits and deductions and FWS.
– Between 2010-11 and 2015-16, federal loans per FTE graduate student declined by $1,240, from $18,700 (in 2015 dollars) to $17,460.
– Grant aid per graduate student increased by $1,830 (in 2015 dollars) between 2010-11 and 2015-16, primarily because of large increases in veterans and military benefits and institutional grant aid.
ALSO IMPORTANT:
– All of the “Other Aid” per FTE undergraduate student in 1995-96 was from FWS. In 2005-06, 87% of “Other Aid” ($590 out of $680) was from education tax credits and deductions and 13% ($90) was from FWS. In 2015-16, 96% ($1,290) was from tax benefits and 4% ($60) was from FWS.
– The $70 of “Other Aid” per FTE graduate student in 1995-96 was from FWS. In 2005-06, 90% of “Other Aid” ($690 out of $770) was from education tax credits and deductions and 10% ($80) was from FWS. In 2015-16, 91% ($890) was from tax benefits and 9% ($90) was from FWS.
FIGURE 1 Average Aid per Full-Time Equivalent (FTE) Student in 2015 Dollars,
1995-96 to 2015-16
NOTES: Loans reported here include only federal loans to students and parents. Grants from all sources are included. “Other Aid” includes federal education tax credits and deductions and Federal Work-Study. Dollar values are rounded to the nearest $10.
SOURCE: Trends in Student Aid website (trends.collegeboard.org), Table 3.
$3,590
$5,250
$7,640$8,390
$4,250
$5,680
$4,720
$3,210
$100
$70$770
$6,320
$7,470
$9,300
$980$1,200
$13,020
$18,700
$17,460
$4,130
$9,130
$1,480 $1,350$680
$0
$4,000
$8,000
$12,000
$16,000
$2,000
$6,000
$10,000
$14,000
$18,000
Average Grant Aid
Average Federal Loans
Average Federal Loans
Average Grant Aid
Average Other Aid
Average Other Aid
Aver
age
Aid
in 2
015
Dol
lars
Aver
age
Aid
in 2
015
Dol
lars
Undergraduate Students
Graduate Students
$0
$4,000
$2,000
$8,000
$12,000
$16,000
$18,000
$14,000
$10,000
$6,000
15-1613-1411-1209-1007-0805-0603-0401-0299-0097-9895-96
15-1613-1411-1209-1007-0805-0603-0401-0299-0097-9895-96

11For detailed data behind the graphs and additional information, please visit: trends.collegeboard.org.
Total Undergraduate Student Aid by TypeIn 2015-16, grants from all sources combined provided 58% of undergraduate aid, although the federal student loan program was the largest single aid program.
– Federal Work-Study and Federal Supplemental Educational Opportunity Grants (FSEOG) combined provided only $1.5 billion — 1% of total aid to undergraduate students.
– Total federal grants to undergraduate students were twice as large in inflation-adjusted dollars in 2015-16 as in 2005-06, increasing from $20.6 billion (in 2015 dollars) to $41.7 billion over the decade, after peaking at $51.9 billion in 2010-11.
– Total federal loans to undergraduates increased by 25% over the decade from 2005-06 to 2015-16, growing by 62% over the first five years, but declining by 23% between 2010-11 and 2015-16.
– In 2015-16, institutions provided an estimated $43 billion in grant aid to undergraduate students — 23% of total undergraduate aid and 40% of undergraduate grant aid.
ALSO IMPORTANT:
– In fall 2014, 13.0 million (86%) of the 15.0 million full-time equivalent postsecondary students were undergraduates. (Digest of Education Statistics 2015, Table 303.60; calculations by the authors)
– Undergraduate students are considered dependent, with their aid eligibility a function of their own and their parents’ financial circumstances, unless they are at least 24 years of age, are married, have legal dependents, are veterans or on active duty, or are orphans, wards of the court, or homeless unaccompanied youth.
FIGURE 2A Total Undergraduate Student Aid by Source and Type (in Billions),
2015-16
NOTES: Percentages on the vertical axis represent each type of aid as a percentage of the total. Loans reported here include only federal loans to students and parents. Percentages may not sum to 100 because of rounding.
SOURCE: Trends in Student Aid website (trends.collegeboard.org), Table 1A.
1995-96 2000-01 2005-06 2010-11 2011-12 2012-13 2013-14 2014-15Preliminary
2015-16Total Federal Grants $11,698 $14,236 $20,633 $51,930 $46,905 $46,233 $45,024 $43,694 $41,736
Total Federal Loans $28,333 $32,725 $47,953 $77,613 $75,312 $70,764 $67,131 $62,598 $60,042
Federal Work-Study $869 $1,150 $1,063 $946 $918 $901 $810 $797 $797
Education Tax Benefits — $4,995 $6,608 $19,321 $18,694 $16,730 $16,725 $16,481 $16,403
Total Federal Aid $40,900 $53,105 $76,257 $149,810 $141,829 $134,627 $129,690 $123,570 $118,978
State Grants $4,448 $6,303 $8,384 $9,982 $9,774 $9,830 $9,990 $10,357 $10,357
Institutional Grants $12,586 $16,710 $22,572 $32,845 $34,592 $37,062 $38,805 $40,482 $43,000
Private and Employer Grants $2,985 $5,515 $7,642 $9,604 $10,041 $10,246 $11,062 $11,334 $11,756
Total Federal, State, Institutional, and Private Aid $60,919 $81,633 $114,856 $202,241 $196,236 $191,765 $189,546 $185,742 $184,091
$1.5
$10.4
$11.8
$12.8
$16.4
Billions of Dollars
$28.2
$60.0
$43.0
Federal Loans (33%)
Institutional Grants (23%)
FederalPell Grants (15%)
Federal Education TaxCredits & Deductions (9%)
Veterans andMilitary Grants (7%)
Private and EmployerGrants (6%)
State Grants (6%)
Federal Work-Studyand FSEOG (1%)
$0 $10 $20 $30 $40 $50 $60 $70
NOTE: Components may not sum to totals because of rounding.
TABLE 1A Total Undergraduate Student Aid by Source and Type in 2015 Dollars (in Millions), 1995-96 to 2015-16, Selected Years

12 For detailed data behind the graphs and additional information, please visit: trends.collegeboard.org.
Total Graduate Student Aid by TypeIn 2015-16, graduate students borrowed $35.8 billion in federal loans, which accounted for 63% of the financial aid they received.
FIGURE 2B Total Graduate Student Aid by Source and Type (in Billions), 2015-16
NOTES: Percentages on the vertical axis represent each type of aid as a percentage of the total. Loans reported here include only federal loans to students and parents. Percentages may not sum to 100 because of rounding.
SOURCE: Trends in Student Aid website (trends.collegeboard.org), Table 1B.
1995-96 2000-01 2005-06 2010-11 2011-12 2012-13 2013-14 2014-15Preliminary
2015-16Total Federal Grants $173 $227 $401 $1,239 $1,264 $1,431 $1,437 $1,456 $1,514
Total Federal Loans $12,164 $14,683 $22,673 $38,644 $37,756 $36,249 $36,394 $35,187 $35,784
Federal Work-Study $93 $135 $139 $121 $110 $105 $192 $186 $185
Education Tax Benefits — $821 $1,205 $2,368 $1,849 $1,705 $1,752 $1,774 $1,823
Total Federal Aid $12,430 $15,866 $24,418 $42,371 $40,979 $39,490 $39,774 $38,603 $39,306
State Grants $112 $162 $218 $134 $155 $161 $163 $168 $168
Institutional Grants $3,752 $5,719 $6,509 $9,109 $9,417 $10,089 $10,564 $11,020 $11,706
Private and Employer Grants $1,460 $2,565 $3,876 $4,944 $4,843 $4,942 $5,336 $5,467 $5,671
Total Federal, State, Institutional, and Private Aid $17,754 $24,311 $35,021 $56,559 $55,393 $54,682 $55,837 $55,259 $56,851
$0 $5 $10 $15 $20 $25 $30 $35 $40
$0.2
$0.2
$1.8
$1.5
Billions of Dollars
$5.7
$35.8
$11.7
Federal Loans (63%)
Institutional Grants (21%)
Private and EmployerGrants (10%)
Federal Education TaxCredits & Deductions (3%)
Federal Grants (3%)
State Grants (<1%)
Federal Work-Study (<1%)
NOTE: Components may not sum to totals because of rounding.
– Graduate student federal borrowing increased from $22.7 billion in 2005-06 (in 2015 dollars) to $38.6 billion in 2010-11, but declined to $35.8 billion in 2015-16.
– Some graduate students rely on assistantships provided by their universities that include stipends for living expenses, which were not included in the $11.7 billion of institutional grant aid in 2015-16.
– Federal grants accounted for only 3% of graduate student aid in 2015-16, but increased from $401 million (in 2015 dollars) in 2005-06 to $1.5 billion in 2015-16 because of the Post-9/11 GI Bill.
– Employer and private grants constituted 30% of the grant aid supporting graduate students in 2015-16.
ALSO IMPORTANT:
– In fall 2014, 2.0 million (14%) of the 15.0 million full-time equivalent postsecondary students were graduate students. (Digest of Education Statistics 2015, Table 303.60; calculations by the authors)
– In 2005-06, 42% of federal loans to graduate students were subsidized and 55% were unsubsidized Stafford Loans. In 2015-16, 75% of federal loans to graduate students were unsubsidized Stafford and 25% were Grad PLUS Loans. (Table 1B online)
– All graduate students are considered independent for federal financial aid purposes; their eligibility for need-based aid depends only on their own income and assets (and those of their spouses if married). The elimination of subsidized Stafford Loans for graduate students in 2012-13 eliminated virtually all need-based federal aid for these students.
TABLE 1B Total Graduate Student Aid by Source and Type in 2015 Dollars (in Millions), 1995-96 to 2015-16, Selected Years

13For detailed data behind the graphs and additional information, please visit: trends.collegeboard.org.
Composition of Grants, Loans, and Other AidIn 2015-16, loans from federal and nonfederal sources combined constituted 36% of the funds used by undergraduates to supplement student and family resources — the lowest proportion in at least two decades.
– In 2015-16, grants constituted 55% of the funds used by undergraduates to supplement student and family resources, the highest proportion in at least the past two decades.
– In 2015-16, loans constituted 64% of the funds used by graduate students to supplement personal resources. This percentage was 71% in 1995-96 and 68% in 2005-06.
– In 2015-16, the combination of federal tax credits and deductions and Federal Work-Study constituted 9% of all student aid and nonfederal loans for undergraduate students and 3% for graduate students.
ALSO IMPORTANT:
– For undergraduate students, total grant aid increased by 80% and total loan volume increased by 7% between 2005-06 and 2015-16, after adjusting for inflation. As a result, grants as a percentage of total funds increased from 45% to 55% during this period. (Table 1A online)
– For graduate students, total grant aid increased by 73% and total loan volume increased by 40% between 2005-06 and 2015-16. (Table 1B online)
0%3%
29% 28%33%
3%
71%68%
64%
1%
6%9%
36%
55%
47% 45%
51% 49%
Grants
Loans
Other Aid
Undergraduate Students
Graduate Students
Perc
enta
ge o
f Tot
al F
unds
Perc
enta
ge o
f Tot
al F
unds
0%
20%
40%
60%
80%
100%
Other Aid
Loans
Grants
0%
20%
40%
60%
80%
100%
15-1613-1411-1209-1007-0805-0603-0401-0299-00 97-98 95-96
15-1613-1411-1209-1007-0805-0603-0401-0299-00 97-98 95-96
FIGURE 3 Composition of Total Aid and Nonfederal Loans, 1995-96 to 2015-16
NOTES: Nonfederal loans are included as an indication of the total amounts that students and parents borrow through education loans. “Other Aid” includes Federal Work-Study (FWS) and federal education tax credits and deductions.
SOURCE: Trends in Student Aid website (trends.collegeboard.org), Table 4.

14 For detailed data behind the graphs and additional information, please visit: trends.collegeboard.org.
Sources of Grant AidFederal grants increased from 30% to 44% of all grant aid for undergraduate and graduate students between 2005-06 and 2010-11, but declined to 34% of the total in 2015-16.
– Total federal grant aid grew by 153% between 2005-06 and 2010-11 — from $21.0 billion (in 2015 dollars) to $53.2 billion. Over the next five years, this aid declined by 19% in inflation-adjusted dollars to $43.2 billion.
– The total amount of grant aid supporting postsecondary students increased by 89% between 1995-96 and 2005-06 (after adjusting for inflation) and by another 79% between 2005-06 and 2015-16, reaching a total of $125.9 billion.
– Almost all of the growth in total grant aid over the last decade occurred between 2005-06 and 2010-11 as full-time equivalent (FTE) enrollment increased by 21%. Between 2010-11 and 2015-16, FTE enrollment declined by 6% and total grant aid increased by just 5%.
ALSO IMPORTANT:
– Grant aid for veterans and active military members increased from 23% of federal grant aid in 2010-11 to 33% in 2015-16. At the same time, Pell Grants declined from 73% to 65% of the total. (Table 1)
– The composition of grant aid for graduate students is quite different from that for undergraduate students — and from the totals in Figure 4. In 2015-16, 8% of graduate student grant aid came from the federal government, 61% from institutions, 30% from employers and other private sources, and 1% from states. For undergraduate students, the percentages were 39%, 40%, 11%, and 10%. (Tables 1A and 1B)
FIGURE 4 Total Grant Aid in 2015 Dollars by Source, 1995-96 to 2015-16
NOTE: Percentages may not sum to 100 because of rounding.
SOURCES: See page 34 for a list of sources for grants included in Figure 4.
32%
44%
12%12%
31%
45%
13%12%
30%
44%
14%
12%
30%
44%
14%12%
28%
45%
16%
12%
28%
44%
16%
13%
31%
41%
15%
12%
33%
39%
15%
13%
33%
39%
15%
12%
32%
40%
16%
12%
30%
41%
16%
12%
29%
42%
17%
12%
29%
42%
17%
12%
32%
41%
16%
11%
42%
36%
13%
9%
44%
35%
12%
8%
41%
38%
13%
8%
40%
39%
13%
8%
38%
40%
13%
8%
36%
42%
14%
8%
34%
43%
14%
8%
$37.2 $39.1$42.1
$46.2$49.0
$51.4$55.7
$60.4$65.4
$68.5 $70.2$73.0
$78.2
$83.5
$107.5
$119.8$117.0
$120.0$122.4 $124.0 $125.9
Gra
nts
in B
illio
ns o
f 201
5 D
olla
rs
$0
$20
$40
$60
$80
$100
15-1614-1513-1412-1311-1210-1109-1008-0907-0806-0705-0604-0503-0402-0301-0200-0199-0098-9997-9896-9795-96
$120State Grants
Private and Employer Grants
Institutional Grants
Federal Grants
15For detailed data behind the graphs and additional information, please visit: trends.collegeboard.org.
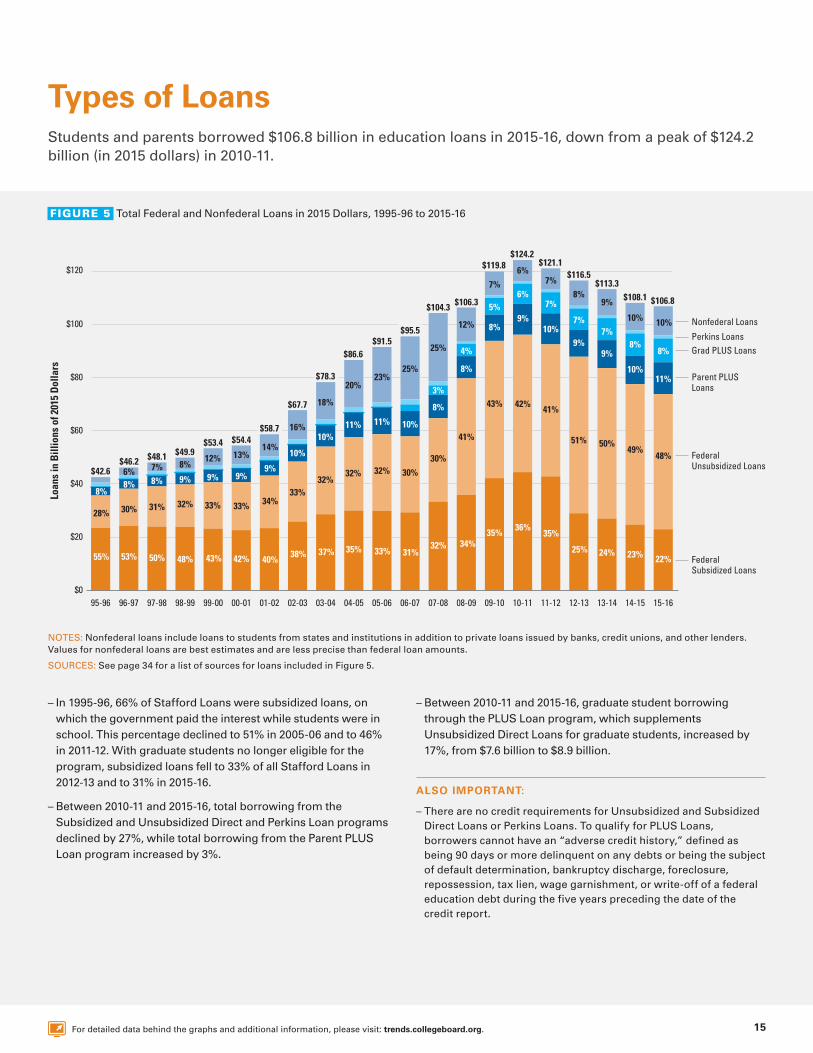
Types of LoansStudents and parents borrowed $106.8 billion in education loans in 2015-16, down from a peak of $124.2 billion (in 2015 dollars) in 2010-11.
– In 1995-96, 66% of Stafford Loans were subsidized loans, on which the government paid the interest while students were in school. This percentage declined to 51% in 2005-06 and to 46% in 2011-12. With graduate students no longer eligible for the program, subsidized loans fell to 33% of all Stafford Loans in 2012-13 and to 31% in 2015-16.
– Between 2010-11 and 2015-16, total borrowing from the Subsidized and Unsubsidized Direct and Perkins Loan programs declined by 27%, while total borrowing from the Parent PLUS Loan program increased by 3%.
– Between 2010-11 and 2015-16, graduate student borrowing through the PLUS Loan program, which supplements Unsubsidized Direct Loans for graduate students, increased by 17%, from $7.6 billion to $8.9 billion.
ALSO IMPORTANT:
– There are no credit requirements for Unsubsidized and Subsidized Direct Loans or Perkins Loans. To qualify for PLUS Loans, borrowers cannot have an “adverse credit history,” defined as being 90 days or more delinquent on any debts or being the subject of default determination, bankruptcy discharge, foreclosure, repossession, tax lien, wage garnishment, or write-off of a federal education debt during the five years preceding the date of the credit report.
FIGURE 5 Total Federal and Nonfederal Loans in 2015 Dollars, 1995-96 to 2015-16
NOTES: Nonfederal loans include loans to students from states and institutions in addition to private loans issued by banks, credit unions, and other lenders. Values for nonfederal loans are best estimates and are less precise than federal loan amounts.
SOURCES: See page 34 for a list of sources for loans included in Figure 5.
$0
$20
$40
$60
$80
$100
$120
Loan
s in
Bill
ions
of 2
015
Dol
lars
53%55%
28%
50%
30%
8%8%
48%
31%
8%7%6%
43%
32%
9%
8%
42%
33%
9%
12%
40%
33%
9%
13%
38%
34%
9%
14%
37%
33%
10%
16%
35%
32%
10%
18%
33%
32%
11%
20%
31%
32%
11%
23%
32%
30%
10%
25%
34%
30%
8%
3%
25%
35%
41%
8%
4%
12%
36%
43%
8%
5%
7%
35%
42%
9%
6%
6%
25%
41%
10%
7%
7%
24%
51%
9%
7%
8%
23%
50%
9%
7%
9%
22%
49%
10%
10%
8%
48%
8%
10%
11%
$42.6$46.2 $48.1 $49.9
$53.4 $54.4$58.7
$67.7
$78.3
$86.6$91.5
$95.5
$104.3 $106.3
$119.8$124.2
$121.1$116.5
$113.3$108.1 $106.8
Nonfederal Loans
Perkins LoansGrad PLUS Loans
Parent PLUS Loans
Federal Unsubsidized Loans
Federal Subsidized Loans
15-1614-1513-1412-1311-1210-1109-1008-0907-0806-0705-0604-0503-0402-0301-0200-0199-0098-9997-9896-9795-96

16 For detailed data behind the graphs and additional information, please visit: trends.collegeboard.org.
Federal AidFederal education tax credits and deductions reach more students than the Subsidized and Unsubsidized Direct Loan programs combined and almost twice as many students as the Pell Grant program.
– An estimated 13.8 million students benefited from federal education tax credits and deductions in 2014-15.
– In 2014-15, public two-year college students, constituting 32% of full-time equivalent (FTE) undergraduate enrollment, received 35% of Pell Grant funds. Students in this sector received less than their proportionate share of funds from all other federal student aid programs.
– In 2014-15, students in the private nonprofit sector accounted for 18% of undergraduate and 21% of total postsecondary FTE enrollment. They received 68% of Grad PLUS, 51% of Perkins Loans, and 40% of Federal Work-Study funds.
ALSO IMPORTANT:
– Because some students borrow from both programs, in 2015-16, the total number of borrowers in the Subsidized and Unsubsidized Loan programs was 8.6 million — less than the sum of the number of recipients in the two programs. (Table 6 online)
– Pell Grants, FSEOG, and Direct Subsidized Loans are for undergraduates only. Grad PLUS Loans are for graduate students only. Parent PLUS Loans are for parents of undergraduate students. FWS, Perkins Loans, Direct Unsubsidized Loans, and Post-9/11 GI Bill benefits are available to both undergraduate and graduate students.
– In 2015-16, 7.6 million students received Pell Grants, compared to 5.2 million a decade earlier. (Figure 18)
– The number of students receiving FWS declined from 711,000 in 2005-06 to 632,000 in 2015-16. (Table 5 online)
– In 2012-13, 41% of Post-9/11 Veterans Benefits went to students in the for-profit sector. (U.S. Senate HELP Committee, 2014, Is the New G.I. Bill Working?)
NOTES: Data on tax benefits are estimated for 2014-15. FSEOG and FWS amounts represent federal funds only. Institutions provide matching funds so the awards that students receive under these programs are larger than these federal aid amounts. Perkins Loans are made from revolving funds on campus. No new federal outlays have been provided since 2005-06, but originally the funds came partly from the federal government and partly from institutional sources.
SOURCES: See page 34 for a list of sources of data on federal aid programs.
NOTES: Precise data on the current distribution of Post-9/11 GI Bill benefits are not available. Excludes aid to students enrolled in public less-than-two-year colleges and to students enrolled in foreign institutions. Percentages may not sum to 100 because of rounding.
SOURCES: See page 34 for a list of sources of data on federal aid programs.
FIGURE 6A Number of Recipients by Federal Aid Program (with Average Aid
Received), 2015-16
FIGURE 6B Percentage Distribution of Federal Aid Funds by Sector, 2014-15
Num
ber o
f Rec
ipie
nts
(in M
illio
ns)
13.8million
7.6million
6.0million
7.3million
1.6million
632,000 848,000 485,0000
2.0
4.0
6.0
8.0
10.0
12.0
14.0
PerkinsLoans
($2,400)
Post-9/11GI Bill
Veterans Benefits($14,570)
FederalWork-Study
($1,550)
FSEOG ($450)
DirectUnsubsidized
Loans($6,980)
DirectSubsidized
Loans($3,800)
FederalPell
Grant($3,720)
FederalEducation
Tax Benefits($1,320)
Federal Aid Programs (with Average Aid per Recipient)
35% 31% 15% 18%
24% 29% 32% 14%
18% 36% 40% 6%1%
45% 51% 3%
15% 41% 24% 19%
7% 39% 35% 19%
48% 43% 7%
26% 68% 6%
Percentage of Aid
For-ProfitPrivate NonprofitPublic Four-YearPublic Two-Year
1%
Grad PLUS Loans
ParentPLUS Loans
DirectUnsubsidized Loans
DirectSubsidized Loans
Perkins Loans
Federal Work-Study
FSEOG
Pell Grants
SOURCE: NCES, IPEDS enrollment data.
FTE Undergraduate
StudentsAll FTE
StudentsPublic Two-Year 32% 28%
Public Four-Year 40% 41%
Private Nonprofit Four-Year 18% 21%
For-Profit 10% 10%
Distribution of Fall 2014 Enrollment by Sector

17For detailed data behind the graphs and additional information, please visit: trends.collegeboard.org.
Federal LoansAfter increasing by 48% in inflation-adjusted dollars between 2000-01 and 2005-06 and by another 65% over the next five years, total annual federal borrowing by undergraduates and their parents declined by 23% between 2010-11 and 2015-16.
FIGURE 7A Total Amount Borrowed from Federal Subsidized, Unsubsidized, and PLUS Loans in Millions of 2015 Dollars, 2000-01 to 2015-16, Selected Years
FIGURE 7B Average Annual Amount Borrowed in Federal Direct (Subsidized and Unsubsidized) and PLUS Loans in 2015 Dollars, 2000-01 to 2015-16, Selected Years
– After increasing by 55% in inflation-adjusted dollars between 2000-01 and 2005-06 and by another 73% over the next five years, total annual federal borrowing by graduate students declined by 7% between 2010-11 and 2015-16.
– Total federal loans to graduate students increased from 31% to 38% of total student borrowing between 2000-01 and 2015-16.
– In 2010-11, undergraduates in the Direct Loan programs borrowed an average of $6,920 in 2015 dollars — $760 (12%) more than a decade earlier. The average amount borrowed declined by $310 (4%) between 2010-11 and 2015-16.
– The number of parents borrowing PLUS Loans in 2015-16 was 11% of the number of undergraduates taking federal Direct Loans. However, the average parent loan was $15,250, about 2.3 times as much as the average undergraduate student loan.
SOURCE: Trends in Student Aid website (trends.collegeboard.org), Table 6.
Number of Borrowers (in Thousands), 2000-01 to 2015-16, Selected Years
2015-16 2010-11 2005-06 2000-01 2015-16 2010-11 2005-06 2000-01
$31,470
PLUSUnsubsidizedSubsidized
$46,460
$76,870
$59,070
$14,360
$22,210
$38,440 $35,590
Undergraduate Graduate
Tota
l Ann
ual A
mou
nt B
orro
wed
in M
illio
ns o
f 201
5 D
olla
rs
$0
$20,000
$40,000
$60,000
$80,000
2000-01
2005-06
2010-11
2015-16
$0 $5,000 $10,000 $15,000 $20,000 $25,000
Graduate
Undergraduate
Graduate
Undergraduate
$0$0
$15,250$13,980
$13,170$10,560
$23,490$21,940
$6,610
$19,350
$20,170$19,570
$18,630
$6,920$6,060$6,160
Average Annual Amount Borrowed in 2015 Dollars per Borrower
PLUS
Dire
ct
2000-01 2005-06 2010-11 2015-16
Direct Undergraduate 4,279 6,017 9,438 7,122
Graduate 712 1,135 1,593 1,433 Total 4,992 7,152 11,031 8,555
PLUS Undergraduate 483 759 829 787
Graduate 0 0 347 378
Total 483 759 1,177 1,165

18 For detailed data behind the graphs and additional information, please visit: trends.collegeboard.org.
Student Loans: Borrowing and BalancesIn 2015, 38% of all borrowers with outstanding student loan debt owed less than $10,000 and 16% owed $40,000 or more.
FIGURE 8 Distribution of Borrowers by Amount of Outstanding Education
Debt, 2015
– Borrowers with graduate debt owe more than those with undergraduate debt. In 2015, 10% of undergraduate borrowers and 43% of graduate borrowers owed $40,000 or more.
– The percentage of undergraduate students who did not borrow federal subsidized or unsubsidized student loans declined from 71% in 2005-06 to 63% in 2010-11, but was 69% in 2015-16.
– In 2015-16, 21% of undergraduate students borrowed both subsidized and unsubsidized loans. The borrowers participating in both programs constituted 67% of undergraduate Direct Loan borrowers.
ALSO IMPORTANT:
– According to the Federal Reserve Bank of New York, 5% of all borrowers with outstanding student debt in 2015 owed $100,000 or more.
– In 2015-16, 1.4 million graduate students borrowed Unsubsidized Direct Loans and 378,000 took Grad PLUS Loans. Overall, 1.5 million graduate students participated in at least one of the programs, with 74% borrowing only Unsubsidized loans, 2% borrowing only Grad PLUS, and 24% borrowing both. (Table 6 online)
NOTES: Balances are as of June 2015. Data are separated by level of education for which loans were issued. Based on U.S. Department of Education data. Percentages may not sum to 100 because of rounding.
SOURCE: Council of Economic Advisers, Investing in Higher Education: Benefits, Challenges, and the State of Student Debt, July 2016.
NOTES: IPEDS headcount enrollments are adjusted for the difference between total headcount, which counts students more than once if they are enrolled in more than one institution at the same time, and unduplicated headcount reported by the National Student Clearinghouse (NSC). Twelve-month undergraduate headcount for 2015-16 is estimated from NSC data. Percentages may not sum to 100 because of rounding.
SOURCES: NCES, Postsecondary Institutions and Cost of Attendance in 2015-16; Degrees and Other Awards Conferred, 2014-15, and 12-Month Enrollment, 2014-15: First Look (Preliminary Data) and earlier editions; National Student Clearinghouse, Current Term Enrollment Estimates: Spring 2016; Federal Student Aid Data Center, Title IV Program Volume Reports and Aid Recipients Summary; calculations by the authors.
19%19% 23% 23% 16%
21%21% 25% 22% 10%
9%8% 16% 24% 43%
Percentage of Borrowers
Graduate
Undergraduate
Total
$40,000 or More
$20,000 to $39,999
$10,000 to $19,999
$5,000 to $9,999
Less than $5,000
6%69% 5% 21%
9%63% 7% 21%
11%71% 5% 13%
Percentage of Undergraduate Students
Aca
dem
ic Y
ear
(Per
cent
age
with
PLU
S Lo
ans)
Both Subsidized and Unsubsidized Loans
Unsubsidized Only
Subsidized Only
No Stafford Loans
2005-06(3.6%)
2010-11(3.3%)
2015-16(3.5%)
FIGURE 9 Percentage of Undergraduate Students Borrowing Federal Subsidized
and Unsubsidized Student Loans, 2005-06, 2010-11, and 2015-16
19For detailed data behind the graphs and additional information, please visit: trends.collegeboard.org.
0%
20%
40%
60%
RecipientsDollars RecipientsDollars RecipientsDollars Recipients
Income Driven Level Payments,10 Years or Less
Repayment Plan
Level Payments,More Than 10 Years
Graduated Payments
Dollars
23%
37%
43%
29%
14%
42%
64%
16%
9% 13%
12%
11%
20%
25%
44%
36%
32%
67%
58%
53%
19%
13%
12%
11%
8% 8% 14%
14%
13%
12%
14%
14%
2014 2013 2015 2016
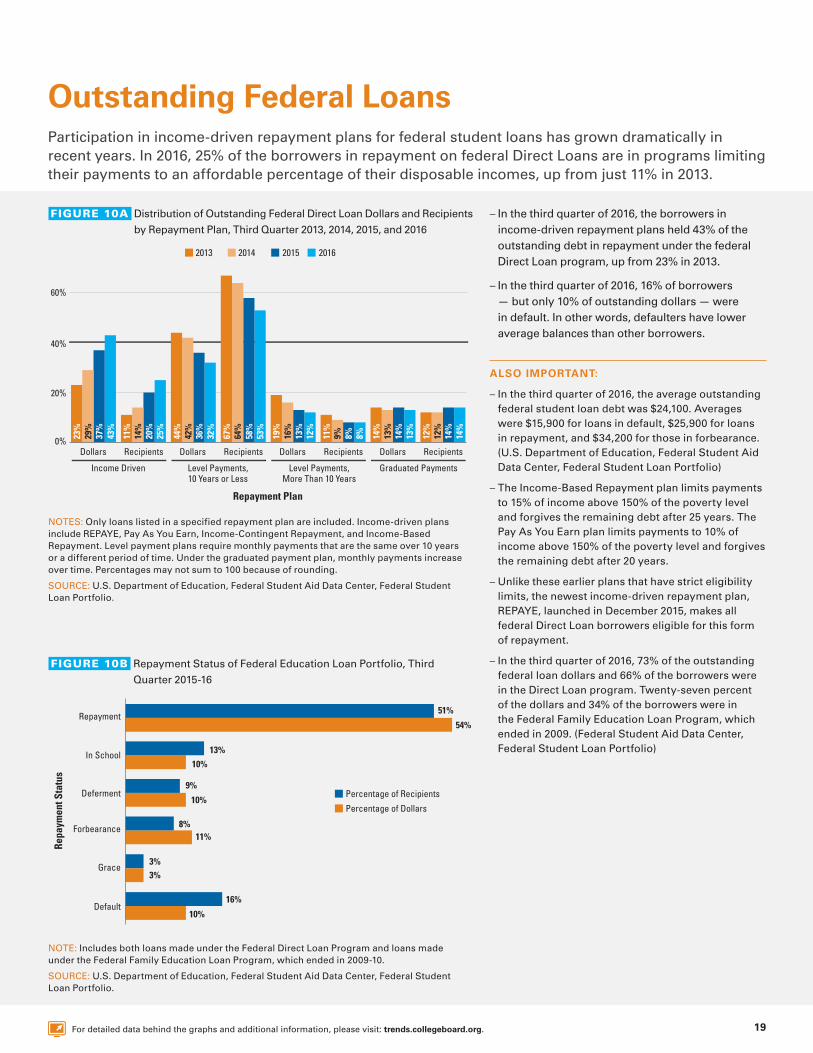
Outstanding Federal Loans Participation in income-driven repayment plans for federal student loans has grown dramatically in recent years. In 2016, 25% of the borrowers in repayment on federal Direct Loans are in programs limiting their payments to an affordable percentage of their disposable incomes, up from just 11% in 2013.
FIGURE 10B Repayment Status of Federal Education Loan Portfolio, Third
Quarter 2015-16
FIGURE 10A Distribution of Outstanding Federal Direct Loan Dollars and Recipients
by Repayment Plan, Third Quarter 2013, 2014, 2015, and 2016 – In the third quarter of 2016, the borrowers in income-driven repayment plans held 43% of the outstanding debt in repayment under the federal Direct Loan program, up from 23% in 2013.
– In the third quarter of 2016, 16% of borrowers — but only 10% of outstanding dollars — were in default. In other words, defaulters have lower average balances than other borrowers.
ALSO IMPORTANT:
– In the third quarter of 2016, the average outstanding federal student loan debt was $24,100. Averages were $15,900 for loans in default, $25,900 for loans in repayment, and $34,200 for those in forbearance. (U.S. Department of Education, Federal Student Aid Data Center, Federal Student Loan Portfolio)
– The Income-Based Repayment plan limits payments to 15% of income above 150% of the poverty level and forgives the remaining debt after 25 years. The Pay As You Earn plan limits payments to 10% of income above 150% of the poverty level and forgives the remaining debt after 20 years.
– Unlike these earlier plans that have strict eligibility limits, the newest income-driven repayment plan, REPAYE, launched in December 2015, makes all federal Direct Loan borrowers eligible for this form of repayment.
– In the third quarter of 2016, 73% of the outstanding federal loan dollars and 66% of the borrowers were in the Direct Loan program. Twenty-seven percent of the dollars and 34% of the borrowers were in the Federal Family Education Loan Program, which ended in 2009. (Federal Student Aid Data Center, Federal Student Loan Portfolio)
NOTES: Only loans listed in a specified repayment plan are included. Income-driven plans include REPAYE, Pay As You Earn, Income-Contingent Repayment, and Income-Based Repayment. Level payment plans require monthly payments that are the same over 10 years or a different period of time. Under the graduated payment plan, monthly payments increase over time. Percentages may not sum to 100 because of rounding.
SOURCE: U.S. Department of Education, Federal Student Aid Data Center, Federal Student Loan Portfolio.
NOTE: Includes both loans made under the Federal Direct Loan Program and loans made under the Federal Family Education Loan Program, which ended in 2009-10.
SOURCE: U.S. Department of Education, Federal Student Aid Data Center, Federal Student Loan Portfolio.
51%
54%
13%10%
9%
10%
8%11%
3%3%
16%
10%
Percentage of Recipients
Percentage of Dollars
Default
Grace
Forbearance
Deferment
Repa
ymen
t Sta
tus
In School
Repayment

20 For detailed data behind the graphs and additional information, please visit: trends.collegeboard.org.
Federal Student Loans: Balances and Default RatesGraduate students and undergraduates who borrow to attend selective colleges have the largest debts and the lowest default rates. Students who attend for-profit and public two-year colleges have the smallest debts and the highest default rates.
– Median federal student loan debt among borrowers who entered repayment in 2013-14 was $19,650. Median debt ranged from $11,650 for borrowers who attended public two-year colleges and $14,260 for those who attended for-profit colleges to $26,490 for those who attended the most selective four-year colleges and $45,890 for those who only borrowed for graduate school.
– Among borrowers from for-profit institutions who entered repayment in 2008-09, 47% defaulted on their loans within five years — down from a peak of 65% for the 1989-90 repayment cohort, but up from 29% for the 1998-99 repayment cohort.
– Among students who only borrowed for graduate school and entered repayment in 2008-09, 5% defaulted on their loans within five years — down from 10% for the 1978-79 repayment cohort, but up from 3% for the 1998-99 repayment cohort.
ALSO IMPORTANT:
– Over the decade from 2003-04 to 2013-14, the median debt of borrowers entering repayment increased by 34% ($5,010) in inflation-adjusted dollars. Increases in debt levels ranged from 22% ($4,720) for those from the most selective four-year institutions and 33% ($11,350) for those who only borrowed for graduate school to 66% ($4,640) for public two-year college students and 83% ($6,470) for those from for-profit institutions.
NOTES: Institution type is based on the school in which students were enrolled at the time their first federal student loan was issued. Therefore, balances in Figure 11A for all sectors may include both undergraduate and graduate debt. Graduate-only borrowers are those who only borrowed to attend graduate school. Perkins and Parent PLUS loans are not included. Default rates in Figure 11B are based on defaults occurring within five calendar years from the date of entering repayment. Consumer Price Index for all urban consumers (CPI-U) was used to adjust median debt for inflation. See Looney and Yannelis (2015) for information on how college selectivity is defined.
SOURCE: Adam Looney and Constantine Yannelis (2015), “A Crisis in Student Loans? How Changes in the Characteristics of Borrowers and in the Institutions They Attended Contributed to Rising Loan Defaults,” Brookings Papers on Economic Activities.
FIGURE 11A Median Federal Student Loan Debt Among Borrowers Entering
Repayment in 2013-14, by Institution Type
FIGURE 11B Five-Year Federal Student Loan Default Rates by Institution Type,
Borrowers Entering Repayment in 1978-79 to 2008-09
Fiv
e-Ye
ar D
efau
lt Ra
te
For-Pro�t
Total
Public Two-Year
Nonselective Four-Year
Selective Four-Year
Most Selective Four-Year
Graduate-Only Borrowers
Year Entering Repayment
08-0903-0498-9993-9488-8983-8478-790%
20%
40%
60%
$45,890
$26,490
$25,890
$21,230
$11,650
$14,260
$19,650
Median Federal Student Loan Debt
Inst
itutio
n Ty
pe
$0 $10,000 $20,000 $30,000 $40,000 $50,000
Total
For-Pro�t
Public Two-Year
Nonselective Four-Year
Selective Four-Year
Most Selective Four-Year
Graduate-Only Borrowers
1978-79 1988-89 1998-99 2008-09
Median Debt
Five-Year Default
RateMedian
Debt
Five-Year Default
RateMedian
Debt
Five-Year Default
RateMedian
Debt
Five-Year Default
RateTotal $7,630 15% $6,310 40% $14,950 16% $13,410 28%Public Two-Year $4,660 24% $4,570 36% $7,560 24% $7,830 38%For-Profit $6,060 28% $4,570 62% $7,980 29% $8,450 47%Nonselective Four-Year $8,690 16% $7,760 27% $13,150 19% $14,650 27%Selective Four-Year $7,680 13% $8,280 17% $18,080 12% $17,770 18%Most Selective Four-Year $8,020 9% $10,490 10% $22,270 8% $18,870 10%Graduate-Only Borrowers $10,560 10% $16,510 8% $35,550 3% $37,660 5%
Median Federal Debt Balance in 2013 Dollars and Five-Year Default Rate

21For detailed data behind the graphs and additional information, please visit: trends.collegeboard.org.
Federal Student Loan Default RatesAmong federal student loan borrowers who entered repayment in 2011-12, 24% of those who left school without a degree or certificate defaulted on their loans within two years, compared with 9% of those who completed their degree or certificate programs.
– Default rates for non-completers ranged from 15% among those who attended private nonprofit four-year institutions to 29% among public two-year college students.
– Default rates for borrowers who completed a degree or certificate ranged from 5% for those who attended private nonprofit four-year institutions to 17% for those who attended public two-year colleges.
– Thirty-five percent of the borrowers who entered repayment in 2010-11 and defaulted on their federal loans within three years owed less than $5,000. Another 31% owed between $5,000 and $10,000. Only 4% owed more than $40,000.
– Student loan default rates are highest for borrowers with less than $5,000 in debt. Default rates are lower for those with higher loan balances.
– The high default rates for borrowers with low balances are related to the high default rates for non-completers. Students tend to borrow more as they stay in college longer and earn degrees. Many of those holding the highest levels of debt borrowed for graduate school.
ALSO IMPORTANT:
– Although default rates are similar in the public two-year and for-profit sectors, a relatively low proportion of public two-year college students borrow, while most for-profit students borrow. In 2011-12, about 20% of public two-year college students borrowed, compared to about three-quarters of students in for-profit institutions. (NPSAS, 2012)
NOTES: Sector is based on the school in which students were enrolled at the time their first federal student loan was issued. Perkins and Parent PLUS loans are not included. Default rates are based on defaults occurring within two calendar years of the date of entering repayment. They do not correspond exactly to official two-year cohort default rates, which are based on defaults before the end of the fiscal year following the year in which the borrower enters repayment.
SOURCE: Adam Looney and Constantine Yannelis (2015), “A Crisis in Student Loans? How Changes in the Characteristics of Borrowers and in the Institutions They Attended Contributed to Rising Loan Defaults,” Brookings Papers on Economic Activities.
NOTE: Loan balance is measured at the time the borrower entered repayment.
SOURCE: Council of Economic Advisers (2016), Investing in Higher Education: Benefits, Challenges, and the State of Student Debt, Figure 27.
FIGURE 12A Two-Year Federal Student Loan Default Rate Among Borrowers
Entering Repayment in 2011-12, by Sector and Completion Status
FIGURE 12B Share of Defaulters and Three-Year Federal Student Loan Default
Rate Among Borrowers Entering Repayment in 2010-11, by Loan
Balance
Borrowers Who Completed Borrowers Who Did Not Complete
24%
9%
5%6%
14%
17%
29%28%
18%
15%
Two-
Year
Def
ault
Rate
PublicTwo-Year
For-Pro�tPublicFour-Year
PrivateNonpro�tFour-Year
All0%
10%
20%
12%
8%
7%
19%
24%
4%
11%
18%
31%
35%
More than $40,000
$20,001 to $40,000
$10,001 to $20,000
$5,001 to $10,000
Less than $5,000
More than $40,000
$20,001 to $40,000
$10,001 to $20,000
$5,001 to $10,000
Less than $5,000
Shar
e of
Def
aulte
rsD
efau
lt Ra
te

22 For detailed data behind the graphs and additional information, please visit: trends.collegeboard.org.
Cumulative Debt: Bachelor’s Degree RecipientsIn 2014-15, 61% of bachelor’s degree recipients from public and private nonprofit institutions graduated with an average of $28,100 in debt.
– Debt levels of public four-year college graduates grew more rapidly between 2009-10 and 2014-15 than over either of the previous five-year periods. In 2014-15, average debt per borrower was $26,800 — 13% ($3,000 in 2015 dollars) higher than in 2009-10. Debt per graduate (including those with and without student debt) was $15,900 — 19% ($2,500) higher than in 2009-10.
– Debt levels of private nonprofit four-year college graduates grew more slowly between 2009-10 and 2014-15 than during either of the previous five-year periods. In 2014-15, average debt per borrower was $31,400 — 4% ($1,300 in 2015 dollars) higher than in 2009-10. Debt per graduate (including those with and without student debt) was $19,900 — 1% ($100) higher than in 2009-10.
– Among students with bachelor’s degrees from the public colleges in which they first enrolled, the percentage who graduated with debt increased from 54% in 1999-00 to 55% in 2004-05, to 56% in 2009-10, and to 60% in 2014-15.
– The percentage of students earning bachelor’s degrees from the private nonprofit colleges in which they first enrolled who graduated with debt fluctuated between 63% and 66% from 1999-00 to 2014-15.
ALSO IMPORTANT:
– Students who earn their bachelor’s degrees at for-profit institutions, not included in Figure 13, are more likely to borrow and tend to accumulate higher average levels of debt than those who graduate from public and private nonprofit colleges.
– Figure 13 includes only students who earned their bachelor’s degrees at the institution in which they first enrolled. Students who attend two or more institutions borrow slightly more than those who do not transfer. (NPSAS, 2012)
NOTES: Figures include federal and nonfederal loans taken by students who began their studies at the institution from which they graduated. The orange bars represent the average cumulative debt levels of bachelor’s degree recipients who took student loans. The blue bars represent the average debt per bachelor’s degree recipient, including those who graduated without student debt. Calculations are based on the number of bachelor’s degrees awarded, which typically exceeds the number of students receiving degrees. Reported amounts are estimates and should be interpreted with caution. The available data are not adequate to allow comparable calculations for for-profit institutions.
SOURCES: College Board, Annual Survey of Colleges, 2001 to 2016; calculations by the authors.
FIGURE 13 Average Cumulative Debt Levels in 2015 Dollars: Bachelor’s
Degree Recipients at Four-Year Institutions, 1999-00 to 2014-15,
Selected Years
Aver
age
Cum
ulat
ive
Deb
t in
2015
Dol
lars
Academic Year(Percentage of Graduates Who Borrowed)
$0
$10,000
$20,000
$30,000
Aver
age
Cum
ulat
ive
Deb
t in
2015
Dol
lars
2014-15 (60%)2009-10 (56%)2004-05 (55%)1999-00 (54%)
Academic Year(Percentage of Graduates Who Borrowed)
$0
$10,000
$20,000
$30,000
2014-15 (63%)2009-10 (66%)2004-05 (64%)1999-00 (63%)
$11.
300
$11,
900
$13,
400
$15,
900
$20,
900
$21,
700
$23,
800
$26,
800
Public Four-Year
Private Nonprofit Four-Year
Per Degree RecipientPer Borrower
Per Degree RecipientPer Borrower
$15,
000
$17,
900
$19,
800
$19,
900
$23,
900
$27,
700
$30,
100
$31,
400
Average Cumulative Debt in 2015 Dollars: Bachelor’s Degree Recipients at Public and Private Nonprofit Four-Year Institutions, 2004-05, 2009-10, and 2014-15
Percentage with Debt
Average Debt per Borrower
Average Debt per Graduate
2004-05 58% $23,800 $13,800
2009-10 59% $25,800 $15,200
2014-15 61% $28,100 $17,000

23For detailed data behind the graphs and additional information, please visit: trends.collegeboard.org.
Sources of Grant Aid: Public InstitutionsIn 2013-14, first-time full-time undergraduate students at public four-year institutions received a higher proportion of their grant aid from their institutions and less from state grant programs than in 2003-04.
FIGURE 14 Sources of Grant Aid for First-Time Full-Time Undergraduate
Students at Public Institutions, 2003-04, 2008-09, and 2013-14
NOTE: Carnegie categories are based on the 2010 classification.
SOURCES: NCES, IPEDS Student Aid Data, 2003-04, 2008-09, and 2013-14; calculations by the authors.
– Between 2003-04 and 2013-14, average institutional grant aid for first-time full-time students more than doubled in inflation-adjusted dollars at public doctoral, master’s, and bachelor’s institutions.
– In 2013-14, average institutional grant aid ranged from $250 at public two-year colleges to $3,330 at public doctoral institutions.
– Between 2003-04 and 2013-14, growth in total grant aid from all sources ranged from 46% at public bachelor’s institutions (where only about 4% of public college students are enrolled) to 73% at public two-year colleges.
– In 2013-14, average total grant aid per first-time full-time student in public institutions ranged from $3,380 at public two-year institutions to $6,230 at public doctoral universities.
– In 2013-14, first-time full-time students at public two-year colleges received 74% of their grant aid from the federal government. First-time full-time students at public bachelor’s, master’s, and doctoral institutions received 46%, 39%, and 23%, respectively, of their grant aid from the federal government.
ALSO IMPORTANT:
– Most federal grant aid is awarded without respect to the institution in which a student enrolls. In contrast, states and institutions have their own policies for awarding grant aid.
Sources of Grant Aid at Public Institutions, 2003-04, 2008-09, and 2013-14
2003-04 2008-09 2013-14Public Doctoral Federal 25% 23% 23%
State 33% 29% 24%
Institutional 43% 48% 53%
Public Master's Federal 39% 37% 39%
State 34% 33% 28%
Institutional 27% 30% 33%
Public Bachelor's Federal 45% 44% 46%
State 36% 32% 26%
Institutional 20% 24% 28%
Public Associate Federal 70% 68% 74%
State 21% 24% 19%
Institutional 9% 9% 7%
2003-04
2008-09
2013-14
2003-04
2008-09
2013-14
2003-04
2008-09
2013-14
InstitutionalStateFederal
$6,230$3,330$1,490$1,410
$2,240$1,330$1,060
$1,570$1,210$910
$1,680$1,410$1,980
$1,120$1,250$1,410
$830$1,040$1,220
$1,390$1,320$2,300
$930$1,250$1,720
$670
$250
$200
$180
$1,220
$630
$560
$410
$1,540
$2,500
$1,580
$1,360
$5,010
$3,900
$3,430
$3,380
$2,340
$1,950
$3,090
$3,780
$4,630
$3,690
$5,070
2003-04
2008-09
2013-14
Publ
ic A
ssoc
iate
(43%
)Pu
blic
Bac
helo
r's(4
%)
Publ
ic M
aste
r's
(20%
)Pu
blic
Doc
tora
l (3
3%)
Carn
egie
Cla
ssifi
catio
n(P
erce
ntag
e of
201
4 Fi
rst-T
ime
Full-
Tim
e St
uden
ts in
Eac
h Ca
tego
ry)
$0 $2,000 $4,000 $6,000
Grant Aid per First-Time Full-Time Undergraduate Student

24 For detailed data behind the graphs and additional information, please visit: trends.collegeboard.org.
Sources of Grant Aid: Private Nonprofit InstitutionsIn 2013-14, first-time full-time undergraduate students at private nonprofit four-year institutions received more of their grant aid from their institutions than in 2003-04. On average, their aid from state grant programs declined over the decade.
– In 2013-14, average total grant aid for first-time full-time students at private nonprofit four-year institutions ranged from $16,320 at master’s institutions to $17,770 at doctoral institutions.
– On average, students at private doctoral institutions receive more institutional grant aid, but less federal and state grant aid, than those at private master’s and bachelor’s institutions.
– At all types of private nonprofit four-year institutions, institutional grant aid grew relative to state and federal grant aid over the decade from 2003-04 to 2013-14.
ALSO IMPORTANT:
– In 2016-17, average annual published tuition and fee prices at private nonprofit doctoral universities are about $12,000 higher than at master’s universities and about $8,600 higher than at private nonprofit bachelor’s institutions. (Trends in College Pricing 2016, Table 1B)
NOTE: Carnegie categories are based on the 2010 classification.
SOURCES: NCES, IPEDS Student Aid Data, 2003-04, 2008-09, and 2013-14; calculations by the authors.
FIGURE 15 Sources of Grant Aid for First-Time Full-Time Undergraduate Students at Private Nonprofit Institutions,
2003-04, 2008-09, and 2013-14
InstitutionalStateFederal
Grant Aid per First-Time Full-Time Undergraduate Students
Carn
egie
Cla
ssifi
catio
n(P
erce
ntag
e of
201
4 Fi
rst-T
ime
Full-
Tim
e St
uden
ts in
Eac
h Ca
tego
ry)
$0 $3,000 $6,000 $9,000 $12,000 $15,000 $18,000
2003-04
2008-09
2013-14
2003-04
2008-09
2013-14
2003-04
2008-09
2013-14
Priv
ate
Bach
elor
's
(34%
)Pr
ivat
e M
aste
r's (3
7%)
Priv
ate
Doct
oral
(2
9%)
$17,770
$14,570
$12,080
$16,320
$12,380
$10,380
$16,680
$11,090
$12,750
$1,070 $580 $16,120
$1,010 $690 $12,870
$980 $930 $10,170
$1,660 $1,260 $13,400
$1,320 $1,380 $9,680
$1,230 $1,440 $7,710
$1,780
$1,470
$1,060
$1,240
$13,840
$10,040
$1,390 $1,260 $8,440
Sources of Grant Aid at Private Nonprofit Institutions, 2003-04, 2008-09, and 2013-14
2003-04 2008-09 2013-14Private Doctoral Federal 8% 7% 6%
State 8% 5% 3%
Institutional 84% 88% 91%
Private Master's Federal 12% 11% 10%
State 14% 11% 8%
Institutional 74% 78% 82%
Private Bachelor's Federal 13% 12% 11%
State 11% 10% 6%
Institutional 76% 79% 83%

25For detailed data behind the graphs and additional information, please visit: trends.collegeboard.org.
Pell GrantsThe number of Pell Grant recipients declined in 2015-16 for the fourth consecutive year to 7.6 million, but this represents a 46% increase from 5.2 million recipients a decade earlier.
– Both the total number of Pell Grant recipients and the percentage of undergraduate students receiving this aid peaked in 2011-12 when 9.4 million students — 38% of the 24.7 million undergraduates — received Pell Grants.
– The total number of undergraduate students increased by 1.9 million between 2005-06 and 2015-16. The number of Pell Grant recipients increased by 2.4 million.
– The level of the maximum Pell Grant, which is legislated by Congress, has fluctuated over time. It declined by 21% in inflation-adjusted dollars between 1985-86 and 1995-96 before increasing by 35% between 1995-96 and 2005-06, and by another 17% between 2005-06 and 2015-16.
– The largest one-year percentage increases in the maximum Pell Grant were 16% ($796 in 2015 dollars) in 2009-10 and 11% ($484) in 2001-02. The largest declines were 14% in 1980-81 ($827) and again in 1981-82 ($699).
– The maximum Pell Grant is the most frequently cited measure of the subsidies provided by the program. However, most students receive smaller grants because they are enrolled part time or because their family incomes and assets reduce their aid eligibility. In 2015-16, when the maximum Pell Grant was $5,775, the average grant was $3,724.
ALSO IMPORTANT:
– The maximum Pell Grant for the 2016-17 academic year is $5,815 — an increase of $40 over 2015-16, but not quite large enough to compensate for the 0.8% increase in the Consumer Price Index between July 2015 and July 2016.
FIGURE 17 Maximum and Average Pell Grants in 2015 Dollars, 1975-76 to 2015-16
FIGURE 16 Undergraduate Enrollment and Percentage of Undergraduate
Students Receiving Pell Grants, 2005-06 to 2015-16
24%25% 25% 26% 33% 37% 38% 37% 37% 36% 33%
20.9 21.2 21.923.2
24.6 25.2 24.7 24.1 23.6 23.2 22.8
12-Month Undergraduate Headcount Enrollment Pell Recipients
15-1614-1513-1412-1311-1210-1109-1008-0907-0806-0705-06
10
5
15
20
25
Mill
ions
of S
tude
nts
0
NOTES: IPEDS headcount enrollments are adjusted for the difference between total headcount, which counts students more than once if they are enrolled in more than one institution at the same time, and unduplicated headcount reported by the National Student Clearinghouse (NSC). Twelve-month undergraduate headcount for 2015-16 is estimated from NSC data.
SOURCES: NCES, Postsecondary Institutions and Cost of Attendance in 2015-16; Degrees and Other Awards Conferred, 2014-15, and 12-Month Enrollment, 2014-15: First Look (Preliminary Data) and earlier editions; National Student Clearinghouse, Current Term Enrollment Estimates: Spring 2016; U.S. Department of Education, Federal Pell Grant Program End-of-Year Report 2014-15; Federal Student Aid Data Center, Title IV Program Volume Reports and Aid Recipients Summary; calculations by the authors.
SOURCES: U.S. Department of Education, Federal Pell Grant Program End-of-Year Report, 1975-76 through 2014-15; Federal Student Aid Data Center, Title IV Program Volume Reports and Aid Recipients Summary; calculations by the authors.
$6,164
$3,350
$2,831
$3,724
$5,775
$4,649
$2,371
$3,662
$4,947
$3,000
Average Pell Grant per Recipient
Maximum Pell Grant
$2,000
$3,000
$1,000
$4,000
$5,000
$6,000
Max
imum
and
Ave
rage
Gra
nt in
201
5 D
olla
rs
$0
15-1610-1105-0600-0195-9690-9185-8680-8175-76

26 For detailed data behind the graphs and additional information, please visit: trends.collegeboard.org.
Pell GrantsBetween 2010-11 and 2015-16, total Pell Grant expenditures declined by 28% in inflation-adjusted dollars. However, the $28.2 billion distributed under the program in 2015-16 was 82% higher than the $15.5 billion awarded a decade earlier.
SOURCES: U.S. Department of Education, Federal Pell Grant Program End-of-Year Report, 1980-81 through 2014-15; Federal Student Aid Data Center, Title IV Program Volume Reports and Aid Recipients Summary; calculations by the authors.
– Growth in Pell Grant expenditures is driven primarily by growth in the number of recipients. The number of recipients in 2015-16 was 18% lower than it was five years earlier, but 46% higher than it was 10 years earlier.
– Both the maximum and average Pell Grants also declined (in inflation-adjusted dollars) between 2010-11 and 2015-16, by 5% and 11%, respectively. In 2015-16, the maximum award was 17% higher and the average award was 24% higher than a decade earlier.
– The percentage of Pell Grant recipients who are independent students, with eligibility determined by their own financial circumstances rather than those of their parents, rose from 41% in 1980-81 to 61% in 1990-91. After a slight decline, this percentage reached 60% in 2010-11, but declined steadily to 55% in 2014-15.
ALSO IMPORTANT:
– Pell Grant recipients who do not have the resources to contribute at all to their own education and who are enrolled full time for a full year receive the maximum award. In 2014-15, 27% of recipients received the maximum grant of $5,730. (Federal Pell Grant Program End-of-Year Report 2014-15, Table 3A)
FIGURE 18 Total Pell Grant Expenditures and Number of Recipients, 1980-81 to 2015-16
Tota
l Pel
l Exp
endi
ture
s in
Bill
ions
of 2
015
Dol
lars
Num
ber of Pell Grant Recipients (in M
illions)$6.9
2.7 2.8
3.43.6
3.9
5.2
7.6
9.3
$8.0
$0
$10
$20
$30
$40
0
2
4
6
8
Number of Recipients (in Millions)
Total Pell Expenditures (in Billions)
$9.0 $8.6$11.0
$15.5
$39.1
$28.2
2015-162010-112005-062000-011995-961990-911985-861980-81
Federal Pell Grant Awards in 2015 Dollars, 1980-81 to 2015-16, Selected Years
Total Expenditures (in Billions of 2015 Dollars)
Maximum Pell Grant
(in 2015 Dollars)
Average Pell Grant
(in 2015 Dollars)
Number of Recipients
(in Millions)
Percentage of Recipients Who Were
Independent1980-81 $6.9 $5,050 $2,544 2.7 41%
1985-86 $8.0 $4,649 $2,831 2.8 50%
1990-91 $9.0 $4,209 $2,653 3.4 61%
1995-96 $8.6 $3,662 $2,371 3.6 59%
2000-01 $11.0 $4,558 $2,818 3.9 56%
2005-06 $15.5 $4,947 $3,000 5.2 59%
2010-11 $39.1 $6,076 $4,196 9.3 60%
2011-12 $35.5 $5,863 $3,755 9.4 59%
2012-13 $33.4 $5,781 $3,728 9.0 58%
2013-14 $32.2 $5,767 $3,712 8.7 56%
2014-15 $30.7 $5,740 $3,689 8.3 55%
2015-16 $28.2 $5,775 $3,724 7.6 —

27For detailed data behind the graphs and additional information, please visit: trends.collegeboard.org.
In 2016-17, the maximum Pell Grant covers 60% of the average published tuition and fees of $9,650 at public four-year colleges and universities and 29% of the average tuition and fees and room and board of $20,090.
Pell Grants
– In 2016-17, the maximum Pell Grant covers 17% of the average published tuition and fees of $33,480 at private nonprofit four-year colleges and universities and 13% of the average tuition and fees and room and board ($45,370).
– Between 2011-12 and 2016-17, the percentage of published tuition and fees covered by the maximum Pell Grant declined from 67% to 60% in the public four-year sector and from 20% to 17% in the private nonprofit four-year sector.
ALSO IMPORTANT:
– Between 2006-07 and 2016-17, published tuition and fees increased by 3.5% per year at public four-year institutions and by 2.4% per year at private nonprofit institutions, while the maximum Pell Grant increased by 2.0% per year, after adjusting for inflation.
FIGURE 19 Inflation-Adjusted Maximum Pell Grant and Published Prices at Public and Private Nonprofit Four-Year Institutions
in 2016 Dollars, 1996-97 to 2016-17
$10,950
$19,920
$28,140
$4,560
$3,786$0
$10,000
$20,000
$30,000
$40,000
$5,084
$5,110
$4,789
$6,860
$12,250
$23,560
$32,340
$26,380
$36,060
$20,090
$33,480
$45,370
$9,650
$5,815
15-16 16-1714-1513-1412-1311-1210-1109-1008-0907-0806-0705-0604-0503-0402-0301-0200-0199-0098-9997-9896-97
Maximum Pell Grant
Public Four-Year Tuitionand Fees and Room and Board
Private Nonprofit Four-YearTuition and Fees and Room and Board
Public Four-YearTuition and Fees
Private Nonprofit Four-YearTuition and Fees
2016
Dol
lars
$15,180
Maximum Pell Grant as a Percentage of Published Prices, 1996-97 to 2016-17, Selected Years
NOTE: Published prices, sometimes called “sticker prices,” differ from the net prices that students actually pay because they receive grant aid (discounts) from their institutions, as well as from federal and state governments and other sources.
SOURCES: U.S. Department of Education, Federal Pell Grant Program End-of-Year Report, 2014-15; Federal Student Aid Data Center, Title IV Program Volume Reports and Aid Recipients Summary; College Board, Trends in College Pricing 2016.
Public Four-Year Private Nonprofit Four-Year
Tuition and Fees
Tuition and Fees and Room
and Board Tuition and Fees
Tuition and Fees and Room
and Board1996-97 83% 35% 19% 13%
2001-02 99% 42% 22% 16%
2006-07 70% 32% 18% 13%
2011-12 67% 32% 20% 15%
2016-17 60% 29% 17% 13%

28 For detailed data behind the graphs and additional information, please visit: trends.collegeboard.org.
Pell GrantsIn 2014-15, just over half of all Pell Grant recipients were age 23 or younger, 24% were between 24 and 30, and 22% were 31 or older.
– In 2014-15, 45% of Pell Grant recipients were dependent students; three-quarters of these students came from families with incomes of $40,000 or less, including 30% with family incomes of $15,000 or less.
– Fifty-five percent of 2014-15 Pell Grant recipients were independent students; 33% had dependents of their own; and 22% were independent students without dependents.
– Among independent Pell Grant recipients with dependents, 83% had family incomes of $40,000 or less, including 42% with incomes of $15,000 or less.
– Almost all independent Pell Grant recipients without dependents had family incomes of $40,000 or less. Over three-quarters had incomes of $15,000 or less.
ALSO IMPORTANT:
– The percentage of Pell Grant recipients over age 30 has been quite stable over time: 22% in 1994-95, 19% in 2004-05, and 22% in 2014-15. (Federal Pell Grant Program End-of-Year Reports, 1994-95, 2004-05, and 2014-15)
– In 2014-15, 66% of Pell Grant recipients had zero expected family contribution (EFC). This included 52% of dependent recipients, 66% of independent recipients without dependents, and 85% of independent recipients with dependents. (2014-15 Federal Pell Grant Program End-of-Year Report, Table 57)
– Among Pell Grant recipients with zero EFC, 54% were eligible for the Automatic Zero EFC and 46% had a calculated zero EFC. (2014-15 Federal Pell Grant Program End-of-Year Report, Table 57)
– The size of a recipient’s Pell Grant depends on both EFC and enrollment intensity (full-time, ¾ time, ½ time, or less than ½ time). In 2014-15, the maximum Pell Grant award was $5,730.
– In 2014-15, 8% of dependent recipients received less than $1,200 in Pell Grants and 36% received $5,400 or more. Among those from families with incomes of $15,000 or less, 4% received less than $1,200 and 54% received $5,400 or more. Among those from families with incomes of $40,000 or higher, these proportions were 20% and 4%, respectively. (2014-15 Federal Pell Grant Program End-of-Year Report, Table 56G)
FIGURE 20A Distribution of Pell Grant Recipients by Age, 2014-15
693,800
1,152,600
1,989,900
2,693,500
1,785,800
Number of Pell Grant Recipients (Millions)(Total = 8.3 Million)
19 or Younger (21%)
20 to 23 (32%)
24 to 30 (24%)
31 to 40 (14%)
41 and Older (8%)
0 0.5 1.0 1.5 2.0 2.5 3.0
FIGURE 20B Distribution of Pell Grant Recipients by Dependency Status and
Family Income, 2014-15
NOTES: Percentages on the vertical axis represent percentages of recipients in each age group. Percentages may not sum to 100 because of rounding.
SOURCE: 2014-15 Federal Pell Grant Program End-of-Year Report, Table 52A.
SOURCE: 2014-15 Federal Pell Grant Program End-of-Year Report, Tables 52B, 52C, and 52D.
Independent WithoutDependents (22%)
Independent withDependents (33%)
Dependent (45%)
$15,001 to $40,000
$15,000 or Less
$40,001 to $60,000
$60,001 or Higher
77% 23%
42% 41%
30% 45% 19% 6%
12% 5%
Percentage of Pell Grant Recipients

29For detailed data behind the graphs and additional information, please visit: trends.collegeboard.org.
State GrantsStates provided grant aid averaging $750 per full-time equivalent undergraduate student in 2014-15, $10 below the 2007-08 peak, but an increase from $690 (in 2014 dollars) in 2011-12.
– In 1981-82 and earlier years, virtually all state grant aid was based on students’ financial circumstances. From 2004-05 to 2010-11, only 71% to 73% of state grant aid was need-based. In 2014-15, that percentage was 76%.
– In 2014-15, 26 states considered students’ financial circumstances in allocating at least 95% of their state grant aid. Fourteen states considered financial circumstances for less than half of their state grant aid.
ALSO IMPORTANT:
– Total spending on state grant aid increased from $8.4 billion (in 2014 dollars) in 2004-05 to $9.8 billion in 2009-10, and to $10.3 billion in 2014-15. (NASSGAP Annual Survey, 2004-05, 2009-10, and 2014-15)
FIGURE 21A Need-Based and Non-Need-Based State Grants per Full-Time Equivalent (FTE) Undergraduate Student in 2014 Dollars,
1974-75 to 2014-15
NOTES: Need-based aid includes any grants for which financial circumstances contribute to eligibility. Non-need-based aid refers to grants for which financial circumstances have no influence on eligibility. New Hampshire did not award state grant aid to undergraduate students in 2014-15.
SOURCE: NASSGAP Annual Survey, 1974-75 to 2014-15, Table 1.
FIGURE 21B Need-Based State Grant Aid as a Percentage of Total Undergraduate State Grant Aid by State, 2014-15
NOTE: Percentages displayed represent percentages of total undergraduate state grant aid for which students’ financial circumstances were considered.
SOURCE: National Association of State Student Grant and Aid Programs (NASSGAP) Annual Survey, 1974-75 to 2014-15, Tables 1 and 12.
Aver
age
Stat
e G
rant
per
FTE
U
nder
grad
uate
Stu
dent
$330$380 $390
91%
90%
100%
100%
100%
100%
100%
100%
100%
100%
91%
91%
91%
90%
90%
89%
88%
89%
90%
90%
87%
86%
85%
83%
82%
78%
76%
76%
77%
74%
73%
72%
72%
73%
72%
73%
71%
74%
75%
76%
76%
$410
$510
$610
$760$680 $690
$750Non-Need-BasedNeed-Based
14-15 09-10 04-05 99-00 94-95 89-90 84-85 79-8074-75$0
$200
$400
$600
$800
100%99%96%
76%
5%
17%
54%
0%
Perc
enta
ge o
f Sta
te G
rant
s B
ased
on
Fina
ncia
l Nee
d
0%
20%
40%
60%
80%
100%
Geor
gia
Arka
nsas
Sout
h Da
kota
Loui
sian
aSo
uth
Caro
lina
New
Mex
ico
Tenn
esse
eUt
ahN
evad
aM
issi
ssip
piAl
aska
Flor
ida
Wes
t Virg
inia
Kent
ucky
Mis
sour
iAl
abam
aN
orth
Dak
ota
Dela
war
eOh
ioM
onta
naUn
ited
Stat
esVi
rgin
iaOk
laho
ma
Iow
aId
aho
Mas
sach
uset
tsN
ew Y
ork
Wis
cons
inIn
dian
aN
orth
Car
olin
aN
ew J
erse
yM
aryl
and
Mic
higa
nVe
rmon
tCo
nnec
ticut
Colo
rado
Min
neso
taPe
nnsy
lvan
iaIll
inoi
sCa
lifor
nia
Was
hing
ton
Arizo
naHa
wai
iKa
nsas
Mai
neN
ebra
ska
Oreg
onRh
ode
Isla
ndTe
xas
Wyo
min
g

30 For detailed data behind the graphs and additional information, please visit: trends.collegeboard.org.
State GrantsIn 2014-15, state grant aid per full-time equivalent (FTE) undergraduate student ranged from under $200 in 11 states to over $1,000 in 12 states.
FIGURE 22A State Grant Aid per Full-Time Equivalent (FTE) Undergraduate Student, 2014-15
NOTE: FTE students include both state residents and out-of-state students. A few states award aid to students enrolled out-of-state.
SOURCES: NASSGAP Annual Survey, 2014-15, Tables 1 and 12; calculations by the authors.
NOTE: State grant expenditures include funding for both undergraduate and graduate students.
SOURCE: NASSGAP Annual Survey, 2014-15, Table 14.
FIGURE 22B State Grant Expenditures as a Percentage of Total State Support for Higher Education by State, 2014-15
– South Carolina, with the highest grant aid per FTE undergraduate student, considered the financial circumstances of recipients for only 17% of state grant funds in 2014-15. Georgia, the second most generous state, allocates its grant funds without regard to students’ financial circumstances. (Figure 21B)
– Of the 12 states awarding over $1,000 per FTE undergraduate in grant aid, only California, New Jersey, New York, and Washington allocated more than half of their state grant dollars based on students’ financial circumstances. (Figure 21B)
– Overall, state grant expenditures constituted 13% of total state support for higher education in 2014-15. Sixteen states devoted less than 5% of their funding to grant aid for students; nine states
directed more than 20% of their funding to individual students rather than to institutions.
ALSO IMPORTANT:
– Four states provided 41% of all state grant dollars in 2014-15, with California contributing 18% and New York 10%.
– Some state-funded grant aid is in the form of “tuition set-aside” programs through which a portion of tuition revenues at public institutions — or of increases in tuition — is dedicated to grant aid. Some of these funds are included in reported state grant aid, but others are not. Tuition remission dollars, not always reported as state grant aid, are sizable in several states.
$120$240
$400$520
$750
$1,050
$1,320
$1,960
$0Stat
e G
rant
Aid
per
FTE
Stu
dent
$0
$500
$1,000
$1,500
$2,000
Loui
sian
aGe
orgi
aSo
uth
Caro
lina
Tenn
esse
eW
ashi
ngto
nN
ew J
erse
yN
ew M
exic
oKe
ntuc
kyN
ew Y
ork
Wes
t Virg
inia
Calif
orni
aAr
kans
asIn
dian
aVi
rgin
iaPe
nnsy
lvan
iaM
inne
sota
Texa
sN
orth
Car
olin
aU
nite
d St
ates
Alas
kaIll
inoi
s
Wyo
min
gVe
rmon
tOk
laho
ma
Dela
war
eFl
orid
aW
isco
nsin
Mar
ylan
dCo
lora
doN
evad
aM
isso
uri
Nor
th D
akot
aIo
wa
Oreg
onCo
nnec
ticut
Mas
sach
uset
tsM
aine
Ohio
Mic
higa
nM
issi
ssip
piN
ebra
ska
Sout
h Da
kota
Rhod
e Is
land
Mon
tana
Kans
asHa
wai
iId
aho
Utah
Arizo
naAl
abam
aN
ew H
amps
hire
6%
13%
20%
38%
0%
Gra
nt A
id a
s a
Perc
enta
geof
Fis
cal S
uppo
rt
0%
10%
20%
30%
40%
New
Ham
pshi
reAl
abam
aHa
wai
iUt
ahId
aho
Mon
tana
Sout
h Da
kota
Kans
asN
ebra
ska
Arizo
naM
issi
ssip
piCo
nnec
ticut
Wyo
min
gAl
aska
Rhod
e Is
land
Nor
th D
akot
aM
aine
Mic
higa
nM
aryl
and
Ohio
Mas
sach
uset
tsIll
inoi
sN
evad
aIo
wa
Wis
cons
inN
orth
Car
olin
aOr
egon
Okla
hom
aDe
law
are
Flor
ida
Mis
sour
iTe
xas
New
Mex
ico
Uni
ted
Stat
esAr
kans
asM
inne
sota
Colo
rado
Calif
orni
aKe
ntuc
kyIn
dian
aN
ew Y
ork
New
Jer
sey
Wes
t Virg
inia
Geor
gia
Verm
ont
Tenn
esse
eW
ashi
ngto
nVi
rgin
iaLo
uisi
ana
Penn
sylv
ania
Sout
h Ca
rolin
a
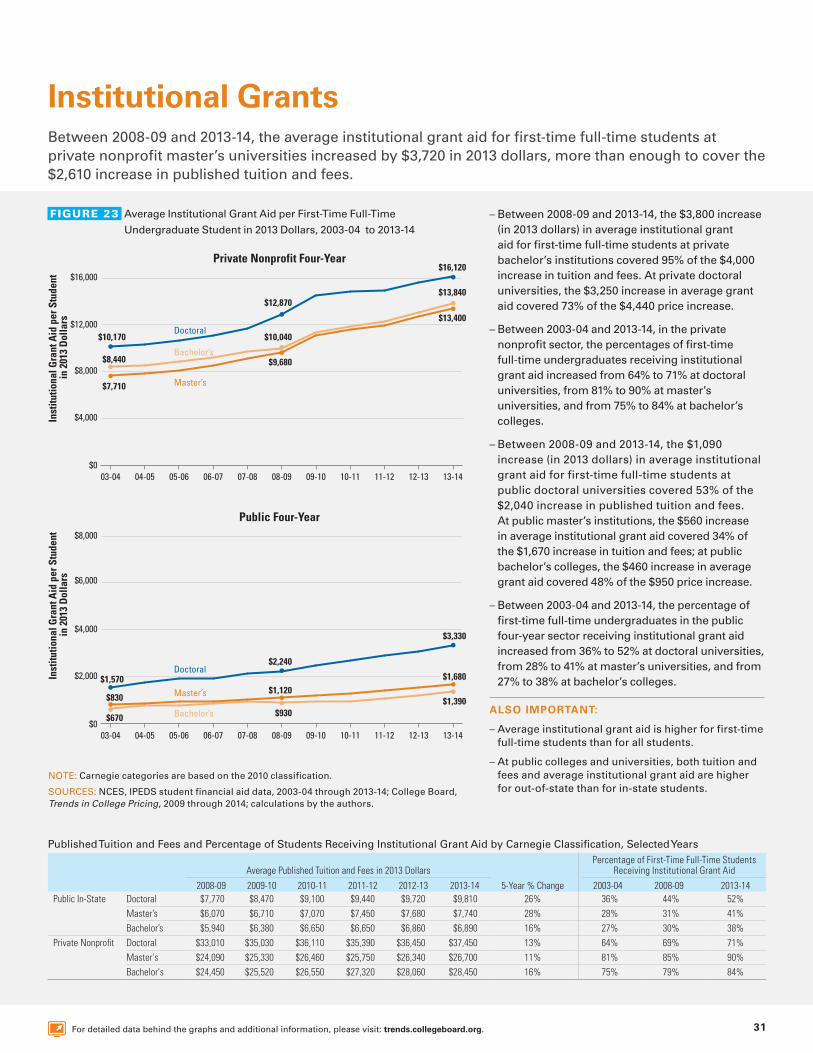
31For detailed data behind the graphs and additional information, please visit: trends.collegeboard.org.
Institutional GrantsBetween 2008-09 and 2013-14, the average institutional grant aid for first-time full-time students at private nonprofit master’s universities increased by $3,720 in 2013 dollars, more than enough to cover the $2,610 increase in published tuition and fees.
– Between 2008-09 and 2013-14, the $3,800 increase (in 2013 dollars) in average institutional grant aid for first-time full-time students at private bachelor’s institutions covered 95% of the $4,000 increase in tuition and fees. At private doctoral universities, the $3,250 increase in average grant aid covered 73% of the $4,440 price increase.
– Between 2003-04 and 2013-14, in the private nonprofit sector, the percentages of first-time full-time undergraduates receiving institutional grant aid increased from 64% to 71% at doctoral universities, from 81% to 90% at master’s universities, and from 75% to 84% at bachelor’s colleges.
– Between 2008-09 and 2013-14, the $1,090 increase (in 2013 dollars) in average institutional grant aid for first-time full-time students at public doctoral universities covered 53% of the $2,040 increase in published tuition and fees. At public master’s institutions, the $560 increase in average institutional grant aid covered 34% of the $1,670 increase in tuition and fees; at public bachelor’s colleges, the $460 increase in average grant aid covered 48% of the $950 price increase.
– Between 2003-04 and 2013-14, the percentage of first-time full-time undergraduates in the public four-year sector receiving institutional grant aid increased from 36% to 52% at doctoral universities, from 28% to 41% at master’s universities, and from 27% to 38% at bachelor’s colleges.
ALSO IMPORTANT:
– Average institutional grant aid is higher for first-time full-time students than for all students.
– At public colleges and universities, both tuition and fees and average institutional grant aid are higher for out-of-state than for in-state students.
FIGURE 23 Average Institutional Grant Aid per First-Time Full-Time
Undergraduate Student in 2013 Dollars, 2003-04 to 2013-14
NOTE: Carnegie categories are based on the 2010 classification.
SOURCES: NCES, IPEDS student financial aid data, 2003-04 through 2013-14; College Board, Trends in College Pricing, 2009 through 2014; calculations by the authors.
Master’s
Bachelor’s
Doctoral
In
stitu
tiona
l Gra
nt A
id p
er S
tude
nt
in 2
013
Dol
lars
$9,680
$10,040
$16,120
$13,840
$13,400
$12,870
$10,170
$8,440
$7,710
Private Nonprofit Four-Year
$0
$4,000
$8,000
$12,000
$16,000
13-1412-1311-1210-1109-1008-0907-0806-0705-0604-0503-04
Master’s
Bachelor’s
Doctoral
In
stitu
tiona
l Gra
nt A
id p
er S
tude
nt
in 2
013
Dol
lars
$930
$1,120
$3,330
$1,680
$1,390
$2,240
$1,570
$830
$670
Public Four-Year
$0
$2,000
$4,000
$6,000
$8,000
09-10 13-1412-1311-1208-0907-0806-0705-0604-0503-04 10-11
Average Published Tuition and Fees in 2013 DollarsPercentage of First-Time Full-Time Students
Receiving Institutional Grant Aid
2008-09 2009-10 2010-11 2011-12 2012-13 2013-14 5-Year % Change 2003-04 2008-09 2013-14Public In-State Doctoral $7,770 $8,470 $9,100 $9,440 $9,720 $9,810 26% 36% 44% 52% Master’s $6,070 $6,710 $7,070 $7,450 $7,680 $7,740 28% 28% 31% 41% Bachelor’s $5,940 $6,380 $6,650 $6,650 $6,860 $6,890 16% 27% 30% 38%Private Nonprofit Doctoral $33,010 $35,030 $36,110 $35,390 $36,450 $37,450 13% 64% 69% 71% Master's $24,090 $25,330 $26,460 $25,750 $26,340 $26,700 11% 81% 85% 90%
Bachelor's $24,450 $25,520 $26,550 $27,320 $28,060 $28,450 16% 75% 79% 84%
Published Tuition and Fees and Percentage of Students Receiving Institutional Grant Aid by Carnegie Classification, Selected Years

32 For detailed data behind the graphs and additional information, please visit: trends.collegeboard.org.
Education Tax Credits and Tuition DeductionsIn 2014, about a quarter of the benefits of the federal education tax credits went to tax filers with incomes of $25,000 or less, a quarter went to those with incomes between $100,000 and $180,000, and half went to those with incomes in between.
– In 2014, about 57% of the benefits of the tuition tax deductions went to tax filers with incomes above $100,000, but the deductions accounted for only about 2% of the tax savings from tuition tax credits and deductions combined.
– Tax savings for students and parents who claimed education tax credits averaged about $1,400 in 2014.
– In 2014, students and parents saved about $18.2 billion on their federal income taxes through tax credits and deductions for education expenses. This form of subsidy to students was about $7.6 billion (in 2014 dollars) in 2004 and $19.9 billion in 2010.
ALSO IMPORTANT:
– Education tax credits and deductions are “tax expenditures.” They reduce federal income tax liabilities and federal tax revenues, and have the same impact on the federal budget as direct expenditures.
– The American Opportunity Tax Credit, which is available to taxpayers with adjusted gross incomes as high as $180,000, accounted for about 86% of the total education credits and deductions (Fiscal Year 2016, Analytical Perspectives, Budget of the U.S. Government). The maximum benefit per filer is $2,500, with up to $1,000 of that amount available as a refund to filers with no tax liability.
– About one quarter of undergraduates are ineligible for education tax credits because they do not pay tuition out of pocket. Many low-income students receive federal and state grant aid that covers tuition and fees; living costs are not qualifying expenses for education tax credits and deductions. (Delisle and Dancy, A New Look at Tuition Tax Benefits, 2015)
– In 2014, 12.1 million taxpayers deducted $12.8 billion in student loan interest, generating about $1.7 billion in tax savings. (Statistics of Income, 2014, Table 1.4; Fiscal Year 2016, Analytical Perspectives, Budget of the U.S. Government)
FIGURE 24A Distribution of Education Tax Credits and Savings from Tuition
Deductions by Adjusted Gross Income (AGI), 2014
FIGURE 24B Total Education Tax Credits and Savings from Tuition Deductions in
Billions of 2014 Dollars, 1998 to 2014
NOTES: The total and average values of tax credits and deductions are best estimates based on data from the Internal Revenue Service. A portion of nonrefundable dollars claimed on nontaxable returns is excluded to account for credits and deductions that do not reduce tax liability. The value of tax deductions is estimated based on applicable marginal tax rates. Percentages may not sum to 100 because of rounding.
SOURCES: Internal Revenue Service, Statistics of Income 1998 to 2015, Tables 1.3, 1.4, 2, 3.3; calculations by the authors.
Education Tax Credits (Average = $1,400)
Tuition andFee Deductions
(Average = $400)
Credits and Deductions
$100,000 to$180,000
$75,000 to$99,999
$50,000 to$74,999
$25,000 to$49,999
Less than $25,000
23%23% 16% 13% 24%
8%3% 24% 7% 57%
23%24% 16% 13% 24%
Total Savings in Billions of Dollars
1998
$5$0 $10 $15 $20
2000
2002
2004
2006
2008
2010
2012
2014
Total DeductionsTotal Credits
$18.2
$18.1
$19.9
$7.3
$7.7
$7.6
$6.6
$5.7
$4.3
$17.8
$17.6
$19.3
$5.8
$6.1
$5.6
$5.2
$5.7
$4.3

33For detailed data behind the graphs and additional information, please visit: trends.collegeboard.org.
Notes and Sources
DATA DEFINITIONS
Federal Aid:
FSEOG. Federal aid amounts include only federal funds allocated for the Federal Supplemental Educational Opportunity Grant (FSEOG) program. Institutional matching funds required since 1989-90 are reported under institutional grants.
Veterans and Military. Veterans benefits are payments for postsecondary education and training to veterans and their dependents, including the Post-9/11 Veterans Educational Assistance program established in 2009-10 and all programs established earlier, as well as the Iraq and Afghanistan Service Grants program, which began in 2010-11 and provides non-need-based grants for students whose parent or guardian was a member of the Armed Forces who died in Iraq or Afghanistan as a result of performing military service after Sept. 11, 2001. Includes estimates of benefits for active duty military members.
Perkins Loans. Since FY06, no funds have been appropriated for new federal capital contributions. Perkins Loans are funded from past federal and institutional capital contributions as well as collections from borrowers. All Perkins Loans awarded are included as federal loans.
Federal Subsidized and Unsubsidized Loans. Prior to 1993-94, federal Subsidized and Unsubsidized Loans for students were made by banks and other private lenders and guaranteed by the federal government. From 1994-95 through 2009-10, the guaranteed loan program, known as the Federal Family Education Loan Program (FFELP), continued alongside the Federal Direct Loan Program (FDLP), which lends federal funds to students. Beginning in 2010-11, all of the loans are Federal Direct Subsidized or Unsubsidized Loans.
Subsidized Loans are need-based student loans for which the federal government pays the interest while the student is in school and during a six-month grace period thereafter. Prior to June 2012, these loans were available to both undergraduate and graduate students, but the Budget Control Act of 2011 eliminated the program for graduate students, whose federal loans are now all Unsubsidized or Grad PLUS loans. Interest accrues on Unsubsidized Loans from the time they are disbursed.
Tax Benefits. Data on education tax credits are authors’ estimates based on IRS data on the volume of Hope, Lifetime Learning, and American Opportunity credits for tax years 1998 and later. A portion of nonrefundable dollars claimed on nontaxable returns is excluded to account for credits that do not reduce tax liability. Tax deductions are based on IRS Statistics of Income Table 1.4, with associated savings estimated by the authors based on the marginal tax rates applied to the taxable income of the taxpayers in each income bracket claiming the deduction on taxable returns. Calendar year amounts are split between the two associated academic years.
Full-Time Equivalent (FTE) Students: Enrollment numbers are based on a federal formula that counts each part-time student as equivalent to one-third of a full-time student.
Graduate and Undergraduate Aid: The breakdown of aid between undergraduate and graduate students is estimated based on the National Postsecondary Student Aid Study (NPSAS) when not available from other sources.
Inflation Adjustment: The Consumer Price Index for all urban dwellers (CPI-U) is used to adjust for inflation. We use the CPI-U in July of the year in which the academic year begins. See www.bls.gov/data/ for changes in the CPI-U over time.
Loan Totals: Nonfederal loans from private lenders, states, and institutions are included in Table 1 and several other figures and tables as an important source of funding for students, but are not considered financial aid because they provide no subsidy to students.
34
SOURCES
Campus-Based Aid (FWS, Perkins, and FSEOG), Iraq and Afghanistan Service Grants, and ACG/SMART Grants: U.S. Department of Education, Annual Federal Program Data Books.
Education Tax Benefits: Income Tax Returns, All Returns, Tables 1.3, 1.4, 2, and 3.3.
Federal Subsidized and Unsubsidized Student Loans: 2009-10 and prior: unpublished data provided by the U.S. Department of Education staff; 2010-11 and after: Federal Student Aid Data Center, Title IV Program Volume Reports. Because the Federal Student Aid Data Center will continue to update the loan volume after each academic year ends, we adjusted the 2015-16 data (obtained in July 2016) using the percentage change between July 2015 and July 2016 for the 2014-15 loan volume.
Institutional Grants: IPEDS finance survey; estimated for 2014-15 and 2015-16. Estimated figures represent best approximations and are updated each year as additional information becomes available.
Nonfederal Loans: Estimates for 2011-12 through 2015-16 are based on data provided by the Consumer Bankers Association, MeasureOne, and the Consumer Financial Protection Bureau. Earlier data are based on information provided by lenders supplemented by data from annual reports and from NPSAS 2008. Estimates of institutional lending are based on NPSAS 2008 and 2012, as well as a survey of institutions conducted for the College Board by the National Association of Student Financial Aid Administrators (NASFAA). Data on loans from states are based on information collected from staff of state-sponsored private loan programs or state grant agencies, in addition to NASSGAP.
Pell Grant Program: 2014-15 and prior: Federal Pell Grant Program End-of-Year Report; 2015-16: Federal Student Aid Data Center, Title IV Program Volume Reports.
Private and Employer Grants: Estimates are based on data included in NPSAS and on National Scholarship Providers Association surveys of major private student grant providers, supplemented by information from annual reports of selected scholarship providers, data from institutional financial aid offices, and the College Board’s Annual Survey of Colleges.
State Grant Programs: 20th through 46th Annual Survey Reports of the National Association of State Student Grant and Aid Programs (NASSGAP) for 1988-89 to 2014-15 and estimated for 2015-16.
Veterans Benefits: Benefits Program series (annual publication for each fiscal year), U.S. Department of Veterans Affairs, Office of Budget and Finance.

Trends in Student Aid was authored by Sandy Baum, senior fellow at the Urban Institute; Jennifer Ma, policy research scientist at the College Board; Matea Pender, associate policy research scientist at the College Board; and Meredith Welch, policy research analyst at the College Board.
Contact Information for the Authors [email protected] [email protected]
Trends in Student Aid and its companion report, Trends in College Pricing, are supplemented by a website that makes detailed data available for reference and downloading. The PDF versions of these reports, along with PowerPoint slides of all the graphs, are available on the web: trends.collegeboard.org.
Hard copies may be requested by contacting [email protected].
Tables, graphs, and data in this report or excerpts thereof may be reproduced or cited, for noncommercial purposes only, provided that the following attribution is included:
Source: Trends in Student Aid. © 2016 The College Board.
www.collegeboard.org
ACKNOWLEDGMENTS
Carol Whang and Robert Majoros provided critical support for this publication. We also benefited from comments from D’Wayne Bell, Jack Buckley, Jessica Howell, Michael Hurwitz, and Anne Sturtevant. Larry L. Clay at RTI International provided expert graphic design work. The publication would not have been possible without the cooperation and support of many individuals at the College Board, including Jaclyn Bergeron, Chris Hagan, Abby Hexter, Alejandro Leal, Kathryn McGinley, Randy Peery, Jose Rios, Matt Walsh, and Jenny Xie.
We thank all of those who contributed to the data collection for this publication, especially federal and state grant agency contacts, Charlotte Etier of the National Association of Student Financial Aid Administration (NASFAA), and Mike Solomon of the Illinois Student Aid Commission.

www.collegeboard.orgtrends.collegeboard.org
00527_003
December 2016