Embed Size (px)
Citation preview
T R E N D S I N H I G H E R E D U C A T I O N S E R I E S
Student AidTRENDS IN
2008
2
T R E N D S I N H I G H E R E D U C A T I O N S E R I E S
HighlightsTotal AidIn 2007-08, undergraduate students received an average of $8,896 in financial aid per full-time equivalent (FTE) student, including $4,656 in grant aid and $3,650 in federal loans. Graduate students received an average of $20,320 in aid per FTE student, including $6,948 in grant aid and $12,746 in federal loans.
Both total grant aid per undergraduate and total federal loans per undergraduate increased by about 5.5% in 2007-08, after adjusting for inflation.
During the 2007-08 academic year, more than $143 billion in financial aid was distributed to undergraduate and graduate students in the form of grants from all sources, federal loans, federal work-study, and federal tax credits and deductions. In addition, students borrowed about $19 billion from state and private sources to help finance their education.
Total student aid increased by about 84% in inflation-adjusted dollars over the decade from 1997-98 to 2007-08. Total FTE postsecondary enrollment increased by 28% over the decade.
Loans have declined from 75% to 70% of total federalaid over the decade. Federal education tax benefits, introduced in 1998-99, now constitute 7% of federal aid to postsecondary students.
In 2006-07, 31% of Pell Grants went to the one-third of undergraduate students enrolled in public two-year colleges. Thirty-four percent went to public four-year college students (42% of undergraduate enrollment), 16% to private not-for-profit college students (19% of undergraduate enrollment), and 19% to students at for-profit institutions (7% of under-graduate enrollment).
In contrast, 8% of campus-based funds went to communitycollege students, 39% to public four-year college students, 46% to those enrolled in private not-for-profit institutions, and 7% to students at for-profit institutions.
Grant AidAverage grant aid per undergraduate FTE increased by $1,494 (in constant 2007 dollars) from 1997-98 to 2007-08. This amount is about two-thirds of the dollar increase in average tuition and fees at public four-year institutions and one-quarter of the increase in average tuition and fees at private not-for-profit institutions over the decade.
After holding steady at 5.2 million for two years, the number of Pell Grant recipients rose by 5%, to 5.4 million in 2007-08, resulting in a 45% increase over the decade.
Total Pell Grant expenditures increased by 76% in constant dollars from 1997-98 to 2004-05. Following a 9% decline from 2004-05 to 2006-07, the 2007-08 increase returned Pell dollars to their 2003-04 level.
The percentage of tuition and fees and room and board at the average public four-year college covered by the maximum Pell Grant increased from 36% to 41% between 1997-98 and 2002-03, but declined to 30% by 2007-08 before increasing to 33% in 2008-09. The percentage of tuition andfees and room and board at the average private four-year college covered by the maximum Pell Grant increased from 14% to 16% between 1997-98 and 2002-03, but declined to 13% by 2007-08, before returning to 14% in 2008-09.
In 2007-08, the second year of the Academic Competi-tiveness Grant (ACG) program, 456,000 students received awards averaging $768. Seventy-two thousand students received SMART Grants averaging $3,194.
In 2007-08, state grant aid funds increased by about 3% in constant dollars. After increasing rapidly from less than 10% in 1992-93 to 27% in 2004-05, the proportion of state grant dollars not based on need continues to rise slowly, and in 2006-07 was about 28%.
Institutions provide the largest source of grant aid, with these discounts to students comprising 21% of student aid to undergraduates and 17% of graduate aid in 2007-08. Institutional grants represent 42% of all grant aid, while federal grants are 31% of the total.
Estimates from the College Board’s Annual Survey of Colleges indicate that the proportion of institutional grant aid at public four-year colleges and universities going to meet financial need increased from 35% to 44% between 2000-01 and 2006-07. At private four-year institutions, this proportion remained steady at about 70% over this time period.
Among private institutions, higher proportions of grant dollars go to meet need at higher-priced colleges and universities and, on average, grant aid covers a higher fraction of tuition and fees at these institutions than at lower-priced private institutions.
Student BorrowingAfter two years of slow growth, federal education loan volume increased by 6% in inflation-adjusted dollars between 2006-07 and 2007-08. Subsidized Stafford Loans increased by 11%, unsubsidized loans grew by 6%, and PLUS Loans grew by 1%. Perkins Loans declined by 33%, to $1.1 billion.
The rapid growth in student borrowing from nonfederal sources slowed in 2006-07, and in 2007-08, the volume of these private loans declined by about 1% in constant dollars.
Subsidized Stafford Loans declined from 52% of total education loans in 1997-98 to 34% in 2007-08.
Over half of Stafford Loan borrowers in 2007-08 received both subsidized and unsubsidized Stafford Loans.
Total borrowing through the William D. Ford Federal Direct Student Loan Program (FDSLP) increased by 7% in constant dollars in 2007-08 after three years of decline. Over the decade, the volume of Stafford and PLUS Loans disbursed through this program increased by 2%.
Total borrowing through the Federal Family Education Loan Program (FFELP) increased by 8% in constant dollars in 2007-08. Over the decade, the volume of Stafford and PLUS Loans disbursed through this program increased by 111%.
Estimates from the Annual Survey of Colleges indicate that for the approximately 60% of 2006-07 bachelor’s degree recipients who graduated with debt, average total debt was about $22,700.
Other College FundingIn 2007-08, 8.5 million taxpayers benefited from federal education tax credits and deductions and 5.4 million students received Pell Grants. In contrast, 1.3 million undergraduates received Federal Supplemental Educational Opportunity Grants (FSEOG) and only 792,000 students received Federal Work-Study support.
After increasing at a rate of about 40% a year in constant dollars for a decade, total assets in 529 college savings accounts declined by 2% in 2008.
Federal education tax credits and deductions generated $6.5 billion in savings for taxpayers in 2006. About 41% of the benefit of the tax credits went to taxpayers with incomes below $50,000. Only about 11% of the benefit of the tuition tax deduction went to taxpayers with incomes below $50,000, while 59% went to those with incomes between $100,000 and $160,000.
For detailed background data and additional information, please visit www.collegeboard.com/trends.
3
T R E N D S I N S T U D E N T A I D 2 0 0 8
Highlights . . . . . . . . . . . . . . . . . . . . . . . . . . . . . . . . . . . . . . . . . . . . . . . . . . . .2
Contents . . . . . . . . . . . . . . . . . . . . . . . . . . . . . . . . . . . . . . . . . . . . . . . . . . . .3
Introduction . . . . . . . . . . . . . . . . . . . . . . . . . . . . . . . . . . . . . . . . . . . . . . . . . .4
Total Student Aid—Adjusted for Inflation . . . . . . . . . . . . . . . . . . . . . . . . 6
Total Undergraduate and Graduate Student Aid by Type . . . . . . . . . . . . 7
Federal Aid Recipients . . . . . . . . . . . . . . . . . . . . . . . . . . . . . . . . . . . . . . 8
Types of Grants and Loans . . . . . . . . . . . . . . . . . . . . . . . . . . . . . . . . . . 9
Loan Consolidation . . . . . . . . . . . . . . . . . . . . . . . . . . . . . . . . . . . . . . . 10
Student Debt . . . . . . . . . . . . . . . . . . . . . . . . . . . . . . . . . . . . . . . . . . . . 11
Federal Aid by Sector . . . . . . . . . . . . . . . . . . . . . . . . . . . . . . . . . . . . . . 12
Total Grants and Total Loans . . . . . . . . . . . . . . . . . . . . . . . . . . . . . . . . 12
Total Aid per Full-Time Equivalent Student . . . . . . . . . . . . . . . . . . . . . 13
Pell Grants . . . . . . . . . . . . . . . . . . . . . . . . . . . . . . . . . . . . . . . . . . . . . . 14
State Grants to Undergraduate Students . . . . . . . . . . . . . . . . . . . . . . 15
Institutional Grant Aid . . . . . . . . . . . . . . . . . . . . . . . . . . . . . . . . . . . . . 16
Federal Education Tax Credits and Tuition Deductions . . . . . . . . . . . . . 17
College Savings Plans . . . . . . . . . . . . . . . . . . . . . . . . . . . . . . . . . . . . . 18
Notes and Sources . . . . . . . . . . . . . . . . . . . . . . . . . . . . . . . . . . . . . . . 19
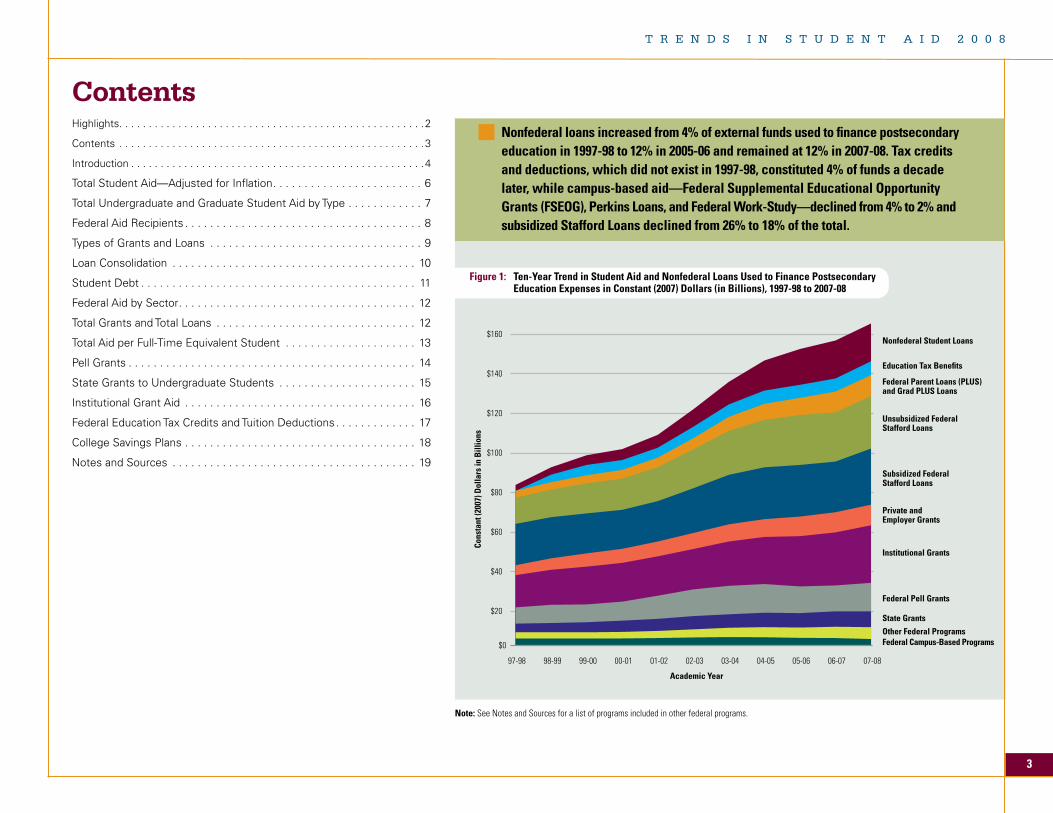
ContentsNonfederal loans increased from 4% of external funds used to finance postsecondary education in 1997-98 to 12% in 2005-06 and remained at 12% in 2007-08. Tax credits and deductions, which did not exist in 1997-98, constituted 4% of funds a decade later, while campus-based aid—Federal Supplemental Educational Opportunity Grants (FSEOG), Perkins Loans, and Federal Work-Study—declined from 4% to 2% and subsidized Stafford Loans declined from 26% to 18% of the total.
Figure 1: Ten-Year Trend in Student Aid and Nonfederal Loans Used to Finance Postsecondary Education Expenses in Constant (2007) Dollars (in Billions), 1997-98 to 2007-08
Note: See Notes and Sources for a list of programs included in other federal programs.
$0
$20
$40
$60
$80
$100
$120
$140
$160
07-0806-0705-0604-0503-0402-0301-0200-0199-0098-9997-98
Academic Year
Cons
tant
(200
7) D
olla
rs in
Bill
ions
Nonfederal Student Loans
Education Tax Benefits
Federal Parent Loans (PLUS)and Grad PLUS Loans
Unsubsidized FederalStafford Loans
Subsidized Federal Stafford Loans
Private and Employer Grants
Institutional Grants
Federal Pell Grants
State Grants
Other Federal ProgramsFederal Campus-Based Programs
4
T R E N D S I N H I G H E R E D U C A T I O N S E R I E S
Every year since 1983, the College Board has published a new edition of Trends in Student Aid, providing detailed updated information on the sources, forms, and amounts of financial aid available to assist students and families in paying for postsecondary education. This 2008 edition continues that tradition in an expanded and innovative format. The revised and shortened print version of Trends is supplemented by a new Web site that makes detailed tables easily available for reference and downloading.
The print edition of Trends in Student Aid includes our standard table detailing the total amount of student aid available over the past decade in constant dollars. However, all other tables have been moved online, allowing the print edition to focus on easy-to-read graphics that illustrate and summarize much of the information in the detailed tables available on the Web site. The text accompanying the graphics provides insights into and highlights of the data depicted.
Trends in Student Aid reports on the total amount of financial aid distributed to students. It also divides this amount by type, separating grants, loans, work aid, and tax benefits. These various types of aid are provided by the federal government and state governments, by colleges and universities themselves, and by employers and other private entities. Growth in aggre-gate amounts of aid may be misleading in an environment of rising enrollments and rising college prices. To understand the impact of financial aid on educational opportunities, it is important to examine the breakdown of aid between graduate and undergraduate students, the amount of aid per student, and the distribution of aid across institution types and by student characteristics.
This year’s innovations in Trends in Student Aid are paralleled by changes in its companion publication, Trends in CollegePricing, which relies on data from the College Board’s Annual Survey of Colleges (ASC) to provide information on changes in undergraduate tuition and fees, room and board, and other estimated expenses related to attending colleges and universities. Although the latest data available for Trends in Student Aid are for the 2007-08 academic year, Trends in College Pricing includes information on published prices for the 2008-09 academic year.
Go to www.collegeboard.com/trends to access the online tables and graphs, along with additional commentary.
Total Student AidFigure 1 and Table 1 report on the total funds available to postsecondary students, both undergraduate and graduate, to supplement family and student payments over the decade from 1997-98 to 2007-08. These funds include both student aid dollars and the loans students take from private sources. Together with their own savings and earnings, as well as support from parental earnings, savings, and borrowing from other sources, all of these funds contribute to making higher education financially accessible.
We report on percentage increases of each type and source of aid over the decade. However, it is important to keep in mind that the percentage increases have very different impli-cations depending on the starting level. The 536% increase in nonfederal loans represents a $16.1 billion increase from $3.0 billion in 1997-98 to $19.1 billion in 2007-08. In contrast, the 70% increase in federal loans represents a $27.6 billion increase from $39.3 billion to $66.8 billion. It is also important to consider this table with a perspective on enrollment growth. In 2007-08, total full-time equivalent enrollment included three million more students than it had a decade earlier, a 28% increase.
The figures in Table 1 have been adjusted for inflation. Similar tables in current dollars (unadjusted) and broken down between undergraduate and graduate students are available online.
Types of Student AidFrom the student’s perspective, grant aid, which is a pure subsidy not requiring repayment, is the most desirable form of financial aid. Education tax credits and deductions are also pure subsidies, although the fact that the savings generally materialize months after the bills have been paid makes them less effective in facilitating college access.
A variety of forms of loans are described in this publication. Subsidized Stafford Loans and Perkins Loans provide the greatest benefit for students, since the government pays the interest while the student is in school. Unsubsidized Stafford Loans and PLUS Loans for parents of undergraduate students and for graduate students also carry a federal guarantee and interest rates that are limited by legislation. In contrast, private loans for education from banks and other lending institutions are not subsidized at all. Their value is only in providing liquidity for student’s who have no other means of accessing funds. We report on private student loans because
of their importance, but do not include them in our measures of student aid, since they do not carry any subsidy.
A small amount of student aid comes in the form of the Federal Work-Study (FWS) Program under which the federal government provides funds to institutions to subsidize the wages they pay to some student workers with documented financial need. Although these funds are packaged along with grants and loans to help students pay their bills, from the students’ perspective, they are simply wages received for services performed.
As Figure 2 reveals, the composition of the aid received by graduate students is quite different from the composition of the aid on which undergraduates rely. Federal loans play a much larger role for graduate students, while federal grants provide more support to undergraduates. The teaching and research assistantships from which many graduate students benefit are a form of compensation and are not included here.
Federal AidWe have moved much of the detailed information on federal student aid that has historically been included in Trends in Student Aid to the Trends Web site. However, the graphs in the print publication summarize some of the key aspects of these data. For example, Figure 3 illustrates the number of recipients of each of the major federal programs in 2007-08, as well as the average amount received. The graph shows clearly that federal education tax benefits and Pell Grants reach many more students than either the campus-based aid programs or the new grants that supplement Pell for some recipients. Figure 4 highlights how the proportion of students borrowing under the various federal loan programs has changed over time. Perhaps most important, it clarifies the often ignored reality that the majority of students do not rely on federal loans in any given year. This graph, which reports only on federal Stafford Loans, includes part-time students, who are much less likely than full-time students to borrow. In addition, many students borrow one year but not every year, so the proportion of students who leave school with debt is higher than the 40% represented here.
The allocation of federal student aid funds differs across programs. Need-based federal aid relies on the information provided by students and parents on the Free Application for Federal Student Aid (FAFSA) and the formula known as Federal Methodology (FM). Pell Grants are distributed based
Introduction
For detailed background data and additional information, please visit www.collegeboard.com/trends.
5
T R E N D S I N S T U D E N T A I D 2 0 0 8
on the expected family contribution (EFC) determined by this formula and do not depend on the charges at the particular school attended. Subsidized Stafford Loan eligibility is based on both the EFC and the cost of attendance at the student’s institution. A student who is found to have financial need at a high-priced institution might not have measured need and might not receive a subsidized Stafford Loan if she attended a less expensive college or university. Campus-based federal funds, including Federal Work-Study, Federal Supplemental Educational Opportunity Grants (FSEOG), and Perkins Loans are also need-based. However, these funds are distributed to institutions based on a complex formula and the institutions allocate them to students with financial need. Unsubsidized Stafford Loans are available to all students regardless of their financial circumstances; PLUS Loans require only the absence of adverse credit. Figure 9 illustrates the distribution of these various forms of aid to students at different types of institutions that results from these various allocation methods.
Grant AidGrant aid comes from the federal government, state governments, employers and other private sources, and from colleges and universities in the form of discounts from the published price. As Figure 5 shows, these sources have contributed fairly stable portions of total grant aid over the course of the 1997-98 to 2007-08 decade.
Pell Grants are of particular interest because this federal grant program, targeted at low- and moderate-income students, is the foundation of the aid system, intended to provide access to postsecondary education for those least able to afford it. Figure 12 provides details on Pell Grants over time. The maxi-mum Pell Grant, awarded to students whose incomes are too low to generate any expected family contribution, increased to $4,310 in 2007-08 after remaining at $4,050 from 2003-04 through 2006-07. (The maximum Pell Grant is $4,731 for 2008-09.) While federal expenditures on Pell Grants increased by 75%, from $6.2 billion to $14.4 billion in constant 2007 dollars over the decade, the combination of rising college prices and an increase in the number of recipients from 3.7 million to 5.4 million has diluted the value of these grants to individual students.
The largest portion of grant aid comes from colleges and universities. The data available on institutional grant aid are less precise than those on state and federal awards.
In addition to the estimates of total institutional aid found in Table 1, this year we include more detailed data from the College Board’s Annual Survey of Colleges (ASC). While some data sources define need-based aid according to the institution’s motivation for allocating the funds, the ASC asks institutions to classify as need-based any grants that meet the documented need of students. Many factors contribute to the amount of aid falling into this category, including differing institutional policies and the reality that students qualify for need-based aid at higher incomes when the cost of attendance is higher.
LoansThe federal government, the primary source of education loans, offers several different types of loans. In addition, the private loan market, which has received considerable attention in recent months as the result of widespread difficulties in credit markets, is an important supplementary source of funds for students. Because our data do not include the 2008-09 academic year, the effects of the credit crisis are not fully reflected here. However, as indicated in Table 1, our survey of lenders indicates that private loan volume declined slightly in real terms, from $19.2 billion in 2006-07 to $19.1 billion in 2007-08. About 85% of these loans go to undergraduate students.
There are two types of funding for federal education loans. Under the William D. Ford Federal Direct Student Loan Program (FDSLP), students borrow directly from the government. Under the Federal Family Education Loan Program (FFELP), the federal government guarantees loans issued by private lenders. The division of loans between these two programs can be found in Table 1. The proportion of federal loans provided through FDSLP declined from 34% in 1997-98 to 27% in 2002-03 and 20% in 2007-08. However, as many institutions have chosen to move into the direct lending program to ensure that their students will have uninterrupted access to federal loans, the proportion is likely to be higher in 2008-09.
All Stafford Loans issued in 2006-07 and 2007-08 carry fixed interest rates of 6.8%. Beginning in 2008-09, the rates on subsidized Stafford Loans for undergraduate students are lower, scheduled to decline to 3.4% in 2011-12. Interest rates on both Stafford and PLUS Loans varied with market rates before 2006-07. Borrowers could lock in fixed rates by consolidating their loans. Trends in Student Aid reports on loan consolidation for
the first time in Figure 7. Loan consolidation was very popular when it allowed borrowers to lock in low interest rates and avoid the impact of rising interest rates. The recent decline in consolidation reflects both the reality that a large proportion of outstanding debt is already consolidated and the fact that fixed interest rates have eliminated this advantage.
Concern over increasing student reliance on debt to finance postsecondary education is frequently reflected in discussion of the changing “grant/loan ratio.” Figure 10 illustrates the proportion of total funds from all sources that has been in the form of loans from 1991-92 through 2007-08. (Both federal loans and private loans are included here.) For graduate students, loans constitute 65% of these funds and grants 32%. In contrast, for undergraduate students, loans are 49% and grants 45%. A decade ago, both grants and loans were 49%. The decline in the share of grants has occurred despite the considerable growth in grant dollars described above. Loans have not replaced grants, but have grown more rapidly than grant aid in recent years, as college prices have risen, family incomes have stagnated, and grant aid has not increased rapidly enough to fill the growing gap.
The most reliable data on the amount of debt individual students accumulate comes periodically from the National Postsecondary Student Aid Study (NPSAS), a survey of a nationally representative sample of students. However, the most recent data available from this source are for the 2003-04 academic year. Figure 8 shows more recent data from the ASC, in which colleges and universities report the proportion of bachelor’s degree recipients who graduate with debt and the average amount of that debt. Because of incomplete responses to these questions, these estimates should be interpreted with caution. The data indicate that among the approximately 60% of graduates who took out loans that were reported to their institutions, average debt increased from $19,300 to $22,700 (in 2007 dollars) between 2000-01 and 2006-07.
We hope readers will find the new format of the Trends publications valuable. The tables supporting all of the graphs in this report, PDF versions of the publications and Power-Point files containing individual slides for all of the graphs, and other detailed data on student aid are available on our Web site at www.collegeboard.com/trends. Please feel free to cite or reproduce the data in Trends for noncommercial purposes with proper attribution.
6
T R E N D S I N H I G H E R E D U C A T I O N S E R I E S
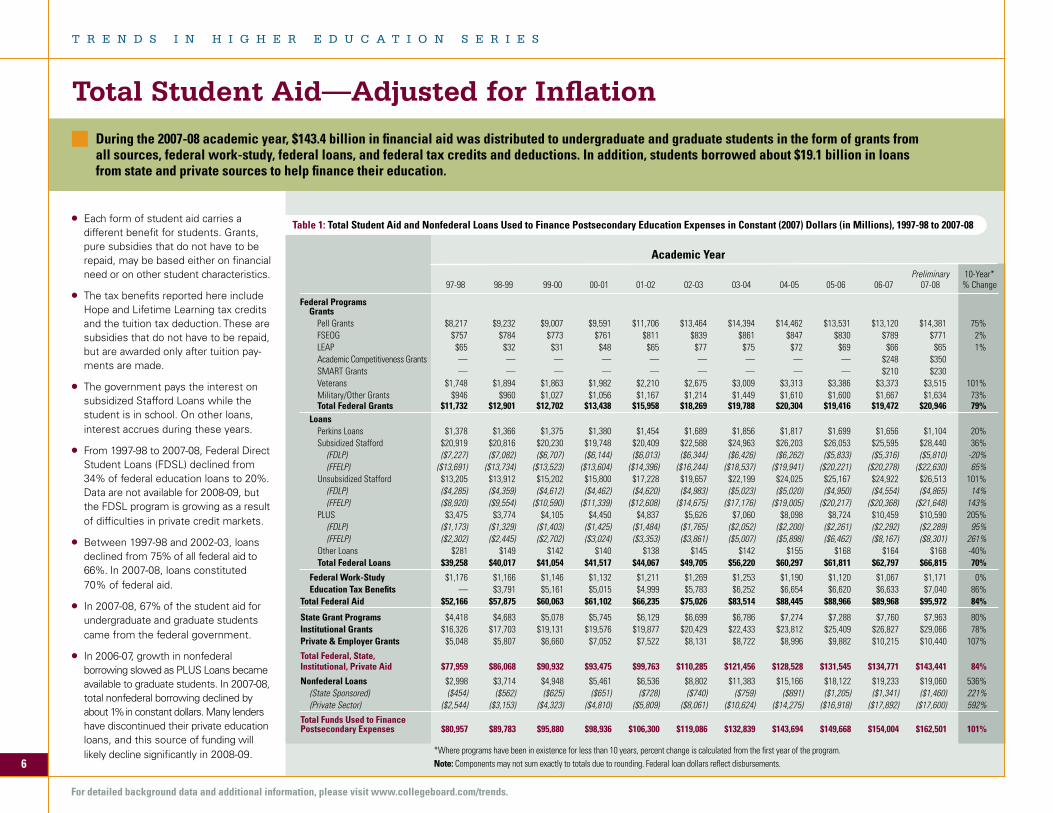
Table 1: Total Student Aid and Nonfederal Loans Used to Finance Postsecondary Education Expenses in Constant (2007) Dollars (in Millions), 1997-98 to 2007-08
*Where programs have been in existence for less than 10 years, percent change is calculated from the first year of the program.Note: Components may not sum exactly to totals due to rounding. Federal loan dollars reflect disbursements.
Academic Year Preliminary 10-Year* 97-98 98-99 99-00 00-01 01-02 02-03 03-04 04-05 05-06 06-07 07-08 % Change
Federal Programs Grants Pell Grants $8,217 $9,232 $9,007 $9,591 $11,706 $13,464 $14,394 $14,462 $13,531 $13,120 $14,381 75% FSEOG $757 $784 $773 $761 $811 $839 $861 $847 $830 $789 $771 2% LEAP $65 $32 $31 $48 $65 $77 $75 $72 $69 $66 $65 1% Academic Competitiveness Grants — — — — — — — — — $248 $350 SMART Grants — — — — — — — — — $210 $230 Veterans $1,748 $1,894 $1,863 $1,982 $2,210 $2,675 $3,009 $3,313 $3,386 $3,373 $3,515 101% Military/Other Grants $946 $960 $1,027 $1,056 $1,167 $1,214 $1,449 $1,610 $1,600 $1,667 $1,634 73% Total Federal Grants $11,732 $12,901 $12,702 $13,438 $15,958 $18,269 $19,788 $20,304 $19,416 $19,472 $20,946 79% Loans Perkins Loans $1,378 $1,366 $1,375 $1,380 $1,454 $1,689 $1,856 $1,817 $1,699 $1,656 $1,104 20% Subsidized Stafford $20,919 $20,816 $20,230 $19,748 $20,409 $22,588 $24,963 $26,203 $26,053 $25,595 $28,440 36% (FDLP) ($7,227) ($7,082) ($6,707) ($6,144) ($6,013) ($6,344) ($6,426) ($6,262) ($5,833) ($5,316) ($5,810) -20% (FFELP) ($13,691) ($13,734) ($13,523) ($13,604) ($14,396) ($16,244) ($18,537) ($19,941) ($20,221) ($20,278) ($22,630) 65% Unsubsidized Stafford $13,205 $13,912 $15,202 $15,800 $17,228 $19,657 $22,199 $24,025 $25,167 $24,922 $26,513 101% (FDLP) ($4,285) ($4,359) ($4,612) ($4,462) ($4,620) ($4,983) ($5,023) ($5,020) ($4,950) ($4,554) ($4,865) 14% (FFELP) ($8,920) ($9,554) ($10,590) ($11,339) ($12,608) ($14,675) ($17,176) ($19,005) ($20,217) ($20,368) ($21,648) 143% PLUS $3,475 $3,774 $4,105 $4,450 $4,837 $5,626 $7,060 $8,098 $8,724 $10,459 $10,590 205% (FDLP) ($1,173) ($1,329) ($1,403) ($1,425) ($1,484) ($1,765) ($2,052) ($2,200) ($2,261) ($2,292) ($2,289) 95% (FFELP) ($2,302) ($2,445) ($2,702) ($3,024) ($3,353) ($3,861) ($5,007) ($5,898) ($6,462) ($8,167) ($8,301) 261% Other Loans $281 $149 $142 $140 $138 $145 $142 $155 $168 $164 $168 -40% Total Federal Loans $39,258 $40,017 $41,054 $41,517 $44,067 $49,705 $56,220 $60,297 $61,811 $62,797 $66,815 70%
Federal Work-Study $1,176 $1,166 $1,146 $1,132 $1,211 $1,269 $1,253 $1,190 $1,120 $1,067 $1,171 0% Education Tax Benefits — $3,791 $5,161 $5,015 $4,999 $5,783 $6,252 $6,654 $6,620 $6,633 $7,040 86%Total Federal Aid $52,166 $57,875 $60,063 $61,102 $66,235 $75,026 $83,514 $88,445 $88,966 $89,968 $95,972 84%
State Grant Programs $4,418 $4,683 $5,078 $5,745 $6,129 $6,699 $6,786 $7,274 $7,288 $7,760 $7,963 80%Institutional Grants $16,326 $17,703 $19,131 $19,576 $19,877 $20,429 $22,433 $23,812 $25,409 $26,827 $29,066 78%Private & Employer Grants $5,048 $5,807 $6,660 $7,052 $7,522 $8,131 $8,722 $8,996 $9,882 $10,215 $10,440 107%
Total Federal, State, Institutional, Private Aid $77,959 $86,068 $90,932 $93,475 $99,763 $110,285 $121,456 $128,528 $131,545 $134,771 $143,441 84%
Nonfederal Loans $2,998 $3,714 $4,948 $5,461 $6,536 $8,802 $11,383 $15,166 $18,122 $19,233 $19,060 536% (State Sponsored) ($454) ($562) ($625) ($651) ($728) ($740) ($759) ($891) ($1,205) ($1,341) ($1,460) 221% (Private Sector) ($2,544) ($3,153) ($4,323) ($4,810) ($5,809) ($8,061) ($10,624) ($14,275) ($16,918) ($17,892) ($17,600) 592%
Total Funds Used to Finance Postsecondary Expenses $80,957 $89,783 $95,880 $98,936 $106,300 $119,086 $132,839 $143,694 $149,668 $154,004 $162,501 101%
During the 2007-08 academic year, $143.4 billion in financial aid was distributed to undergraduate and graduate students in the form of grants from all sources, federal work-study, federal loans, and federal tax credits and deductions. In addition, students borrowed about $19.1 billion in loans from state and private sources to help finance their education.
Total Student Aid—Adjusted for Inflation
Each form of student aid carries a different benefit for students. Grants, pure subsidies that do not have to be repaid, may be based either on financial need or on other student characteristics.
The tax benefits reported here include Hope and Lifetime Learning tax credits and the tuition tax deduction. These are subsidies that do not have to be repaid, but are awarded only after tuition pay-ments are made.
The government pays the interest on subsidized Stafford Loans while the student is in school. On other loans, interest accrues during these years.
From 1997-98 to 2007-08, Federal DirectStudent Loans (FDSL) declined from 34% of federal education loans to 20%.Data are not available for 2008-09, but the FDSL program is growing as a result of difficulties in private credit markets.
Between 1997-98 and 2002-03, loans declined from 75% of all federal aid to 66%. In 2007-08, loans constituted 70% of federal aid.
In 2007-08, 67% of the student aid for undergraduate and graduate students came from the federal government.
In 2006-07, growth in nonfederal borrowing slowed as PLUS Loans became available to graduate students. In 2007-08, total nonfederal borrowing declined by about 1% in constant dollars. Many lenders have discontinued their private education loans, and this source of funding will likely decline significantly in 2008-09.
For detailed background data and additional information, please visit www.collegeboard.com/trends.
• In2006-07,11.8million(87%)ofthe13.6millionfull-timeequivalent(FTE)postsecondarystudentswereundergraduatesand1.8million(13%)weregraduate students.
• Undergraduateandgraduatestudentsaredistributed differently across sectors. Forty-two percent of undergraduate FTE enrollment is in the public four-year sector, 32% in the public two-year sector, 19% in private not-for-profit institutions, and 7% in the for-profit sector. Fifty percent of graduate FTE enrollment is in the public four-year sector, 42% in private not-for-profit institutions, and 8% in the for-profit sector.
• Allgraduatestudentsareindependentforpurposes of financial aid, so their eligibility for need-based financial aid depends only on their own income and assets for most programs. Undergraduate students are considered depen-dent, with their aid eligibility a function of their own and their parents’ financial circumstances unless they are orphans or wards of the court, married, with legal dependents, or veterans or on active duty.
ALSO IMPORTANT
T R E N D S I N S T U D E N T A I D 2 0 0 8
7
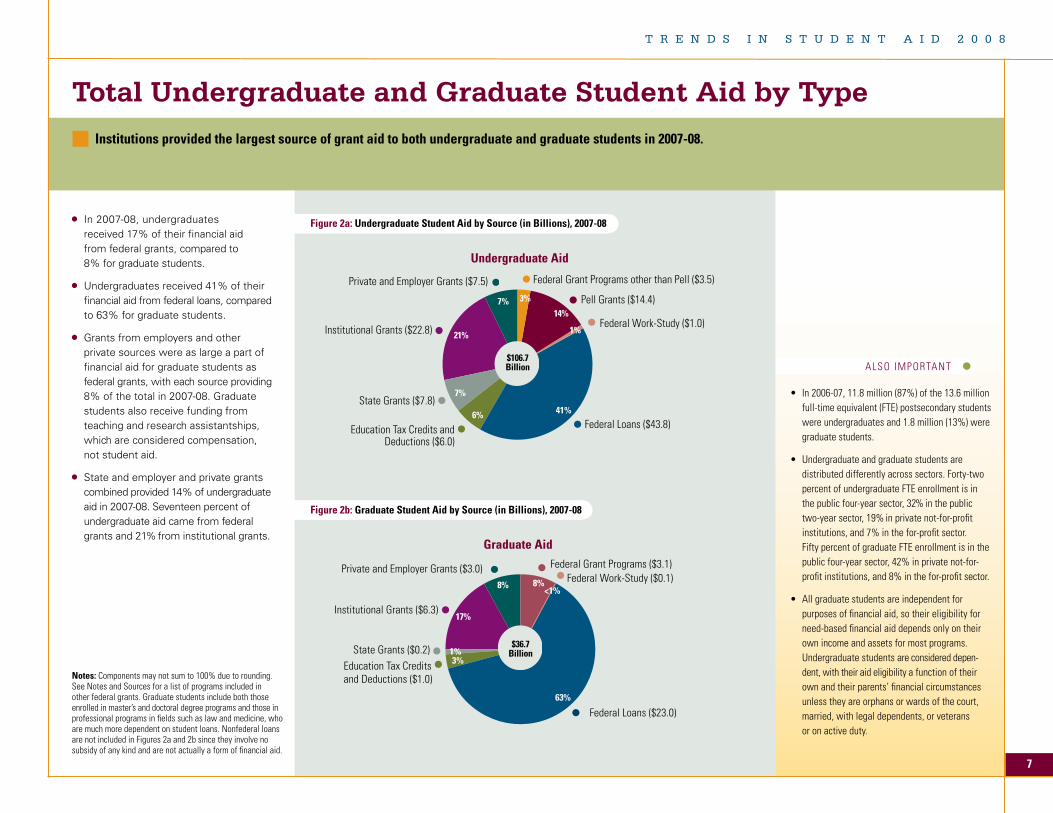
Total Undergraduate and Graduate Student Aid by TypeInstitutions provided the largest source of grant aid to both undergraduate and graduate students in 2007-08.
Figure 2a: Undergraduate Student Aid by Source (in Billions), 2007-08
Notes: Components may not sum to 100% due to rounding. See Notes and Sources for a list of programs included in other federal grants. Graduate students include both those enrolled in master’s and doctoral degree programs and those in professional programs in fields such as law and medicine, who are much more dependent on student loans. Nonfederal loans are not included in Figures 2a and 2b since they involve no subsidy of any kind and are not actually a form of financial aid.
In 2007-08, undergraduates received 17% of their financial aid from federal grants, compared to 8% for graduate students.
Undergraduates received 41% of their financial aid from federal loans, compared to 63% for graduate students.
Grants from employers and other private sources were as large a part of financial aid for graduate students as federal grants, with each source providing 8% of the total in 2007-08. Graduate students also receive funding from teaching and research assistantships, which are considered compensation, not student aid.
State and employer and private grants combined provided 14% of undergraduateaid in 2007-08. Seventeen percent of undergraduate aid came from federal grants and 21% from institutional grants.
Federal Loans ($43.8)
State Grants ($7.8)
Federal Grant Programs other than Pell ($3.5) Private and Employer Grants ($7.5) Pell Grants ($14.4)
Federal Work-Study ($1.0)
Education Tax Credits andDeductions ($6.0)
Institutional Grants ($22.8)
Undergraduate Aid
$106.7Billion
$36.7Billion
7%
21%
7%
6% 41%
1%
14%
3%
Private and Employer Grants ($3.0) Federal Grant Programs ($3.1) Federal Work-Study ($0.1)
Federal Loans ($23.0)
Education Tax Credits and Deductions ($1.0)
State Grants ($0.2)
Institutional Grants ($6.3)
Graduate Aid
17%
3%1%
8% 8%
63%
<1%
Figure 2b: Graduate Student Aid by Source (in Billions), 2007-08
No Stafford Subsidized Only Unsubsidized Only Subsidized and Unsubsidized
8
T R E N D S I N H I G H E R E D U C A T I O N S E R I E S
Federal Aid Recipients
The number of Pell Grant recipients increased from 2.9 million in 1987-88 to 3.7 million in 1997-98 and 5.4 million in 2007-08.
The number of FSEOG recipients increased from 635,000 in 1987-88 to 1.1 million in 1997-98 and 1.3 million in 2007-08.
The number of Federal Work-Study recipients was 720,000 in 1987-88, 714,000 in 1997-98, and 792,000 in 2007-08.
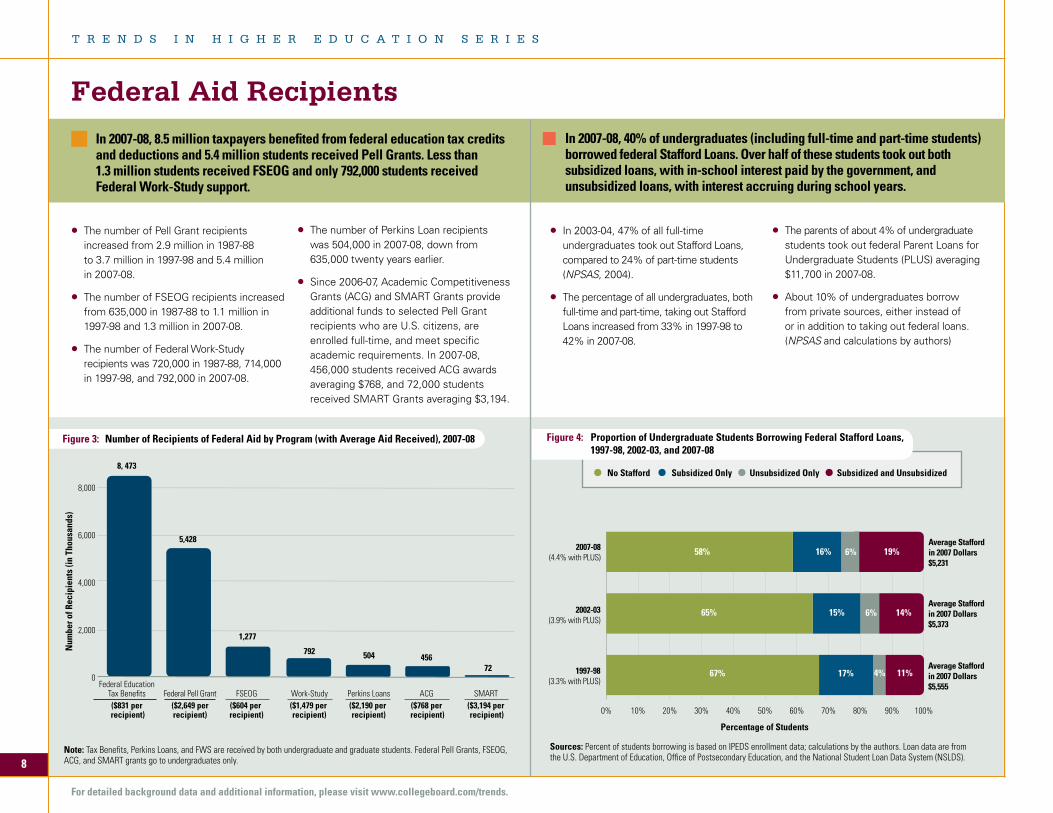
Figure 3: Number of Recipients of Federal Aid by Program (with Average Aid Received), 2007-08
In 2007-08, 8.5 million taxpayers benefited from federal education tax credits and deductions and 5.4 million students received Pell Grants. Less than 1.3 million students received FSEOG and only 792,000 students received Federal Work-Study support.
In 2007-08, 40% of undergraduates (including full-time and part-time students) borrowed federal Stafford Loans. Over half of these students took out both subsidized loans, with in-school interest paid by the government, and unsubsidized loans, with interest accruing during school years.
Figure 4: Proportion of Undergraduate Students Borrowing Federal Stafford Loans, 1997-98, 2002-03, and 2007-08
The number of Perkins Loan recipients was 504,000 in 2007-08, down from 635,000 twenty years earlier.
Since 2006-07, Academic Competitiveness Grants (ACG) and SMART Grants provide additional funds to selected Pell Grant recipients who are U.S. citizens, are enrolled full-time, and meet specific academic requirements. In 2007-08, 456,000 students received ACG awards averaging $768, and 72,000 students received SMART Grants averaging $3,194.
In 2003-04, 47% of all full-time undergraduates took out Stafford Loans, compared to 24% of part-time students (NPSAS, 2004).
The percentage of all undergraduates, both full-time and part-time, taking out Stafford Loans increased from 33% in 1997-98 to 42% in 2007-08.
The parents of about 4% of undergraduate students took out federal Parent Loans for Undergraduate Students (PLUS) averaging $11,700 in 2007-08.
About 10% of undergraduates borrow from private sources, either instead of or in addition to taking out federal loans. (NPSAS and calculations by authors)
0
2,000
4,000
6,000
8,000
8, 473
456504792
1,277
5,428
72
Num
ber o
f Rec
ipie
nts
(in T
hous
ands
)
Federal Education Tax Benefits Federal Pell Grant FSEOG Work-Study Perkins Loans ACG SMART ($831 per ($2,649 per ($604 per ($1,479 per ($2,190 per ($768 per ($3,194 per recipient) recipient) recipient) recipient) recipient) recipient) recipient) 0% 10% 20% 30% 40% 50% 60% 70% 80% 90% 100%
58% 16% 6% 19%
65% 15% 6% 14%
67% 17% 4% 11% 1997-98(3.3% with PLUS)
2002-03(3.9% with PLUS)
2007-08(4.4% with PLUS)
Percentage of Students
Average Staffordin 2007 Dollars$5,555
Average Staffordin 2007 Dollars$5,373
Average Staffordin 2007 Dollars$5,231
Note: Tax Benefits, Perkins Loans, and FWS are received by both undergraduate and graduate students. Federal Pell Grants, FSEOG, ACG, and SMART grants go to undergraduates only.
For detailed background data and additional information, please visit www.collegeboard.com/trends.
Sources: Percent of students borrowing is based on IPEDS enrollment data; calculations by the authors. Loan data are from theU.S.DepartmentofEducation,OfficeofPostsecondaryEducation,andtheNationalStudentLoanDataSystem(NSLDS).
Over the five years from 1997-98 to 2002-03, federal grant aid, state grant aid, and grant aid from employers and other private sources all grew by over 50% after adjusting for inflation, but growth in all sources of grant aid was considerably slower over the second half of the decade.
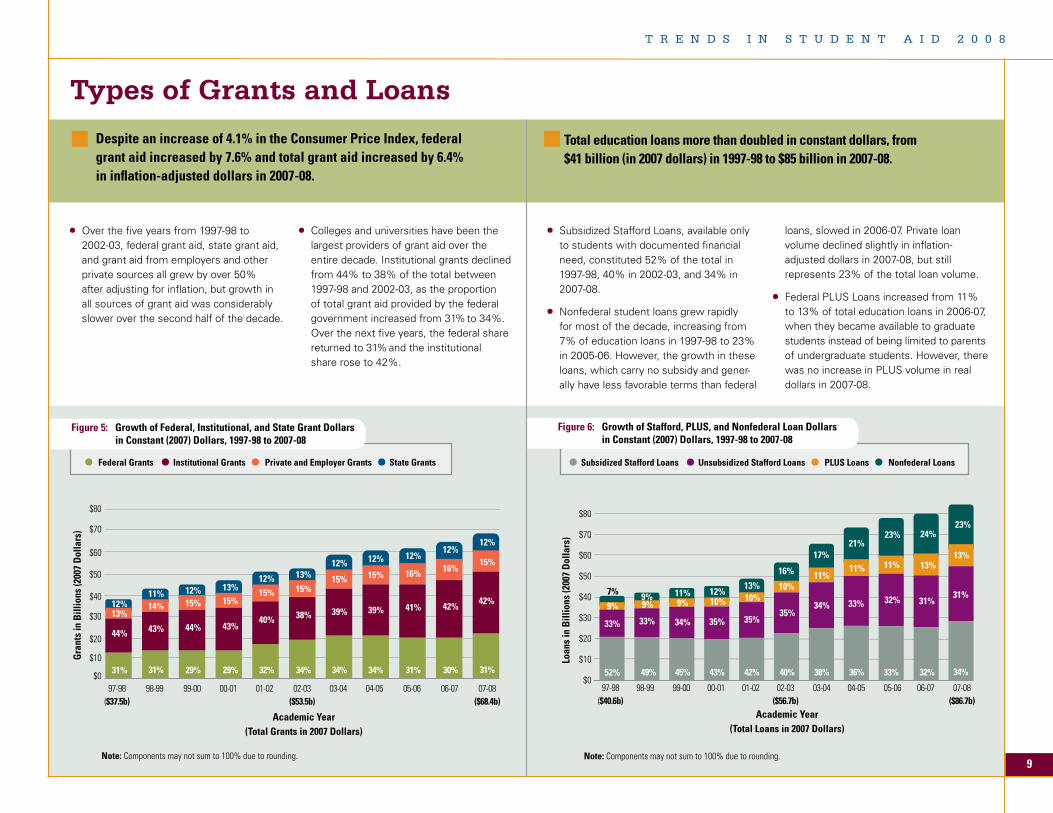
Despite an increase of 4.1% in the Consumer Price Index, federal grant aid increased by 7.6% and total grant aid increased by 6.4% in inflation-adjusted dollars in 2007-08.
Total education loans more than doubled in constant dollars, from$41 billion (in 2007 dollars) in 1997-98 to $85 billion in 2007-08.
Subsidized Stafford Loans, available only to students with documented financial need, constituted 52% of the total in 1997-98, 40% in 2002-03, and 34% in 2007-08.
Nonfederal student loans grew rapidly for most of the decade, increasing from 7% of education loans in 1997-98 to 23% in 2005-06. However, the growth in these loans, which carry no subsidy and gener-ally have less favorable terms than federal
loans, slowed in 2006-07. Private loan volume declined slightly in inflation-adjusted dollars in 2007-08, but still represents 23% of the total loan volume.
Federal PLUS Loans increased from 11% to 13% of total education loans in 2006-07, when they became available to graduate students instead of being limited to parents of undergraduate students. However, there was no increase in PLUS volume in real dollars in 2007-08.
Federal Grants Institutional Grants Private and Employer Grants State Grants
Types of Grants and Loans
97-98 98-99 99-00 00-01 01-02 02-03 03-04 04-05 05-06 06-07 07-08 ($40.6b) ($56.7b) ($86.7b)
$0
$10
$20
$30
$40
$50
$60
$70
$80
$0
$20
$40
$60
Loan
s in
Bill
ions
(200
7 D
olla
rs)
Academic Year(Total Grants in 2007 Dollars)
Gra
nts
in B
illio
ns (2
007
Dol
lars
)
97-98 98-99 99-00 00-01 01-02 02-03 03-04 04-05 05-06 06-07 07-08 ($37.5b) ($53.5b) ($68.4b)
31% 31%
44%
12%13%
43%
11%14%
29%
44%
12%15%
29%
43%
13%15%
32%
40%
12%15%
34%
38%
13%15%
34%
39%
12%
15%
34%
39%
12%
15%
31%
41%
12%
16%
30%
42%
12%
16%
31%
42%
12%
15%$50
$30
$10
Academic Year(Total Loans in 2007 Dollars)
$70
$80
52% 49%
33%
7%
9%
33%
9%9%
45%
34%
11%9%
43%
35%
12%10%
42%
35%
13%10%
40%
35%
16%
10%
38%
34%
17%
11%
36%
33%
21%
11%
33%
32%
23%
11%
32%
31%
24%
13%
34%
31%
23%
13%
Figure 6: Growth of Stafford, PLUS, and Nonfederal Loan Dollars in Constant (2007) Dollars, 1997-98 to 2007-08
Figure 5: Growth of Federal, Institutional, and State Grant Dollars in Constant (2007) Dollars, 1997-98 to 2007-08
Subsidized Stafford Loans Unsubsidized Stafford Loans PLUS Loans Nonfederal Loans
Note: Components may not sum to 100% due to rounding.
T R E N D S I N S T U D E N T A I D 2 0 0 8
9Note: Components may not sum to 100% due to rounding.
97-98 98-99 99-00 00-01 01-02 02-03 03-04 04-05 05-06 06-07 07-08 ($40.6b) ($56.7b) ($86.7b)
$0
$10
$20
$30
$40
$50
$60
$70
$80
$0
$20
$40
$60
Loan
s in
Bill
ions
(200
7 D
olla
rs)
Academic Year(Total Grants in 2007 Dollars)
Gra
nts
in B
illio
ns (2
007
Dol
lars
)
97-98 98-99 99-00 00-01 01-02 02-03 03-04 04-05 05-06 06-07 07-08 ($37.5b) ($53.5b) ($68.4b)
31% 31%
44%
12%13%
43%
11%14%
29%
44%
12%15%
29%
43%
13%15%
32%
40%
12%15%
34%
38%
13%15%
34%
39%
12%
15%
34%
39%
12%
15%
31%
41%
12%
16%
30%
42%
12%
16%
31%
42%
12%
15%$50
$30
$10
Academic Year(Total Loans in 2007 Dollars)
$70
$80
52% 49%
33%
7%
9%
33%
9%9%
45%
34%
11%9%
43%
35%
12%10%
42%
35%
13%10%
40%
35%
16%
10%
38%
34%
17%
11%
36%
33%
21%
11%
33%
32%
23%
11%
32%
31%
24%
13%
34%
31%
23%
13%
Colleges and universities have been the largest providers of grant aid over the entire decade. Institutional grants declined from 44% to 38% of the total between 1997-98 and 2002-03, as the proportion of total grant aid provided by the federal government increased from 31% to 34%. Over the next five years, the federal share returned to 31% and the institutional share rose to 42%.
• Theinterestrateonaconsolidationloanistheweighted average of the interest rates on the underlying loans, rounded up to the nearest one-eighth of one percent.
• ConsolidationloansmadebetweenNovember13,1997 and September 30, 1998 have variable interest rates, up to a maximum of 8.25%, that are reset each July 1.
ALSO IMPORTANT
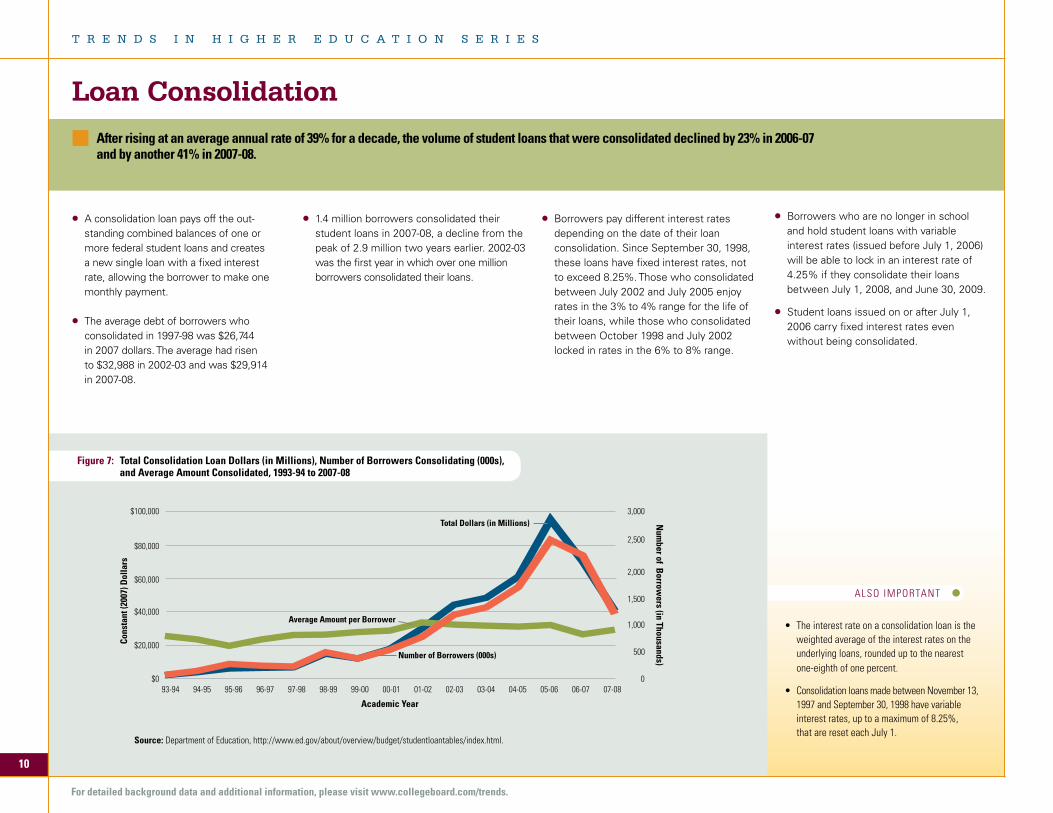
Figure 7: Total Consolidation Loan Dollars (in Millions), Number of Borrowers Consolidating (000s), and Average Amount Consolidated, 1993-94 to 2007-08
Source: Department of Education, http://www.ed.gov/about/overview/budget/studentloantables/index.html.
A consolidation loan pays off the out-standing combined balances of one or more federal student loans and creates a new single loan with a fixed interest rate, allowing the borrower to make one monthly payment.
The average debt of borrowers who consolidated in 1997-98 was $26,744 in 2007 dollars. The average had risen to $32,988 in 2002-03 and was $29,914 in 2007-08.
10
T R E N D S I N H I G H E R E D U C A T I O N S E R I E S
Loan Consolidation After rising at an average annual rate of 39% for a decade, the volume of student loans that were consolidated declined by 23% in 2006-07 and by another 41% in 2007-08.
For detailed background data and additional information, please visit www.collegeboard.com/trends.
Academic Year
Cons
tant
(200
7) D
olla
rs
Num
ber of Borrow
ers (in Thousands)
Total Dollars (in Millions)
Average Amount per Borrower
Number of Borrowers (000s)
$0
$20,000
$40,000
$60,000
$80,000
$100,000
0
500
1,000
1,500
2,000
2,500
3,000
07-0806-0705-0604-0503-0402-0301-0200-0199-0098-9997-9896-9795-9694-9593-94
1.4 million borrowers consolidated their student loans in 2007-08, a decline from the peak of 2.9 million two years earlier. 2002-03 was the first year in which over one million borrowers consolidated their loans.
Borrowers pay different interest rates depending on the date of their loan consolidation. Since September 30, 1998, these loans have fixed interest rates, notto exceed 8.25%. Those who consolidated between July 2002 and July 2005 enjoy rates in the 3% to 4% range for the life of their loans, while those who consolidated between October 1998 and July 2002 locked in rates in the 6% to 8% range.
Borrowers who are no longer in school and hold student loans with variable interest rates (issued before July 1, 2006) will be able to lock in an interest rate of 4.25% if they consolidate their loans between July 1, 2008, and June 30, 2009.
Student loans issued on or after July 1,
2006 carry fixed interest rates even without being consolidated.
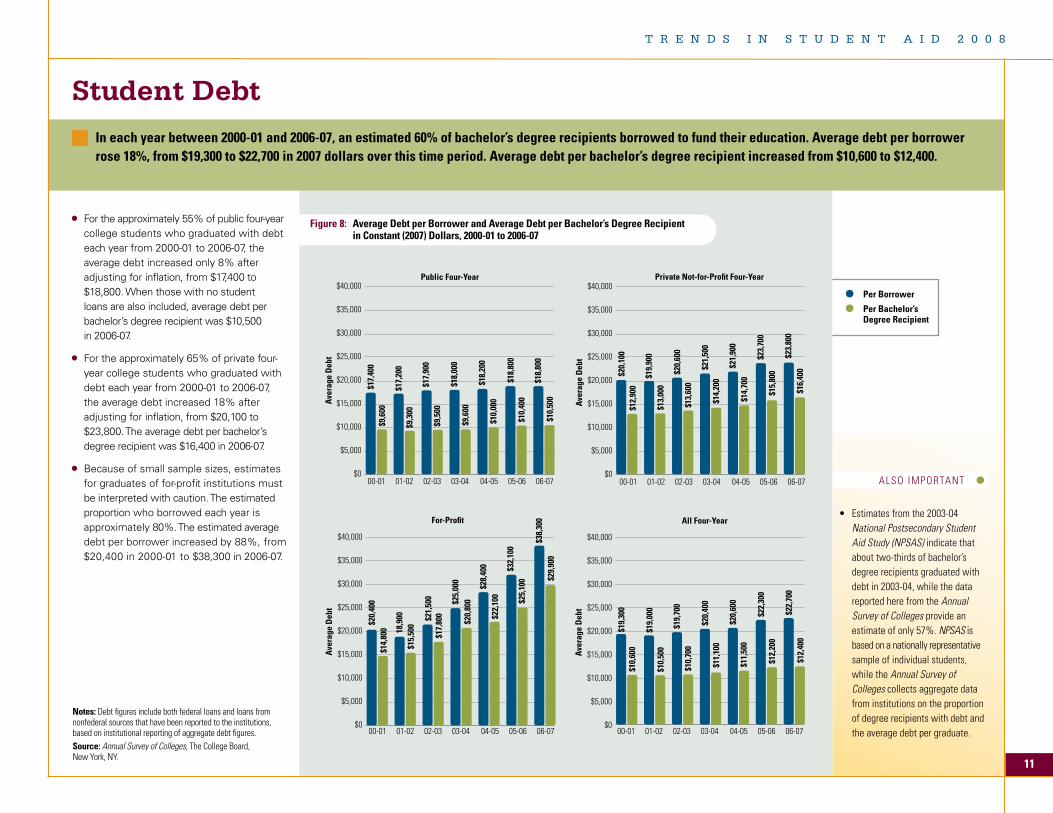
• Estimates from the 2003-04 National Postsecondary Student Aid Study (NPSAS) indicate that about two-thirds of bachelor’s degree recipients graduated with debt in 2003-04, while the data reported here from the Annual Survey of Colleges provide an estimate of only 57%. NPSAS is based on a nationally representative sample of individual students, while the Annual Survey of Colleges collects aggregate data from institutions on the proportion of degree recipients with debt and the average debt per graduate.
ALSO IMPORTANT
Per Borrower
Per Bachelor’s Degree Recipient
Notes: Debt figures include both federal loans and loans from nonfederal sources that have been reported to the institutions, based on institutional reporting of aggregate debt figures.Source: Annual Survey of Colleges, The College Board, New York, NY.
Student DebtIn each year between 2000-01 and 2006-07, an estimated 60% of bachelor’s degree recipients borrowed to fund their education. Average debt per borrower rose 18%, from $19,300 to $22,700 in 2007 dollars over this time period. Average debt per bachelor’s degree recipient increased from $10,600 to $12,400.
Figure 8: Average Debt per Borrower and Average Debt per Bachelor’s Degree Recipient in Constant (2007) Dollars, 2000-01 to 2006-07
Aver
age
Deb
tAv
erag
e D
ebt
Public Four-Year Private Not-for-Profit Four-Year
For-Profit All Four-Year
$17,
400
$9,6
00
$17,
200
$9,3
00
$17,
900
$9,5
00
$18,
000
$9,6
00
$18,
200
$10,
000
$18,
800
$10,
400
$18,
800
$10,
500
$20,
400
$14,
800 18
,900
$15,
500
$21,
500
$17,
800
$25,
000
$20,
800
$28,
400
$22,
100
$32,
100
$25,
100
$38,
300
$29,
900
$20,
100
$12,
900
$19,
900
$13,
000
$20,
600
$13,
600
$21,
500
$14,
200
$21,
900
$14,
700
$23,
700
$15,
800
$23,
800
$16,
400
$19,
300
$10,
600
$19,
000
$10,
500
$19,
700
$10,
700
$20,
400
$11,
100
$20,
600
$11,
500
$22,
300
$12,
200
$22,
700
$12,
400
Aver
age
Deb
tAv
erag
e D
ebt
$0
$5,000
$10,000
$15,000
$20,000
$25,000
$30,000
$35,000
$40,000
06-0705-0604-0503-0402-0301-0200-01
$0
$5,000
$10,000
$15,000
$20,000
$25,000
$30,000
$35,000
$40,000
$0
$5,000
$10,000
$15,000
$20,000
$25,000
$30,000
$35,000
$40,000
$0
$5,000
$10,000
$15,000
$20,000
$25,000
$30,000
$35,000
$40,000
06-0705-0604-0503-0402-0301-0200-01
06-0705-0604-0503-0402-0301-0200-01 06-0705-0604-0503-0402-0301-0200-01
T R E N D S I N S T U D E N T A I D 2 0 0 8
11
For the approximately 55% of public four-year college students who graduated with debt each year from 2000-01 to 2006-07, the average debt increased only 8% after adjusting for inflation, from $17,400 to $18,800. When those with no student loans are also included, average debt per bachelor’s degree recipient was $10,500 in 2006-07.
For the approximately 65% of private four-year college students who graduated with debt each year from 2000-01 to 2006-07, the average debt increased 18% after adjusting for inflation, from $20,100 to $23,800. The average debt per bachelor’s degree recipient was $16,400 in 2006-07.
Because of small sample sizes, estimates for graduates of for-profit institutions must be interpreted with caution. The estimated proportion who borrowed each year is approximately 80%. The estimated average debt per borrower increased by 88%, from $20,400 in 2000-01 to $38,300 in 2006-07.
ALSO IMPORTANT
• EligibilityforPellGrantsisdeterminedthroughthe federal need analysis system, without regard to institution attended.
• SubsidizedStaffordLoans,onwhichthefederal government pays the interest while the student is in school, are based on financial need, which depends on both the student’s financial circumstances and cost of attendance at the institution at which the student is enrolled.
• UnsubsidizedStaffordLoansareavailable without regard to financial need.
• Graduatestudentsandparentsofundergraduatestudents can borrow PLUS Loans up to the cost of attendance less other financial aid received.
• Campus-basedfundsaredistributedtoinstitutionsthrough a federal allocation formula. Institutions allocate the funds to their needy students.
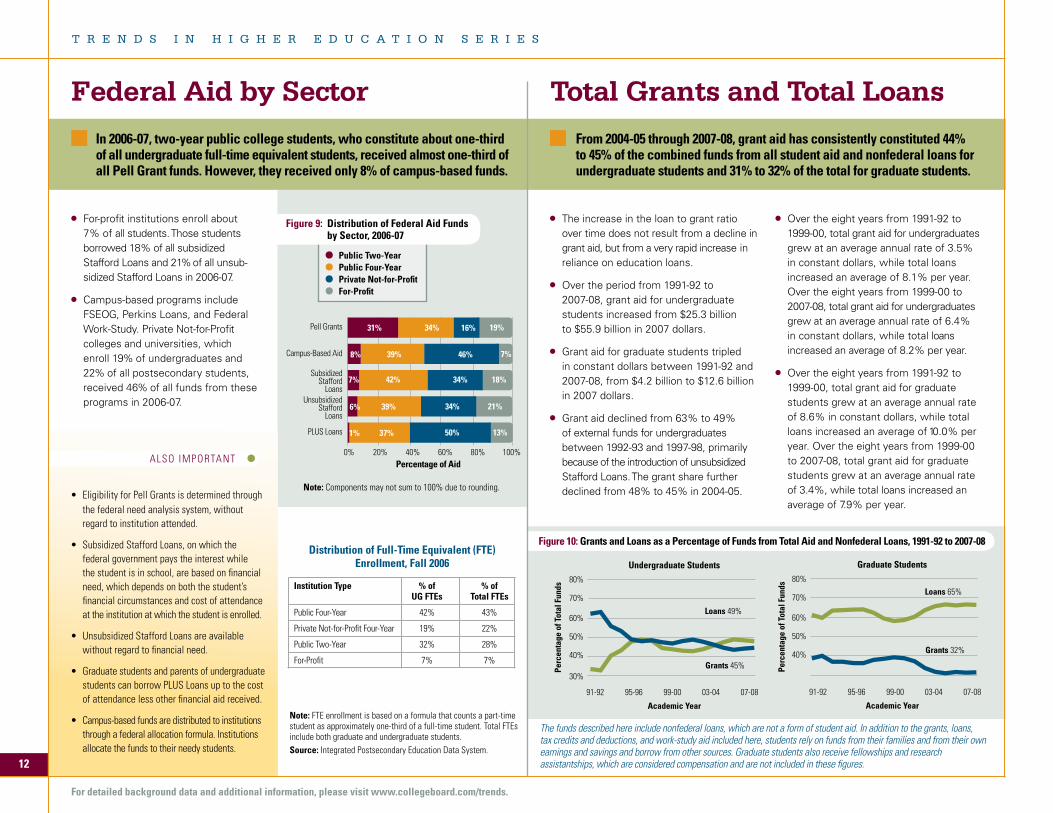
In 2006-07, two-year public college students, who constitute about one-third of all undergraduate full-time equivalent students, received almost one-third of all Pell Grant funds. However, they received only 8% of campus-based funds.
From 2004-05 through 2007-08, grant aid has consistently constituted 44% to 45% of the combined funds from all student aid and nonfederal loans for undergraduate students and 31% to 32% of the total for graduate students.
Federal Aid by Sector Total Grants and Total Loans
Figure 10: Grants and Loans as a Percentage of Funds from Total Aid and Nonfederal Loans, 1991-92 to 2007-08
The increase in the loan to grant ratio over time does not result from a decline in grant aid, but from a very rapid increase in reliance on education loans.
Over the period from 1991-92 to 2007-08, grant aid for undergraduate students increased from $25.3 billion to $55.9 billion in 2007 dollars.
Grant aid for graduate students tripled in constant dollars between 1991-92 and 2007-08, from $4.2 billion to $12.6 billion in 2007 dollars.
Grant aid declined from 63% to 49% of external funds for undergraduates between 1992-93 and 1997-98, primarily because of the introduction of unsubsidizedStafford Loans. The grant share further declined from 48% to 45% in 2004-05.
Note: FTE enrollment is based on a formula that counts a part-time student as approximately one-third of a full-time student. Total FTEs include both graduate and undergraduate students.Source: Integrated Postsecondary Education Data System.
Over the eight years from 1991-92 to 1999-00, total grant aid for undergraduates grew at an average annual rate of 3.5% in constant dollars, while total loans increased an average of 8.1% per year. Over the eight years from 1999-00 to 2007-08, total grant aid for undergraduates grew at an average annual rate of 6.4% in constant dollars, while total loans increased an average of 8.2% per year.
Over the eight years from 1991-92 to 1999-00, total grant aid for graduate students grew at an average annual rate of 8.6% in constant dollars, while total loans increased an average of 10.0% per year. Over the eight years from 1999-00 to 2007-08, total grant aid for graduate students grew at an average annual rate of 3.4%, while total loans increased an average of 7.9% per year.
Public Two-Year Public Four-Year Private Not-for-Profit For-Profit
Figure 9: Distribution of Federal Aid Funds by Sector, 2006-07
Pell Grants
Campus-Based Aid
SubsidizedStafford
LoansUnsubsidized
StaffordLoans
PLUS Loans
Percentage of Aid0% 20% 40% 60% 80% 100%
39% 34% 21%
42% 34% 18%
39% 46% 7%
31% 34% 16% 19%
1% 37%
6%
7%
8%
50% 13%
Distribution of Full-Time Equivalent (FTE)Enrollment, Fall 2006
Institution Type % of % of UG FTEs Total FTEs
Public Four-Year 42% 43%
Private Not-for-Profit Four-Year 19% 22%
Public Two-Year 32% 28%
For-Profit 7% 7%
For-profit institutions enroll about 7% of all students. Those students borrowed 18% of all subsidized Stafford Loans and 21% of all unsub-sidized Stafford Loans in 2006-07.
Campus-based programs include FSEOG, Perkins Loans, and Federal Work-Study. Private Not-for-Profit colleges and universities, which enroll 19% of undergraduates and 22% of all postsecondary students, received 46% of all funds from these programs in 2006-07.
The funds described here include nonfederal loans, which are not a form of student aid. In addition to the grants, loans, tax credits and deductions, and work-study aid included here, students rely on funds from their families and from their own earnings and savings and borrow from other sources. Graduate students also receive fellowships and research assistantships, which are considered compensation and are not included in these figures.
40%
50%
60%
70%
80%
Perc
enta
ge o
f Tot
al F
unds
Academic Year
30%
40%
50%
60%
70%
80%
07-0803-0499-00 95-96 91-92
Perc
enta
ge o
f Tot
al F
unds
Academic Year
Grants 45%
Loans 49%
Undergraduate Students
07-0803-0499-00 95-96 91-92
Grants 32%
Loans 65%
Graduate Students
Note: Components may not sum to 100% due to rounding.
12
T R E N D S I N H I G H E R E D U C A T I O N S E R I E S
For detailed background data and additional information, please visit www.collegeboard.com/trends.
Average Grant Aid per FTE
Average Federal Loans per FTE
ALSO IMPORTANT
$0
$2,000
$4,000
$6,000
$8,000
$10,000
$12,000
06-0704-0502-0300-0198-9996-9794-9592-9390-91
$0
$2,000
$4,000
$6,000
$8,000
$10,000
$12,000
06-0704-0502-0300-0198-9996-9794-9592-9390-91
Aver
age
Aid
in C
onst
ant (
2007
) Dol
lars
Aver
age
Aid
in C
onst
ant (
2007
) Dol
lars
92-93:$2,992
$1,608
97-98:$3,162
$2,924
02-03:$4,005
$3,097
07-08:$4,656
$3,650
92-93:$5,404
$3,662
97-98:$8,606
$5,688
02-03:$9,947
$6,114
07-08:$12,746
$6,948
Total Aid per Full-Time Equivalent Student
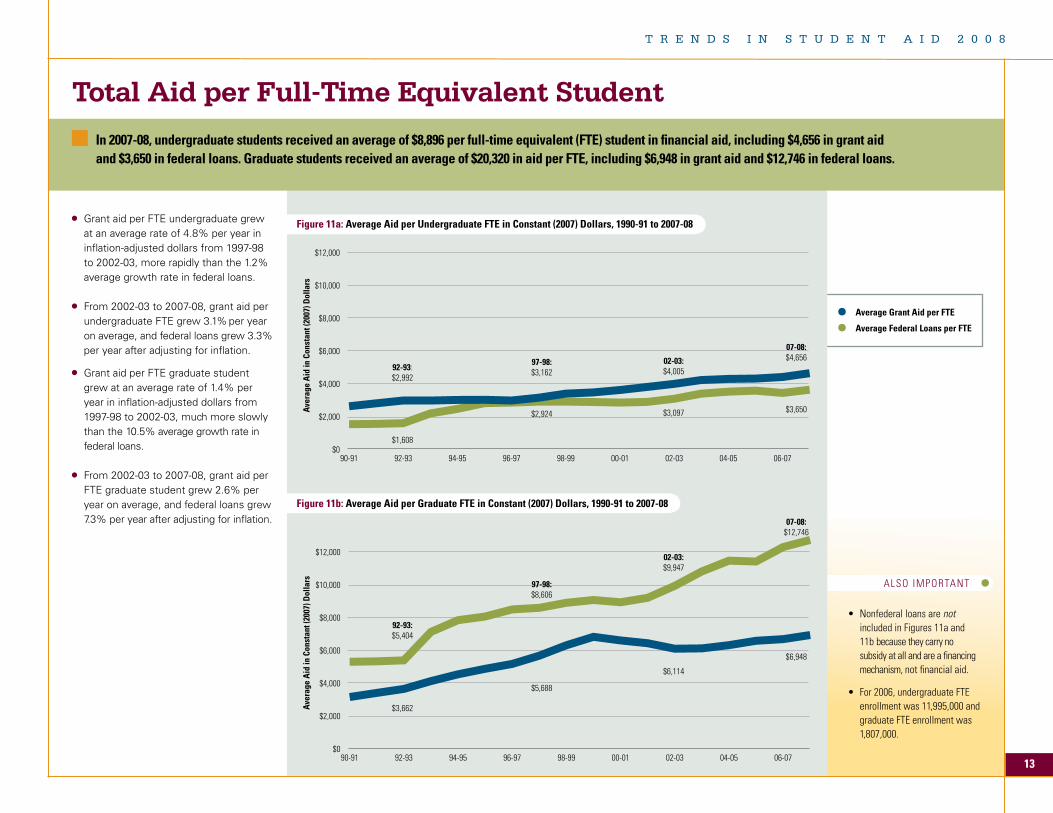
Grant aid per FTE undergraduate grew at an average rate of 4.8% per year in inflation-adjusted dollars from 1997-98 to 2002-03, more rapidly than the 1.2% average growth rate in federal loans.
From 2002-03 to 2007-08, grant aid per undergraduate FTE grew 3.1% per year on average, and federal loans grew 3.3% per year after adjusting for inflation.
Grant aid per FTE graduate student grew at an average rate of 1.4% per year in inflation-adjusted dollars from 1997-98 to 2002-03, much more slowly than the 10.5% average growth rate in federal loans.
From 2002-03 to 2007-08, grant aid per FTE graduate student grew 2.6% per year on average, and federal loans grew 7.3% per year after adjusting for inflation.
Figure 11a: Average Aid per Undergraduate FTE in Constant (2007) Dollars, 1990-91 to 2007-08
In 2007-08, undergraduate students received an average of $8,896 per full-time equivalent (FTE) student in financial aid, including $4,656 in grant aid and $3,650 in federal loans. Graduate students received an average of $20,320 in aid per FTE, including $6,948 in grant aid and $12,746 in federal loans.
• Nonfederal loans are not included in Figures 11a and 11b because they carry no subsidy at all and are a financing mechanism, not financial aid.
• For2006,undergraduateFTEenrollment was 11,995,000 and graduate FTE enrollment was 1,807,000.
Figure 11b: Average Aid per Graduate FTE in Constant (2007) Dollars, 1990-91 to 2007-08
T R E N D S I N S T U D E N T A I D 2 0 0 8
13
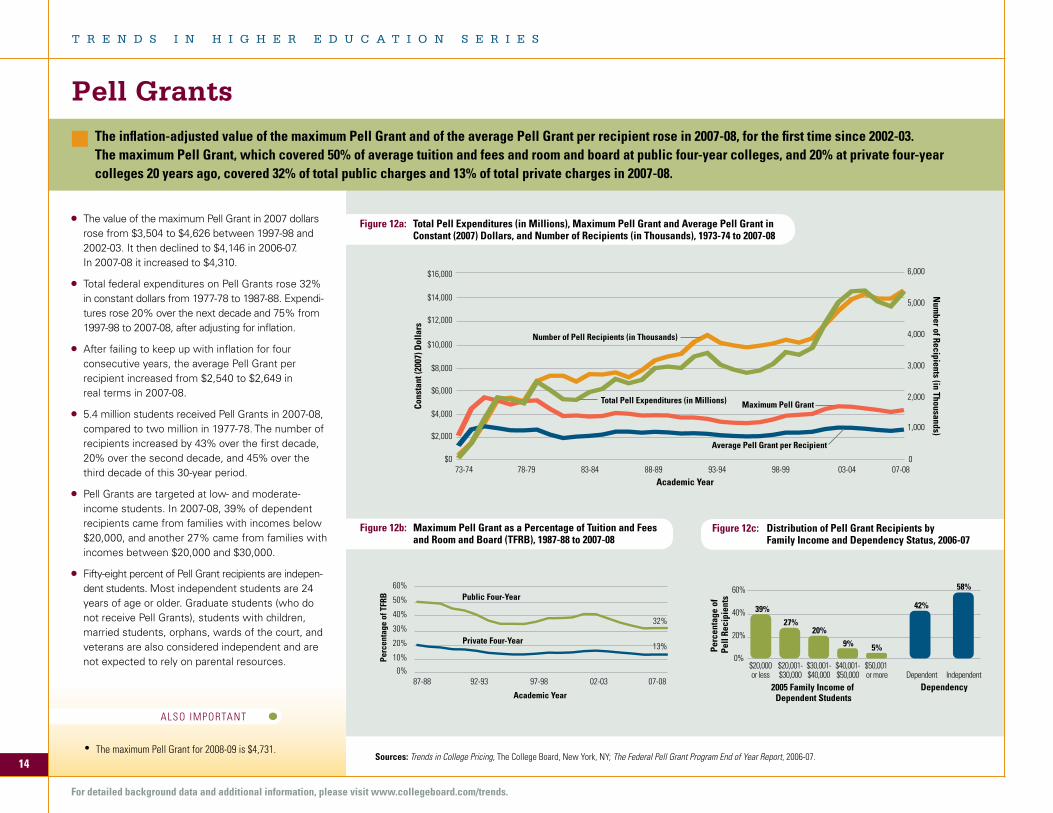
Pell GrantsThe inflation-adjusted value of the maximum Pell Grant and of the average Pell Grant per recipient rose in 2007-08, for the first time since 2002-03. The maximum Pell Grant, which covered 50% of average tuition and fees and room and board at public four-year colleges, and 20% at private four-year colleges 20 years ago, covered 32% of total public charges and 13% of total private charges in 2007-08.
The value of the maximum Pell Grant in 2007 dollars rose from $3,504 to $4,626 between 1997-98 and 2002-03. It then declined to $4,146 in 2006-07. In 2007-08 it increased to $4,310.
Total federal expenditures on Pell Grants rose 32%in constant dollars from 1977-78 to 1987-88. Expendi-tures rose 20% over the next decade and 75% from 1997-98 to 2007-08, after adjusting for inflation.
After failing to keep up with inflation for fourconsecutive years, the average Pell Grant per recipient increased from $2,540 to $2,649 in real terms in 2007-08.
5.4 million students received Pell Grants in 2007-08,compared to two million in 1977-78. The number of recipients increased by 43% over the first decade, 20% over the second decade, and 45% over the third decade of this 30-year period.
Pell Grants are targeted at low- and moderate-income students. In 2007-08, 39% of dependent recipients came from families with incomes below $20,000, and another 27% came from families with incomes between $20,000 and $30,000.
Fifty-eight percent of Pell Grant recipients are indepen-dent students. Most independent students are 24 years of age or older. Graduate students (who do not receive Pell Grants), students with children, married students, orphans, wards of the court, and veterans are also considered independent and are not expected to rely on parental resources.
Figure 12c: Distribution of Pell Grant Recipients by Family Income and Dependency Status, 2006-07
Sources: Trends in College Pricing, The College Board, New York, NY; The Federal Pell Grant Program End of Year Report, 2006-07.
Perc
enta
ge o
f TFR
B
Academic Year
Public Four-Year
Private Four-Year
0%
10%
20%
30%
40%
50%
60%
07-0802-0397-9892-9387-88
32%
13%
Figure 12a: Total Pell Expenditures (in Millions), Maximum Pell Grant and Average Pell Grant in Constant (2007) Dollars, and Number of Recipients (in Thousands), 1973-74 to 2007-08
Figure 12b: Maximum Pell Grant as a Percentage of Tuition and Fees and Room and Board (TFRB), 1987-88 to 2007-08
0%
20%
40%
60%
IndependentDependent$50,001 or more
$40,001-$50,000
$30,001-$40,000
$20,001-$30,000
$20,000or less
2005 Family Income of Dependent Students
Dependency
Perc
enta
ge o
f Pe
ll Re
cipi
ents
39%
27%20%
9% 5%
42%
58%
$0
$2,000
$4,000
$6,000
$8,000
$10,000
$12,000
$14,000
$16,000
0
1,000
2,000
3,000
4,000
5,000
6,000
Academic Year
Cons
tant
(200
7) D
olla
rs
Num
ber of Recipients (in Thousands)
Total Pell Expenditures (in Millions) Maximum Pell Grant
Average Pell Grant per Recipient
Number of Pell Recipients (in Thousands)
07-0803-0498-9993-9488-8983-8478-7973-74
14
T R E N D S I N H I G H E R E D U C A T I O N S E R I E S
For detailed background data and additional information, please visit www.collegeboard.com/trends.
ALSO IMPORTANT
• The maximum Pell Grant for 2008-09 is $4,731.
ALSO IMPORTANT
• Stategrantaidperfull-timeequivalentundergraduatestudent ranged from highs of $1,788 per student in South Carolina and $1,565 in Georgia to lows of $10 per student in Hawaii and $7 in Wyoming, with a national average of $613 in 2006-07.
• Stateneed-basedgrantaidperfull-timeequivalentundergraduate student ranged from highs of $1,049 in New York and $933 in New Jersey to lows of $4 per student in Georgia and $0 in South Dakota, with a national average of $440 in 2006-07.
Non-Need-Based Grants
Need-Based Grants
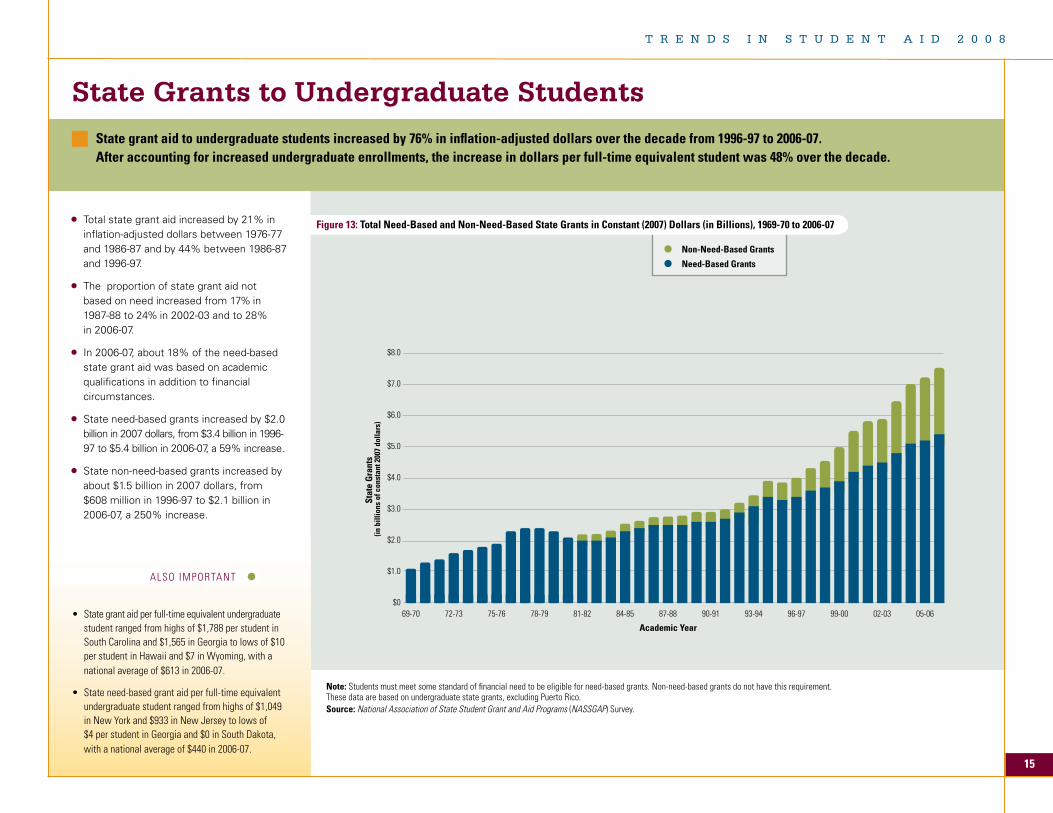
Total state grant aid increased by 21% ininflation-adjusted dollars between 1976-77 and 1986-87 and by 44% between 1986-87 and 1996-97.
The proportion of state grant aid not based on need increased from 17% in 1987-88 to 24% in 2002-03 and to 28% in 2006-07.
In 2006-07, about 18% of the need-based state grant aid was based on academic qualifications in addition to financial circumstances.
State need-based grants increased by $2.0billion in 2007 dollars, from $3.4 billion in 1996- 97 to $5.4 billion in 2006-07, a 59% increase.
State non-need-based grants increased by about $1.5 billion in 2007 dollars, from $608 million in 1996-97 to $2.1 billion in 2006-07, a 250% increase.
Academic Year
Stat
e G
rant
s (in
bill
ions
of c
onst
ant 2
007
dolla
rs)
$0
$1.0
$2.0
$3.0
$4.0
$5.0
$6.0
$7.0
$8.0
05-0602-0399-0096-9793-9490-9187-8884-8581-8278-7975-7672-7369-70
Note: Students must meet some standard of financial need to be eligible for need-based grants. Non-need-based grants do not have this requirement. These data are based on undergraduate state grants, excluding Puerto Rico.Source: National Association of State Student Grant and Aid Programs (NASSGAP)Survey.
State Grants to Undergraduate StudentsState grant aid to undergraduate students increased by 76% in inflation-adjusted dollars over the decade from 1996-97 to 2006-07. After accounting for increased undergraduate enrollments, the increase in dollars per full-time equivalent student was 48% over the decade.
Figure 13: Total Need-Based and Non-Need-Based State Grants in Constant (2007) Dollars (in Billions), 1969-70 to 2006-07
T R E N D S I N S T U D E N T A I D 2 0 0 8
15
ALSO IMPORTANT
• Somegrantsdefinedhereasneed-basedbecausetheirrecipients have measured need may be labeled “merit” awards. Some measures of need-based aid exclude these awards to needy students.
• Between2000-01and2006-07,theaverageinstitutionalgrant per FTE at public four-year institutions covered between 16% and 18% of tuition and fees.
Need-Based Institutional Scholarships & Grants/FTE Non-Need-Based Institutional Scholarships & Grants/FTE Athletic Awards/FTE
Institutional Grant Aid
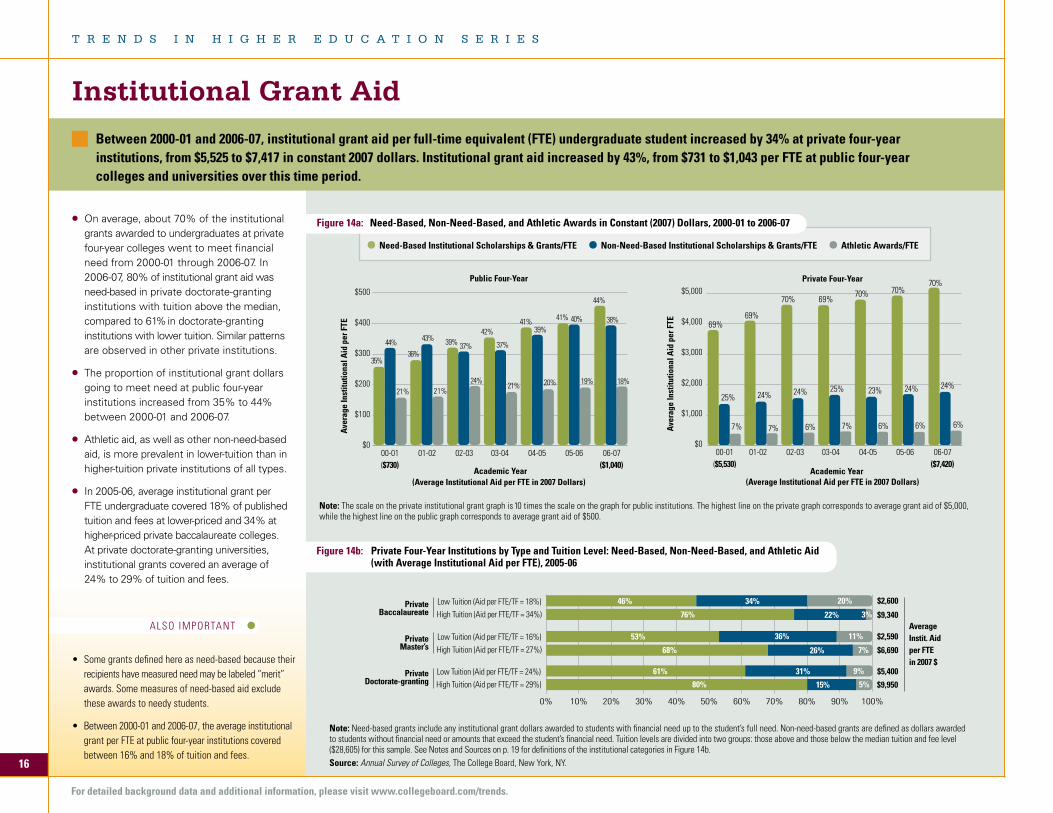
Between 2000-01 and 2006-07, institutional grant aid per full-time equivalent (FTE) undergraduate student increased by 34% at private four-year institutions, from $5,525 to $7,417 in constant 2007 dollars. Institutional grant aid increased by 43%, from $731 to $1,043 per FTE at public four-year colleges and universities over this time period.
On average, about 70% of the institutional grants awarded to undergraduates at private four-year colleges went to meet financial need from 2000-01 through 2006-07. In 2006-07, 80% of institutional grant aid was need-based in private doctorate-granting institutions with tuition above the median, compared to 61% in doctorate-granting institutions with lower tuition. Similar patterns are observed in other private institutions.
The proportion of institutional grant dollars going to meet need at public four-year institutions increased from 35% to 44% between 2000-01 and 2006-07.
Athletic aid, as well as other non-need-based aid, is more prevalent in lower-tuition than in higher-tuition private institutions of all types.
In 2005-06, average institutional grant per FTE undergraduate covered 18% of publishedtuition and fees at lower-priced and 34% at higher-priced private baccalaureate colleges. At private doctorate-granting universities, institutional grants covered an average of 24% to 29% of tuition and fees.
Note: Need-based grants include any institutional grant dollars awarded to students with financial need up to the student’s full need. Non-need-based grants are defined as dollars awarded to students without financial need or amounts that exceed the student’s financial need. Tuition levels are divided into two groups: those above and those below the median tuition and fee level($28,605)forthissample.SeeNotesandSourcesonp.19fordefinitionsoftheinstitutionalcategoriesinFigure14b.Source: Annual Survey of Colleges, The College Board, New York, NY.
Figure 14b: Private Four-Year Institutions by Type and Tuition Level: Need-Based, Non-Need-Based, and Athletic Aid (with Average Institutional Aid per FTE), 2005-06
7% 7% 6%
69%
25%
69%
24%
Academic Year
Aver
age
Inst
itutio
nal A
id p
er F
TE
7% 6% 6% 6%
70%
24%
69%
25%
70%
23%
70%
24%
70%
24%
35%36%
21%
44%
21%
37%43%
42%41%
20%
44%
39%
24%
37%
21%
41%
39%40%
19%
38%
18%
$500
$400
$300
$200
$100
$000-01 01-02 02-03 03-04 04-05 05-06 06-07 ($730) ($1,040)
$5,000
$4,000
$3,000
$2,000
$1,000
$0 00-01 01-02 02-03 03-04 04-05 05-06 06-07 ($5,530) ($7,420)
Aver
age
Inst
itutio
nal A
id p
er F
TE
Academic Year
Public Four-Year Private Four-Year
(Average Institutional Aid per FTE in 2007 Dollars) (Average Institutional Aid per FTE in 2007 Dollars)
0% 10% 20% 30% 40% 50% 60% 70% 80% 90% 100%
Low Tuition (Aid per FTE/TF = 18%)High Tuition (Aid per FTE/TF = 34%)
Low Tuition (Aid per FTE/TF = 16%)High Tuition (Aid per FTE/TF = 27%)
Low Tuition (Aid per FTE/TF = 24%)High Tuition (Aid per FTE/TF = 29%)
PrivateBaccalaureate
PrivateMaster’s
PrivateDoctorate-granting
46% 34% 20%
76% 22% 3%
53% 36% 11%
68% 26% 7%
61% 31% 9%
80% 15% 5%
$2,600
$9,340
$2,590
$6,690
$5,400
$9,950
Average Instit. Aidper FTEin 2007 $
Note: The scale on the private institutional grant graph is 10 times the scale on the graph for public institutions. The highest line on the private graph corresponds to average grant aid of $5,000, while the highest line on the public graph corresponds to average grant aid of $500.
16
T R E N D S I N H I G H E R E D U C A T I O N S E R I E S
For detailed background data and additional information, please visit www.collegeboard.com/trends.
Figure 14a: Need-Based, Non-Need-Based, and Athletic Awards in Constant (2007) Dollars, 2000-01 to 2006-07
ALSO IMPORTANT
• Thefederalgovernmentalsoallowsataxdeduction for interest paid on student loans. In 2006, seven million taxpayers with taxable returns deducted about $5.2 billion in student loan interest, generating about $800 million in savings.
• Othersignificantsubsidiestostudentsthroughthe tax code include the personal exemption allowed for students ages 19 and over, which saved parents about $4.0 billion in 2006, and the excludability of tuition assistance from employers, which saved students about $590million(BudgetoftheU.S.GovernmentFY2008,AnalyticalPerspectives).
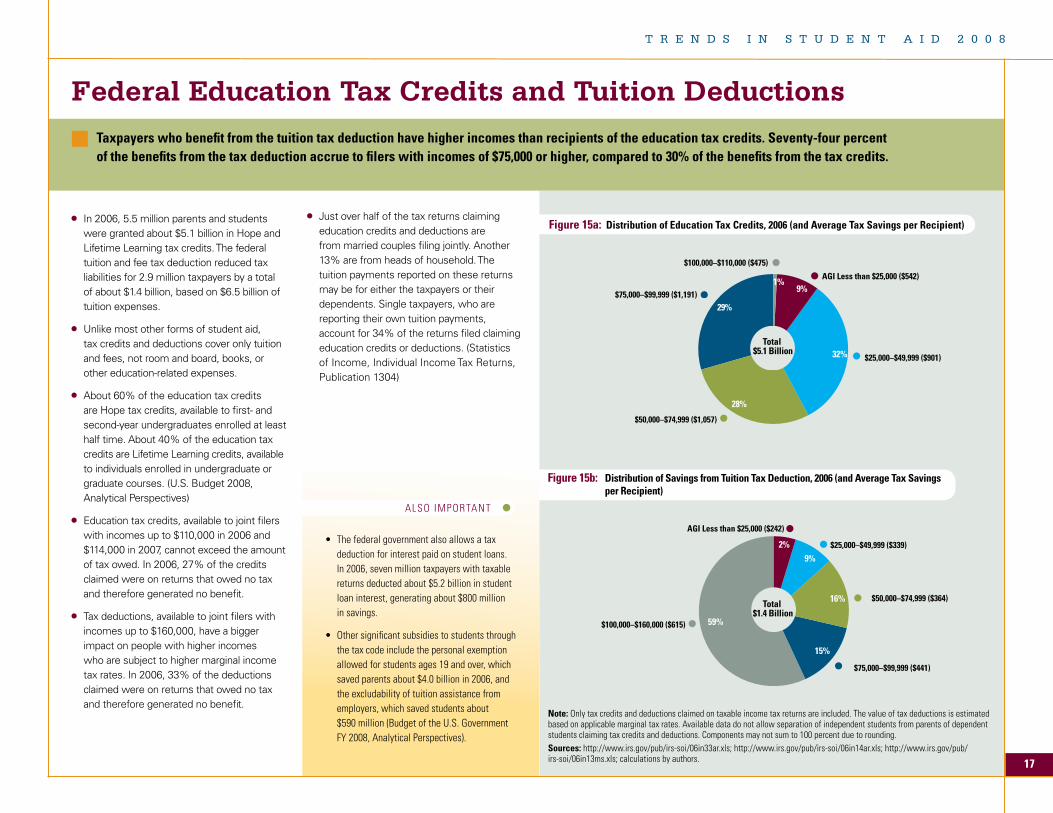
In 2006, 5.5 million parents and students were granted about $5.1 billion in Hope and Lifetime Learning tax credits. The federal tuition and fee tax deduction reduced tax liabilities for 2.9 million taxpayers by a total of about $1.4 billion, based on $6.5 billion of tuition expenses.
Unlike most other forms of student aid, tax credits and deductions cover only tuition and fees, not room and board, books, or other education-related expenses.
About 60% of the education tax creditsare Hope tax credits, available to first- and second-year undergraduates enrolled at least half time. About 40% of the education tax credits are Lifetime Learning credits, available to individuals enrolled in undergraduate or graduate courses. (U.S. Budget 2008, Analytical Perspectives)
Education tax credits, available to joint filers with incomes up to $110,000 in 2006 and $114,000 in 2007, cannot exceed the amount of tax owed. In 2006, 27% of the credits claimed were on returns that owed no tax and therefore generated no benefit.
Tax deductions, available to joint filers with incomes up to $160,000, have a bigger impact on people with higher incomes who are subject to higher marginal income tax rates. In 2006, 33% of the deductions claimed were on returns that owed no tax and therefore generated no benefit.
Just over half of the tax returns claiming education credits and deductions are from married couples filing jointly. Another 13% are from heads of household. The tuition payments reported on these returns may be for either the taxpayers or their dependents. Single taxpayers, who are reporting their own tuition payments, account for 34% of the returns filed claiming education credits or deductions. (Statistics of Income, Individual Income Tax Returns, Publication 1304)
Figure 15a: Distribution of Education Tax Credits, 2006 (and Average Tax Savings per Recipient)
Note: Only tax credits and deductions claimed on taxable income tax returns are included. The value of tax deductions is estimated based on applicable marginal tax rates. Available data do not allow separation of independent students from parents of dependent students claiming tax credits and deductions. Components may not sum to 100 percent due to rounding. Sources: http://www.irs.gov/pub/irs-soi/06in33ar.xls; http://www.irs.gov/pub/irs-soi/06in14ar.xls; http://www.irs.gov/pub/irs-soi/06in13ms.xls; calculations by authors.
Federal Education Tax Credits and Tuition DeductionsTaxpayers who benefit from the tuition tax deduction have higher incomes than recipients of the education tax credits. Seventy-four percent of the benefits from the tax deduction accrue to filers with incomes of $75,000 or higher, compared to 30% of the benefits from the tax credits.
Figure 15b: Distribution of Savings from Tuition Tax Deduction, 2006 (and Average Tax Savings per Recipient)
$100,000–$110,000 ($475)
$75,000–$99,999 ($1,191)
AGI Less than $25,000 ($542)
$25,000–$49,999 ($901)
$50,000–$74,999 ($1,057)
29%
28%
32%
9%1%
2%
59%
9%
16%
15%
Total $5.1 Billion
$100,000–$160,000 ($615)
$75,000–$99,999 ($441)
AGI Less than $25,000 ($242)
$25,000–$49,999 ($339)
$50,000–$74,999 ($364)Total
$1.4 Billion
T R E N D S I N S T U D E N T A I D 2 0 0 8
17
ALSO IMPORTANT
• More than 270 private colleges and universities have joined together in a prepaid tuition plan that carries the same tax benefits as the state-sponsored 529 plans. The assets in this plan, not included in Figures 16a and 16b, exceed $100 million. The average size of these approximately 5,000 accounts exceeds $20,000.(www.independent529plan.org)
• Taxpayers saved an estimated $830 million in federal income taxes by saving in 529plansin2007.(U.S.Budget2008,AnalyticalPerspectives)
• Other forms of savings for education that are granted special tax status by the federal government include Series EE and Series I Savings Bonds and Coverdell Education Savings Accounts.
Note: Information on type of account is not available for years before 1999, although the majority of accounts were prepaid tuition plans. Data are as of June 30, 2008.Sources: CollegeSavingsPlansNetwork(collegesavings.org),NationalAssociationofStateTreasurers.
Prepaid Tuition College Savings
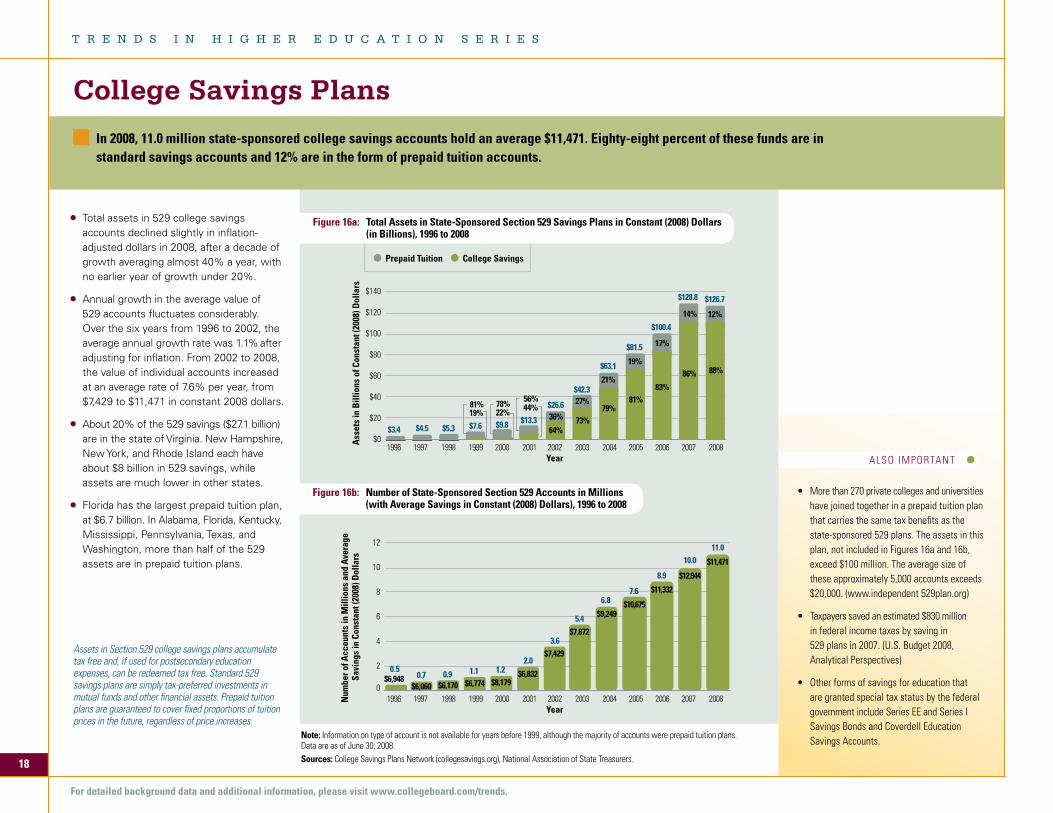
Figure 16a: Total Assets in State-Sponsored Section 529 Savings Plans in Constant (2008) Dollars (in Billions), 1996 to 2008
College Savings Plans
In 2008, 11.0 million state-sponsored college savings accounts hold an average $11,471. Eighty-eight percent of these funds are in standard savings accounts and 12% are in the form of prepaid tuition accounts.
$0
$20
$40
$60
$80
$100
$120
$140
1996 1997 1998 1999 2000 2001 2002 2003 2004 2005 2006 2007 2008Year
Ass
ets
in B
illio
ns o
f Con
stan
t (20
08) D
olla
rsN
umbe
r of A
ccou
nts
in M
illio
ns a
nd A
vera
ge
Savi
ngs
in C
onst
ant (
2008
) Dol
lars
86%
14%
83%
17%
81%
19%
79%
21%
73%
27%
64%
36%
0.50.7 0.9 1.1 1.2
2.0
3.6
5.4
6.87.6
8.9
10.0
$3.4 $4.5 $5.3 $7.6 $9.8 $13.3
$26.6
$42.3
$63.1
$81.5
$100.4
$128.8
22%78%
19%81%
88%
12%
$126.7
0
2
4
6
8
10
12
1996 1997 1998 1999 2000 2001 2002 2003 2004 2005 2006 2007 2008Year
11.0
44%56%
$6,948$6,060 $6,170 $6,774 $8,179
$6,832
$7,429
$7,872
$9,249$10,675
$11,332
$12,944
$11,471
Total assets in 529 college savings accounts declined slightly in inflation-adjusted dollars in 2008, after a decade of growth averaging almost 40% a year, with no earlier year of growth under 20%.
Annual growth in the average value of 529 accounts fluctuates considerably. Over the six years from 1996 to 2002, the average annual growth rate was 1.1% after adjusting for inflation. From 2002 to 2008, the value of individual accounts increased at an average rate of 7.6% per year, from $7,429 to $11,471 in constant 2008 dollars.
About 20% of the 529 savings ($27.1 billion)are in the state of Virginia. New Hampshire, New York, and Rhode Island each have about $8 billion in 529 savings, while assets are much lower in other states.
Florida has the largest prepaid tuition plan, at $6.7 billion. In Alabama, Florida, Kentucky, Mississippi, Pennsylvania, Texas, and Washington, more than half of the 529 assets are in prepaid tuition plans.
Figure 16b: Number of State-Sponsored Section 529 Accounts in Millions (with Average Savings in Constant (2008) Dollars), 1996 to 2008
Assets in Section 529 college savings plans accumulate tax free and, if used for postsecondary education expenses, can be redeemed tax free. Standard 529 savings plans are simply tax-preferred investments in mutual funds and other financial assets. Prepaid tuition plans are guaranteed to cover fixed proportions of tuition prices in the future, regardless of price increases.
18
T R E N D S I N H I G H E R E D U C A T I O N S E R I E S
For detailed background data and additional information, please visit www.collegeboard.com/trends.
T R E N D S I N S T U D E N T A I D 2 0 0 8
19
Data DefinitionsFederally Supported Programs:Several of the federally supported programs include small amounts of funding from sources other than the federal government. For example, Federal Work-Study (FWS) includes contributions by institutions, although most of the funds in the program are federal. Perkins Loans are funded from federal and institutional capital contributions as well as collections from borrowers. Since FY 2006, no funds have been appropriated for new federal capital contributions. Institutional matching funds required by the Federal Supplemental Educational Opportunity Grant (FSEOG) program since 1989-90 are reported under institutional grants.
LEAP. Formerly known as the State Student Incentive Grants(SSIG) program, the Leveraging Educational Assistance Partner-ship (LEAP) monies reported under federally supported aid include federal monies only; the state share is included in the state grants category. Veterans. Benefits are payments for postsecondary educationand training to veterans and their dependents.Military. Includes educational expenditures under the F. Edward Hebert Armed Forces Health Professions Scholarship Program; Reserve Officers’ Training Corps programs for the Air Force, Army, and Navy/Marines; and higher education tuition assistance for the active duty Armed Forces.Other Grants. Includes Higher Education Grants for Indian Students; American Indian Scholarships; Indian Health Service Scholarships; National Science Foundation predoctoral fellow-ships (minority and general graduate); National Health Service Corps Scholarships; National Institutes of Health predoctoral individual awards; the Jacob K. Javits Fellowship Program; and college grants provided to volunteers in the AmeriCorps national service programs (funding began in 1994-95).Stafford, PLUS, and Perkins Loans. Data provided by the Department of Education on education loan disbursements. Trends in Student Aid reports before 2007 reported instead on loan commitments, a larger number including some loans approved but never disbursed.Other Loans. Includes amounts loaned under the Health Professions Student Loan Program, Disadvantaged Student Loans, and the Nursing Student Loan Program.Education Tax Benefits. Data on education tax credits are IRS estimates of the volume of Hope and Lifetime Learning credits claimed on taxable returns for tax years 1988 and later. Tax deductions are based on IRS Statistics of Income, with associated savings estimated by the College Board based on the marginal tax rates applied to the taxable income of the taxpayers
in each income bracket claiming the deduction. Amounts are attributed to the academic year beginning in the calendar year during which the tax benefit was claimed. Estimates for 2007 are based on earlier data.
Subsidized Stafford Loans: Need-based student loans for which the federal government pays the interest while the student is in school and during a six-month grace period thereafter.
Unsubsidized Stafford Loans: Non-need-based studentloans guaranteed by the federal government but with interest accruing during the in-school time period.
Full-Time Equivalent (FTE) Students: Enrollment numbers based on a federal formula that counts each part-time student as equivalent to approximately one-third of a full-time student.
Graduate and Undergraduate Aid: The breakdown of aid between undergraduate and graduate students is estimated based on the National Postsecondary Student Aid Study (NPSAS)when not available from other sources.
Loan Totals: Nonfederal loans from private lenders are included in Table 1 as an important source of funding for students, but are not considered financial aid since they involve no subsidy to students. Figures 1, 6, 8, and 10 include private loans to give a more complete picture of student borrowing. Figures 2a, 2b, 11a, and 11b measure financial aid amounts and therefore exclude private loans.
Carnegie Classification: Doctorate-granting Universities. Includes institutions that
award at least 20 doctoral degrees per year (excluding doctoral-level degrees that qualify recipients for entry into professional practice, such as the JD, MD, PharmD, DPT, etc.) Excludes Special Focus Institutions and Tribal Colleges.
Master’s Colleges and Universities. Includes institutions thataward at least 50 master’s degrees per year. Excludes Special Focus Institutions and Tribal Colleges.
Baccalaureate Colleges. Includes institutions where baccalaureate degrees represent at least 10% of all undergraduatedegrees and that award fewer than 50 master’s degrees or fewer than 20 doctoral degrees per year. Excludes Special Focus Institutions and Tribal Colleges.
Inflation Adjustment: The Consumer Price Index for all urban dwellers (CPI-U) is used to adjust for inflation. We use the CPI-U in July of the year in which the academic year begins. See ftp://ftp.bls.gov/pub/special.requests/cpi/cpiai.txt for changes in the CPI-U over time.
SourcesCampus-Based Aid (FWS, Perkins, and FSEOG): U.S. Department of Education, Office of Postsecondary Education Policy, Budget, and Analysis staff. Federal Campus-Based Programs Databook.Education Tax Benefits: Income Tax Returns, All Returns, Tables 1.3, 1.4, and 3.3 and additional Statistics of Income sources; Lutz Berkner and Christina Wei, Student Financing of Undergraduate Education 2003-04, NCES 2006-186. Federal Family Education Loan and Ford Direct Student Loan Programs: Unpublished data from the U.S. Department of Education, Policy, Budget, and Analysis staff and the National Student Loan Data System (NSLDS).Full-Time Equivalent (FTE) Enrollment: Based on unpublished computations by IPEDS staff at the National Center for Education Statistics (NCES).Institutional Grants: Estimates based on Integrated Postsecondary Education Data System (IPEDS) data through FY 2007 and data from the College Board’s Annual Survey of Colleges. These figures represent best approximations and are updated each year as additional information becomes available. LEAP and State Grant Programs: 2007-08: Preliminary figures reported by 20 states with largest grant appropriations. Figures for remaining 30 states, the District of Columbia, and Puerto Rico estimated by the College Board. 1988-89 to 2006-07: 20th through 38th Annual Survey Reports of the National Association of State Student Grant and Aid Programs.Military: F. Edward Hebert Armed Forces Health Professions Scholarshipamounts from the Office of the Assistant Secretary for Defense (Health Affairs). ROTC program data from the Air Force, Army, and Navy program offices. Nonfederal Loans: Estimates based on an informal annual College Board survey of major private education loan providers, supplemented by data from annual reports and from Student Lending Analytics, and on informa-tion collected from staff of state-sponsored private loan programs. Other Grants and Loans: Data collected through conversations and corre-spondence with the officials of the agencies that sponsor the programs.Pell Grant Program: Data from Policy, Budget, and Analysis Staff, U.S. Department of Education. Other data from Pell Grant End-of-Year Reports. Private and Employer Grants: Estimates based on data included in the National Postsecondary Student Aid Study (NPSAS) and on 2006 and 2008 National Scholarship Provider’s Association surveys of major private student grant providers, supplemented by information from annual reports of selected scholarship providers and data from institutional financial aid offices.State Savings Plans: Data on assets in state savings plans and guaranteed tuition plans were provided by the National Association of State Treasurers, and the College Savings Plans Network. Veterans Benefits: Benefits Program series (annual publication for each fiscal year), Office of Budget and Finance, U.S. Veterans Administration, and unpublished data from the same agency.
For more details on data sources and methodology, please see the Trends in Student Aid Web site at www.collegeboard.com/trends.
Notes and Sources
T R E N D S I N H I G H E R E D U C A T I O N S E R I E S
This report provides the most recent and complete statistics available on student aid in the United States. Detailed historical data are available online at www.collegeboard.com/trends.
Trends in Student Aid was authored by College Board senior policy analyst Sandy Baum and consultant Kathleen Payea, with invaluable support from consultant Jennifer Ma and senior adviser for student aid policy Kathleen Little.
Contact information for the authors:Sandy Baum, [email protected] Payea, [email protected]
Trends in Student Aid and its companion report, Trends in College Pricing, are supple-mented by a new Web site that makes detailed data available for reference and downloading. PDF versions of these reports, along with PowerPoint slides of all of the graphs, are available on the Web: www.collegeboard.com/trends.
Additional hard copies of the report can be ordered online or via e-mail: [email protected]. Tables, graphs, and data in this report or excerpts thereof may be reproduced or cited, for noncommerical purposes only, provided that the following attribution is included:
Source: Trends in Student Aid. Copyright © 2008The College Board. www.collegeboard.com
AcknowledgmentsThe publication would not have been possible without the cooperation and support of many people at the College Board, including Tom Rudin, Sally Mitchell, Patricia Steele, Eleanor Vogelsang, and Edna DiFeo of the Washington Office and Edna Johnson, Carol Balistreri, William Fogarty, and Larry Hillman of the Marketing & Publication Services division. We are very grateful to Keryl Holman and her staff at Hawthorne Visual for their expert graphic design and publication skills, patience, and support.
We are grateful to all of those who contributed to the data collection for this publication, including state agency and special-aid program contacts,private lenders, and experts from the U.S. Department of Education. Special thanks to Dan Madzelan, Mary Miller, Donald Conner, Greg Gerrans and Frank Morgan of the U.S. Department of Education, as well as Mike Solomon of the Illinois Student Aid Commission, Amy Weinstein of the National Scholarship Provider’s Association, and Chris Hunter of the National Association of State Treasurers for their assistance.
The College BoardThe College Board is a not-for-profit membership association whose mission is to connect students to college success and opportunity. Founded in 1900, the association is composed of more than 5,400 schools, colleges, universities, and other educational organizations. Each year, the College Board serves seven million students and their parents, 23,000 high schools, and 3,500 colleges through major programs and services in college admissions, guidance, assessment, financial aid, enrollment, and teaching and learning. Among its best-known programs are the SAT®, the PSAT/NMSQT®, and the Advanced Placement Program® (AP®). The College Board is committed to the principles of excellence and equity, and that commitment is embodied in all of its programs, services, activities, and concerns.
The Washington Office of the College Board conducts research relevant to public policy issues in education. The office is located at 1233 20th Street NW, Suite 600, Washington, DC 20036-2375. Phone: 202 741-4700.
For further information, visitwww.collegeboard.com.
© 2008 The College Board. All rights reserved. College Board, Advanced Placement Program, AP, SAT, and the acorn logo are registered trademarks of the College Board. inspiring minds is a trademark owned by the College Board. PSAT/NMSQT is a registered trademark of the College Board and National Merit Scholarship Corporation. All other products and services may be trademarks of their respective owners.
080342672