Embed Size (px)
Citation preview

Trends in Higher Education Series
Trends inStudent Aid2013

See the Trends in Higher Education website at trends.collegeboard.org
for the figures and tables in this report and for more information and data.
The online icon at the bottom of each page indicates additional figures and
tables that can be accessed by going to the website.
About the College Board The College Board is a mission-driven not-for-profit organization that connects
students to college success and opportunity. Founded in 1900, the College
Board was created to expand access to higher education. Today, the membership
association is made up of over 6,000 of the world’s leading educational institutions
and is dedicated to promoting excellence and equity in education. Each year, the
College Board helps more than seven million students prepare for a successful
transition to college through programs and services in college readiness and
college success — including the SAT® and the Advanced Placement Program®.
The organization also serves the education community through research and
advocacy on behalf of students, educators, and schools. For further information,
visit www.collegeboard.org.
Trends in Higher Education
The Trends in Higher Education publications include the Trends in College Pricing,
Trends in Student Aid, and Education Pays series in addition to How College Shapes
Lives: Understanding the Issues and other research reports and topical analysis
briefs published periodically. These reports are designed to provide a foundation of
evidence to strengthen policy discussions and decisions.
The tables supporting all of the graphs in this report, a PDF version of the report, and
a PowerPoint file containing individual slides for all of the graphs are available on
our website trends.collegeboard.org.
Please feel free to cite or reproduce the data in this report for noncommercial purposes with proper attribution.
For inquiries or ordering hard copies, please contact: [email protected].
© 2013 The College Board. College Board, Advanced Placement Program, SAT, and the acorn logo are registered trademarks of the College Board. All other products and services may be trademarks of their respective owners.
Visit the College Board on the Web: www.collegeboard.org.

TRENDS IN HIGHER EDUCATION SERIES TRENDS IN STUDENT AID 2013
3
Highlights
The dramatic economic disruptions of the Great Recession had a major impact on colleges and universities, their students, and the multifaceted financial aid system that has developed to help students and their families pay for higher education. The data reported in Trends in Student Aid 2013 reveal that the sharp increases in federal grant aid and in student borrowing accompanying the financial crisis have not been repeated. Indeed, while the federal government continues to play a large and increased role in funding students, spending on both federal grants and federal loans decreased in 2012-13.
TYPES OF STUDENT AID In 2012-13, 49% of all student aid was in the form of grants — the highest percentage over the past decade. In 2008-09, 44% of student aid was grant aid.
– In 2012-13, 43% of all student aid was in the form of federal loans — the lowest percentage over the past decade. In 2008-09, federal loans constituted 49% of student aid.
– The federal government funded 71% of all student aid and 41% of all grant aid to postsecondary students in 2012-13.
– In 2012-13, $238.5 billion in financial aid was distributed to undergraduate and graduate students in the form of grants from all sources, Federal Work-Study, federal loans, and federal tax credits and deductions. In addition, students borrowed about $8.8 billion from private, state, and institutional sources.
– In 2012-13 undergraduate students received an average of $13,730 per full-time equivalent (FTE) student in financial aid, including $7,190 in grants from all sources and $4,900 in federal loans.
– Graduate students received an average of $25,730 per FTE student in financial aid, including $7,800 in grants and $16,240 in federal loans.
– The American Opportunity Tax Credit increased the tax savings for college students and their parents from education credits and tuition deductions from $7.1 billion (in 2012 dollars) in 2008 to $15.6 billion in 2009 and to $20.3 billion in 2011.
SOURCES OF GRANT AID Federal grant aid to undergraduate students more than doubled in constant dollars between 2002‐03 and 2012‐13, increasing from 21% to 24% of the total $185.1 billion in undergraduate aid.
– Total grant aid to postsecondary students increased by 29% in inflation-adjusted dollars between 2008-09 and 2009-10 and by another 12% in 2010-11, but did not grow between 2010-11 and 2012-13.
– Grant aid per FTE student increased by 30% between 2008-09 and 2010-11 and by 1% between 2010-11 and 2012-13.
– In 2012-13, 45% of undergraduate grant aid came from the federal government, compared to 39% 10 years earlier.
– Veterans benefits and military aid increased from 19% to 28% of total federal grants over the decade from 2002-03 to 2012-13.
– In 2012-13, 38% of all grant aid came from colleges and universities, 8% came from state governments, and 13% came from employers and other private sources.
– While federal grant aid to postsecondary students doubled in constant dollars between 2007-08 and 2012-13, state grant aid grew by only 11%.
– In 2011-12, state grant aid per FTE undergraduate student ranged from under $200 (in 2012 dollars) in 12 states to over $1,000 in 10 states.
– Grant aid from colleges and universities in the form of discounts to students grew from $13 billion (in 2012 dollars) in 1992-93 to $22 billion in 2002-03 and to $44 billion in 2012-13.
PELL GRANTS The number of students receiving Pell Grants increased from 4.0 million in 1992‐93 to 4.8 million in 2002‐03 and to 8.8 million in 2012‐13.
– Total Pell Grant expenditures increased from $14.8 billion (in 2012 dollars) in 2002-03 to $37.5 billion in 2010-11, but declined to an estimated $32.3 billion by 2012-13.
– Only undergraduate students who have an expected family contribution of zero and enroll full time/full year receive the maximum Pell Grant. In 2011-12, 28% of recipients received the maximum $5,550 in Pell funding.
– The average Pell Grant per recipient was $2,516 (in 2012 dollars) in 1992-93, $3,099 in 2002-03, and $3,650 in 2012-13. The average grant peaked at $4,028 (in 2012 dollars) in 2010-11.
– The maximum Pell Grant covered 87% of average public four-year tuition and fees in 2003-04, but only 63% in 2013-14. It covered 21% of average private nonprofit four-year tuition and fees in 2003-04, and 19% in 2013-14.
– The percentage of undergraduate students receiving Pell Grants increased from 23% in 2002-03 to 36% in 2012-13.
– In 2011-12, about half of all Pell Grant recipients were ages 24 or older.
– In 2011-12, 30% of independent Pell Grant recipients were enrolled in the for-profit sector, as were 10% of dependent recipients. Two-year public colleges enrolled 39% of independent and 33% of dependent recipients.

TRENDS IN STUDENT AID 2013 trends.collegeboard.org
4
DISTRIBUTION OF STUDENT AIDIn 2012-13, undergraduate students received 52% of their funding in the form of grants, 39% as loans (including nonfederal loans), and 9% in a combination of tax credits or deductions and Federal Work‐Study. For graduate students, these percentages were 30%, 64%, and 6%, respectively.
– In 2011-12, 41% of Pell Grant recipients were dependent on their parents for support, and 60% of these students came from families with incomes of $30,000 or less.
– In 2011, 21% of the savings from education tax credits and 57% of the tuition tax deduction benefit went to households with an adjusted gross income (AGI) over $100,000.
– While 26% of the savings from tax credits went to households with AGI below $25,000 in 2011, only 4% of the tax deduction benefit went to households in this income category.
– In 1992-93, only 10% of all state grant aid for undergraduates was awarded without regard to the students’ financial circumstances. By 2002-03, this percentage had risen to 23%. Between 2010-11 and 2011-12, it fell from 29% to 26%.
– In 2011-12, low-income dependent students enrolled full time in public institutions received about five times as much total grant aid, on average, as those from families with incomes of $106,000 or higher ($8,890 vs. $1,760), but only 30% more institutional grant aid ($1,690 vs. $1,280).
STUDENT BORROWING Total education borrowing fell by 6% in real terms between 2011-12 and 2012-13. Total federal student and parent loans plus nonfederal loans had declined by 2% between 2010-11 and 2011-12.
– The 9% growth in total annual education borrowing between 2007-08 and 2012-13 followed a 55% increase between 2002-03 and 2007-08.
– The percentage of undergraduate students taking federal subsidized or unsubsidized student loans increased from 24% in 2002-03 to 34% in 2012-13. A quarter of all students took both subsidized and unsubsidized loans, while 5% took only subsidized loans.
– Total borrowing from the federal Direct Loan program fell by 3% ($2.9 billion) in 2011-12 and by another 7% ($6.5 billion) in 2012-13. Total borrowing from the PLUS program for parents of undergraduate students fell by 11% ($1.3 billion) over these two years.
– Because graduate students became ineligible for this program in 2012-13, Direct Subsidized Loans per FTE student declined by 33%, from $2,580 (in 2012 dollars) in 2011-12 to $1,740 in 2012-13; Direct Unsubsidized Loans per student increased by 17%, from $2,970 to $3,480 per FTE student.
– Over the past decade, the total number of federal student loan borrowers increased by 69%, from 5.9 million in 2002-03 to 10.0 million in 2012-13. Average Direct Loans per borrower increased by 6%, from $7,900 (in 2012 dollars) in 2002-03 to $8,350 over the decade.
– In 2012-13, undergraduate borrowers took federal loans averaging $6,760, while graduate students borrowed an average of $17,230.
– Nonfederal education loans, which are not part of the student aid system, grew from an estimated $10.5 billion (in 2012 dollars) in 2002-03 to $25.5 billion in 2007-08. Since then, student loan volume from banks, credit unions, states, and institutions has declined to about $8.8 billion.
– The percentage of undergraduate students taking private education loans fell from 14% in 2007-08 to 6% in 2011-12; the percentage of graduate students relying on this source of funds fell from 11% to 4%.
STUDENT DEBT About 60% of students who earned bachelor’s degrees in 2011-12 from the public and private nonprofit institutions at which they began their studies graduated with debt. They borrowed an average of $26,500.
– In 2012, 40% of borrowers with outstanding education debt owed less than $10,000 and another 30% owed between $10,000 and $25,000; 4% of borrowers owed $100,000 or more. This debt includes borrowing for both undergraduate and graduate studies.
– Among individuals who began their postsecondary studies in 2003-04, 43% had not accumulated education debt by 2009. Another 25% had borrowed less than $10,000, while 2% had borrowed more than $50,000.
– In 2013, 1.6 million federal Direct Loan borrowers were in repayment plans that limit their payments to a specified percentage of their incomes. These borrowers constituted 11% of those in repayment plans, and they held 22% of the total outstanding debt in repayment plans.
– By Sept. 11, 2012, 10% of borrowers who entered repayment in 2010-11 had defaulted on their federal student loans. This was the highest two-year cohort default rate since FY 1995, but the default rates were 21% and 22% in 1989 and 1990, respectively.
– For-profit institutions accounted for 11% of all students enrolled in 2009-10, 32% of those who entered repayment in 2010-11, and 43% of those who defaulted by the end of September 2012.

TRENDS IN HIGHER EDUCATION SERIES TRENDS IN STUDENT AID 2013
5
Contents
3 Highlights7 Introduction10 Total Student Aid TABLE 1 Total Student Aid and Nonfederal Loans in 2012 Dollars over Time
FIGURE 2 Total Student Aid by Source and Type
TABLE 2 Total Student Aid and Nonfederal Loans in Current Dollars over Time
11 Aid per Full-Time Equivalent (FTE) Student
FIGURE 1 Ten-Year Trend in Student Aid and Nonfederal Loans per FTE Student
FIGURE 1A Student Aid and Nonfederal Loans per FTE Undergraduate Student over Time
FIGURE 1B Student Aid and Nonfederal Loans per FTE Graduate Student over Time
12 Total Undergraduate Student Aid by Type
FIGURE 2A Undergraduate Student Aid by Source and TypeTABLE 1A Total Undergraduate Student Aid in 2012 Dollars over TimeTABLE 2A Total Undergraduate Student Aid and Nonfederal Loans in Current Dollars
over Time
13 Total Graduate Student Aid by Type
FIGURE 2B Graduate Student Aid by Source and Type
TABLE 1B Total Graduate Student Aid in 2012 Dollars over Time
TABLE 2B Total Graduate Student Aid and Nonfederal Loans in Current Dollars over Time
14 Grants and Loans per Student
FIGURE 3A Average Aid per FTE Undergraduate Student over Time
FIGURE 3B Average Aid per FTE Graduate Student over Time
FIGURE 3 Average Aid per FTE Student over Time
TABLE 3 Grants, Loans, and Tax Benefits per FTE Student — All Students
TABLE 3A Grants, Loans, and Tax Benefits per FTE Student — Undergraduate
TABLE 3B Grants, Loans, and Tax Benefits per FTE Student — Graduate
15 Total Grants and Total Loans
FIGURE 4A Undergraduate Student Grant and Loan Percentages over TimeFIGURE 4B Graduate Student Grant and Loan Percentages over TimeTABLE 4 Total Aid and Nonfederal Loans in Current and Constant Dollars and Percentages
over TimeTABLE 4A Undergraduate Total Aid and Nonfederal Loans in Current and Constant Dollars
and Percentages over TimeTABLE 4B Graduate Total Aid and Nonfederal Loans in Current and Constant Dollars and
Percentages over Time
16 Types of Grants FIGURE 5 Total Federal, Institutional, Private and Employer, and State Grants over Time
17 Types of Loans FIGURE 6 Total Federal and Nonfederal Loans over Time
18 Federal Aid Recipients
FIGURE 7A Number of Federal Aid Recipients by Program, 2012-13FIGURE 7B Total Number of Undergraduate and Graduate Federal Loan Borrowers and
Average Amount Borrowed over TimeTABLE 5 Federal Aid per Recipient by Program in Current and Constant Dollars over Time
TABLE 6 Federal Loan Programs in Current and Constant Dollars over Time
19 Federal Aid by Sector
FIGURE 8A Percentage Distribution of Federal Aid Funds by Sector, 2012-13FIGURE 8B Percentage Distribution of Pell Grant and Federal Loan Funds by Sector over TimeTABLE 7 Percentage Distribution of Federal Aid Funds by Sector over Time
20 Student Loans FIGURE 9A Percentage of Undergraduate Students Borrowing Federal Loans over TimeFIGURE 9B Percentage of Undergraduate and Graduate Students Borrowing Private Loans
over TimeFIGURE 9C Percentage of Undergraduate Students Borrowing Private Loans by Sector, Family
Income, and Dependency Status, 2011-12TABLE 6A Undergraduate Students: Federal Loan Programs in Current and Constant Dollars
over TimeTABLE 6B Graduate Students: Federal Loan Programs in Current and Constant Dollars over Time
21 Student Debt FIGURE 10A Average Debt Levels of Public Sector Bachelor’s Degree Recipients over TimeFIGURE 10B Average Debt Levels of Private Nonprofit Sector Bachelor’s Degree Recipients
over Time
Figures and tables that are available online only at trends.collegeboard.org.

TRENDS IN STUDENT AID 2013 trends.collegeboard.org
6
Contents — Continued
22 Student Debt FIGURE 11A Distribution of Outstanding Education Debt BalancesFIGURE 11B Total Outstanding Student Debt, Number of Borrowers, and Average Balance,
Relative to 2005 Fourth QuarterFIGURE 11C Cumulative Debt Among Students Beginning Postsecondary Education in 2003-04
by Degree Attainment Levels, 2009
FIGURE 2012_11A Cumulative Debt: Attainment by Debt Level
FIGURE 2012_11B Cumulative Debt: Sector of Bachelor’s Degree Recipients by Debt Level
FIGURE 2012_11C Cumulative Debt: Students Who Left Without Completing a Degree by Sector and Length of Enrollment
FIGURES 2011_9A, 2011_9B
Cumulative Debt Among 2009 Bachelor’s Degree Completers and Non-Completers by Sector
23 Student Loan Repayment
FIGURE 12A Distribution of Outstanding Federal Direct Loan Borrowers and Dollars by Repayment Plan, FY 2013
FIGURE 12B Federal Student Loan Two-Year Cohort Default Rates over Time
FIGURE 12C Distribution of Total Enrollments, 2009-10, Borrowers Entering Repayment, and Defaulters, FY 2011, by Sector
24 Pell Grants FIGURE 13A Pell Grants: Total Expenditures, Maximum and Average Grants, and Number of Recipients over Time
FIGURE 13B Maximum and Average Pell Grant over Time
TABLE 8 Federal Pell Grant Awards in Current and Constant Dollars over Time
25 Pell Grants FIGURE 14A Total Enrollment and Percentage Receiving Pell Grants over Time
FIGURE 14B Maximum Pell Grant as Percentage of Tuition and Fees and Total Charges over Time
COLLEGE PRICING TABLE 2
Tuition and Fee and Room and Board Charges over Time
26 Pell Grants FIGURE 15A Distribution of Pell Grant Recipients by Dependency Status, Enrollment Intensity, and Institutional Sector, 2011-12
FIGURE 15B Distribution of Pell Grant Recipients by Family Income and Dependency Status, 2011-12
FIGURE 15C Distribution of Pell Grant Recipients by Age, 2011-12
27 Education Tax Credits and Tuition Deductions
FIGURE 16A Total Education Tax Benefits over Time
FIGURE 16B Distribution of Education Tax Credits by AGI, 2011
FIGURE 16C Distribution of Savings from Tuition Tax Deductions by AGI, 2011
28 State Grants FIGURE 17A Need-Based and Non-Need-Based State Grants per FTE Undergraduate Student over Time
FIGURE 17B Percentage of State Grants Based on Need by State, 2011-12
29 State Grants FIGURE 18A State Grant Aid per FTE Undergraduate, 2011-12
FIGURE 18B State Grant Expenditures as Percentage of Total State Support for Higher Education
30 Institutional Grant Aid
FIGURE 19 Public Four-Year and Private Nonprofit Four-Year Institutional and Other Grant Aid by Dependency Status and Income, 2011-12
31 Institutional Grant Aid
FIGURE 20A Public Sector Institutional Grant Aid over Time
FIGURE 20B Private Nonprofit Sector Institutional Grant Aid over Time
32 College Savings Plans
FIGURE 21A Section 529 College Savings Plan Assets over Time
FIGURE 21B Section 529 College Savings Plans: Account Value and Number of Accounts over Time
FIGURE 21C Section 529 College Savings Plan Accounts: Contributions and Distributions over Time
33 Notes and Sources TABLE A2 Consumer Price Index, Not Seasonally Adjusted, All Items, U.S. City Average, 1982-84=100
Figures and tables that are available online only at trends.collegeboard.org.

TRENDS IN HIGHER EDUCATION SERIES TRENDS IN STUDENT AID 2013
7
“Even after adjusting for inflation, the growth in student aid has been dramatic. In terms of what the dollar was worth in 1982, there was $1.7 billion in aid available in 1963-64, $10.9 billion by 1970-71, and $18.2 billion by 1975-76.” The New York Times reported this information in its Jan. 16, 1984 report on Trends in Student Aid: 1963 to 1983.1 The headline, “Study Finds Significant Drop in Financial Aid for Students,” suggests that the student aid story was not much easier to understand 30 years ago than it is today.
In the 30 years since the College Board began publishing its annual reports on student aid, all of the numbers have changed by orders of magnitude. Since 1982-83, total fall enrollment in degree-granting postsecondary institutions has increased from just over 12 million to about 21 million; total federal aid has grown from $29 billion (in 2012 dollars) to $170 billion in 2012-13; and total student aid from all sources has increased from $36 billion to $238 billion.
In 1982-83, the average student received $2,130 (in 2012 dollars) in grant aid and borrowed $1,720 in federal loans. Thirty years later, we are reporting $7,270 in grant aid per full-time equivalent (FTE) student and $6,370 in federal loans. Over the same period, average tuition and fees at public four-year colleges and universities rose from $2,423 (in 2012 dollars) in 1982-83 to $8,646 in 2012-13. (The average price in 2013-14 is $8,893.)
Concerns over college prices and how students can pay them have persisted over all of these years. A July 21, 1983, headline in The New York Times reported “College Costs Up 9–10% a Year” — up to three times faster than the general rate of inflation.2 A 1985 article gave advice on “Coping with College Costs.”3
The Trends in Student Aid series has evolved since 1983 to include more information about the funds available to help students pay for postsecondary education. We have added text that highlights and explains key elements of the data reported. We have developed a website that allows users to find current and historical information and to download data easily. We rely on many sources to help us gather the data we include. Colleagues with the U.S. Department of Education, state student aid agencies, the National Association of Student Financial Aid Administrators, the National Scholarship Providers Association, MeasureOne, the Consumer Financial Protection Bureau, and the National Association of State Treasurers all provide invaluable assistance.
Since 1998, Trends in College Pricing has been the companion publication to Trends in Student Aid, reporting on changes in college prices over time; on the variation in prices across sectors, states, and regions; on some of the revenue and expenditure factors contributing to the prices charged; and on the net prices students actually pay after taking financial aid into consideration.
In 2013, two additional reports supplement the Trends reports. Education Pays 2013: The Benefits of Higher Education for Individuals and Society is the fourth edition in this series, begun in 2004 to elucidate the monetary and nonmonetary benefits of higher education, as well as the differences in participation and success across demographic groups. A second 2013 report, How College Shapes Lives: Understanding the Issues, focuses on the variation in the returns to postsecondary education and sheds light on some of the methodological and conceptual complexities underlying the issues covered in Education Pays.
TRENDS IN STUDENT AIDThis report documents grant aid from federal and state governments, colleges and universities, employers, and other private sources, as well as loans, tax benefits, and Federal Work-Study (FWS) assistance. It examines changes in funding levels over time, reports on the distribution of aid across students with different incomes and attending different types of institutions, and tracks the debt students incur as they pursue the educational opportunities that can increase their earnings, open doors to new experiences, and improve their ability to adapt to an ever-changing society. The report puts recent changes into historical context and provides important background information for ongoing conversations about the roles of federal, state, institutional, and private partners in helping students and families finance postsecondary education. Only policy reforms based on reliable data and analyses can assure that the financial aid system continues to increase educational opportunities for students and to support the development of a more productive labor force and a more educated society.
TOTAL STUDENT AIDThe dramatic economic disruptions of the Great Recession had a major impact on colleges and universities, their students, and the multifaceted financial aid system that has developed to help students and their families pay for higher education. The data reported in Trends in Student Aid 2013 reveal that the sharp increases in federal grant aid and in student borrowing that accompanied the financial crisis have not been repeated. Indeed, while the federal government continues to play a large and increased role in funding students, inflation-adjusted spending on both federal grants and federal loans decreased in 2011-12 and again in 2012-13.
Table 1 of Trends in Student Aid reports on the total funds available to postsecondary students, both undergraduate and graduate, to supplement family and student payments over the decade from 2002-03 to 2012-13, making higher education financially accessible. Increases in total funds are important indicators of the resources being devoted to student assistance. But these figures may create an overly optimistic view of the benefits available to individual students because they do not account for increases in the number of students enrolled in postsecondary education.
Introduction
1. http://www.nytimes.com/1984/01/16/us/study-finds-significant-drop-in-financial-aid-for-students.html
2. http://www.nytimes.com/1983/07/21/us/college-costs-up-9-10-a-year.html
3. http://www.nytimes.com/1985/12/07/business/your-money-coping-with-college-costs.html

TRENDS IN STUDENT AID 2013 trends.collegeboard.org
8
Figure 1 shows the funds detailed in Table 1 divided across full-time equivalent (FTE) students. Between 2002-03 and 2012-13, total FTE postsecondary enrollment increased by 27%, with 2.9 million more FTE undergraduates and 481,000 more graduate students enrolled at the end of the decade. The 96% increase (after adjusting for inflation) in total financial aid over the decade amounted to a 54% increase in aid per FTE student.
The data in Table 1 have been adjusted for inflation. Similar tables in current dollars (unadjusted) that include data going back to 1963 and that separate undergraduates from graduate students are available online.
TYPES OF STUDENT AIDFrom the student’s perspective, grant aid, which is a pure subsidy not requiring repayment, is the most desirable form of financial aid. Tax credits and deductions are also pure subsidies, but the fact that the savings generally materialize months after the tuition bills have been paid makes them less effective in facilitating college access.
Education loans postpone, but do not eliminate, student payments. However, because most federal loans do reduce the overall cost of education for students — although by much less than the face value of the loans — they qualify as a form of student aid. The government pays the interest on Direct Subsidized Loans and Perkins Loans while the student is in school. Other federal loans also carry interest rates that are controlled by legislation and most include protections for repayment difficulties. In contrast, nonfederal education loans from banks, other private lending institutions, and (on a smaller scale) states and postsecondary institutions are generally not subsidized at all. Their value is in providing liquidity for students who have no other means of accessing funds. We report on nonfederal student loans because of their importance, but since they do not carry subsidies, we do not include them in our measures of student aid.
A small amount of student aid comes from the Federal Work-Study Program, under which the federal government provides funds to institutions to subsidize wages for some student workers with documented financial need. Although these funds are packaged along with grants and loans to help students pay their bills, from the students’ perspective they are wages received for services performed. We include only the federal share of FWS earnings in our measure of student aid.
As Figures 4A and 4B reveal, graduate students rely more heavily than undergraduates on loans. Grants constituted 52% of the funding for undergraduates in 2012-13, but made up only 30% of the student aid and nonfederal loans received by graduate students. The teaching and research assistantships from which many graduate students benefit are a form of compensation and are not included here.
FEDERAL AIDLike other need-based aid programs, the Pell Grant program bases eligibility on the information provided by students and parents on the Free Application for Federal Student Aid (FAFSA) and the Federal Methodology (FM) formula. Eligibility for Pell Grants does not differ depending on the charges at the school attended. In contrast, Direct Subsidized Loan eligibility, limited to undergraduates, is based on both the student’s financial circumstances and cost of attendance. Campus-based federal funds, including FWS, Federal Supplemental Educational Opportunity Grants (FSEOG), and Perkins Loans, are also need-based. However, these funds are distributed to institutions based on a complex formula, and the institutions allocate them to students with financial need.
Direct Unsubsidized Loans are available to students regardless of their financial circumstances and PLUS Loans require only the absence of adverse credit. Figures 8A and 8B illustrate the distribution of these various forms of aid to students at different types of institutions. Aid to veterans and military personnel now constitutes 28% of all federal grants awarded to students, and federal tax credits and deductions provide about 43% as much assistance as all forms of federal grants.
GRANT AIDGrant aid comes from the federal government, state governments, employers, and other private sources, and from colleges and universities in the form of discounts applied to the published price. Led by a near doubling in federal grants to postsecondary students, total grant aid increased by 45% in constant dollars between 2008-09 and 2010-11. But a 10% decline in federal grants over the next two years contributed to a 1% decline (in constant dollars) in total grant aid between 2010-11 and 2012-13.
The rapid rise in expenditures during the worst of the recent economic downturn has increased the policy focus on student aid at both the federal and state levels. The evidence that this spike did not signal a new long-term growth pattern may calm some of the tension over the issue. But the renewed focus on the effectiveness of grant aid, and on its role in supporting student success in addition to access to postsecondary education, is likely to continue and could generate significant reforms to existing programs.
In addition to total and per student amounts of grant aid, Trends in Student Aid reports on the distribution of grant aid among students. Some parents are able to provide their children with the financial resources necessary to pay tuition and fees, as well as other costs associated with going to college, without serious difficulty. For many others, postsecondary education would be out of the question without generous subsidies from the government, their colleges and universities, or other sources. As college prices and the other expenses associated with college attendance continue to rise more rapidly than incomes, more students and potential students fall into the second category.

TRENDS IN HIGHER EDUCATION SERIES TRENDS IN STUDENT AID 2013
9
Federal grants are targeted at low- and moderate-income students, but both states and institutions frequently consider factors other than, or in addition to, financial circumstances when allocating their aid. Figures 17A and 17B show changes over time and variation across states in the distribution of need-based and non-need-based grant aid. Despite a long-term trend in many states toward state grants based on academic qualifications alone, the percentage of state grant aid distributed at least in part based on financial circumstances increased from 71% in 2010-11 to 74% in 2011-12, and 22 states considered ability to pay in the allocation of at least 95% of their grant funds.
LOANSThe federal government offers several different types of loans. As of July 1, 2010, the federal government no longer guarantees education loans made by banks and other private lenders, but funds these loans through the Federal Direct Student Loan Program. Major federal education loan programs include those for undergraduate students with documented financial need (Direct Subsidized Loans), for undergraduate and graduate students (Direct Unsubsidized Loans), for graduate students only (Grad PLUS), for parents (PLUS), and for students with high need at some institutions (Perkins).
The conditions and interest rates vary by program. As of 2012-13, interest accrues on all of the loans taken by graduate students, but almost half of the undergraduate Direct Loans carry the in-school interest subsidy.
Figure 12B reports on default rates for federal student loans. In the current weak economy, default rates have risen measurably, although the current 10.0% two-year cohort default rate (CDR) is much lower than the peak of 22% in FY 1990. The federal government is in the process of extending the window for inclusion in the official measure of default from two years to three years after entering repayment. Students who default later in the repayment period will still be excluded from the official count.
As Figure 12A reports, about 1.6 million students are now enrolled in income-based repayment plans, limiting their payments on federal loans to a specified percentage of their discretionary incomes. If more students took advantage of these options, inadequate earnings would not lead them to default on their student loans. Nonfederal loans, however, are not eligible for this protection.
The private loan market is an important supplementary source of funds for some students, but the loans generally have higher interest rates over the long term and have less favorable repayment provisions than federal loans. As Figures 9B and 9C reveal, reliance on these loans has declined significantly in recent years. The totals for nonfederal loans reported in Table 1 and elsewhere in Trends in Student Aid also include the loans that states and institutions make to students. Like our estimates of grants from
private sources, our estimates in this area are less precise than most of the data on student financial aid that we report.
Total education borrowing declined from $120.1 billion (in 2012 dollars) in 2010-11 to $110.3 billion in 2012-13. But the total borrowed is 69% higher than it was a decade earlier. Interpreting the growth in total education loan volume is difficult because it is partially a reflection of both increases in enrollment and declines in the availability of other appealing sources of borrowing, such as home equity loans. The real concern about student loans is the amount of debt that individual students accumulate. Student loans make it possible for many students who could not otherwise pay for college to acquire the postsecondary experience they need to improve their life prospects. Just as most small business start-ups would be impossible to launch without loans that can be repaid out of future earnings, many students would be unable to invest in themselves without debt financing. Although postsecondary education has a higher success rate in terms of future earnings than small businesses, excessive debt and barriers to managing that debt create major difficulties for many students.
Stories in the press about individual students with startling amounts of debt obscure actual borrowing patterns. As Figure 11C reports, only 2% of students who first enrolled in 2003-04 had borrowed more than $50,000 by 2008-09. The vast majority of these borrowers had earned bachelor’s degrees by that year. In contrast, over 40% of those who did not borrow or who borrowed less than $10,000 were no longer in school in 2008-09 and had not earned a degree or certificate.
As Figures 10A and 10B indicate, the average debt of bachelor’s degree recipients who graduated from the public four-year institution at which they began their studies has grown more rapidly since 2008-09 than it did during the preceding decade. In contrast, average debt levels for private nonprofit bachelor’s degree recipients have risen very slowly in recent years. About two-thirds of all bachelor’s degree recipients graduate with education debt.
THE CONSUMER PRICE INDEXWe provide much of our data in constant dollars, adjusting values for changes in the Consumer Price Index (CPI). We use the change in the CPI from July 2011 to July 2012 to compare the value of aid in 2011-12 to the value in 2012-13. The CPI increased by 1.4% between July 2011 and July 2012.
The tables supporting all of the graphs in the Trends publications, PDF versions of the publications, PowerPoint files containing individual slides for all of the graphs, and other detailed data on student aid and college pricing are available on our website at trends.collegeboard.org. Please feel free to cite or reproduce the data in Trends for noncommercial purposes with proper attribution.
TRENDS IN STUDENT AID 2013 trends.collegeboard.org
10 See Figure 2 Total Student Aid by Source and Table 2 Total Student Aid and Nonfederal Loans in Current Dollars over Time.
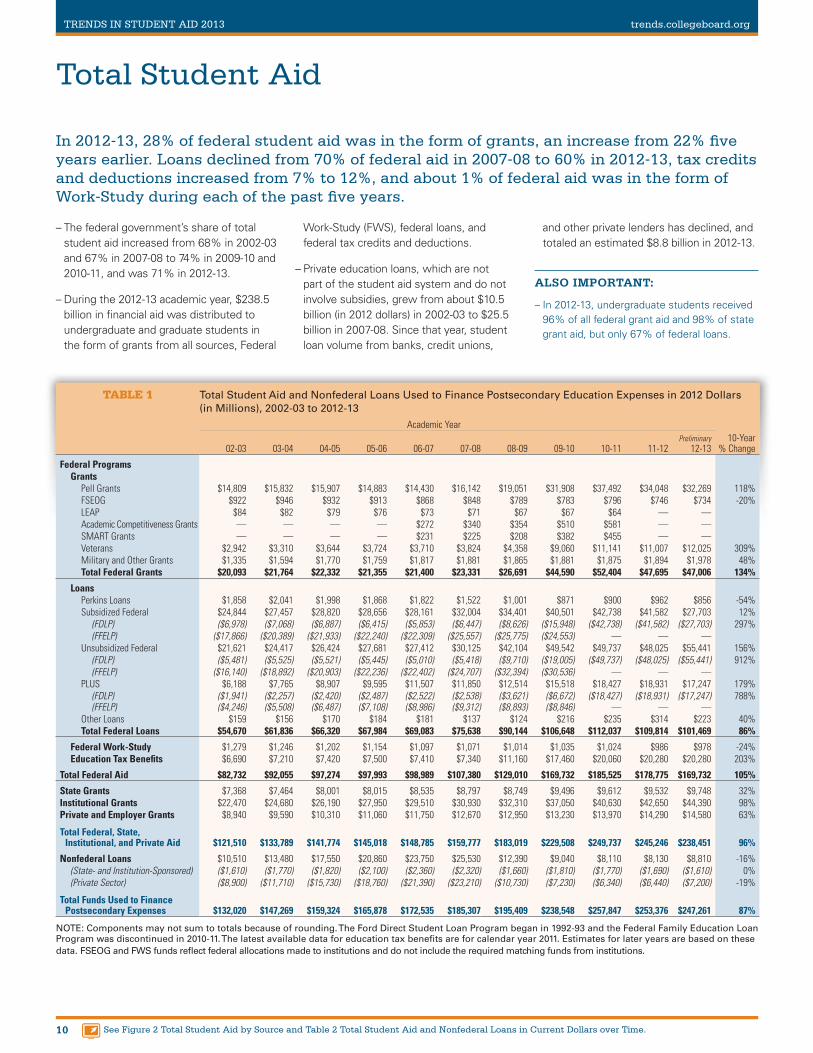
In 2012-13, 28% of federal student aid was in the form of grants, an increase from 22% five years earlier. Loans declined from 70% of federal aid in 2007-08 to 60% in 2012-13, tax credits and deductions increased from 7% to 12%, and about 1% of federal aid was in the form of Work-Study during each of the past five years.
Total Student Aid
– The federal government’s share of total student aid increased from 68% in 2002-03 and 67% in 2007-08 to 74% in 2009-10 and 2010-11, and was 71% in 2012-13.
– During the 2012-13 academic year, $238.5 billion in financial aid was distributed to undergraduate and graduate students in the form of grants from all sources, Federal
Work-Study (FWS), federal loans, and federal tax credits and deductions.
– Private education loans, which are not part of the student aid system and do not involve subsidies, grew from about $10.5 billion (in 2012 dollars) in 2002-03 to $25.5 billion in 2007-08. Since that year, student loan volume from banks, credit unions,
and other private lenders has declined, and totaled an estimated $8.8 billion in 2012-13.
ALSO IMPORTANT:
– In 2012-13, undergraduate students received 96% of all federal grant aid and 98% of state grant aid, but only 67% of federal loans.
TABLE 1 Total Student Aid and Nonfederal Loans Used to Finance Postsecondary Education Expenses in 2012 Dollars (in Millions), 2002-03 to 2012-13
Academic Year
02-03 03-04 04-05 05-06 06-07 07-08 08-09 09-10 10-11 11-12 Preliminary
12-1310-Year
% Change
Federal ProgramsGrants
Pell Grants $14,809 $15,832 $15,907 $14,883 $14,430 $16,142 $19,051 $31,908 $37,492 $34,048 $32,269 118%FSEOG $922 $946 $932 $913 $868 $848 $789 $783 $796 $746 $734 -20%LEAP $84 $82 $79 $76 $73 $71 $67 $67 $64 — —Academic Competitiveness Grants — — — — $272 $340 $354 $510 $581 — —SMART Grants — — — — $231 $225 $208 $382 $455 — —Veterans $2,942 $3,310 $3,644 $3,724 $3,710 $3,824 $4,358 $9,060 $11,141 $11,007 $12,025 309%Military and Other Grants $1,335 $1,594 $1,770 $1,759 $1,817 $1,881 $1,865 $1,881 $1,875 $1,894 $1,978 48%Total Federal Grants $20,093 $21,764 $22,332 $21,355 $21,400 $23,331 $26,691 $44,590 $52,404 $47,695 $47,006 134%
LoansPerkins Loans $1,858 $2,041 $1,998 $1,868 $1,822 $1,522 $1,001 $871 $900 $962 $856 -54%Subsidized Federal $24,844 $27,457 $28,820 $28,656 $28,161 $32,004 $34,401 $40,501 $42,738 $41,582 $27,703 12%
(FDLP) ($6,978) ($7,068) ($6,887) ($6,415) ($5,853) ($6,447) ($8,626) ($15,948) ($42,738) ($41,582) ($27,703) 297%(FFELP) ($17,866) ($20,389) ($21,933) ($22,240) ($22,309) ($25,557) ($25,775) ($24,553) — — —
Unsubsidized Federal $21,621 $24,417 $26,424 $27,681 $27,412 $30,125 $42,104 $49,542 $49,737 $48,025 $55,441 156%(FDLP) ($5,481) ($5,525) ($5,521) ($5,445) ($5,010) ($5,418) ($9,710) ($19,005) ($49,737) ($48,025) ($55,441) 912%(FFELP) ($16,140) ($18,892) ($20,903) ($22,236) ($22,402) ($24,707) ($32,394) ($30,536) — — —
PLUS $6,188 $7,765 $8,907 $9,595 $11,507 $11,850 $12,514 $15,518 $18,427 $18,931 $17,247 179%(FDLP) ($1,941) ($2,257) ($2,420) ($2,487) ($2,522) ($2,538) ($3,621) ($6,672) ($18,427) ($18,931) ($17,247) 788%(FFELP) ($4,246) ($5,508) ($6,487) ($7,108) ($8,986) ($9,312) ($8,893) ($8,846) — — —
Other Loans $159 $156 $170 $184 $181 $137 $124 $216 $235 $314 $223 40%Total Federal Loans $54,670 $61,836 $66,320 $67,984 $69,083 $75,638 $90,144 $106,648 $112,037 $109,814 $101,469 86%
Federal Work-Study $1,279 $1,246 $1,202 $1,154 $1,097 $1,071 $1,014 $1,035 $1,024 $986 $978 -24%Education Tax Benefits $6,690 $7,210 $7,420 $7,500 $7,410 $7,340 $11,160 $17,460 $20,060 $20,280 $20,280 203%
Total Federal Aid $82,732 $92,055 $97,274 $97,993 $98,989 $107,380 $129,010 $169,732 $185,525 $178,775 $169,732 105%
State Grants $7,368 $7,464 $8,001 $8,015 $8,535 $8,797 $8,749 $9,496 $9,612 $9,532 $9,748 32%Institutional Grants $22,470 $24,680 $26,190 $27,950 $29,510 $30,930 $32,310 $37,050 $40,630 $42,650 $44,390 98%Private and Employer Grants $8,940 $9,590 $10,310 $11,060 $11,750 $12,670 $12,950 $13,230 $13,970 $14,290 $14,580 63%
Total Federal, State, Institutional, and Private Aid $121,510 $133,789 $141,774 $145,018 $148,785 $159,777 $183,019 $229,508 $249,737 $245,246 $238,451 96%
Nonfederal Loans $10,510 $13,480 $17,550 $20,860 $23,750 $25,530 $12,390 $9,040 $8,110 $8,130 $8,810 -16%(State- and Institution-Sponsored) ($1,610) ($1,770) ($1,820) ($2,100) ($2,360) ($2,320) ($1,660) ($1,810) ($1,770) ($1,690) ($1,610) 0%(Private Sector) ($8,900) ($11,710) ($15,730) ($18,760) ($21,390) ($23,210) ($10,730) ($7,230) ($6,340) ($6,440) ($7,200) -19%
Total Funds Used to Finance Postsecondary Expenses $132,020 $147,269 $159,324 $165,878 $172,535 $185,307 $195,409 $238,548 $257,847 $253,376 $247,261 87%
NOTE: Components may not sum to totals because of rounding. The Ford Direct Student Loan Program began in 1992-93 and the Federal Family Education Loan Program was discontinued in 2010-11. The latest available data for education tax benefits are for calendar year 2011. Estimates for later years are based on these data. FSEOG and FWS funds reflect federal allocations made to institutions and do not include the required matching funds from institutions.

TRENDS IN HIGHER EDUCATION SERIES TRENDS IN STUDENT AID 2013
11See Figure 1A and Figure 1B Undergraduate and Graduate Student Aid per FTE Student in 2012 Dollars over Time.
– Over the decade from 2002-03 to 2012-13, grant aid per FTE student increased by 55% in inflation-adjusted dollars. Total loans per student, including federal student loans, parent loans, and nonfederal loans, increased by 33%.
– Over the five years from 2007-08 to 2012-13, grant aid per FTE student increased by 34%, from $5,420 (in 2012
dollars) to $7,270. Total loans per FTE student declined by 4%, from $7,250 to $6,930.
– As of July 1, 2012, graduate students are no longer eligible for Direct Subsidized Loans, on which the government pays the interest while students are in school.
– As a result of this policy change, the largest changes in aid from individual programs between 2011-12 and 2012-13 were a 32% decline in Direct Subsidized Loans, from $2,580 (in 2012 dollars) to $1,740 per FTE student, and a 17% increase in Direct Unsubsidized Loans, from $2,970 to $3,480. Total Direct Loans per FTE student declined by 6% in constant dollars.
Total financial aid per full‐time equivalent (FTE) student increased 54% over the last decade, from $9,700 (in 2012 dollars) in 2002-03 to $14,980 in 2012-13. In addition, students borrowed an average of about $840 in 2002-03 and about $550 in 2012-13 from nonfederal sources.
NOTE: See Notes and Sources for a list of programs included in other federal programs. The Campus-Based Aid category in Figure 1 includes FSEOG, Perkins, and FWS. FSEOG funds are included in calculations of federal grants per student and Perkins loans are included in calculations of federal loans per FTE student.
SOURCES: Table 1; National Center for Education Statistics (NCES), unpublished IPEDS enrollment data.
Aid per Full-Time Equivalent (FTE) Student
FIGURE 1 Ten-Year Trend in Student Aid and Nonfederal Loans per Full-Time Equivalent (FTE) Student Used to Finance Postsecondary Education Expenses in 2012 Dollars, 2002-03 to 2012-13
$0
$2,000
$4,000
$6,000
$8,000
$10,000
$12,000
$14,000
$16,000
12-1311-1210-1109-1008-0907-0806-0705-0604-0503-0402-03
Academic Year
2012
Dol
lars
Federal Campus-Based Programs
Nonfederal Student Loans
Education Tax Bene�ts
Unsubsidized Federal Loans
Subsidized Federal Loans
Private and Employer Grants
Institutional Grants
Federal Pell Grants
State Grants
Federal Parent Loans (PLUS)and Grad PLUS Loans
Other Federal Programs

TRENDS IN STUDENT AID 2013 trends.collegeboard.org
12 See Table 2A Undergraduate Student Aid and Nonfederal Loans in Current Dollars over Time.
Total Undergraduate Student Aid by Type
FIGURE 2AUndergraduate Student Aid by Source and Type (in Billions), 2012-13
NOTE: Percentages may not sum to 100 and components may not sum to total because of rounding. See Notes and Sources for a list of programs included in federal grant programs. Nonfederal loans are not included because they involve no subsidy and are not actually a form of financial aid.
SOURCE: Trends in Student Aid website (trends.collegeboard.org), Table 1A.
TABLE 1A Total Undergraduate Student Aid in 2012 Dollars (in Millions), 1992-93 to 2012-13, Selected Years
1992-93 1997-98 2002-03 2007-08 2008-09 2009-10 2010-11 2011-12 Preliminary
2012-13
Total Federal Grants $13,462 $12,433 $19,482 $22,536 $25,842 $43,271 $50,840 $46,048 $45,228
Total Federal Loans $15,643 $30,273 $37,243 $48,242 $60,358 $72,067 $74,674 $73,036 $67,791
Federal Work-Study $896 $1,049 $1,136 $948 $895 $912 $908 $881 $874
Education Tax Benefits — $1,830 $5,750 $6,120 $9,290 $14,540 $16,700 $16,880 $16,880
TOTAL FEDERAL AID $30,001 $45,585 $63,611 $77,846 $96,385 $130,790 $143,122 $136,845 $130,772
State Grants $3,301 $4,738 $7,183 $8,629 $8,642 $9,364 $9,484 $9,383 $9,592
Institutional Grants $10,270 $13,380 $17,240 $23,920 $25,090 $28,890 $31,810 $33,530 $34,890
Private and Employer Grants $3,560 $3,730 $6,300 $7,810 $8,180 $8,540 $9,220 $9,630 $9,840
TOTAL FEDERAL, STATE, INSTITUTIONAL, AND PRIVATE AID $47,132 $67,433 $94,334 $118,205 $138,297 $177,584 $193,636 $189,388 $185,094
In 2012-13, federal loans constituted 37% and federal grants constituted 24% of the $185.1 billion in student aid received by undergraduate students.
Institutional Grants ($34.9)
State Grants ($9.6)
Federal EducationTax Credits and
Deductions ($16.9)Federal Loans ($67.8)
Federal Work-Study ($0.9)
Federal Pell Grants ($32.3)
Federal Grant ProgramsOther Than Pell ($13.0)
5%
$185.1Billion
19%
5%
9%
37%
<1%
17%
7%
Private and Employer Grants ($9.8)
– The 19% of undergraduate aid that came in the form of institutional grants in 2012-13 constituted 35% of all undergraduate grant aid. The federal government provided 45% of undergraduate grant aid.
– Federal grant aid to undergraduates increased by 132% in constant dollars between 2002-03 and 2012-13, increasing from 21% of total undergraduate aid to 24%. Federal loans increased by 82%, but declined from 39% to 37% of total undergraduate aid over the decade.
ALSO IMPORTANT:
– In fall 2012, an estimated 13.8 million (87%) of the 15.9 million full-time equivalent (FTE) postsecondary students were undergraduates.
– In fall 2012, 41% of FTE undergraduate enrollment was in the public four-year sector, 30% in public two-year colleges, 17% in private nonprofit four-year institutions, and 12% in the for-profit sector, with a small share in other institutions.
– Undergraduate students are considered dependent, with their aid eligibility a function of their own and their parents’ financial circumstances, unless they are at least 24 years of age or are orphans or wards of the court, homeless unaccompanied youth, married, veterans, on active duty, or have legal dependents.
NOTE: Components may not sum to totals because of rounding.

TRENDS IN HIGHER EDUCATION SERIES TRENDS IN STUDENT AID 2013
13See Table 2B Graduate Student Aid and Nonfederal Loans in Current Dollars over Time.
Total Graduate Student Aid by Type
FIGURE 2BGraduate Student Aid by Source and Type (in Billions), 2012-13
NOTE: Percentages may not sum to 100 and components may not sum to total because of rounding. See Notes and Sources for a list of programs included in federal grant programs. Nonfederal loans are not included because they involve no subsidy and are not actually a form of financial aid.
SOURCE: Trends in Student Aid website (trends.collegeboard.org), Table 1B.
In 2012-13, federal loans constituted 63% of the $53.4 billion in student aid received by graduate students, who also rely on fellowships and assistantships provided by their universities. Federal grants accounted for only 3% of graduate student aid.
– Despite its relatively small role, federal grant aid for graduate students almost tripled between 2002-03 and 2012-13, as aid to veterans pursuing graduate study increased from $261 million (in 2012 dollars) to $1.2 billion.
– The 18% of graduate student aid that came in the form of institutional grants in 2012-13 constituted 59% of all grant aid for graduate students.
– The estimated 9% of graduate student aid that came in the form of grants from employers and other private sources constituted 29% of all grants to graduate students.
– Total federal grants for graduate students increased from $611 million (in 2012 dollars) in 2002-03 to $1.8 billion in 2012-13. Federal loans grew from $17.4 billion to $33.7 billion over the decade, declining from 64% to 63% of total aid.
TABLE 1B Total Graduate Student Aid in 2012 Dollars (in Millions), 1992-93 to 2012-13, Selected Years
1992-93 1997-98 2002-03 2007-08 2008-09 2009-10 2010-11 2011-12 Preliminary
2012-13
Total Federal Grants $299 $470 $611 $796 $849 $1,319 $1,564 $1,646 $1,778
Total Federal Loans $7,729 $12,906 $17,427 $27,396 $29,786 $34,581 $37,363 $36,778 $33,678
Federal Work-Study $107 $114 $143 $123 $119 $122 $116 $105 $104
Education Tax Benefits — $290 $940 $1,220 $1,870 $2,920 $3,360 $3,400 $3,400
TOTAL FEDERAL AID $8,135 $13,781 $19,121 $29,534 $32,624 $38,943 $42,403 $41,930 $38,960
State Grants $165 $121 $184 $168 $107 $131 $128 $148 $157
Institutional Grants $2,660 $4,580 $5,230 $7,010 $7,220 $8,160 $8,820 $9,120 $9,500
Private and Employer Grants $1,020 $1,820 $2,640 $4,860 $4,770 $4,690 $4,750 $4,660 $4,740
TOTAL FEDERAL, STATE, INSTITUTIONAL, AND PRIVATE AID $11,980 $20,302 $27,175 $41,572 $44,722 $51,924 $56,101 $56,858 $53,357
$53.4Billion
9%
18%
6%
63%
3%
Private and Employer Grants ($4.7)
Institutional Grants ($9.5)
State Grants ($0.2)
Federal Education Tax Creditsand Deductions ($3.4)
Federal Loans ($33.7)
Federal Work-Study ($0.1)
Federal Grant Programs ($1.8)
<1%
<1%
ALSO IMPORTANT:
– In fall 2012, an estimated 2.1 million (13%) of the 15.9 million full-time equivalent (FTE) postsecondary students were graduate students.
– Graduate students include both those enrolled in master’s or doctoral programs and those in professional programs in fields such as law and medicine, who are much more dependent on student loans.
– In fall 2012, 47% of FTE graduate enrollment was in the public four-year sector, 42% was in private nonprofit four-year institutions, and 11% was in the for-profit sector.
– All graduate students are independent for purposes of federal financial aid, so their eligibility for need-based aid depends only on their own income and assets for most programs.
NOTE: Components may not sum to totals because of rounding.

TRENDS IN STUDENT AID 2013 trends.collegeboard.org
14 See Figure 3 Average Aid per FTE Student in 2012 Dollars over Time.
NOTE: Loans reported here include only federal loans to students and parents. Grants from all sources are included. Dollar values are rounded to the nearest $10.
SOURCE: Trends in Student Aid website (trends.collegeboard.org), Tables 3A and 3B.
FIGURE 3AAverage Aid per Full-Time Equivalent (FTE) Undergraduate Student in 2012 Dollars, 1997-98 to 2012-13
FIGURE 3BAverage Aid per Full-Time Equivalent (FTE) Graduate Student in 2012 Dollars, 1997-98 to 2012-13
Grants and Loans per Student
In 2012-13, undergraduate students received an average of $13,370 in aid per full‐time equivalent (FTE) student, including $7,190 in grants from all sources, $4,900 in federal loans, and $1,280 in a combination of tax credits and deductions and Federal Work‐Study.
– Federal loans per FTE undergraduate student declined by $290, from $5,190 (in 2012 dollars) to $4,900 between 2011-12 and 2012-13. Grant aid per FTE undergraduate student from all sources increased by $180.
– Total grant aid per FTE undergraduate student increased at an average rate of 4.7% per year in inflation-adjusted dollars from 1997-98 to 2002-03, 2.5% per year from 2002-03 to 2007-08, and a more rapid rate of 6.8% per year from 2007-08 to 2012-13.
– Federal loans per FTE undergraduate student grew very rapidly between 2007-08 and 2009-10, as nonfederal borrowing declined by 65% over two years and federal student loan borrowing limits were increased. After increasing 32% (from $3,980 in 2012 dollars to $5,240) between 2007-08 and 2009-10, federal loans per FTE undergraduate student declined by 7% (from $5,240 to $4,900) between 2009-10 and 2012-13.
– In 2012-13, graduate students received an average of $25,730 in aid per FTE student, including $7,800 in grant aid, $16,240 in federal loans, and $1,690 in a combination of tax credits and deductions and Federal Work-Study.
– In 2012-13, graduate students received 43% more in grant aid per FTE student (after adjusting for inflation) than they had a decade earlier. They borrowed 48% more per student in federal loans in 2012-13 than in 2002-03.
ALSO IMPORTANT:
– Overall, postsecondary students received an average of $740 more (in 2012 dollars) per FTE student in benefits from federal tax credits and deductions in 2012-13 than in 2002-03. They received $40 less per FTE student from federal funding of Work-Study jobs.
$0
$4,000
$8,000
$12,000
$16,000
$18,000
$2,000
$6,000
$10,000
$14,000
Aver
age
Aid
in 2
012
Dol
lars
Academic Year12-1309-1007-0805-0603-0401-0299-0097-98
Undergraduate Students
$3,220 $3,410$3,980
$4,900$3,640
$4,590$5,190
$7,190Average Grant Aid per FTE
Average Federal Loans per FTE
$0
$4,000
$8,000
$12,000
$16,000
$18,000
$2,000
$6,000
$10,000
$14,000
Aver
age
Aid
in 2
012
Dol
lars
Academic Year12-1309-1007-0805-0603-0401-0299-0097-98
Graduate Students
$9,470
$10,940
$14,940$16,240
$5,130$5,440
$7,800
Average Grant Aid per FTE
Average Federal Loans per FTE
$7,000

TRENDS IN HIGHER EDUCATION SERIES TRENDS IN STUDENT AID 2013
15See Table 4, Table 4A, and Table 4B Total Aid and Nonfederal Loans in Current and Constant Dollars and Percentages over Time.
Total Grants and Total LoansTotal Grants and Total Loans
In 2012-13, grants constituted 52% of the funds used by undergraduates to supplement student and family resources, compared to 30% for graduate students. Loans constituted 39% of the funds for undergraduates, compared to 64% for graduate students.
– The introduction of the unsubsidized Stafford Loan program in the early 1990s led to an increase in the share of funds for undergraduate students in the form of loans from 33% in 1992-93 to 48% in 1996-97 (and 46% in 1997-98). Not included in this figure are home equity loans, credit card borrowing, and other sources of debt undergraduate students and their parents may have relied on more before unsubsidized federal loans were available.
– Grant aid as a share of total funds from grants, federal loans, other forms of financial aid, and nonfederal loans used by graduate students to help pay educational costs was 29% in 2002-03, 28% in 2007-08, and 27% in 2011-12.
– In 2012-13, the combination of federal tax credits and deductions and Federal Work-Study constituted 9% of the student aid and nonfederal loan funds that supplemented student and family payments for the college expenses of undergraduate students; they constituted 6% of these funds for graduate students.
– Over the five years from 2007-08 to 2012-13, total grant aid for graduate students increased by 26% in inflation-adjusted dollars, while total federal and nonfederal loans combined increased by 12%.
ALSO IMPORTANT:
– Loans have not replaced grants in funding postsecondary education. Rather, grant aid often fails to increase rapidly enough to fill the growing gap between the costs of attending college or graduate school and the ability of students and families to pay those costs.
FIGURE 4AGrants and Loans as a Percentage of Funds from Total Aid and Nonfederal Loans for Undergraduate Students, 1992-93 to 2012-13
FIGURE 4BGrants and Loans as a Percentage of Funds from Total Aid and Nonfederal Loans for Graduate Students, 1992-93 to 2012-13
Percentages in Figures 4A and 4B are shown as a portion of the total amount of postsecondary funding described in Table 1, including nonfederal loans in addition to financial aid (grants, federal loans, tax credits and deductions, and Federal Work-Study). In addition to the sources included here, students rely on funds from their families and from their own earnings and savings; they also borrow from other sources. Graduate students also receive fellowships and research assistantships, which are considered compensation.
SOURCE: Trends in Student Aid website (trends.collegeboard.org), Tables 4A and 4B.
0%
20%
40%
60%
80%
100%
Perc
enta
ge o
f Tot
al F
unds
Academic Year
Undergraduate Students
12-1310-1108-0906-0704-0502-0300-0198-9996-9794-9592-93
33%
46%
50%
39%
65%
50%
45%
52%
44%
49%
Grants
Loans
0%
20%
40%
60%
80%
100%
Perc
enta
ge o
f Tot
al F
unds
Academic Year
Graduate Students
12-1310-1108-0906-0704-0502-0300-0198-9996-9794-9592-93
35%32%
28% 30%
65% 66% 69%64%
Loans
29%
68%
Grants

TRENDS IN STUDENT AID 2013 trends.collegeboard.org
16 For detailed data behind the graphs and additional information, please visit trends.collegeboard.org.
Types of Grants
Total grant aid to postsecondary students increased by 29% in inflation-adjusted dollars between 2008-09 and 2009-10 and by another 12% in 2010-11, but did not increase between 2010-11 and 2012-13.
– Total full-time equivalent (FTE) enrollments increased by 11% between 2008-09 and 2010-11 and declined by 2% over the next two years. Grant aid per FTE student increased by 30% between 2008-09 and 2010-11 and by 1% between 2010-11 and 2012-13.
– Total federal grant aid, which increased by 125% in constant dollars between 2007-08 and 2010-11, declined by 9% in 2011-12 and by another 1% in 2012-13.
– Federal grant aid constituted 40% of total grant aid to postsecondary students in 1992-93, and 20 years later, it is at 41%. However, in the intervening years, this percentage fell gradually to a low of 29% in 1999-2000 and 2000-01, increased from 33% to 43% between 2008-09 and 2009-10, and peaked at 45% in 2010-11.
– While federal grant aid to postsecondary students doubled in inflation-adjusted dollars between 2007-08 and 2012-13, state grant aid grew by only 11%.
– Grant aid from colleges and universities in the form of discounts to their students grew from $13 billion in 1992-93 to $22 billion in 2002-03 and to $44 billion in 2012-13.
ALSO IMPORTANT:
– Pell Grants declined from 74% of federal grant aid in 2002-03 to 69% in 2007-08 and 2012-13. Veterans and military aid increased from 19% to 28% of total federal grants over the decade.
– The large increase in federal grant aid in 2009-10 resulted from a combination of policy changes, growth in enrollment, and economic conditions that increased unemployment and reduced family and student financial capacity.
FIGURE 5 Growth of Federal, Institutional, Private and Employer, and State Grant Dollars in 2012 Dollars, 1992-93 to 2012-13
NOTE: Percentages may not sum to 100 because of rounding.
SOURCE: Table 1.
$0
$10
$20
$30
$40
$50
$60
$70
$80
$90
$100
$110
$120
Gra
nts
(in B
illio
ns) i
n 20
12 D
olla
rs
Academic Year11-12 12-1309-1007-0805-0603-0401-0299-0097-9895-9693-94 10-1108-0906-0704-0502-0300-0198-9996-9794-9592-93
$63.5
$38.4
32%
44%
13%
$114.2 $115.7
42% 41%
37% 38%
13% 13%
8% 8%
$116.6
45%
35%
12%
8%
13%
$104.4
43%
36%
9%
16%
$80.7
33%
40%
11%$75.7
31%
41%
17%
12%$71.2
30%
41%
17%
12%$68.4
31%
41%
16%
12%$66.8
33%
39%
15%
12%
15%
12%
34%
39%
$58.9
34%
38%
15%
13%$54.4
32%
40%
15%
12%$47.9
29%
44%
15%
12%
$50.4
29%
43%
15%
13%$41.3
31%
44%
13%12%
$45.2
31%
43%
14%
11%12%$35.1
37%
40%
13%11%
$34.7
40%
37%
13%10%
$36.1
35%
41%
12%12%
$36.7
33%
43%
12%12%
State Grants
Private and Employer Grants
Institutional Grants
Federal Grants

TRENDS IN HIGHER EDUCATION SERIES TRENDS IN STUDENT AID 2013
17For detailed data behind the graphs and additional information, please visit trends.collegeboard.org.
Types of Loans
Students and parents borrowed $110.3 billion in education loans in 2012-13, down from a peak of $120.1 billion (in 2012 dollars) in 2010-11.
– Total borrowing from the federal Direct Loan program declined by 3% ($2.9 billion) in 2011-12 and by another 7% ($6.5 billion) in 2012-13. Total borrowing from the PLUS program for parents of undergraduate students declined by 11% ($1.3 billion) over this two-year period.
– The total volume of education loans disbursed increased by 55% in inflation-adjusted dollars between 2002-03 and 2007-08. Because of the decline in borrowing in 2011-12 and 2012-13, total volume increased by only 8% between 2008-09 and 2012-13.
– In 2012-13, nonfederal loans, which usually have less favorable repayment terms than federal loans, totaled an estimated $8.8 billion. Nonfederal borrowing grew from about $10.5 billion (in 2012 dollars) in 2002-03 to $25.5 billion in 2007-08, before falling to $8.1 billion in 2010-11 and 2011-12 and increasing by an estimated $0.7 billion in 2012-13.
– Some colleges and universities make loans to students and parents to supplement their federal loans. While no precise measure of these loans is available, reports from institutions
indicate that institutional loans have grown from about $490 million (in 2012 dollars) in 2007-08 to about $710 million in 2012-13.
ALSO IMPORTANT:
– As of July 1, 2012, graduate students are no longer eligible for Direct Subsidized Loans.
– The estimate of $8.8 billion in private loans for 2012-13 combines information from the Consumer Bankers Association/MeasureOne and the Consumer Financial Protection Bureau with data from credit unions, estimates of institutional loans, and data on loans provided through states.
– Dependent undergraduates can borrow up to $5,500 in federal Direct Loans (including a maximum of $3,500 in subsidized loans) in their first year, and up to $6,500 (up to $4,500 in subsidized loans) in their second year. The limit for the third year and beyond is $7,500 (up to $5,500 in subsidized loans). Limits for independent undergraduate students are higher.
– Graduate students can borrow up to $20,500 per year in federal Direct Loans. The lifetime maximum for graduate students is $138,500, including their undergraduate borrowing.
FIGURE 6 Growth of Federal and Nonfederal Loan Dollars in 2012 Dollars, 1992-93 to 2012-13, Selected Years
NOTE: Nonfederal loans include loans to students from states and from institutions, in addition to private loans issued by banks, credit unions, and Sallie Mae. Estimates of institutional and state loan volume are included only for academic years 1999-2000 through 2012-13.
SOURCE: Table 1.
$0
$10
$20
$30
$40
$50
$60
$70
$80
$90
$100
$110
$120
Loan
s (in
Bill
ions
) in
2012
Dol
lars
Academic Year12-1310-1108-0907-0804-0502-0300-0198-9996-9794-95 11-1209-1092-93
48% 25%35%36%35%34%32%38% 34%41%
$44.7
58%
$36.08%
7%$26.4
67%
23% 8%
2%
27%
52%
50%
Perkins and OtherFederal LoansGrad PLUS Loans
Federal Unsubsidized Loans
FederalSubsidized Loans
Nonfederal Loans
Parent PLUS Loans
$48.1$52.4
$65.2
$83.9
$101.2 $102.5
$115.7
1%
1%8%
7%
9%
$120.1$117.9
$110.3
41%
6%
7%
10%
1%
41%
6%
7%
9%
1%
43%
5%
8%
8%1%
41%
4%
12%
8%
2%
30%
3%
25%
8%3%
32%
11%
21%
3%
33%
9%
16%
3%
33%
9%
13%
3%
32%
9%
8%4%
30%
8%6%

TRENDS IN STUDENT AID 2013 trends.collegeboard.org
18 See Table 5 Federal Aid per Recipient in Current and Constant Dollars over Time and Table 6 Federal Loans over Time.
Federal Aid Recipients
FIGURE 7ANumber of Recipients by Federal Aid Program (with Average Aid Received), 2012-13
NOTE: Dollar values are rounded to the nearest $10.
SOURCE: Trends in Student Aid website (trends.collegeboard.org), Tables 6A and 6B.
NOTE: Both undergraduate and graduate students are eligible for tax benefits, Direct Unsubsidized Loans, Perkins Loans, and Federal Work-Study (FWS). Direct Subsidized Loans were available to both groups in 2011-12, but were limited to undergraduates thereafter. Pell Grants and Federal Supplemental Educational Opportunity Grants (FSEOG) go to undergraduates only. Data on tax benefits are for 2011-12 (in 2012 dollars) and are estimated based on data for tax year 2011.
FSEOG and FWS amounts represent federal funds only. Institutions provide matching funds, so the awards students receive under these programs are larger than these federal aid amounts. Perkins Loans are made from revolving funds on campus consisting of earlier loans that have been repaid. No new federal outlays were provided in 2012-13, but originally the funds came partly from federal and partly from institutional sources. Post-9/11 veterans benefits reported here cover tuition and fees as well as living and other expenses.
SOURCES: Internal Revenue Service, Statistics of Income; Annual Publications, U.S. Department of Education, Office of Postsecondary Education; unpublished data from the Veterans Administration.
FIGURE 7B Total Number of Undergraduate and Graduate Federal Subsidized and Unsubsidized Student Loan Borrowers and Average Amount Borrowed in 2012 Dollars, 2002-03 to 2012-13
An estimated 15.2 million tax filers benefited from federal education tax credits and deductions in 2011-12. Pell Grants were awarded to 8.8 million students in 2012-13.
– The 8.8 million students receiving Pell Grants in 2012-13 compares to 9.3 million in 2010-11 and 6.2 million in 2008-09. The number of Pell Grant recipients was almost twice as high in 2012-13 as it was a decade earlier.
– The number of students receiving FWS declined from 759,000 in 2002-03 to 698,000 in 2007-08 and to 697,000 in 2012-13. The average federal funding received by FWS students was $1,849 (in 2012 dollars) in 2002-03 and $1,403 in 2012 -13.
– Over the past decade, the total number of federal student loan borrowers increased by 69%, from 5.9 million in 2002-03 to almost 10 million in 2012-13. The average amount borrowed from federal subsidized and unsubsidized loan programs combined increased by 6%, from $7,900 in 2002-03 (in 2012 dollars) to $8,350 over this decade.
– In 2012-13, undergraduate borrowers received federal Direct Loans averaging $6,760, while graduate students borrowed an average of $17,230.
0
5,000
10,000
15,000
12,500
7,500
2,500
20,000
$0
$5,000
$10,000
$15,000
$20,000
$17,500
$12,500
$7,500
$2,500
Academic Year
17,500
Num
ber o
f Bor
row
ers
(000
s)Average per B
orrower (2012 D
ollars)
11-12 12-1312-13 10-1109-1008-0907-0806-0705-0604-0503-0402-0311-1210-1109-1008-0907-0806-0705-0604-0503-0402-03
Number of Subsidized and Unsubsidized Loan Borrowers Average Amount Borrowed
Graduate BorrowersUndergraduate Borrowers
5,88
4
6,49
2
6,92
4
7,15
2
7,28
8
7,74
5 8,65
7 10,1
77
10,2
64
10,4
07
9,96
0
84% 84% 84% 84% 84% 84% 84% 85% 85%85%85%
16% 16% 16% 16%16%
16% 16% 15% 15%
15%15%
$5,9
10
$5,9
50
$5,9
20
$5,8
20
$5,6
20
$5,9
50
$7,0
70
$7,2
10
$7,2
50
$6,9
20
$6,7
60
$19,
180
$19,
190
$19,
070
$18,
790
$18,
060
$18,
550
$18,
280
$17,
680
$18,
510
$17,
850
$17,
230
0
2
4
6
8
10
12
14
Num
ber o
f Rec
ipie
nts
(in M
illio
ns)
Federal Aid Programs (with Average Aid per Recipient)
PerkinsLoans
($1,857)
Post-9/11GI Bill
VeteransBene�ts($13,628)
FederalWork-Study
($1,403)
FSEOG($463)
DirectUnsubsidized
Loans($6,450)
DirectSubsidized
Loans($3,690)
FederalPell
Grants($3,650)
FederalEducation
Tax Bene�ts($1,330)
15.2
mill
ion
1.6
mill
ion
697,
000
711,
000
461,
000
8.6
mill
ion
7.5
mill
ion
8.8
mill
ion

TRENDS IN HIGHER EDUCATION SERIES TRENDS IN STUDENT AID 2013
19See Table 7 Percentage Distribution of Federal Aid Funds by Sector over Time.
Federal Aid by Sector
FIGURE 8APercentage Distribution of Federal Aid Funds by Sector, 2012-13
NOTE: Not included here are the roughly $500 million (8%) of Grad PLUS dollars going to students enrolled at foreign institutions. Of those funds, 10% went to students enrolled in foreign private institutions, 23% to public, and 67% to foreign for-profit institutions. Veterans’ benefits are based on fiscal year 2011. Percentages may not sum to 100 because of rounding.
Total Undergraduate and Total Postsecondary FTE Enrollments by Sector, Fall 2003 to Fall 2012
FIGURE 8B Percentage Distribution of Pell Grant Funds and Federal Subsidized and Unsubsidized Loan Funds by Sector, 2003-04 to 2012-13, Selected Years
– In fall 2012, 12% of FTE undergraduate students and 12% of all FTE postsecondary students were enrolled in for-profit institutions. They received 21% of Pell Grant funds, 16% of FSEOG allocations, 7% of FWS funds, and 21% of subsidized loans.
– As the share of undergraduate enrollment in the for-profit sector increased from 7% in fall 2003 to 9% in fall 2006, and to 12% in fall 2009, the share of Pell Grant funds going to students in this sector increased from 16% to 19% to 25%. By fall 2012, the for-profit share of FTE enrollments remained at 12% and the sector’s share of Pell Grants had declined to 21%.
In fall 2012, about 30% of full-time equivalent (FTE) undergraduate students and about 26% of all FTE postsecondary students were enrolled in public two-year colleges. They received 33% of Pell Grant funds, 21% of Federal Supplemental Educational Opportunity Grant (FSEOG) allocations, 16% of Federal Work-Study (FWS) funds, and 15% of subsidized federal loans.
SOURCES: Annual Publications, U.S. Department of Education, Office of Postsecondary Education; the National Student Loan Data System (NSLDS); the Federal Student Aid Data Center (studentaid.ed.gov/data-center); and Distribution of Veterans Education Benefits: Student Characteristics and Outcomes, GAO, 2013.
Fall 2003 Fall 2004 Fall 2005 Fall 2006 Fall 2007 Fall 2008 Fall 2009 Fall 2010 Fall 2011 Fall 2012Undergraduate FTE
Public Two-Year 33% 32% 32% 31% 31% 31% 31% 31% 30% 30%Public Four-Year 41% 41% 41% 41% 41% 40% 39% 39% 40% 41%Private Nonprofit Four-Year 18% 18% 18% 18% 18% 17% 16% 16% 17% 17%For-Profit 7% 8% 9% 9% 9% 11% 12% 13% 12% 12%
Total Postsecondary FTEPublic Two-Year 29% 28% 28% 27% 27% 27% 27% 27% 26% 26%Public Four-year 42% 42% 42% 42% 42% 41% 40% 40% 41% 41%Private Nonprofit Four-Year 21% 21% 21% 21% 21% 21% 20% 20% 20% 20%For-Profit 7% 8% 9% 9% 9% 9% 12% 12% 12% 12%
0%
10%
20%
30%
40%
50%
0%
10%
20%
30%
40%
50%
Perc
enta
gePercentage
Sector Sector
Pell Grant Funds Federal Subsidized and Unsubsidized Loan Funds
Public Two-Year
Public Four-Year
Private Nonpro�t
For-Pro�t Public Two-Year
Public Four-Year
Private Nonpro�t
For-Pro�t
2012-132009-102006-072003-04
16% 16%16%17%
8%
14%13%
19%19% 21% 21%25% 27%
32%33% 33% 34% 34%
29% 29%34%31%
36% 36%40%41%42%
10%
6% 6%
30% 32%
SOURCE: NCES, Integrated Postsecondary Education Data System (IPEDS).
Percentage of Aid0% 20% 40% 60% 80% 100%
25% 69% 6%Grad PLUS Loans
46% 44% 9%Parent PLUS Loans
7% 39% 33% 21%Direct Unsubsidized Loans
0%
1%
45% 52%3%
Perkins Loans
16% 36% 40% 7%Federal Work-Study
21% 30% 33% 16%FSEOG
33% 32% 14% 21%Pell Grants
38% 25% 37%Post-9/11 GI Bill
15% 41% 23% 21%Direct Subsidized Loans
0%
For-Pro�tPrivate Nonpro�tPublic Four-YearPublic Two-Year All Public

TRENDS IN STUDENT AID 2013 trends.collegeboard.org
20 See Table 6A and Table 6B Federal Loan Programs in Current and Constant Dollars over Time (Undergraduate, Graduate).
In 2012-13, 34% of undergraduate students took out federal subsidized or unsubsidized loans to help finance their education. In 2002-03, this percentage was 29%.
Student Loans
FIGURE 9BPercentage of Undergraduate and Graduate Students Taking Private Education Loans, 2007-08 and 2011-12
FIGURE 9CPercentage of Undergraduate Students Taking Private Loans, by Sector, Family Income, and Dependency Status, 2011-12
NOTE: The income categories in Figure 9C represent quartiles of dependent students in 2011-12. SOURCES: NCES, National Postsecondary Student Aid Study 2012; calculations by the authors.
– The percentage of undergraduate students taking only federal subsidized loans declined from 12% in 2007-08 to 5% in 2012-13. The percentage taking both subsidized and unsubsidized federal loans increased from 13% to 25% during these years. – The percentage of undergraduate students taking private education loans declined from 14% in 2007-08 to 6% in 2011-12; the percentage of graduate students relying on this source of funds fell from 11% to 4%. – Dependent students in the third income quartile, with 2010 family incomes between $65,000 and $105,999, were more likely than those from either less affluent or more affluent families to take private student loans in 2011-12.
ALSO IMPORTANT:
– In 2011-12, 2% of undergraduate students (5% of Direct Loan borrowers) borrowed through the Perkins Loan program (NPSAS, 2012).
FIGURE 9APercentage of Undergraduate Students Borrowing Federal Subsidized and Unsubsidized Loans, 2002-03, 2007-08, and 2012-13
NOTE: Percentages are based on preliminary IPEDS estimates of undergraduate headcount enrollment at Title IV–participating institutions. Some students may be counted more than once if they enrolled in more than one institution, leading to a slight underestimate of the percentage borrowing. Percentages may not sum to 100 because of rounding.
SOURCES: NCES, Enrollment in Postsecondary Institutions and Financial Statistics and Postsecondary Institutions and Price of Attendance in the United States, Annual Publications, U.S. Department of Education, Office of Postsecondary Education; NCES, IPEDS preliminary data; NSLDS; calculations by the authors.
0% 10% 20% 30% 40%
Total
Public Two-Year
Public Four-Year
Private Nonpro�tFour-Year
For-Pro�t
Total
Public Four-Year
Private Nonpro�tFour-Year
For-Pro�t
11%
14%
39%
2%
7%
14%6%
4%
25%12%
12%
4%
3%6%
12%
5%
29%5%
2007-082011-12
Percentage of Students
Und
ergr
adua
te S
tude
nts
Gra
duat
e St
uden
ts
0% 10% 20% 30% 40%
12%15%
18%11%
11%
8%
8%
14%20%
13%
9%
4%
2%
1%
2%2%2%
9%
9%
10%8%
5%
5%
5%7%
For-Pro�t
Private Nonpro�tFour-Year
Public Four-Year
Public Two-Year
Total
Percentage of Students
Sect
or
$106,000 or More
Independent Undergraduates
Dependent Student Family Income
$65,000 to $105,999
$30,000 to $64,999
Less than $30,000
0% 10% 20% 30% 40%
Percentage of Students
0% 20% 40% 60% 80% 100%
2002-03(2.7%)
2007-08(3.0%)
2012-13(2.9%)
Aca
dem
ic Y
ear
(Per
cent
age
of P
aren
ts w
ith P
LUS
Loan
s)
$5,911
$5,953
$6,764
4%
4%71% 12% 13%
5% 4%66% 25%
76% 4%10% 10%
Both Subsidized and Unsubsidized
Unsubsidized Only
Subsidized Only
No FederalLoans
AverageLoan in
2012 Dollars

TRENDS IN HIGHER EDUCATION SERIES TRENDS IN STUDENT AID 2013
21For detailed data behind the graphs and additional information, please visit trends.collegeboard.org.
Only students who began their studies at the institution from which they graduated are included in the data reported here. The blue bars represent the average debt levels of bachelor’s degree recipients who relied on student loans. The orange bars represent average debt per bachelor’s degree recipient, including those who graduated without student debt. The percentages along the base of the axis represent the percentage of degree recipients who borrowed.
NOTE: Debt figures include both federal loans and loans from nonfederal sources that have been reported to the institutions. Transfer students are excluded. Some students earn more than one bachelor’s degree, and some institutions may report number of degrees rather than number of degree recipients. This would lead to a slight underestimate of debt per graduating student. Debt figures are based on institutional reporting to the College Board and are best approximations. Estimates for 2011-12 incorporate both the responses for that year and the changes from 2010-11 for schools reporting for both years. Exact dollar amounts should be interpreted with caution. The data are not adequate to allow comparable calculations for for-profit institutions.
SOURCES: The College Board, Annual Survey of Colleges, 2001 to 2013; calculations by the authors.
Student Debt
FIGURE 10AAverage Total Debt Levels of Bachelor’s Degree Recipients, Public Four-Year Colleges and Universities in 2012 Dollars, 1999-2000 to 2011-12
About 60% of students who earned bachelor’s degrees in 2011-12 from the public and private nonprofit institutions at which they began their studies graduated with debt. They borrowed an average of $26,500.
– The 57% of public four-year college bachelor’s degree recipients who graduated with debt in 2011-12 borrowed an average of $25,000, 22% ($4,500 in 2012 dollars) more than the average debt of the 52% of 2001-02 graduates who had education debt.
– The 65% of private nonprofit four-year college bachelor’s degree recipients who graduated with debt in 2011-12 borrowed an average of $29,900, 24% ($5,700 in 2012 dollars) more than the average debt of the 64% of 2001-02 graduates who had education debt.
– For graduates of public four-year colleges, average debt per graduate, including those who did not borrow, increased by 12% (from $10,600 to $11,900 in 2012 dollars) between 2001-02 and 2006-07, and by 20% (from $11,900 to $14,300) over the next five years.
– For graduates of private nonprofit four-year colleges, average debt per graduate, including those who did not borrow, increased by 23% (from $15,400 to $19,000 in 2012 dollars) between 2001-02 and 2006-07, and by 3% (from $19,000 to $19,500) over the next five years.
ALSO IMPORTANT:
– Students who earn their bachelor’s degrees at for-profit institutions are more likely to borrow than those who attend public and private nonprofit colleges, and those who borrow tend to accumulate higher average levels of debt.
Average Debt of 2011-12 Graduates of Public and Private Nonprofit Four-Year Institutions: Students Earning Bachelor’s Degrees from the Institution at Which They Began Their Studies
FIGURE 10BAverage Total Debt Levels of Bachelor’s Degree Recipients, Private Nonprofit Four-Year Colleges and Universities in 2012 Dollars, 1999-2000 to 2011-12
Percentage with Debt
Average Debt per Borrower
Average Debt per Graduate
60% $26,500 $15,800
$0
$5,000
$10,000
$15,000
$20,000
$25,000
$30,000
Aver
age
Cum
ulat
ive
Deb
t in
2012
Dol
lars
Academic Year(Percentage of Students Who Borrowed)
Per Bachelor’s Degree RecipientPer Borrower
09-10(56%)
10-11(57%)
11-12(57%)
08-09(55%)
07-08(55%)
06-07(55%)
05-06(55%)
04-05(55%)
03-04(54%)
02-03(53%)
01-02(52%)
00-01(52%)
99-00(54%)
$20,
800
$11,
200
$20,
400
$10,
600
$20,
500
$10,
600
$20,
900
$11,
000
$21,
000
$11,
400
$21,
500
$11,
800
$21,
800
$12,
100
$21,
500
$11,
900
$21,
500
$11,
900
$21,
100
$11,
700
$23,
200
$13,
000
$25,
000
$14,
300
$24,
200
$13,
900
$0
$5,000
$10,000
$15,000
$20,000
$25,000
$30,000
Aver
age
Cum
ulat
ive
Deb
t in
2012
Dol
lars
Academic Year(Percentage of Students Who Borrowed)
Per Bachelor’s Degree RecipientPer Borrower
09-10(66%)
10-11(66%)
11-12(65%)
08-09(65%)
07-08(65%)
06-07(66%)
05-06(65%)
04-05(64%)
03-04(64%)
02-03(63%)
01-02(64%)
00-01(63%)
99-00(63%)
$23,
800
$15,
000
$23,
700
$14,
800
$24,
200
$15,
400
$25,
400
$16,
100
$25,
900
$16,
500
$27,
500
$17,
700
$28,
600
$18,
600
$28,
700
$19,
000
$27,
800
$18,
200
$27,
800
$18,
000
$29,
300
$19,
200
$29,
900
$19,
500
$30,
400
$20,
000

TRENDS IN STUDENT AID 2013 trends.collegeboard.org
22
TRENDS IN STUDENT AID 2013 trends.collegeboard.org
22 See Figure 2011_9A and Figure 2011_9B Distribution of Cumulative Debt Among 2009 Degree Completers and Non-Completers.
Student Debt
– Total outstanding education debt was just over twice as large in 2012 as it had been in 2005 ($962 billion compared to $461 billion in 2012 dollars). The number of adults with education debt was 56% higher in 2012 than in 2005 (having grown from 24.8 million to 38.8 million). The average outstanding debt per borrower was 33% higher in 2012 than in 2005 (having increased from $18,600 in 2012 dollars in 2005 to $24,800).
– Among individuals who began their postsecondary studies in 2003-04, 43% had not accumulated education debt by 2009. Another 25% had borrowed $10,000 or less, while 2% had borrowed more than $50,000.
– The absence of debt was most common among those who left school without a credential (52%) and least common among those who earned bachelor’s degrees (36%). Borrowing $30,000 or more was most common among bachelor’s degree recipients (15%) and least common among those who earned certificates (1%).
ALSO IMPORTANT:
– The frequently cited $1 trillion student debt figure refers to estimates of the outstanding value of education loan debt. This is the amount that students and parents have borrowed over time but have not yet repaid. It includes accrued interest and other charges as well as loans not yet in repayment.
– In contrast to the estimates of total debt reported in Figures 10A and 10B, Figure 11C includes bachelor’s degree recipients from the for-profit sector, as well as those who earned their degrees at institutions other than those in which they first enrolled.
FIGURE 11BTotal Outstanding Student Debt, Number of Borrowers with Outstanding Debt, and Average Balance, Relative to 2005 Fourth Quarter, 2005 to 2012
FIGURE 11ADistribution of Outstanding Education Debt Balances, 2012 Fourth Quarter
SOURCE: Federal Reserve Bank of New York (www.newyorkfed.org/studentloandebt).
In 2012, 40% of borrowers with education debt owed less than $10,000 and another 30% owed between $10,000 and $25,000; 4% of borrowers owed $100,000 or more. This debt includes funds borrowed for both undergraduate and graduate studies.
Outstanding education debt balances include debts accrued for both undergraduate and graduate education by students, parents, and others. Outstanding balances are diminished as debts are repaid, but grow if unpaid interest accrues.
NOTE: The Federal Reserve Bank of New York (FRBNY) estimates education debt balances from a nationally representative sample of adults with credit reports. Percentages may not sum to 100 because of rounding.
SOURCE: FRBNY Consumer Credit Panel. Equifax (www.newyorkfed.org/regional/Brown_presentation_GWU_2013Q2.pdf).
NOTE: Percentages in the parentheses on the vertical axis correspond to the percentage of all students in the specified attainment category. Percentages may not sum to 100 because of rounding.
SOURCES: Beginning Postsecondary Students Longitudinal Study (BPS), 2009; calculations by the authors.
FIGURE 11CTotal Amount Borrowed by 2009 by Students Beginning Postsecondary Education in 2003-04, by Degree Attainment
Percentage0% 20% 40% 60% 80% 100%
Attained Bachelor’sDegree (31%)
Attained AssociateDegree (9%)
Attained Certi�cate(9%)
No Degree,Still Enrolled (15%)
No Degree, LeftWithout Return (35%)
TOTAL
$10,001 to $20,000
$1 to $10,000
Did NotBorrow
$30,001 to $50,000
$50,001or more
$20,001 to $30,000
27% 5%39% 9%18%
45%39% 12%
1%9%24% 18%42% 7%
52% 30% 11% 4%
25% 16%43% 8% 5%
12% 22%36% 5%14% 10%
2%
1% 0%
0%
2%
2%
0.00
0.50
1.00
1.50
2.00
2.50
Ratio
Rel
ativ
e to
200
5 Fo
urth
Qua
rter
Year and Quarter
2012:Q42011:Q42010:Q42009:Q42008:Q42007:Q42006:Q42005:Q4
1.001.18
2.09
1.56
1.331.27
1.45
1.14
1.84
1.49
1.24
Total Debt in 2012 Dollars
Borrowers
Average Balance in 2012 Dollars1.101.07
$962 Billion
$25,000 to $49,999
$10,000 to $24,999
Less than $10,000
$100,000 to $149,999$150,000 to $199,999
$200,000 or more
$50,000 to $99,999
1%1%
40%18%
2%
9%
30%

TRENDS IN HIGHER EDUCATION SERIES TRENDS IN STUDENT AID 2013
23
TRENDS IN HIGHER EDUCATION SERIES TRENDS IN STUDENT AID 2013
23For detailed data behind the graphs and additional information, please visit trends.collegeboard.org.
Student Loan Repayment
– The Direct Loan borrowers in income-related repayment plans held 22% of the outstanding Direct Loans in repayment plans.
– By Sept. 11, 2012, 10% of borrowers who entered repayment in 2010-11 had defaulted on their federal student loans. This was the highest two-year cohort default rate since FY 1995, but the default rates were 21% and 22% in 1989 and 1990, respectively.
– For-profit institutions accounted for 11% of all students enrolled in 2009-10, 32% of those who entered repayment in 2010-11, and 43% of those who defaulted by the end of Sept. 2012.
ALSO IMPORTANT:
– The 2010 two-year cohort default rate was 6.8% for students from public four-year institutions, 5.1% for those from the private nonprofit four-year sector, 13.6% for students from for-profit institutions, and 15% for those from public two-year colleges.
– The cumulative lifetime default rate measures the percentage of federal education loans entering repayment in a given year that have defaulted through the end of the most recent fiscal year. Of the loans entering repayment in FY 2010, 11% have defaulted. Lifetime default rates are 16% for FY 2008 loans and 10% for FY 2006 loans. (http://www.ifap.ed.gov/eannouncements/attachments/DefaultRates.pdf)
– The federal government eventually collects over 90% of the student loan dollars that have gone into default. After adjusting for the time and cost involved in collecting these funds, however, the total cost of default is expected to be about $38 billion for loans issued in 2012-13. (New America Foundation)
FIGURE 12BFederal Student Loan Two-Year Cohort Default Rate (CDR), 1987–2011
FIGURE 12ADistribution of Outstanding Federal Direct Loan Dollars and Recipients by Repayment Plan, FY 2013
SOURCE: U.S. Department of Education (www2.ed.gov/offices/OSFAP/defaultmanagement/defaultrates.html).
NOTE: Percentages may not sum to 100 because of rounding.
SOURCE: U.S Department of Education (www2.ed.gov/offices/OSFAP/defaultmanagement/cdrschooltype2yr.pdf).
In 2013, 1.6 million Federal Direct Loan borrowers were in repayment plans that limit their payments to a specified percentage of their incomes. These borrowers constituted 11% of Direct Loan borrowers in repayment plans.
Two-year cohort default rates are based on the percentage of borrowers entering repayment in a fiscal year who default by the end of the next fiscal year. For example, the FY 2011 cohort default rate, based on students who entered repayment between Oct. 1, 2010, and Sept. 30, 2011, counts those who defaulted before Sept. 30, 2012.
NOTE: Only Federal Direct Loans in a specified repayment plan are included. Borrowers not currently enrolled in a repayment plan are excluded. Income-related plans include the Income-Contingent, Income-Based, and Pay As You Earn plans. Alternative repayment plans are customized to an individual borrower’s circumstances that meet basic repayment plan requirements. Percentages may not sum to 100 because of rounding.
SOURCE: U.S. Department of Education (studentaid.ed.gov/about/data-center/student/portfolio).
FIGURE 12CDistribution of Total Enrollments, 2009-10, Borrowers Entering Repayment in FY 2011, and FY 2011 Two-Year Cohort Default Rate, by Sector
0%
5%
10%
15%
20%
25%
Coho
rt D
efau
lt Ra
te
Year20112007 20092005200320011999199719951993199119891987
10.0%
17.6%
5.4%
22.4%
15 MillionBorrowers
11%
11%
11%
2%
66%
Percentage of Recipients
Graduated Repayment
Level Payments, More Than 10 Years
Level Payments, 10 Years or Less
Alternative
Income-Related
1%
19%
22%
14%
43%$324 Billion
Percentage of Dollars
Percentage
0% 20% 40% 60% 80% 100%
Borrowers WhoDefaulted
Borrowers WhoEntered Repayment
2009-10 Enrollment
For-Pro�tPrivate Nonpro�t Four-YearPublic Four-YearPublic Two-Year
21%25% 10% 43%
31%16% 20% 32%
34% 18%37% 11%

TRENDS IN STUDENT AID 2013 trends.collegeboard.org
24
TRENDS IN STUDENT AID 2013 trends.collegeboard.org
24 See Table 8 Federal Pell Grant Awards in Current and Constant Dollars over Time.
TRENDS IN STUDENT AID 2013 trends.collegeboard.org
Pell Grants
Although the 2012-13 maximum Pell Grant of $5,550 was only 1% higher in inflation-adjusted dollars than the 1976-77 maximum grant, the average Pell Grant of $3,650 was 20% higher than the $3,045 average (in 2012 dollars) 36 years earlier.
– The $3,650 average Pell Grant in 2012-13 was 25% higher in inflation-adjusted dollars than the $2,912 average grant in 2007-08.
– Total Pell Grant expenditures peaked at $37.5 billion in 2010-11 (in 2012 dollars) and declined to $32.3 billion by 2012-13. Both the average grant and the number of recipients were lower in 2012-13 than in 2010-11. The maximum grant was $5,550 for the entire three-year period, but declined by $282 in inflation-adjusted (2012) dollars.
ALSO IMPORTANT:
– Recipients who do not have the resources to contribute at all to their own education and who are enrolled full time for a full year receive the maximum Pell Grant. Over time, changes in the formula for determining Pell eligibility have led to an increase in the percentage of students eligible for the maximum grant.
– In 2011-12, 28% of Pell Grant recipients received the maximum $5,550 in Pell funding. In 2007-08, 25% of Pell Grant recipients received the maximum Pell Grant of $4,731 (in current dollars).
Federal Pell Grant Awards in 2012 Dollars, 1976-77 to 2012-13, Selected Years
In 2012 DollarsNumber
of Pell Recipients
(in Millions)
Total Pell Expenditures
(in Billions)Maximum Pell Grant
Average Pell Grant per Recipient
1976-77 $5.9 $5,617 $3,045 1.9
1977-78 $5.7 $5,258 $2,847 2.0
1982-83 $5.7 $4,230 $2,255 2.5
1987-88 $7.6 $4,228 $2,623 2.9
1992-93 $10.1 $3,914 $2,516 4.0
1997-98 $9.0 $3,854 $2,421 3.7
2002-03 $14.8 $5,088 $3,099 4.8
2007-08 $16.1 $4,740 $2,912 5.5
2008-09 $19.1 $4,928 $3,095 6.2
2009-10 $31.9 $5,692 $3,942 8.1
2010-11 $37.5 $5,832 $4,028 9.3
2011-12 $34.0 $5,628 $3,605 9.4
2012-13 $32.3 $5,550 $3,650 8.8
FIGURE 13BMaximum and Average Pell Grant in 2012 Dollars, 1976-77 to 2012-13
FIGURE 13ANumber of Pell Recipients, Total Inflation-Adjusted Expenditures, and Maximum and Average Pell Grant Relative to the 1976-77 Level, 1976-77 to 2012-13
Each line in Figure 13A shows how one aspect of the Pell Grant program has changed since 1976-77. A value of 2 indicates a doubling since that year. The value of 5.45 for total expenditures in 2012-13 indicates that total Pell dollars were 5.45 times higher in 2012-13 than in 1976-77, after adjusting for inflation.
SOURCES: The Federal Pell Grant Program End-of-Year Report, 2011-12; Federal Student Aid Data Center (studentaid.ed.gov/about/data-center/student/title-iv); unpublished data from the U.S. Department of Education, Office of Postsecondary Education.
0
1
2
3
4
5
6
Tota
l Exp
endi
ture
s, M
axim
um a
nd
Aver
age
Gra
nt, a
nd N
umbe
r of R
ecip
ient
s Re
lativ
e to
197
6-77
Academic Year
1.00
0.740.75 0.700.91
1.02
2.462.50
1.20
4.55
5.45
0.990.83
1.70
2.06
1.300.96
Number of Pell RecipientsAverage Pell Grant per Recipient (Constant Dollars)Maximum Pell Grant (Constant Dollars)
Total Pell Expenditures (Constant Dollars)
12-1302-0382-83 87-88 92-93 97-98 07-0876-77
12-1302-0382-83 87-88 07-0876-77$0
$1,000
$2,000
$3,000
$4,000
$5,000
$6,000
Max
imum
and
Ave
rage
Gra
ntin
201
2 D
olla
rs
Academic Year92-93 97-98
Maximum Pell Grant$5,617
$3,045
$2,255$2,516
$4,230
$3,914
$5,550
$3,650
$5,088
Average Pell Grant per Recipient
$3,099

TRENDS IN HIGHER EDUCATION SERIES TRENDS IN STUDENT AID 2013
25
TRENDS IN HIGHER EDUCATION SERIES TRENDS IN STUDENT AID 2013
25See Table 2A and Table 2B in Trends in College Pricing.
TRENDS IN HIGHER EDUCATION SERIES TRENDS IN STUDENT AID 2013
25
SOURCES: The Federal Pell Grant Program End-of-Year Report, 2011-12; unpublished data from the U.S. Department of Education, Office of Postsecondary Education; The College Board, Trends in College Pricing.
FIGURE 14B Inflation-Adjusted Maximum Pell Grant, Tuition and Fees (TF), Tuition and Fees and Room and Board (TFRB), and Maximum Pell Grant as a Percentage of TF and TFRB, 1993-94 to 2013-14
Percentages displayed in Figure 14B represent percentages of TF (solid blue line) and TFRB (orange line) that are covered by the maximum Pell Grant in that academic year.
Pell Grants
FIGURE 14ATotal Undergraduate Enrollment and Percentage of Students Receiving Pell Grants, 2002-03 to 2012-13
NOTE: Percentages are based on preliminary IPEDS estimates of undergraduate headcount enrollment at Title IV–participating institutions. Some students may be counted more than once if they enrolled in more than one institution.SOURCES: NCES, Enrollment in Postsecondary Institutions and Financial Statistics and Postsecondary Institutions and Price of Attendance in the United States; The Federal Pell Grant Program End-of-Year Report, 2011-12; projections from the U.S. Department of Education, Office of Postsecondary Education.
The total number of undergraduate students in the U.S. increased from 20.7 million in 2002-03 to 22.3 million in 2007-08 and to 24.8 million in 2012-13. The percentage of these students receiving Pell Grants increased from 23% in 2002-03 to 25% in 2007-08 and to 36% in 2012-13.
– The number of undergraduate students grew at an average rate of 1% per year from 2002-03 to 2007-08 and an average rate of 2% per year over the second half of the decade.
– The number of Pell Grant recipients grew at an average rate of 3% per year from 2002-03 to 2007-08 and an average rate of 10% per year over the second half of the decade.
– The maximum Pell Grant grew by 39% in current dollars, from $4,050 in 2003-04 to $5,645 in 2013-14 — a 10% increase after adjusting for inflation. Inflation-adjusted tuition and fees increased by 51% at public four-year institutions and by 25% at private nonprofit four-year institutions over this decade.
– The maximum Pell Grant covered 87% of average public four-year tuition and fees in 2003-04, but only 63% in 2013-14 (and 31% of tuition, fees, room and board).
– The maximum Pell Grant covered 21% of average private nonprofit four-year tuition and fees in 2003-04, and 19% in 2013-14 (and 14% of tuition, fees, room and board).
$0
$5,000
$10,000
$15,000
$20,000
$25,000
$30,000
$35,000
$40,000
2012
Dol
lars
$0
$5,000
$10,000
$15,000
$20,000
$25,000
$30,000
$35,000
$40,000
2012 Dollars
Academic Year Academic Year
Public Four-Year (In-State) Private Nonpro�t Four-Year
93-94 11-12 13-1409-1007-0805-0603-0401-0299-0097-9895-96 93-94 11-12 13-1409-1007-0805-0603-0401-0299-0097-9895-96
21%
20%21%
$3,649 $4,211 $5,046 $4,928 $5,536$3,649 $4,211 $5,046 $4,928 $5,536
91%
37%
38%39%
87%72%
92%
33%
31%
63%
19%
19%
14%
14%
16%
15%
15%
Tuition and Fees Tuition and Fees and Room and Board
Maximum Pell Grant
30
25
20
15
10
5
0
Mill
ions
of S
tude
nts
Academic Year
Total Number of Pell Recipients
12-Month Undergraduate Headcount Enrollment
09-1008-0907-0806-0705-0604-0503-0402-03
32%26%25%24%24%25%25%23%
10-11
36%
11-12
37%
12-13
36%
25.6 25.2
21.220.7 20.7 21.1 21.6 22.323.7
25.1 24.8

TRENDS IN STUDENT AID 2013 trends.collegeboard.org
26 For detailed data behind the graphs and additional information, please visit trends.collegeboard.org.
Pell Grants
FIGURE 15BDistribution of Pell Grant Recipients by Dependency Status and Income Level, 2011-12
NOTE: Percentages may not sum to 100 because of rounding.
SOURCES: The Federal Pell Grant Program End-of-Year Report, 2011-12, Tables 6, 11, 13, and 19; unpublished data from the U.S. Department of Education; calculations by the authors.
– In 2011-12, 30% of all independent Pell Grant recipients were enrolled in the for-profit sector, as were 10% of dependent Pell Grant recipients. Two-year public colleges enrolled 39% of independent and 33% of dependent Pell Grant recipients.
– In 2011-12, 34% of recipients were full-time dependent students. These students received 38% of Pell Grant funds.
– In 2011-12, 55% of all Pell Grant recipients enrolled full time were independent students, as were 72% of those enrolled part time.
– Dependent students constituted 41% of Pell Grant recipients in 2011-12, with 88% of these students coming from families with incomes of $50,000 or less.
– Virtually all independent Pell Grant recipients without dependents have family incomes under $30,000. Among independent recipients with dependents, 25% have incomes exceeding $30,000.
– About half of all Pell Grant recipients in 2011-12 were ages 23 or younger, and about a quarter were ages 31 or older.
FIGURE 15CDistribution of Pell Grant Recipients by Age, 2011-12
NOTE: Full-time is defined as exclusively full-time for one or more academic periods that a student received a Pell Grant; part-time includes all other enrollments. Private nonprofit two-year institutions are excluded here. Percentages may not sum to 100 because of rounding.
In 2011-12, just over half of all Pell Grant recipients in public and private nonprofit four-year institutions were dependent students, compared to 37% of recipients in public two-year colleges and 19% in the for-profit sector.
FIGURE 15ADistribution of Pell Grant Recipients by Dependency Status, Enrollment Intensity, and Institutional Sector, 2011-12
Distribution of Pell Grant Recipients and Pell Grant Dollars by Dependency Status and Enrollment Intensity, 2011-12
Dependent Independent
Full-Time Part-Time Full-Time Part-Time
Percentage of Students 34% 7% 41% 18%
Percentage of Dollars 38% 5% 44% 12%
Dep
ende
nt S
tude
nts
(41%
of t
otal
)
Inde
pend
ent S
tude
nts
With
out D
epen
dent
s(2
1% o
f tot
al)
Inde
pend
ent S
tude
nts
with
Dep
ende
nts
(38%
of t
otal
)
$0$1 to $9,000
$9,001 to $15,000$15,001 to $20,000$20,001 to $30,000$30,001 to $40,000$40,001 to $50,000$50,001 to $60,000
$60,001 or more
$0$1 to $9,000
$9,001 to $15,000$15,001 to $20,000$20,001 to $30,000$30,001 to $40,000$40,001 to $50,000$50,001 to $60,000
$60,001 or more
$0$1 to $9,000
$9,001 to $15,000$15,001 to $20,000$20,001 to $30,000$30,001 to $40,000$40,001 to $50,000$50,001 to $60,000
$60,001 or more
Percentage of Pell Grant Recipients
0% 10% 20% 30% 40%
8%9%
11%11%
21%16%
12%7%
5%
24%36%
20%13%
6%1%
0%0%0%
11%18%
16%12%
18%11%
7%4%
3%
0% 20% 40% 60% 80% 100%
Public Two-Year(33% of dollars,
36% of recipients)
Public Four-Year(32% of dollars,
29% of recipients)
Private Nonpro�t(14% of dollars,
13% of recipients)
For-Pro�t (21% of dollars,
22% of recipients)14%
47%
5%
5%
50%
28% 9% 43% 20%
32%7% 11%
35% 13%
56% 24%
Part-Time Independent
Full-TimeIndependent
Part-Time Dependent
Full-Time Dependent
Percentage of Pell Grant Recipients
TotalRecipients:
9,444,368
30%15%
9%
21%
11%
13%
Ages 41 and older
Ages 31to 40
Ages 27to 30
Ages 24to 26
Ages 21to 23
Ages 20or younger

TRENDS IN HIGHER EDUCATION SERIES TRENDS IN STUDENT AID 2013
27For detailed data behind the graphs and additional information, please visit trends.collegeboard.org.
Education Tax Credits and Tuition Deductions
The $20 billion in savings provided to students and their parents through federal education tax credits and tuition deductions in 2011 equaled over 40% of total federal spending on grants to students, and almost 60% of spending on Pell Grants.
– Education tax credits and deductions are “tax expenditures.” They reduce federal income tax liabilities and federal tax revenues, and have the same impact on the federal budget as direct expenditures.
– The number of taxpayers benefiting from the tuition tax deduction declined from 2.9 million in 2008 to 1.2 million in 2011, as the number of filers benefiting from education tax credits increased from 5.2 million to 14.1 million.
– The AOTC is available to taxpayers with an AGI as high as $180,000. Of the savings from tax credits, 21% went to households with an AGI of $100,000 or higher in 2011; 57% of the tuition tax deduction benefit went to households with incomes between $100,000 and $160,000.
– Because the AOTC is partially refundable, 26% of the savings from tax credits went to households with an AGI below $25,000 in 2011. Only 4% of the tax deduction benefit went to households in this income category.
ALSO IMPORTANT:
– In 2011, 8.2 million taxpayers with taxable returns deducted $8 billion in student loan interest, generating about $1.4 billion in savings.
– Other subsidies to students through the tax code include the personal exemption for students ages 19 and older, saving parents about $4 billion in 2011-12, and the excludability of tuition assistance from employers, saving students about $1 billion. Taxpayers saved over $1 billion in taxes on the earnings from savings earmarked for education. (Joint Committee on Taxation, Estimates of Federal Tax Expenditures for Fiscal Years 2012–2017, Table 1; OMB, Analytical Perspectives: Budget of the U.S. Government Fiscal Year 2014, Table 16.1)
FIGURE 16ATotal Education Tax Credits and Deductions in 2012 Dollars, 1998 to 2011 (and Average Tax Savings per Recipient)
FIGURE 16BDistribution of Education Tax Credits by Adjusted Gross Income (AGI), 2011 (and Average Tax Savings per Recipient in 2012 Dollars)
FIGURE 16CDistribution of Savings from Tuition Tax Deductions by Adjusted Gross Income (AGI), 2011 (and Average Tax Savings per Recipient in 2012 Dollars)
NOTE: The number of recipients of tax credits includes those claiming refundable or nonrefundable credits. Nonrefundable dollars claimed on nontaxable returns are not included. The value of tax deductions is estimated based on applicable marginal tax rates. The tax deduction was first implemented for the 2002 tax year. Percentages may not sum to 100 because of rounding.
SOURCES: Internal Revenue Service, Statistics of Income, Tables 1.3, 1.4, 2, 3.3 (1998–2011); calculations by the authors.
$0 $5 $10
Total Tax Savings (in Billions) in 2012 Dollars
Tax
Year
$15 $20 $25
1998
1999
2000
2001
2002
2003
2004
2005
2006
2007
2008
2009
2010
2011
($1,035)
($418)$15.6
($426)
($1,471)
($1,070)
($1,058)
$19.1
($508) $7.1
$7.2
($1,074)
($519)
$7.4
($1,047)
($546)
$7.3
($1,044)
($569)
$7.3
($1,028)
($564)
$6.9
($1,004)($504)
($489)$6.4
($924) $5.5
($947) $5.5
($1,034) $5.7
$4.2
Total DeductionsTotal Credits
($1,410)($420)
$20.3
($1,392)
$100,000–$180,000 ($2,490)
$75,000–$99,999 ($2,030)
$50,000–$74,999($1,670)
AGI Less than $25,000 ($930)
26%21%
22%
16%
14%
$25,000–$49,999 ($1,250)
Total$19.8 Billon
($1,410)
4%
57%
8%
22%
10%
$100,000–$160,000 ($500)
AGI Less than $25,000 ($220)
$25,000–$49,999($320)
$50,000–$74,999($360)
$75,000–$99,999($440)
Total$0.5
Billon($420)

TRENDS IN STUDENT AID 2013 trends.collegeboard.org
28 For detailed data behind the graphs and additional information, please visit trends.collegeboard.org.
The percentage of all state grant aid that was allocated based at least in part on students’ financial circumstances increased from 71% in 2010-11 to 74% in 2011-12 — after declining from 76% in 2001-02.
State Grants
FIGURE 17A Need-Based and Non-Need-Based State Grants per Full-Time Equivalent (FTE) Undergraduate Student in 2012 Dollars, 1971-72 to 2011-12
FIGURE 17B Percentage of Undergraduate State Grant Aid for Which Students’ Financial Circumstances Were Considered, by State, 2011-12
NOTE: Need-based aid includes any grants for which financial circumstances contribute to eligibility. Non-need-based aid refers to grants for which financial circumstances have no influence on eligibility. These data are based on state grants awarded to undergraduate students. Dollar values are rounded to nearest $10.
SOURCES: National Association of State Student Grant and Aid Programs (NASSGAP) Survey, 2013, Tables 1 and 12; unpublished IPEDS enrollment data.
Percentages displayed represent percentage of total undergraduate state grant aid for which students’ financial circumstances were considered.
– Non-need-based state grant aid declined in 2011-12, as both Florida and Georgia made significant reductions in their merit-based programs. The percentage of all state grant aid coming from these two states combined declined from 15% in 2010-11 to 11% in 2011-12.
– Several states with large need-based grant programs increased spending on state student grant aid in 2011-12. California provided 17% more state grant aid in 2011-12 than in 2010-11. New York, Pennsylvania, and Washington also saw significant increases.
– Total spending on state undergraduate grant aid increased from $6.5 billion (in 2012 dollars) in 2001-02 to $8.3 billion in 2006-07 and to $9.4 billion in 2011-12.
– State grant aid per FTE undergraduate student increased from $620 in 2001-02 (in 2012 dollars) to $700 in 2006-07, but declined to $670 by 2011-12.
– In 2011-12, 22 states considered students’ financial circumstances in allocating at least 95% of their state grant aid. In 16 states, financial circumstances were considered for less than half of the state grant aid.
Academic Year
Aver
age
Stat
e G
rant
per
FTE
Stu
dent
$0
$100
$200
$300
$400
$500
$600
$700
11-1206-0701-0296-9791-9286-8781-8276-7771-72
Non-Need-Based GrantsNeed-Based Grants
$240
$670
85%
71%
74%
72%
72%
74%
76%
78%
81%
86%
83%
90%
90%
89%
90%
91%
91%
91%
72%
72%
72%
73%
77%
76%
87%
90%
89%
89%
91%
91%
90%
$350$310
$390 $370
$470
$620
$700
State
Perc
enta
ge o
f Sta
te G
rant
s B
ased
on F
inan
cial
Nee
d
0%
20%
40%
60%
80%
100%
Geor
gia
Sout
h Da
kota
Wyo
min
gDi
stric
t of C
olum
bia
Arka
nsas
Loui
sian
aSo
uth
Caro
lina
Mis
siss
ippi
Tenn
esse
eN
ew M
exic
oId
aho
Flor
ida
Utah
Wes
t Virg
inia
Kent
ucky
Alas
kaN
evad
aM
isso
uri
Dela
war
eOh
ioN
orth
Dak
ota
Virg
inia
Mon
tana
Nor
th C
arol
ina
Okla
hom
aAl
abam
aIo
wa
Mas
sach
uset
tsM
aryl
and
New
Jer
sey
Illin
ois
New
Yor
kW
isco
nsin
Mic
higa
nW
ashi
ngto
nKa
nsas
Conn
ectic
utCo
lora
doVe
rmon
tM
inne
sota
Indi
ana
Arizo
naCa
lifor
nia
Haw
aii
Mai
neN
ebra
ska
Oreg
onPe
nnsy
lvan
iaRh
ode
Isla
ndTe
xas
Uni
ted
Stat
es
100%100%99%97%91%
74%
49%
28%
0%
14%

TRENDS IN HIGHER EDUCATION SERIES TRENDS IN STUDENT AID 2013
29For detailed data behind the graphs and additional information, please visit trends.collegeboard.org.
State Grants
In 2011-12, state grant aid per full-time equivalent (FTE) undergraduate student ranged from under $200 (in 2012 dollars) in 12 states to over $1,000 in 10 states.
NOTE: State grant expenditures include funding for both undergraduate and graduate students.
SOURCE: NASSGAP, 2013, Table 14.
FIGURE 18B State Grant Expenditures as a Percentage of Total State Support for Higher Education, 2011-12
Full-time equivalent students include both state residents and out-of-state students who are not eligible for state grants. State grant aid per FTE is influenced both by the generosity of state grant programs and by the variation across states in the percentage of students who are residents.
NOTE: Dollar values are rounded to nearest $10. SOURCE: NASSGAP, 2013, Table 12.
FIGURE 18A State Grant Aid per Full-Time Equivalent (FTE) Undergraduate Student in 2012 Dollars, 2011-12
– In South Carolina, the state with the highest grant aid per FTE undergraduate student, the financial circumstances of the recipients were considered for only 16% of state grant funds in 2011-12. In Georgia, the second most generous state, none of the state grant aid is need-based.
– Of the 10 states with the highest grant aid per FTE undergraduate student, only New Jersey, New York, and Washington take the financial circumstances of students into consideration in allocating more than half of their state grant dollars.
– In the nation as a whole, state grant expenditures constituted 13% of total state support for higher education in 2011-12. This represents an increase from 8% in 2001-02 (NASSGAP, 2003, Table 15) and 11% in 2006-07 (NASSGAP, 2008, Table 14).
ALSO IMPORTANT:
– Six states provided 49% of all state grant dollars in 2011-12, with California contributing 16% and New York 10%.
– Some state-funded grant aid is in the form of “tuition set-aside” programs through which a portion of tuition revenues at public institutions — or of increases in tuition — is dedicated to grant aid. Some of these funds are included in reported state grant aid, but others are not. Tuition remission dollars, not always reported as state grant aid, play a sizable role in several states.
201
2 D
olla
rs
$0
$500
$1,000
$1,500
$2,000
State
$1,110$1,010
$790$620
$520$340
$670
$250$170$90$30$0 $0
$1,730
New
Ham
pshi
reW
yom
ing
Arizo
naUt
ahHa
wai
iAl
abam
aId
aho
Sout
h Da
kota
Kans
asM
onta
naN
ebra
ska
Mis
siss
ippi
Rhod
e Is
land
Mic
higa
nOh
ioIo
wa
Oreg
onAl
aska
Mas
sach
uset
tsCo
lora
doM
aine
Nor
th D
akot
aM
isso
uri
Conn
ectic
utM
aryl
and
Wis
cons
inDe
law
are
Okla
hom
aVi
rgin
iaVe
rmon
tM
inne
sota
Texa
sFl
orid
a N
evad
aIll
inoi
sIn
dian
aDi
stric
t of C
olum
bia
Nor
th C
arol
ina
Penn
sylv
ania
Calif
orni
aN
ew M
exic
oKe
ntuc
kyLo
uisi
ana
Wes
t Virg
inia
New
Yor
kW
ashi
ngto
nN
ew J
erse
yAr
kans
asTe
nnes
see
Geor
gia
Sout
h Ca
rolin
a
Uni
ted
Stat
es
State
Perc
enta
ge
0%
5%
10%
15%
25%
20%
30%
35%
40%
New
Ham
pshi
reHa
wai
iAl
abam
aUt
ahAl
aska
Idah
oAr
izona
Sout
h Da
kota
Neb
rask
aM
issi
ssip
piKa
nsas
Mon
tana
Nor
th D
akot
aW
yom
ing
Ohio
Conn
ectic
utM
ichi
gan
Mai
neM
aryl
and
Oreg
onIo
wa
Rhod
e Is
land
Nor
th C
arol
ina
Mas
sach
uset
tsOk
laho
ma
Dela
war
eW
isco
nsin
Texa
sM
isso
uri
Colo
rado
Min
neso
taN
ew M
exic
oN
evad
aIll
inoi
s
Flor
ida
Virg
inia
Kent
ucky
Calif
orni
aLo
uisi
ana
Indi
ana
Arka
nsas
New
Jer
sey
Wes
t Virg
inia
New
Yor
kGe
orgi
aW
ashi
ngto
nVe
rmon
tPe
nnsy
lvan
iaTe
nnes
see
Sout
h Ca
rolin
a
Uni
ted
Stat
es
20%
16%13%12%
10%8%
6%2%2%
0%
38%

TRENDS IN STUDENT AID 2013 trends.collegeboard.org
30 For detailed data behind the graphs and additional information, please visit trends.collegeboard.org.
Institutional Grant Aid
In 2011-12, on average, low-income dependent students enrolled full time in public four-year colleges and universities received about five times as much total grant aid as those from families with incomes of $106,000 or higher ($8,890 vs. $1,760). However, they received only 30% more institutional grant aid ($1,690 vs. $1,280).
– Independent students and low-income dependent students are more likely than others to enroll in low-price institutions and less likely to enroll in higher-price institutions. In 2007-08, when 35% of full-time dependent students in the sector from families with incomes of $106,000 or higher were enrolled in institutions with tuition and fees exceeding $8,000, 20% of low-income dependent students and 14% of independent students attended institutions in this category.
– In the private nonprofit four-year sector, in 2007-08, 38% of full-time dependent students from families with incomes of $106,000 or higher were enrolled in colleges with tuition and fees exceeding $30,000. In contrast, 21% of low-income dependent and 7% of independent students in this sector were in colleges in this price range.
– Almost all of the grant aid received by dependent students from families in the upper half of the income distribution enrolled in private nonprofit colleges and universities comes from the institutions they attend. In 2011-12, two-thirds of the grant aid received by the lowest-income students and three-quarters of that received by those from families with incomes between $65,000 and $106,000 also came from their colleges and universities.
– For full-time students at private nonprofit four-year institutions, the percentage of institutional grant aid not based on financial circumstances ranged from 43% to 44% for dependent students in the lower half of the income distribution and for independent students, to 63% for dependent undergraduates from families with incomes of $106,000 or higher.
FIGURE 19Institutional Need-Based and Non-Need-Based Grant Aid, and Federal and State Grant Aid, by Dependency Status and Family Income, Full-Time Undergraduate Students at Public Four-Year and Private Nonprofit Four-Year Colleges and Universities, 2011-12
Distribution of Full-Time Undergraduate Students at Public and Private Nonprofit Four-Year Colleges and Universities by Tuition and Fee Level, Dependency Status, and Family Income, 2007-08
Public Four-YearLevel of Tuition and Fees
Private Nonprofit Four-Year Level of Tuition and Fees
Family Income
Less than $4,000 (15%)
$4,000 to $7,999(59%)
$8,000 or More(27%)
Less than $15,000 (18%)
$15,000 to $29,999 (58%)
$30,000 or More(25%)
Dependent StudentLess than $30,000 24% 57% 20% 25% 54% 21%$30,000 to $64,999 16% 61% 23% 15% 65% 20%$65,000 to $105,999 12% 60% 28% 8% 67% 25%$106,000 and over 10% 56% 35% 7% 55% 38%
Independent Student 26% 60% 14% 50% 43% 7%
The percentages along the base of the axis represent the percentage of all full-time students in the sector. The scale of the private nonprofit four-year graph is twice that of the public four-year graph.
NOTE: Grants are categorized by institutions as need-based or non-need-based depending on whether financial circumstances are considered in determining the award. Averages are across all full-time students, including those who did not receive grant aid.
SOURCE: NCES, National Postsecondary Student Aid Study, 2012 (NPSAS:12).
SOURCE: NCES, National Postsecondary Student Aid Study, 2008 (NPSAS:08).
$0
$2,000
$4,000
$6,000
$8,000
$10,000
Aver
age
Gra
nt A
id
$2,000
$0
$4,000
$6,000
$8,000
$10,000
$12,000
$14,000
$16,000
$18,000
$20,000
Private Nonpro�t Four-Year
$290$410
$5,200
$1,760$2,160
$5,760
$8,890
$820$960 $960
$4,410
$510
$480$720
$3,980
$790$990
Institutional Need-Based GrantsInstitutional Non-Need-Based GrantsFederal and State Grants
Less than$30,000(18%)
$65,000 to$105,999
(21%)
IndependentStudents
(19%)
$106,000 orHigher(24%)
$30,000 to$64,999(18%)
$970
$7,200
$280
Dependent Students’ Family Income Quartile
Aver
age
Gra
nt A
id
Public Four-Year
$910
$8,760$10,290
$12,760
$290
$18,250
$20,550
$7,780$5,710
$1,960
$4,190
$2,610
$6,330
$5,510$6,070
$4,400
$6,140
$3,670
$7,380
$7,660
Less than$30,000(14%)
$65,000 to$105,999
(23%)
$106,000 orHigher(30%)
$30,000 to$64,999(18%)
Dependent Students’ Family Income Quartile
IndependentStudents
(15%)

TRENDS IN HIGHER EDUCATION SERIES TRENDS IN STUDENT AID 2013
31For detailed data behind the graphs and additional information, please visit trends.collegeboard.org.
Institutional Grant Aid
Grants meeting need may be awarded according to financial circumstances or on the basis of other criteria. The estimates reported here reflect the best efforts of respondents to the College Board’s Annual Survey of Colleges to identify aid that fills the gap between a student’s available resources and the cost of attendance. Grants awarded to students without financial need or awarded in excess of need are “grants exceeding need.”
NOTE: Only institutions reporting institutional grant aid are included. About 70% of the public four-year institutions and 80% of the private four-year institutions in the Annual Survey of Colleges (ASC) provide data on institutional grants. Athletic grants and tuition waivers reflect three-year moving averages. Estimates for 2012-13 incorporate both the responses for that year and the change from 2011-12 for schools reporting both years. Estimates should be interpreted with caution. Note that the scale of Figure 20B is six times that of Figure 20A.
SOURCES: The College Board, Annual Survey of Colleges, 2002 to 2013; calculations by the authors.
The percentage of institutional grant aid meeting undergraduate students’ financial need at public four-year colleges and universities increased from 34% in 2002-03 to 40% in 2007-08 and to an estimated 51% in 2012-13, as both athletic awards and grant aid exceeding need constituted declining portions of aid budgets.
FIGURE 20AAverage Institutional Grant per Full-Time Equivalent (FTE) Student: Percentage Meeting Need, Exceeding Need, Athletic Awards, and Tuition Waivers, Public Four-Year Colleges and Universities in 2012 Dollars, 2001-02 to 2012-13
Inst
itutio
nal G
rant
Aid
per
FTE
$0
$500
$1,000
$1,500
$2,000
Academic Year
12-1311-1210-1109-1008-0907-0806-0705-0604-0503-0402-0301-02
$1,7
80
$1,6
60
$1,5
70
$1,4
60
$1,3
80
$1,3
40
$1,3
10
$1,2
00
$1,2
40
$1,0
90
$1,0
30
$1,0
10
31% 34% 36% 36% 35% 38% 40% 41% 45%49% 48%
51%37% 33%
31% 33% 35% 33% 32%32%
29%27%
29%28%
17% 17% 17%17% 16% 15% 15% 14%
13%11%
10%9%
16% 16% 16%15% 14% 14% 13% 13%
13%13%
13%13%
Grants Meeting NeedGrants Exceeding NeedAthletic GrantsTuition Waivers
FIGURE 20BAverage Institutional Grant per Full-Time Equivalent (FTE) Student: Percentage Meeting Need, Exceeding Need, Athletic Awards, and Tuition Waivers, Private Nonprofit Four-Year Colleges and Universities in 2012 Dollars, 2001-02 to 2012-13
– Between 2007-08 and 2012-13, average grant aid meeting need at public four-year colleges increased by 67% in 2012 dollars, from $540 to $900 per FTE student. Over these five years, institutional grants exceeding need rose 14% at institutions reporting grant aid, from $430 to $490 per FTE student, while athletic awards declined by 24% in 2012 dollars.
– The percentage of institutional grant aid meeting students’ financial need at private nonprofit four-year colleges and universities was 67% in 2002-03, 67% in 2007-08, and an estimated 72% in 2012-13.
– Between 2007-08 and 2012-13, at private nonprofit four-year colleges and universities reporting grant aid, average grant aid meeting need increased by 31% in 2012 dollars, from $6,090 to $7,990 per FTE student. Over these five years, institutional grants exceeding need rose 15%, from $2,020 to $2,320 per FTE student, while athletic awards declined by 35% in 2012 dollars.
ALSO IMPORTANT:
– Both public and private institutions use their financial aid dollars for multiple purposes. In addition to making it possible for students with inadequate financial resources to enroll, these institutions seek to attract students with strong academic credentials and other characteristics they consider important.
$0
$3,000
$6,000
$9,000
$12,000
66%67% 66% 67% 67% 67% 67% 68%
70% 71%72% 72%23% 23% 23% 22%
23%23% 22% 23%
22% 21% 21% 21%
5%5% 5% 5% 5%
5%5% 4%
4%4%
4% 4%
6%6% 6% 6% 6% 6%
6% 5%4%
3%3% 3%
Inst
itutio
nal G
rant
Aid
per
FTE
Grants Meeting NeedGrants Exceeding NeedAthletic GrantsTuition Waivers
$11,
080
$10,
690
$10,
350
$9,9
00
$8,9
20
$8,9
80
$8,5
30
$7,9
00
$8,1
60
$7,6
60
$7,4
70
$6,8
70
Academic Year
12-1311-1210-1109-1008-0907-0806-0705-0604-0503-0402-0301-02

TRENDS IN STUDENT AID 2013 trends.collegeboard.org
32 For detailed data behind the graphs and additional information, please visit trends.collegeboard.org.
College Savings Plans
As of June 2013, assets in Section 529 state college savings plans totaled $205.7 billion. The 11.4 million accounts held an average of $18,000.
– The percentage of 529 assets held in prepaid tuition plans declined from 81% in 1999 to 24% in 2003, to 15% in 2008, and to 11% in 2013.
– The total number of 529 college savings accounts grew from 9.6 million in 2009 to 11.4 million in 2013.
– In 2012, distributions from 529 accounts covered $13.2 billion of college expenses, an increase from $7.7 billion in 2009 (in 2013 dollars).
ALSO IMPORTANT:
– State 529 plans provide tax benefits for college savings. Funds in these accounts grow tax-deferred, and distributions to pay for the beneficiary’s college tuition are exempt from federal taxation. Changes in the value of funds in regular 529 savings plans depend on market performance. The value of pre-paid plans is fixed relative to the price of in-state public colleges.
– Although 16 states have prepaid tuition plans, 45% of the total assets in these accounts are in Florida.
– Virginia has the largest 529 savings plan, with 19% of the total assets.
– Arkansas, Colorado, Kansas, Louisiana, Maine, Missouri, Nevada, North Dakota, Rhode Island, Utah, and West Virginia provide matching grants for low- and middle-income families who contribute to 529 savings accounts. (www.savingforcollege.com)
– More than 270 private colleges and universities have joined together in a prepaid tuition plan that carries the same tax benefits as the state-sponsored 529 savings plans. The assets in the 8,000 accounts in this plan, which are not included in Figure 21A, were $277 million as of June 30, 2013.
– Other forms of savings for education that are granted special tax status by the federal government include Series EE and Series I Savings Bonds and Coverdell Education Savings Accounts, as well as IRA withdrawals for education expenses.
FIGURE 21ATotal Assets in State-Sponsored Section 529 Savings Plans (and Percentage of Funds in Prepaid Tuition Accounts) in 2013 Dollars (in Billions), December 1999 to June 2013
FIGURE 21CState-Sponsored 529 College Savings Accounts: Contributions and Distributions in 2013 Dollars (in Billions), 2009–2012
NOTE: Values for 1999 through 2012 are as of Dec. 31. Value for 2013 is as of June 30.
SOURCE: Data provided by College Savings Plans Network (www.collegesavings.org).
NOTE: Values for 2001 through 2012 are as of Dec. 31. Value for 2013 is as of June 30. Comparable numbers of active accounts are not available for years prior to 2009.
SOURCE: College Savings Plans Network.
SOURCE: College Savings Plans Network.
FIGURE 21BState-Sponsored 529 Savings Accounts: Average Account Value in 2013 Dollars, 2009–2013 (with Number of Active Accounts)
Year
Aver
age
Acc
ount
Val
ue
in 2
013
Dol
lars
$02010 2011 2012 20132009
$5,000
$10,000
$15,000
$20,000
$15,109
(9.6)
$16,599
(10.2)
$15,862
(10.7)
$17,501
(11.1)
$17,997
(11.4)
Year
In B
illio
ns o
f 201
3 D
olla
rs
$0
$20
$40
$60
$80
$100
$120
$140
$160
$180
$200
$220
201320122011201020092008200720062005200420032002200120001999
Prepaid PlansSavings Plans
$170.2$168.7
$194.2
$144.7
$111.4
$145.7
$121.3
$98.7
$79.8
$58.1
$34.8
$17.9$12.6$8.1
11%
$205.7
11%
12%12%
13%
15%
14%
15%
17%
19%
24%
31%
48%66%81%
Year
$0
$5
$10
$15
$20
$25
2010 20112009 2012
Contributions Distributions
In B
illio
ns o
f 201
3 D
olla
rs
$17.9
$7.7
$19.3 $20.4
$11.7
$21.6
$13.2$10.0

TRENDS IN HIGHER EDUCATION SERIES TRENDS IN STUDENT AID 2013
33See Table A2 Consumer Price Index.
Notes and Sources
DATA DEFINITIONS
Federally Supported Programs: Only federal funds allocated for campus-based aid programs are included in reported federal aid amounts. Perkins Loans are funded from past federal and institutional capital contributions as well as collections from borrowers. Since FY 2006, no funds have been appropriated for new federal capital contributions. All Perkins Loans awarded are included as federal loans. Institutional matching funds required by the Federal Supplemental Educational Opportunity Grant (FSEOG) program since 1989-90 are reported under institutional grants.
LEAP. Formerly known as the State Student Incentive Grant (SSIG) program, the Leveraging Educational Assistance Partnership (LEAP) monies reported under federally supported aid include federal monies only; the state share is included in the state grant category. Funding for the LEAP programs ended with the 2010-11 academic year.
Veterans. Benefits are payments for postsecondary education and training to veterans and their dependents, including the Post-9/11 Veterans Educational Assistance program established in 2009-10 and all programs established earlier. Some of these funds also cover living expenses and other education-related costs. The Iraq and Afghanistan Service Grants program began in 2010-11. These grants provide non-need-based grants for students whose parent or guardian was a member of the Armed Forces who died in Iraq or Afghanistan as a result of performing military service after Sept. 11, 2001.
Military. Includes educational expenditures under the F. Edward Hebert Armed Forces Health Professions Scholarship Program; Reserve Officers’ Training Corps (ROTC) programs for the Air Force, Army, and Navy/Marines; and higher education tuition assistance for the active duty Armed Forces.
Other Federal Grants. Includes Higher Education Grants for Indian Students; American Indian Scholarships; Indian Health Service Scholarships; National Science Foundation predoctoral fellowships (minority and general graduate); National Health Service Corps Scholarships; National Institutes of Health predoctoral individual awards; the Jacob K. Javits Fellowship Program; and college grants provided to volunteers in the AmeriCorps national service programs, for which funding began in 1994-95.
Federal Direct, PLUS, and Perkins Loans. Data provided by the Department of Education on education loan disbursements.
Other Federal Loans. Includes loans from the Health Professions Student Loan Program, Disadvantaged Student Loans, the Nursing Student Loan Program, and the Teacher Education Assistance for College and Higher Education (TEACH) grant program. The TEACH grant program is operated as a loan program with 100% loan forgiveness
upon completion of a service requirement. Current estimates suggest that approximately three-quarters of participating students will not complete the required service and thus will have their grants converted to Direct Unsubsidized Loans.
Education Tax Benefits. Data on education tax credits are IRS estimates of the volume of Hope, Lifetime Learning, and American Opportunity credits for tax years 1998 and later. For nonrefundable credits, only those claimed on taxable returns are included. Tax deductions are based on IRS Statistics of Income (www.irs.gov/pub/irs-soi/11inalcr.pdf), with associated savings estimated by the authors based on the marginal tax rates applied to the taxable income of the taxpayers in each income bracket claiming the deduction on taxable returns. Calendar year amounts are split between the two associated academic years.
Direct Subsidized Loans: Need-based student loans for which the federal government pays the interest while the student is in school and during a six-month grace period thereafter. Prior to June 2012, these loans were available to both undergraduate and graduate students, but the Budget Control Act of 2011 eliminated the program for graduate students, whose federal loans are now all unsubsidized or Grad PLUS loans.
Direct Unsubsidized Loans: Unsubsidized loans are issued by the federal government through the Federal Direct Student Loan Program (FDSLP). Prior to July 2010, loans were issued either through the FDSLP or issued by private lenders and guaranteed by the federal government.
Full-Time Equivalent (FTE) Students: Enrollment numbers based on a federal formula that counts each part-time student as equivalent to one-third of a full-time student.
Graduate and Undergraduate Aid: The breakdown of aid between undergraduate and graduate students is estimated based on the National Postsecondary Student Aid Study (NPSAS) when not available from other sources.
Loan Totals: Nonfederal loans from private lenders are included in Table 1 as an important source of funding for students, but are not considered financial aid because they provide no subsidy to students. Figures 1, 4A, 4B, 6, 8, 11A, 11B, 11C, 12A, and 12B include nonfederal loans to give a more complete picture of student borrowing. Figures 2A, 2B, 3A, and 3B measure financial aid amounts and therefore exclude nonfederal loans.
Inflation Adjustment: The Consumer Price Index for all urban dwellers (CPI-U) is used to adjust for inflation. We use the CPI-U in July of the year in which the academic year begins. See ftp.bls.gov/pub/special.requests/cpi/cpiai.txt for changes in the CPI-U over time.

TRENDS IN STUDENT AID 2013 trends.collegeboard.org
34
SOURCES
Campus-Based Aid (FWS, Perkins, and FSEOG), Iraq and Afghanistan Service Grants, and ACG/SMART Grants: U.S. Department of Education, Annual Federal Program Databooks.
Cumulative Debt for Undergraduate Students: Distribution of cumulative debt levels reported in Figure 11C comes from the Beginning Postsecondary Students Longitudinal Study, 2009. Average debt levels reported in Figures 10A and 10B are based on the Annual Survey of Colleges, 2001 to 2013.
Education Tax Benefits: Income Tax Returns, All Returns, Tables 1.3, 1.4, 2, and 3.3 and additional Statistics of Income sources.
Federal Family Education Loan and Direct Student Loan Programs: Unpublished data from Policy, Budget, and Analysis Staff, U.S. Department of Education, and the National Student Loan Data System (NSLDS).
Federal Student Loan Program Cohort Default Rates (CDR): Data reported on annual default rates in Figures 12B and 12C are from the U.S. Department of Education, Federal Student Aid, Default Prevention and Management. The Default Prevention and Management home page is located at ifap.ed.gov/DefaultManagement/DefaultManagement.html.
Federal Student Loan Program Repayment Data: Based on data published by the U.S. Department of Education at http://studentaid.ed.gov/about/data-center/student/portfolio. Only Federal Direct Loans in a specified repayment plan are included in Figure 12A.
Full-Time Equivalent (FTE) Enrollment: Based on unpublished computations by Integrated Postsecondary Education Data System (IPEDS) staff at the National Center for Education Statistics (NCES), as well as unpublished IPEDS data.
Institutional Grants: Estimates based on IPEDS data through FY 2010, information from NPSAS, and data from the College Board’s Annual Survey of Colleges. These figures represent best approximations and are updated each year as additional information becomes available.
State Grant Programs: 2012-13: Estimates based on an annual College Board survey of all states. 1988-89 to 2011-12: 20th through 43rd Annual Survey Reports of the National Association of State Student Grant and Aid Programs (NASSGAP).
Military: Estimates based on available data from F. Edward Hebert Armed Forces Health Professions Scholarship Program amounts from the Office of the Assistant Secretary for Defense (Health Affairs). ROTC program data from the Air Force, Army, and Navy/Marines program offices.
Nonfederal Loans: Estimates for 2010-11 through 2012-13 provided by the Consumer Bankers Association, MeasureOne, and the Consumer Financial Protection Bureau. Earlier data based on information provided by lenders supplemented by data from annual reports and from NPSAS, 2008. Data on lending also collected from the major credit unions and their associations. Estimates of institutional lending are based on NPSAS, 2008 and 2012, as well as a survey of institutions conducted for the College Board by the National Association of Student Financial Aid Administrators (NASFAA). Data on loans from states are based on information collected from staff of state-sponsored private loan programs or state grant agencies, in addition to NASSGAP.
Other Grants and Loans: Data collected through conversations and correspondence with the officials of the agencies that sponsor the programs.
Pell Grant Program: Data from Policy, Budget, and Analysis Staff, U.S. Department of Education. Other data are from Federal Pell Grant End-of-Year Reports and from the Federal Student Aid Data Center (http://studentaid.ed.gov/data-center).
Private and Employer Grants: Estimates based on data included in NPSAS and on National Scholarship Providers Association surveys of major private student grant providers, supplemented by information from annual reports of selected scholarship providers and data from institutional financial aid offices.
State Savings Plans: Data on assets in state savings plans and guaranteed tuition plans were provided by the National Association of State Treasurers/College Savings Plans Network.
Veterans Benefits: Benefits Program series (annual publication for each fiscal year), Office of Budget and Finance, U.S. Veterans Administration and unpublished data from the same agency.
For more details on data sources and methodology, please see the Trends in Student Aid website at trends.collegeboard.org.

This report provides the most recent and complete statistics available on student aid in the United States. Detailed historical data are available online at trends.collegeboard.org.
Trends in Student Aid was authored by Sandy Baum, senior fellow at the Urban Institute and research professor at the George Washington University Graduate School of Human Development, and Kathleen Payea, College Board policy analyst, with invaluable assistance from Charles Kurose.
Contact Information for the AuthorsSandy Baum, [email protected] Kathleen Payea, [email protected]
Trends in Student Aid and its companion report, Trends in College Pricing, are supplemented by a website that makes detailed data available for reference and downloading. The PDF versions of these reports, along with PowerPoint slides of all the graphs, are available on the Web: trends.collegeboard.org.
Hard copies may be ordered by contacting [email protected].
Tables, graphs, and data in this report or excerpts thereof may be reproduced or cited, for noncommercial purposes only, provided that the following attribution is included:
Source: Trends in Student Aid. © 2013 The College Board.www.collegeboard.org
ACKNOWLEDGMENTS
This publication benefited from comments by Michael Hurwitz, Kathleen Little, Jennifer Ma, and Anne Sturtevant. The publication would not have been possible without the cooperation and support of many people at the College Board, including Andy Costello and the Annual Survey of Colleges staff, Craig Jerald, Rohit Tandon, Silvia Ivanova, and Kathryn McGinley. Barbara Kridl and her colleagues at RTI International provided expert graphic design work, as well as advice on content.
We thank all of those who contributed to the data collection for this publication, including institutional research department staff and campus administrators who provided us with invaluable data through the Annual Survey of Colleges, state agency and special-aid program contacts, private lenders, and experts from the U.S. Department of Education. Special thanks to Donald Conner and Mary Miller of the U.S. Department of Education, as well as Paul Fielding at MeasureOne, Chris Hunter of the National Association of State Treasurers, Gigi Jones of the National Association of Student Financial Aid Administrators (NASFAA), Mike Solomon of the Illinois Student Aid Commission, and Amy Weinstein of the National Scholarship Providers Association for their assistance.

www.collegeboard.org
trends.collegeboard.org
13b-8192
130505642