Embed Size (px)
Citation preview
Trends in Perinatal Mortality in Scotland
A review over 30 years

Trends in Perinatal Mortality in Scotland - a review over 30 years
Trends in Perinatal Mortality in Scotland - a review over 30 years
Trends in Perinatal Mortality in Scotland
A review over 30 years
Information Services DivisionNHSScotland
NHS Quality Improvement Scotland (NHS QIS)Reproductive Health Programme
Edinburgh 2009
Trends in Perinatal Mortality in Scotland - a review over 30 years
© Common Services Agency/Crown Copyright 2009
Brief extracts from this publication may be reproduced provided the source is fullyacknowledged. Proposals for the reproduction of large extracts should be addressed to ISD Publications, Area 114a, South Gyle Square, 1 South Gyle Crescent, Edinburgh, EH12 9EB
NHS Quality Improvement Scotland (NHS QIS)Reproductive Health Programme
ISBN-10: 1-84134-020-0
ISBN-13: 978-1-84134-020-3
Information Services
Publication enquiries
ISD Customer Support DeskGyle Square, 1 South Gyle CrescentEdinburgh EH12 9EB
Tel 0131 275 7777 Email [email protected] or
Leslie MarrReproductive Health Programme Coordinator NHS Quality Improvement ScotlandElliot House8-10 Hillside CrescentEdinburgh EH7 5EA
Tel 0131 623 4710 Email [email protected]
Typeset by ISD Scotland Publications
Trends in Perinatal Mortality in Scotland - a review over 30 years
1
ConTenTS
Acknowledgements 2
Conventions 3
Definitions 3
1 Summary 4
Background, methods and aims 4 Key Findings 4 Summary of recommendations 4
2 Introduction and Methods 5
Comparisons with other European Countries 5
3 Total Births 9
4 Stillbirths 10
Stillbirth and maternal age 10 Stillbirth and deprivation 12 Antepartum stillbirths 17 Intrapartum stillbirths 18 Coding 19 Paediatric classification 22
5 Neonatal deaths 23
6 Multiple births 24
7 Deprivation 27
Smoking 31
8 Summary of Recommendations 32
9 Limitations 33
10 Conclusions 34
11 References 35
12 Obstetric and Paediatric Classification - Categories 36
Trends in Perinatal Mortality in Scotland - a review over 30 years
2
AcknowledgementsThis report was produced by:
Andrew Lyon, Chair of The Scottish Perinatal Morbidity and Mortality Review Advisory Group, NHS Quality Improvement Scotland
Jim Chalmers, Head of Women and Children’s Health Information Programme, Information Services Division, NHS Scotland
Etta Shanks, Maternity and Neonatal Team Leader, Information Services Division, NHS Scotland
Christopher Lennox, Clinical Advisor, Reproductive Health Programme, NHS QIS
Leslie Marr, Reproductive Health Programme Coordinator, NHS QIS
Angus K McFadyen, Reader in Health Statistics, Glasgow Caledonian University
Special thanks are also due to:
The unit coordinators, risk managers, clinicians and staff through out NHS Scotland who contributed the data for this report.
Members of The Scottish Perinatal Morbidity and Mortality Review Advisory Group, NHS Quality Improvement Scotland.
Addendum
1. Page 11 changed chart title from 1985-2006 ti 1985/87-2005/07.2. Page 23 changed chart title from 1985/87-2005/07 to 1985-2007.3. Page 24 changed chart title from 1975-2006 to 1975-2007.4. Page 35 added in reference - Sandra Bonellie, James Chalmers, Ron Gray, Ian Greer, Stephen Jarvis,
Claire Williams. Centile charts for birthweight for gestational age for Scottish singleton births. BMC Pregnancy and Childbirth 2008, :5doi:10.1186/1471-2393-8-5: <http://www.biomedcentral.com/1471-2393/8/5>.
Trends in Perinatal Mortality in Scotland - a review over 30 years
3
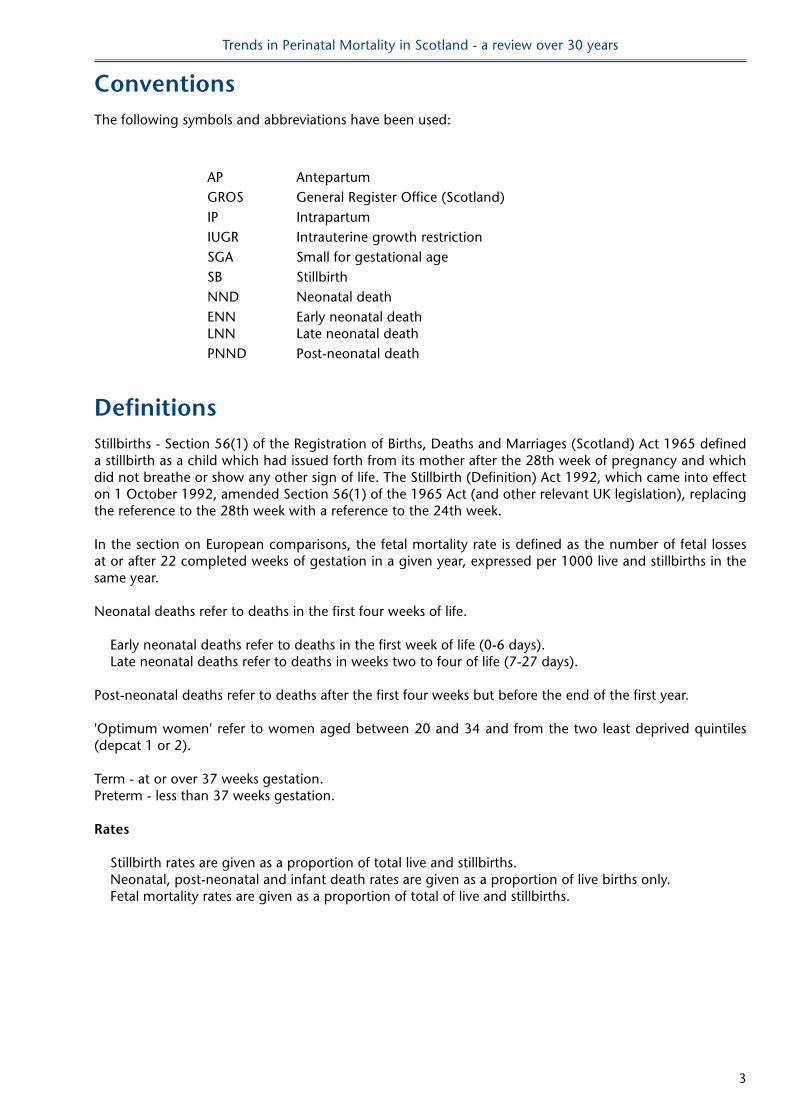
ConventionsThe following symbols and abbreviations have been used:
AP Antepartum GROS General Register Office (Scotland) IP Intrapartum IUGR Intrauterine growth restriction SGA Small for gestational age SB Stillbirth NND Neonatal death ENN Early neonatal death LNN Late neonatal death PNND Post-neonatal death
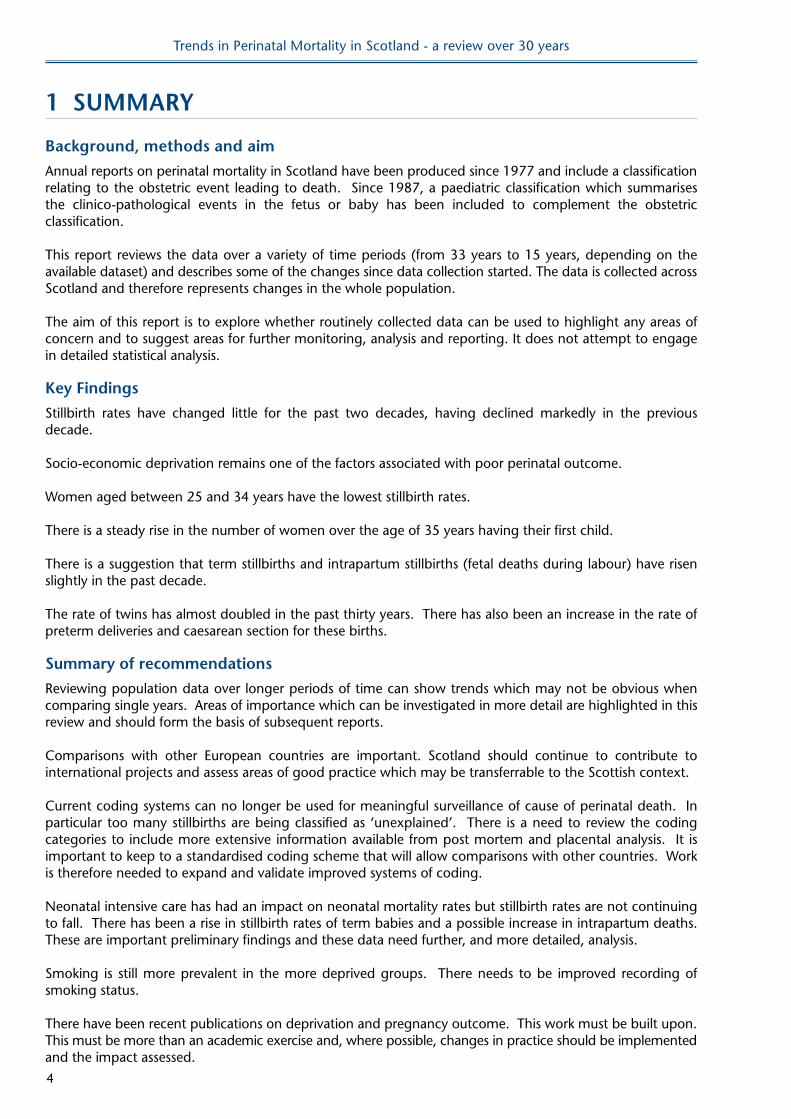
DefinitionsStillbirths - Section 56(1) of the Registration of Births, Deaths and Marriages (Scotland) Act 1965 defined a stillbirth as a child which had issued forth from its mother after the 28th week of pregnancy and which did not breathe or show any other sign of life. The Stillbirth (Definition) Act 1992, which came into effect on 1 October 1992, amended Section 56(1) of the 1965 Act (and other relevant UK legislation), replacing the reference to the 28th week with a reference to the 24th week.
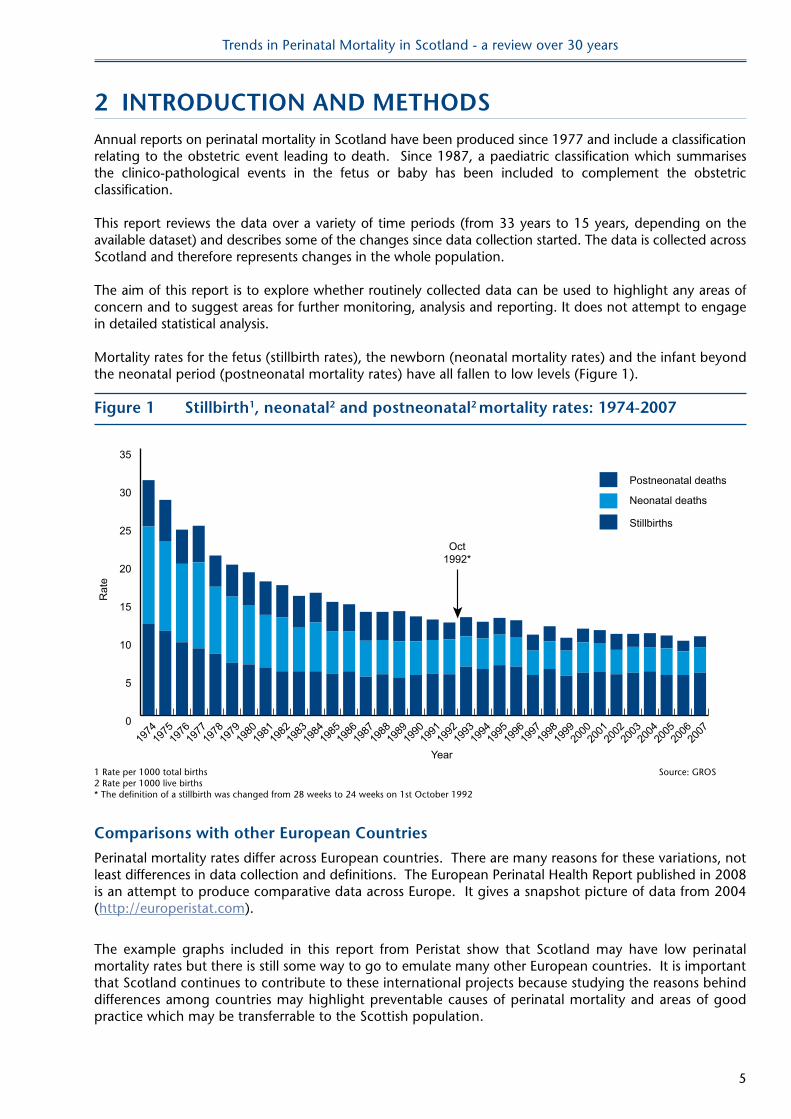
In the section on European comparisons, the fetal mortality rate is defined as the number of fetal losses at or after 22 completed weeks of gestation in a given year, expressed per 1000 live and stillbirths in the same year.
Neonatal deaths refer to deaths in the first four weeks of life.
Early neonatal deaths refer to deaths in the first week of life (0-6 days). Late neonatal deaths refer to deaths in weeks two to four of life (7-27 days).
Post-neonatal deaths refer to deaths after the first four weeks but before the end of the first year.
'Optimum women' refer to women aged between 20 and 34 and from the two least deprived quintiles (depcat 1 or 2).
Term - at or over 37 weeks gestation.Preterm - less than 37 weeks gestation.
Rates
Stillbirth rates are given as a proportion of total live and stillbirths. Neonatal, post-neonatal and infant death rates are given as a proportion of live births only. Fetal mortality rates are given as a proportion of total of live and stillbirths.
Trends in Perinatal Mortality in Scotland - a review over 30 years
4
1 SUMMARY
Background, methods and aim
Annual reports on perinatal mortality in Scotland have been produced since 1977 and include a classification relating to the obstetric event leading to death. Since 1987, a paediatric classification which summarises the clinico-pathological events in the fetus or baby has been included to complement the obstetric classification. This report reviews the data over a variety of time periods (from 33 years to 15 years, depending on the available dataset) and describes some of the changes since data collection started. The data is collected across Scotland and therefore represents changes in the whole population.
The aim of this report is to explore whether routinely collected data can be used to highlight any areas of concern and to suggest areas for further monitoring, analysis and reporting. It does not attempt to engage in detailed statistical analysis.
Key Findings
Stillbirth rates have changed little for the past two decades, having declined markedly in the previous decade. Socio-economic deprivation remains one of the factors associated with poor perinatal outcome. Women aged between 25 and 34 years have the lowest stillbirth rates. There is a steady rise in the number of women over the age of 35 years having their first child. There is a suggestion that term stillbirths and intrapartum stillbirths (fetal deaths during labour) have risen slightly in the past decade. The rate of twins has almost doubled in the past thirty years. There has also been an increase in the rate of preterm deliveries and caesarean section for these births.
Summary of recommendations
Reviewing population data over longer periods of time can show trends which may not be obvious when comparing single years. Areas of importance which can be investigated in more detail are highlighted in this review and should form the basis of subsequent reports.
Comparisons with other European countries are important. Scotland should continue to contribute to international projects and assess areas of good practice which may be transferrable to the Scottish context.
Current coding systems can no longer be used for meaningful surveillance of cause of perinatal death. In particular too many stillbirths are being classified as ‘unexplained’. There is a need to review the coding categories to include more extensive information available from post mortem and placental analysis. It is important to keep to a standardised coding scheme that will allow comparisons with other countries. Work is therefore needed to expand and validate improved systems of coding.
Neonatal intensive care has had an impact on neonatal mortality rates but stillbirth rates are not continuing to fall. There has been a rise in stillbirth rates of term babies and a possible increase in intrapartum deaths. These are important preliminary findings and these data need further, and more detailed, analysis.
Smoking is still more prevalent in the more deprived groups. There needs to be improved recording of smoking status.
There have been recent publications on deprivation and pregnancy outcome. This work must be built upon. This must be more than an academic exercise and, where possible, changes in practice should be implemented and the impact assessed.
Trends in Perinatal Mortality in Scotland - a review over 30 years
5
2 InTRoDUCTIon AnD MeThoDSAnnual reports on perinatal mortality in Scotland have been produced since 1977 and include a classification relating to the obstetric event leading to death. Since 1987, a paediatric classification which summarises the clinico-pathological events in the fetus or baby has been included to complement the obstetric classification. This report reviews the data over a variety of time periods (from 33 years to 15 years, depending on the available dataset) and describes some of the changes since data collection started. The data is collected across Scotland and therefore represents changes in the whole population.
The aim of this report is to explore whether routinely collected data can be used to highlight any areas of concern and to suggest areas for further monitoring, analysis and reporting. It does not attempt to engage in detailed statistical analysis.
Mortality rates for the fetus (stillbirth rates), the newborn (neonatal mortality rates) and the infant beyond the neonatal period (postneonatal mortality rates) have all fallen to low levels (Figure 1).
Figure 1 Stillbirth1, neonatal2 and postneonatal2 mortality rates: 1974-2007
0
5
10
15
20
25
30
35
Postneonatal deaths
Neonatal deaths
Stillbirths
2007
2006
2005
2004
2003
2002
2001
2000
1999
1998
1997
1996
1995
1994
1993
1992
1991
1990
1989
1988
1987
1986
1985
1984
1983
1982
1981
1980
1979
1978
1977
1976
1975
1974
Year
Rat
e
Oct1992*
1 Rate per 1000 total births Source: GROS2 Rate per 1000 live births* The definition of a stillbirth was changed from 28 weeks to 24 weeks on 1st October 1992
Comparisons with other european Countries
Perinatal mortality rates differ across European countries. There are many reasons for these variations, not least differences in data collection and definitions. The European Perinatal Health Report published in 2008 is an attempt to produce comparative data across Europe. It gives a snapshot picture of data from 2004 (http://europeristat.com).
The example graphs included in this report from Peristat show that Scotland may have low perinatal mortality rates but there is still some way to go to emulate many other European countries. It is important that Scotland continues to contribute to these international projects because studying the reasons behind differences among countries may highlight preventable causes of perinatal mortality and areas of good practice which may be transferrable to the Scottish population.
Trends in Perinatal Mortality in Scotland - a review over 30 years
6
Figure 2 shows fetal mortality rates. This is defined as the number of fetal losses at or after 22 completed weeks of gestation in a given year, expressed per 1000 live and stillbirths in the same year. Scotland has one of the highest singleton fetal mortality rates of the countries which are assessed.
Figure 2 Singleton and multiple fetal mortality rates1: 2004
Rates
10.4
0 5 10 15 20 25 30 35
Singleton
Multiple
UK: ScotlandUK: Northern Ireland
UK: England and WalesSweden
SpainSlovenia
Slovak RepublicPortugal
PolandNorway
NetherlandsMalta
LuxembourgLithuania
LatviaItaly
IrelandGermany
FranceFinlandEstonia
DenmarkCzech Republic
Belgium: FlandersBelgium: Brussels
Austria
2.4
3.0
5.1
4.4
3.3
5.1
4.0
8.1
13.6
8.9
7.9
12.7
6.1
8.5
3.8
6.6
13.3
10.6
12.3
6.55.0
2.8
29.1
28.4
15.6
17.4
22.2
9.7
9.0
26.5
16.8
20.9
13.1
14.9
15.8
8.3
6.6
3.5
4.6
3.7
5.0
2.3
2.9
3.0
5.4
6.3
5.6
4.0
4.0
3.9
1 Rate per 1000 singleton/multiple total births Source: European Perinatal Health Report
Trends in Perinatal Mortality in Scotland - a review over 30 years
7
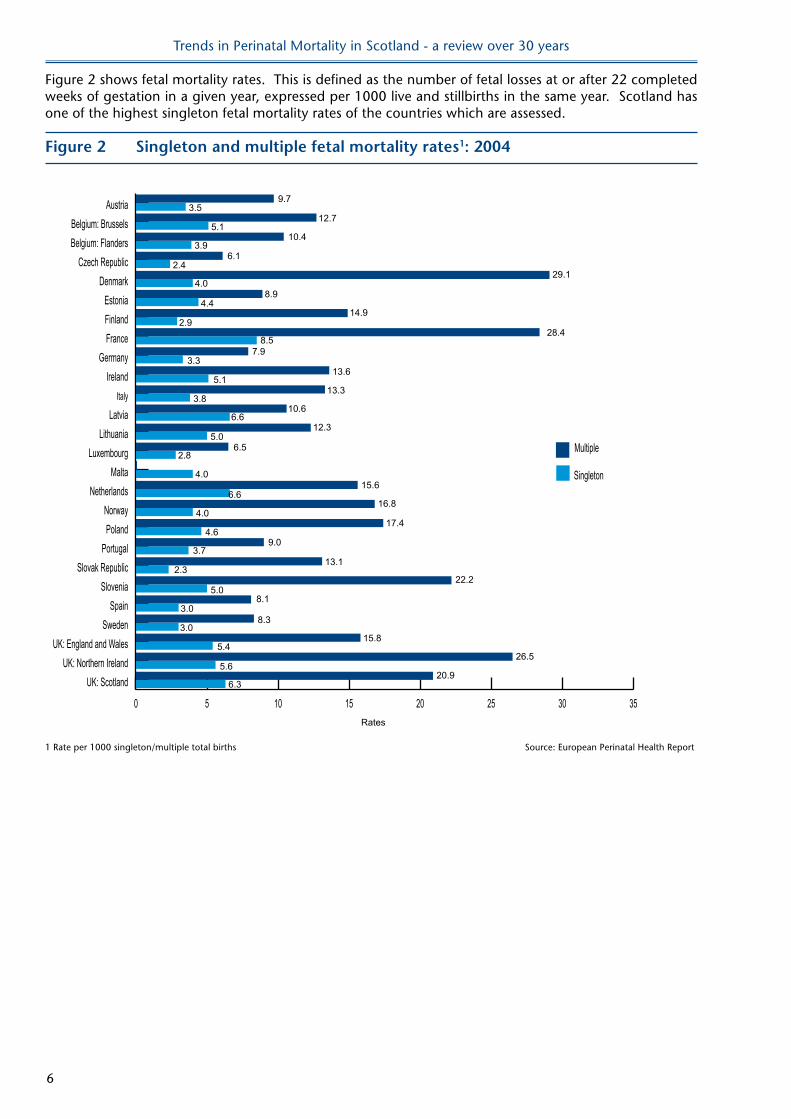
Figure 3 demonstrates the differences across many European countries in 2004, early and late neonatal mortality rates. Sotland’s rates for early neonatal mortality were lower than those of England and Wales, and Northern Ireland, but the rates for late neonatal mortality were similar to those of England and Wales and higher than those of Northern Ireland.
Figure 3 early and late neonatal mortality rates1: 2004
0 1 2 3 4 5 6
Late (7-27 days)
Early (0-6 days)
UK: ScotlandUK: Northern Ireland
UK: England and WalesSweden
SpainSlovenia
Slovak RepublicPortugal
PolandNorway
NetherlandsMalta
LuxembourgLithuania
LatviaItaly
IrelandHungaryGreece
GermanyFranceFinlandEstonia
ES: ValanciaDenmark
Czech RepublicBelgium: FlandersBelgium: Brussels
Austria
Rates
1.7 1.0
2.2 0.9
0.8
1.9
1.1
0.9
0.9
0.4
0.5
0.80.6
0.7
0.6
2.0
1.01.3
3.0
1.3
3.4
2.0
1.8
2.0
1.8
3.4
2.7
3.8
3.3 1.4
0.4
1.3
1.6
3.1
0.5
1.3
3.00.61.5
3.6
0.9
0.4
0.52.1
2.2
1.7
0.90.5
0.8
0.3
2.6
2.6
0.82.2
2.0
0.9
1.6
1 Rate per 1000 live births Source: European Perinatal Health Report
Trends in Perinatal Mortality in Scotland - a review over 30 years
8
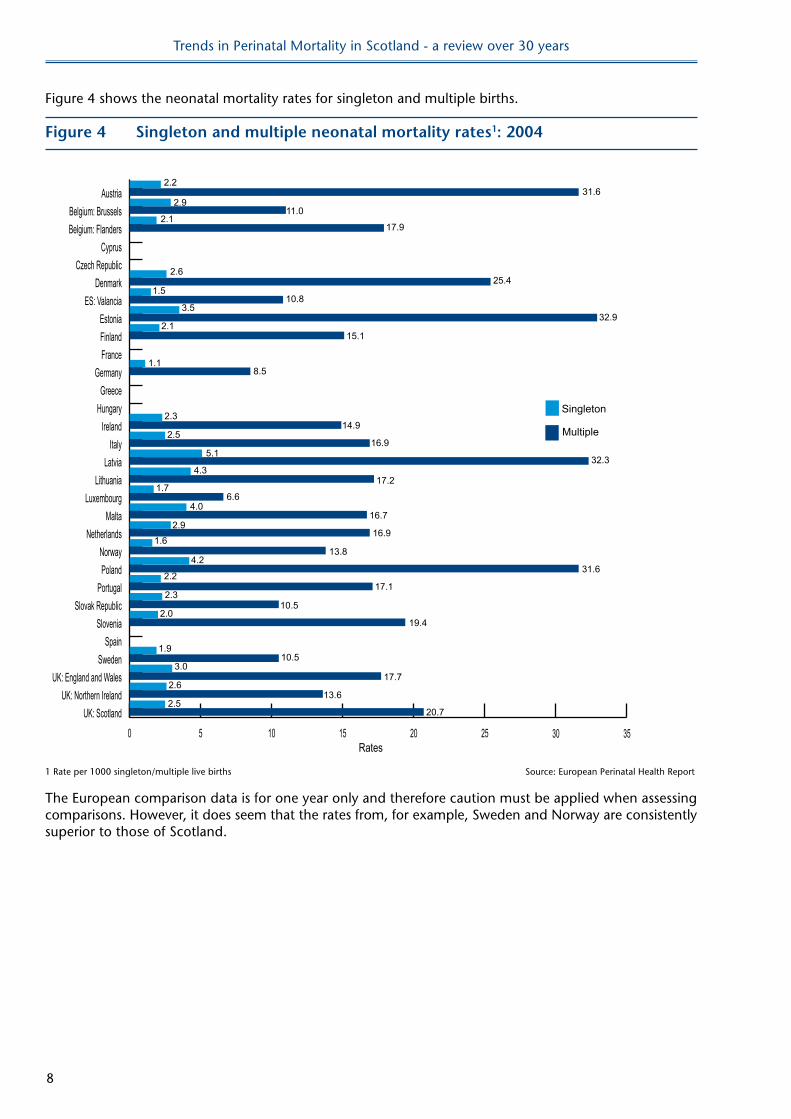
Figure 4 shows the neonatal mortality rates for singleton and multiple births.
Figure 4 Singleton and multiple neonatal mortality rates1: 2004
Rates0 5 10 15 20 25 30 35
UK: ScotlandUK: Northern Ireland
UK: England and WalesSweden
SpainSlovenia
Slovak RepublicPortugal
PolandNorway
NetherlandsMalta
LuxembourgLithuania
LatviaItaly
IrelandHungaryGreece
GermanyFranceFinlandEstonia
ES: ValanciaDenmark
Czech RepublicCyprus
Belgium: FlandersBelgium: Brussels
Austria
2.6
1.9
3.5
1.1
2.1
1.5
15.1
10.8
11.0
17.9
8.5
2.3
2.516.9
17.2
14.9
4.3
5.1
1.7
31.6
32.9
16.9
32.3
19.4
2.2
10.5
31.6
13.8
20.7
17.1
25.4
17.7
10.5
2.9
2.9
4.2
2.2
2.0
2.3
2.1
3.0
2.613.6
2.5
4.0
1.6
Singleton
Multiple
6.6
16.7
1 Rate per 1000 singleton/multiple live births Source: European Perinatal Health Report
The European comparison data is for one year only and therefore caution must be applied when assessing comparisons. However, it does seem that the rates from, for example, Sweden and Norway are consistently superior to those of Scotland.
Trends in Perinatal Mortality in Scotland - a review over 30 years
9
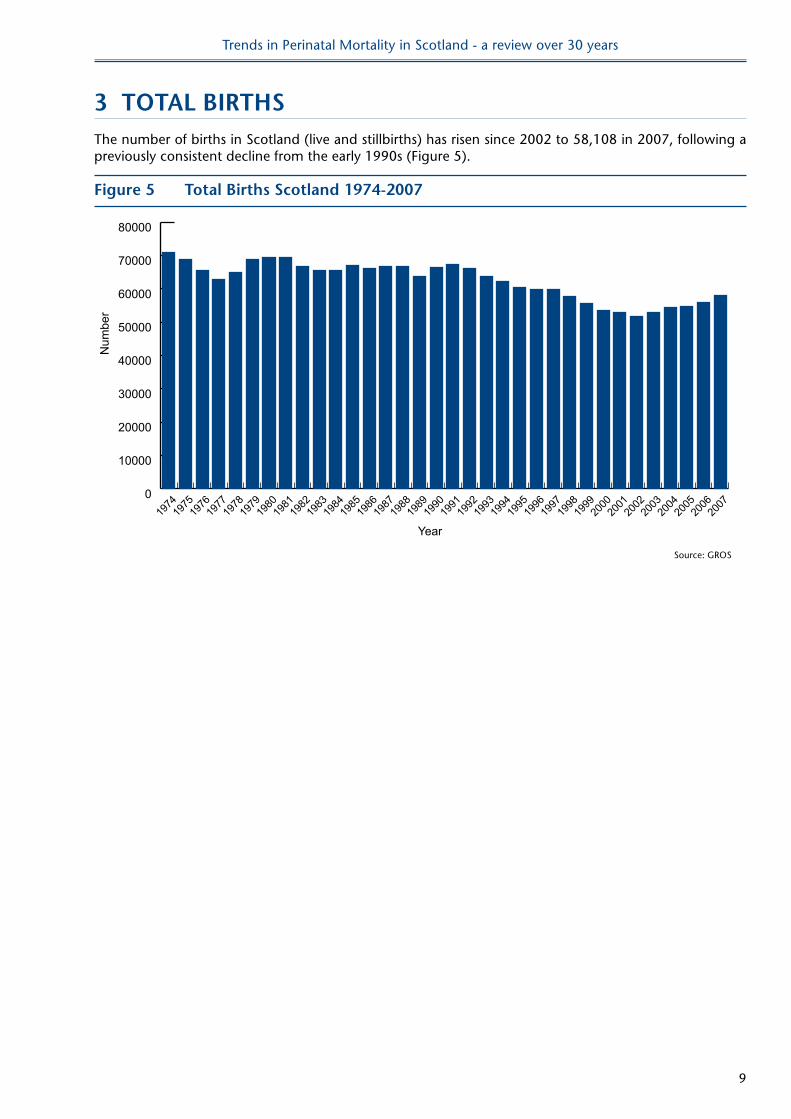
3 ToTAl BIRThSThe number of births in Scotland (live and stillbirths) has risen since 2002 to 58,108 in 2007, following a previously consistent decline from the early 1990s (Figure 5).
Figure 5 Total Births Scotland 1974-2007
0
10000
20000
30000
40000
50000
60000
70000
80000
2007
2006
2005
2004
2003
2002
2001
2000
1999
1998
1997
1996
1995
1994
1993
1992
1991
1990
1989
1988
1987
1986
1985
1984
1983
1982
1981
1980
1979
1978
1977
1976
1975
1974
Year
Num
ber
Source: GROS
Trends in Perinatal Mortality in Scotland - a review over 30 years
10
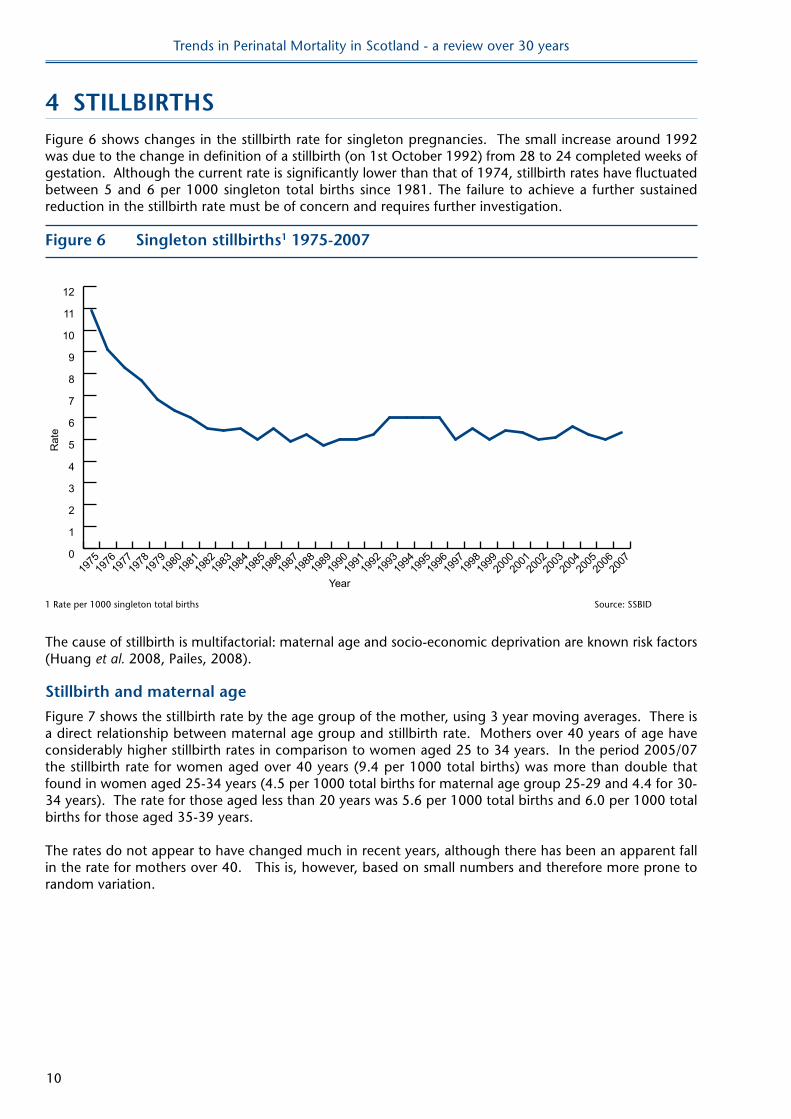
4 STIllBIRThSFigure 6 shows changes in the stillbirth rate for singleton pregnancies. The small increase around 1992 was due to the change in definition of a stillbirth (on 1st October 1992) from 28 to 24 completed weeks of gestation. Although the current rate is significantly lower than that of 1974, stillbirth rates have fluctuated between 5 and 6 per 1000 singleton total births since 1981. The failure to achieve a further sustained reduction in the stillbirth rate must be of concern and requires further investigation.
Figure 6 Singleton stillbirths1 1975-2007
Year
Rat
e
0
1
2
3
4
5
6
7
8
9
10
11
12
2007
2006
2005
2004
2003
2002
2001
2000
1999
1998
1997
1996
1995
1994
1993
1992
1991
1990
1989
1988
1987
1986
1985
1984
1983
1982
1981
1980
1979
1978
1977
1976
1975
1 Rate per 1000 singleton total births Source: SSBID
The cause of stillbirth is multifactorial: maternal age and socio-economic deprivation are known risk factors (Huang et al. 2008, Pailes, 2008).
Stillbirth and maternal age
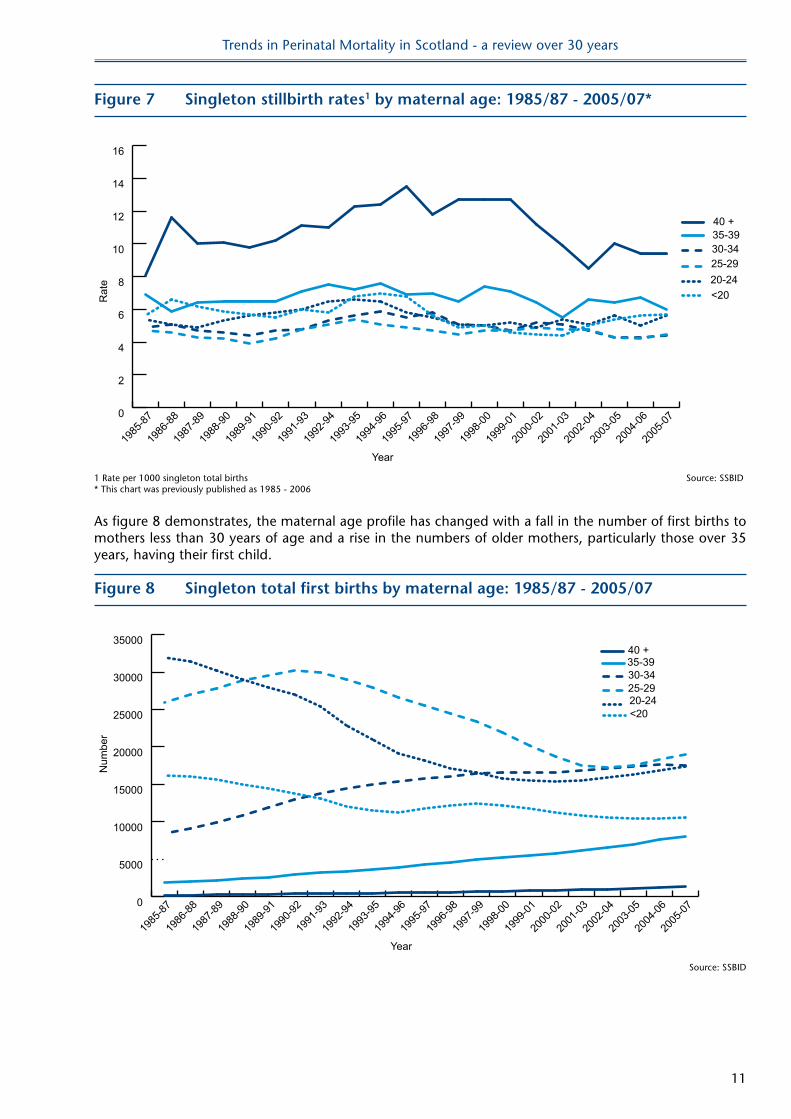
Figure 7 shows the stillbirth rate by the age group of the mother, using 3 year moving averages. There is a direct relationship between maternal age group and stillbirth rate. Mothers over 40 years of age have considerably higher stillbirth rates in comparison to women aged 25 to 34 years. In the period 2005/07 the stillbirth rate for women aged over 40 years (9.4 per 1000 total births) was more than double that found in women aged 25-34 years (4.5 per 1000 total births for maternal age group 25-29 and 4.4 for 30-34 years). The rate for those aged less than 20 years was 5.6 per 1000 total births and 6.0 per 1000 total births for those aged 35-39 years.
The rates do not appear to have changed much in recent years, although there has been an apparent fall in the rate for mothers over 40. This is, however, based on small numbers and therefore more prone to random variation.
Trends in Perinatal Mortality in Scotland - a review over 30 years
11
Figure 7 Singleton stillbirth rates1 by maternal age: 1985/87 - 2005/07*
Year
Rat
e
0
2
4
6
8
10
12
14
16
40 +35-3930-3425-2920-24<20
2005
-07
2004
-06
2003
-05
2002
-04
2001
-03
2000
-02
1999
-01
1998
-00
1997
-99
1996
-98
1995
-97
1994
-96
1993
-95
1992
-94
1991
-93
1990
-92
1989
-91
1988
-90
1987
-89
1986
-88
1985
-87
1 Rate per 1000 singleton total births Source: SSBID* This chart was previously published as 1985 - 2006
As figure 8 demonstrates, the maternal age profile has changed with a fall in the number of first births to mothers less than 30 years of age and a rise in the numbers of older mothers, particularly those over 35 years, having their first child.
Figure 8 Singleton total first births by maternal age: 1985/87 - 2005/07
Year
Num
ber
0
5000
10000
15000
20000
25000
30000
3500040 +35-3930-3425-2920-24<20
2005
-07
2004
-06
2003
-05
2002
-04
2001
-03
2000
-02
1999
-01
1998
-00
1997
-99
1996
-98
1995
-97
1994
-96
1993
-95
1992
-94
1991
-93
1990
-92
1989
-91
1988
-90
1987
-89
1986
-88
1985
-87
Source: SSBID
Trends in Perinatal Mortality in Scotland - a review over 30 years
12
Stillbirth and deprivation
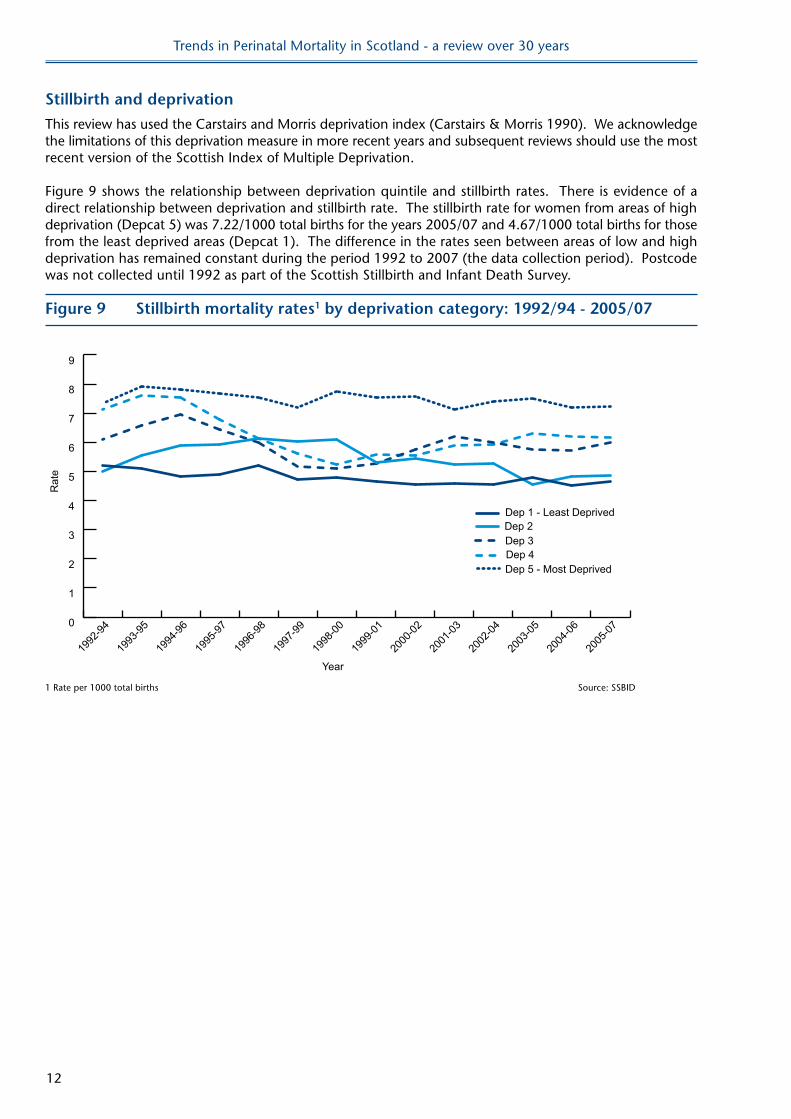
This review has used the Carstairs and Morris deprivation index (Carstairs & Morris 1990). We acknowledge the limitations of this deprivation measure in more recent years and subsequent reviews should use the most recent version of the Scottish Index of Multiple Deprivation.
Figure 9 shows the relationship between deprivation quintile and stillbirth rates. There is evidence of a direct relationship between deprivation and stillbirth rate. The stillbirth rate for women from areas of high deprivation (Depcat 5) was 7.22/1000 total births for the years 2005/07 and 4.67/1000 total births for those from the least deprived areas (Depcat 1). The difference in the rates seen between areas of low and high deprivation has remained constant during the period 1992 to 2007 (the data collection period). Postcode was not collected until 1992 as part of the Scottish Stillbirth and Infant Death Survey.
Figure 9 Stillbirth mortality rates1 by deprivation category: 1992/94 - 2005/07
Year
Rat
e
0
1
2
3
4
5
6
7
8
9
Dep 5 - Most DeprivedDep 4Dep 3Dep 2Dep 1 - Least Deprived
2005
-07
2004
-06
2003
-05
2002
-04
2001
-03
2000
-02
1999
-01
1998
-00
1997
-99
1996
-98
1995
-97
1994
-96
1993
-95
1992
-94
1 Rate per 1000 total births Source: SSBID
Trends in Perinatal Mortality in Scotland - a review over 30 years
13
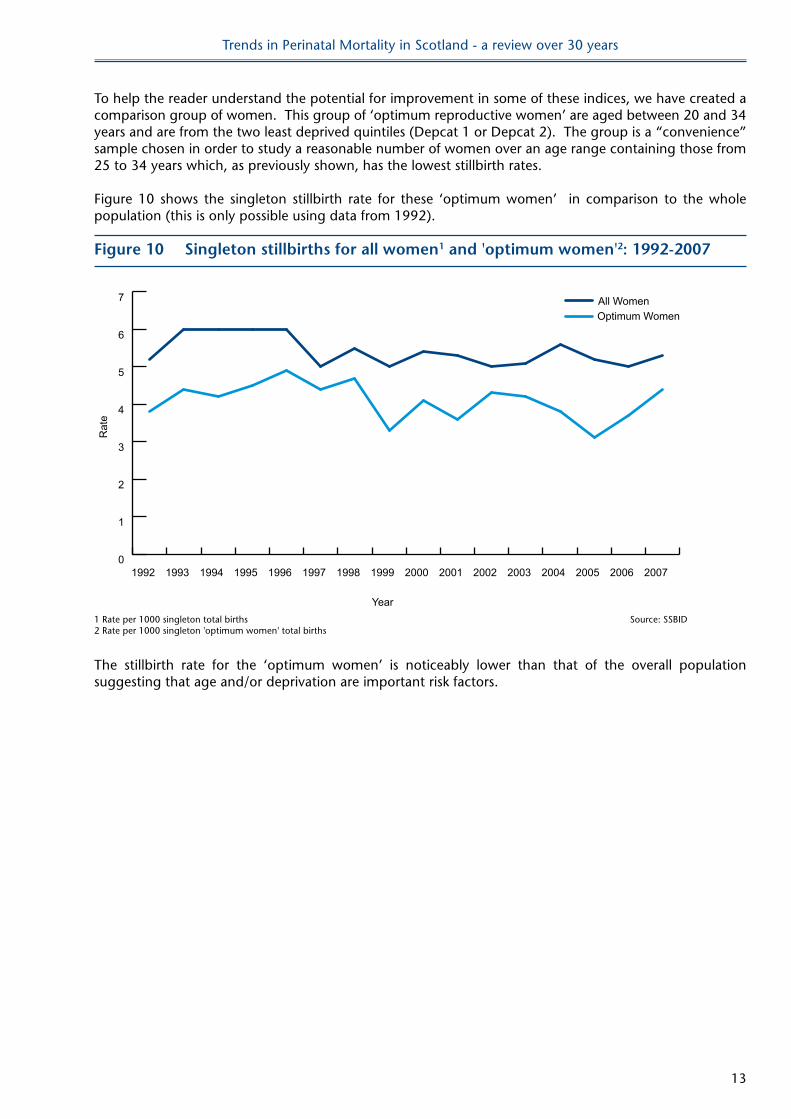
To help the reader understand the potential for improvement in some of these indices, we have created a comparison group of women. This group of ‘optimum reproductive women’ are aged between 20 and 34 years and are from the two least deprived quintiles (Depcat 1 or Depcat 2). The group is a “convenience” sample chosen in order to study a reasonable number of women over an age range containing those from 25 to 34 years which, as previously shown, has the lowest stillbirth rates.
Figure 10 shows the singleton stillbirth rate for these ‘optimum women’ in comparison to the whole population (this is only possible using data from 1992).
Figure 10 Singleton stillbirths for all women1 and 'optimum women'2: 1992-2007
Year
Rat
e
0
1
2
3
4
5
6
7
Optimum WomenAll Women
2007200620052004200320022001200019991998199719961995199419931992
1 Rate per 1000 singleton total births Source: SSBID 2 Rate per 1000 singleton 'optimum women' total births
The stillbirth rate for the ‘optimum women’ is noticeably lower than that of the overall population suggesting that age and/or deprivation are important risk factors.
Trends in Perinatal Mortality in Scotland - a review over 30 years
14
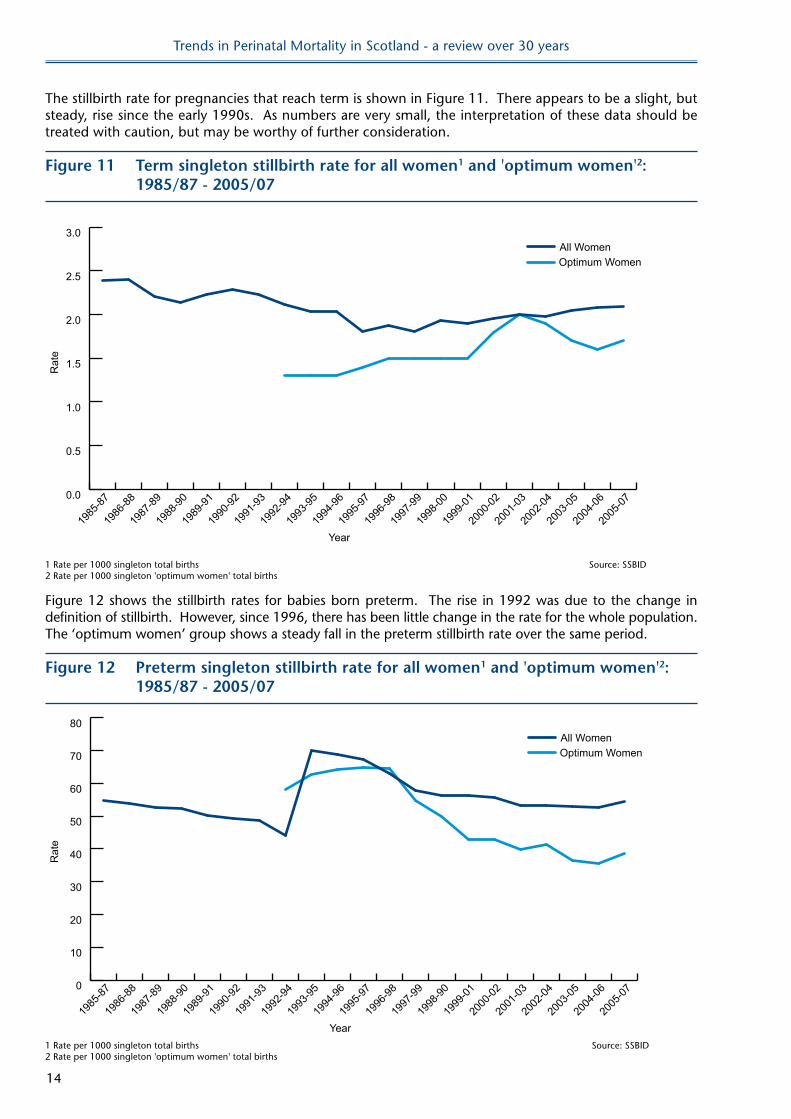
The stillbirth rate for pregnancies that reach term is shown in Figure 11. There appears to be a slight, but steady, rise since the early 1990s. As numbers are very small, the interpretation of these data should be treated with caution, but may be worthy of further consideration.
Figure 11 Term singleton stillbirth rate for all women1 and 'optimum women'2: 1985/87 - 2005/07
Year
Rat
e
0.0
0.5
1.0
1.5
2.0
2.5
3.0
2005
-07
2004
-06
2003
-05
2002
-04
2001
-03
2000
-02
1999
-01
1998
-00
1997
-99
1996
-98
1995
-97
1994
-96
1993
-95
1992
-94
1991
-93
1990
-92
1989
-91
1988
-90
1987
-89
1986
-88
1985
-87
Optimum WomenAll Women
1 Rate per 1000 singleton total births Source: SSBID2 Rate per 1000 singleton 'optimum women' total births
Figure 12 shows the stillbirth rates for babies born preterm. The rise in 1992 was due to the change in definition of stillbirth. However, since 1996, there has been little change in the rate for the whole population. The ‘optimum women’ group shows a steady fall in the preterm stillbirth rate over the same period.
Figure 12 Preterm singleton stillbirth rate for all women1 and 'optimum women'2: 1985/87 - 2005/07
Year
Rat
e
0
10
20
30
40
50
60
70
80
2005
-07
2004
-06
2003
-05
2002
-04
2001
-03
2000
-02
1999
-01
1998
-90
1997
-99
1996
-98
1995
-97
1994
-96
1993
-95
1992
-94
1991
-93
1990
-92
1989
-91
1988
-90
1987
-89
1986
-88
1985
-87
Optimum WomenAll Women
1 Rate per 1000 singleton total births Source: SSBID2 Rate per 1000 singleton 'optimum women' total births
Trends in Perinatal Mortality in Scotland - a review over 30 years
15
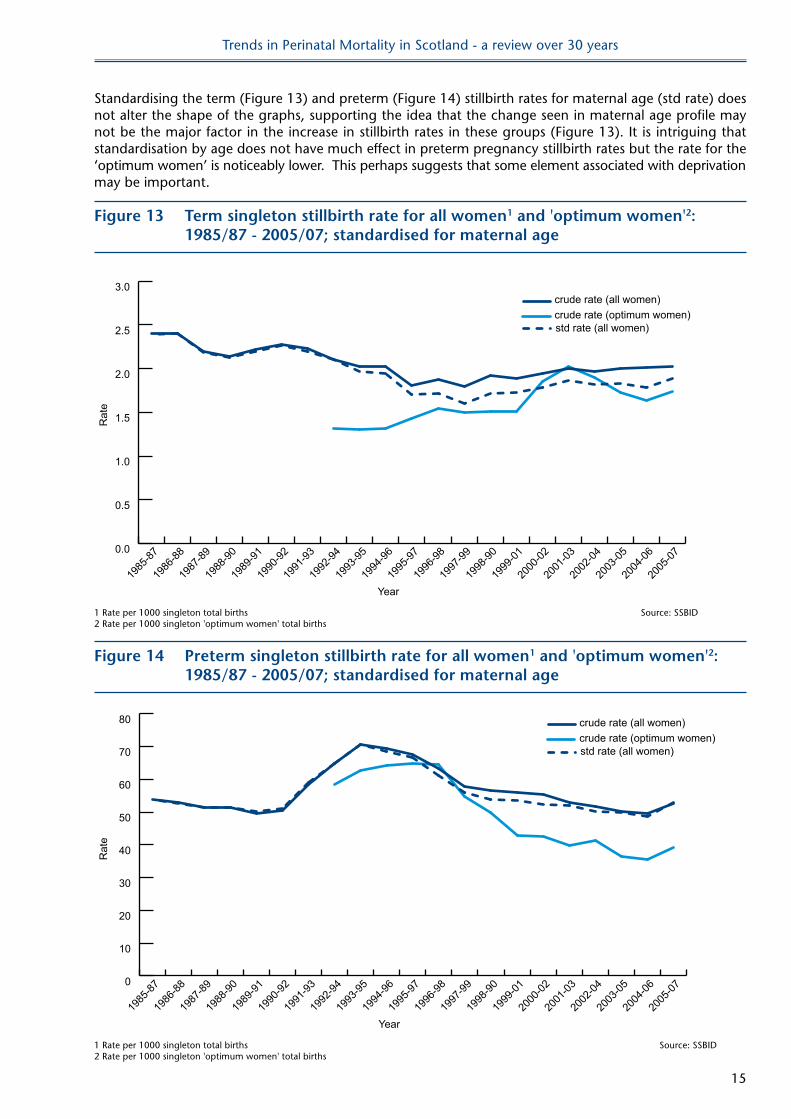
Standardising the term (Figure 13) and preterm (Figure 14) stillbirth rates for maternal age (std rate) does not alter the shape of the graphs, supporting the idea that the change seen in maternal age profile may not be the major factor in the increase in stillbirth rates in these groups (Figure 13). It is intriguing that standardisation by age does not have much effect in preterm pregnancy stillbirth rates but the rate for the ‘optimum women’ is noticeably lower. This perhaps suggests that some element associated with deprivation may be important.
Figure 13 Term singleton stillbirth rate for all women1 and 'optimum women'2: 1985/87 - 2005/07; standardised for maternal age
Year
Rat
e
0.0
0.5
1.0
1.5
2.0
2.5
3.0crude rate (all women)crude rate (optimum women)std rate (all women)
2005
-07
2004
-06
2003
-05
2002
-04
2001
-03
2000
-02
1999
-01
1998
-90
1997
-99
1996
-98
1995
-97
1994
-96
1993
-95
1992
-94
1991
-93
1990
-92
1989
-91
1988
-90
1987
-89
1986
-88
1985
-87
1 Rate per 1000 singleton total births Source: SSBID2 Rate per 1000 singleton 'optimum women' total births
Figure 14 Preterm singleton stillbirth rate for all women1 and 'optimum women'2: 1985/87 - 2005/07; standardised for maternal age
Year
Rat
e
0
10
20
30
40
50
60
70
80
2005
-07
2004
-06
2003
-05
2002
-04
2001
-03
2000
-02
1999
-01
1998
-90
1997
-99
1996
-98
1995
-97
1994
-96
1993
-95
1992
-94
1991
-93
1990
-92
1989
-91
1988
-90
1987
-89
1986
-88
1985
-87
crude rate (all women)crude rate (optimum women)std rate (all women)
1 Rate per 1000 singleton total births Source: SSBID2 Rate per 1000 singleton 'optimum women' total births
Trends in Perinatal Mortality in Scotland - a review over 30 years
16
Although the changes are small, these are population data and the steady rise in the term stillbirth rate since the mid 1990s has to be of concern. This perhaps should not be dismissed as chance finding due to small numbers.
The complex interactions of the many factors involved in the aetiology of stillbirth need further investigation. In particular the effect of changes in maternal age and its interaction with deprivation must be explored. The stillbirth rate needs to be monitored closely and a lack of year on year rise should not be accepted as an indication of success.
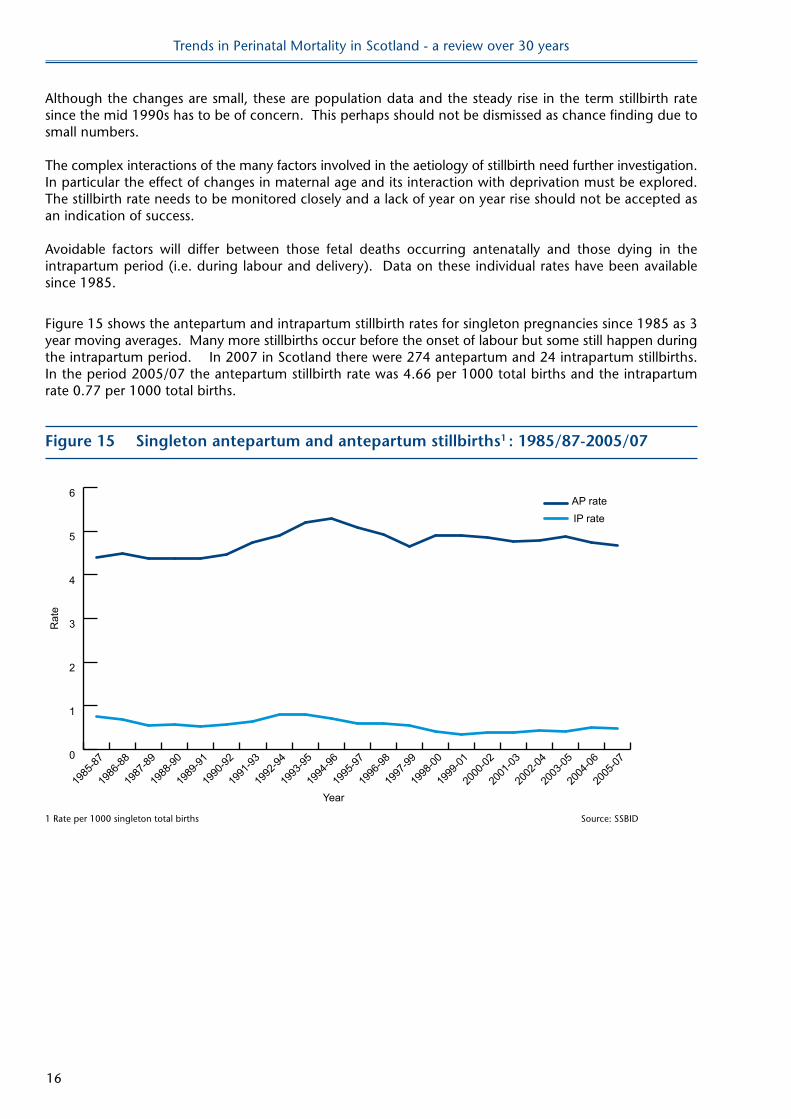
Avoidable factors will differ between those fetal deaths occurring antenatally and those dying in the intrapartum period (i.e. during labour and delivery). Data on these individual rates have been available since 1985.
Figure 15 shows the antepartum and intrapartum stillbirth rates for singleton pregnancies since 1985 as 3 year moving averages. Many more stillbirths occur before the onset of labour but some still happen during the intrapartum period. In 2007 in Scotland there were 274 antepartum and 24 intrapartum stillbirths. In the period 2005/07 the antepartum stillbirth rate was 4.66 per 1000 total births and the intrapartum rate 0.77 per 1000 total births.
Figure 15 Singleton antepartum and antepartum stillbirths1 : 1985/87-2005/07
Year
Rat
e
0
1
2
3
4
5
6
IP rateAP rate
2005
-07
2004
-06
2003
-05
2002
-04
2001
-03
2000
-02
1999
-01
1998
-00
1997
-99
1996
-98
1995
-97
1994
-96
1993
-95
1992
-94
1991
-93
1990
-92
1989
-91
1988
-90
1987
-89
1986
-88
1985
-87
1 Rate per 1000 singleton total births Source: SSBID
Trends in Perinatal Mortality in Scotland - a review over 30 years
17
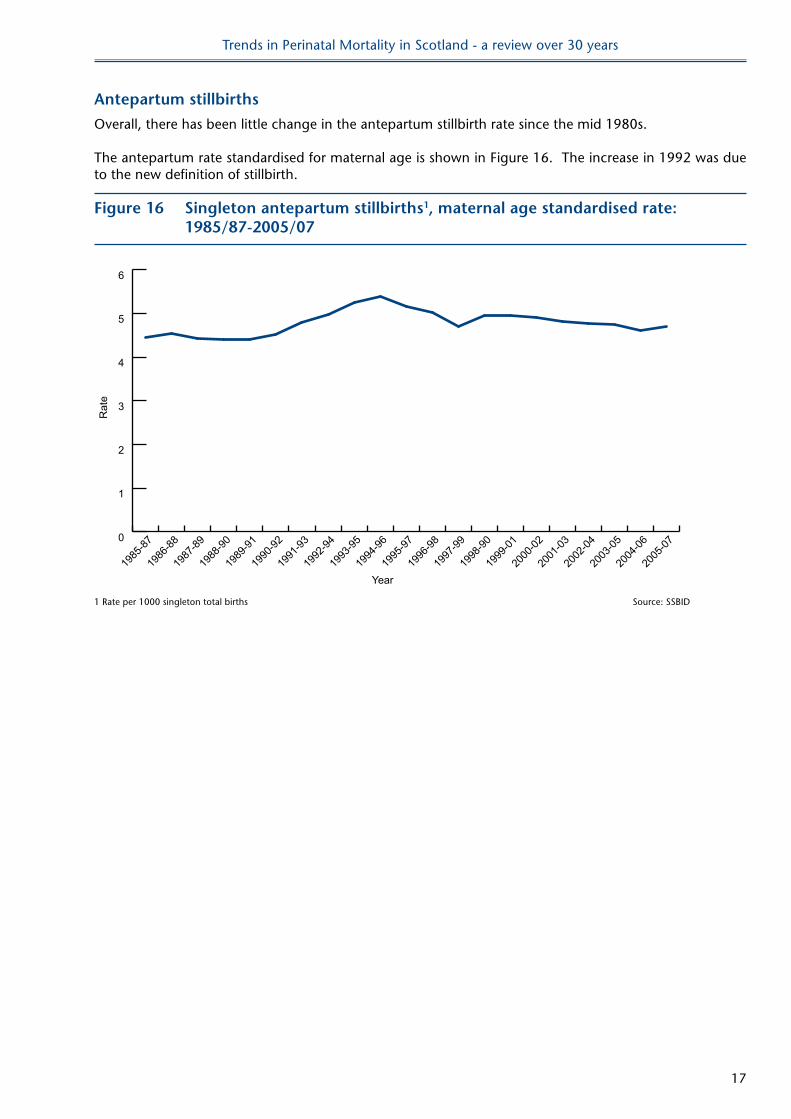
Antepartum stillbirths
Overall, there has been little change in the antepartum stillbirth rate since the mid 1980s.
The antepartum rate standardised for maternal age is shown in Figure 16. The increase in 1992 was due to the new definition of stillbirth.
Figure 16 Singleton antepartum stillbirths1, maternal age standardised rate: 1985/87-2005/07
Year
Rat
e
0
1
2
3
4
5
6
2005
-07
2004
-06
2003
-05
2002
-04
2001
-03
2000
-02
1999
-01
1998
-90
1997
-99
1996
-98
1995
-97
1994
-96
1993
-95
1992
-94
1991
-93
1990
-92
1989
-91
1988
-90
1987
-89
1986
-88
1985
-87
1 Rate per 1000 singleton total births Source: SSBID
Trends in Perinatal Mortality in Scotland - a review over 30 years
18
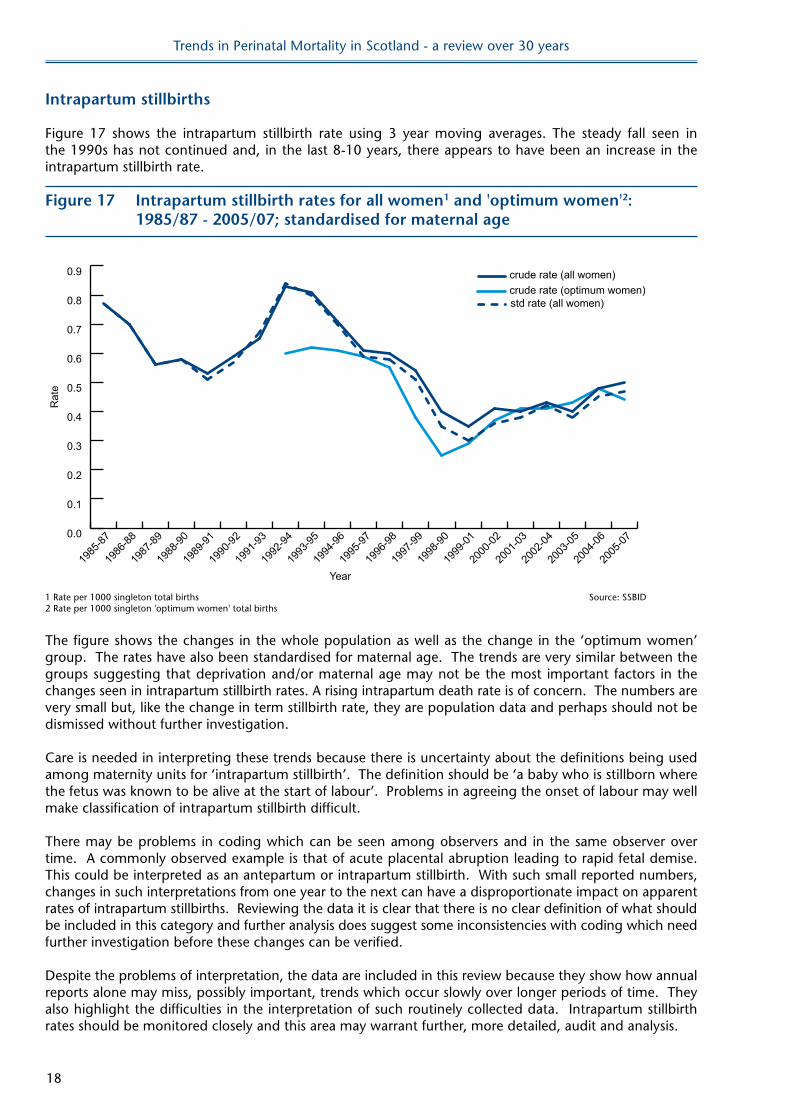
Intrapartum stillbirths
Figure 17 shows the intrapartum stillbirth rate using 3 year moving averages. The steady fall seen in the 1990s has not continued and, in the last 8-10 years, there appears to have been an increase in the intrapartum stillbirth rate.
Figure 17 Intrapartum stillbirth rates for all women1 and 'optimum women'2: 1985/87 - 2005/07; standardised for maternal age
Year
Rat
e
0.0
0.1
0.2
0.3
0.4
0.5
0.6
0.7
0.8
0.9
2005
-07
2004
-06
2003
-05
2002
-04
2001
-03
2000
-02
1999
-01
1998
-90
1997
-99
1996
-98
1995
-97
1994
-96
1993
-95
1992
-94
1991
-93
1990
-92
1989
-91
1988
-90
1987
-89
1986
-88
1985
-87
crude rate (all women)crude rate (optimum women)std rate (all women)
1 Rate per 1000 singleton total births Source: SSBID2 Rate per 1000 singleton 'optimum women' total births
The figure shows the changes in the whole population as well as the change in the ‘optimum women’ group. The rates have also been standardised for maternal age. The trends are very similar between the groups suggesting that deprivation and/or maternal age may not be the most important factors in the changes seen in intrapartum stillbirth rates. A rising intrapartum death rate is of concern. The numbers are very small but, like the change in term stillbirth rate, they are population data and perhaps should not be dismissed without further investigation.
Care is needed in interpreting these trends because there is uncertainty about the definitions being used among maternity units for ‘intrapartum stillbirth’. The definition should be ‘a baby who is stillborn where the fetus was known to be alive at the start of labour’. Problems in agreeing the onset of labour may well make classification of intrapartum stillbirth difficult.
There may be problems in coding which can be seen among observers and in the same observer over time. A commonly observed example is that of acute placental abruption leading to rapid fetal demise. This could be interpreted as an antepartum or intrapartum stillbirth. With such small reported numbers, changes in such interpretations from one year to the next can have a disproportionate impact on apparent rates of intrapartum stillbirths. Reviewing the data it is clear that there is no clear definition of what should be included in this category and further analysis does suggest some inconsistencies with coding which need further investigation before these changes can be verified.
Despite the problems of interpretation, the data are included in this review because they show how annual reports alone may miss, possibly important, trends which occur slowly over longer periods of time. They also highlight the difficulties in the interpretation of such routinely collected data. Intrapartum stillbirth rates should be monitored closely and this area may warrant further, more detailed, audit and analysis.
Trends in Perinatal Mortality in Scotland - a review over 30 years
19
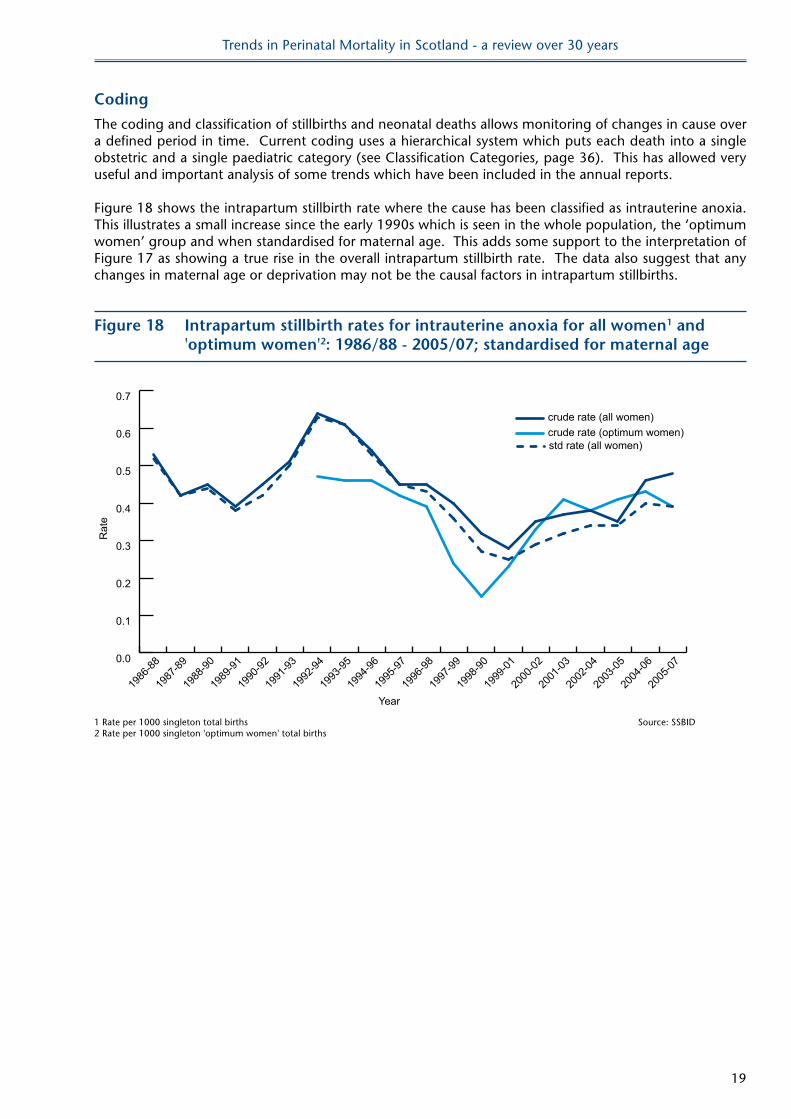
Coding
The coding and classification of stillbirths and neonatal deaths allows monitoring of changes in cause over a defined period in time. Current coding uses a hierarchical system which puts each death into a single obstetric and a single paediatric category (see Classification Categories, page 36). This has allowed very useful and important analysis of some trends which have been included in the annual reports.
Figure 18 shows the intrapartum stillbirth rate where the cause has been classified as intrauterine anoxia. This illustrates a small increase since the early 1990s which is seen in the whole population, the ‘optimum women’ group and when standardised for maternal age. This adds some support to the interpretation of Figure 17 as showing a true rise in the overall intrapartum stillbirth rate. The data also suggest that any changes in maternal age or deprivation may not be the causal factors in intrapartum stillbirths.
Figure 18 Intrapartum stillbirth rates for intrauterine anoxia for all women1 and 'optimum women'2: 1986/88 - 2005/07; standardised for maternal age
Year
Rat
e
0.0
0.1
0.2
0.3
0.4
0.5
0.6
0.7
2005
-07
2004
-06
2003
-05
2002
-04
2001
-03
2000
-02
1999
-01
1998
-90
1997
-99
1996
-98
1995
-97
1994
-96
1993
-95
1992
-94
1991
-93
1990
-92
1989
-91
1988
-90
1987
-89
1986
-88
crude rate (all women)crude rate (optimum women)std rate (all women)
1 Rate per 1000 singleton total births Source: SSBID2 Rate per 1000 singleton 'optimum women' total births
Trends in Perinatal Mortality in Scotland - a review over 30 years
20
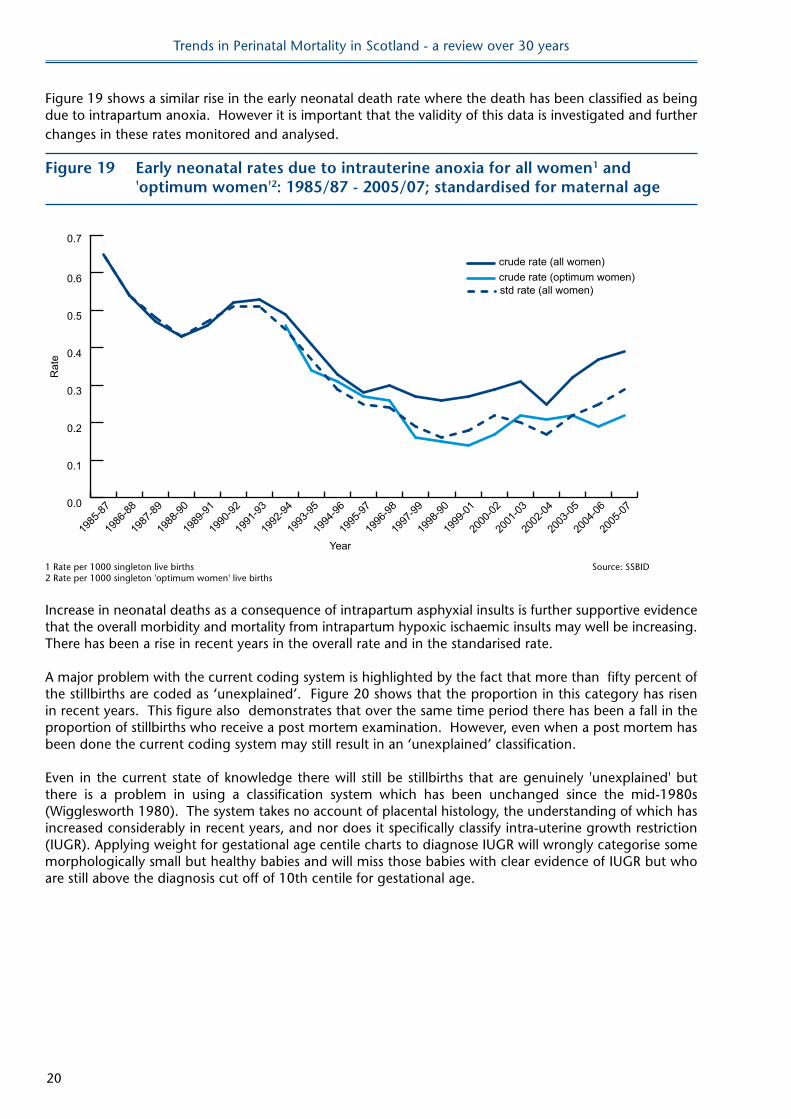
Figure 19 shows a similar rise in the early neonatal death rate where the death has been classified as being due to intrapartum anoxia. However it is important that the validity of this data is investigated and further changes in these rates monitored and analysed.
Figure 19 early neonatal rates due to intrauterine anoxia for all women1 and 'optimum women'2: 1985/87 - 2005/07; standardised for maternal age
Year
Rat
e
0.0
0.1
0.2
0.3
0.4
0.5
0.6
2005
-07
2004
-06
2003
-05
2002
-04
2001
-03
2000
-02
1999
-01
1998
-90
1997
-99
1996
-98
1995
-97
1994
-96
1993
-95
1992
-94
1991
-93
1990
-92
1989
-91
1988
-90
1987
-89
1986
-88
1985
-87
crude rate (all women)crude rate (optimum women)std rate (all women)
0.7
1 Rate per 1000 singleton live births Source: SSBID2 Rate per 1000 singleton 'optimum women' live births
Increase in neonatal deaths as a consequence of intrapartum asphyxial insults is further supportive evidence that the overall morbidity and mortality from intrapartum hypoxic ischaemic insults may well be increasing. There has been a rise in recent years in the overall rate and in the standarised rate.
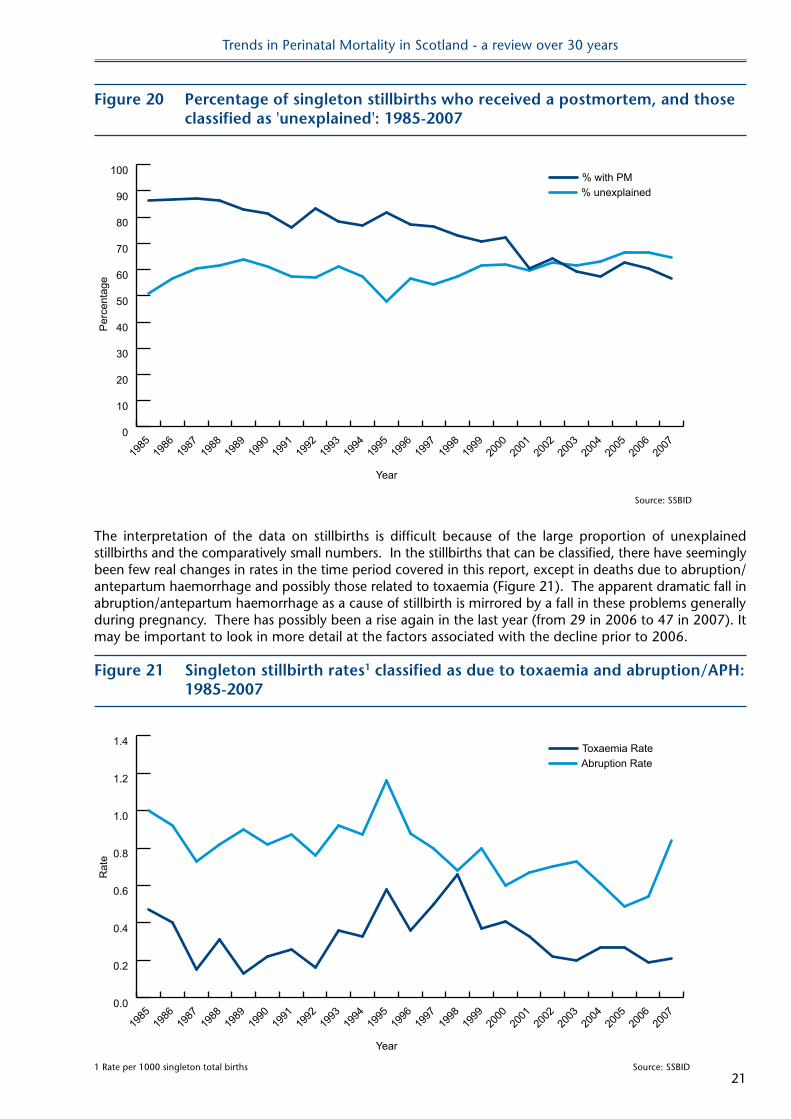
A major problem with the current coding system is highlighted by the fact that more than fifty percent of the stillbirths are coded as ‘unexplained’. Figure 20 shows that the proportion in this category has risen in recent years. This figure also demonstrates that over the same time period there has been a fall in the proportion of stillbirths who receive a post mortem examination. However, even when a post mortem has been done the current coding system may still result in an ‘unexplained’ classification.
Even in the current state of knowledge there will still be stillbirths that are genuinely 'unexplained' but there is a problem in using a classification system which has been unchanged since the mid-1980s (Wigglesworth 1980). The system takes no account of placental histology, the understanding of which has increased considerably in recent years, and nor does it specifically classify intra-uterine growth restriction (IUGR). Applying weight for gestational age centile charts to diagnose IUGR will wrongly categorise some morphologically small but healthy babies and will miss those babies with clear evidence of IUGR but who are still above the diagnosis cut off of 10th centile for gestational age.
Trends in Perinatal Mortality in Scotland - a review over 30 years
21
Figure 20 Percentage of singleton stillbirths who received a postmortem, and those classified as 'unexplained': 1985-2007
Year
Per
cent
age
0
10
20
30
40
50
60
70
80
90
100
2007
2006
2005
2004
2003
2002
2001
2000
1999
1998
1997
1996
1995
1994
1993
1992
1991
1990
1989
1988
1987
1986
1985
% unexplained% with PM
Source: SSBID
The interpretation of the data on stillbirths is difficult because of the large proportion of unexplained stillbirths and the comparatively small numbers. In the stillbirths that can be classified, there have seemingly been few real changes in rates in the time period covered in this report, except in deaths due to abruption/antepartum haemorrhage and possibly those related to toxaemia (Figure 21). The apparent dramatic fall in abruption/antepartum haemorrhage as a cause of stillbirth is mirrored by a fall in these problems generally during pregnancy. There has possibly been a rise again in the last year (from 29 in 2006 to 47 in 2007). It may be important to look in more detail at the factors associated with the decline prior to 2006.
Figure 21 Singleton stillbirth rates1 classified as due to toxaemia and abruption/APh: 1985-2007
Year
Rat
e
0.0
0.2
0.4
0.6
0.8
1.0
1.2
1.4
2007
2006
2005
2004
2003
2002
2001
2000
1999
1998
1997
1996
1995
1994
1993
1992
1991
1990
1989
1988
1987
1986
1985
Abruption RateToxaemia Rate
1 Rate per 1000 singleton total births Source: SSBID
Trends in Perinatal Mortality in Scotland - a review over 30 years
22
Paediatric classification
Stillbirths, and neonatal deaths, are also given a paediatric classification (see Classification Categories, page 36). Congenital abnormality remains a major paediatric classification of death but the stillbirth rate for this group has not changed in recent years.
Using the paediatric classification, most stillbirths are classified as showing signs of ‘antepartum anoxia’ or ‘intrapartum anoxia’. These are very non-specific labels.
The recent increase in the number of stillbirths classified as intrapartum anoxia has already been discussed.
It is clear the current system of coding now gives insufficient information to allow meaningful comparisons. In particular too many stillbirths are being classified as ‘unexplained’. There is a need to review the coding categories to include more extensive information available from post mortem and placental analysis. It is important to keep to a standardised coding scheme that will allow comparisons with other countries. The work to review and extend the coding systems has already been started.
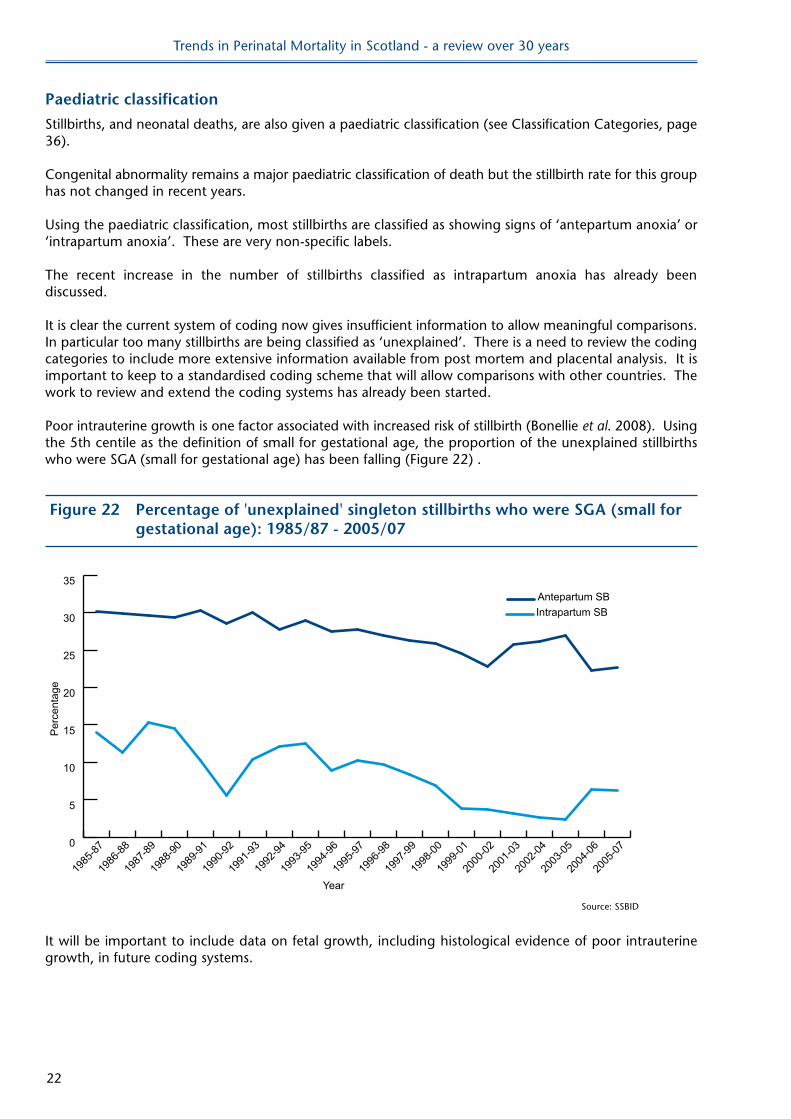
Poor intrauterine growth is one factor associated with increased risk of stillbirth (Bonellie et al. 2008). Using the 5th centile as the definition of small for gestational age, the proportion of the unexplained stillbirths who were SGA (small for gestational age) has been falling (Figure 22) .
Figure 22 Percentage of 'unexplained' singleton stillbirths who were SGA (small for gestational age): 1985/87 - 2005/07
Year
Per
cent
age
0
5
10
15
20
25
30
35
Intrapartum SBAntepartum SB
2005
-07
2004
-06
2003
-05
2002
-04
2001
-03
2000
-02
1999
-01
1998
-00
1997
-99
1996
-98
1995
-97
1994
-96
1993
-95
1992
-94
1991
-93
1990
-92
1989
-91
1988
-90
1987
-89
1986
-88
1985
-87
Source: SSBID
It will be important to include data on fetal growth, including histological evidence of poor intrauterine growth, in future coding systems.
Trends in Perinatal Mortality in Scotland - a review over 30 years
23
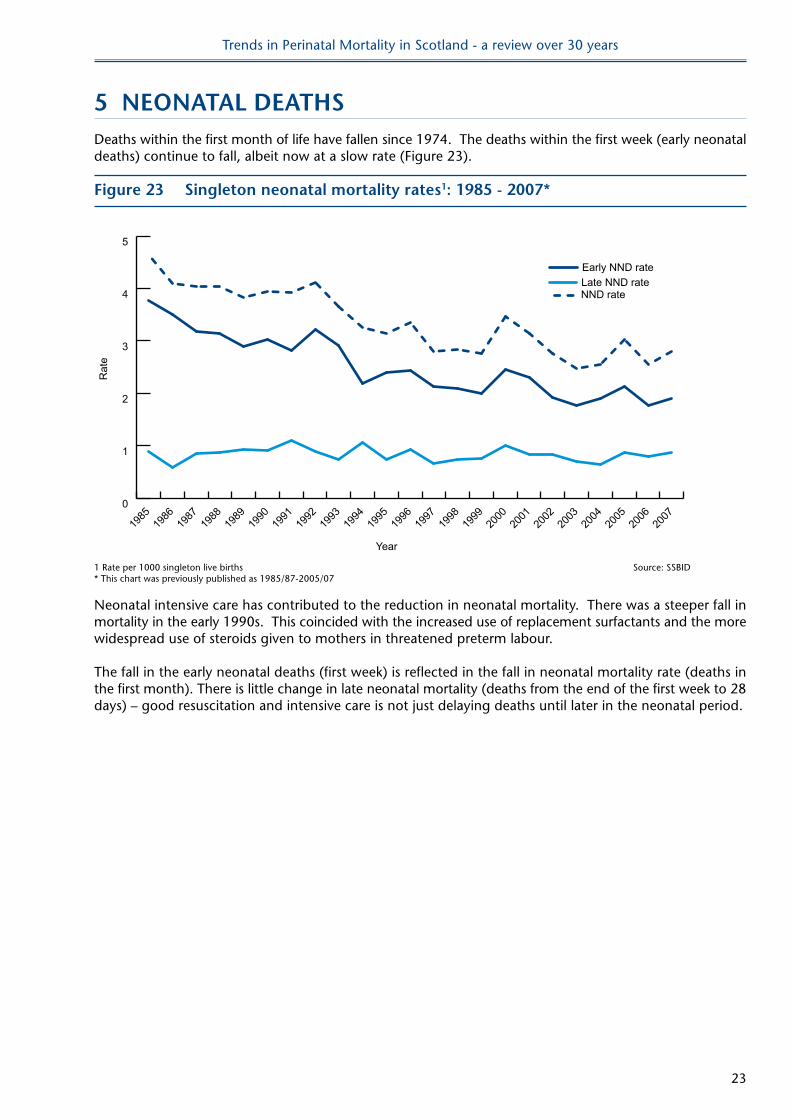
5 neonATAl DeAThSDeaths within the first month of life have fallen since 1974. The deaths within the first week (early neonatal deaths) continue to fall, albeit now at a slow rate (Figure 23).
Figure 23 Singleton neonatal mortality rates1: 1985 - 2007*
Year
Rat
e
0
1
2
3
4
5
NND rate
2007
2006
2005
2004
2003
2002
2001
2000
1999
1998
1997
1996
1995
1994
1993
1992
1991
1990
1989
1988
1987
1986
1985
Late NND rateEarly NND rate
1 Rate per 1000 singleton live births Source: SSBID* This chart was previously published as 1985/87-2005/07
Neonatal intensive care has contributed to the reduction in neonatal mortality. There was a steeper fall in mortality in the early 1990s. This coincided with the increased use of replacement surfactants and the more widespread use of steroids given to mothers in threatened preterm labour.
The fall in the early neonatal deaths (first week) is reflected in the fall in neonatal mortality rate (deaths in the first month). There is little change in late neonatal mortality (deaths from the end of the first week to 28 days) – good resuscitation and intensive care is not just delaying deaths until later in the neonatal period.
Trends in Perinatal Mortality in Scotland - a review over 30 years
24
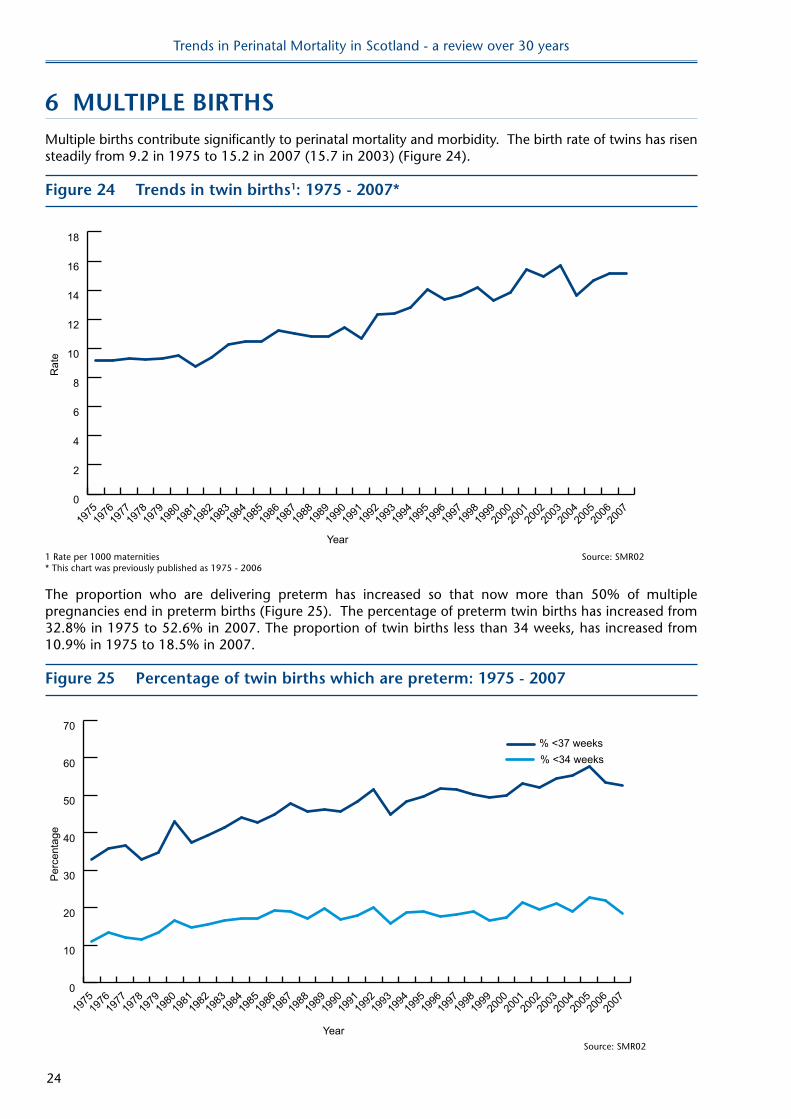
6 MUlTIPle BIRThSMultiple births contribute significantly to perinatal mortality and morbidity. The birth rate of twins has risen steadily from 9.2 in 1975 to 15.2 in 2007 (15.7 in 2003) (Figure 24).
Figure 24 Trends in twin births1: 1975 - 2007*
Year
Rat
e
0
2
4
6
8
10
12
14
16
18
2007
2006
2005
2004
2003
2002
2001
2000
1999
1998
1997
1996
1995
1994
1993
1992
1991
1990
1989
1988
1987
1986
1985
1984
1983
1982
1981
1980
1979
1978
1977
1976
1975
1 Rate per 1000 maternities Source: SMR02* This chart was previously published as 1975 - 2006
The proportion who are delivering preterm has increased so that now more than 50% of multiple pregnancies end in preterm births (Figure 25). The percentage of preterm twin births has increased from 32.8% in 1975 to 52.6% in 2007. The proportion of twin births less than 34 weeks, has increased from 10.9% in 1975 to 18.5% in 2007.
Figure 25 Percentage of twin births which are preterm: 1975 - 2007
Year
Per
cent
age
0
10
20
30
40
50
60
70% <37 weeks% <34 weeks
2007
2006
2005
2004
2003
2002
2001
2000
1999
1998
1997
1996
1995
1994
1993
1992
1991
1990
1989
1988
1987
1986
1985
1984
1983
1982
1981
1980
1979
1978
1977
1976
1975
Source: SMR02
Trends in Perinatal Mortality in Scotland - a review over 30 years
25
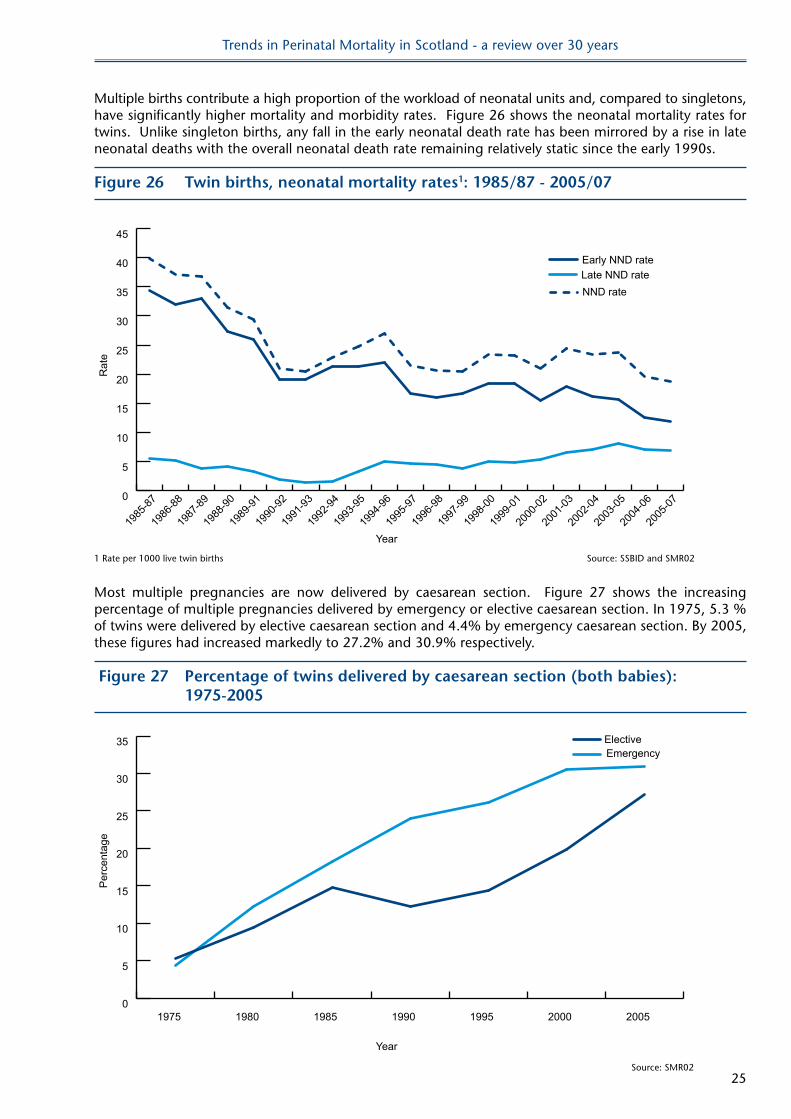
Multiple births contribute a high proportion of the workload of neonatal units and, compared to singletons, have significantly higher mortality and morbidity rates. Figure 26 shows the neonatal mortality rates for twins. Unlike singleton births, any fall in the early neonatal death rate has been mirrored by a rise in late neonatal deaths with the overall neonatal death rate remaining relatively static since the early 1990s.
Figure 26 Twin births, neonatal mortality rates1: 1985/87 - 2005/07
Year
Rat
e
0
5
10
15
20
25
30
35
40
45
NND rate
2005
-07
2004
-06
2003
-05
2002
-04
2001
-03
2000
-02
1999
-01
1998
-00
1997
-99
1996
-98
1995
-97
1994
-96
1993
-95
1992
-94
1991
-93
1990
-92
1989
-91
1988
-90
1987
-89
1986
-88
1985
-87
Late NND rateEarly NND rate
1 Rate per 1000 live twin births Source: SSBID and SMR02
Most multiple pregnancies are now delivered by caesarean section. Figure 27 shows the increasing percentage of multiple pregnancies delivered by emergency or elective caesarean section. In 1975, 5.3 % of twins were delivered by elective caesarean section and 4.4% by emergency caesarean section. By 2005, these figures had increased markedly to 27.2% and 30.9% respectively.
Figure 27 Percentage of twins delivered by caesarean section (both babies): 1975-2005
Year
Per
cent
age
0
5
10
15
20
25
30
35EmergencyElective
2005200019951990198519801975
Source: SMR02
Trends in Perinatal Mortality in Scotland - a review over 30 years
26
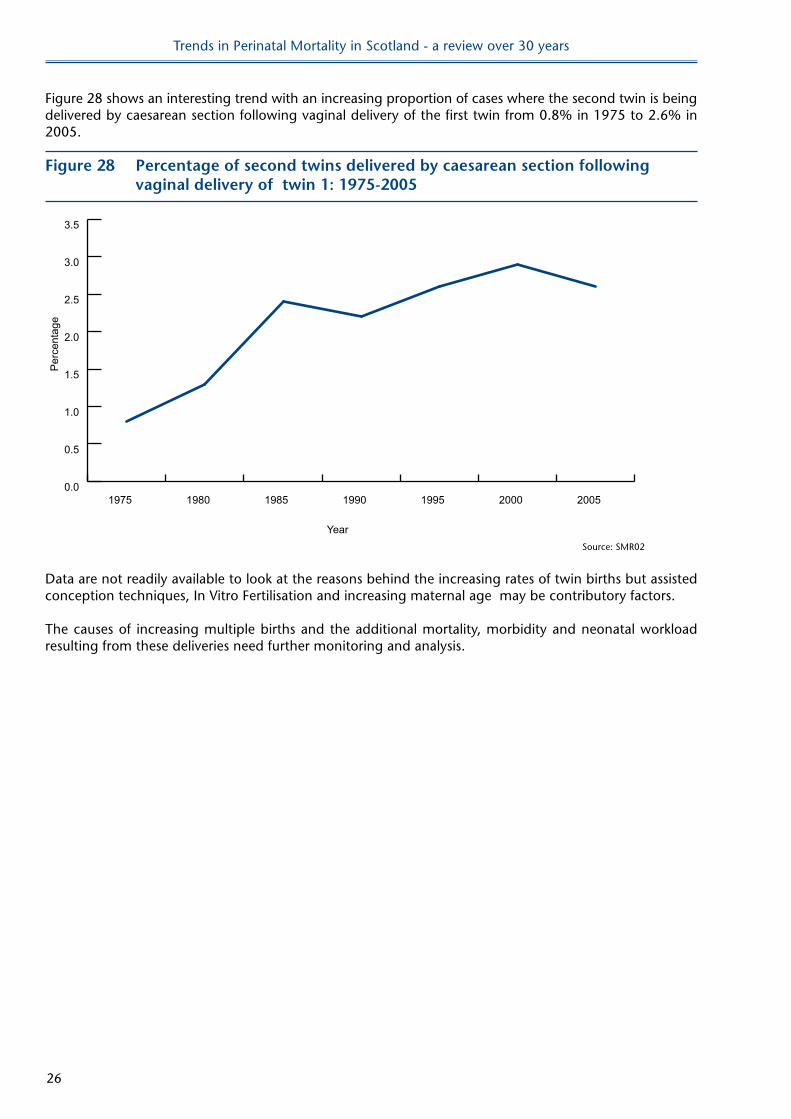
Figure 28 shows an interesting trend with an increasing proportion of cases where the second twin is being delivered by caesarean section following vaginal delivery of the first twin from 0.8% in 1975 to 2.6% in 2005.
Figure 28 Percentage of second twins delivered by caesarean section following vaginal delivery of twin 1: 1975-2005
Year
Per
cent
age
0.0
0.5
1.0
1.5
2.0
2.5
3.0
3.5
2005200019951990198519801975
Source: SMR02
Data are not readily available to look at the reasons behind the increasing rates of twin births but assisted conception techniques, In Vitro Fertilisation and increasing maternal age may be contributory factors.
The causes of increasing multiple births and the additional mortality, morbidity and neonatal workload resulting from these deliveries need further monitoring and analysis.
Trends in Perinatal Mortality in Scotland - a review over 30 years
27
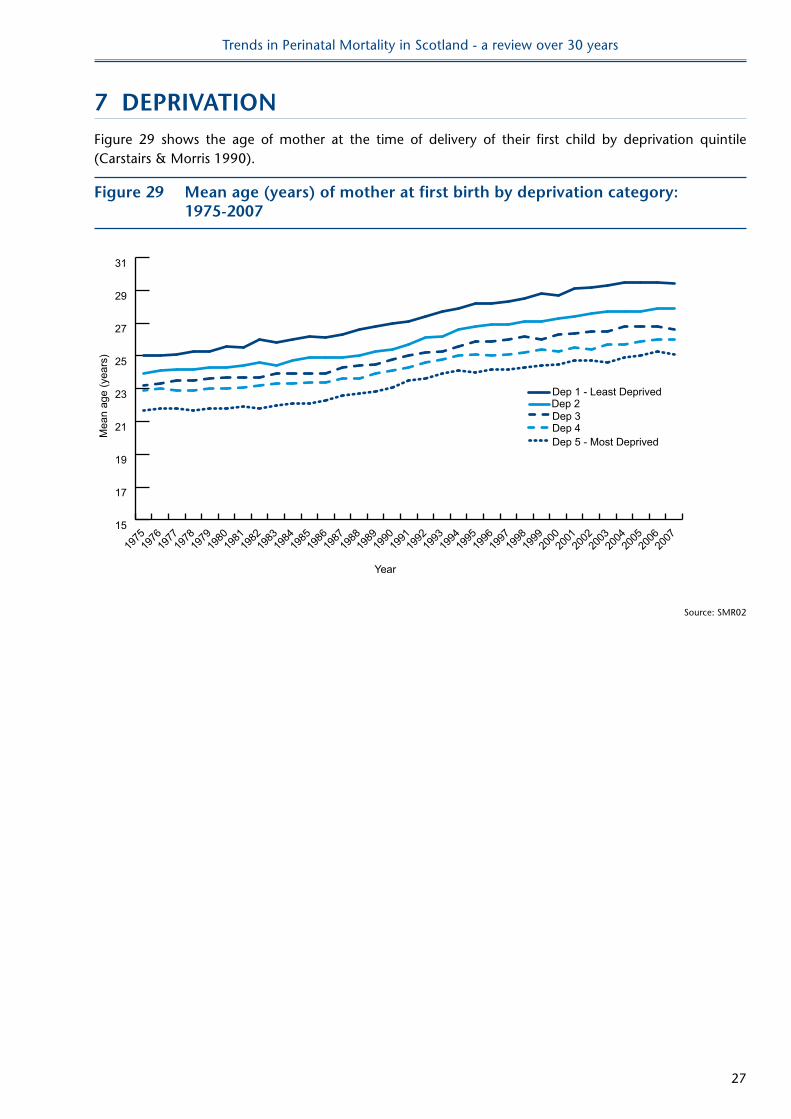
7 DePRIvATIonFigure 29 shows the age of mother at the time of delivery of their first child by deprivation quintile (Carstairs & Morris 1990).
Figure 29 Mean age (years) of mother at first birth by deprivation category: 1975-2007
Year
Mea
n ag
e (y
ears
)
15
17
19
21
23
25
27
29
31
Dep 5 - Most DeprivedDep 4Dep 3Dep 2Dep 1 - Least Deprived
2007
2006
2005
2004
2003
2002
2001
2000
1999
1998
1997
1996
1995
1994
1993
1992
1991
1990
1989
1988
1987
1986
1985
1984
1983
1982
1981
1980
1979
1978
1977
1976
1975
Source: SMR02
Trends in Perinatal Mortality in Scotland - a review over 30 years
28
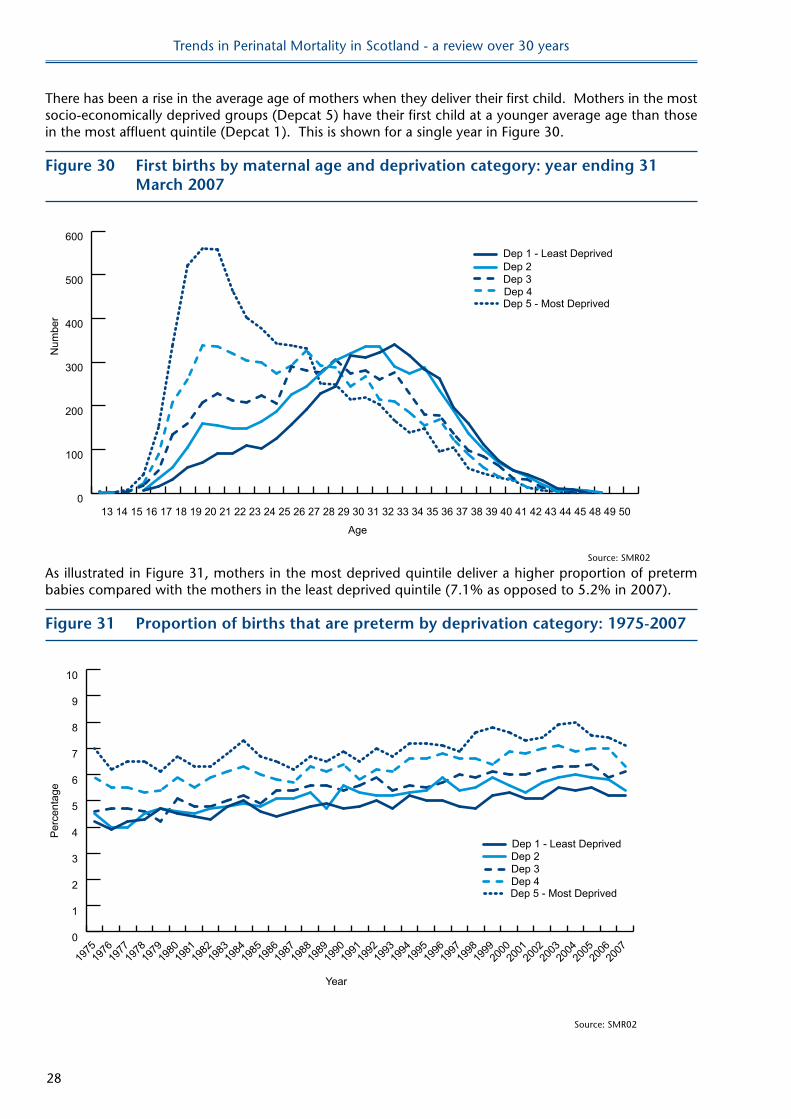
There has been a rise in the average age of mothers when they deliver their first child. Mothers in the most socio-economically deprived groups (Depcat 5) have their first child at a younger average age than those in the most affluent quintile (Depcat 1). This is shown for a single year in Figure 30.
Figure 30 First births by maternal age and deprivation category: year ending 31 March 2007
Age
Num
ber
0
100
200
300
400
500
600
504948454443424140393837363534333231302928272625242322212019181716151413
Dep 5 - Most DeprivedDep 4Dep 3Dep 2Dep 1 - Least Deprived
Source: SMR02
As illustrated in Figure 31, mothers in the most deprived quintile deliver a higher proportion of preterm babies compared with the mothers in the least deprived quintile (7.1% as opposed to 5.2% in 2007).
Figure 31 Proportion of births that are preterm by deprivation category: 1975-2007
Year
Per
cent
age
0
1
2
3
4
5
6
7
8
9
10
Dep 5 - Most DeprivedDep 4Dep 3Dep 2Dep 1 - Least Deprived
2007
2006
2005
2004
2003
2002
2001
2000
1999
1998
1997
1996
1995
1994
1993
1992
1991
1990
1989
1988
1987
1986
1985
1984
1983
1982
1981
1980
1979
1978
1977
1976
1975
Source: SMR02
Trends in Perinatal Mortality in Scotland - a review over 30 years
29
The influences on the numbers of preterm deliveries are multifactorial. Gray et al. 2007 found an increased rate of preterm birth during their study period and noted that social inequalities in preterm births were apparent.
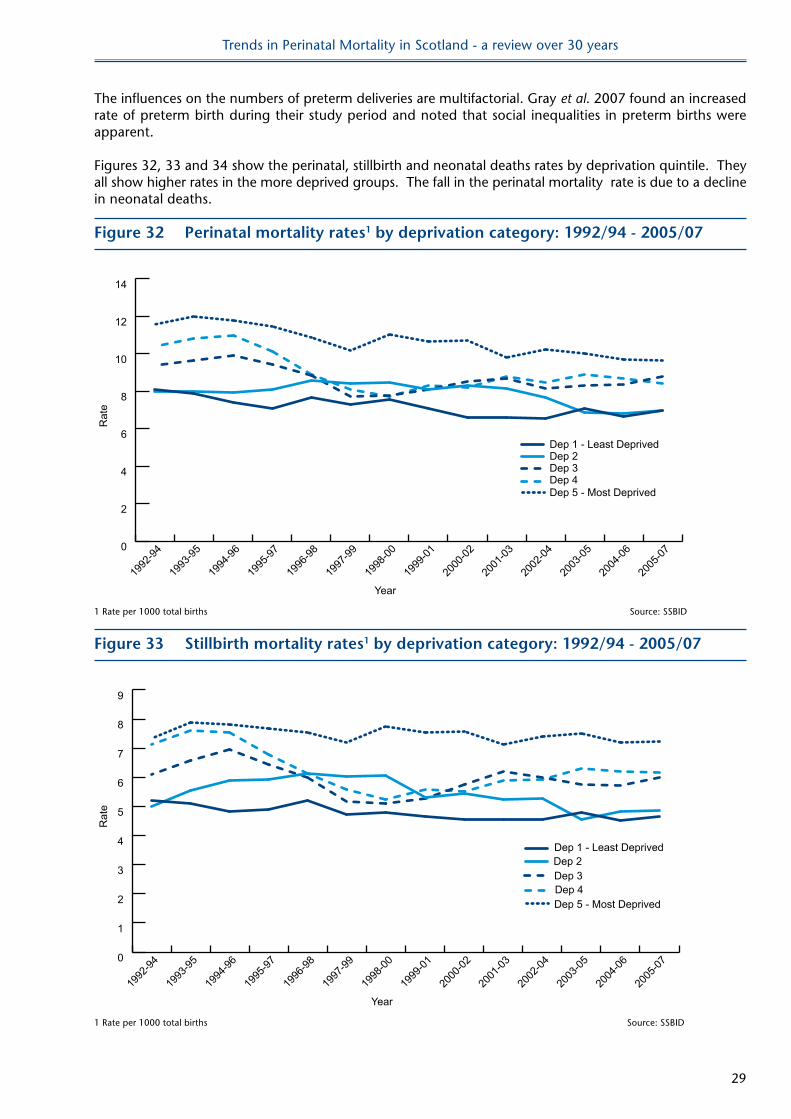
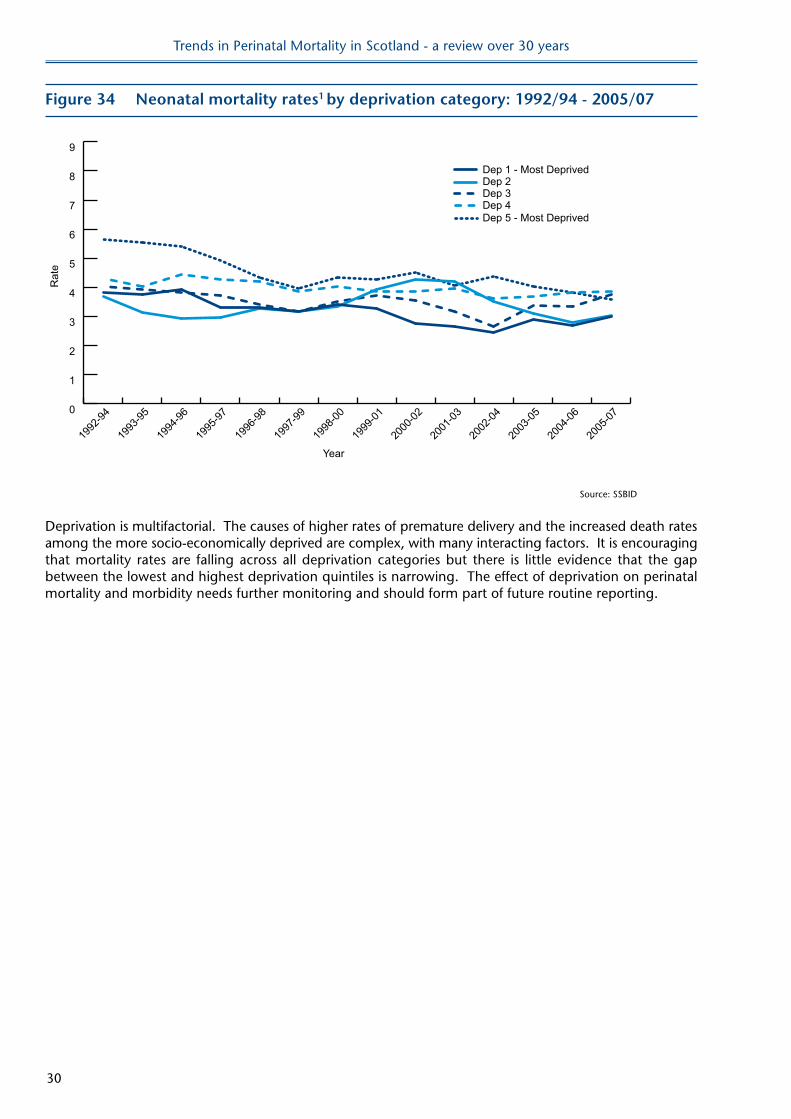
Figures 32, 33 and 34 show the perinatal, stillbirth and neonatal deaths rates by deprivation quintile. They all show higher rates in the more deprived groups. The fall in the perinatal mortality rate is due to a decline in neonatal deaths.
Figure 32 Perinatal mortality rates1 by deprivation category: 1992/94 - 2005/07
Year
Rat
e
0
2
4
6
8
10
12
14
Dep 5 - Most DeprivedDep 4Dep 3Dep 2Dep 1 - Least Deprived
2005
-07
2004
-06
2003
-05
2002
-04
2001
-03
2000
-02
1999
-01
1998
-00
1997
-99
1996
-98
1995
-97
1994
-96
1993
-95
1992
-94
1 Rate per 1000 total births Source: SSBID
Figure 33 Stillbirth mortality rates1 by deprivation category: 1992/94 - 2005/07
Year
Rat
e
0
1
2
3
4
5
6
7
8
9
Dep 5 - Most DeprivedDep 4Dep 3Dep 2Dep 1 - Least Deprived
2005
-07
2004
-06
2003
-05
2002
-04
2001
-03
2000
-02
1999
-01
1998
-00
1997
-99
1996
-98
1995
-97
1994
-96
1993
-95
1992
-94
1 Rate per 1000 total births Source: SSBID
Trends in Perinatal Mortality in Scotland - a review over 30 years
30
Figure 34 neonatal mortality rates1 by deprivation category: 1992/94 - 2005/07
Year
Rat
e
0
1
2
3
4
5
6
7
8
9
2005
-07
2004
-06
2003
-05
2002
-04
2001
-03
2000
-02
1999
-01
1998
-00
1997
-99
1996
-98
1995
-97
1994
-96
1993
-95
1992
-94
Dep 5 - Most DeprivedDep 4Dep 3Dep 2Dep 1 - Most Deprived
Source: SSBID
Deprivation is multifactorial. The causes of higher rates of premature delivery and the increased death rates among the more socio-economically deprived are complex, with many interacting factors. It is encouraging that mortality rates are falling across all deprivation categories but there is little evidence that the gap between the lowest and highest deprivation quintiles is narrowing. The effect of deprivation on perinatal mortality and morbidity needs further monitoring and should form part of future routine reporting.
Trends in Perinatal Mortality in Scotland - a review over 30 years
31
Smoking
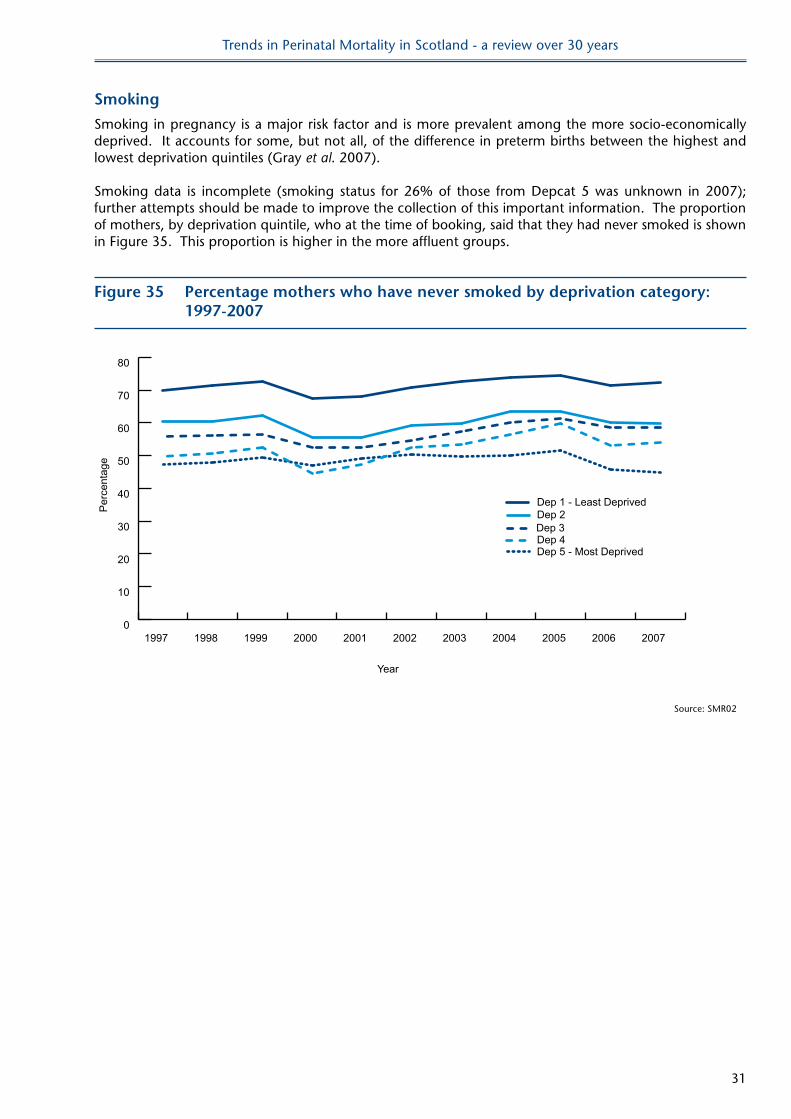
Smoking in pregnancy is a major risk factor and is more prevalent among the more socio-economically deprived. It accounts for some, but not all, of the difference in preterm births between the highest and lowest deprivation quintiles (Gray et al. 2007).
Smoking data is incomplete (smoking status for 26% of those from Depcat 5 was unknown in 2007); further attempts should be made to improve the collection of this important information. The proportion of mothers, by deprivation quintile, who at the time of booking, said that they had never smoked is shown in Figure 35. This proportion is higher in the more affluent groups.
Figure 35 Percentage mothers who have never smoked by deprivation category: 1997-2007
Year
Per
cent
age
0
10
20
30
40
50
60
70
80
Dep 5 - Most DeprivedDep 4Dep 3Dep 2Dep 1 - Least Deprived
20072006200520042003200220012000199919981997
Source: SMR02

Trends in Perinatal Mortality in Scotland - a review over 30 years
32
8 SUMMARY oF ReCoMMenDATIonSReviewing population data over longer periods of time can show trends which may not be obvious when •comparing single years. Areas of importance which can be investigated in more detail are highlighted in this review and should form the basis of subsequent reports.
Comparisons with other European countries are important. Scotland should continue to contribute to •projects and assess areas of good practice which may be transferrable to the Scottish context.
Current coding systems can no longer be used for meaningful surveillance of cause of perinatal death. In •particular too many stillbirths are being classified as ‘unexplained’. There is a need to review the coding categories to include more extensive information available from post mortem and placental analysis. It is important to keep to a standardised coding scheme that will allow comparisons with other countries. Work is therefore needed to expand and validate improved systems of coding.
Neonatal intensive care has had an impact on neonatal mortality rates but stillbirth rates are not •continuing to fall. There has been a rise in the stillbirth rates of term babies and a possible increase in intrapartum deaths. If true these are important findings and these data need further, and more detailed, analysis.
Smoking is still more prevalent in the more deprived groups. There needs to be improved recording of •smoking status.
There have been recent publications on deprivation and pregnancy outcome (Gray • et al. 2007). This work must be built upon. This must be more than an academic exercise and, where possible, changes in practice should be implemented and the impact assessed.

Trends in Perinatal Mortality in Scotland - a review over 30 years
33
9 lIMITATIonSThis review is restricted to the data which has been collected over the period of the report. •
In many instances the number are very small and interpretation therefore difficult.•
This review did find, as have many other studies, that maternal age, particularly for women over the age •of 40 years, results in higher stillbirth rates. However the impact of paternal age has not been assessed as this data has not been routinely collected. Other studies suggest that paternal age may also have an impact on outcome (Andersen et al. 2004).
This review did not attempt to assess the multifactorial cause of perinatal mortality in detail.•
Many stillbirths are unclassified because of the limitations of the current coding system.•

Trends in Perinatal Mortality in Scotland - a review over 30 years
34
10 ConClUSIonSThe aim of this report was: to review routinely collected perinatal data; to highlight areas of concern; and to suggest areas for further monitoring, analysis and reporting.
It has acknowledged the limitations of the current coding system and has not attempted to ascribe in any detail the influences and interaction of maternal age, deprivation and other factors which may contribute to perinatal mortality.
This review has demonstrated that assessing trends in perinatal mortality over a lengthy time period highlights areas which may require further investigation and analysis.
Trends in Perinatal Mortality in Scotland - a review over 30 years
35
11 ReFeRenCeSAndersen, A., Hansen, K., Andersen, P., Smith, G., Advanced Paternal Age and Risk of Fetal Death: A Cohort Study American Journal of Epidemiology 2004;160 (12) pp1214–1222.
Carstairs V, Morris R. Deprivation and Health in Scotland. Health Bulletin 1990;48 (4) pp162-175.
Gray R, Bonellie SR, Chalmers J, Greer I, Jarvis S, Williams C. Social inequalities in preterm birth in Scotland 1980-2003: findings from an area-based measure of deprivation. British Journal of Obstetrics and Gynaecology 2008*;115 (1) pp82-90. (*This was previously published as 2007).
Huang, L., Sauve, R., Birkett, N., Fergusson, D., van Walraven, C., Maternal age and risk of stillbirth: a systematic review Canadian Medical Association Journal 2008;178 (2) pp165-172.
Pailes, K. Advancing Maternal Age: a risk indicator or a risk factor for primiparous women in childbearing?A systematic review MIDIRS Midwifery Digest 2008;18 (1) pp7-18.
Sandra Bonellie, James Chalmers, Ron Gray, Ian Greer, Stephen Jarvis, Claire Williams. Centile charts for birthweight for gestational age for Scottish singleton births. BMC Pregnancy and Childbirth 2008, :5doi:10.1186/1471-2393-8-5: <http://www.biomedcentral.com/1471-2393/8/5> (*This was previously excluded).
Trends in Perinatal Mortality in Scotland - a review over 30 years
36
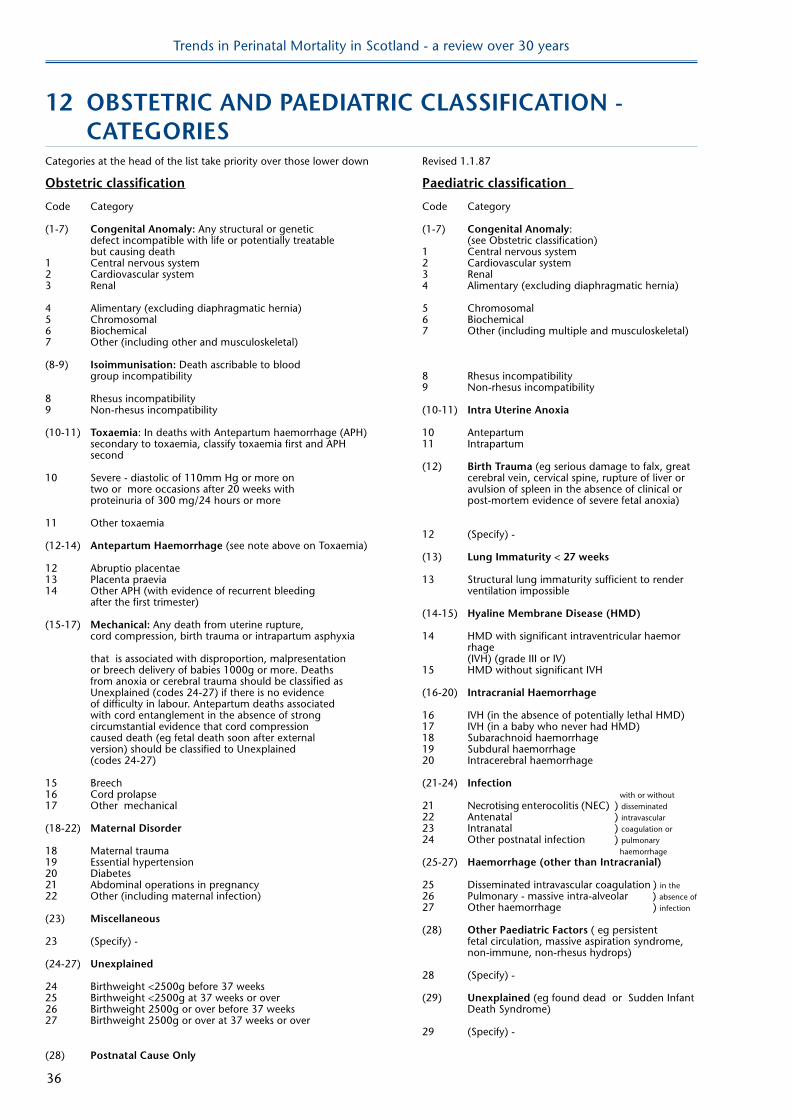
12 oBSTeTRIC AnD PAeDIATRIC ClASSIFICATIon - CATeGoRIeSCategories at the head of the list take priority over those lower down Revised 1.1.87
obstetric classification Paediatric classification
Code Category Code Category
(1-7) Congenital Anomaly: Any structural or genetic (1-7) Congenital Anomaly: defect incompatible with life or potentially treatable (see Obstetric classification) but causing death 1 Central nervous system1 Central nervous system 2 Cardiovascular system2 Cardiovascular system 3 Renal3 Renal 4 Alimentary (excluding diaphragmatic hernia)
4 Alimentary (excluding diaphragmatic hernia) 5 Chromosomal5 Chromosomal 6 Biochemical6 Biochemical 7 Other (including multiple and musculoskeletal)7 Other (including other and musculoskeletal)
(8-9) Isoimmunisation: Death ascribable to blood group incompatibility 8 Rhesus incompatibility 9 Non-rhesus incompatibility8 Rhesus incompatibility9 Non-rhesus incompatibility (10-11) Intra Uterine Anoxia
(10-11) Toxaemia: In deaths with Antepartum haemorrhage (APH) 10 Antepartum secondary to toxaemia, classify toxaemia first and APH 11 Intrapartum second (12) Birth Trauma (eg serious damage to falx, great10 Severe - diastolic of 110mm Hg or more on cerebral vein, cervical spine, rupture of liver or two or more occasions after 20 weeks with avulsion of spleen in the absence of clinical or proteinuria of 300 mg/24 hours or more post-mortem evidence of severe fetal anoxia)
11 Other toxaemia 12 (Specify) -(12-14) Antepartum haemorrhage (see note above on Toxaemia) (13) lung Immaturity < 27 weeks12 Abruptio placentae13 Placenta praevia 13 Structural lung immaturity sufficient to render14 Other APH (with evidence of recurrent bleeding ventilation impossible after the first trimester) (14-15) hyaline Membrane Disease (hMD)(15-17) Mechanical: Any death from uterine rupture, cord compression, birth trauma or intrapartum asphyxia 14 HMD with significant intraventricular haemor rhage that is associated with disproportion, malpresentation (IVH) (grade III or IV) or breech delivery of babies 1000g or more. Deaths 15 HMD without significant IVH from anoxia or cerebral trauma should be classified as Unexplained (codes 24-27) if there is no evidence (16-20) Intracranial haemorrhage of difficulty in labour. Antepartum deaths associated with cord entanglement in the absence of strong 16 IVH (in the absence of potentially lethal HMD) circumstantial evidence that cord compression 17 IVH (in a baby who never had HMD) caused death (eg fetal death soon after external 18 Subarachnoid haemorrhage version) should be classified to Unexplained 19 Subdural haemorrhage (codes 24-27) 20 Intracerebral haemorrhage
15 Breech (21-24) Infection16 Cord prolapse with or without17 Other mechanical 21 Necrotising enterocolitis (NEC) ) disseminated 22 Antenatal ) intravascular(18-22) Maternal Disorder 23 Intranatal ) coagulation or 24 Other postnatal infection ) pulmonary 18 Maternal trauma haemorrhage19 Essential hypertension (25-27) haemorrhage (other than Intracranial)20 Diabetes21 Abdominal operations in pregnancy 25 Disseminated intravascular coagulation ) in the 22 Other (including maternal infection) 26 Pulmonary - massive intra-alveolar ) absence of 27 Other haemorrhage ) infection (23) Miscellaneous (28) other Paediatric Factors ( eg persistent 23 (Specify) - fetal circulation, massive aspiration syndrome, non-immune, non-rhesus hydrops)(24-27) Unexplained 28 (Specify) -24 Birthweight <2500g before 37 weeks25 Birthweight <2500g at 37 weeks or over (29) Unexplained (eg found dead or Sudden Infant 26 Birthweight 2500g or over before 37 weeks Death Syndrome)27 Birthweight 2500g or over at 37 weeks or over 29 (Specify) - (28) Postnatal Cause only