Embed Size (px)
Citation preview
Maternal and Perinatal Mortality and Morbidity in QueenslandQueensland Maternal and Perinatal Quality Council Report 2015
Department of Health
Maternal and perinatal mortality in Queensland Queensland Maternal and Perinatal Quality Council Report 2015
Published by the State of Queensland (Queensland Health), November 2015
Report authors:Professor Michael HumphreyProfessor Paul ColditzProfessor David EllwoodAssociate Professor Vicki FlenadyDr Nikki Whelan
Editorial Committee:Professor Michael Humphrey (Chair)Joanne ElleringtonAndrea ChitakisProfessor David Ellwood Dr Trisha JohnstonDr Diane Payton
This document is licensed under a Creative Commons Attribution 3.0 Australia licence. To view a copy of this licence, visit creativecommons.org/licenses/by/3.0/au
© State of Queensland (Queensland Health) 2015
You are free to copy, communicate and adapt the work, as long as you attribute the State of Queensland (Queensland Health).
For more information contact: Queensland Maternal and Perinatal Quality Council, Level 2 15 Butterfield Street, HERSTON QLD 4029, email [email protected], phone 07 33289364.
Disclaimer: The content presented in this publication is distributed by the Queensland Government as an information source only. The State of Queensland makes no statements, representations or warranties about the accuracy, completeness or reliability of any information contained in this publication. The State of Queensland disclaims all responsibility and all liability (including without limitation for liability in negligence) for all expenses, losses, damages and costs you might incur as a result of the information being inaccurate or incomplete in any way, and for any reason reliance was placed on such information.

1
1. Maternal and perinatal mortality
Preface
This is the fourth report of the Queensland Maternal and Perinatal Quality Council since it recommenced activity in mid-2009.
The primary purpose of the Council is to provide advice and make recommendations to the Minister for Health and the Director-General of the Queensland Department of Health on matters relating to statewide and facility-specific morbidity and mortality. The Council functions as a gazetted quality assurance committee under the quality assurance provisions of sections 81–92 of the Hospital and Health Boards Act 2011, which enables the Council to undertake confidential enquiries into maternal and perinatal morbidity and mortality while providing members with legislative protection.
This report details the review of maternal and perinatal deaths in Queensland during the period 2012 to 2013, examines pregnancy and newborn outcomes of 124,832 women who gave birth to 126,881 babies in that period, and reviews some indicators of care. The report highlights clinical areas which may benefit from review by practitioners in maternity and newborn facilities, to the ultimate benefit of future mothers and babies.
The report contains data obtained from the following sources:
• Health Statistics Branch, including Perinatal Data Collection (PDC), Statistical • Reporting and Co-ordination, and Statistical Analysis and Linkage (SALT) Teams• Australian Institute of Health and Welfare (AIHW)• Registry of Births, Deaths and Marriages, Queensland• Office of the State Coroner, Queensland.
The Council is grateful for the cooperation of the Registrar for Births, Deaths and Marriages and the Queensland State Coroner who have facilitated access to relevant data.
I would like to thank the Council members, and those who support them, for their commitment to improving maternal and perinatal outcomes. I trust that clinicians throughout Queensland will read this report carefully and give consideration to, in particular, the Council’s recommendations and good practice points.
The Department of Health supports the work of the Queensland Maternal and Perinatal Quality Council with the realisation that sound health planning principles need to be based on the best available evidence including analyses of health outcomes by clinical experts such as form the contents of this report. Comments on the findings of this report are welcomed.
Dr Michael Cleary Deputy Director-General, Clinical Excellence Division

Queensland Maternal and Perinatal Quality Council Report 2015
2
Foreword
At the end of 2015, the Queensland Maternal and Perinatal Quality Council (the Council) will have completed its third two year term since being reconvened late in 2009. In this report, the Council reviews statewide maternity and newborn outcomes to the end of the 2013 calendar year.
The purpose of the Queensland Maternal and Perinatal Quality Council is to:
• collect and analyse clinical information regarding maternal and perinatal mortality and morbidity in Queensland to identify statewide and facility-specific trends.
• make recommendations to the Minister for Health on standards and quality indicators of maternal and perinatal clinical care to enable health providers in Queensland to improve safety and quality.
• assist with the adoption of such standards in both Public and Private sectors.
The Council functions collaboratively with the Statewide Maternity and Neonatal Clinical Network (SMNCN) and a Private Hospitals Maternity Liaison Group (supported by Private Hospitals Association of Queensland). Terms of Reference of the Queensland Maternal and Perinatal Quality Council are found at: www.health.qld.gov.au
The purpose of this report is to examine the management of pregnancies, births and newborns in Queensland, including maternal deaths and perinatal deaths and apparent risk factors for such events. This report will also attempt to identify areas of maternal and neonatal care where service providers might focus attention to prevent future deaths and adverse outcomes.
This report examines statewide maternity and neonatal data, including maternal deaths and perinatal deaths, in the period 2012 to 2013, with comparative data from the previous decade wherever those data are available. Data are provided to the Perinatal Data Collection Unit of the Health Statistics Branch, Queensland Department of Health by midwives, under the Perinatal Statistics provisions of the Public Health Act 2005 (Chapter 6, Part 1, s214–228), and have been analysed by Council and Sub-Committee members for this report. At the time of writing this report, the data available to the Council for the calendar year 2013 was a preliminary data set; as such, the data may be subject to minor change. At times, reference is made in this report to analyses by Statistical Analysis and Linkage Team (SALT), to provide readers with further detail.
I wish to acknowledge the commitment of Council members and their supporters to improve maternal and perinatal outcomes. The Council particularly acknowledges a very effective partnership with the Health Statistics Branch staff, with particular reference to the Perinatal Data Collection team (PDC) and the SALT.
Council’s close and effective working relationship with the Health Statistics Branch staff is particularly vital to the Council’s functionality.
I trust that all involved in the provision of care to mothers and their babies throughout Queensland will find this report helpful and give careful consideration to the Council’s recommendations.
Professor Michael Humphrey Chair, Queensland Maternal and Perinatal Quality Council
3
1. Maternal and perinatal mortality
ContentsPreface ................................................................................................................................................................. 1
Foreword .............................................................................................................................................................. 2
List of figures........................................................................................................................................................ 5
List of tables ......................................................................................................................................................... 8
Abbreviations ..................................................................................................................................................... 10
Executive summary ............................................................................................................................................ 11
Recommendations ............................................................................................................................................. 13
Good practice points .......................................................................................................................................... 14
1. Maternal and perinatal mortality .................................................................................................................... 161.1 Definitions ................................................................................................................................................... 161.2 Maternal deaths ........................................................................................................................................... 16
1.2.1 Maternal mortality ratio (MMR) ......................................................................................................... 161.2.2 Classification of cause of maternal deaths 2012 to 2013 ................................................................. 171.2.3 Cause of maternal death .................................................................................................................. 171.2.4 Avoidability ...................................................................................................................................... 181.2.5 Data collection and quality ............................................................................................................... 181.2.6 Reporting of maternal deaths ........................................................................................................... 181.2.7 Autopsies following maternal death ................................................................................................. 191.2.8 Deaths of Aboriginal and Torres Strait Islander women ..................................................................... 191.2.9 Psychosocial causations of death .................................................................................................... 191.2.10 Deaths due to malignancy ................................................................................................................ 201.2.11 Hypertension in pregnancy .............................................................................................................. 211.2.12 Other clinical issues raised by case review ....................................................................................... 211.2.13 Characteristics of women who died in the decade 2004 to 2013 ...................................................... 211.2.14 Causes of maternal deaths in the decade 2004 to 2013 .................................................................. 23
1.3 Perinatal deaths ......................................................................................................................................... 241.3.1 Perinatal mortality review modus operandi ...................................................................................... 241.3.2 Clinical classification ....................................................................................................................... 241.3.3 Data collection and data quality ....................................................................................................... 241.3.4 The IMPROVE educational program .................................................................................................. 251.3.5 National Perinatal Death Clinical Audit Tool (NPDCAT) ...................................................................... 261.3.6 Definitions of perinatal deaths ......................................................................................................... 261.3.7 Perinatal mortality rates and trends ................................................................................................. 261.3.8 PSANZ Perinatal Death Classification (PSANZ-PDC and PSANZ-NDC) of perinatal deaths .................. 271.3.9 Multiple pregnancy .......................................................................................................................... 321.3.10 Aboriginal and Torres Strait Islander perinatal mortality .................................................................. 331.3.11 Gestation and birthweight specific perinatal mortality rates ............................................................. 341.3.12 Perinatal autopsies .......................................................................................................................... 37
2. Pregnancy and newborn care .......................................................................................................................... 382.1 Mode of healthcare delivery ......................................................................................................................... 382.2 Home birth ................................................................................................................................................... 392.3 Gestation at birth ......................................................................................................................................... 392.4 Birthweight ................................................................................................................................................. 422.5 Multiple pregnancies ................................................................................................................................... 432.6 Assisted conception ..................................................................................................................................... 442.7 Onset of labour ............................................................................................................................................ 462.8 Mode of birth ............................................................................................................................................... 482.9 Indigenous mothers and their babies........................................................................................................... 51
2.9.1 Queensland Department of Health Performance Indicators in Aboriginal and/or Torres Strait Islander Health related to maternity and newborn care ................................................. 54
2.9.2 QMPQC Gestation at Birth Performance Indicator in Aboriginal and/or Torres Strait Islander Health maternity and newborn care ................................................................. 54
2.10 Influence of maternal risk factors ................................................................................................................. 552.10.1 Effect of previous pregnancy on mode of birth ................................................................................. 552.10.2 Effect of previous caesarean section on mode of birth ..................................................................... 562.10.3 Maternal age .................................................................................................................................... 572.10.4 Maternal obesity .............................................................................................................................. 592.10.6 Remoteness of residence ................................................................................................................. 642.10.7 Socio-economic disadvantage ......................................................................................................... 67
Queensland Maternal and Perinatal Quality Council Report 2015
4
3. Congenital anomalies ..................................................................................................................................... 703.1 Neural tube defects ...................................................................................................................................... 733.2 Other major Central Nervous System anomalies ........................................................................................... 743.3 Major cardiovascular anomalies ................................................................................................................... 753.4 Cleft lip and/or cleft palate .......................................................................................................................... 763.5 Gastrointestinal atresia, stenosis ................................................................................................................. 773.6 Hypospadias, epispadias, bladder exstrophy ............................................................................................... 783.7 Renal agenesis/dysgenesis, cystic kidneys .................................................................................................. 793.8 Polydactyly ................................................................................................................................................... 803.9 Limb reduction defects ................................................................................................................................ 813.10 Diaphragmatic hernia .................................................................................................................................. 823.11 Exomphalos, gastroschisis ........................................................................................................................... 833.12 Trisomy 21 ................................................................................................................................................... 843.13 Trisomy 13 and trisomy 18 ........................................................................................................................... 853.14 Sex chromosome anomalies ........................................................................................................................ 863.15 Critical congenital heart disease: Place of birth Queensland 2007 to 2011 .................................................. 86
4. Comparisons between hospitals and their outcomes ...................................................................................... 884.1 Indicator 1- incidence of caesarean section birth in selected primigravida ................................................... 934.2 Indicator 2 - incidence of unassisted vaginal birth in selected primigravida ................................................. 944.3 Indicator 3 - incidence of caesarean section without labour birth in all women ............................................ 964.4 Indicator 4 - incidence of elective birth prior to 38 weeks gestation in all women......................................... 974.5 Indicator 5 - incidence of vaginal birth after caesarean section (VBAC)
in the birth immediately following a first caesarean section in all women .................................................... 994.6 Indicator 6 - proportion of selected primigravida who laboured spontaneously and achieved
an unassisted vaginal birth without episiotomy and without third/fourth degree perineal tear .................. 1004.7 Indicator 7- proportion of all women who laboured spontaneously and achieved an
unassisted vaginal birth without episiotomy and without third/fourth degree perineal tear................................................................................................................ 102
APPENDIX A: supplementary data tables .......................................................................................................... 104
APPENDIX B. Data sources used in this report ................................................................................................... 137
APPENDIX C: Membership of the Queensland Maternal and Perinatal Quality Council, 2014—2015 ................. 138
APPENDIX D: IMPROVE Program ....................................................................................................................... 142
APPENDIX E: Statewide Maternity and Neonatal Clinical Network ..................................................................... 143
APPENDIX F: Institute of Medicine Guidelines re. Weight Gain During Pregnancy .............................................. 144
APPENDIX G: Acknowledgements ..................................................................................................................... 145
5
1. Maternal and perinatal mortality
List of figures
Figure 1: Causes of maternal deaths (direct and indirect deaths), Queensland 2004 to 2013 ....................................................23
Figure 2: Perinatal mortality rates, Queensland 2004 to 2013....................................................................................................26
Figure 3: Perinatal deaths by PSANZ-PDC classification, Queensland 2012 to 2013 ..................................................................29
Figure 4: Stillbirths by PSANZ-PDC classification, Queensland 2012 to 2013 .............................................................................29
Figure 5: Neonatal deaths by PSANZ-PDC classification, Queensland 2012 to 2013 ..................................................................30
Figure 6: Neonatal deaths by PSANZ-NDC classification, Queensland 2012 to 2013 ..................................................................30
Figure 7: Perinatal deaths by plurality of pregnancy and PSANZ-PDC classification, Queensland 2012 to 2013 .........................32
Figure 8: Perinatal deaths by plurality of pregnancy and PSANZ-NDC classification, Queensland 2012 to 2013 ........................32
Figure 9: Perinatal deaths by Indigenous status, Queensland 2012 to 2013 ..............................................................................33
Figure 10: Perinatal deaths by PSANZ-PDC and Indigenous status, Queensland 2012 to 2013 ....................................................33
Figure 11: Perinatal deaths by PSANZ-NDC and Indigenous status, Queensland 2012 to 2013 ....................................................34
Figure 12: Perinatal mortality rate and risk*by gestation (weeks), Queensland 2012 to 2013 ......................................................34
Figure 13: Perinatal deaths by PSANZ-PDC and gestational age, Queensland 2012 to 2013 .......................................................35
Figure 14: Neonatal deaths by PSANZ-NDC and gestational age, Queensland 2012 to 2013........................................................35
Figure 15: Perinatal mortality rate by birthweight (g), Queensland 2012 to 2013 .........................................................................36
Figure 16: Perinatal deaths by PSANZ-PDC and birthweight, Queensland 2012 to 2013 ..............................................................36
Figure 17: Neonatal deaths by PSANZ-NDC and birthweight, Queensland 2012 to 2013 ..............................................................37
Figure 18: Perinatal autopsies by type of death, Queensland 2004 to 2013 ................................................................................37
Figure 19: Number of women giving birth by mode of healthcare delivery, Queensland 2004 to2013 .........................................38
Figure 20: Percentage of women accessing Public and Private birth care, Queensland 2004 to 2013 ..........................................38
Figure 21: Percentage of home births by maternal age group, Queensland 2004 to 2013 ............................................................39
Figure 22: Percentage of women giving birth by gestation, Queensland 2004 to 2013 . ...............................................................39
Figure 23: Percentage of babies born by gestation, Queensland 2004 to 2013 . ..........................................................................39
Figure 24: Number of babies born at less than 37 weeks’ gestation by mode of healthcare delivery, Queensland 2004 to 2013 40
Figure 25: Percentage of babies born by mode of healthcare delivery and gestation, Queensland 2009 to 2013 .......................40
Figures 26a Number of women giving birth by mode of healthcare delivery, gestation and onset of labour, and 26b: Queensland 2009 to 2013 ..........................................................................................................................................41
Figure 27: Birthweight distribution, Queensland 2004 to 2013 ...................................................................................................42
Figure 28: Percentage of multiple pregnancies by maternal age, Queensland 2004 to 2013 .......................................................43
Figure 29: Percentage of multiple and singleton pregnancies by gestation at birth, Queensland 2004 to 2013 ..........................43
Figure 30: Influence of assisted conception techniques, Queensland 2004 to 2013 ...................................................................44
Figure 31: Percentage of multiple births in pregnancies conceived with and without the use of assisted conception techniques, Queensland 2004 to 2013 ..........................................................................................................................................44
Figure 32: Onset of labour, all births, Queensland 2004 to 2013 ................................................................................................46
Figure 33: Spontaneous onset of labour by public and private hospitals, Queensland 2004 to 2013 .........................................46
Figure 34: Induced labour by public and private hospitals, Queensland 2004 to 2013 ...............................................................47
Figure 35: Caesarean section without labour by public and private hospitals, Queensland 2004 to 2013 ..................................47
Figure 36: Mode of birth of babies, Queensland 2004 to 2013 ...................................................................................................48
Figure 37: Incidence of unassisted vaginal birth and caesarean section birth of babies by public and private hospitals, Queensland 2004 to 2013 ..........................................................................................................................................49
Figure 38: Incidence of caesarean section birth, before and in labour, of babies born in public and private hospitals, Queensland 2004 to 2013 ..........................................................................................................................................49
Figure 39: Incidence of caesarean section birth of babies when there is a breech presentation, in public and private hospitals, Queensland 2004 to 2013 ..........................................................................................................................................50
Figure 40: Incidence of caesarean section for multiple births in public and private hospitals, Queensland 2004 to 2013 ..........50
Figure 41: Mode of birth relating to women’s intentions regarding birth centre birthing intention, Queensland 2009 to 2013 ...........................................................................................................................................51
Figure 42: Incidence of maternal age groups by maternal Indigenous status, Queensland 2004 to 2013 ....................................51
Figure 43: Percentage of women giving birth, by maternal Indigenous status and gestational age group, Queensland 2009 to 2013 ..........................................................................................................................................52
Figure 44: Percentage of women giving birth at gestations less than 37 weeks, by maternal Indigenous status and gestational age, Queensland 2009 to 2013 ................................................................................................................52
Figure 45: Mean birthweight by gestational age and maternal Indigenous status, Queensland 2009 to 2013 .............................53
Figure 46: Percentage of babies by gestation, birthweight group and maternal Indigenous status, Queensland 2009 to 2013 ..........................................................................................................................................53
Figure 47: Incidence of mode of birth by previous pregnancy, Queensland 2004 to 2013 ...........................................................55
Figure 48: Incidence of mode of birth by previous caesarean sections, Queensland 2004 to 2013 ..............................................56
Figure 49: Percentage of births by maternal age group, Queensland 2004 to 2013 (Table A43) ...................................................57
Queensland Maternal and Perinatal Quality Council Report 2015
6
Figure 50: Number of births to women less than 20 years of age by mode of healthcare delivery, Queensland 2004 to 2013 ....57
Figure 51: Number of births to women 20–34 years of age by mode of healthcare delivery, Queensland 2004 to 2013 ..............57
Figure 52: Number of births to women 35 or more years of age by mode of healthcare delivery, Queensland 2004 to 2013 .......57
Figure 50: Number of births to women less than 20 years of age by mode of healthcare delivery, Queensland 2004 to 2013 .....57
Figure 52: Number of births to women 35 or more years of age by mode of healthcare delivery, Queensland 2004 to 2013 .......57
Figure 51: Number of births to women 20–34 years of age by mode of healthcare delivery, Queensland 2004 to 2013 ..............57
Figure 53: Incidence of multiple birth by maternal age, Queensland 2009 to 2013 ....................................................................58
Figure 54: Percentage of babies born by maternal age and gestation, Queensland 2009 to 2013 ...............................................58
Figure 55: Percentage of live-born babies requiring admission to neonatal intensive care or special care units by maternal age, Queensland 2009 to 2013 ..........................................................................................................................................59
Figure 56: BMI versus maternal age, Queensland 2009 to 2013 .................................................................................................59
Figure 57: BMI versus mode of birth, Queensland 2009 to 2013 .................................................................................................60
Figure 58: BMI versus gestation at birth (singleton pregnancies only), Queensland 2009 to 2013 ..............................................60
Figure 59: BMI versus birthweight (singleton pregnancies only), Queensland 2009 to 2013 .......................................................61
Figure 60: BMI versus perinatal mortality rates (per 1000 births), Queensland 2009 to 2013 .....................................................61
Figure 61: Smoking versus gestation, Queensland 2010 to 2013 ................................................................................................62
Figure 62: Smoking versus birthweight, Queensland 2010 to 2013 ............................................................................................62
Figure 63: Smoking versus perinatal mortality rates (per 1000 births), Queensland 2010 to 2013 .............................................63
Figure 64: Remoteness of residence versus gestation at birth (percentage of babies), Queensland 2012 to 2013.......................64
Figure 65: Remoteness of residence versus birthweight (percentage of babies), Queensland 2012 to 2013 ...............................65
Figure 66: Remoteness of residence versus perinatal mortality rates (per 1000 births), Queensland 2012 to 2013 ....................65
Figure 67: Correlation of antenatal transfer of care and remoteness class of women’s primary residence with perinatal death, Queensland 2009 to 2013 ..........................................................................................................................................66
Figure 68: Correlation of antenatal transfer of care and remoteness class of women’s primary residence with stillbirth, Queensland 2009 to 2013 ...........................................................................................................................................66
Figure 69: Correlation of antenatal transfer of care and remoteness class of women’s primary residence with neonatal death, Queensland 2009 to 2013 ...........................................................................................................................................67
Figure 70: SEIFA quintile versus gestation, Queensland 2012 to 2013 .........................................................................................68
Figure 71: SEIFA quintile versus birthweight, Queensland 2012 to 2013 .....................................................................................68
Figure 72: SEIFA quintile versus perinatal mortality rates (per 1000 births), Queensland 2012 to 2013 ......................................69
Figure 73: Number of congenital anomalies reported in the pregnancy and newborn period, Queensland 2012 to 2013 ...........71
Figure 74A: Characteristics of the mothers of all babies born with one or more of the defined congenital anomalies, Queensland 2012 to 2013 ..........................................................................................................................................72
Figure 74B: Characteristics of all babies born with one or more of the defined congenital anomalies and the associated case fatality rates, Queensland 2012 to 2013 .....................................................................................................................72
Figure 75A: Characteristics of mothers of babies born with neural tube defects, Queensland 2012 to 2013 .................................73
Figure 75B: Characteristics of babies born with neural tube defects and the associated case fatality rates, Queensland 2012 to 2013 ..........................................................................................................................................73
Figure 76A: Characteristics of mothers of babies born with ‘other major central nervous system anomalies’, Queensland 2012 to 2013 ..........................................................................................................................................74
Figure 76B: Characteristics of babies born with ‘other major central nervous system anomalies’ and the associated case fatality rates, Queensland 2012 to 2013 ......................................................................................................................74
Figure 77A: Characteristics of mothers of babies born with major cardiovascular anomalies, Queensland 2012 to 2013 ..........................................................................................................................................75
Figure 77B: Characteristics of babies born with major cardiovascular anomalies and the associated case fatality rates, Queensland 2012 to 2013 ...........................................................................................................................................75
Figure 78A: Characteristics of mothers of babies born with cleft lip and/or cleft palate, Queensland 2012 to 2013 ...........................................................................................................................................76
Figure 78B: Characteristics of babies born with cleft lip and/or cleft palate and the associated case fatality rates, Queensland 2012 to 2013 ..........................................................................................................................................76
Figure 79A: Characteristics of mothers of babies born with gastrointestinal atresia/stenosis (oesophageal, small intestine, ano-rectal), Queensland 2012 to 2013 .......................................................................................................................77
Figure 79B: Characteristics of babies born with gastrointestinal atresia/stenosis (oesophageal, small intestine, ano-rectal) and the associated case fatality rates, Queensland 2012 to 2013 ..............................................................................77
Figure 80A: Characteristics of mothers of babies born with hypospadias, epispadias and/or bladder exstrophy, Queensland 2012 to 2013 ..........................................................................................................................................78
Figure 80B: Characteristics of babies born with hypospadias, epispadias and/or bladder exstrophy and the associated case fatality rates, Queensland 2012 to 2013 ...........................................................................................78
Figure 81A: Characteristics of mothers of babies born with renal agenesis/dysgenesis or cystic kidneys, Queensland 2012 to 2013 ..........................................................................................................................................79
Figure 81B: Characteristics of babies born with renal agenesis/dysgenesis or cystic kidneys and the associated case fatality rates, Queensland 2012 to 2013 .....................................................................................................................79
7
1. Maternal and perinatal mortality
Figure 82A: Characteristics of mothers of babies born with polydactyly, Queensland 2012 to 2013 .............................................80
Figure 82B: Characteristics of babies born with polydactyly and the associated case fatality rates, Queensland 2012 to 2013 ....80
Figure 83A: Characteristics of mothers of babies born with limb reduction defects, Queensland 2012 to 2013.............................81
Figure 83B: Characteristics of babies born with limb reduction defects and the associated case fatality rates, Queensland 2012 to 2013 ..........................................................................................................................................81
Figure 84A: Characteristics of mothers of babies born with diaphragmatic hernia, Queensland 2012 to 2013 .............................82
Figure 84B: Characteristics of babies born with diaphragmatic hernia and the associated case fatality rates, Queensland 2012 to 2013 ..........................................................................................................................................82
Figure 85A: Characteristics of mothers of babies born with exomphalos or gastroschisis, Queensland 2012 to 2013 ..................83
Figure 85B: Characteristics of babies born with exomphalos or gastroschisis and the associated case fatality rates, Queensland 2012 to 2013 ..........................................................................................................................................83
Figure 86A: Characteristics of mothers of babies born with trisomy 21, Queensland 2012 to 2013 ..............................................84
Figure 86B: Characteristics of babies born with trisomy 21 and the associated case fatality rates, Queensland 2012 to 2013 .....84
Figure 87A: Characteristics of mothers of babies born with trisomy 13 and trisomy 18, Queensland 2012 to 2013 .......................85
Figure 87B: Characteristics of babies born with trisomy 13 and trisomy 18 and the associated case fatality rates, Queensland 2012 to 2013 ..........................................................................................................................................85
Figure 88A: Characteristics of mothers of babies born with sex chromosome anomalies, Queensland 2012 to 2013 ....................86
Figure 88B: Characteristics of babies born with sex chromosome anomalies and the associated case fatality rates, Queensland 2012 to 2013 (Table A66) .......................................................................................................................86
Figure 89: Proportion (%) of selected primigravida having a caesarean section birth, Queensland 2012 to 2013 .......................93
Figure 90A: Proportion (%) of selected primigravida having a caesarean section birth in public hospitals .....................................93
Figure 90B: Proportion (%) of selected primigravida having a caesarean section birth in public hospitals (Non-specialist maternity and newborn services Groups D-E), Queensland 2012 to 2013 ...........................................94
Figure 91: Proportion (%) of selected primigravida achieving unassisted vaginal birth, Queensland 2012 to 2013 .....................94
Figure 92A: Proportion (%) of selected primigravida having an unassisted vaginal birth in public hospitals (Specialist maternity and newborn services Groups A–C), Queensland 2012 to 2013 .................................................95
Figure 92B: Proportion (%) of selected primigravida having an unassisted vaginal birth in public hospitals (Non-specialist maternity and newborn services Groups D-E), Queensland 2012 to 2013 ...........................................95
Figure 93: Proportion (%) of caesarean sections performed without labour in all women giving birth, Queensland 2012 to 2013 ..........................................................................................................................................96
Figure 94A: Proportion (%) of all women having caesarean section without labour in public hospitals (Specialist maternity and newborn services Groups A-C), Queensland 2012 to 2013 ..................................................96
Figure 94B: Proportion (%) of all women having caesarean section without labour in public hospitals (Non-specialist maternity and newborn services Groups D-E), Queensland 2012 to 2013 ...........................................97
Figure 95: Proportion (%) of elective births (inductions of labour and caesarean sections without labour in all women giving birth) occurring before 38 completed weeks’ gestation, Queensland 2012 to 2013 .............................97
Figure 96A: Proportion (%) of all women having an elective birth (induced labour or caesarean section without labour) prior to 38 weeks gestation in public hospitals (Specialist maternity and newborn services Groups A-C), Queensland 2012 to 2013 ...........................................................................................................................................98
Figure 96B: Proportion (%) of all women having an elective birth (induced labour or caesarean section without labour) prior to 38 weeks gestation in public hospitals (Non-specialist maternity and newborn services Groups D-E), Queensland 2012 to 2013 ...........................................................................................................................................98
Figure 97: Proportion (%) of all women giving birth whose previous pregnancy ended in a first caesarean section and who achieved a vaginal birth (ie successful VBAC), Queensland 2012 to 2013 ..................................................................99
Figure 98A: Proportion (%) of all women giving birth whose previous pregnancy ended in a first caesarean section and who achieved a vaginal birth(ie successful VBAC) in public hospitals, Queensland 2012 to 2013 ......................................99
Figure 98B: Proportion (%) of all women giving birth whose previous pregnancy ended in a first caesarean section and who achieved a vaginal birth(ie successful VBAC) in public hospitals (Non-specialist maternity and newborn services Groups D-E), Queensland 2012 to 2013 ....................................................................................................................100
Figure 99: Proportion (%) of selected primigravida labouring spontaneously and achieving unassisted vaginal birth without episiotomy and without third/fourth degree perineal tear, Queensland 2012 to 2013 ..............................................100
Figure 100A: Proportion (%) of selected primigravida labouring spontaneously and achieving unassisted vaginal birth without episiotomy and without third/fourth degree perineal tear in public hospitals (Specialist maternity and newborn services Groups A-C), Queensland 2012 to 2013 .....................................................................................................101
Figure 100B: Proportion (%) of selected primigravida labouring spontaneously and achieving unassisted vaginal birth without episiotomy and without third/fourth degree perineal tear in public hospitals (Non-specialist maternity and newborn services Groups D-E), Queensland 2012 to 2013 ................................................................................101
Figure 101: Proportion (%) of all women giving birth labouring spontaneously and achieving unassisted vaginal birth without episiotomy and without third/fourth degree perineal tear, Queensland 2012 to 2013 ................................102
Figure 102A: Proportion (%) of all women giving birth labouring spontaneously and achieving unassisted vaginal birth without episiotomy and without third/fourth degree perineal tear in public hospitals (Specialist maternity and newborn services Groups A-C), Queensland 2012 to 2013 ................................................................................102
Figure 102B: Proportion (%) of all women giving birth labouring spontaneously and achieving unassisted vaginal birth without episiotomy and without third/fourth degree perineal tear in public hospitals (Non-specialist maternity and newborn services Groups D-E), Queensland 2012 to 2013 ...................................................................................10
Queensland Maternal and Perinatal Quality Council Report 2015
8
List of tables
Table 1: Maternal mortality ratios (MMR), Queensland and Australia 2000 to 2012 .................................................................17
Table 2: Classification of maternal deaths in Queensland 2012 to 2013 (includes incidental and late deaths) ........................17
Table 3: Cause of maternal deaths in Queensland, during pregnancy or within 42 days of the end of pregnancy, 2012 to 2013 ...............................................................................................................................................................17
Table 4: Cause of maternal deaths in Queensland, between 43 and 365 days of the end of pregnancy, 2012 to 2013 ............18
Table 5: Avoidable factors in maternal deaths in Queensland, during pregnancy or within 365 days of the end of pregnancy, 2012 to 2013 ...............................................................................................................................................................18
Table 6: Incidence of autopsy being performed in maternal deaths, Queensland 2012 to 2013 ...............................................19
Table 7: Clinical characteristics of direct and indirect maternal deaths, Queensland 2004 to 2013 ..........................................22
Table 8: Characteristics of women who died (direct and indirect deaths), Queensland 2004 to 2013 ......................................22
Table 9: Perinatal mortality rates by facility type, Queensland 2012 to 2013 ...........................................................................27
Table 10: Perinatal deaths by type and PSANZ-PDC, Queensland 2012 to 2013 .........................................................................28
Table 11: Neonatal deaths PSANZ-NDC, Queensland 2012 to 2013 ............................................................................................28
Table 12: Perinatal mortality rate by onset of birth process, Queensland 2009 to 2013 .............................................................42
Table 13: Infants with critical congenital heart disease by Birth Hospital, Queensland 2007 to 2011 .........................................87
Table 14: Fetal detection of critical congenital heart disease in non-cardiac hospital births, Queensland 2007 to 2011 ............87
Table 15: Hospital groups for outcome comparisons, Maternal profiles by hospital group (%), Queensland 2012 to 2013 .......90
Table 17: Baby profiles by hospital group (%), Queensland 2012 to 2013 ..................................................................................92
Supplementary data tablesTable A1: Causes of maternal death, Queensland 2004 to 2013 ...............................................................................................104
Table A2: Stillbirth, neonatal and perinatal death rates, Queensland 2004 to 2013 .................................................................104
Table A3: Perinatal deaths by detailed PSANZ-PDC classification, Queensland 2012 to 2013 ...................................................105
Table A3: Perinatal deaths by detailed PSANZ-PDC classification, Queensland 2012 to 2013 ...................................................106
Table A3: Perinatal deaths by detailed PSANZ-PDC classification, Queensland 2012 to 2013 ...................................................107
Table A4: Neonatal deaths by detailed PSANZ-NDC classification, Queensland 2012 to 2013 ..................................................108
Table A4: Neonatal deaths by detailed PSANZ-NDC classification, Queensland 2012 to 2013 ..................................................109
Table A5: Perinatal deaths by PSANZ-PDC and plurality, Queensland 2012 to 2013 ..................................................................109
Table A6: Neonatal deaths by PSANZ-NDC and plurality, Queensland 2012 to 2013 .................................................................109
Table A7: Perinatal deaths by Indigenous status of the mother, Queensland 2012 to 2013 ......................................................110
Table A8: Perinatal deaths by PSANZ-PDC and Indigenous status, Queensland 2012 to 2013 ..................................................110
Table A9: Neonatal deaths by PSANZ-NDC and Indigenous status, Queensland 2012 to 2013 .................................................110
Table A10: Perinatal deaths by gestation (completed weeks), Queensland 2012 to 2013. .........................................................111
Table A11: Perinatal deaths by PSANZ-PDC and gestational age, Queensland 2012 to 2013 .....................................................111
Table A12: Neonatal deaths by PSANZ-NDC and gestational age, Queensland 2012 to 2013......................................................112
Table A13: Perinatal deaths by birthweight, Queensland 2012 to 2013 ......................................................................................112
Table A14: Perinatal deaths by PSANZ-PDC and birthweight, Queensland 2012 to 2013 ............................................................113
Table A15: Neonatal deaths by PSANZ-NDC and birthweight, Queensland 2012 to 2013 ............................................................113
Table A16: Perinatal autopsy rates, Queensland 2004 to 2013 ...................................................................................................113
Table A17: Women giving birth by mode of healthcare delivery, Queensland 2004 to 2013 .......................................................114
Table A18: Number and percentage of women giving birth by gestation at birth, Queensland 2004 to 2013 .............................114
Table A19: Number and percentage of babies born by gestation at birth, Queensland 2004 to 2013 .........................................114
Table A20: Number and percentage of women giving birth by gestation at birth and mode of healthcare delivery, Queensland 2004 to 2013 .........................................................................................................................................115
Table A21: Number and percentage of babies born in public and private hospitals, by gestation at birth, mode of healthcare delivery and onset of labour / caesarean section, Queensland 2009 to 2013 ...........................115
Table A22: Birthweight of babies born, Queensland 2004 to 2013 ............................................................................................116
Table A23: Percentage of mothers having multiple births by maternal age, Queensland 2004 to 2013 ......................................116
Table A24: Number and percentage of multiple and singleton births(number of mothers) by gestation, Queensland 2004 to 2013 .........................................................................................................................................116
Table A25: Number and percentage of singleton and multiple births (number of mothers) in pregnancies conceived with and without the use of assisted conception techniques, Queensland 2004 to 2013 .........................................117
Table A26: Number and percentage of live-born babies by use of assisted conception techniques and need for care in a neonatal intensive care unit (NICU) or a special care nursery (SCN), Queensland 2009 to 2013 .........................117
Table A27: Number and percentage of women giving birth by onset of labour, Queensland 2004 to 2013 .................................117
Table A28: Number of women giving birth by onset of labour in public and private hospitals, Queensland 2004 to 2013 ..........118
Table A29: Number of babies born by birth mode, Queensland 2004 to 2013 ............................................................................118
9
1. Maternal and perinatal mortality
Table A30: Number of babies born by birth mode in public and private hospitals, Queensland 2004 to 2013 ...........................118
Table A31: Percentage of babies born by birth mode in public and private hospitals, Queensland 2004 to 2013 .......................119
Table A32: Number and percentage of babies born by caesarean section with and without labour in public and private hospitals, Queensland 2004 to 2013 ...........................................................................................119
Table A33: Number and percentage of babies presenting by the breech born by caesarean section in public and private hospitals, Queensland 2004 to 2013 ...........................................................................................119
Table A34: Number and percentage of multiple births by caesarean section in public and private hospitals, Queensland 2004 to 2013 .........................................................................................................................................120
Table A35: Number and percentage of mode of birth in women who intended to give birth in a Birth Centre versus women who intended hospital maternity service (public or private) birth, Queensland 2009 to 2013 ...........120
Table A36: Number and percentage of women giving birth by Indigenous status and mode of healthcare delivery, Queensland 2004 to 2013 .........................................................................................................................................120
Table A37: Number of women giving birth by Indigenous status and maternal age group, Queensland 2004 to 2013 ................121
Table A38: Percentage of women giving birth by Indigenous status and maternal age group, Queensland 2004 to 2013 ...........121
Table A39: Birthweight (number (n), mean and standard deviation (SD)) by Indigenous status and gestation, Queensland 2009 to 2013 ........................................................................................................................................122
Table A40: Percentage of babies born by Indigenous status of mother, gestation and birthweight, Queensland 2009 to 2013 .........................................................................................................................................122
Table A41: Number and percentage of women giving birth by mode of birth and previous pregnancy, Queensland 2004 to 2013 ........................................................................................................................................123
Table A42: Number of women giving birth by mode of birth and previous caesarean section, Queensland 2004 to 2013 ..........123
Table A43: Births by maternal age, Queensland 2004 to 2013 ....................................................................................................124
Table A44: Number of women giving birth by maternal age group and mode of healthcare delivery, Queensland 2004 to 2013 .........................................................................................................................................124
Table A45: Number of women giving birth by maternal age group and plurality, Queensland 2009 to 2013 ...............................124
Table A46: Number and percentage of babies born by maternal age group and gestation at birth, Queensland 2009 to 2013 ...125
Table A47: Number of live-born babies born by maternal age group and need for admission to a neonatal intensive care unit (NICU) or a special care nursery (SCN), Queensland 2009 to 2013 ............................................................................125
Table A48: Correlation of body mass index (BMI) of women giving birth with maternal age, Queensland 2009 to 2013 .............125
Table A49: Correlation of body mass index (BMI) of women giving birth with mode of birth, Queensland 2009 to 2013 ............126
Table A50: Correlation of body mass index (BMI) of women giving birth with gestation of their babies at birth (singleton births only), Queensland 2009 to 2013 ....................................................................................................126
Table A51: Correlation of body mass index (BMI) of women giving birth with birthweight of their babies (singleton births only), Queensland 2009 to 2013 ....................................................................................................127
Table A52: Correlation of body mass index (BMI) of women giving birth with perinatal outcome, Queensland 2009 to 2013 ....127
Table A53: Incidence (%) of cigarette smoking status of women giving birth with maternal age, Queensland 2010 to 2013 (smoking status data before and after 20 weeks has been collected since July 2009) .....128
Table A54: Incidence (%) of cigarette smoking status of women giving birth with gestation at birth, Queensland 2010 to 2013 (smoking status data before and after 20 weeks has been collected since July 2009) .....128
Table A55: Incidence (%) of cigarette smoking status of women giving birth with birthweight, Queensland 2010 to 2013 (smoking status data before and after 20 weeks has been collected since July 2009) .....128
Table A56: Correlation of cigarette smoking status of women giving birth with perinatal outcome, Queensland 2010 to 2013 .........................................................................................................................................129
Table A57: Incidence (%) of remoteness class of women’s primary residence with gestation at birth, Queensland 2012 to 2013 .........................................................................................................................................129
Table A58: Incidence (%) of remoteness class of women’s primary residence with birthweight of their babies, Queensland 2012 to 2013 ........................................................................................................................................129
Table A59: Correlation of remoteness class of women’s primary residence with perinatal outcome, Queensland 2012 to 2013 ........................................................................................................................................130
Table A60: Correlation of transfer of care and remoteness class of women’s primary residence with perinatal outcome in “normally-formed” babies, Queensland 2009 to 2013 ............................................................130
Table A61: Incidence (%) of socio-economic status of women giving birth with gestation at birth, Queensland 2012 to 2013 ..131
Table A62: Incidence (%) of socio-economic status of women giving birth with birthweight, Queensland 2012 to 2013 ............131
Table A63: Correlation of socio-economic status of women giving birth with perinatal outcome, Queensland 2012 to 2013 .....132
Table A64: Congenital anomaly groupings used in this report .....................................................................................................132
Table A65: Congenital anomalies reported in the pregnancy and newborn period, Queensland 2012 to 2013 ..........................133
Table A66: Congenital anomaly groups by maternal and baby characteristics, Queensland 2012 to 2013 .................................133
Table A67: Perinatal care indicators by hospital group, Queensland 2012 to 2013 .....................................................................136
Table E1: Clinical Practice Guidelines published by Queensland Maternity and Neonatal Clinical Guidelines Program as at January 2015. ....................................................................................................................................................143
Queensland Maternal and Perinatal Quality Council Report 2015
10
Abbreviations
ABS Australian Bureau of Statistics
AIHW Australian Institute of Health and Welfare
AMOSS Australasian Maternity Outcomes Surveillance System
ANZSA Australian and New Zealand Stillbirth Alliance
ARIA Accessibility/Remoteness Index of Australia
BMI body mass index
CA congenital anomaly
CHD congenital heart disease
COAG Council of Australian Governments
EPDS Edinburgh Postnatal Depression Score
g gram
HELLP Haemolysis, elevated liver enzymes, low platelet count
HLHS Hypoplastic Left Heart Syndrome
ICD-10 International Classification of Diseases, version 10
IMPROVE IMproving Perinatal Review and Outcomes Via Education
MMR maternal mortality ratio
NHMRC National Health and Medical Research Council
NICU neonatal intensive care unit
NPDC National Perinatal Data Collection
NPDCAT National Perinatal Death Clinical Audit Tool
NPESU AIHW National Perinatal Epidemiology and Statistics Unit
PA Pulmonary Atresia
PMMRC Perinatal Maternal Mortality Review Committee, New Zealand
PSANZ Perinatal Society of Australia and New Zealand
PSANZ-NDC Perinatal Society of Australia and New Zealand Neonatal Death Classification
PSANZ-PDC Perinatal Society of Australia and New Zealand Perinatal Death Classification
QCOPMM Queensland Council on Obstetric and Paediatric Morbidity and Mortality
QMNCPG Queensland Maternity and Neonatal Clinical Guidelines Program
QMPQC Queensland Maternal and Perinatal Quality Council
QHAPDC Queensland Hospital Admitted Patient Data Collection
QPDC Queensland Perinatal Data Collection
RANZCOG Royal Australian and New Zealand College of Obstetricians and Gynaecologists
RR relative risk
SALT Statistical Analysis and Linkage Team
SEIFA Socio-economic Indexes for Areas
SCN special care nursery
SMNCN Statewide Maternity and Neonatal Clinical Network
TGA Transposition of the Great Arteries
ToF Tetralogy of Fallot
ToP Termination of Pregnancy
WHO World Health Organization
11
1. Maternal and perinatal mortality
Executive summary
This report focuses primarily on the 124,832 women who gave birth to 126,881 babies in Queensland in the period 2012 to 2013, with a comparative review of maternal and perinatal death data 2009 to 2013 (five years) since the rebirth of QMPQC and the current review system being put in place, and pregnancy outcome data for the decade 2004 to 2013 depending upon data availability.
Maternal death
During 2012 and 2013 there were eight (8) maternal deaths due to causes directly or indirectly related to the pregnancy. The maternal mortality ratio in Queensland for 2012 and 2013 was 6.4 per 100,000 births. The most recently published national maternal mortality ratio was 7.1 per 100,000 births for the five years 2008 to 2012 and the Queensland maternal mortality ratio for this same period (8.5 per 100,000 births) was not statistically significantly different.
There were also four (4) maternal deaths due to incidental causes and 28 late maternal deaths. Five (5) of the 40 women who died were of Aboriginal and/or Torres Strait Islander origin; all of these deaths were late maternal deaths with causation incidental to the pregnancy. Suicide was the leading cause of death in women during pregnancy and within 365 days of the end of pregnancy.
Perinatal death
There were 1272 perinatal deaths in 2012 to 2013, giving a perinatal mortality rate of 10.0 per 1000 births (stillbirth rate 6.9 per 1000 births and neonatal mortality rate 3.2 per 1000 live births). The perinatal mortality rate, and its constituent stillbirth rate and neonatal mortality rate, have not changed significantly in Queensland over the decade 2004 to 2013. The perinatal mortality rate and the stillbirth rate in Queensland were equivalent to the most recently published Australian rate, but the neonatal mortality rate for Queensland was higher than the Australian rate.
The most common causes of perinatal death were congenital abnormality, unexplained antepartum death and spontaneous preterm birth. The most common causes of perinatal death in normally formed term infants were unexplained stillbirth and hypoxic peripartum death.
A significant proportion of the unexplained stillbirths had not been investigated in line with the Perinatal Society of Australia and New Zealand (PSANZ) recommendations, especially in relation to absence of autopsy and/or placental histopathology. QMPQC believes that the incidence of deaths being allocated to this “unknown” category would decrease significantly if perinatal deaths were correctly investigated. The group of hypoxic peripartum deaths includes deaths occurring either intrapartum or in the neonatal period without major pre-existing conditions and may benefit from closer review at both local and state level.
Aboriginal and Torres Strait Islander women continue to have higher rates of adverse pregnancy outcomes compared to non-Indigenous women. The perinatal mortality rate for babies born to Aboriginal and Torres Strait Islander mothers was approximately 50 per cent higher than the perinatal mortality rate for babies born to non- Indigenous mothers. The main contributor to this disparity relates to preterm birth.
Congenital anomalies
Congenital anomalies (one or more) were recorded in 60.7 babies per 1000 born in Queensland in 2012 and 2013. The perinatal mortality rate in the babies with congenital anomalies was more than nine times that of babies without a recorded congenital anomaly. Babies born with one or more congenital anomaly were likely to be born preterm and low birthweight. Some of these cases are related to termination of pregnancy, but these data are incompletely recorded in Queensland.
Univariate analysis of incidence related to various epidemiological factors are shown, though a more complete multivariate analysis would be needed to ensure that these relationships did not represent confounding from other factors.
Queensland Maternal and Perinatal Quality Council Report 2015
12
Pregnancy outcomes
Over the decade 2004 to 2013 there has been little change seen in the incidence of birth at less than 37 weeks. There is a clear difference in the gestational patterns between public and private sectors with a marked preponderance for caesarean section without labour and, to a lesser degree induction of labour, in the 37 to 39 week gestation period in the private sector. A significantly higher perinatal mortality rate is shown for all gestations below 40 weeks in association with elective birth (induction of labour and caesarean section without labour).
Since 2004, the frequency of caesarean section without labour (20 per cent to 21 per cent) and induction of labour (22 per cent to 23 per cent) have remained steady with pregnancies ending in spontaneous labour in less than 60 per cent of instances. Women being cared for in the public hospital system laboured spontaneously in 61 per cent to 64 per cent of pregnancies, while women being cared for in the private hospital system laboured spontaneously in 38 per cent to 42 per cent of pregnancies.
Between 2004 and 2013 the incidence of unassisted vaginal birth has progressively fallen from 60 per cent to 56 per cent, with a concomitant rise in the incidence of caesarean section birth from 32 per cent to 34 per cent. A marked disparity is seen between management in the public and private hospital systems:
• the likelihood of a woman giving birth in the public hospital system having an unassisted vaginal birth was approximately 50 per cent higher than a woman in the private hospital system.
• almost half of the women giving birth in the private hospital system had a caesarean section birth, while less than one-third of women giving birth in the public hospital system had a caesarean section birth.
Improvements in extracorporeal techniques for assisted conception have resulted in a steady almost 50 per cent fall in the incidence of multiple pregnancy over the decade 2004 to 2013 in association with these techniques. However, it is concerning to note that the same kind of improvement has not been seen in relation to the use of ovulation induction and/or artificial insemination, with the multiple pregnancy incidence associated with their use persistently in the region of eight (8) per cent.
Smoking throughout pregnancy increases the likelihood of preterm and low birthweight birth, and is associated with a 50 per cent increase in perinatal mortality risk. Smoking throughout pregnancy is significantly more common in young women and Indigenous women.
Forty–three per cent (43 per cent) of the women who gave birth in 2009 to 2013 were overweight or obese, and women in this group were more likely to have a caesarean section birth, a baby weighing more than 4000g, and a baby who died in the perinatal period.
Women living in remote and very remote areas were more likely to give birth before 37 weeks’ gestation and more likely to give birth to low birthweight babies. Perinatal mortality rates for the babies of women who live in remote and very remote areas are significantly higher than those for the babies of women living in highly accessible and accessible areas.
The perinatal mortality rate for ‘normally-formed’ babies born after the mother was transferred antenatally was 4.3 times greater than for ‘normally-formed’ babies born to women who did not require transfer. The risk of perinatal death if antenatal transfer was required was increased for all areas of maternal residence, and was higher for women transferred from metropolitan areas when compared with remote and very remote areas. Interpretation of these data is difficult. It would appear to provide some evidence that the system is providing good quality care to those women who live in rural and remote Queensland, and that there is no measurable disadvantage, at least in terms of perinatal mortality.
Indicators
A small group of care indicators, chosen for relevance by the Queensland Maternal and Perinatal Quality Council are examined in this report, with comparison hospitals being grouped in clinically relevant ‘Hospital/facility’ groupings. Indicator outcomes for all current public hospital maternity services are also presented in ‘funnel plots’ to allow facilities to benchmark against their peers.
13
1. Maternal and perinatal mortality
Recommendations
The Queensland Maternal and Perinatal Quality Council recommends:
That the Private Health Regulation Team review facility registration requirements in relation to facilities providing termination of pregnancy (TOP) services, to ensure that the need for appropriate post-TOP follow-up by health practitioners is made part of the formal advice and counselling provided to their clients. (See section 1.2.9)
That all front line clinicians (medical officers, nursing staff and bereavement support personnel) involved in Queensland Hospital Maternity and Newborn Services attend the IMPROVE educational program to enhance optimal clinical practice around the time of a perinatal death according to the PSANZ Perinatal Mortality Guidelines. (See section 1.3.8)
That Queensland Health recommends that the Therapeutic Goods Administration review the conditions for authorising medical practitioners to prescribe ovulation induction agents, with particular reference to techniques designed to minimise the incidence of multiple pregnancy. (See section 2.6)
That RANZCOG promote education programs for its Fellows and Diplomates regarding the safe and appropriate use of ovulation induction agents. (See section 2.6)
That the Health Statistics Branch progress a recommendation through the appropriate mechanisms of government to COAG, to develop an indicator relating to gestation at birth (e.g. less than 37 weeks’ gestation) in addition to the indicator relating to Indigenous baby birthweight. The Indigenous baby birthweight indicator may be more valuable if calculated for gestation equal to 37 or more weeks, tracking near-term intrauterine growth restriction. (See section 2.9)
That Queensland Health undertake a coordinated and detailed study of pregnancy outcomes for women requiring antenatal transfer during their care, to understand the reasons for and significance of the differences between outcomes for metropolitan or inner regional women and their babies when compared with rural and remote women and their babies. (See section 2.10.6)
That the published guidelines of the International Society of Ultrasound in Obstetrics and Gynaecology 2013 be adopted as core training for all points of care for fetal ultrasound screening in Queensland. (See section 3.15)
Queensland Maternal and Perinatal Quality Council Report 2015
14
Good practice points
The Queensland Maternal and Perinatal Quality Council commends the following clinical practice improvement Good Practice Points to clinicians:
Women should be weighed regularly throughout antenatal care and have their weight gain compared to Institute of Medicine guidelines for weight gain in pregnancy. (See section 1.2.4)
Autopsy should be undertaken whenever possible in the event of a maternal death, even if a Coronial autopsy is not ordered, because inheritable conditions may be discovered. (See section 1.2.7)
Women with a history of serious mental illness (e.g. schizophrenia, bipolar affective disorder, schizoaffective disorder) should routinely be offered mental health follow-up for at least the first twelve months post-partum. The woman’s GP would be the most appropriate health practitioner to undertake such follow-up in most circumstances. (See section 1.2.9)
Mental health screening is performed almost universally in the public sector but less so in the private sector. Use of the Edinburgh Post Natal Depression Score in the private sector may help to identify women who warrant further follow-up. (See section 1.2.9)
Clinicians should be wary of inadequate weight gain or weight loss during pregnancy, especially in the presence of disturbed bowel habits and/or unexpected or poorly responsive iron deficiency. Adequate diagnosis of conditions that may cause such symptoms and signs is difficult in pregnancy. (See section 1.2.10)
A rise in blood pressure during antenatal care needs careful evaluation and review. This is particularly important in women with Gestational Diabetes, who are at an increased risk of developing pre-eclampsia. (See section 1.2.11)
Hypertension in labour needs to be actively managed, even if the aetiology of the hypertension is not clearly apparent. (See section 1.2.11)
Postpartum surveillance of women with pre-eclampsia needs to be vigilant as severe deterioration can occur after delivery. (See section 1.2.11)
Clinicians responsible for the care of women who may refuse blood and blood products are advised to read carefully to the QMPQC document ‘Considerations in the management of pregnant women who refuse blood and blood products’ which can be found at www.health.qld.gov.au This document was developed in collaboration with senior members of the Jehovah’s Witness faith. (See section 1.2.12)
Post-partum thromboprophylaxis in high risk women should be continued for six weeks. (See section 1.2.11)
Following a perinatal death, all parents should be offered the option of an autopsy examination. (See section 1.3.3)
Council strongly encourages requesting placental histopathology in every case of stillbirth, neonatal death and high risk newborn according to the PSANZ Perinatal Mortality Guidelines. Placentas should be sent to pathology fresh and un-fixed. (See section 1.3.3)
Determining the accuracy of completion of the death certificates, and submitting amendments when required, should be a routine part of local perinatal mortality committee review of all perinatal deaths. Parents should be informed of this outcome prior to receiving a revised death certificate. (See section 1.3.3)
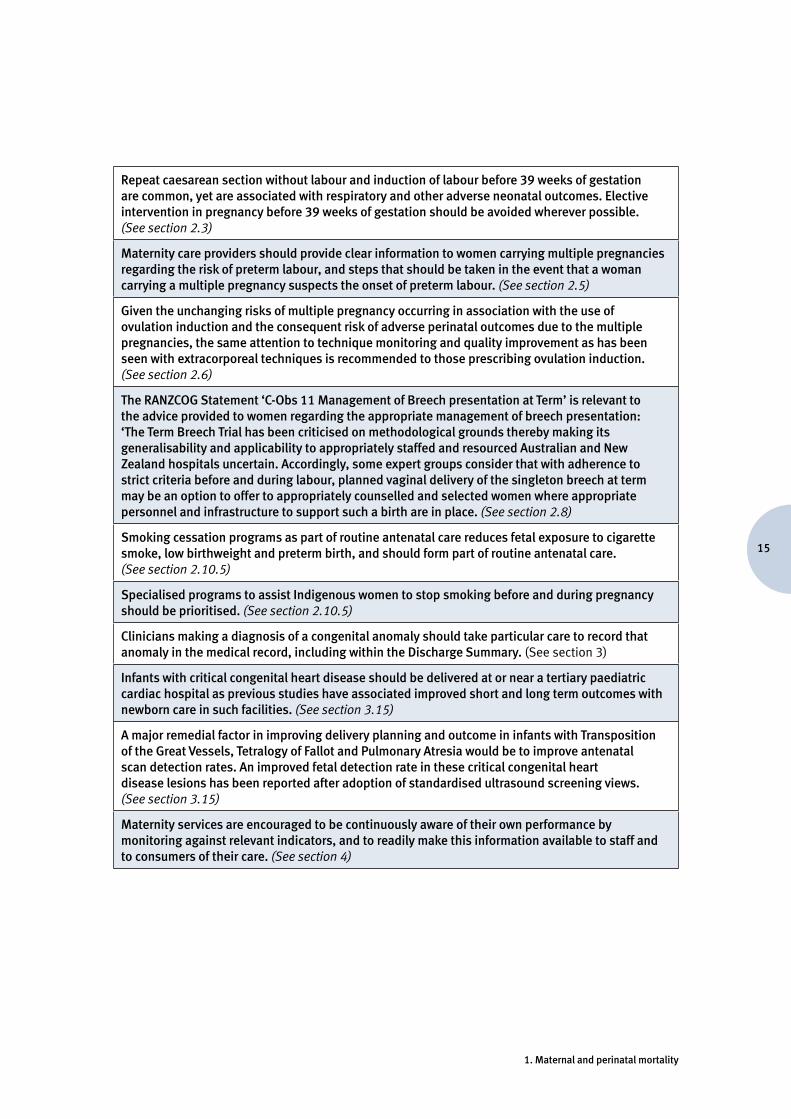
15
1. Maternal and perinatal mortality
Repeat caesarean section without labour and induction of labour before 39 weeks of gestation are common, yet are associated with respiratory and other adverse neonatal outcomes. Elective intervention in pregnancy before 39 weeks of gestation should be avoided wherever possible. (See section 2.3)
Maternity care providers should provide clear information to women carrying multiple pregnancies regarding the risk of preterm labour, and steps that should be taken in the event that a woman carrying a multiple pregnancy suspects the onset of preterm labour. (See section 2.5)
Given the unchanging risks of multiple pregnancy occurring in association with the use of ovulation induction and the consequent risk of adverse perinatal outcomes due to the multiple pregnancies, the same attention to technique monitoring and quality improvement as has been seen with extracorporeal techniques is recommended to those prescribing ovulation induction. (See section 2.6)
The RANZCOG Statement ‘C-Obs 11 Management of Breech presentation at Term’ is relevant to the advice provided to women regarding the appropriate management of breech presentation: ‘The Term Breech Trial has been criticised on methodological grounds thereby making its generalisability and applicability to appropriately staffed and resourced Australian and New Zealand hospitals uncertain. Accordingly, some expert groups consider that with adherence to strict criteria before and during labour, planned vaginal delivery of the singleton breech at term may be an option to offer to appropriately counselled and selected women where appropriate personnel and infrastructure to support such a birth are in place. (See section 2.8)
Smoking cessation programs as part of routine antenatal care reduces fetal exposure to cigarette smoke, low birthweight and preterm birth, and should form part of routine antenatal care. (See section 2.10.5)
Specialised programs to assist Indigenous women to stop smoking before and during pregnancy should be prioritised. (See section 2.10.5)
Clinicians making a diagnosis of a congenital anomaly should take particular care to record that anomaly in the medical record, including within the Discharge Summary. (See section 3)
Infants with critical congenital heart disease should be delivered at or near a tertiary paediatric cardiac hospital as previous studies have associated improved short and long term outcomes with newborn care in such facilities. (See section 3.15)
A major remedial factor in improving delivery planning and outcome in infants with Transposition of the Great Vessels, Tetralogy of Fallot and Pulmonary Atresia would be to improve antenatal scan detection rates. An improved fetal detection rate in these critical congenital heart disease lesions has been reported after adoption of standardised ultrasound screening views. (See section 3.15)
Maternity services are encouraged to be continuously aware of their own performance by monitoring against relevant indicators, and to readily make this information available to staff and to consumers of their care. (See section 4)
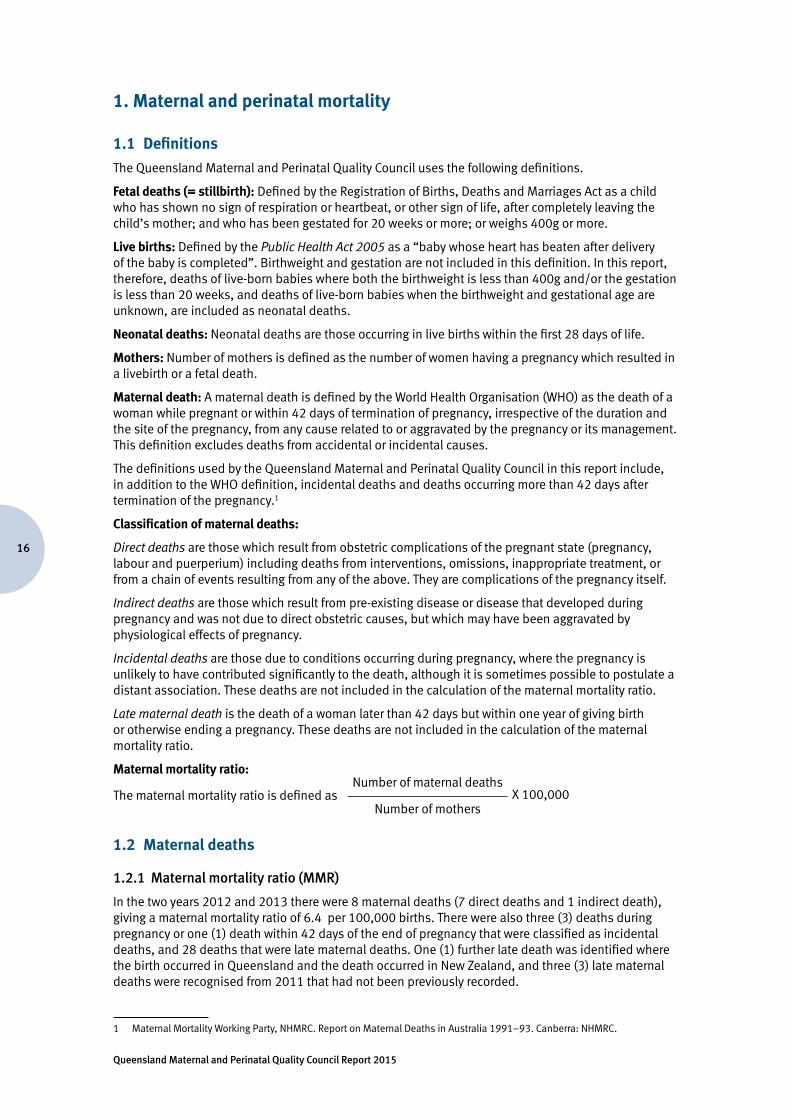
Queensland Maternal and Perinatal Quality Council Report 2015
16
1. Maternal and perinatal mortality
1.1 Definitions
The Queensland Maternal and Perinatal Quality Council uses the following definitions.
Fetal deaths (= stillbirth): Defined by the Registration of Births, Deaths and Marriages Act as a child who has shown no sign of respiration or heartbeat, or other sign of life, after completely leaving the child’s mother; and who has been gestated for 20 weeks or more; or weighs 400g or more.
Live births: Defined by the Public Health Act 2005 as a “baby whose heart has beaten after delivery of the baby is completed”. Birthweight and gestation are not included in this definition. In this report, therefore, deaths of live-born babies where both the birthweight is less than 400g and/or the gestation is less than 20 weeks, and deaths of live-born babies when the birthweight and gestational age are unknown, are included as neonatal deaths.
Neonatal deaths: Neonatal deaths are those occurring in live births within the first 28 days of life.
Mothers: Number of mothers is defined as the number of women having a pregnancy which resulted in a livebirth or a fetal death.
Maternal death: A maternal death is defined by the World Health Organisation (WHO) as the death of a woman while pregnant or within 42 days of termination of pregnancy, irrespective of the duration and the site of the pregnancy, from any cause related to or aggravated by the pregnancy or its management. This definition excludes deaths from accidental or incidental causes.
The definitions used by the Queensland Maternal and Perinatal Quality Council in this report include, in addition to the WHO definition, incidental deaths and deaths occurring more than 42 days after termination of the pregnancy.1
Classification of maternal deaths:
Direct deaths are those which result from obstetric complications of the pregnant state (pregnancy, labour and puerperium) including deaths from interventions, omissions, inappropriate treatment, or from a chain of events resulting from any of the above. They are complications of the pregnancy itself.
Indirect deaths are those which result from pre-existing disease or disease that developed during pregnancy and was not due to direct obstetric causes, but which may have been aggravated by physiological effects of pregnancy.
Incidental deaths are those due to conditions occurring during pregnancy, where the pregnancy is unlikely to have contributed significantly to the death, although it is sometimes possible to postulate a distant association. These deaths are not included in the calculation of the maternal mortality ratio.
Late maternal death is the death of a woman later than 42 days but within one year of giving birth or otherwise ending a pregnancy. These deaths are not included in the calculation of the maternal mortality ratio.
Maternal mortality ratio:
The maternal mortality ratio is defined as
Number of maternal deaths
Number of mothersX 100,000
1.2 Maternal deaths
1.2.1 Maternal mortality ratio (MMR)
In the two years 2012 and 2013 there were 8 maternal deaths (7 direct deaths and 1 indirect death), giving a maternal mortality ratio of 6.4 per 100,000 births. There were also three (3) deaths during pregnancy or one (1) death within 42 days of the end of pregnancy that were classified as incidental deaths, and 28 deaths that were late maternal deaths. One (1) further late death was identified where the birth occurred in Queensland and the death occurred in New Zealand, and three (3) late maternal deaths were recognised from 2011 that had not been previously recorded.
1 Maternal Mortality Working Party, NHMRC. Report on Maternal Deaths in Australia 1991–93. Canberra: NHMRC.
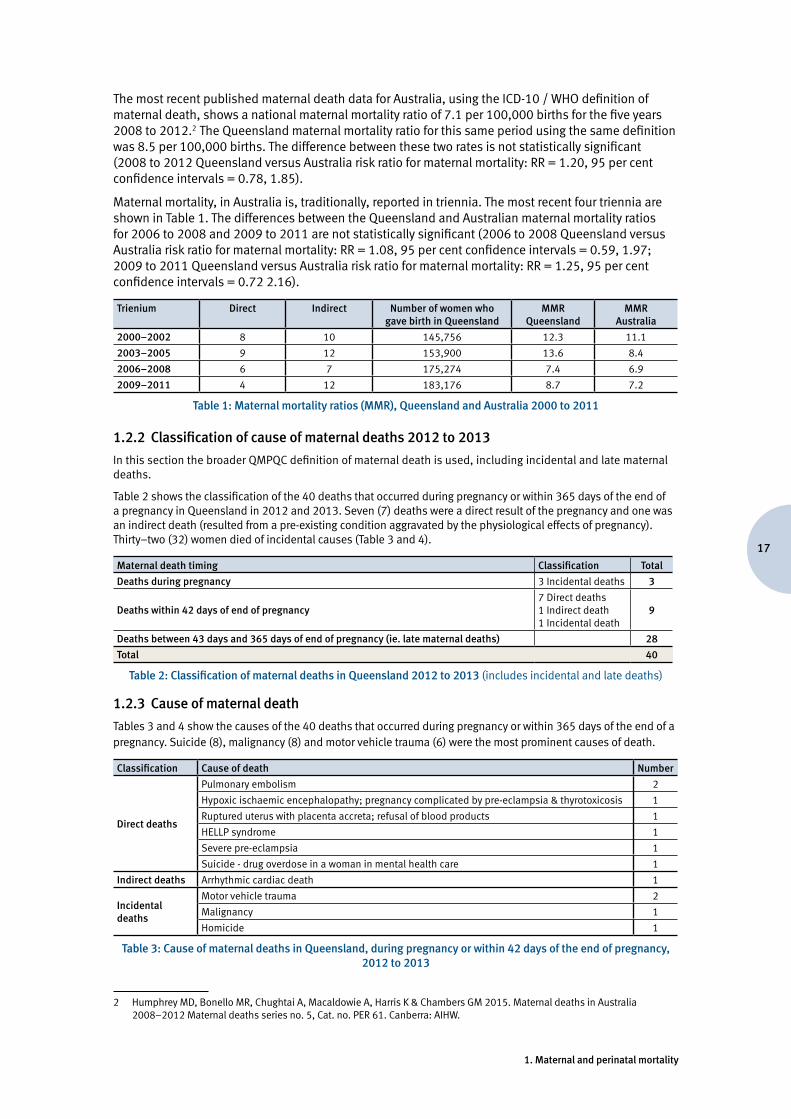
17
1. Maternal and perinatal mortality
The most recent published maternal death data for Australia, using the ICD-10 / WHO definition of maternal death, shows a national maternal mortality ratio of 7.1 per 100,000 births for the five years 2008 to 2012.2 The Queensland maternal mortality ratio for this same period using the same definition was 8.5 per 100,000 births. The difference between these two rates is not statistically significant (2008 to 2012 Queensland versus Australia risk ratio for maternal mortality: RR = 1.20, 95 per cent confidence intervals = 0.78, 1.85).
Maternal mortality, in Australia is, traditionally, reported in triennia. The most recent four triennia are shown in Table 1. The differences between the Queensland and Australian maternal mortality ratios for 2006 to 2008 and 2009 to 2011 are not statistically significant (2006 to 2008 Queensland versus Australia risk ratio for maternal mortality: RR = 1.08, 95 per cent confidence intervals = 0.59, 1.97; 2009 to 2011 Queensland versus Australia risk ratio for maternal mortality: RR = 1.25, 95 per cent confidence intervals = 0.72 2.16).
Trienium Direct Indirect Number of women who gave birth in Queensland
MMRQueensland
MMRAustralia
2000–2002 8 10 145,756 12.3 11.1
2003–2005 9 12 153,900 13.6 8.4
2006–2008 6 7 175,274 7.4 6.9
2009–2011 4 12 183,176 8.7 7.2
Table 1: Maternal mortality ratios (MMR), Queensland and Australia 2000 to 2011
1.2.2 Classification of cause of maternal deaths 2012 to 2013
In this section the broader QMPQC definition of maternal death is used, including incidental and late maternal deaths.
Table 2 shows the classification of the 40 deaths that occurred during pregnancy or within 365 days of the end of a pregnancy in Queensland in 2012 and 2013. Seven (7) deaths were a direct result of the pregnancy and one was an indirect death (resulted from a pre-existing condition aggravated by the physiological effects of pregnancy). Thirty–two (32) women died of incidental causes (Table 3 and 4).
Maternal death timing Classification Total
Deaths during pregnancy 3 Incidental deaths 3
Deaths within 42 days of end of pregnancy7 Direct deaths1 Indirect death1 Incidental death
9
Deaths between 43 days and 365 days of end of pregnancy (ie. late maternal deaths) 28
Total 40
Table 2: Classification of maternal deaths in Queensland 2012 to 2013 (includes incidental and late deaths)
1.2.3 Cause of maternal death
Tables 3 and 4 show the causes of the 40 deaths that occurred during pregnancy or within 365 days of the end of a pregnancy. Suicide (8), malignancy (8) and motor vehicle trauma (6) were the most prominent causes of death.
Classification Cause of death Number
Direct deaths
Pulmonary embolism 2
Hypoxic ischaemic encephalopathy; pregnancy complicated by pre-eclampsia & thyrotoxicosis 1
Ruptured uterus with placenta accreta; refusal of blood products 1
HELLP syndrome 1
Severe pre-eclampsia 1
Suicide - drug overdose in a woman in mental health care 1
Indirect deaths Arrhythmic cardiac death 1
Incidental deaths
Motor vehicle trauma 2
Malignancy 1
Homicide 1
Table 3: Cause of maternal deaths in Queensland, during pregnancy or within 42 days of the end of pregnancy, 2012 to 2013
2 Humphrey MD, Bonello MR, Chughtai A, Macaldowie A, Harris K & Chambers GM 2015. Maternal deaths in Australia 2008–2012 Maternal deaths series no. 5, Cat. no. PER 61. Canberra: AIHW.
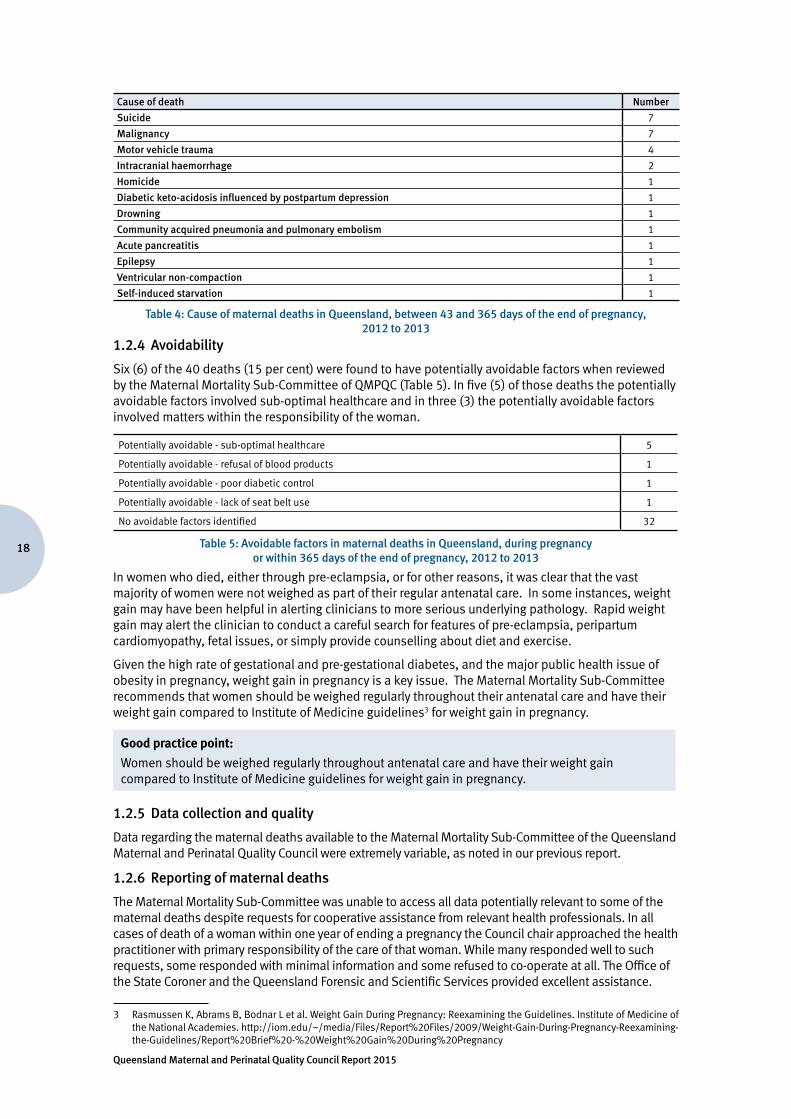
Queensland Maternal and Perinatal Quality Council Report 2015
18
Cause of death Number
Suicide 7
Malignancy 7
Motor vehicle trauma 4
Intracranial haemorrhage 2
Homicide 1
Diabetic keto-acidosis influenced by postpartum depression 1
Drowning 1
Community acquired pneumonia and pulmonary embolism 1
Acute pancreatitis 1
Epilepsy 1
Ventricular non-compaction 1
Self-induced starvation 1
Table 4: Cause of maternal deaths in Queensland, between 43 and 365 days of the end of pregnancy, 2012 to 2013
1.2.4 Avoidability
Six (6) of the 40 deaths (15 per cent) were found to have potentially avoidable factors when reviewed by the Maternal Mortality Sub-Committee of QMPQC (Table 5). In five (5) of those deaths the potentially avoidable factors involved sub-optimal healthcare and in three (3) the potentially avoidable factors involved matters within the responsibility of the woman.
Potentially avoidable - sub-optimal healthcare 5
Potentially avoidable - refusal of blood products 1
Potentially avoidable - poor diabetic control 1
Potentially avoidable - lack of seat belt use 1
No avoidable factors identified 32
Table 5: Avoidable factors in maternal deaths in Queensland, during pregnancy or within 365 days of the end of pregnancy, 2012 to 2013
In women who died, either through pre-eclampsia, or for other reasons, it was clear that the vast majority of women were not weighed as part of their regular antenatal care. In some instances, weight gain may have been helpful in alerting clinicians to more serious underlying pathology. Rapid weight gain may alert the clinician to conduct a careful search for features of pre-eclampsia, peripartum cardiomyopathy, fetal issues, or simply provide counselling about diet and exercise.
Given the high rate of gestational and pre-gestational diabetes, and the major public health issue of obesity in pregnancy, weight gain in pregnancy is a key issue. The Maternal Mortality Sub-Committee recommends that women should be weighed regularly throughout their antenatal care and have their weight gain compared to Institute of Medicine guidelines3 for weight gain in pregnancy.
Good practice point:
Women should be weighed regularly throughout antenatal care and have their weight gain compared to Institute of Medicine guidelines for weight gain in pregnancy.
1.2.5 Data collection and quality
Data regarding the maternal deaths available to the Maternal Mortality Sub-Committee of the Queensland Maternal and Perinatal Quality Council were extremely variable, as noted in our previous report.
1.2.6 Reporting of maternal deaths
The Maternal Mortality Sub-Committee was unable to access all data potentially relevant to some of the maternal deaths despite requests for cooperative assistance from relevant health professionals. In all cases of death of a woman within one year of ending a pregnancy the Council chair approached the health practitioner with primary responsibility of the care of that woman. While many responded well to such requests, some responded with minimal information and some refused to co-operate at all. The Office of the State Coroner and the Queensland Forensic and Scientific Services provided excellent assistance.
3 Rasmussen K, Abrams B, Bodnar L et al. Weight Gain During Pregnancy: Reexamining the Guidelines. Institute of Medicine of the National Academies. http://iom.edu/~/media/Files/Report%20Files/2009/Weight-Gain-During-Pregnancy-Reexamining-the-Guidelines/Report%20Brief%20-%20Weight%20Gain%20During%20Pregnancy
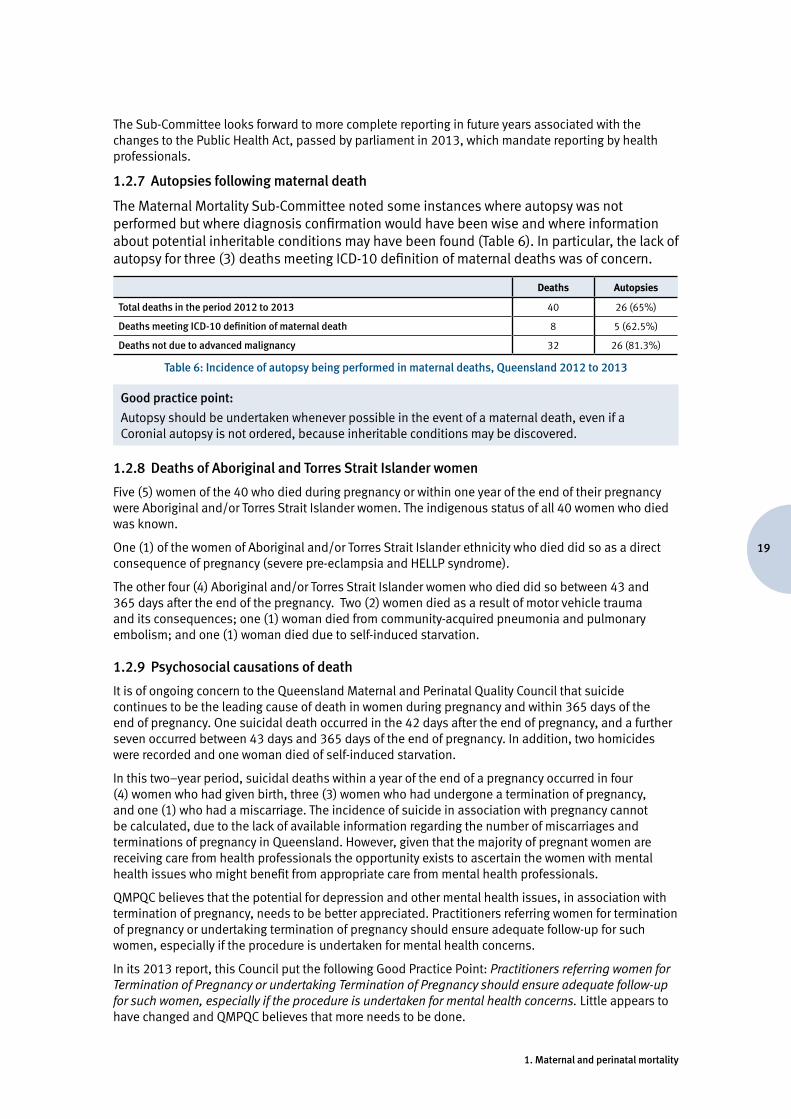
19
1. Maternal and perinatal mortality
The Sub-Committee looks forward to more complete reporting in future years associated with the changes to the Public Health Act, passed by parliament in 2013, which mandate reporting by health professionals.
1.2.7 Autopsies following maternal death
The Maternal Mortality Sub-Committee noted some instances where autopsy was not performed but where diagnosis confirmation would have been wise and where information about potential inheritable conditions may have been found (Table 6). In particular, the lack of autopsy for three (3) deaths meeting ICD-10 definition of maternal deaths was of concern.
Deaths Autopsies
Total deaths in the period 2012 to 2013 40 26 (65%)
Deaths meeting ICD-10 definition of maternal death 8 5 (62.5%)
Deaths not due to advanced malignancy 32 26 (81.3%)
Table 6: Incidence of autopsy being performed in maternal deaths, Queensland 2012 to 2013
Good practice point:
Autopsy should be undertaken whenever possible in the event of a maternal death, even if a Coronial autopsy is not ordered, because inheritable conditions may be discovered.
1.2.8 Deaths of Aboriginal and Torres Strait Islander women
Five (5) women of the 40 who died during pregnancy or within one year of the end of their pregnancy were Aboriginal and/or Torres Strait Islander women. The indigenous status of all 40 women who died was known.
One (1) of the women of Aboriginal and/or Torres Strait Islander ethnicity who died did so as a direct consequence of pregnancy (severe pre-eclampsia and HELLP syndrome).
The other four (4) Aboriginal and/or Torres Strait Islander women who died did so between 43 and 365 days after the end of the pregnancy. Two (2) women died as a result of motor vehicle trauma and its consequences; one (1) woman died from community-acquired pneumonia and pulmonary embolism; and one (1) woman died due to self-induced starvation.
1.2.9 Psychosocial causations of death
It is of ongoing concern to the Queensland Maternal and Perinatal Quality Council that suicide continues to be the leading cause of death in women during pregnancy and within 365 days of the end of pregnancy. One suicidal death occurred in the 42 days after the end of pregnancy, and a further seven occurred between 43 days and 365 days of the end of pregnancy. In addition, two homicides were recorded and one woman died of self-induced starvation.
In this two–year period, suicidal deaths within a year of the end of a pregnancy occurred in four (4) women who had given birth, three (3) women who had undergone a termination of pregnancy, and one (1) who had a miscarriage. The incidence of suicide in association with pregnancy cannot be calculated, due to the lack of available information regarding the number of miscarriages and terminations of pregnancy in Queensland. However, given that the majority of pregnant women are receiving care from health professionals the opportunity exists to ascertain the women with mental health issues who might benefit from appropriate care from mental health professionals.
QMPQC believes that the potential for depression and other mental health issues, in association with termination of pregnancy, needs to be better appreciated. Practitioners referring women for termination of pregnancy or undertaking termination of pregnancy should ensure adequate follow-up for such women, especially if the procedure is undertaken for mental health concerns.
In its 2013 report, this Council put the following Good Practice Point: Practitioners referring women for Termination of Pregnancy or undertaking Termination of Pregnancy should ensure adequate follow-up for such women, especially if the procedure is undertaken for mental health concerns. Little appears to have changed and QMPQC believes that more needs to be done.
Queensland Maternal and Perinatal Quality Council Report 2015
20
Recommendation:
That the Private Health Regulation Team review facility registration requirements in relation to facilities providing termination of pregnancy (TOP) services, to ensure that the need for appropriate post-TOP follow-up by health practitioners is made part of the formal advice and counselling provided to their clients.
Equally, active follow-up of the women known to be at risk of depression from prenatal and postnatal screening needs to be universal and effective.
Beyondblue, in its Clinical Practice Guidelines,4 recommends that:• The Edinburgh Postnatal Depression Score (EPDS) should be used by health professionals as a
component of the assessment of all women for symptoms of depression in the antenatal period.• Health professionals should use the EPDS as a component of the assessment of all women in the
postnatal period for symptoms of depression or co-occurring depression and anxiety.• A score of 13 or more can be used for detecting symptoms of major depression in the postnatal
period.
Good practice points:
Women with a history of serious mental illness (e.g. schizophrenia, bipolar affective disorder, schizoaffective disorder) should routinely be offered mental health follow-up for at least the first twelve months post-partum. The woman’s GP would be the most appropriate health practitioner to undertake such follow-up in most circumstances.
Mental health screening is performed almost universally in the public sector but less so in the private sector. Use of the Edinburgh Post Natal Depression Score in the private sector may help to identify women who warrant further follow-up.
1.2.10 Deaths due to malignancy
Eight women died of malignancy, which was undiagnosed prior to, during and after pregnancy. It is important to note that many of the symptoms of pregnancy, such as nausea, abdominal pain or rectal bleeding can also be features of malignancy. In many of the cases of malignancy that were undiagnosed, careful assessment of the clinical notes revealed that all of these women had actually lost weight (often substantial amounts of weight) during pregnancy. This further emphasises the need to weigh women through the antenatal period, and in women who do not gain weight appropriately, for clinicians to undertake clinical history, examination and basic investigations to exclude serious disease.
Women who have any of the following symptoms warrant a thorough clinical history, examination, and appropriate investigations:
• longstanding post coital bleeding• rectal bleeding• abdominal pain• fevers• unexplained weight loss.
Most women who died of malignancy that was undiagnosed had presented to numerous providers (general practitioners, obstetricians, doctors in training, midwives), and had reported multiple symptoms that were clearly associated with their subsequently diagnosed malignancy. Often, very little evidence could be obtained of any health care provider having undertaken appropriate clinical history, examination or basic investigations to exclude serious underlying pathology. In addition, severe iron deficiency anaemia was identified in all women who subsequently died of colorectal carcinoma, but all of these women also had severe weight loss. The combination of significant weight loss, in the presence of iron deficiency anaemia probably warrants a thorough search for underlying gastrointestinal pathology (inflammatory bowel disease, coeliac disease, malignancy). Due to the increasing age of pregnant women, the increasing levels of obesity in pregnancy, and presumably other factors, malignancy is increasingly common in pregnancy, and so malignancy should be considered and excluded as part of thorough clinical care of pregnant women.
4 Austin M-P, Highet N and the Guidelines Expert Advisory Committee. (2011).“Clinical practice guidelines for depression and related disorders—anxiety, bipolar disorder and puerperal psychosis—in the perinatal period. A guideline for primary care health professionals.” Melbourne: beyondblue: the national depression initiative.
21
1. Maternal and perinatal mortality
Good practice point:
Clinicians should be wary of inadequate weight gain or weight loss during pregnancy, especially in the presence of disturbed bowel habits and/or unexpected or poorly responsive iron deficiency. Adequate diagnosis of conditions that may cause such symptoms and signs is difficult in pregnancy.
1.2.11 Hypertension in pregnancy
There were three (3) direct deaths that were the consequence of pre-eclampsia and its complications. Review of these cases revealed inadequate awareness of the processes underlying pre-eclampsia and inadequate management of hypertension. The Maternal Mortality Sub-committee of QMPQC noted that antenatal surveillance needs to be thorough even in women deemed low risk as preeclampsia can occur with little warning and not necessarily in a textbook fashion (e.g. proteinuria may occur before hypertension).
Good practice points:
A rise in blood pressure during antenatal care needs careful evaluation and review. This is particularly important in women with Gestational Diabetes, who are at an increased risk of developing pre-eclampsia.
Hypertension in labour needs to be actively managed, even if the aetiology of the hypertension is not clearly apparent.
Postpartum surveillance of women with pre-eclampsia needs to be vigilant as severe deterioration can occur after delivery.
1.2.12 Other clinical issues raised by case review
A report of this type does not allow for detailed discussion of individual case management. However, the Maternal Mortality Sub-Committee noted two areas of concern requiring comment in the following good practice points:
Good practice point:
Clinicians responsible for the care of women who may refuse blood and blood products are advised to read carefully the QMPQC document ‘Considerations in the management of pregnant women who refuse blood and blood products’ which can be found at www.health.qld.gov.au. This document was developed in collaboration with senior members of the Jehovah’s Witness faith.
Good practice point:
Post-partum thromboprophylaxis in high risk women should be continued for six weeks.
1.2.13 Characteristics of women who died in the decade 2004 to 2013
Tables 7 and 8 provide an overview of the 53 women who died as a direct or indirect result of pregnancy over the last decade (2004 to 2013) during pregnancy or within 42 days of the end of pregnancy (ie. direct and indirect maternal deaths).
Forty–seven per cent (47 per cent) of the deaths were direct deaths. Twenty–three per cent (23 per cent) occurred during pregnancy, fifty-eight per cent (58 per cent) occurred after the birth of the baby and nineteen per cent (19 per cent) occurred after a termination of pregnancy or miscarriage (Table 7). Thirty–four percent (34 per cent) of the deaths were found to have been avoidable or potentially avoidable.
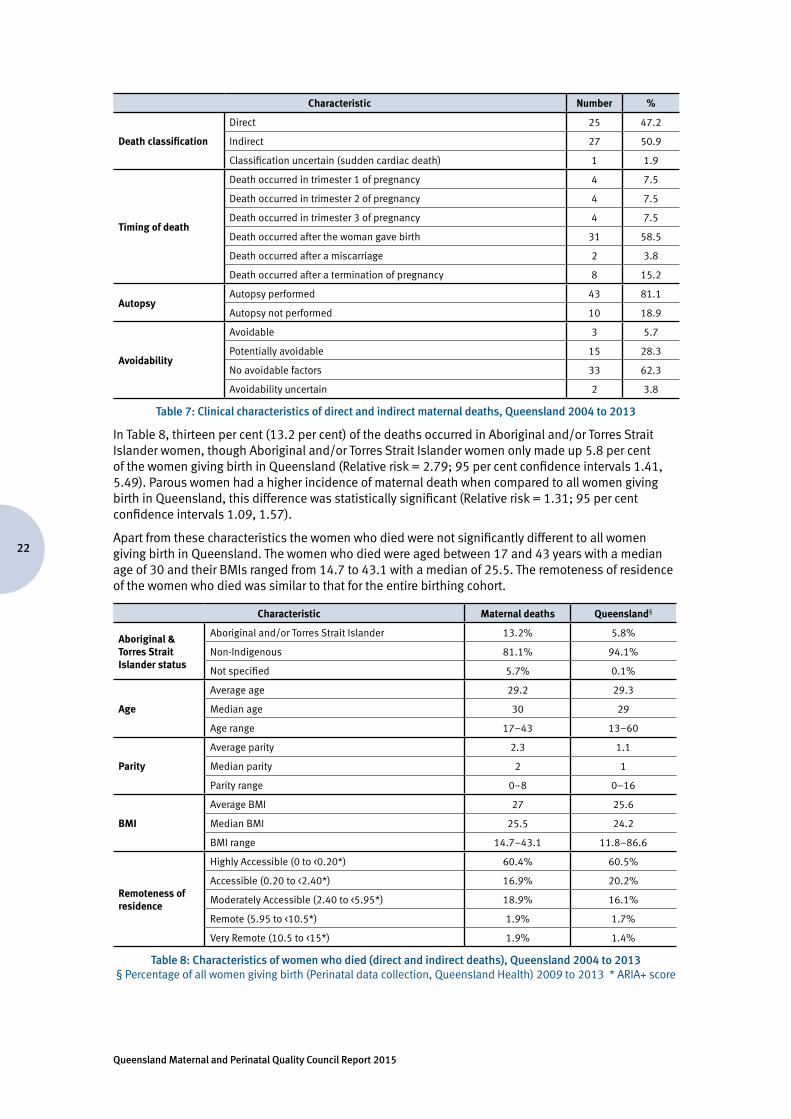
Queensland Maternal and Perinatal Quality Council Report 2015
22
Characteristic Number %
Death classification
Direct 25 47.2
Indirect 27 50.9
Classification uncertain (sudden cardiac death) 1 1.9
Timing of death
Death occurred in trimester 1 of pregnancy 4 7.5
Death occurred in trimester 2 of pregnancy 4 7.5
Death occurred in trimester 3 of pregnancy 4 7.5
Death occurred after the woman gave birth 31 58.5
Death occurred after a miscarriage 2 3.8
Death occurred after a termination of pregnancy 8 15.2
AutopsyAutopsy performed 43 81.1
Autopsy not performed 10 18.9
Avoidability
Avoidable 3 5.7
Potentially avoidable 15 28.3
No avoidable factors 33 62.3
Avoidability uncertain 2 3.8
Table 7: Clinical characteristics of direct and indirect maternal deaths, Queensland 2004 to 2013
In Table 8, thirteen per cent (13.2 per cent) of the deaths occurred in Aboriginal and/or Torres Strait Islander women, though Aboriginal and/or Torres Strait Islander women only made up 5.8 per cent of the women giving birth in Queensland (Relative risk = 2.79; 95 per cent confidence intervals 1.41, 5.49). Parous women had a higher incidence of maternal death when compared to all women giving birth in Queensland, this difference was statistically significant (Relative risk = 1.31; 95 per cent confidence intervals 1.09, 1.57).
Apart from these characteristics the women who died were not significantly different to all women giving birth in Queensland. The women who died were aged between 17 and 43 years with a median age of 30 and their BMIs ranged from 14.7 to 43.1 with a median of 25.5. The remoteness of residence of the women who died was similar to that for the entire birthing cohort.
Characteristic Maternal deaths Queensland§
Aboriginal & Torres Strait Islander status
Aboriginal and/or Torres Strait Islander 13.2% 5.8%
Non-Indigenous 81.1% 94.1%
Not specified 5.7% 0.1%
Age
Average age 29.2 29.3
Median age 30 29
Age range 17–43 13–60
Parity
Average parity 2.3 1.1
Median parity 2 1
Parity range 0–8 0–16
BMI
Average BMI 27 25.6
Median BMI 25.5 24.2
BMI range 14.7–43.1 11.8–86.6
Remoteness of residence
Highly Accessible (0 to <0.20*) 60.4% 60.5%
Accessible (0.20 to <2.40*) 16.9% 20.2%
Moderately Accessible (2.40 to <5.95*) 18.9% 16.1%
Remote (5.95 to <10.5*) 1.9% 1.7%
Very Remote (10.5 to <15*) 1.9% 1.4%
Table 8: Characteristics of women who died (direct and indirect deaths), Queensland 2004 to 2013§ Percentage of all women giving birth (Perinatal data collection, Queensland Health) 2009 to 2013 * ARIA+ score
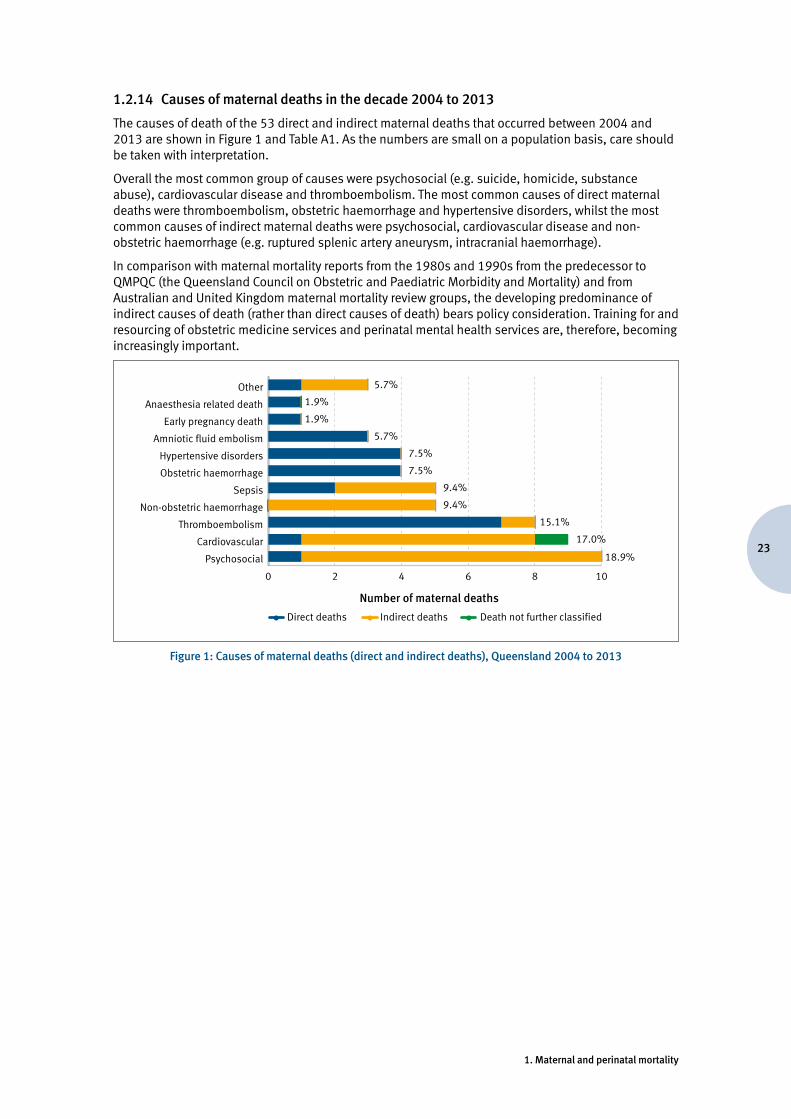
23
1. Maternal and perinatal mortality
1.2.14 Causes of maternal deaths in the decade 2004 to 2013
The causes of death of the 53 direct and indirect maternal deaths that occurred between 2004 and 2013 are shown in Figure 1 and Table A1. As the numbers are small on a population basis, care should be taken with interpretation.
Overall the most common group of causes were psychosocial (e.g. suicide, homicide, substance abuse), cardiovascular disease and thromboembolism. The most common causes of direct maternal deaths were thromboembolism, obstetric haemorrhage and hypertensive disorders, whilst the most common causes of indirect maternal deaths were psychosocial, cardiovascular disease and non-obstetric haemorrhage (e.g. ruptured splenic artery aneurysm, intracranial haemorrhage).
In comparison with maternal mortality reports from the 1980s and 1990s from the predecessor to QMPQC (the Queensland Council on Obstetric and Paediatric Morbidity and Mortality) and from Australian and United Kingdom maternal mortality review groups, the developing predominance of indirect causes of death (rather than direct causes of death) bears policy consideration. Training for and resourcing of obstetric medicine services and perinatal mental health services are, therefore, becoming increasingly important.
0 2 4 6 8 10
Psychosocial
Cardiovascular
Thromboembolism
Non-obstetric haemorrhage
Sepsis
Obstetric haemorrhage
Hypertensive disorders
Amniotic fluid embolism
Early pregnancy death
Anaesthesia related death
Other
Number of maternal deaths
Direct deaths Indirect deaths Death not further classified
17.0%
18.9%
15.1%
9.4%
9.4%
7.5%
7.5%
5.7%
1.9%
1.9%
5.7%
Figure 1: Causes of maternal deaths (direct and indirect deaths), Queensland 2004 to 2013
Queensland Maternal and Perinatal Quality Council Report 2015
24
1.3 Perinatal deaths
1.3.1 Perinatal mortality review modus operandi
All perinatal deaths in Queensland are subject to a systematic review. Perinatal mortality data have been obtained from the Perinatal Data Collection Unit, Health Statistics Branch, Department of Health, the Registry of Births Deaths and Marriages, and case summaries from hospital and regional perinatal mortality committees in Queensland. A number of local perinatal mortality committees collaborate with the Council in the perinatal mortality review process, submitting confidential case summaries and classifications.
1.3.2 Clinical classification
The QMPQC has adopted the Perinatal Society of Australia and New Zealand (PSANZ) classification system including the Perinatal Death Classification (PSANZ-PDC) and, in addition for neonatal deaths, the PSANZ Neonatal Death Classification (PSANZ-NDC)5, and all perinatal deaths in Queensland are classified accordingly. The system has been shown to perform well against other contemporary systems6. The purpose of classifying deaths according to the PSANZ system is to identify preventable factors associated with perinatal death, through the systematic application of clinically relevant categories to large populations.
1.3.3 Data collection and data quality
The data used to assist in classification of perinatal deaths by the Perinatal Mortality Sub-Committee are sourced from:
• Electronic extracts and paper MR63D forms, which are completed by all maternity hospitals in Queensland and forwarded to the Perinatal Data Collection Unit (Queensland Department of Health). The electronic extract and paper MR63D form (a potentially rich data source containing over 50 data fields) is used to supply information to the National Perinatal Epidemiology and Statistics Unit (NPESU) and can also be used for benchmarking and other research projects
• The Medical Certificate of Cause of Perinatal Death (Forms 9 and 9A)• The National Perinatal Death Clinical Audit Tool (NPDCAT) summaries received and discharge
summaries (where available) from hospitals• Pathology reports including autopsy, placental pathology and cytogenetic reports.
During the course of review of perinatal deaths, the Sub-Committee’s ability to classify cause of death accurately was often limited due to inadequate investigation and conflicting or lacking information in the materials provided. Low autopsy rates continue to pose a major limitation.
Placental pathology, which is an essential component of investigation protocol for stillbirths and neonatal deaths, was often not performed in cases of death where this examination may have provided the only lead to reasons for the death. Despite a presumed cause of death, placental pathology should be undertaken for all stillbirths and also for births of infants at increased risk of neonatal death. Placental histopathology remains a cornerstone investigation of perinatal death and other poor pregnancy outcomes.
The overall autopsy rate has remained relatively constant at thirty per cent (30 per cent). This rate is disappointingly low. Autopsy remains the gold standard investigation and appropriate counselling should be provided to all parents following a stillbirth or neonatal death about the option of a high quality autopsy7. Parents should be made aware that important information about the cause of death may be missed if an autopsy is not performed. Unfortunately, an insufficient number of pathologists with expertise in perinatal autopsy in Queensland is an impediment to quality and reporting. Delays in receiving autopsy reports of six months or more are not uncommon in Queensland.
5 Chan A, King J, Flenady V, Haslam R, Tudehope D. (2004). “Classification of perinatal deaths: development of the Australian and New Zealand Classifications.” J Paediatr. Child Health. Jul; 40(7):340-7.
6 Flenady V, Frøen JF, Pinar H, Torabi R, Saastad E, Guyon G, Russell L, Charles A, Harrison C, Chauke L, Pattinson R, Koshy R, Bahrin S, Gardener G, Day K, Petersson K, Gordon A, Gilshenan K. (2009). “An evaluation of classification systems for stillbirth. BMC Pregnancy Childbirth.”9:24.
7 Flenady V, King J, Charles A, et al.(2009). “Clinical practice guideline for perinatal mortality.” Version 2.2 April. www.psanz.org.au Accessed August 2011
25
1. Maternal and perinatal mortality
Good practice points:
Following a perinatal death, all parents should be offered the option of an autopsy examination.
Council strongly encourages requesting placental histopathology in every case of stillbirth, neonatal death and high risk newborn according to the PSANZ Perinatal Mortality Guidelines8. Placentas should be sent to pathology fresh and un-fixed.
The need for high quality perinatal autopsies, performed by pathologists with specialised paediatric and perinatal training and experience is emphasised. This is of particular importance at a time of potential changes in the structure and delivery of health services. The necessity for training, retaining, and supporting pathologists with expertise in perinatal autopsy procedures is also emphasised. Recognition of the need for continued investment of time and resources is required for maintenance of accessible, sustainable, tertiary level post mortem services. Perinatal post mortem services are largely restricted to the public sector. Access to perinatal post mortem services and out of pocket costs are significant barriers to bereaved parents in the private health sector seeking perinatal post mortem services.
Death certificate (DC) data are notoriously inaccurate worldwide9 and, in Australia, it is largely attributed to the policy of completing the death certificate at the time of a perinatal death prior to full investigation and review of the death. The Perinatal Mortality Sub-Committee found that the information on death certificates was often inaccurate. Common errors included administrative aspects due to lack of knowledge of the requirements and assigned cause of death. The Perinatal Mortality Sub-Committee is undertaking a detailed review of death certificates to identify areas for clinician education to improve accuracy of this information. Following review and classification of perinatal deaths, clinicians are encouraged to submit a revised death certificate where information is found to be inaccurate for re-issuing to the parents. Parents should be contacted prior to receiving a revised death certificate to inform them of this outcome.
Good practice point:
Determining the accuracy of completion of the death certificates, and submitting amendments when required, should be a routine part of local perinatal mortality committee review of all perinatal deaths. Parents should be informed of this outcome prior to receiving a revised death certificate
1.3.4 The IMPROVE educational program
The IMPROVE program (IMproving Perinatal Review and Outcomes Via Education) has been well received across Queensland. Throughout the conduct of these workshops it has become clear that IMPROVE addresses a real gap in knowledge and expertise for many front-line clinicians when caring for parents following a perinatal death. Continuation of this program is crucially important to ensure optimal bereavement care and to illustrate and explain the advantages of a thorough investigation of every perinatal death, particularly autopsy, and to better equip clinicians with appropriate information and skills for counselling parents regarding their decision on autopsy.
Through funding made available by the Queensland Department of Health, the educational program IMPROVE (IMproving Perinatal Review and Outcomes Via Education) based on the PSANZ Perinatal Mortality Guidelines, was made available to clinicians providing maternity care in the larger Queensland maternity hospitals (www.stillbirthalliance.org.au).
Between January 2010 and December 2012 18 IMPROVE workshops were conducted in Queensland: Mater Mothers’ Hospital (3), Gold Coast Hospital (2), Ipswich Hospital (2), Royal Brisbane and Women’s Hospital (2), Cairns Base Hospital, Logan Hospital, Mackay Base Hospital, Roma Hospital, Rockhampton Base Hospital, The Townsville Hospital, and Toowoomba Hospital. A total of 441 participants attended these workshops (23 per cent medical staff, 63 per cent midwives, 4.2 per cent nurses, 9.8 per cent other).
In Queensland, IMPROVE can currently only be offered on a fee for service basis which may result in suboptimal coverage. Continuation of this program is crucially important to ensure high quality investigation and audit of all perinatal deaths and optimal care for women, their partners and families who experience this loss.
8 PSANZ Clinical Practice Guideline for Perinatal Mortality, Chapter 4 – Perinatal post-mortem examination. www.stillbirthalliance.org.au/guideline1.htm
9 Kirby RS. (1993). “The coding of underlying cause of death from fetal death certificates: issues and policy considerations.” Am J Public Health. 83: 1088-91
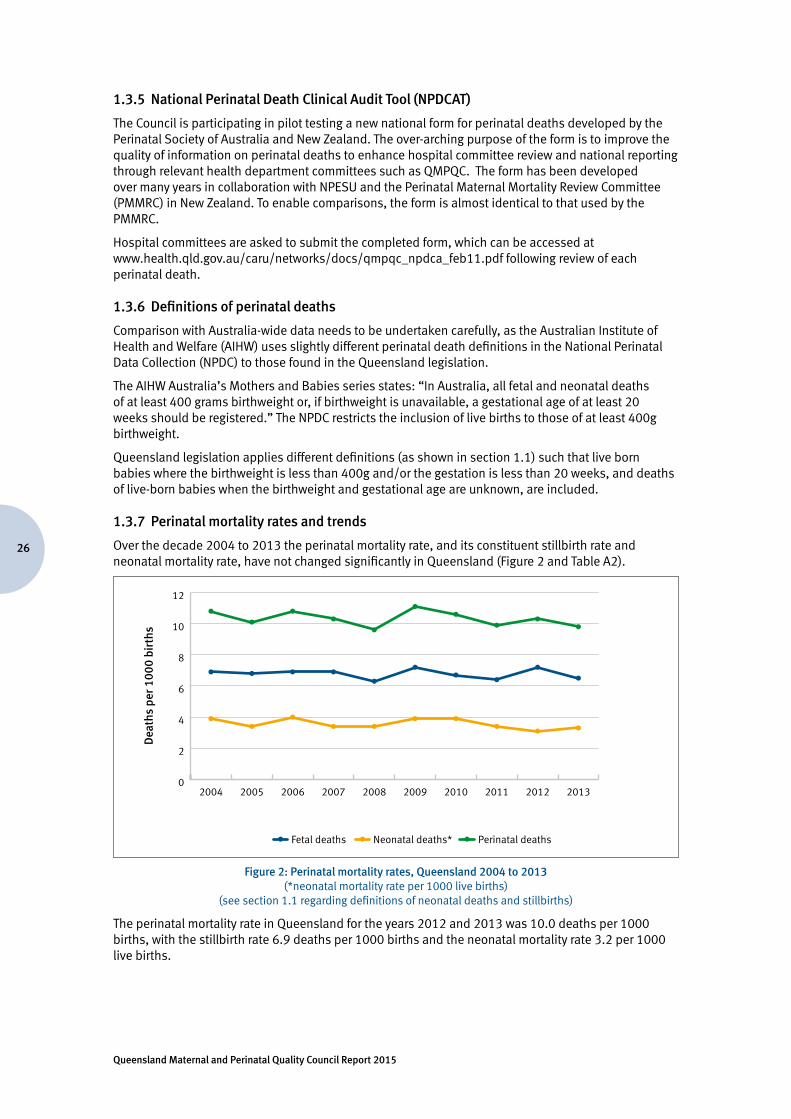
Queensland Maternal and Perinatal Quality Council Report 2015
26
1.3.5 National Perinatal Death Clinical Audit Tool (NPDCAT)
The Council is participating in pilot testing a new national form for perinatal deaths developed by the Perinatal Society of Australia and New Zealand. The over-arching purpose of the form is to improve the quality of information on perinatal deaths to enhance hospital committee review and national reporting through relevant health department committees such as QMPQC. The form has been developed over many years in collaboration with NPESU and the Perinatal Maternal Mortality Review Committee (PMMRC) in New Zealand. To enable comparisons, the form is almost identical to that used by the PMMRC.
Hospital committees are asked to submit the completed form, which can be accessed at www.health.qld.gov.au/caru/networks/docs/qmpqc_npdca_feb11.pdf following review of each perinatal death.
1.3.6 Definitions of perinatal deaths
Comparison with Australia-wide data needs to be undertaken carefully, as the Australian Institute of Health and Welfare (AIHW) uses slightly different perinatal death definitions in the National Perinatal Data Collection (NPDC) to those found in the Queensland legislation.
The AIHW Australia’s Mothers and Babies series states: “In Australia, all fetal and neonatal deaths of at least 400 grams birthweight or, if birthweight is unavailable, a gestational age of at least 20 weeks should be registered.” The NPDC restricts the inclusion of live births to those of at least 400g birthweight.
Queensland legislation applies different definitions (as shown in section 1.1) such that live born babies where the birthweight is less than 400g and/or the gestation is less than 20 weeks, and deaths of live-born babies when the birthweight and gestational age are unknown, are included.
1.3.7 Perinatal mortality rates and trends
Over the decade 2004 to 2013 the perinatal mortality rate, and its constituent stillbirth rate and neonatal mortality rate, have not changed significantly in Queensland (Figure 2 and Table A2).
Dea
ths
per 1
000
birt
hs
Fetal deaths Neonatal deaths* Perinatal deaths
0
2
4
6
8
10
12
2013201220112010200920082007200620052004
Figure 2: Perinatal mortality rates, Queensland 2004 to 2013(*neonatal mortality rate per 1000 live births)
(see section 1.1 regarding definitions of neonatal deaths and stillbirths)
The perinatal mortality rate in Queensland for the years 2012 and 2013 was 10.0 deaths per 1000 births, with the stillbirth rate 6.9 deaths per 1000 births and the neonatal mortality rate 3.2 per 1000 live births.
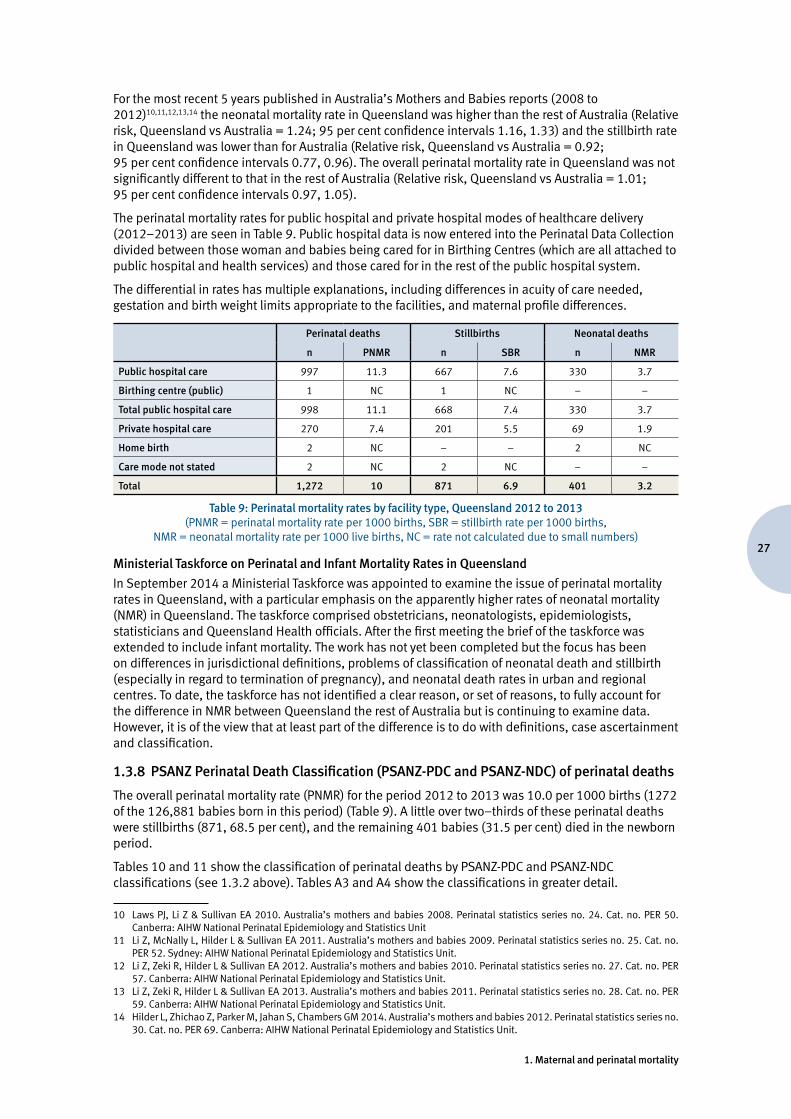
27
1. Maternal and perinatal mortality
For the most recent 5 years published in Australia’s Mothers and Babies reports (2008 to 2012)10,11,12,13,14 the neonatal mortality rate in Queensland was higher than the rest of Australia (Relative risk, Queensland vs Australia = 1.24; 95 per cent confidence intervals 1.16, 1.33) and the stillbirth rate in Queensland was lower than for Australia (Relative risk, Queensland vs Australia = 0.92; 95 per cent confidence intervals 0.77, 0.96). The overall perinatal mortality rate in Queensland was not significantly different to that in the rest of Australia (Relative risk, Queensland vs Australia = 1.01; 95 per cent confidence intervals 0.97, 1.05).
The perinatal mortality rates for public hospital and private hospital modes of healthcare delivery (2012–2013) are seen in Table 9. Public hospital data is now entered into the Perinatal Data Collection divided between those woman and babies being cared for in Birthing Centres (which are all attached to public hospital and health services) and those cared for in the rest of the public hospital system.
The differential in rates has multiple explanations, including differences in acuity of care needed, gestation and birth weight limits appropriate to the facilities, and maternal profile differences.
Perinatal deaths Stillbirths Neonatal deaths
n PNMR n SBR n NMR
Public hospital care 997 11.3 667 7.6 330 3.7
Birthing centre (public) 1 NC 1 NC – –
Total public hospital care 998 11.1 668 7.4 330 3.7
Private hospital care 270 7.4 201 5.5 69 1.9
Home birth 2 NC – – 2 NC
Care mode not stated 2 NC 2 NC – –
Total 1,272 10 871 6.9 401 3.2
Table 9: Perinatal mortality rates by facility type, Queensland 2012 to 2013 (PNMR = perinatal mortality rate per 1000 births, SBR = stillbirth rate per 1000 births,
NMR = neonatal mortality rate per 1000 live births, NC = rate not calculated due to small numbers)
Ministerial Taskforce on Perinatal and Infant Mortality Rates in Queensland
In September 2014 a Ministerial Taskforce was appointed to examine the issue of perinatal mortality rates in Queensland, with a particular emphasis on the apparently higher rates of neonatal mortality (NMR) in Queensland. The taskforce comprised obstetricians, neonatologists, epidemiologists, statisticians and Queensland Health officials. After the first meeting the brief of the taskforce was extended to include infant mortality. The work has not yet been completed but the focus has been on differences in jurisdictional definitions, problems of classification of neonatal death and stillbirth (especially in regard to termination of pregnancy), and neonatal death rates in urban and regional centres. To date, the taskforce has not identified a clear reason, or set of reasons, to fully account for the difference in NMR between Queensland the rest of Australia but is continuing to examine data. However, it is of the view that at least part of the difference is to do with definitions, case ascertainment and classification.
1.3.8 PSANZ Perinatal Death Classification (PSANZ-PDC and PSANZ-NDC) of perinatal deaths
The overall perinatal mortality rate (PNMR) for the period 2012 to 2013 was 10.0 per 1000 births (1272 of the 126,881 babies born in this period) (Table 9). A little over two–thirds of these perinatal deaths were stillbirths (871, 68.5 per cent), and the remaining 401 babies (31.5 per cent) died in the newborn period.
Tables 10 and 11 show the classification of perinatal deaths by PSANZ-PDC and PSANZ-NDC classifications (see 1.3.2 above). Tables A3 and A4 show the classifications in greater detail.
10 Laws PJ, Li Z & Sullivan EA 2010. Australia’s mothers and babies 2008. Perinatal statistics series no. 24. Cat. no. PER 50. Canberra: AIHW National Perinatal Epidemiology and Statistics Unit
11 Li Z, McNally L, Hilder L & Sullivan EA 2011. Australia’s mothers and babies 2009. Perinatal statistics series no. 25. Cat. no. PER 52. Sydney: AIHW National Perinatal Epidemiology and Statistics Unit.
12 Li Z, Zeki R, Hilder L & Sullivan EA 2012. Australia’s mothers and babies 2010. Perinatal statistics series no. 27. Cat. no. PER 57. Canberra: AIHW National Perinatal Epidemiology and Statistics Unit.
13 Li Z, Zeki R, Hilder L & Sullivan EA 2013. Australia’s mothers and babies 2011. Perinatal statistics series no. 28. Cat. no. PER 59. Canberra: AIHW National Perinatal Epidemiology and Statistics Unit.
14 Hilder L, Zhichao Z, Parker M, Jahan S, Chambers GM 2014. Australia’s mothers and babies 2012. Perinatal statistics series no. 30. Cat. no. PER 69. Canberra: AIHW National Perinatal Epidemiology and Statistics Unit.
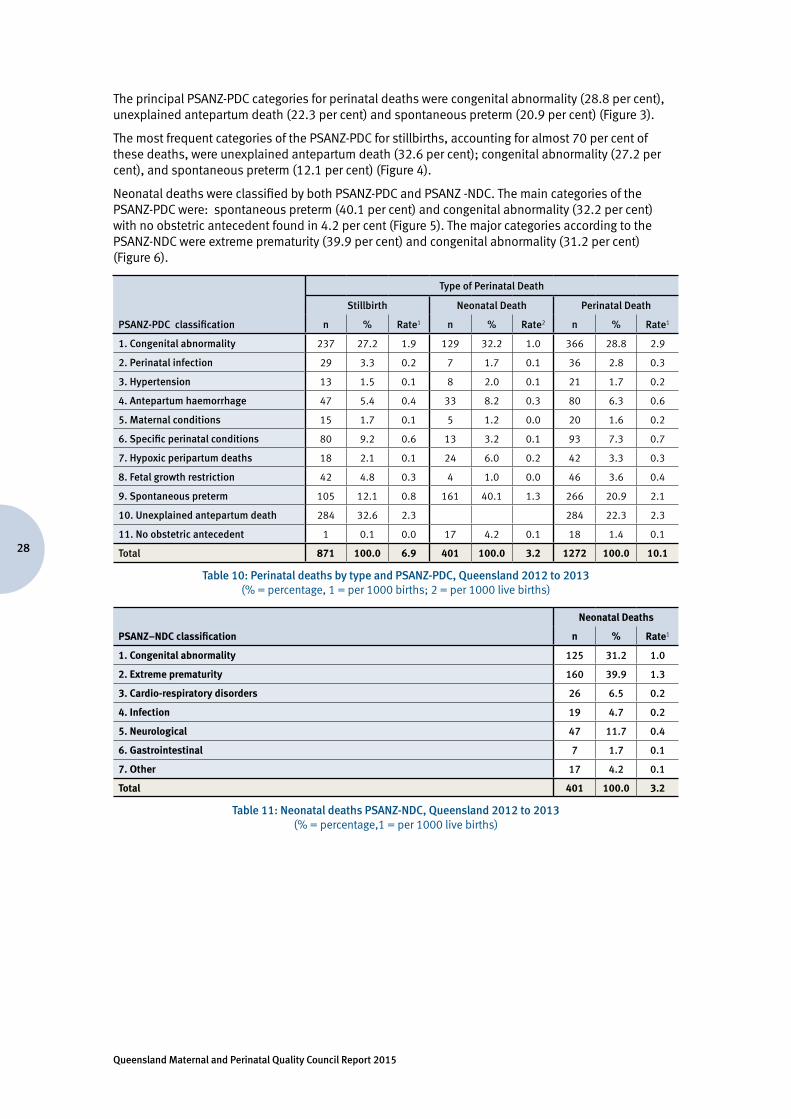
Queensland Maternal and Perinatal Quality Council Report 2015
28
The principal PSANZ-PDC categories for perinatal deaths were congenital abnormality (28.8 per cent), unexplained antepartum death (22.3 per cent) and spontaneous preterm (20.9 per cent) (Figure 3).
The most frequent categories of the PSANZ-PDC for stillbirths, accounting for almost 70 per cent of these deaths, were unexplained antepartum death (32.6 per cent); congenital abnormality (27.2 per cent), and spontaneous preterm (12.1 per cent) (Figure 4).
Neonatal deaths were classified by both PSANZ-PDC and PSANZ -NDC. The main categories of the PSANZ-PDC were: spontaneous preterm (40.1 per cent) and congenital abnormality (32.2 per cent) with no obstetric antecedent found in 4.2 per cent (Figure 5). The major categories according to the PSANZ-NDC were extreme prematurity (39.9 per cent) and congenital abnormality (31.2 per cent) (Figure 6).
PSANZ-PDC classification
Type of Perinatal Death
Stillbirth Neonatal Death Perinatal Death
n % Rate1 n % Rate2 n % Rate1
1. Congenital abnormality 237 27.2 1.9 129 32.2 1.0 366 28.8 2.9
2. Perinatal infection 29 3.3 0.2 7 1.7 0.1 36 2.8 0.3
3. Hypertension 13 1.5 0.1 8 2.0 0.1 21 1.7 0.2
4. Antepartum haemorrhage 47 5.4 0.4 33 8.2 0.3 80 6.3 0.6
5. Maternal conditions 15 1.7 0.1 5 1.2 0.0 20 1.6 0.2
6. Specific perinatal conditions 80 9.2 0.6 13 3.2 0.1 93 7.3 0.7
7. Hypoxic peripartum deaths 18 2.1 0.1 24 6.0 0.2 42 3.3 0.3
8. Fetal growth restriction 42 4.8 0.3 4 1.0 0.0 46 3.6 0.4
9. Spontaneous preterm 105 12.1 0.8 161 40.1 1.3 266 20.9 2.1
10. Unexplained antepartum death 284 32.6 2.3 284 22.3 2.3
11. No obstetric antecedent 1 0.1 0.0 17 4.2 0.1 18 1.4 0.1
Total 871 100.0 6.9 401 100.0 3.2 1272 100.0 10.1
Table 10: Perinatal deaths by type and PSANZ-PDC, Queensland 2012 to 2013(% = percentage, 1 = per 1000 births; 2 = per 1000 live births)
PSANZ–NDC classification
Neonatal Deaths
n % Rate1
1. Congenital abnormality 125 31.2 1.0
2. Extreme prematurity 160 39.9 1.3
3. Cardio-respiratory disorders 26 6.5 0.2
4. Infection 19 4.7 0.2
5. Neurological 47 11.7 0.4
6. Gastrointestinal 7 1.7 0.1
7. Other 17 4.2 0.1
Total 401 100.0 3.2
Table 11: Neonatal deaths PSANZ-NDC, Queensland 2012 to 2013(% = percentage,1 = per 1000 live births)
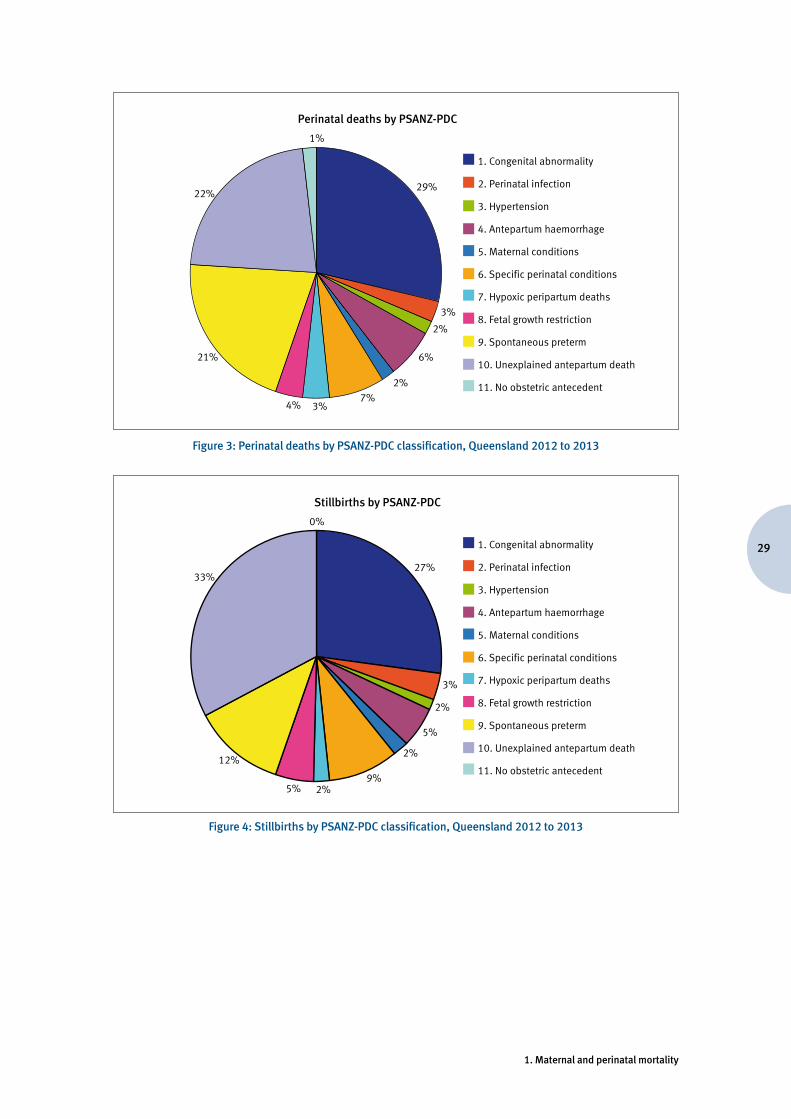
29
1. Maternal and perinatal mortality
Perinatal deaths by PSANZ-PDC
1. Congenital abnormality
2. Perinatal infection
3. Hypertension
4. Antepartum haemorrhage
5. Maternal conditions
6. Specific perinatal conditions
7. Hypoxic peripartum deaths
8. Fetal growth restriction
9. Spontaneous preterm
10. Unexplained antepartum death
11. No obstetric antecedent
1%
29%
3%
2%
6%
2%7%
3%4%
21%
22%
Figure 3: Perinatal deaths by PSANZ-PDC classification, Queensland 2012 to 2013
Stillbirths by PSANZ-PDC
1. Congenital abnormality
2. Perinatal infection
3. Hypertension
4. Antepartum haemorrhage
5. Maternal conditions
6. Specific perinatal conditions
7. Hypoxic peripartum deaths
8. Fetal growth restriction
9. Spontaneous preterm
10. Unexplained antepartum death
11. No obstetric antecedent
0%
27%
3%
2%
5%
2%
9%2%5%
12%
33%
Figure 4: Stillbirths by PSANZ-PDC classification, Queensland 2012 to 2013
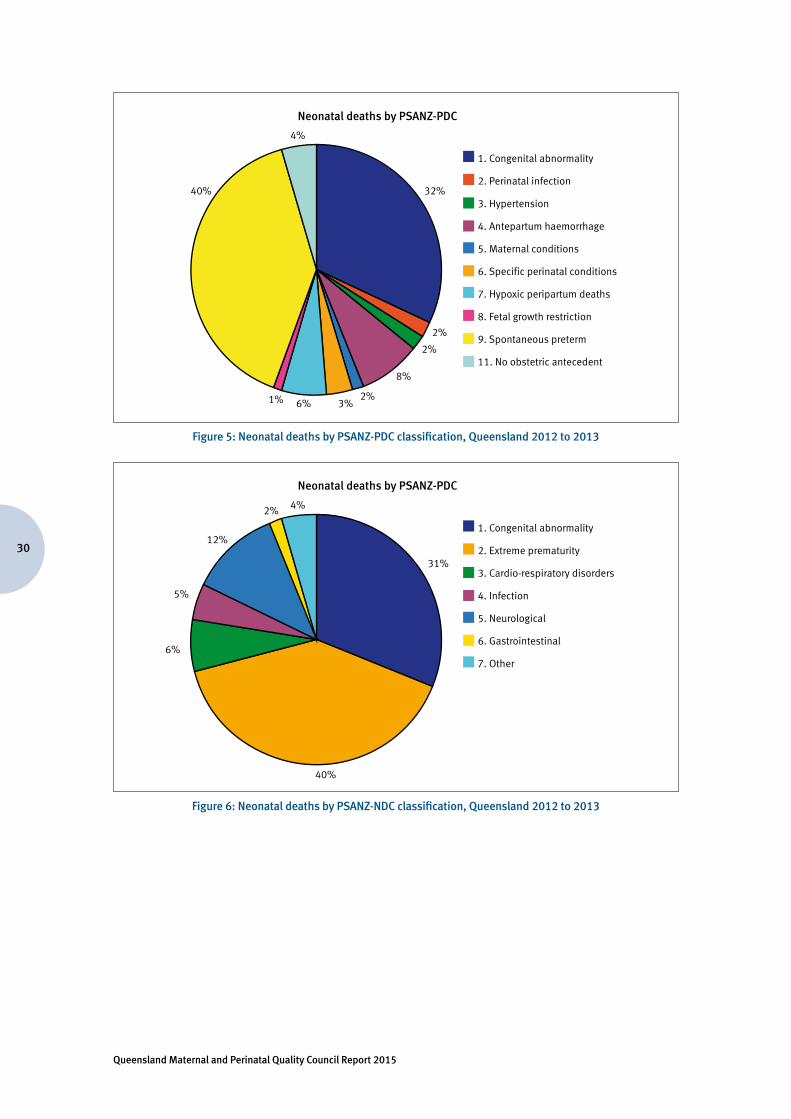
Queensland Maternal and Perinatal Quality Council Report 2015
30
Neonatal deaths by PSANZ-PDC
1. Congenital abnormality
2. Perinatal infection
3. Hypertension
4. Antepartum haemorrhage
5. Maternal conditions
6. Specific perinatal conditions
7. Hypoxic peripartum deaths
8. Fetal growth restriction
9. Spontaneous preterm
11. No obstetric antecedent
4%
32%
2%
2%
8%
2%3%6%1%
40%
Figure 5: Neonatal deaths by PSANZ-PDC classification, Queensland 2012 to 2013
Neonatal deaths by PSANZ-PDC
1. Congenital abnormality
2. Extreme prematurity
3. Cardio-respiratory disorders
4. Infection
5. Neurological
6. Gastrointestinal
7. Other
4%2%
31%
5%
6%
40%
12%
Figure 6: Neonatal deaths by PSANZ-NDC classification, Queensland 2012 to 2013
31
1. Maternal and perinatal mortality
The major subcategories of the congenital abnormality category on PSANZ-PDC classification were, for stillbirths and neonatal deaths respectively: central nervous system 7.2 per cent and 6.0 per cent; chromosomal 6.2 per cent and 7.0 per cent; cardiovascular 5.1 per cent and 6.0 per cent (Table A3).
In the majority (62.8 per cent) of perinatal deaths assigned to the category of spontaneous preterm, chorioamnionitis was either clinically suspected or confirmed on histopathology of the placenta. In 21.8 per cent of these perinatal deaths, either no placental histopathology was undertaken or it was unknown whether this was performed.
Thirty–six (12.7 per cent) of the 284 unexplained stillbirths (unexplained antepartum death) were associated with significant placental insufficiency (Table A3, Category 10.1) and in some other approaches to classification internationally (Froen15, Korteweg16) would be classified as a placental pathology cause of death rather than unexplained. Further, in 50 (17.6 per cent) of these apparently unexplained deaths, placental histopathology was either not performed or unknown whether it was performed.
As placental pathology is a crucially important investigation for stillbirths, it could be argued that causes in these cases should be classified as “unclassifiable” rather than “unexplained”.
Removing the “unclassifiable” and the placental insufficiency groups reduces the unexplained stillbirth proportion to 18.4 per cent (rather than 22.3 per cent). Including an autopsy examination as part of the criteria for assignment of the unexplained antepartum stillbirth category may reduce this further.
Revisions to the PSANZ–PDC definition of the unexplained antepartum death category are currently being considered by the PSANZ Perinatal Mortality Group to more clearly identify the true proportion of unexplained deaths.
Further, the proportion of the unexplained stillbirth group where a placental pathology report was not available at the time of classification indicates room for improvement in standards of investigation and audit of stillbirths.
Recommendation:
That all front line clinicians (medical officers, nursing staff and bereavement support personnel) involved in Queensland Hospital Maternity and Newborn Services attend the IMPROVE educational program to enhance optimal clinical practice around the time of a perinatal death according to the PSANZ Perinatal Mortality Guidelines
15 Froen, J. F., Pinar H., Flenady V.J. et al. (2009). “Causes of death and associated conditions (Codac): a utilitarian approach to the classification of perinatal deaths.” BMC Pregnancy Childbirth 9: 22.
16 Korteweg, F. J., Gordijn S. J., et al. (2006). “The Tulip classification of perinatal mortality: introduction and multidisciplinary inter-rater agreement.” BJOG 113(4): 393-401.
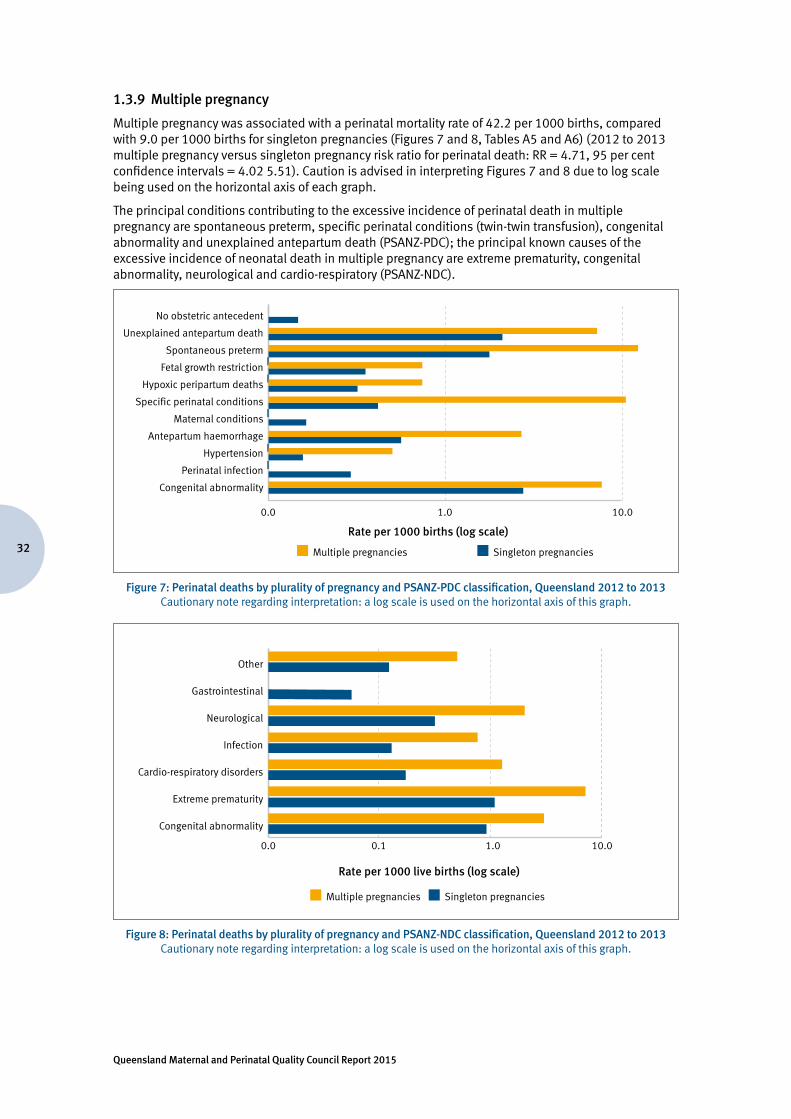
Queensland Maternal and Perinatal Quality Council Report 2015
32
1.3.9 Multiple pregnancy
Multiple pregnancy was associated with a perinatal mortality rate of 42.2 per 1000 births, compared with 9.0 per 1000 births for singleton pregnancies (Figures 7 and 8, Tables A5 and A6) (2012 to 2013 multiple pregnancy versus singleton pregnancy risk ratio for perinatal death: RR = 4.71, 95 per cent confidence intervals = 4.02 5.51). Caution is advised in interpreting Figures 7 and 8 due to log scale being used on the horizontal axis of each graph.
The principal conditions contributing to the excessive incidence of perinatal death in multiple pregnancy are spontaneous preterm, specific perinatal conditions (twin-twin transfusion), congenital abnormality and unexplained antepartum death (PSANZ-PDC); the principal known causes of the excessive incidence of neonatal death in multiple pregnancy are extreme prematurity, congenital abnormality, neurological and cardio-respiratory (PSANZ-NDC).
0.0 1.0 10.0
Congenital abnormality
Perinatal infection
Hypertension
Antepartum haemorrhage
Maternal conditions
Specific perinatal conditions
Hypoxic peripartum deaths
Fetal growth restriction
Spontaneous preterm
Unexplained antepartum death
No obstetric antecedent
Rate per 1000 births (log scale)
Singleton pregnanciesMultiple pregnancies
Figure 7: Perinatal deaths by plurality of pregnancy and PSANZ-PDC classification, Queensland 2012 to 2013
Cautionary note regarding interpretation: a log scale is used on the horizontal axis of this graph.
0.10.0 1.0 10.0
Congenital abnormality
Extreme prematurity
Cardio-respiratory disorders
Infection
Neurological
Gastrointestinal
Other
Rate per 1000 live births (log scale)
Singleton pregnanciesMultiple pregnancies
Figure 8: Perinatal deaths by plurality of pregnancy and PSANZ-NDC classification, Queensland 2012 to 2013
Cautionary note regarding interpretation: a log scale is used on the horizontal axis of this graph.
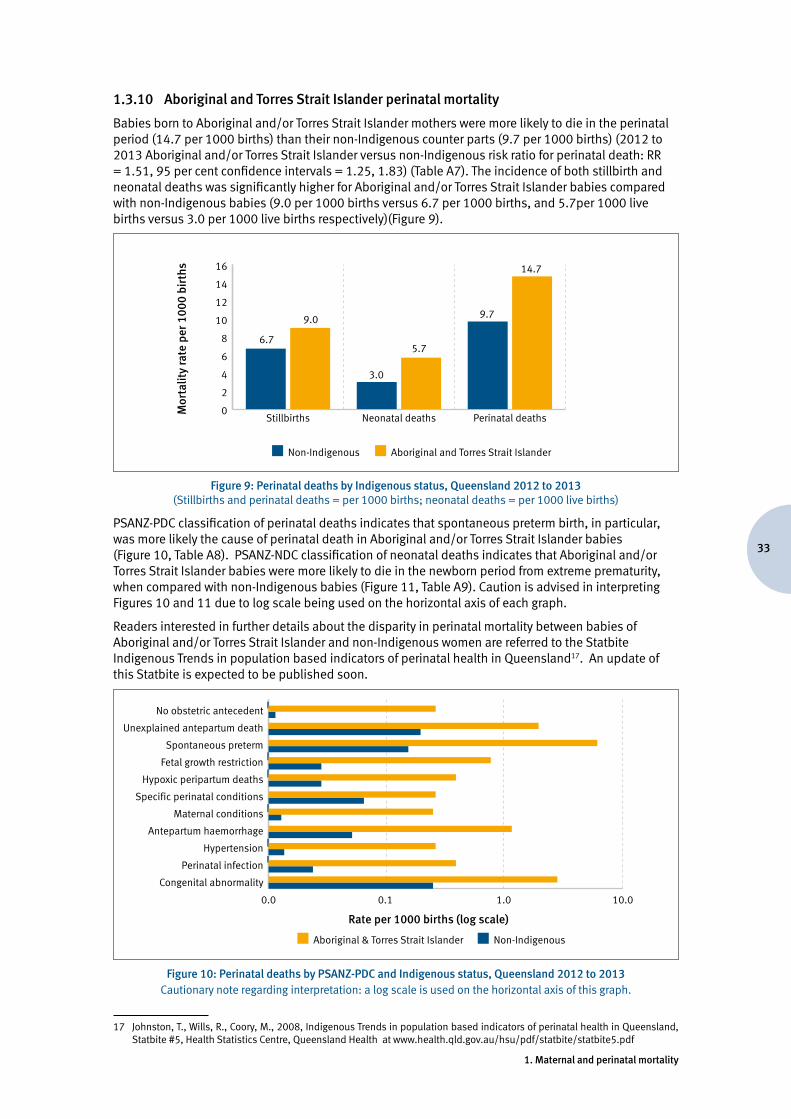
33
1. Maternal and perinatal mortality
1.3.10 Aboriginal and Torres Strait Islander perinatal mortality
Babies born to Aboriginal and/or Torres Strait Islander mothers were more likely to die in the perinatal period (14.7 per 1000 births) than their non-Indigenous counter parts (9.7 per 1000 births) (2012 to 2013 Aboriginal and/or Torres Strait Islander versus non-Indigenous risk ratio for perinatal death: RR = 1.51, 95 per cent confidence intervals = 1.25, 1.83) (Table A7). The incidence of both stillbirth and neonatal deaths was significantly higher for Aboriginal and/or Torres Strait Islander babies compared with non-Indigenous babies (9.0 per 1000 births versus 6.7 per 1000 births, and 5.7per 1000 live births versus 3.0 per 1000 live births respectively)(Figure 9).
9.0
6.75.7
3.0
14.7
9.7
Mor
talit
y ra
te p
er 1
000
birt
hs
Non-Indigenous Aboriginal and Torres Strait Islander
0
2
4
6
8
10
12
14
16
Perinatal deathsNeonatal deathsStillbirths
Figure 9: Perinatal deaths by Indigenous status, Queensland 2012 to 2013(Stillbirths and perinatal deaths = per 1000 births; neonatal deaths = per 1000 live births)
PSANZ-PDC classification of perinatal deaths indicates that spontaneous preterm birth, in particular, was more likely the cause of perinatal death in Aboriginal and/or Torres Strait Islander babies (Figure 10, Table A8). PSANZ-NDC classification of neonatal deaths indicates that Aboriginal and/or Torres Strait Islander babies were more likely to die in the newborn period from extreme prematurity, when compared with non-Indigenous babies (Figure 11, Table A9). Caution is advised in interpreting Figures 10 and 11 due to log scale being used on the horizontal axis of each graph.
Readers interested in further details about the disparity in perinatal mortality between babies of Aboriginal and/or Torres Strait Islander and non-Indigenous women are referred to the Statbite Indigenous Trends in population based indicators of perinatal health in Queensland17. An update of this Statbite is expected to be published soon.
0.0 0.1 1.0 10.0
Congenital abnormality
Perinatal infection
Hypertension
Antepartum haemorrhage
Maternal conditions
Specific perinatal conditions
Hypoxic peripartum deaths
Fetal growth restriction
Spontaneous preterm
Unexplained antepartum death
No obstetric antecedent
Rate per 1000 births (log scale)
Non-IndigenousAboriginal & Torres Strait Islander
Figure 10: Perinatal deaths by PSANZ-PDC and Indigenous status, Queensland 2012 to 2013
Cautionary note regarding interpretation: a log scale is used on the horizontal axis of this graph.
17 Johnston, T., Wills, R., Coory, M., 2008, Indigenous Trends in population based indicators of perinatal health in Queensland, Statbite #5, Health Statistics Centre, Queensland Health at www.health.qld.gov.au/hsu/pdf/statbite/statbite5.pdf
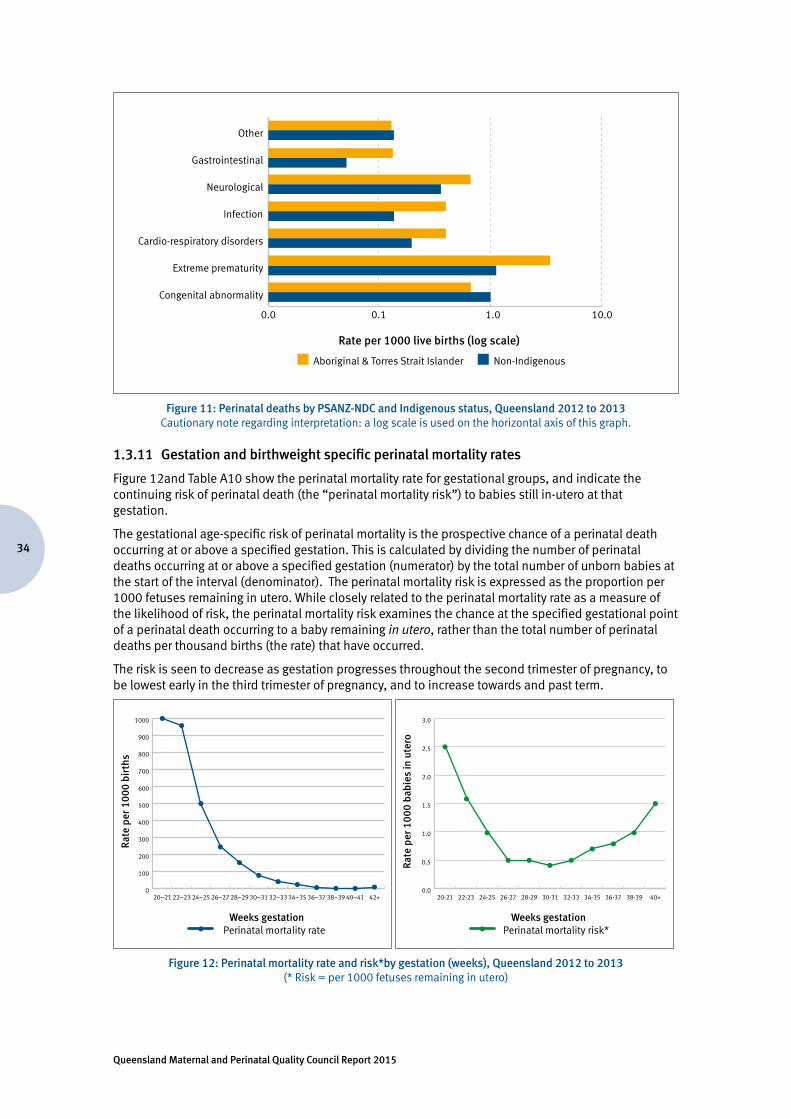
Queensland Maternal and Perinatal Quality Council Report 2015
34
0.10.0 1.0 10.0
Congenital abnormality
Extreme prematurity
Cardio-respiratory disorders
Infection
Neurological
Gastrointestinal
Other
Rate per 1000 live births (log scale)
Non-IndigenousAboriginal & Torres Strait Islander
Figure 11: Perinatal deaths by PSANZ-NDC and Indigenous status, Queensland 2012 to 2013
Cautionary note regarding interpretation: a log scale is used on the horizontal axis of this graph.
1.3.11 Gestation and birthweight specific perinatal mortality rates
Figure 12and Table A10 show the perinatal mortality rate for gestational groups, and indicate the continuing risk of perinatal death (the “perinatal mortality risk”) to babies still in-utero at that gestation.
The gestational age-specific risk of perinatal mortality is the prospective chance of a perinatal death occurring at or above a specified gestation. This is calculated by dividing the number of perinatal deaths occurring at or above a specified gestation (numerator) by the total number of unborn babies at the start of the interval (denominator). The perinatal mortality risk is expressed as the proportion per 1000 fetuses remaining in utero. While closely related to the perinatal mortality rate as a measure of the likelihood of risk, the perinatal mortality risk examines the chance at the specified gestational point of a perinatal death occurring to a baby remaining in utero, rather than the total number of perinatal deaths per thousand births (the rate) that have occurred.
The risk is seen to decrease as gestation progresses throughout the second trimester of pregnancy, to be lowest early in the third trimester of pregnancy, and to increase towards and past term.
Rate
per
100
0 bi
rths
Weeks gestation
0
100
200
300
400
500
600
700
800
900
1000
42+40–4138–3936–3734–3532–3330–3128–2926–2724–2522–2320–21
Perinatal mortality rate
Rate
per
100
0 ba
bies
in u
tero
Weeks gestation
0.0
0.5
1.0
1.5
2.0
2.5
3.0
40+38-3936-3734-3532-3330-3128-2926-2724-2522-2320-21
Perinatal mortality risk*
Figure 12: Perinatal mortality rate and risk*by gestation (weeks), Queensland 2012 to 2013
(* Risk = per 1000 fetuses remaining in utero)
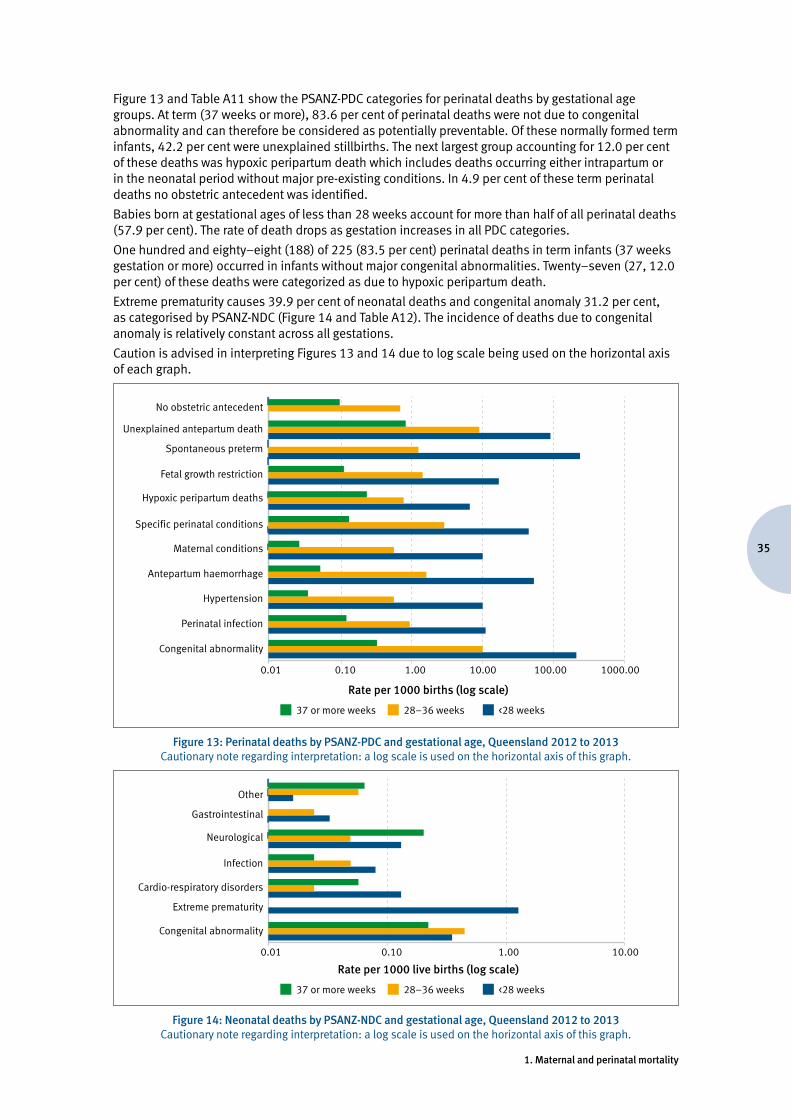
35
1. Maternal and perinatal mortality
Figure 13 and Table A11 show the PSANZ-PDC categories for perinatal deaths by gestational age groups. At term (37 weeks or more), 83.6 per cent of perinatal deaths were not due to congenital abnormality and can therefore be considered as potentially preventable. Of these normally formed term infants, 42.2 per cent were unexplained stillbirths. The next largest group accounting for 12.0 per cent of these deaths was hypoxic peripartum death which includes deaths occurring either intrapartum or in the neonatal period without major pre-existing conditions. In 4.9 per cent of these term perinatal deaths no obstetric antecedent was identified.
Babies born at gestational ages of less than 28 weeks account for more than half of all perinatal deaths (57.9 per cent). The rate of death drops as gestation increases in all PDC categories.
One hundred and eighty–eight (188) of 225 (83.5 per cent) perinatal deaths in term infants (37 weeks gestation or more) occurred in infants without major congenital abnormalities. Twenty–seven (27, 12.0 per cent) of these deaths were categorized as due to hypoxic peripartum death.
Extreme prematurity causes 39.9 per cent of neonatal deaths and congenital anomaly 31.2 per cent, as categorised by PSANZ-NDC (Figure 14 and Table A12). The incidence of deaths due to congenital anomaly is relatively constant across all gestations.
Caution is advised in interpreting Figures 13 and 14 due to log scale being used on the horizontal axis of each graph.
0.01 0.10 1.00 10.00 100.00 1000.00
Congenital abnormality
Perinatal infection
Hypertension
Antepartum haemorrhage
Maternal conditions
Specific perinatal conditions
Hypoxic peripartum deaths
Fetal growth restriction
Spontaneous preterm
Unexplained antepartum death
No obstetric antecedent
Rate per 1000 births (log scale)
<28 weeks37 or more weeks 28–36 weeks
Figure 13: Perinatal deaths by PSANZ-PDC and gestational age, Queensland 2012 to 2013 Cautionary note regarding interpretation: a log scale is used on the horizontal axis of this graph.
Extreme prematurity
Cardio-respiratory disorders
Infection
Neurological
Gastrointestinal
Other
0.01 0.10 1.00 10.00
Congenital abnormality
Rate per 1000 live births (log scale)
<28 weeks37 or more weeks 28–36 weeks
Figure 14: Neonatal deaths by PSANZ-NDC and gestational age, Queensland 2012 to 2013Cautionary note regarding interpretation: a log scale is used on the horizontal axis of this graph.
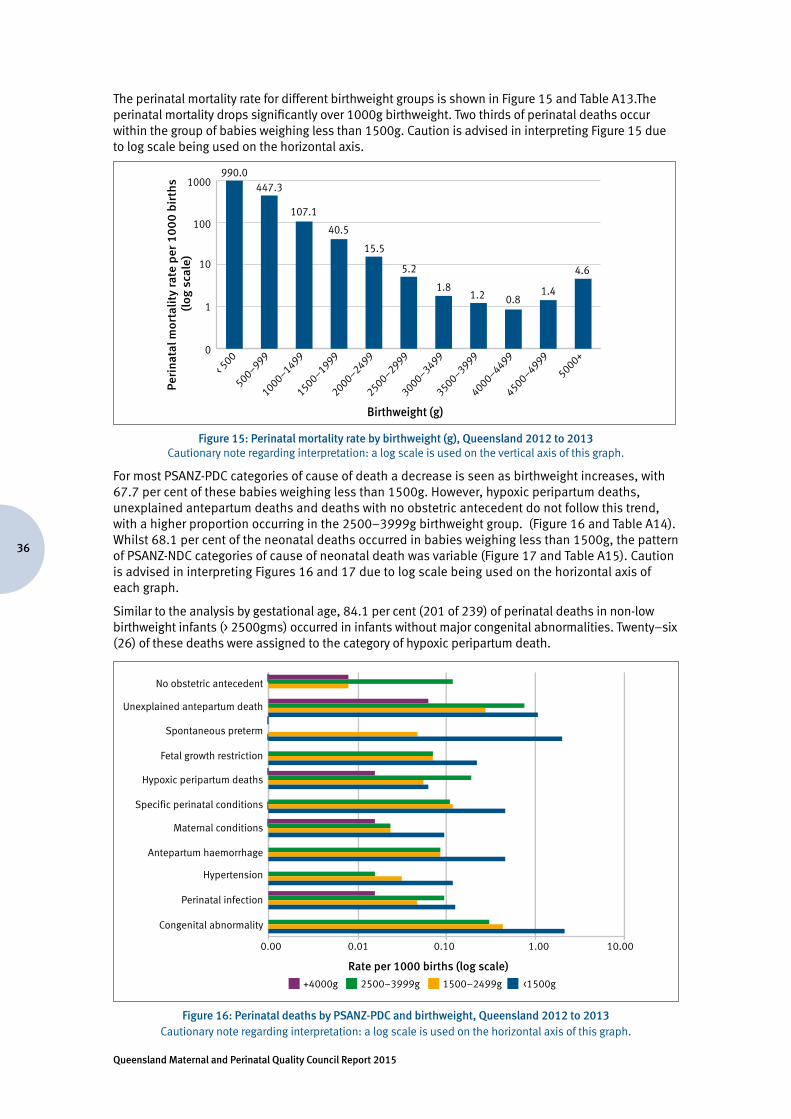
Queensland Maternal and Perinatal Quality Council Report 2015
36
The perinatal mortality rate for different birthweight groups is shown in Figure 15 and Table A13.The perinatal mortality drops significantly over 1000g birthweight. Two thirds of perinatal deaths occur within the group of babies weighing less than 1500g. Caution is advised in interpreting Figure 15 due to log scale being used on the horizontal axis.
Per
inat
al m
orta
lity
rat
e p
er 1
00
0 b
irth
s (l
og s
cale
)
Birthweight (g)
5000+
4500–4999
4000–4499
3500–3999
3000–3499
2500–2999
2000–2499
1500–1999
1000–1499
500–999< 5
000
1
10
100
990.0447.3
107.1
40.5
15.5
5.2
1.81.2 0.8
1.4
4.6
1000
Figure 15: Perinatal mortality rate by birthweight (g), Queensland 2012 to 2013Cautionary note regarding interpretation: a log scale is used on the vertical axis of this graph.
For most PSANZ-PDC categories of cause of death a decrease is seen as birthweight increases, with 67.7 per cent of these babies weighing less than 1500g. However, hypoxic peripartum deaths, unexplained antepartum deaths and deaths with no obstetric antecedent do not follow this trend, with a higher proportion occurring in the 2500–3999g birthweight group. (Figure 16 and Table A14). Whilst 68.1 per cent of the neonatal deaths occurred in babies weighing less than 1500g, the pattern of PSANZ-NDC categories of cause of neonatal death was variable (Figure 17 and Table A15). Caution is advised in interpreting Figures 16 and 17 due to log scale being used on the horizontal axis of each graph.
Similar to the analysis by gestational age, 84.1 per cent (201 of 239) of perinatal deaths in non-low birthweight infants (> 2500gms) occurred in infants without major congenital abnormalities. Twenty–six (26) of these deaths were assigned to the category of hypoxic peripartum death.
0.00 0.01 0.10 1.00 10.00
Congenital abnormality
Perinatal infection
Hypertension
Antepartum haemorrhage
Maternal conditions
Specific perinatal conditions
Hypoxic peripartum deaths
Fetal growth restriction
Spontaneous preterm
Unexplained antepartum death
No obstetric antecedent
Rate per 1000 births (log scale)
<1500g2500–3999g+4000g 1500–2499g
Figure 16: Perinatal deaths by PSANZ-PDC and birthweight, Queensland 2012 to 2013Cautionary note regarding interpretation: a log scale is used on the horizontal axis of this graph.
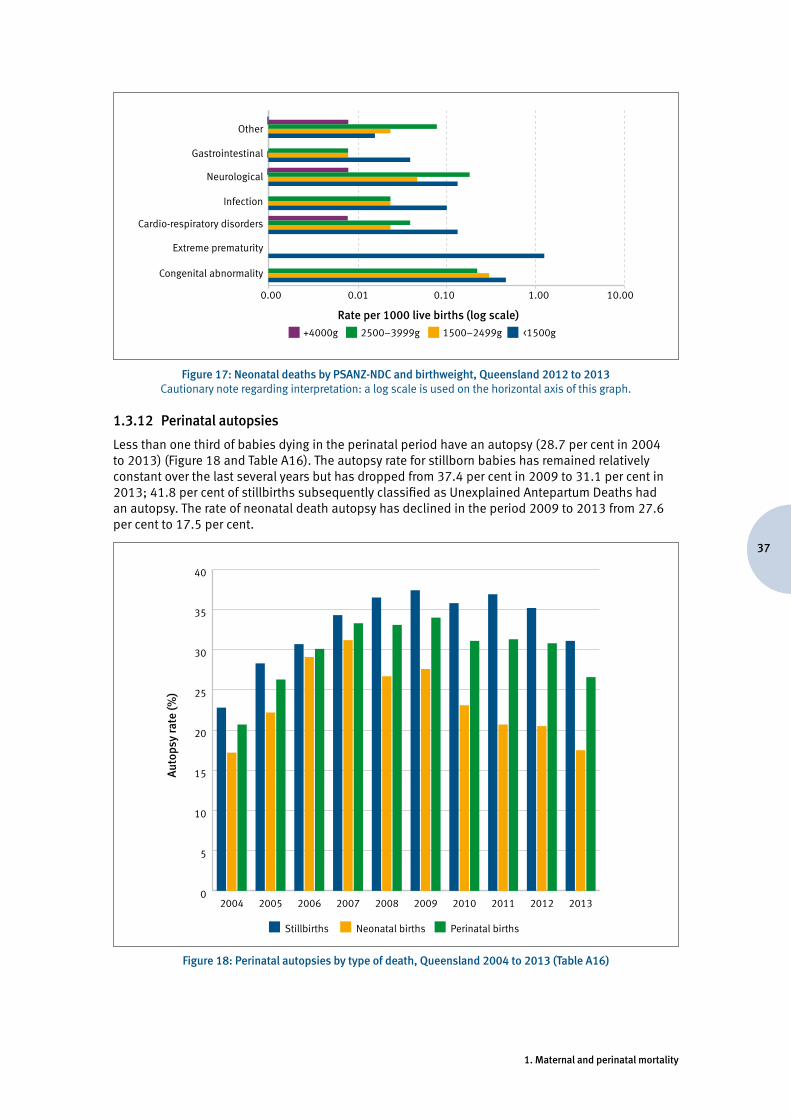
37
1. Maternal and perinatal mortality
0.00 0.01 0.10 1.00 10.00
Rate per 1000 live births (log scale)
<1500g2500–3999g+4000g 1500–2499g
Other
Extreme prematurity
Cardio-respiratory disorders
Infection
Neurological
Gastrointestinal
Congenital abnormality
Figure 17: Neonatal deaths by PSANZ-NDC and birthweight, Queensland 2012 to 2013Cautionary note regarding interpretation: a log scale is used on the horizontal axis of this graph.
1.3.12 Perinatal autopsies
Less than one third of babies dying in the perinatal period have an autopsy (28.7 per cent in 2004 to 2013) (Figure 18 and Table A16). The autopsy rate for stillborn babies has remained relatively constant over the last several years but has dropped from 37.4 per cent in 2009 to 31.1 per cent in 2013; 41.8 per cent of stillbirths subsequently classified as Unexplained Antepartum Deaths had an autopsy. The rate of neonatal death autopsy has declined in the period 2009 to 2013 from 27.6 per cent to 17.5 per cent.
Aut
opsy
rate
(%)
Stillbirths Neonatal births Perinatal births
0
5
10
15
20
25
30
35
40
2013201220112010200920082007200620052004
Figure 18: Perinatal autopsies by type of death, Queensland 2004 to 2013 (Table A16)
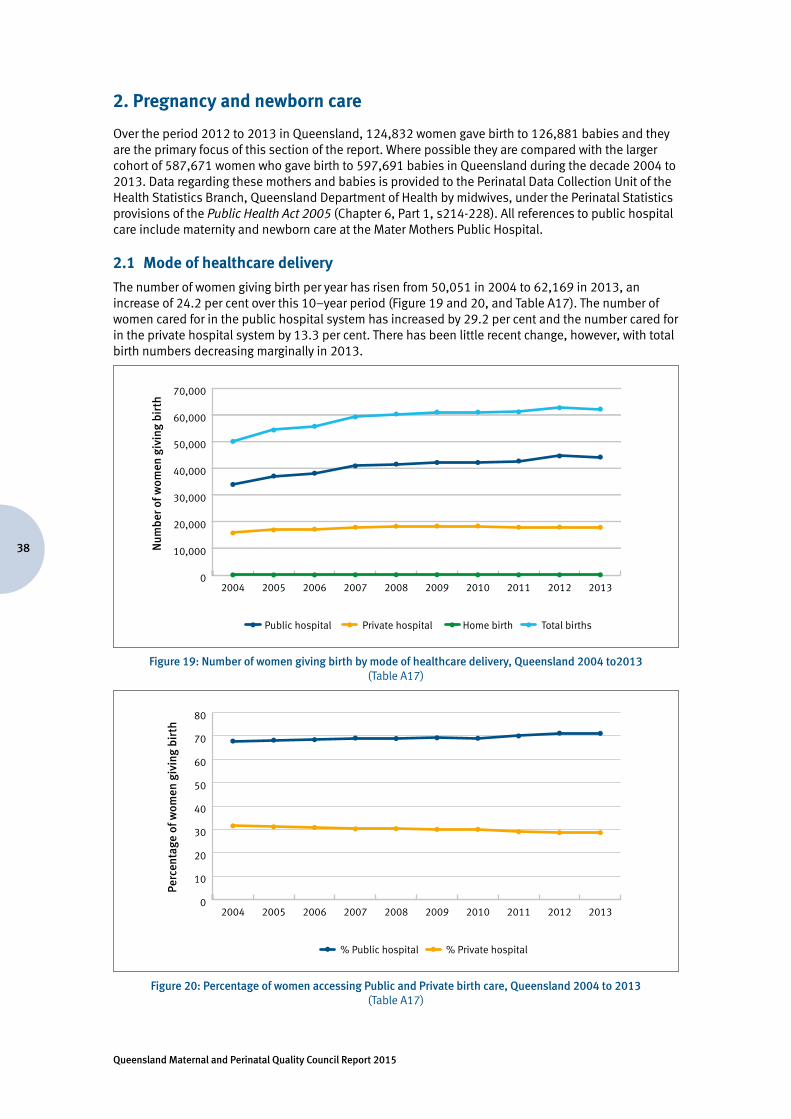
Queensland Maternal and Perinatal Quality Council Report 2015
38
2. Pregnancy and newborn care
Over the period 2012 to 2013 in Queensland, 124,832 women gave birth to 126,881 babies and they are the primary focus of this section of the report. Where possible they are compared with the larger cohort of 587,671 women who gave birth to 597,691 babies in Queensland during the decade 2004 to 2013. Data regarding these mothers and babies is provided to the Perinatal Data Collection Unit of the Health Statistics Branch, Queensland Department of Health by midwives, under the Perinatal Statistics provisions of the Public Health Act 2005 (Chapter 6, Part 1, s214-228). All references to public hospital care include maternity and newborn care at the Mater Mothers Public Hospital.
2.1 Mode of healthcare delivery
The number of women giving birth per year has risen from 50,051 in 2004 to 62,169 in 2013, an increase of 24.2 per cent over this 10–year period (Figure 19 and 20, and Table A17). The number of women cared for in the public hospital system has increased by 29.2 per cent and the number cared for in the private hospital system by 13.3 per cent. There has been little recent change, however, with total birth numbers decreasing marginally in 2013.
Num
ber o
f wom
en g
ivin
g bi
rth
Public hospital
0
10,000
20,000
30,000
40,000
50,000
60,000
70,000
2013201220112010200920082007200620052004
Private hospital Home birth Total births
Figure 19: Number of women giving birth by mode of healthcare delivery, Queensland 2004 to2013(Table A17)
Perc
enta
ge o
f wom
en g
ivin
g bi
rth
% Public hospital
0
10
20
30
40
50
60
70
80
2013201220112010200920082007200620052004
% Private hospital
Figure 20: Percentage of women accessing Public and Private birth care, Queensland 2004 to 2013(Table A17)
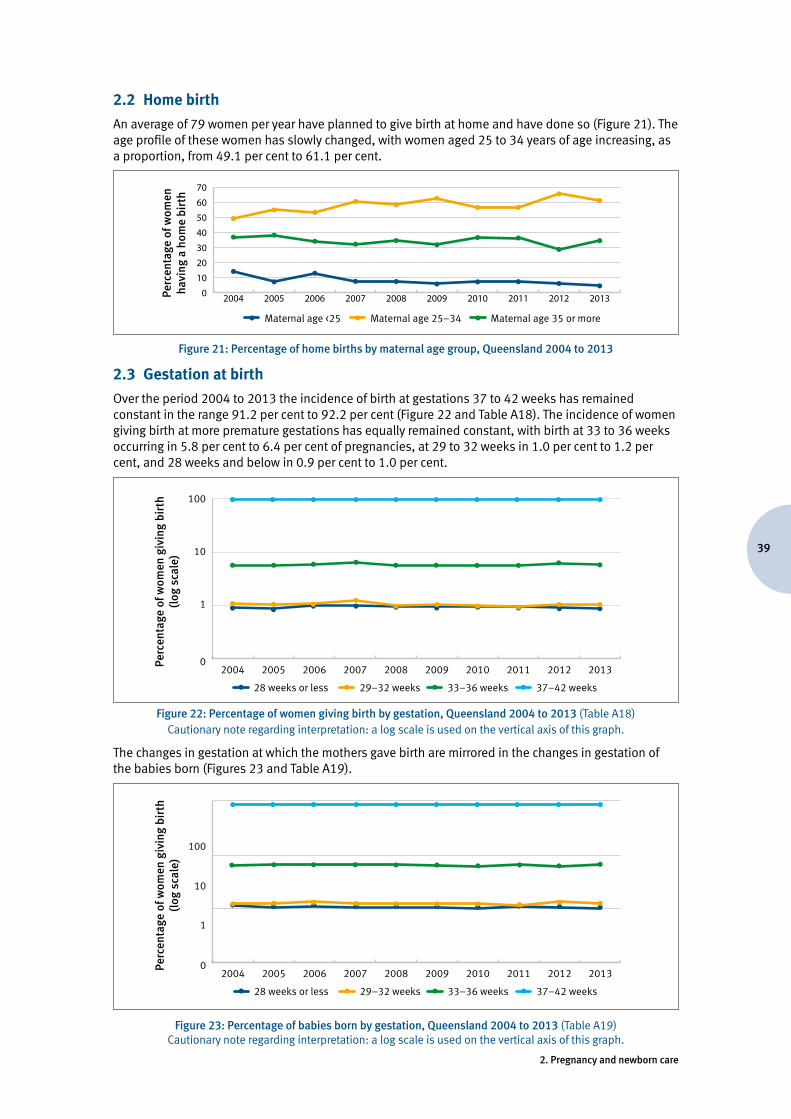
39
2. Pregnancy and newborn care
2.2 Home birth
An average of 79 women per year have planned to give birth at home and have done so (Figure 21). The age profile of these women has slowly changed, with women aged 25 to 34 years of age increasing, as a proportion, from 49.1 per cent to 61.1 per cent.
Perc
enta
ge o
f wom
enha
ving
a h
ome
birt
h
Maternal age <25 Maternal age 25–34 Maternal age 35 or more
0
10
20
30
40
50
60
70
2013201220112010200920082007200620052004
Figure 21: Percentage of home births by maternal age group, Queensland 2004 to 2013
2.3 Gestation at birth
Over the period 2004 to 2013 the incidence of birth at gestations 37 to 42 weeks has remained constant in the range 91.2 per cent to 92.2 per cent (Figure 22 and Table A18). The incidence of women giving birth at more premature gestations has equally remained constant, with birth at 33 to 36 weeks occurring in 5.8 per cent to 6.4 per cent of pregnancies, at 29 to 32 weeks in 1.0 per cent to 1.2 per cent, and 28 weeks and below in 0.9 per cent to 1.0 per cent.
Perc
enta
ge o
f wom
en g
ivin
g bi
rth
(log
sca
le)
28 weeks or less
0
1
10
100
2013201220112010200920082007200620052004
29–32 weeks 33–36 weeks 37–42 weeks
Figure 22: Percentage of women giving birth by gestation, Queensland 2004 to 2013 (Table A18) Cautionary note regarding interpretation: a log scale is used on the vertical axis of this graph.
The changes in gestation at which the mothers gave birth are mirrored in the changes in gestation of the babies born (Figures 23 and Table A19).
Perc
enta
ge o
f wom
en g
ivin
g bi
rth
(log
sca
le)
28 weeks or less
0
1
10
100
2013201220112010200920082007200620052004
29–32 weeks 33–36 weeks 37–42 weeks
Figure 23: Percentage of babies born by gestation, Queensland 2004 to 2013 (Table A19) Cautionary note regarding interpretation: a log scale is used on the vertical axis of this graph.
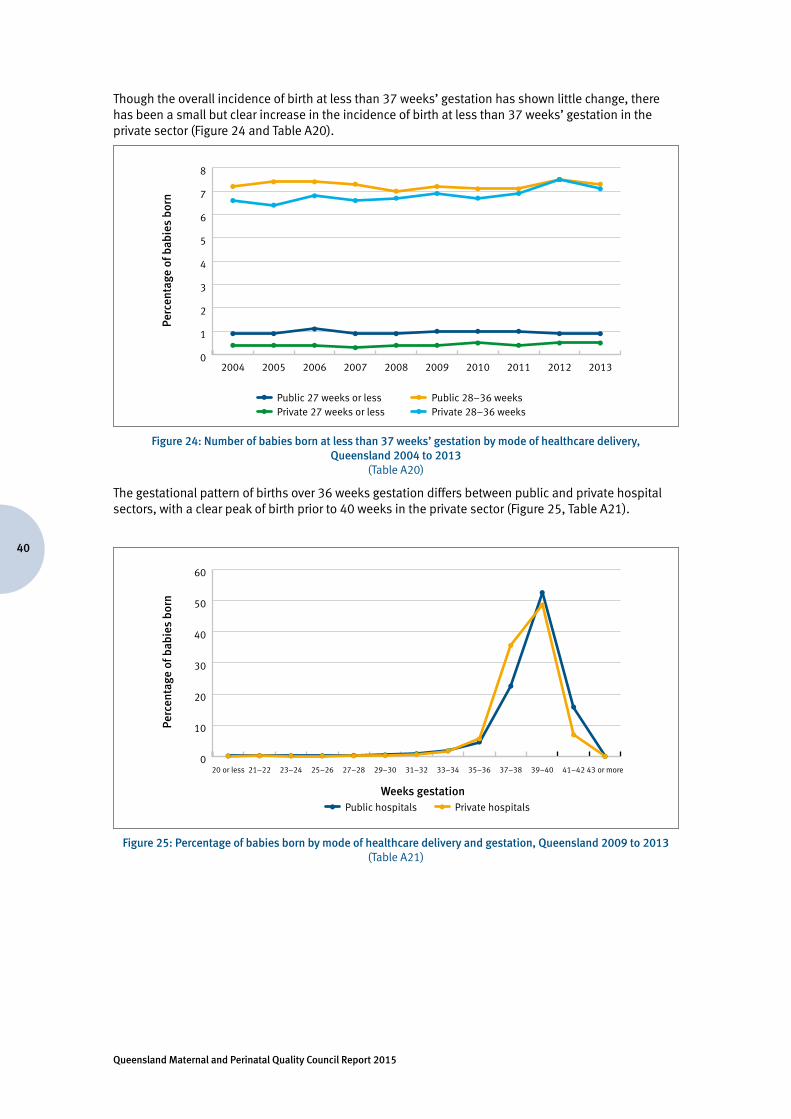
Queensland Maternal and Perinatal Quality Council Report 2015
40
Though the overall incidence of birth at less than 37 weeks’ gestation has shown little change, there has been a small but clear increase in the incidence of birth at less than 37 weeks’ gestation in the private sector (Figure 24 and Table A20).
Perc
enta
ge o
f bab
ies
born
Public 27 weeks or less
0
1
2
3
4
5
6
7
8
2013201220112010200920082007200620052004
Public 28–36 weeksPrivate 27 weeks or less Private 28–36 weeks
Figure 24: Number of babies born at less than 37 weeks’ gestation by mode of healthcare delivery,Queensland 2004 to 2013
(Table A20)
The gestational pattern of births over 36 weeks gestation differs between public and private hospital sectors, with a clear peak of birth prior to 40 weeks in the private sector (Figure 25, Table A21).
Perc
enta
ge o
f bab
ies
born
Weeks gestationPublic hospitals
0
10
20
30
40
50
60
43 or more41–4239–4037–3835–3633–3431–3229–3027–2825–2623–2421–2220 or less
Private hospitals
Figure 25: Percentage of babies born by mode of healthcare delivery and gestation, Queensland 2009 to 2013 (Table A21)
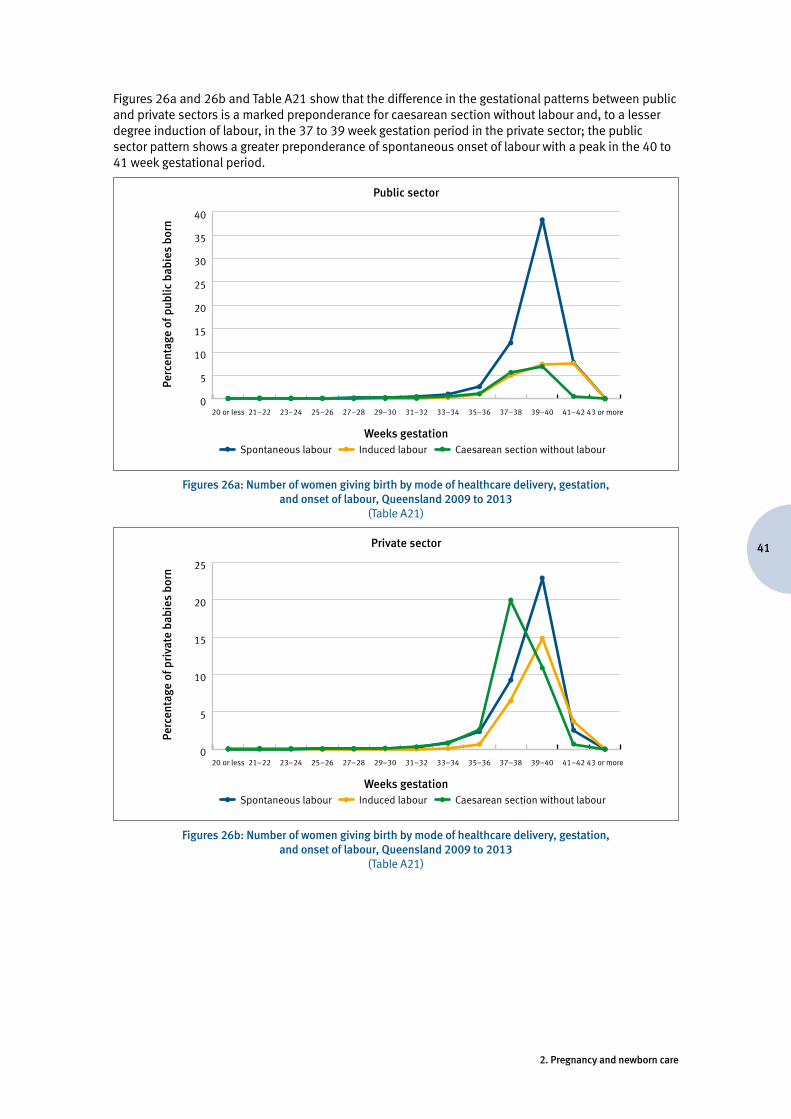
41
2. Pregnancy and newborn care
Figures 26a and 26b and Table A21 show that the difference in the gestational patterns between public and private sectors is a marked preponderance for caesarean section without labour and, to a lesser degree induction of labour, in the 37 to 39 week gestation period in the private sector; the public sector pattern shows a greater preponderance of spontaneous onset of labour with a peak in the 40 to 41 week gestational period.
Perc
enta
ge o
f pub
lic b
abie
s bo
rn
Weeks gestation
Public sector
Spontaneous labour
0
5
10
15
20
25
30
35
40
43 or more41–4239–4037–3835–3633–3431–3229–3027–2825–2623–2421–2220 or less
Induced labour Caesarean section without labour
Figures 26a: Number of women giving birth by mode of healthcare delivery, gestation, and onset of labour, Queensland 2009 to 2013
(Table A21)
Perc
enta
ge o
f pri
vate
bab
ies
born
Weeks gestation
Private sector
Spontaneous labour
0
5
10
15
20
25
43 or more41–4239–4037–3835–3633–3431–3229–3027–2825–2623–2421–2220 or less
Induced labour Caesarean section without labour
Figures 26b: Number of women giving birth by mode of healthcare delivery, gestation, and onset of labour, Queensland 2009 to 2013
(Table A21)
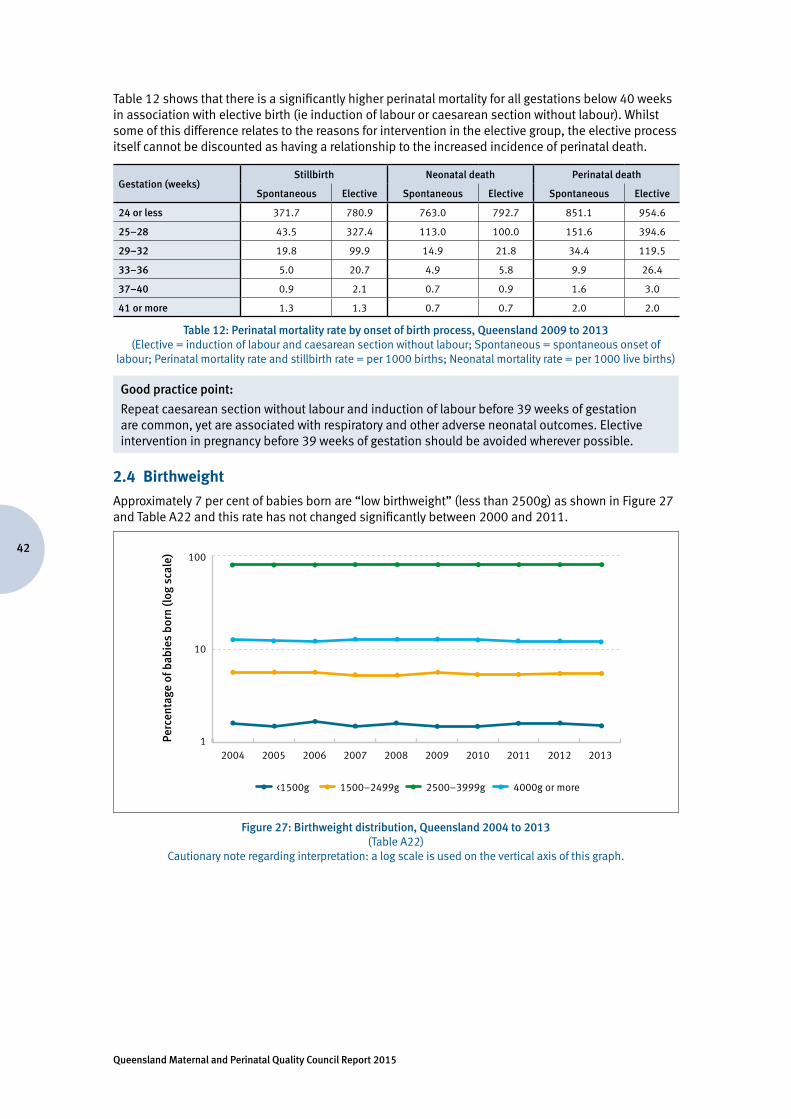
Queensland Maternal and Perinatal Quality Council Report 2015
42
Table 12 shows that there is a significantly higher perinatal mortality for all gestations below 40 weeks in association with elective birth (ie induction of labour or caesarean section without labour). Whilst some of this difference relates to the reasons for intervention in the elective group, the elective process itself cannot be discounted as having a relationship to the increased incidence of perinatal death.
Gestation (weeks)Stillbirth Neonatal death Perinatal death
Spontaneous Elective Spontaneous Elective Spontaneous Elective
24 or less 371.7 780.9 763.0 792.7 851.1 954.6
25–28 43.5 327.4 113.0 100.0 151.6 394.6
29–32 19.8 99.9 14.9 21.8 34.4 119.5
33–36 5.0 20.7 4.9 5.8 9.9 26.4
37–40 0.9 2.1 0.7 0.9 1.6 3.0
41 or more 1.3 1.3 0.7 0.7 2.0 2.0
Table 12: Perinatal mortality rate by onset of birth process, Queensland 2009 to 2013 (Elective = induction of labour and caesarean section without labour; Spontaneous = spontaneous onset of
labour; Perinatal mortality rate and stillbirth rate = per 1000 births; Neonatal mortality rate = per 1000 live births)
Good practice point:
Repeat caesarean section without labour and induction of labour before 39 weeks of gestation are common, yet are associated with respiratory and other adverse neonatal outcomes. Elective intervention in pregnancy before 39 weeks of gestation should be avoided wherever possible.
2.4 Birthweight
Approximately 7 per cent of babies born are “low birthweight” (less than 2500g) as shown in Figure 27 and Table A22 and this rate has not changed significantly between 2000 and 2011.
Perc
enta
ge o
f bab
ies
born
(log
sca
le)
<1500g
1
10
100
1500–2499g 2500–3999g 4000g or more
2013201220112010200920082007200620052004
Figure 27: Birthweight distribution, Queensland 2004 to 2013 (Table A22)
Cautionary note regarding interpretation: a log scale is used on the vertical axis of this graph.
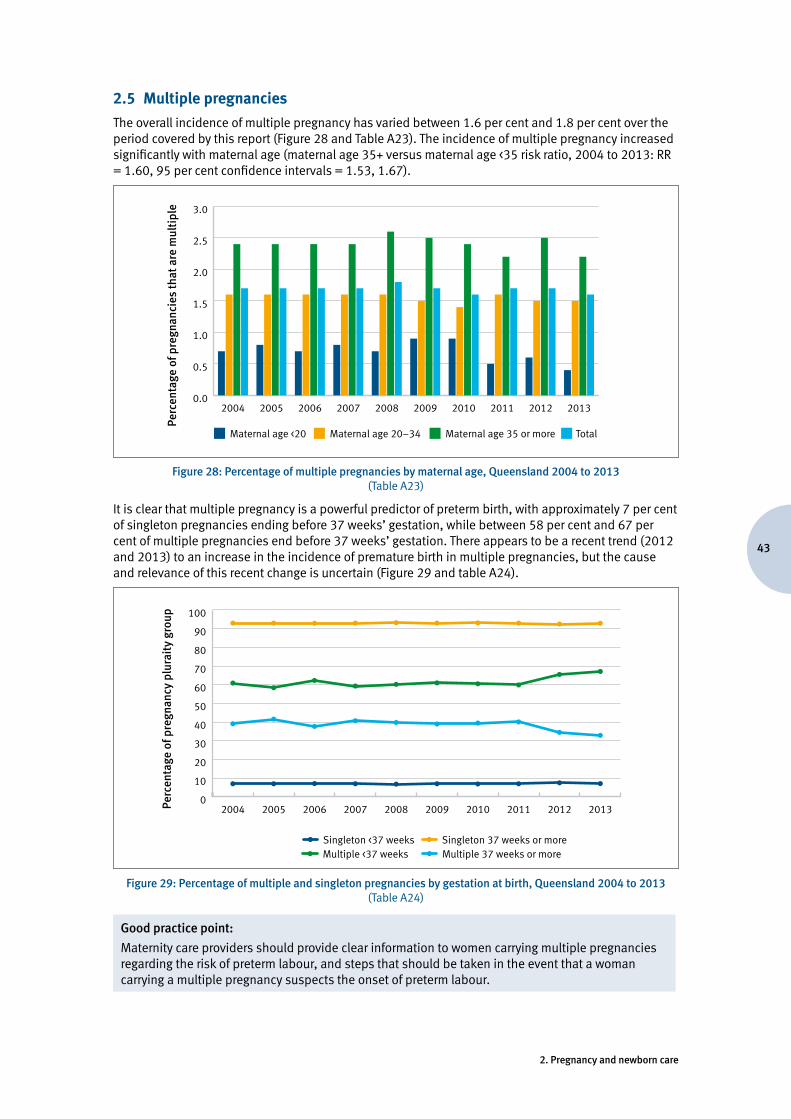
43
2. Pregnancy and newborn care
2.5 Multiple pregnancies
The overall incidence of multiple pregnancy has varied between 1.6 per cent and 1.8 per cent over the period covered by this report (Figure 28 and Table A23). The incidence of multiple pregnancy increased significantly with maternal age (maternal age 35+ versus maternal age <35 risk ratio, 2004 to 2013: RR = 1.60, 95 per cent confidence intervals = 1.53, 1.67).
Perc
enta
ge o
f pre
gnan
cies
that
are
mul
tipl
e
Maternal age <20 Maternal age 20–34 Maternal age 35 or more Total
0.0
0.5
1.0
1.5
2.0
2.5
3.0
2013201220112010200920082007200620052004
Figure 28: Percentage of multiple pregnancies by maternal age, Queensland 2004 to 2013 (Table A23)
It is clear that multiple pregnancy is a powerful predictor of preterm birth, with approximately 7 per cent of singleton pregnancies ending before 37 weeks’ gestation, while between 58 per cent and 67 per cent of multiple pregnancies end before 37 weeks’ gestation. There appears to be a recent trend (2012 and 2013) to an increase in the incidence of premature birth in multiple pregnancies, but the cause and relevance of this recent change is uncertain (Figure 29 and table A24).
Perc
enta
ge o
f pre
gnan
cy p
lura
ity
grou
p
Singleton <37 weeks
0
10
20
30
40
50
60
70
80
90
100
2013201220112010200920082007200620052004
Singleton 37 weeks or moreMultiple <37 weeks Multiple 37 weeks or more
Figure 29: Percentage of multiple and singleton pregnancies by gestation at birth, Queensland 2004 to 2013 (Table A24)
Good practice point:
Maternity care providers should provide clear information to women carrying multiple pregnancies regarding the risk of preterm labour, and steps that should be taken in the event that a woman carrying a multiple pregnancy suspects the onset of preterm labour.
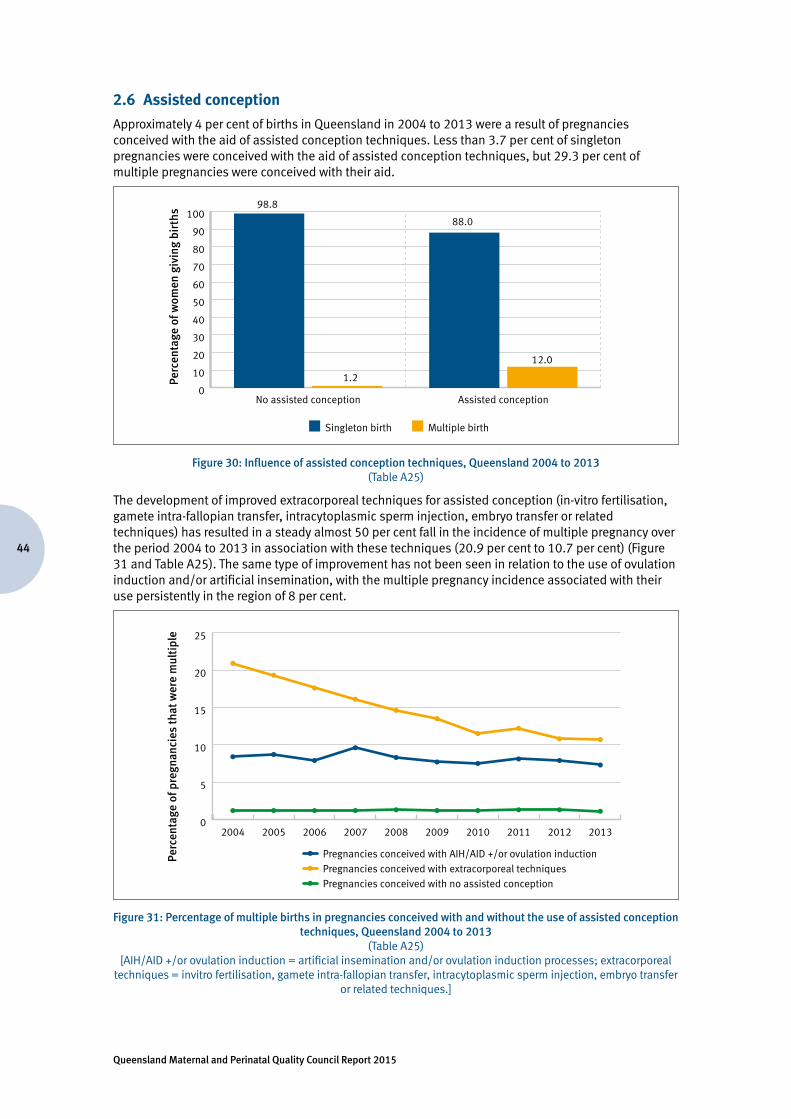
Queensland Maternal and Perinatal Quality Council Report 2015
44
2.6 Assisted conception
Approximately 4 per cent of births in Queensland in 2004 to 2013 were a result of pregnancies conceived with the aid of assisted conception techniques. Less than 3.7 per cent of singleton pregnancies were conceived with the aid of assisted conception techniques, but 29.3 per cent of multiple pregnancies were conceived with their aid.
0
10
20
30
40
50
60
70
80
90
100
Assisted conceptionNo assisted conception
1.2
98.8
88.0
12.0
9.7
Perc
enta
ge o
f wom
en g
ivin
g bi
rths
Singleton birth Multiple birth
Figure 30: Influence of assisted conception techniques, Queensland 2004 to 2013 (Table A25)
The development of improved extracorporeal techniques for assisted conception (in-vitro fertilisation, gamete intra-fallopian transfer, intracytoplasmic sperm injection, embryo transfer or related techniques) has resulted in a steady almost 50 per cent fall in the incidence of multiple pregnancy over the period 2004 to 2013 in association with these techniques (20.9 per cent to 10.7 per cent) (Figure 31 and Table A25). The same type of improvement has not been seen in relation to the use of ovulation induction and/or artificial insemination, with the multiple pregnancy incidence associated with their use persistently in the region of 8 per cent.
Perc
enta
ge o
f pre
gnan
cies
that
wer
e m
ulti
ple
Pregnancies conceived with AIH/AID +/or ovulation induction
0
5
10
15
20
25
2013201220112010200920082007200620052004
Pregnancies conceived with extracorporeal techniquesPregnancies conceived with no assisted conception
Figure 31: Percentage of multiple births in pregnancies conceived with and without the use of assisted conception techniques, Queensland 2004 to 2013
(Table A25) [AIH/AID +/or ovulation induction = artificial insemination and/or ovulation induction processes; extracorporeal
techniques = invitro fertilisation, gamete intra-fallopian transfer, intracytoplasmic sperm injection, embryo transfer or related techniques.]
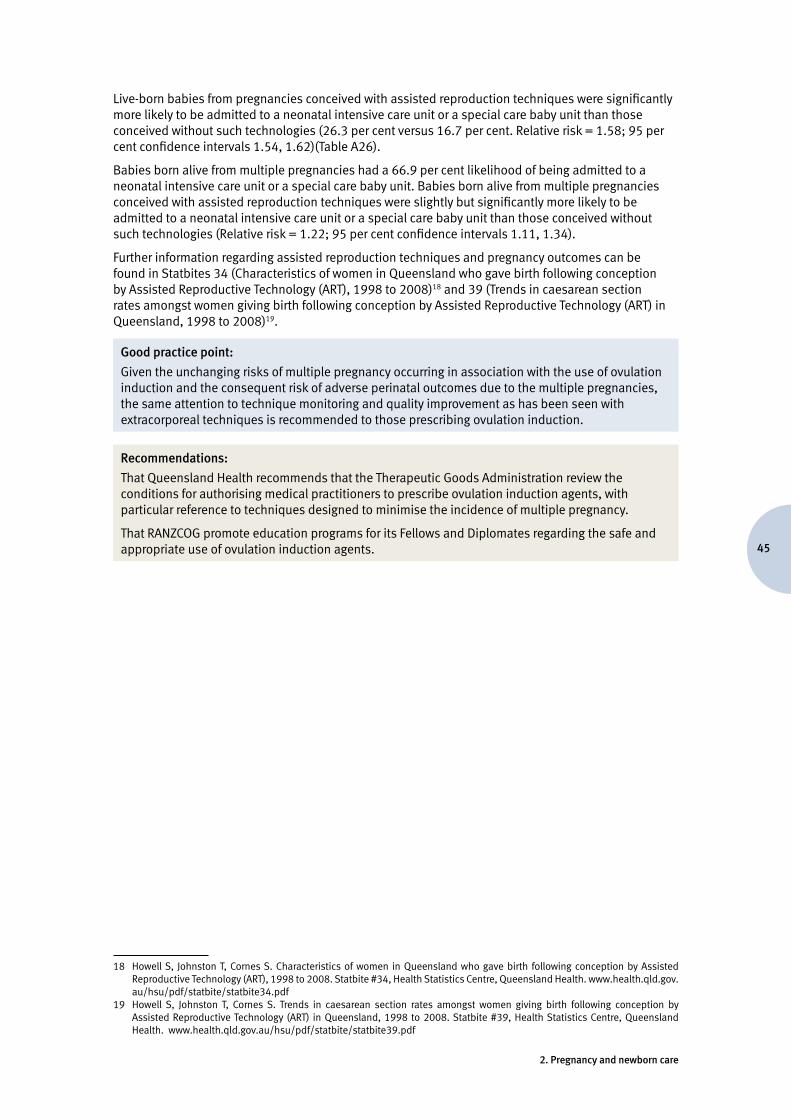
45
2. Pregnancy and newborn care
Live-born babies from pregnancies conceived with assisted reproduction techniques were significantly more likely to be admitted to a neonatal intensive care unit or a special care baby unit than those conceived without such technologies (26.3 per cent versus 16.7 per cent. Relative risk = 1.58; 95 per cent confidence intervals 1.54, 1.62)(Table A26).
Babies born alive from multiple pregnancies had a 66.9 per cent likelihood of being admitted to a neonatal intensive care unit or a special care baby unit. Babies born alive from multiple pregnancies conceived with assisted reproduction techniques were slightly but significantly more likely to be admitted to a neonatal intensive care unit or a special care baby unit than those conceived without such technologies (Relative risk = 1.22; 95 per cent confidence intervals 1.11, 1.34).
Further information regarding assisted reproduction techniques and pregnancy outcomes can be found in Statbites 34 (Characteristics of women in Queensland who gave birth following conception by Assisted Reproductive Technology (ART), 1998 to 2008)18 and 39 (Trends in caesarean section rates amongst women giving birth following conception by Assisted Reproductive Technology (ART) in Queensland, 1998 to 2008)19.
Good practice point:
Given the unchanging risks of multiple pregnancy occurring in association with the use of ovulation induction and the consequent risk of adverse perinatal outcomes due to the multiple pregnancies, the same attention to technique monitoring and quality improvement as has been seen with extracorporeal techniques is recommended to those prescribing ovulation induction.
Recommendations:
That Queensland Health recommends that the Therapeutic Goods Administration review the conditions for authorising medical practitioners to prescribe ovulation induction agents, with particular reference to techniques designed to minimise the incidence of multiple pregnancy.
That RANZCOG promote education programs for its Fellows and Diplomates regarding the safe and appropriate use of ovulation induction agents.
18 Howell S, Johnston T, Cornes S. Characteristics of women in Queensland who gave birth following conception by Assisted Reproductive Technology (ART), 1998 to 2008. Statbite #34, Health Statistics Centre, Queensland Health. www.health.qld.gov.au/hsu/pdf/statbite/statbite34.pdf
19 Howell S, Johnston T, Cornes S. Trends in caesarean section rates amongst women giving birth following conception by Assisted Reproductive Technology (ART) in Queensland, 1998 to 2008. Statbite #39, Health Statistics Centre, Queensland Health. www.health.qld.gov.au/hsu/pdf/statbite/statbite39.pdf
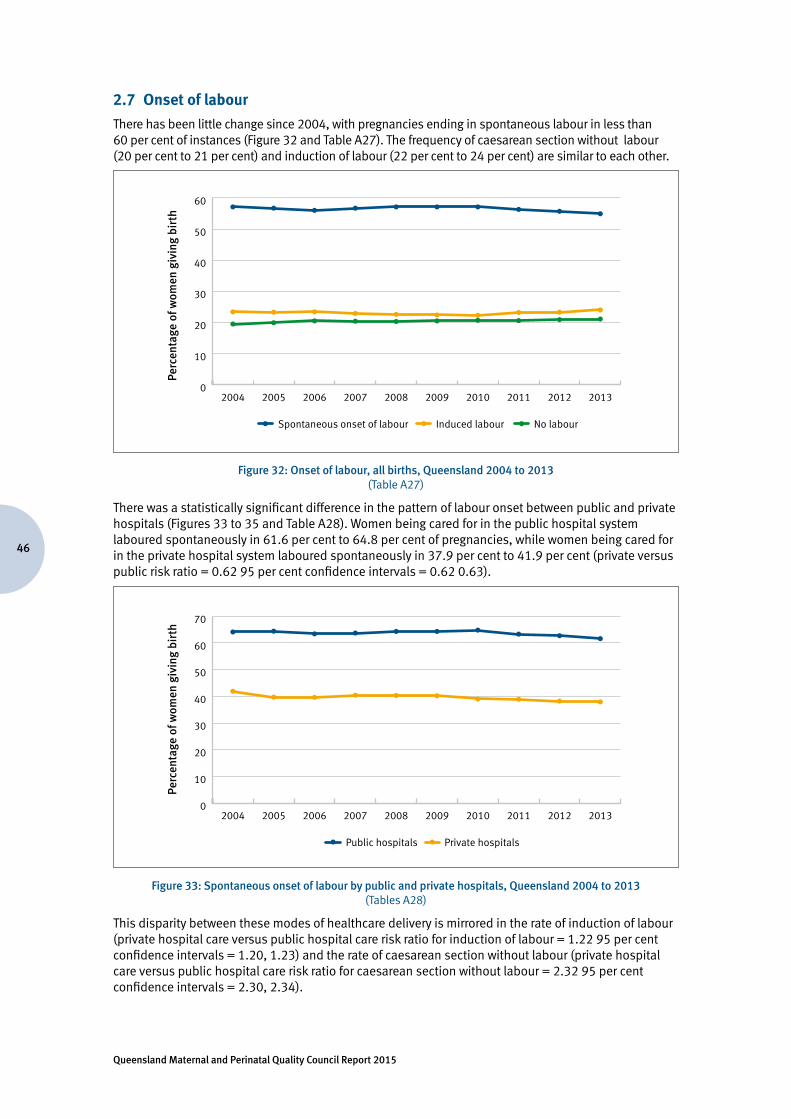
Queensland Maternal and Perinatal Quality Council Report 2015
46
2.7 Onset of labour
There has been little change since 2004, with pregnancies ending in spontaneous labour in less than 60 per cent of instances (Figure 32 and Table A27). The frequency of caesarean section without labour (20 per cent to 21 per cent) and induction of labour (22 per cent to 24 per cent) are similar to each other.
Perc
enta
ge o
f wom
en g
ivin
g bi
rth
Spontaneous onset of labour Induced labour No labour
0
10
20
30
40
50
60
2013201220112010200920082007200620052004
Figure 32: Onset of labour, all births, Queensland 2004 to 2013 (Table A27)
There was a statistically significant difference in the pattern of labour onset between public and private hospitals (Figures 33 to 35 and Table A28). Women being cared for in the public hospital system laboured spontaneously in 61.6 per cent to 64.8 per cent of pregnancies, while women being cared for in the private hospital system laboured spontaneously in 37.9 per cent to 41.9 per cent (private versus public risk ratio = 0.62 95 per cent confidence intervals = 0.62 0.63).
Perc
enta
ge o
f wom
en g
ivin
g bi
rth
Public hospitals Private hospitals
0
10
20
30
40
50
60
70
2013201220112010200920082007200620052004
Figure 33: Spontaneous onset of labour by public and private hospitals, Queensland 2004 to 2013 (Tables A28)
This disparity between these modes of healthcare delivery is mirrored in the rate of induction of labour (private hospital care versus public hospital care risk ratio for induction of labour = 1.22 95 per cent confidence intervals = 1.20, 1.23) and the rate of caesarean section without labour (private hospital care versus public hospital care risk ratio for caesarean section without labour = 2.32 95 per cent confidence intervals = 2.30, 2.34).
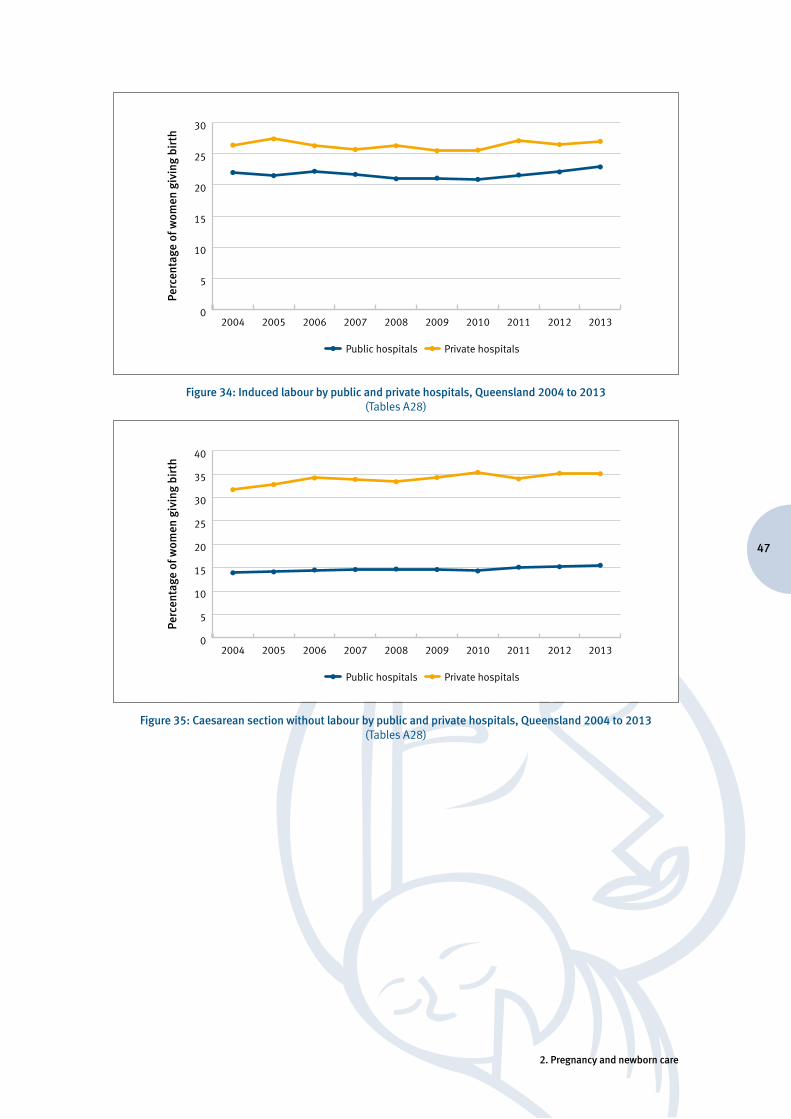
47
2. Pregnancy and newborn care
Perc
enta
ge o
f wom
en g
ivin
g bi
rth
Public hospitals Private hospitals
0
5
10
15
20
25
30
2013201220112010200920082007200620052004
Figure 34: Induced labour by public and private hospitals, Queensland 2004 to 2013 (Tables A28)
Perc
enta
ge o
f wom
en g
ivin
g bi
rth
Public hospitals Private hospitals
0
5
10
15
20
25
30
35
40
2013201220112010200920082007200620052004
Figure 35: Caesarean section without labour by public and private hospitals, Queensland 2004 to 2013 (Tables A28)
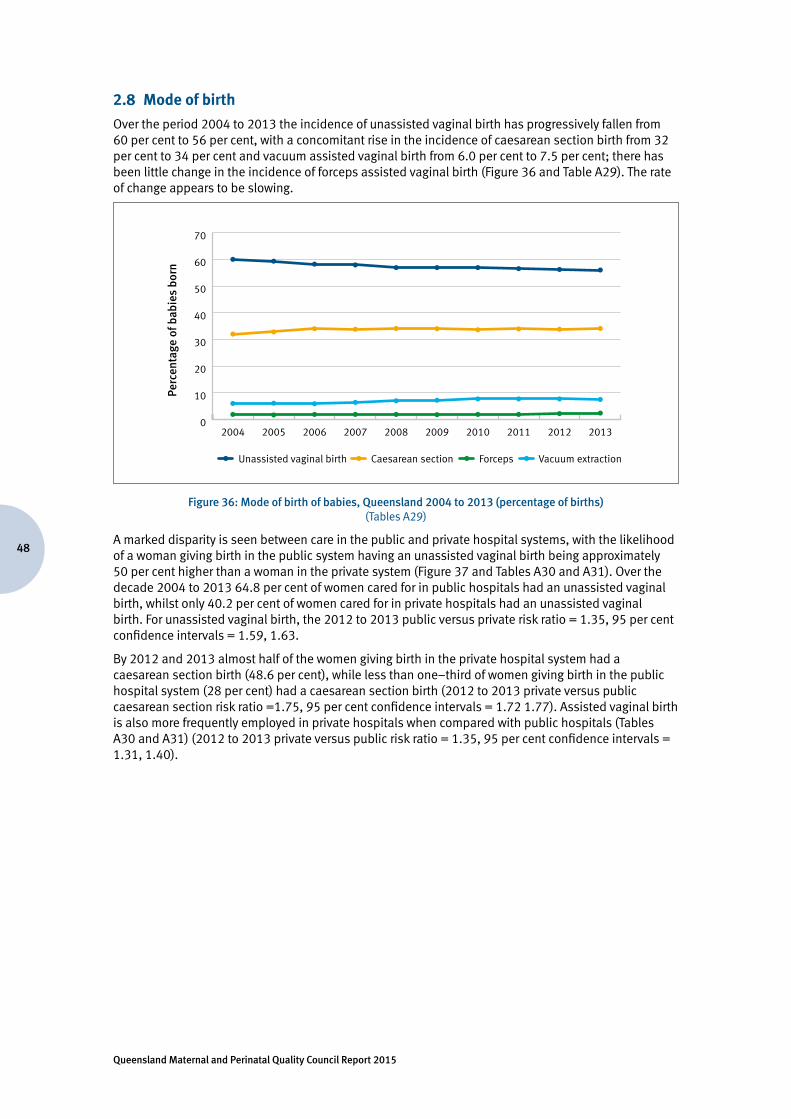
Queensland Maternal and Perinatal Quality Council Report 2015
48
2.8 Mode of birth
Over the period 2004 to 2013 the incidence of unassisted vaginal birth has progressively fallen from 60 per cent to 56 per cent, with a concomitant rise in the incidence of caesarean section birth from 32 per cent to 34 per cent and vacuum assisted vaginal birth from 6.0 per cent to 7.5 per cent; there has been little change in the incidence of forceps assisted vaginal birth (Figure 36 and Table A29). The rate of change appears to be slowing.
Perc
enta
ge o
f bab
ies
born
Unassisted vaginal birth Caesarean section Forceps
0
10
20
30
40
50
60
70
2013201220112010200920082007200620052004
Vacuum extraction
Figure 36: Mode of birth of babies, Queensland 2004 to 2013 (percentage of births)(Tables A29)
A marked disparity is seen between care in the public and private hospital systems, with the likelihood of a woman giving birth in the public system having an unassisted vaginal birth being approximately 50 per cent higher than a woman in the private system (Figure 37 and Tables A30 and A31). Over the decade 2004 to 2013 64.8 per cent of women cared for in public hospitals had an unassisted vaginal birth, whilst only 40.2 per cent of women cared for in private hospitals had an unassisted vaginal birth. For unassisted vaginal birth, the 2012 to 2013 public versus private risk ratio = 1.35, 95 per cent confidence intervals = 1.59, 1.63.
By 2012 and 2013 almost half of the women giving birth in the private hospital system had a caesarean section birth (48.6 per cent), while less than one–third of women giving birth in the public hospital system (28 per cent) had a caesarean section birth (2012 to 2013 private versus public caesarean section risk ratio =1.75, 95 per cent confidence intervals = 1.72 1.77). Assisted vaginal birth is also more frequently employed in private hospitals when compared with public hospitals (Tables A30 and A31) (2012 to 2013 private versus public risk ratio = 1.35, 95 per cent confidence intervals = 1.31, 1.40).
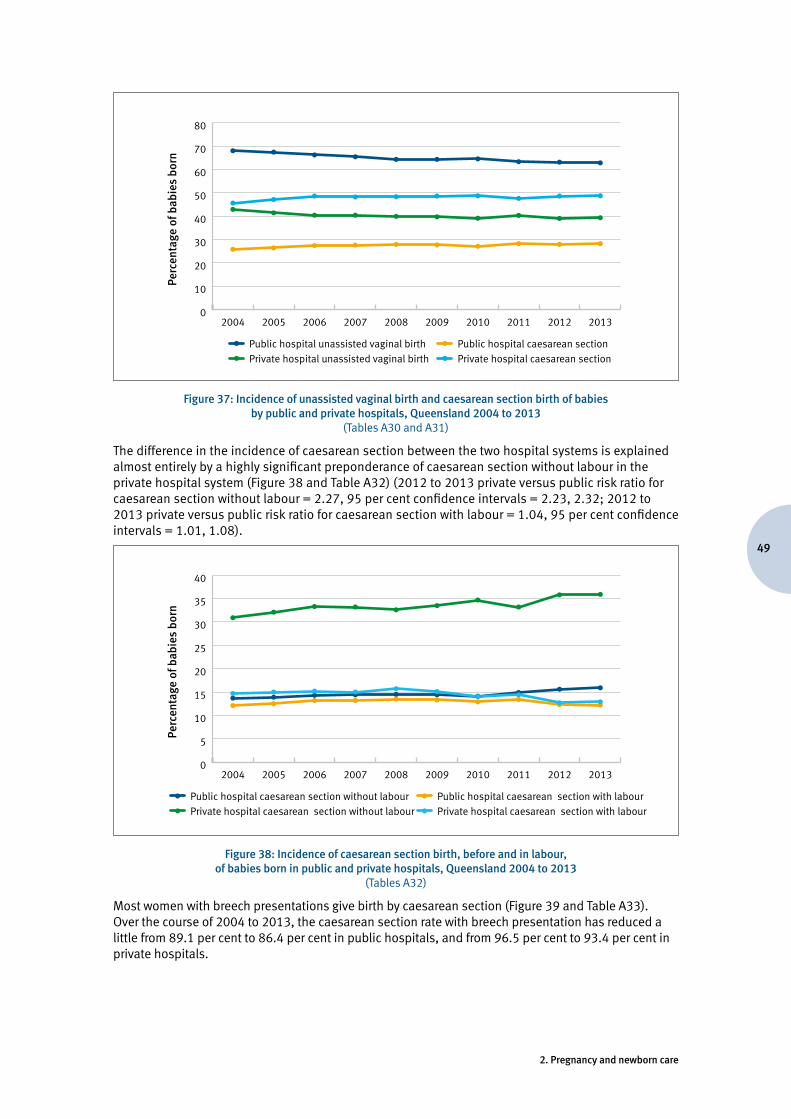
49
2. Pregnancy and newborn care
Perc
enta
ge o
f bab
ies
born
Public hospital unassisted vaginal birth
0
10
20
30
40
50
60
70
80
2013201220112010200920082007200620052004
Private hospital unassisted vaginal birthPublic hospital caesarean sectionPrivate hospital caesarean section
Figure 37: Incidence of unassisted vaginal birth and caesarean section birth of babies by public and private hospitals, Queensland 2004 to 2013
(Tables A30 and A31)
The difference in the incidence of caesarean section between the two hospital systems is explained almost entirely by a highly significant preponderance of caesarean section without labour in the private hospital system (Figure 38 and Table A32) (2012 to 2013 private versus public risk ratio for caesarean section without labour = 2.27, 95 per cent confidence intervals = 2.23, 2.32; 2012 to 2013 private versus public risk ratio for caesarean section with labour = 1.04, 95 per cent confidence intervals = 1.01, 1.08).
Perc
enta
ge o
f bab
ies
born
Public hospital caesarean section without labour
0
5
10
15
20
25
30
35
40
2013201220112010200920082007200620052004
Private hospital caesarean section without labourPublic hospital caesarean section with labourPrivate hospital caesarean section with labour
Figure 38: Incidence of caesarean section birth, before and in labour, of babies born in public and private hospitals, Queensland 2004 to 2013
(Tables A32)
Most women with breech presentations give birth by caesarean section (Figure 39 and Table A33). Over the course of 2004 to 2013, the caesarean section rate with breech presentation has reduced a little from 89.1 per cent to 86.4 per cent in public hospitals, and from 96.5 per cent to 93.4 per cent in private hospitals.
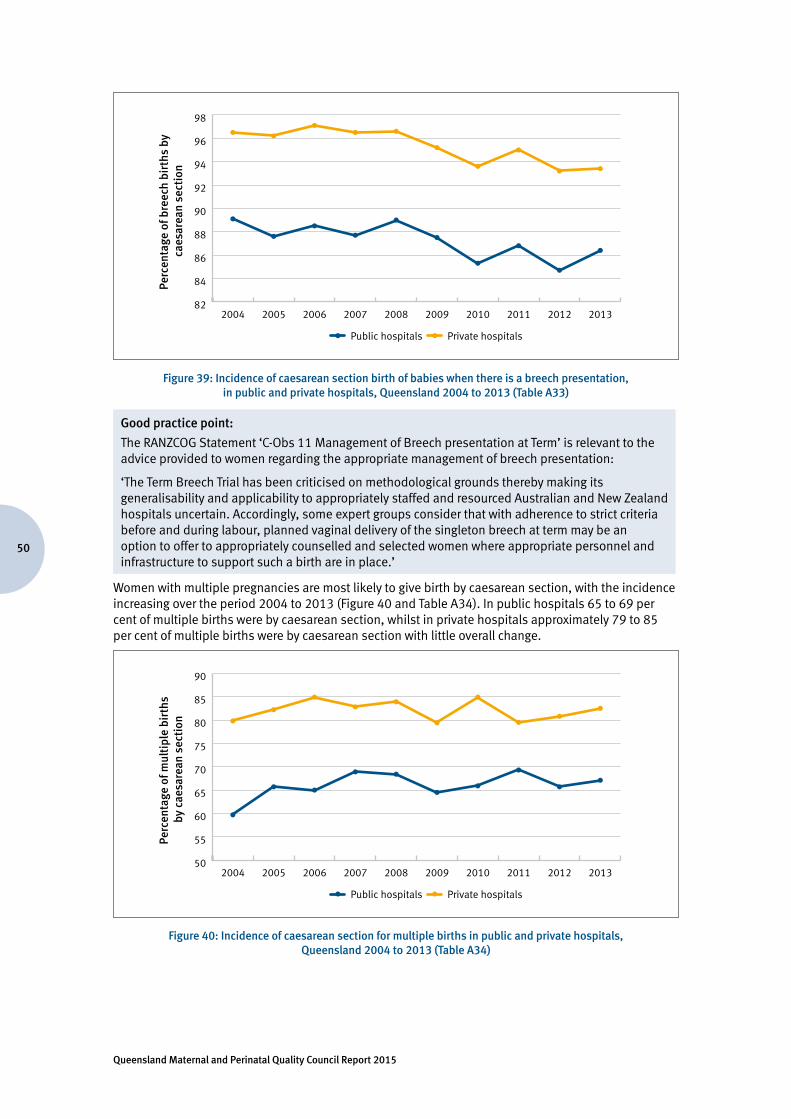
Queensland Maternal and Perinatal Quality Council Report 2015
50
Perc
enta
ge o
f bre
ech
birt
hs b
y ca
esar
ean
sect
ion
Public hospitals
82
84
86
88
90
92
94
96
98
2013201220112010200920082007200620052004
Private hospitals
Figure 39: Incidence of caesarean section birth of babies when there is a breech presentation, in public and private hospitals, Queensland 2004 to 2013 (Table A33)
Good practice point:
The RANZCOG Statement ‘C-Obs 11 Management of Breech presentation at Term’ is relevant to the advice provided to women regarding the appropriate management of breech presentation:
‘The Term Breech Trial has been criticised on methodological grounds thereby making its generalisability and applicability to appropriately staffed and resourced Australian and New Zealand hospitals uncertain. Accordingly, some expert groups consider that with adherence to strict criteria before and during labour, planned vaginal delivery of the singleton breech at term may be an option to offer to appropriately counselled and selected women where appropriate personnel and infrastructure to support such a birth are in place.’
Women with multiple pregnancies are most likely to give birth by caesarean section, with the incidence increasing over the period 2004 to 2013 (Figure 40 and Table A34). In public hospitals 65 to 69 per cent of multiple births were by caesarean section, whilst in private hospitals approximately 79 to 85 per cent of multiple births were by caesarean section with little overall change.
Perc
enta
ge o
f mul
tipl
e bi
rths
by
cae
sare
an s
ecti
on
Public hospitals
50
55
60
65
70
75
80
85
90
2013201220112010200920082007200620052004
Private hospitals
Figure 40: Incidence of caesarean section for multiple births in public and private hospitals, Queensland 2004 to 2013 (Table A34)
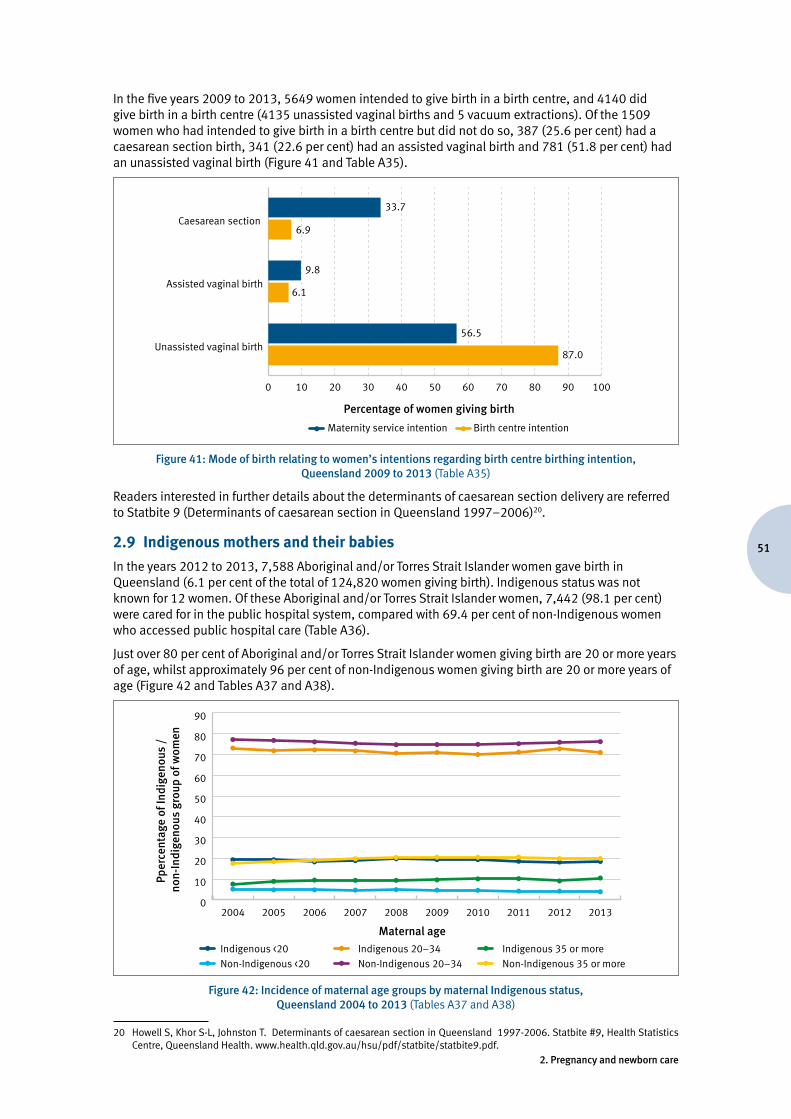
51
2. Pregnancy and newborn care
In the five years 2009 to 2013, 5649 women intended to give birth in a birth centre, and 4140 did give birth in a birth centre (4135 unassisted vaginal births and 5 vacuum extractions). Of the 1509 women who had intended to give birth in a birth centre but did not do so, 387 (25.6 per cent) had a caesarean section birth, 341 (22.6 per cent) had an assisted vaginal birth and 781 (51.8 per cent) had an unassisted vaginal birth (Figure 41 and Table A35).
0 10 20 30 40 50 60 70 80 90 100
Unassisted vaginal birth
Assisted vaginal birth
Caesarean section
Percentage of women giving birth
Maternity service intention Birth centre intention
33.7
6.9
9.8
6.1
56.5
87.0
Figure 41: Mode of birth relating to women’s intentions regarding birth centre birthing intention, Queensland 2009 to 2013 (Table A35)
Readers interested in further details about the determinants of caesarean section delivery are referred to Statbite 9 (Determinants of caesarean section in Queensland 1997–2006)20.
2.9 Indigenous mothers and their babies
In the years 2012 to 2013, 7,588 Aboriginal and/or Torres Strait Islander women gave birth in Queensland (6.1 per cent of the total of 124,820 women giving birth). Indigenous status was not known for 12 women. Of these Aboriginal and/or Torres Strait Islander women, 7,442 (98.1 per cent) were cared for in the public hospital system, compared with 69.4 per cent of non-Indigenous women who accessed public hospital care (Table A36).
Just over 80 per cent of Aboriginal and/or Torres Strait Islander women giving birth are 20 or more years of age, whilst approximately 96 per cent of non-Indigenous women giving birth are 20 or more years of age (Figure 42 and Tables A37 and A38).
Pper
cent
age
of In
dige
nous
/
non-
Indi
geno
us g
roup
of w
omen
Indigenous <20
0
10
20
30
40
50
60
70
80
90
2013201220112010200920082007200620052004
Non-Indigenous <20Indigenous 20–34Non-Indigenous 20–34
Indigenous 35 or moreNon-Indigenous 35 or more
Maternal age
Figure 42: Incidence of maternal age groups by maternal Indigenous status, Queensland 2004 to 2013 (Tables A37 and A38)
20 Howell S, Khor S-L, Johnston T. Determinants of caesarean section in Queensland 1997-2006. Statbite #9, Health Statistics Centre, Queensland Health. www.health.qld.gov.au/hsu/pdf/statbite/statbite9.pdf.
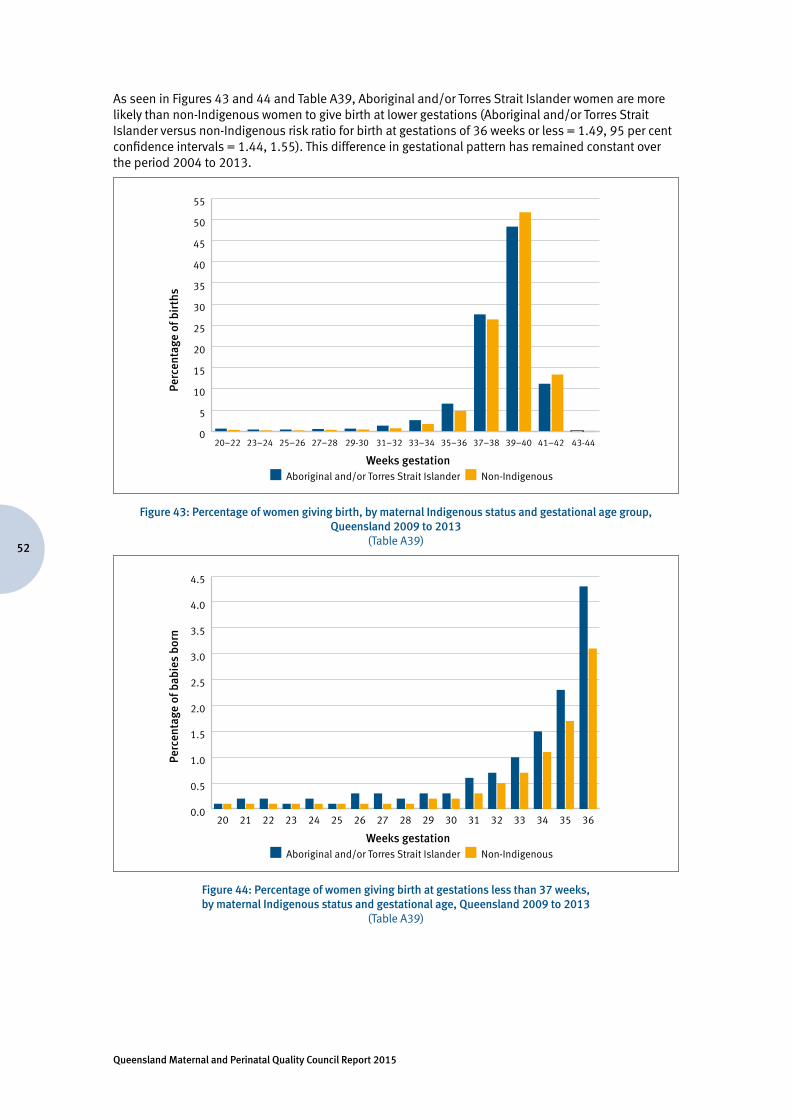
Queensland Maternal and Perinatal Quality Council Report 2015
52
As seen in Figures 43 and 44 and Table A39, Aboriginal and/or Torres Strait Islander women are more likely than non-Indigenous women to give birth at lower gestations (Aboriginal and/or Torres Strait Islander versus non-Indigenous risk ratio for birth at gestations of 36 weeks or less = 1.49, 95 per cent confidence intervals = 1.44, 1.55). This difference in gestational pattern has remained constant over the period 2004 to 2013.
Perc
enta
ge o
f bir
ths
Weeks gestationAboriginal and/or Torres Strait Islander Non-Indigenous
0
5
10
15
20
25
30
35
40
45
50
55
43-4441–4239–4037–3835–3633–3431–3229-3027–2825–2623–2420–22
Figure 43: Percentage of women giving birth, by maternal Indigenous status and gestational age group, Queensland 2009 to 2013
(Table A39)
Perc
enta
ge o
f bab
ies
born
Weeks gestationAboriginal and/or Torres Strait Islander Non-Indigenous
0.0
0.5
1.0
1.5
2.0
2.5
3.0
3.5
4.0
4.5
3635343332313029282726252423222120
Figure 44: Percentage of women giving birth at gestations less than 37 weeks, by maternal Indigenous status and gestational age, Queensland 2009 to 2013
(Table A39)
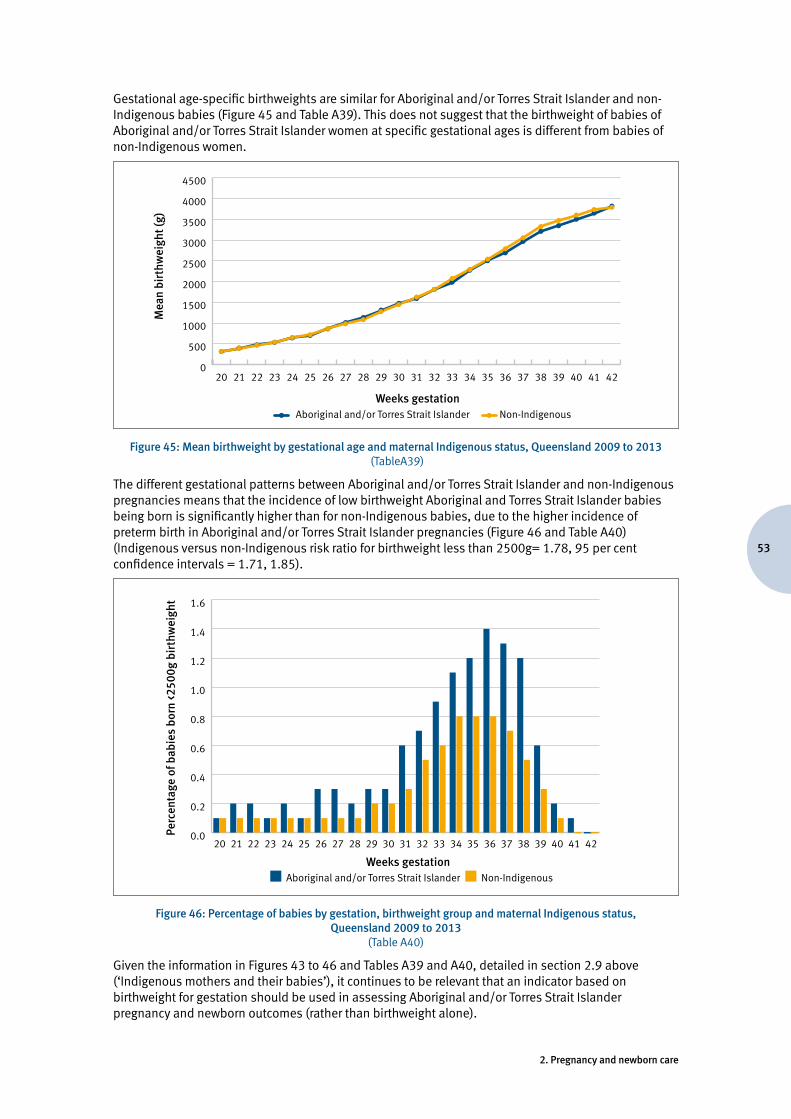
53
2. Pregnancy and newborn care
Gestational age-specific birthweights are similar for Aboriginal and/or Torres Strait Islander and non-Indigenous babies (Figure 45 and Table A39). This does not suggest that the birthweight of babies of Aboriginal and/or Torres Strait Islander women at specific gestational ages is different from babies of non-Indigenous women.
Mea
n bi
rthw
eigh
t (g)
0
500
1000
1500
2000
2500
3000
3500
4000
4500
4241403938373635343332313029282726252423222120
Weeks gestationAboriginal and/or Torres Strait Islander Non-Indigenous
Figure 45: Mean birthweight by gestational age and maternal Indigenous status, Queensland 2009 to 2013 (TableA39)
The different gestational patterns between Aboriginal and/or Torres Strait Islander and non-Indigenous pregnancies means that the incidence of low birthweight Aboriginal and Torres Strait Islander babies being born is significantly higher than for non-Indigenous babies, due to the higher incidence of preterm birth in Aboriginal and/or Torres Strait Islander pregnancies (Figure 46 and Table A40) (Indigenous versus non-Indigenous risk ratio for birthweight less than 2500g= 1.78, 95 per cent confidence intervals = 1.71, 1.85).
Perc
enta
ge o
f bab
ies
born
<25
00g
birt
hwei
ght
Weeks gestationAboriginal and/or Torres Strait Islander Non-Indigenous
0.0
0.2
0.4
0.6
0.8
1.0
1.2
1.4
1.6
4241403938373635343332313029282726252423222120
Figure 46: Percentage of babies by gestation, birthweight group and maternal Indigenous status, Queensland 2009 to 2013
(Table A40)
Given the information in Figures 43 to 46 and Tables A39 and A40, detailed in section 2.9 above (‘Indigenous mothers and their babies’), it continues to be relevant that an indicator based on birthweight for gestation should be used in assessing Aboriginal and/or Torres Strait Islander pregnancy and newborn outcomes (rather than birthweight alone).
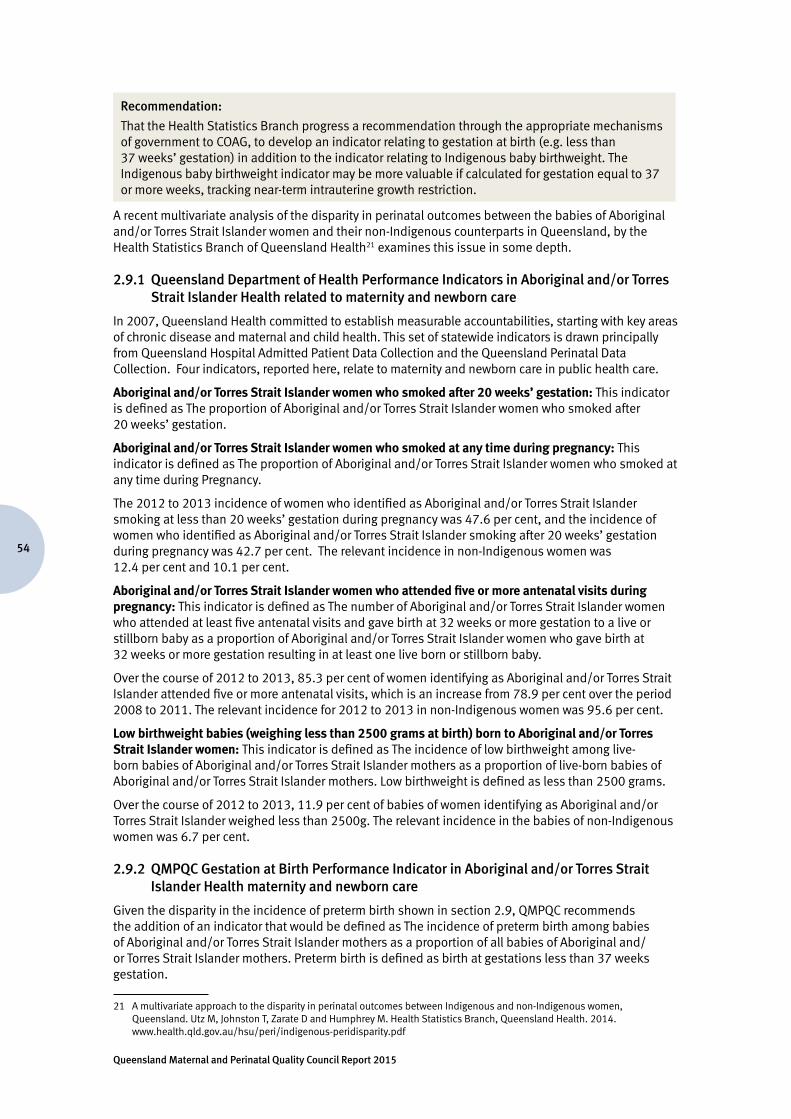
Queensland Maternal and Perinatal Quality Council Report 2015
54
Recommendation:
That the Health Statistics Branch progress a recommendation through the appropriate mechanisms of government to COAG, to develop an indicator relating to gestation at birth (e.g. less than 37 weeks’ gestation) in addition to the indicator relating to Indigenous baby birthweight. The Indigenous baby birthweight indicator may be more valuable if calculated for gestation equal to 37 or more weeks, tracking near-term intrauterine growth restriction.
A recent multivariate analysis of the disparity in perinatal outcomes between the babies of Aboriginal and/or Torres Strait Islander women and their non-Indigenous counterparts in Queensland, by the Health Statistics Branch of Queensland Health21 examines this issue in some depth.
2.9.1 Queensland Department of Health Performance Indicators in Aboriginal and/or Torres Strait Islander Health related to maternity and newborn care
In 2007, Queensland Health committed to establish measurable accountabilities, starting with key areas of chronic disease and maternal and child health. This set of statewide indicators is drawn principally from Queensland Hospital Admitted Patient Data Collection and the Queensland Perinatal Data Collection. Four indicators, reported here, relate to maternity and newborn care in public health care.
Aboriginal and/or Torres Strait Islander women who smoked after 20 weeks’ gestation: This indicator is defined as The proportion of Aboriginal and/or Torres Strait Islander women who smoked after 20 weeks’ gestation.
Aboriginal and/or Torres Strait Islander women who smoked at any time during pregnancy: This indicator is defined as The proportion of Aboriginal and/or Torres Strait Islander women who smoked at any time during Pregnancy.
The 2012 to 2013 incidence of women who identified as Aboriginal and/or Torres Strait Islander smoking at less than 20 weeks’ gestation during pregnancy was 47.6 per cent, and the incidence of women who identified as Aboriginal and/or Torres Strait Islander smoking after 20 weeks’ gestation during pregnancy was 42.7 per cent. The relevant incidence in non-Indigenous women was 12.4 per cent and 10.1 per cent.
Aboriginal and/or Torres Strait Islander women who attended five or more antenatal visits during pregnancy: This indicator is defined as The number of Aboriginal and/or Torres Strait Islander women who attended at least five antenatal visits and gave birth at 32 weeks or more gestation to a live or stillborn baby as a proportion of Aboriginal and/or Torres Strait Islander women who gave birth at 32 weeks or more gestation resulting in at least one live born or stillborn baby.
Over the course of 2012 to 2013, 85.3 per cent of women identifying as Aboriginal and/or Torres Strait Islander attended five or more antenatal visits, which is an increase from 78.9 per cent over the period 2008 to 2011. The relevant incidence for 2012 to 2013 in non-Indigenous women was 95.6 per cent.
Low birthweight babies (weighing less than 2500 grams at birth) born to Aboriginal and/or Torres Strait Islander women: This indicator is defined as The incidence of low birthweight among live-born babies of Aboriginal and/or Torres Strait Islander mothers as a proportion of live-born babies of Aboriginal and/or Torres Strait Islander mothers. Low birthweight is defined as less than 2500 grams.
Over the course of 2012 to 2013, 11.9 per cent of babies of women identifying as Aboriginal and/or Torres Strait Islander weighed less than 2500g. The relevant incidence in the babies of non-Indigenous women was 6.7 per cent.
2.9.2 QMPQC Gestation at Birth Performance Indicator in Aboriginal and/or Torres Strait Islander Health maternity and newborn care
Given the disparity in the incidence of preterm birth shown in section 2.9, QMPQC recommends the addition of an indicator that would be defined as The incidence of preterm birth among babies of Aboriginal and/or Torres Strait Islander mothers as a proportion of all babies of Aboriginal and/or Torres Strait Islander mothers. Preterm birth is defined as birth at gestations less than 37 weeks gestation.
21 A multivariate approach to the disparity in perinatal outcomes between Indigenous and non-Indigenous women, Queensland. Utz M, Johnston T, Zarate D and Humphrey M. Health Statistics Branch, Queensland Health. 2014. www.health.qld.gov.au/hsu/peri/indigenous-peridisparity.pdf
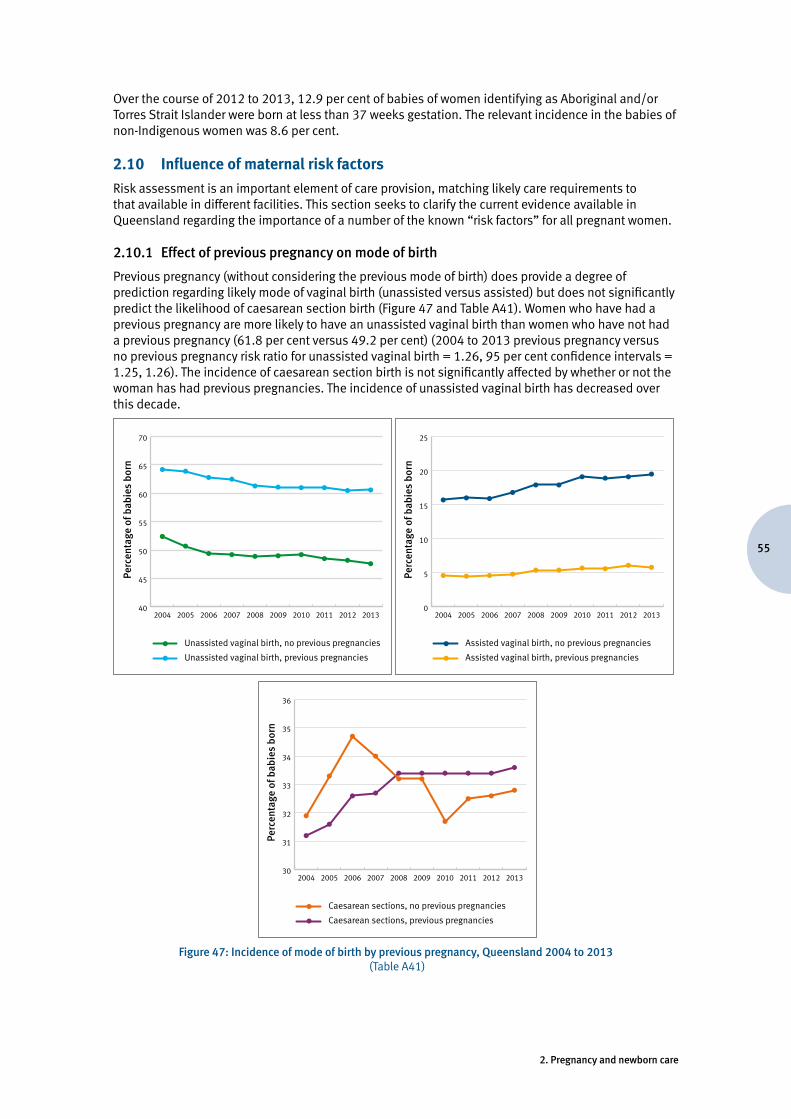
55
2. Pregnancy and newborn care
Over the course of 2012 to 2013, 12.9 per cent of babies of women identifying as Aboriginal and/or Torres Strait Islander were born at less than 37 weeks gestation. The relevant incidence in the babies of non-Indigenous women was 8.6 per cent.
2.10 Influence of maternal risk factors
Risk assessment is an important element of care provision, matching likely care requirements to that available in different facilities. This section seeks to clarify the current evidence available in Queensland regarding the importance of a number of the known “risk factors” for all pregnant women.
2.10.1 Effect of previous pregnancy on mode of birth
Previous pregnancy (without considering the previous mode of birth) does provide a degree of prediction regarding likely mode of vaginal birth (unassisted versus assisted) but does not significantly predict the likelihood of caesarean section birth (Figure 47 and Table A41). Women who have had a previous pregnancy are more likely to have an unassisted vaginal birth than women who have not had a previous pregnancy (61.8 per cent versus 49.2 per cent) (2004 to 2013 previous pregnancy versus no previous pregnancy risk ratio for unassisted vaginal birth = 1.26, 95 per cent confidence intervals = 1.25, 1.26). The incidence of caesarean section birth is not significantly affected by whether or not the woman has had previous pregnancies. The incidence of unassisted vaginal birth has decreased over this decade.
Perc
enta
ge o
f bab
ies
born
40
45
50
55
60
65
70
2013201220112010200920082007200620052004
Unassisted vaginal birth, no previous pregnancies
Unassisted vaginal birth, previous pregnancies
Perc
enta
ge o
f bab
ies
born
0
5
10
15
20
25
2013201220112010200920082007200620052004
Assisted vaginal birth, no previous pregnancies
Assisted vaginal birth, previous pregnancies
Perc
enta
ge o
f bab
ies
born
30
31
32
33
34
35
36
2013201220112010200920082007200620052004
Caesarean sections, no previous pregnancies
Caesarean sections, previous pregnancies
Figure 47: Incidence of mode of birth by previous pregnancy, Queensland 2004 to 2013 (Table A41)
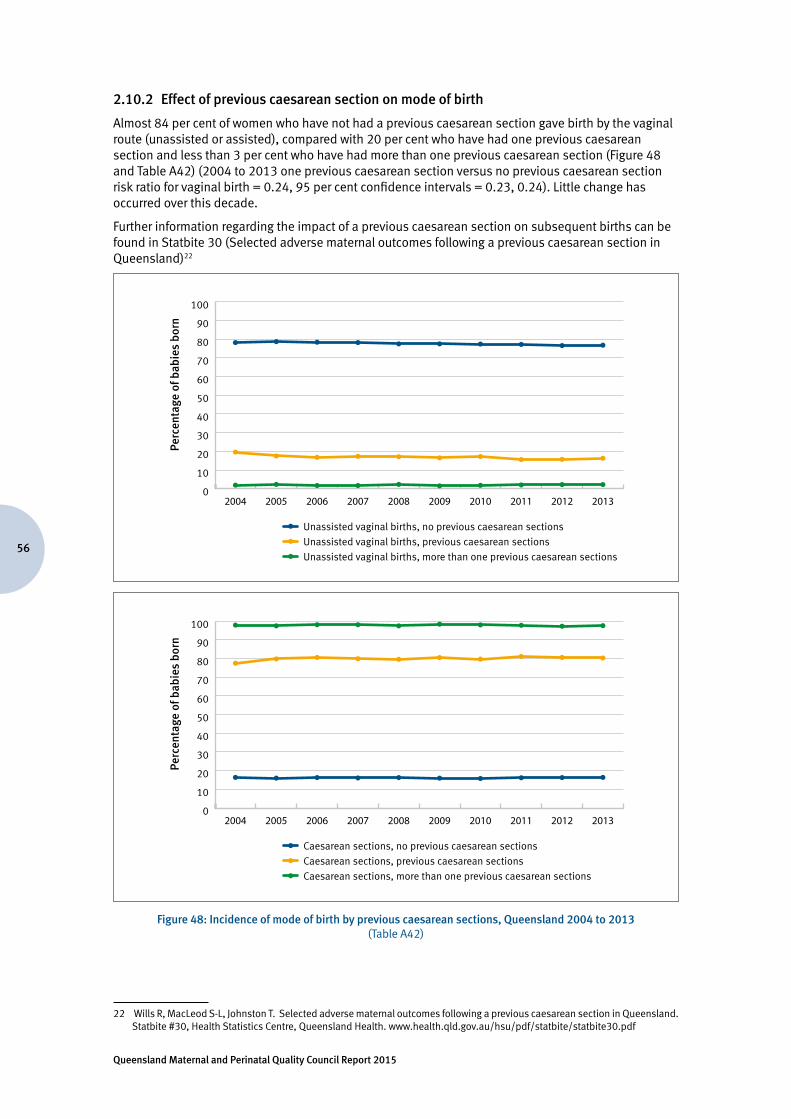
Queensland Maternal and Perinatal Quality Council Report 2015
56
2.10.2 Effect of previous caesarean section on mode of birth
Almost 84 per cent of women who have not had a previous caesarean section gave birth by the vaginal route (unassisted or assisted), compared with 20 per cent who have had one previous caesarean section and less than 3 per cent who have had more than one previous caesarean section (Figure 48 and Table A42) (2004 to 2013 one previous caesarean section versus no previous caesarean section risk ratio for vaginal birth = 0.24, 95 per cent confidence intervals = 0.23, 0.24). Little change has occurred over this decade.
Further information regarding the impact of a previous caesarean section on subsequent births can be found in Statbite 30 (Selected adverse maternal outcomes following a previous caesarean section in Queensland)22
Perc
enta
ge o
f bab
ies
born
Unassisted vaginal births, more than one previous caesarean sections
0
10
20
30
40
50
60
70
80
90
100
2013201220112010200920082007200620052004
Unassisted vaginal births, previous caesarean sections
Unassisted vaginal births, no previous caesarean sections
Perc
enta
ge o
f bab
ies
born
Caesarean sections, more than one previous caesarean sections
0
10
20
30
40
50
60
70
80
90
100
2013201220112010200920082007200620052004
Caesarean sections, previous caesarean sections
Caesarean sections, no previous caesarean sections
Figure 48: Incidence of mode of birth by previous caesarean sections, Queensland 2004 to 2013(Table A42)
22 Wills R, MacLeod S-L, Johnston T. Selected adverse maternal outcomes following a previous caesarean section in Queensland. Statbite #30, Health Statistics Centre, Queensland Health. www.health.qld.gov.au/hsu/pdf/statbite/statbite30.pdf
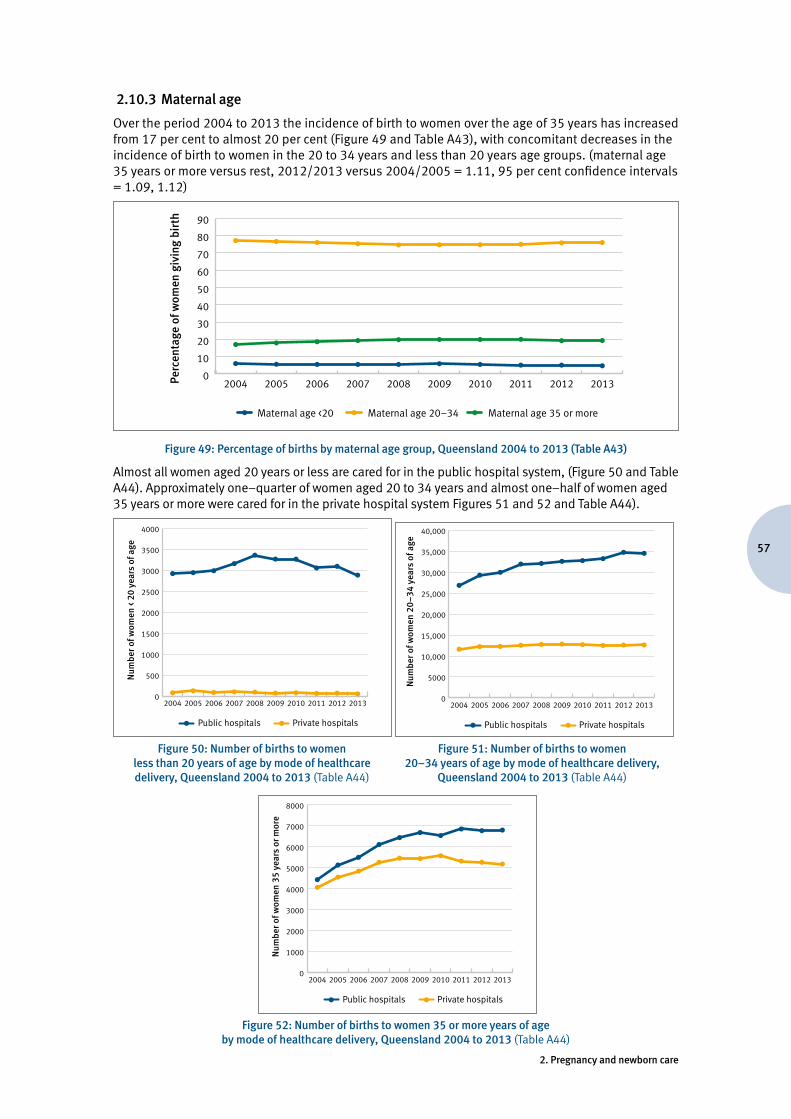
57
2. Pregnancy and newborn care
2.10.3 Maternal age
Over the period 2004 to 2013 the incidence of birth to women over the age of 35 years has increased from 17 per cent to almost 20 per cent (Figure 49 and Table A43), with concomitant decreases in the incidence of birth to women in the 20 to 34 years and less than 20 years age groups. (maternal age 35 years or more versus rest, 2012/2013 versus 2004/2005 = 1.11, 95 per cent confidence intervals = 1.09, 1.12)
Perc
enta
ge o
f wom
en g
ivin
g bi
rth
Maternal age <20 Maternal age 20–34 Maternal age 35 or more
0
10
20
30
40
50
60
70
80
90
2013201220112010200920082007200620052004
Figure 49: Percentage of births by maternal age group, Queensland 2004 to 2013 (Table A43)
Almost all women aged 20 years or less are cared for in the public hospital system, (Figure 50 and Table A44). Approximately one–quarter of women aged 20 to 34 years and almost one–half of women aged 35 years or more were cared for in the private hospital system Figures 51 and 52 and Table A44).
Num
ber o
f wom
en <
20
year
s of
age
Public hospitals Private hospitals
0
500
1000
1500
2000
2500
3000
3500
4000
2013201220112010200920082007200620052004
Num
ber o
f wom
en 2
0–34
yea
rs o
f age
Public hospitals Private hospitals
0
5000
10,000
15,000
20,000
25,000
30,000
35,000
40,000
2013201220112010200920082007200620052004
Figure 50: Number of births to women
less than 20 years of age by mode of healthcare delivery, Queensland 2004 to 2013 (Table A44)
Figure 51: Number of births to women 20–34 years of age by mode of healthcare delivery,
Queensland 2004 to 2013 (Table A44)
Num
ber o
f wom
en 3
5 ye
ars
or m
ore
Public hospitals Private hospitals
0
1000
2000
3000
4000
5000
6000
7000
8000
2013201220112010200920082007200620052004
Figure 52: Number of births to women 35 or more years of age
by mode of healthcare delivery, Queensland 2004 to 2013 (Table A44)
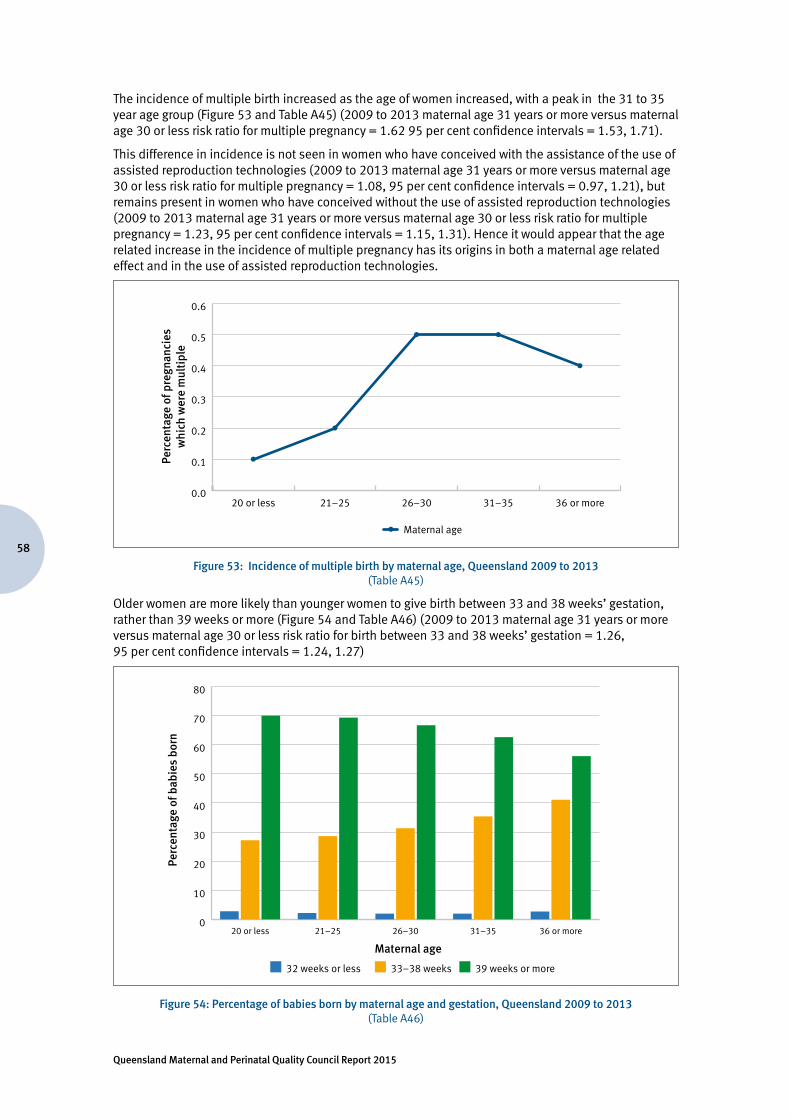
Queensland Maternal and Perinatal Quality Council Report 2015
58
The incidence of multiple birth increased as the age of women increased, with a peak in the 31 to 35 year age group (Figure 53 and Table A45) (2009 to 2013 maternal age 31 years or more versus maternal age 30 or less risk ratio for multiple pregnancy = 1.62 95 per cent confidence intervals = 1.53, 1.71).
This difference in incidence is not seen in women who have conceived with the assistance of the use of assisted reproduction technologies (2009 to 2013 maternal age 31 years or more versus maternal age 30 or less risk ratio for multiple pregnancy = 1.08, 95 per cent confidence intervals = 0.97, 1.21), but remains present in women who have conceived without the use of assisted reproduction technologies (2009 to 2013 maternal age 31 years or more versus maternal age 30 or less risk ratio for multiple pregnancy = 1.23, 95 per cent confidence intervals = 1.15, 1.31). Hence it would appear that the age related increase in the incidence of multiple pregnancy has its origins in both a maternal age related effect and in the use of assisted reproduction technologies.
Perc
enta
ge o
f pre
gnan
cies
whi
ch w
ere
mul
tipl
e
Maternal age
0.0
0.1
0.2
0.3
0.4
0.5
0.6
36 or more31–3526–3021–2520 or less
Figure 53: Incidence of multiple birth by maternal age, Queensland 2009 to 2013 (Table A45)
Older women are more likely than younger women to give birth between 33 and 38 weeks’ gestation, rather than 39 weeks or more (Figure 54 and Table A46) (2009 to 2013 maternal age 31 years or more versus maternal age 30 or less risk ratio for birth between 33 and 38 weeks’ gestation = 1.26, 95 per cent confidence intervals = 1.24, 1.27)
Perc
enta
ge o
f bab
ies
born
Maternal age
32 weeks or less 33–38 weeks 39 weeks or more
0
10
20
30
40
50
60
70
80
36 or more31–3526–3021–2520 or less
Figure 54: Percentage of babies born by maternal age and gestation, Queensland 2009 to 2013 (Table A46)

59
2. Pregnancy and newborn care
Live-born babies of women 36 or more years of age and women 20 or less years of age are most likely to need newborn care in a neonatal intensive care unit (NICU) and/or a special care nursery (SCN) (Figure 55 and Table A47) (2009 to 2013 maternal age 36 years or more versus maternal age 21–35 years risk ratio for NICU and/or SCN care = 1.19, 95 per cent confidence intervals = 1.17, 1.21; 2009 to 2013 maternal age 20 years or less versus maternal age 21–35 years risk ratio for NICU and/or SCN care = 1.16, 95 per cent confidence intervals = 1.12 1.19).
Perc
enta
ge o
f liv
ebor
n ba
bies
ad
mit
ted
to N
ICU
and
/or S
CN
Maternal age
15
16
17
18
19
20
36 or more31–3526–3021–2520 or less
Figure 55: Percentage of live-born babies requiring admission to neonatal intensive care or special care units by maternal age, Queensland 2009 to 2013
(Table A47)
Further information regarding the impact of older maternal age can be found in Statbites 53 (Characteristics of older mothers in pregnancy)23 and 56 (Morbidity and mortality associated with older maternal age at birth)24
2.10.4 Maternal obesity
Overweight and obesity are defined by body mass index (BMI; kg/m2). Those with a BMI of 25.0–29.9 kg/m2 are classified as overweight, while those with a BMI ≥ 30.0 kg/m2 are classified as obese. A woman with a BMI of <18.5 kg/m2 is classified as underweight.
One in five women pregnant in 2009 to 2013 (19.4 per cent) were obese, and a further 23.7 per cent were overweight. Women in the overweight and obese categories were more likely to be cared for in the public hospital system (32.3 per cent) than in the private hospital system (10.7 per cent) or homebirth (0.04 per cent). Women over the age of 20 years were more likely to be obese when compared with women less than 20 years of age (Figure 56 and Table A48).
Perc
enta
ge o
f wom
en g
ivin
g bi
rth
Maternal age <20 Maternal age 20–34 Maternal age 35 or more
0
10
20
30
40
50
60
30 or more25–29.9 18.5–24.9<18.5
Maternal BMI
Figure 56: BMI versus maternal age, Queensland 2009 to 2013 (Table A48)
23 Wills R and Johnston T. Characteristics of older mothers in pregnancy. Statbite #53, Health Statistics Centre, Queensland Health. www.health.qld.gov.au/hsu/pdf/statbite/statbite53.pdf
24 Wills R and Johnston T. Morbidity and mortality associated with older maternal age at birth. Statbite #56, Health Statistics Centre, Queensland Health. www.health.qld.gov.au/hsu/pdf/statbite/statbite56.pdf
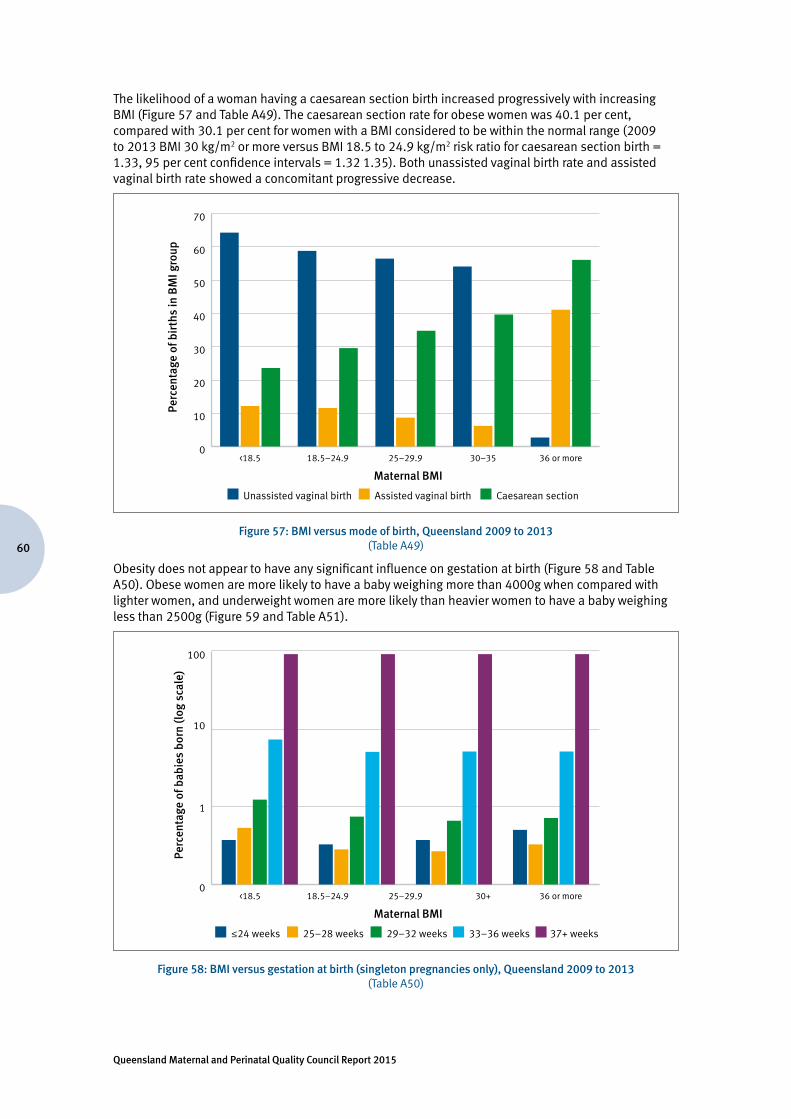
Queensland Maternal and Perinatal Quality Council Report 2015
60
The likelihood of a woman having a caesarean section birth increased progressively with increasing BMI (Figure 57 and Table A49). The caesarean section rate for obese women was 40.1 per cent, compared with 30.1 per cent for women with a BMI considered to be within the normal range (2009 to 2013 BMI 30 kg/m2 or more versus BMI 18.5 to 24.9 kg/m2 risk ratio for caesarean section birth = 1.33, 95 per cent confidence intervals = 1.32 1.35). Both unassisted vaginal birth rate and assisted vaginal birth rate showed a concomitant progressive decrease.
Perc
enta
ge o
f bir
ths
in B
MI g
roup
Maternal BMI
Unassisted vaginal birth Assisted vaginal birth Caesarean section
0
10
20
30
40
50
60
70
36 or more30–3525–29.918.5–24.9<18.5
Figure 57: BMI versus mode of birth, Queensland 2009 to 2013 (Table A49)
Obesity does not appear to have any significant influence on gestation at birth (Figure 58 and Table A50). Obese women are more likely to have a baby weighing more than 4000g when compared with lighter women, and underweight women are more likely than heavier women to have a baby weighing less than 2500g (Figure 59 and Table A51).
Perc
enta
ge o
f bab
ies
born
(log
sca
le)
Maternal BMI
≤24 weeks 25–28 weeks 29–32 weeks 33–36 weeks 37+ weeks
0
1
10
100
36 or more30+25–29.918.5–24.9<18.5
Figure 58: BMI versus gestation at birth (singleton pregnancies only), Queensland 2009 to 2013 (Table A50)
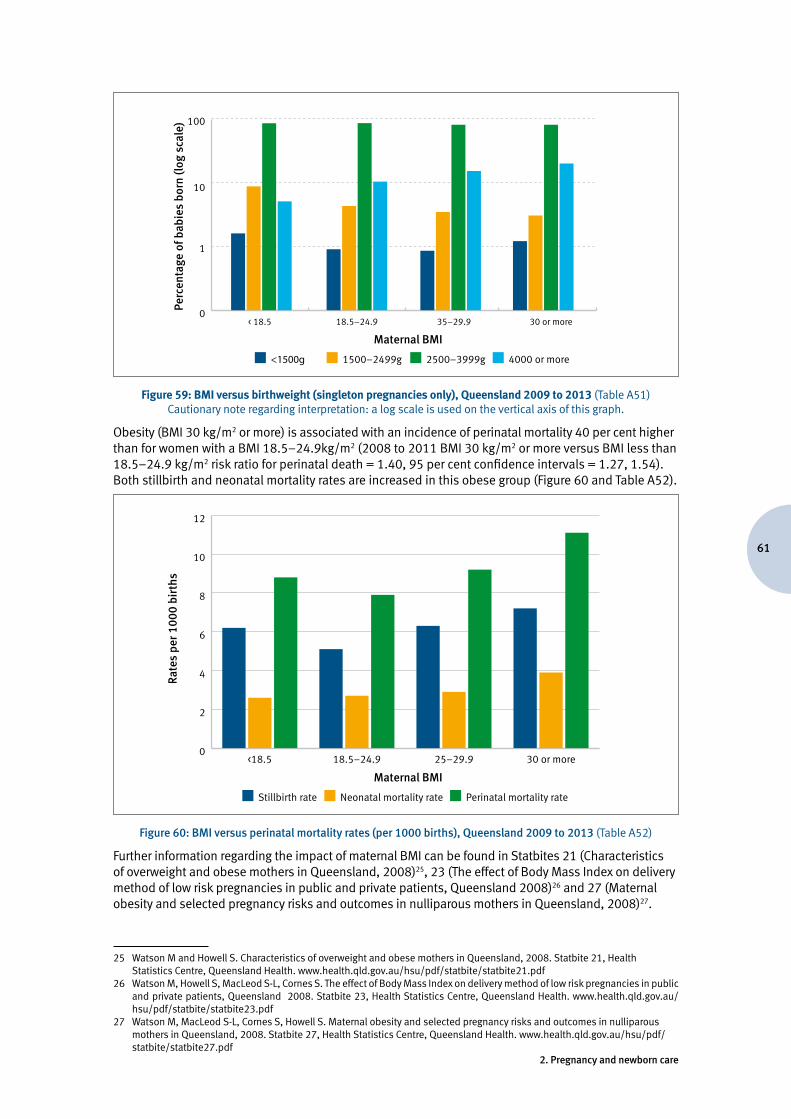
61
2. Pregnancy and newborn care
Perc
enta
ge o
f bab
ies
born
(log
sca
le)
Maternal BMI
<1500g 1500–2499g 2500–3999g 4000 or more
0
1
10
100
30 or more35–29.918.5–24.9< 18.5
Figure 59: BMI versus birthweight (singleton pregnancies only), Queensland 2009 to 2013 (Table A51) Cautionary note regarding interpretation: a log scale is used on the vertical axis of this graph.
Obesity (BMI 30 kg/m2 or more) is associated with an incidence of perinatal mortality 40 per cent higher than for women with a BMI 18.5–24.9kg/m2 (2008 to 2011 BMI 30 kg/m2 or more versus BMI less than 18.5–24.9 kg/m2 risk ratio for perinatal death = 1.40, 95 per cent confidence intervals = 1.27, 1.54). Both stillbirth and neonatal mortality rates are increased in this obese group (Figure 60 and Table A52).
Rate
s pe
r 100
0 bi
rths
Maternal BMI
Stillbirth rate Neonatal mortality rate Perinatal mortality rate
0
2
4
6
8
10
12
30 or more25–29.918.5–24.9<18.5
Figure 60: BMI versus perinatal mortality rates (per 1000 births), Queensland 2009 to 2013 (Table A52)
Further information regarding the impact of maternal BMI can be found in Statbites 21 (Characteristics of overweight and obese mothers in Queensland, 2008)25, 23 (The effect of Body Mass Index on delivery method of low risk pregnancies in public and private patients, Queensland 2008)26 and 27 (Maternal obesity and selected pregnancy risks and outcomes in nulliparous mothers in Queensland, 2008)27.
25 Watson M and Howell S. Characteristics of overweight and obese mothers in Queensland, 2008. Statbite 21, Health Statistics Centre, Queensland Health. www.health.qld.gov.au/hsu/pdf/statbite/statbite21.pdf
26 Watson M, Howell S, MacLeod S-L, Cornes S. The effect of Body Mass Index on delivery method of low risk pregnancies in public and private patients, Queensland 2008. Statbite 23, Health Statistics Centre, Queensland Health. www.health.qld.gov.au/hsu/pdf/statbite/statbite23.pdf
27 Watson M, MacLeod S-L, Cornes S, Howell S. Maternal obesity and selected pregnancy risks and outcomes in nulliparous mothers in Queensland, 2008. Statbite 27, Health Statistics Centre, Queensland Health. www.health.qld.gov.au/hsu/pdf/statbite/statbite27.pdf
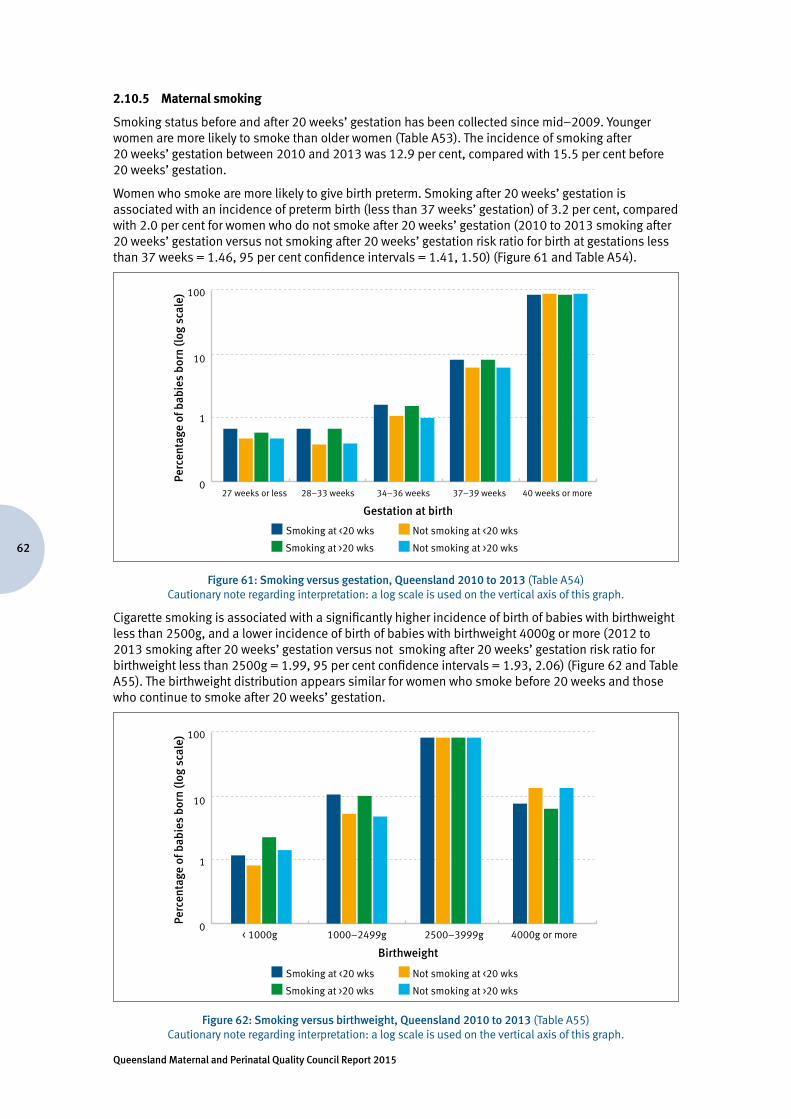
Queensland Maternal and Perinatal Quality Council Report 2015
62
2.10.5 Maternal smoking
Smoking status before and after 20 weeks’ gestation has been collected since mid–2009. Younger women are more likely to smoke than older women (Table A53). The incidence of smoking after 20 weeks’ gestation between 2010 and 2013 was 12.9 per cent, compared with 15.5 per cent before 20 weeks’ gestation.
Women who smoke are more likely to give birth preterm. Smoking after 20 weeks’ gestation is associated with an incidence of preterm birth (less than 37 weeks’ gestation) of 3.2 per cent, compared with 2.0 per cent for women who do not smoke after 20 weeks’ gestation (2010 to 2013 smoking after 20 weeks’ gestation versus not smoking after 20 weeks’ gestation risk ratio for birth at gestations less than 37 weeks = 1.46, 95 per cent confidence intervals = 1.41, 1.50) (Figure 61 and Table A54).
Perc
enta
ge o
f bab
ies
born
(log
sca
le)
Gestation at birth
Smoking at <20 wks
Smoking at >20 wks
Not smoking at <20 wks
Not smoking at >20 wks
0
1
10
100
37–39 weeks 40 weeks or more34–36 weeks28–33 weeks27 weeks or less
Figure 61: Smoking versus gestation, Queensland 2010 to 2013 (Table A54) Cautionary note regarding interpretation: a log scale is used on the vertical axis of this graph.
Cigarette smoking is associated with a significantly higher incidence of birth of babies with birthweight less than 2500g, and a lower incidence of birth of babies with birthweight 4000g or more (2012 to 2013 smoking after 20 weeks’ gestation versus not smoking after 20 weeks’ gestation risk ratio for birthweight less than 2500g = 1.99, 95 per cent confidence intervals = 1.93, 2.06) (Figure 62 and Table A55). The birthweight distribution appears similar for women who smoke before 20 weeks and those who continue to smoke after 20 weeks’ gestation.
Perc
enta
ge o
f bab
ies
born
(log
sca
le)
Birthweight
0
1
10
100
4000g or more2500–3999g1000–2499g< 1000g
Smoking at <20 wks
Smoking at >20 wks
Not smoking at <20 wks
Not smoking at >20 wks
Figure 62: Smoking versus birthweight, Queensland 2010 to 2013 (Table A55) Cautionary note regarding interpretation: a log scale is used on the vertical axis of this graph.
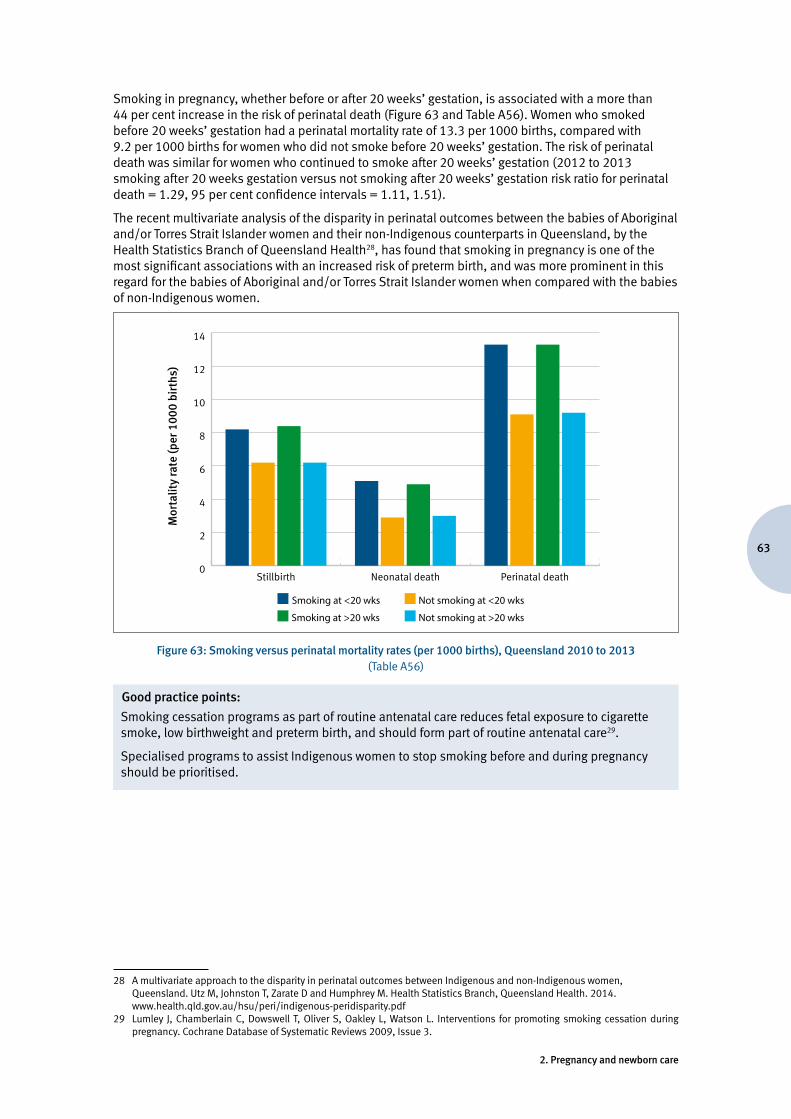
63
2. Pregnancy and newborn care
Smoking in pregnancy, whether before or after 20 weeks’ gestation, is associated with a more than 44 per cent increase in the risk of perinatal death (Figure 63 and Table A56). Women who smoked before 20 weeks’ gestation had a perinatal mortality rate of 13.3 per 1000 births, compared with 9.2 per 1000 births for women who did not smoke before 20 weeks’ gestation. The risk of perinatal death was similar for women who continued to smoke after 20 weeks’ gestation (2012 to 2013 smoking after 20 weeks gestation versus not smoking after 20 weeks’ gestation risk ratio for perinatal death = 1.29, 95 per cent confidence intervals = 1.11, 1.51).
The recent multivariate analysis of the disparity in perinatal outcomes between the babies of Aboriginal and/or Torres Strait Islander women and their non-Indigenous counterparts in Queensland, by the Health Statistics Branch of Queensland Health28, has found that smoking in pregnancy is one of the most significant associations with an increased risk of preterm birth, and was more prominent in this regard for the babies of Aboriginal and/or Torres Strait Islander women when compared with the babies of non-Indigenous women.
Mor
talit
y ra
te (p
er 1
000
birt
hs)
0
2
4
6
8
10
12
14
Perinatal deathNeonatal deathStillbirth
Smoking at <20 wks
Smoking at >20 wks
Not smoking at <20 wks
Not smoking at >20 wks
Figure 63: Smoking versus perinatal mortality rates (per 1000 births), Queensland 2010 to 2013 (Table A56)
Good practice points:
Smoking cessation programs as part of routine antenatal care reduces fetal exposure to cigarette smoke, low birthweight and preterm birth, and should form part of routine antenatal care29.
Specialised programs to assist Indigenous women to stop smoking before and during pregnancy should be prioritised.
28 A multivariate approach to the disparity in perinatal outcomes between Indigenous and non-Indigenous women, Queensland. Utz M, Johnston T, Zarate D and Humphrey M. Health Statistics Branch, Queensland Health. 2014. www.health.qld.gov.au/hsu/peri/indigenous-peridisparity.pdf
29 Lumley J, Chamberlain C, Dowswell T, Oliver S, Oakley L, Watson L. Interventions for promoting smoking cessation during pregnancy. Cochrane Database of Systematic Reviews 2009, Issue 3.
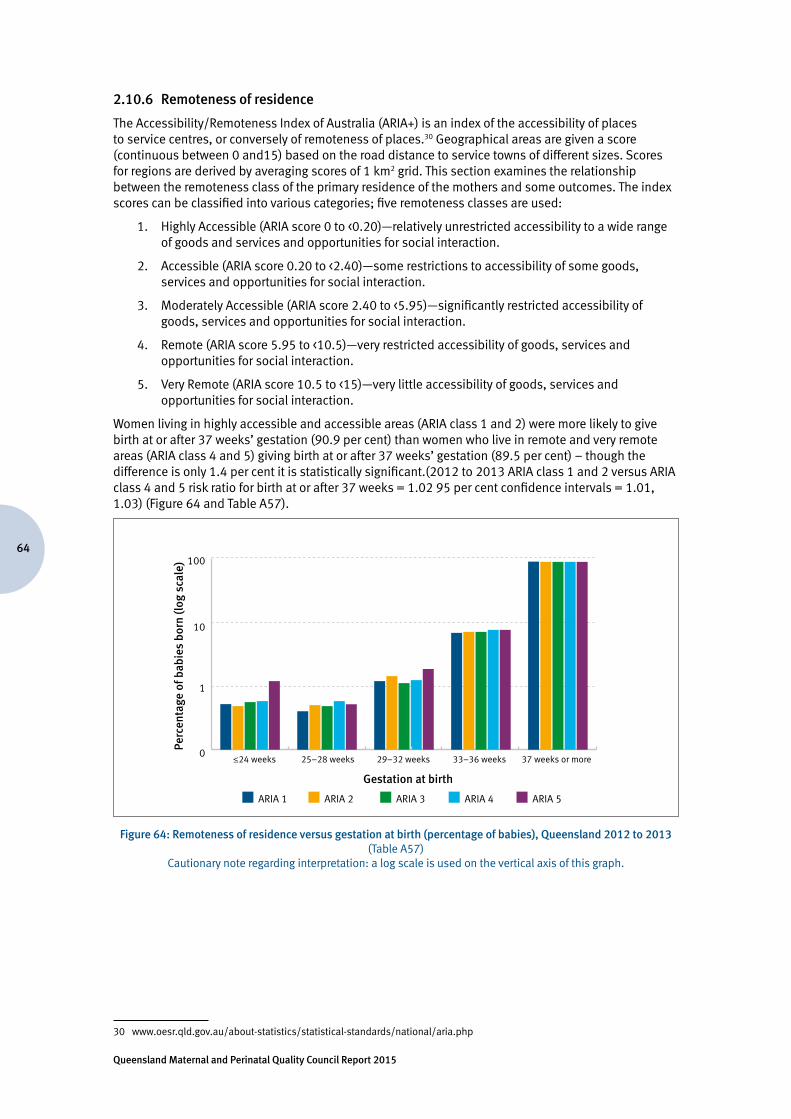
Queensland Maternal and Perinatal Quality Council Report 2015
64
2.10.6 Remoteness of residence
The Accessibility/Remoteness Index of Australia (ARIA+) is an index of the accessibility of places to service centres, or conversely of remoteness of places.30 Geographical areas are given a score (continuous between 0 and15) based on the road distance to service towns of different sizes. Scores for regions are derived by averaging scores of 1 km2 grid. This section examines the relationship between the remoteness class of the primary residence of the mothers and some outcomes. The index scores can be classified into various categories; five remoteness classes are used:
1. Highly Accessible (ARIA score 0 to <0.20)—relatively unrestricted accessibility to a wide range of goods and services and opportunities for social interaction.
2. Accessible (ARIA score 0.20 to <2.40)—some restrictions to accessibility of some goods, services and opportunities for social interaction.
3. Moderately Accessible (ARIA score 2.40 to <5.95)—significantly restricted accessibility of goods, services and opportunities for social interaction.
4. Remote (ARIA score 5.95 to <10.5)—very restricted accessibility of goods, services and opportunities for social interaction.
5. Very Remote (ARIA score 10.5 to <15)—very little accessibility of goods, services and opportunities for social interaction.
Women living in highly accessible and accessible areas (ARIA class 1 and 2) were more likely to give birth at or after 37 weeks’ gestation (90.9 per cent) than women who live in remote and very remote areas (ARIA class 4 and 5) giving birth at or after 37 weeks’ gestation (89.5 per cent) – though the difference is only 1.4 per cent it is statistically significant.(2012 to 2013 ARIA class 1 and 2 versus ARIA class 4 and 5 risk ratio for birth at or after 37 weeks = 1.02 95 per cent confidence intervals = 1.01, 1.03) (Figure 64 and Table A57).
Perc
enta
ge o
f bab
ies
born
(log
sca
le)
Gestation at birth
0
1
10
100
ARIA 1 ARIA 2 ARIA 3 ARIA 4 ARIA 5
33–36 weeks 37 weeks or more29–32 weeks25–28 weeks≤24 weeks
Figure 64: Remoteness of residence versus gestation at birth (percentage of babies), Queensland 2012 to 2013(Table A57)
Cautionary note regarding interpretation: a log scale is used on the vertical axis of this graph.
30 www.oesr.qld.gov.au/about-statistics/statistical-standards/national/aria.php
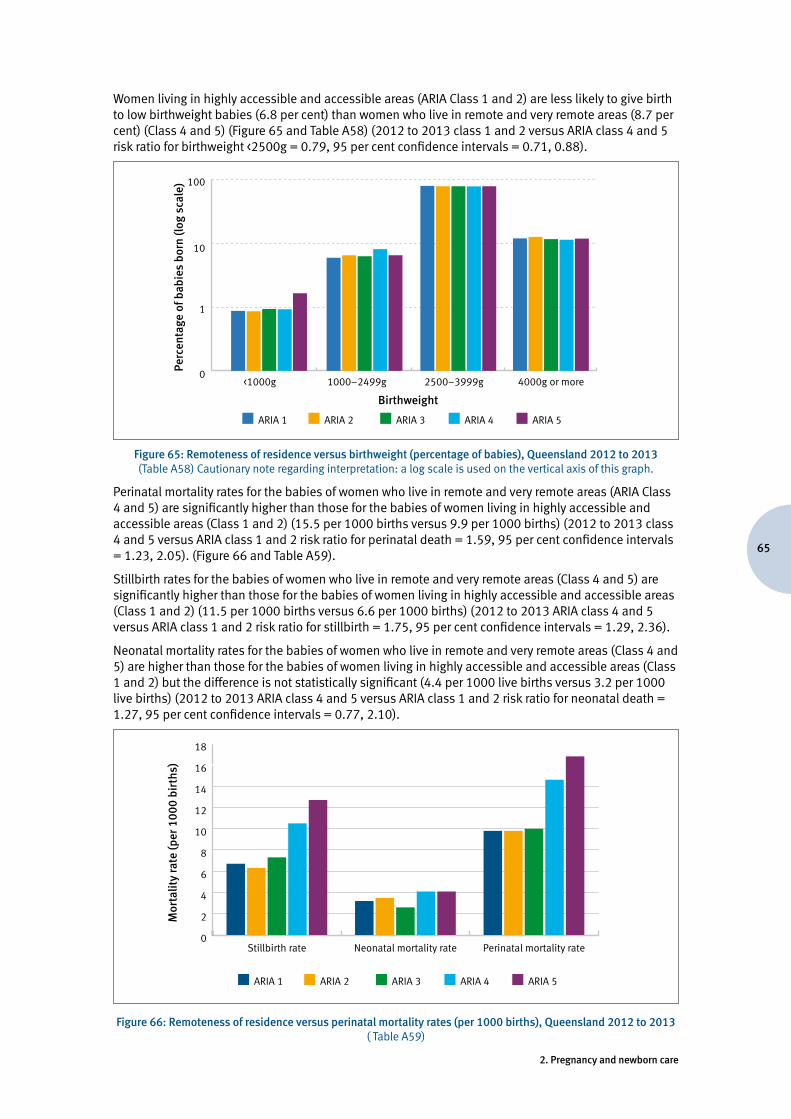
65
2. Pregnancy and newborn care
Women living in highly accessible and accessible areas (ARIA Class 1 and 2) are less likely to give birth to low birthweight babies (6.8 per cent) than women who live in remote and very remote areas (8.7 per cent) (Class 4 and 5) (Figure 65 and Table A58) (2012 to 2013 class 1 and 2 versus ARIA class 4 and 5 risk ratio for birthweight <2500g = 0.79, 95 per cent confidence intervals = 0.71, 0.88).
Perc
enta
ge o
f bab
ies
born
(log
sca
le)
Birthweight
0
1
10
100
ARIA 1 ARIA 2 ARIA 3 ARIA 4 ARIA 5
4000g or more2500–3999g1000–2499g<1000g
Figure 65: Remoteness of residence versus birthweight (percentage of babies), Queensland 2012 to 2013 (Table A58) Cautionary note regarding interpretation: a log scale is used on the vertical axis of this graph.
Perinatal mortality rates for the babies of women who live in remote and very remote areas (ARIA Class 4 and 5) are significantly higher than those for the babies of women living in highly accessible and accessible areas (Class 1 and 2) (15.5 per 1000 births versus 9.9 per 1000 births) (2012 to 2013 class 4 and 5 versus ARIA class 1 and 2 risk ratio for perinatal death = 1.59, 95 per cent confidence intervals = 1.23, 2.05). (Figure 66 and Table A59).
Stillbirth rates for the babies of women who live in remote and very remote areas (Class 4 and 5) are significantly higher than those for the babies of women living in highly accessible and accessible areas (Class 1 and 2) (11.5 per 1000 births versus 6.6 per 1000 births) (2012 to 2013 ARIA class 4 and 5 versus ARIA class 1 and 2 risk ratio for stillbirth = 1.75, 95 per cent confidence intervals = 1.29, 2.36).
Neonatal mortality rates for the babies of women who live in remote and very remote areas (Class 4 and 5) are higher than those for the babies of women living in highly accessible and accessible areas (Class 1 and 2) but the difference is not statistically significant (4.4 per 1000 live births versus 3.2 per 1000 live births) (2012 to 2013 ARIA class 4 and 5 versus ARIA class 1 and 2 risk ratio for neonatal death = 1.27, 95 per cent confidence intervals = 0.77, 2.10).
Mor
talit
y ra
te (p
er 1
000
birt
hs)
ARIA 1 ARIA 2 ARIA 3 ARIA 4 ARIA 5
0
2
4
6
8
10
12
14
16
18
Perinatal mortality rateNeonatal mortality rateStillbirth rate
Figure 66: Remoteness of residence versus perinatal mortality rates (per 1000 births), Queensland 2012 to 2013( Table A59)
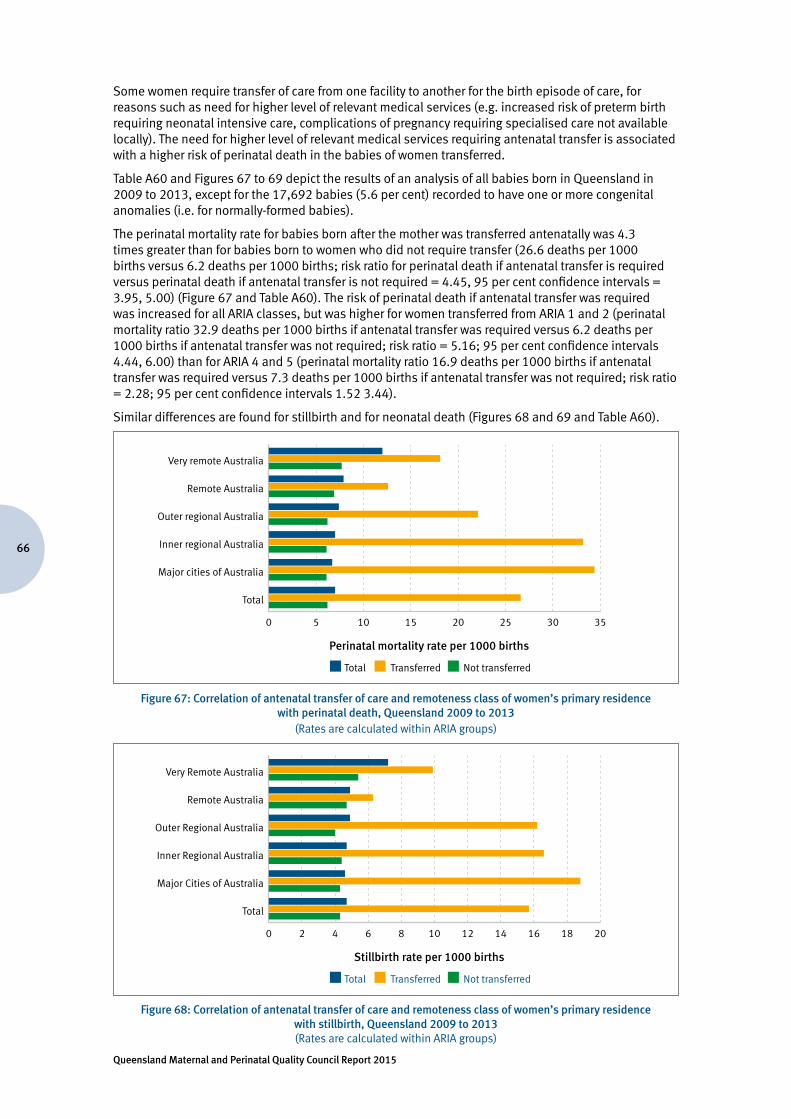
Queensland Maternal and Perinatal Quality Council Report 2015
66
Some women require transfer of care from one facility to another for the birth episode of care, for reasons such as need for higher level of relevant medical services (e.g. increased risk of preterm birth requiring neonatal intensive care, complications of pregnancy requiring specialised care not available locally). The need for higher level of relevant medical services requiring antenatal transfer is associated with a higher risk of perinatal death in the babies of women transferred.
Table A60 and Figures 67 to 69 depict the results of an analysis of all babies born in Queensland in 2009 to 2013, except for the 17,692 babies (5.6 per cent) recorded to have one or more congenital anomalies (i.e. for normally-formed babies).
The perinatal mortality rate for babies born after the mother was transferred antenatally was 4.3 times greater than for babies born to women who did not require transfer (26.6 deaths per 1000 births versus 6.2 deaths per 1000 births; risk ratio for perinatal death if antenatal transfer is required versus perinatal death if antenatal transfer is not required = 4.45, 95 per cent confidence intervals = 3.95, 5.00) (Figure 67 and Table A60). The risk of perinatal death if antenatal transfer was required was increased for all ARIA classes, but was higher for women transferred from ARIA 1 and 2 (perinatal mortality ratio 32.9 deaths per 1000 births if antenatal transfer was required versus 6.2 deaths per 1000 births if antenatal transfer was not required; risk ratio = 5.16; 95 per cent confidence intervals 4.44, 6.00) than for ARIA 4 and 5 (perinatal mortality ratio 16.9 deaths per 1000 births if antenatal transfer was required versus 7.3 deaths per 1000 births if antenatal transfer was not required; risk ratio = 2.28; 95 per cent confidence intervals 1.52 3.44).
Similar differences are found for stillbirth and for neonatal death (Figures 68 and 69 and Table A60).
Perinatal mortality rate per 1000 births
Not transferredTransferredTotal
0 5 10 15 20 25 30 35
Total
Major cities of Australia
Inner regional Australia
Outer regional Australia
Remote Australia
Very remote Australia
Figure 67: Correlation of antenatal transfer of care and remoteness class of women’s primary residence with perinatal death, Queensland 2009 to 2013
(Rates are calculated within ARIA groups)
Stillbirth rate per 1000 births
0 2 4 6 8 10 12 14 16 18 20
Total
Major Cities of Australia
Inner Regional Australia
Outer Regional Australia
Remote Australia
Very Remote Australia
Not transferredTransferredTotal
Figure 68: Correlation of antenatal transfer of care and remoteness class of women’s primary residence with stillbirth, Queensland 2009 to 2013(Rates are calculated within ARIA groups)
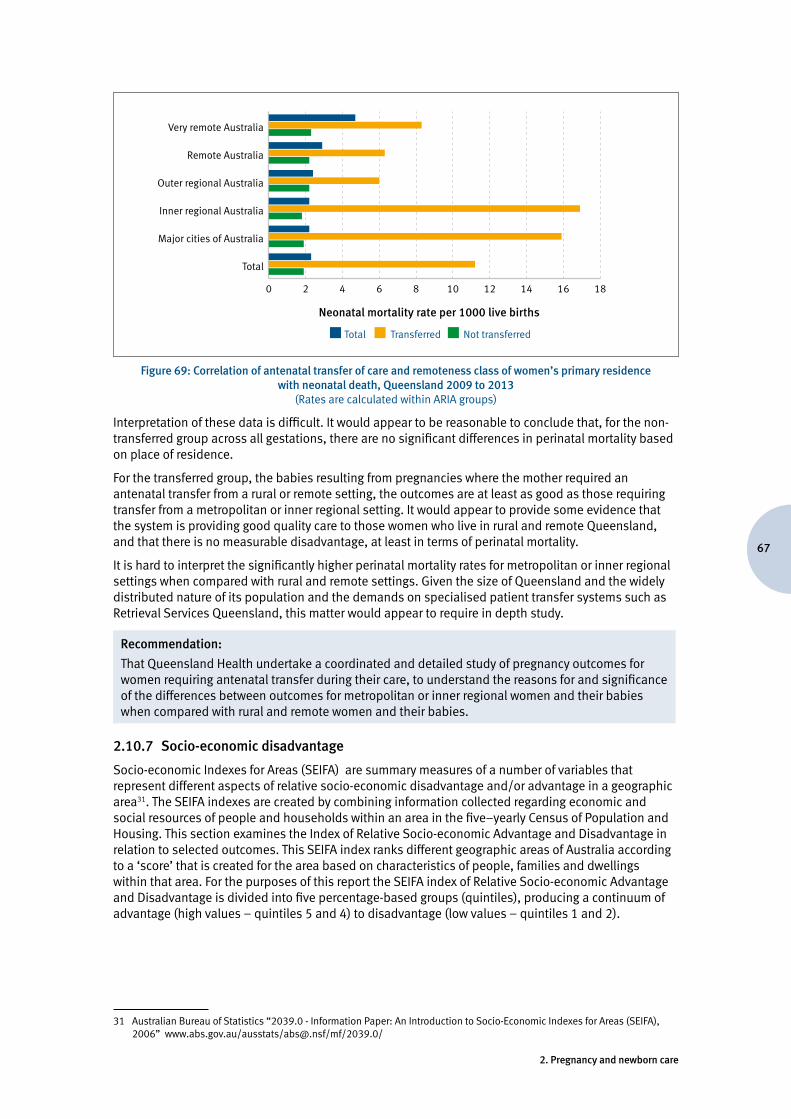
67
2. Pregnancy and newborn care
Neonatal mortality rate per 1000 live births
0 2 4 6 8 10 12 14 16 18
Total
Major cities of Australia
Inner regional Australia
Outer regional Australia
Remote Australia
Very remote Australia
Not transferredTransferredTotal
Figure 69: Correlation of antenatal transfer of care and remoteness class of women’s primary residence with neonatal death, Queensland 2009 to 2013
(Rates are calculated within ARIA groups)
Interpretation of these data is difficult. It would appear to be reasonable to conclude that, for the non-transferred group across all gestations, there are no significant differences in perinatal mortality based on place of residence.
For the transferred group, the babies resulting from pregnancies where the mother required an antenatal transfer from a rural or remote setting, the outcomes are at least as good as those requiring transfer from a metropolitan or inner regional setting. It would appear to provide some evidence that the system is providing good quality care to those women who live in rural and remote Queensland, and that there is no measurable disadvantage, at least in terms of perinatal mortality.
It is hard to interpret the significantly higher perinatal mortality rates for metropolitan or inner regional settings when compared with rural and remote settings. Given the size of Queensland and the widely distributed nature of its population and the demands on specialised patient transfer systems such as Retrieval Services Queensland, this matter would appear to require in depth study.
Recommendation:
That Queensland Health undertake a coordinated and detailed study of pregnancy outcomes for women requiring antenatal transfer during their care, to understand the reasons for and significance of the differences between outcomes for metropolitan or inner regional women and their babies when compared with rural and remote women and their babies.
2.10.7 Socio-economic disadvantage
Socio-economic Indexes for Areas (SEIFA) are summary measures of a number of variables that represent different aspects of relative socio-economic disadvantage and/or advantage in a geographic area31. The SEIFA indexes are created by combining information collected regarding economic and social resources of people and households within an area in the five–yearly Census of Population and Housing. This section examines the Index of Relative Socio-economic Advantage and Disadvantage in relation to selected outcomes. This SEIFA index ranks different geographic areas of Australia according to a ‘score’ that is created for the area based on characteristics of people, families and dwellings within that area. For the purposes of this report the SEIFA index of Relative Socio-economic Advantage and Disadvantage is divided into five percentage-based groups (quintiles), producing a continuum of advantage (high values – quintiles 5 and 4) to disadvantage (low values – quintiles 1 and 2).
31 Australian Bureau of Statistics “2039.0 - Information Paper: An Introduction to Socio-Economic Indexes for Areas (SEIFA), 2006” www.abs.gov.au/ausstats/[email protected]/mf/2039.0/
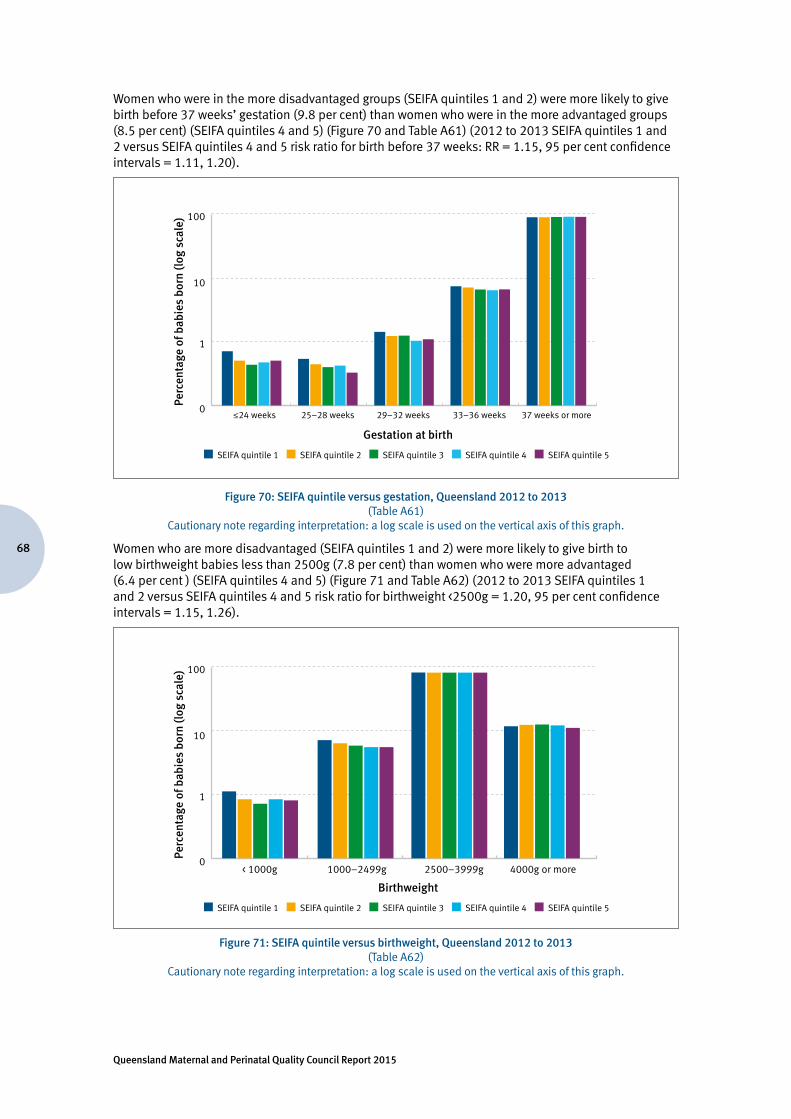
Queensland Maternal and Perinatal Quality Council Report 2015
68
Women who were in the more disadvantaged groups (SEIFA quintiles 1 and 2) were more likely to give birth before 37 weeks’ gestation (9.8 per cent) than women who were in the more advantaged groups (8.5 per cent) (SEIFA quintiles 4 and 5) (Figure 70 and Table A61) (2012 to 2013 SEIFA quintiles 1 and 2 versus SEIFA quintiles 4 and 5 risk ratio for birth before 37 weeks: RR = 1.15, 95 per cent confidence intervals = 1.11, 1.20).
Perc
enta
ge o
f bab
ies
born
(log
sca
le)
Gestation at birth
0
1
10
100
SEIFA quintile 1 SEIFA quintile 2 SEIFA quintile 3 SEIFA quintile 4 SEIFA quintile 5
33–36 weeks 37 weeks or more29–32 weeks25–28 weeks≤24 weeks
Figure 70: SEIFA quintile versus gestation, Queensland 2012 to 2013(Table A61)
Cautionary note regarding interpretation: a log scale is used on the vertical axis of this graph.
Women who are more disadvantaged (SEIFA quintiles 1 and 2) were more likely to give birth to low birthweight babies less than 2500g (7.8 per cent) than women who were more advantaged (6.4 per cent ) (SEIFA quintiles 4 and 5) (Figure 71 and Table A62) (2012 to 2013 SEIFA quintiles 1 and 2 versus SEIFA quintiles 4 and 5 risk ratio for birthweight <2500g = 1.20, 95 per cent confidence intervals = 1.15, 1.26).
Perc
enta
ge o
f bab
ies
born
(log
sca
le)
Birthweight
0
1
10
100
4000g or more2500–3999g1000–2499g< 1000g
SEIFA quintile 1 SEIFA quintile 2 SEIFA quintile 3 SEIFA quintile 4 SEIFA quintile 5
Figure 71: SEIFA quintile versus birthweight, Queensland 2012 to 2013 (Table A62)
Cautionary note regarding interpretation: a log scale is used on the vertical axis of this graph.
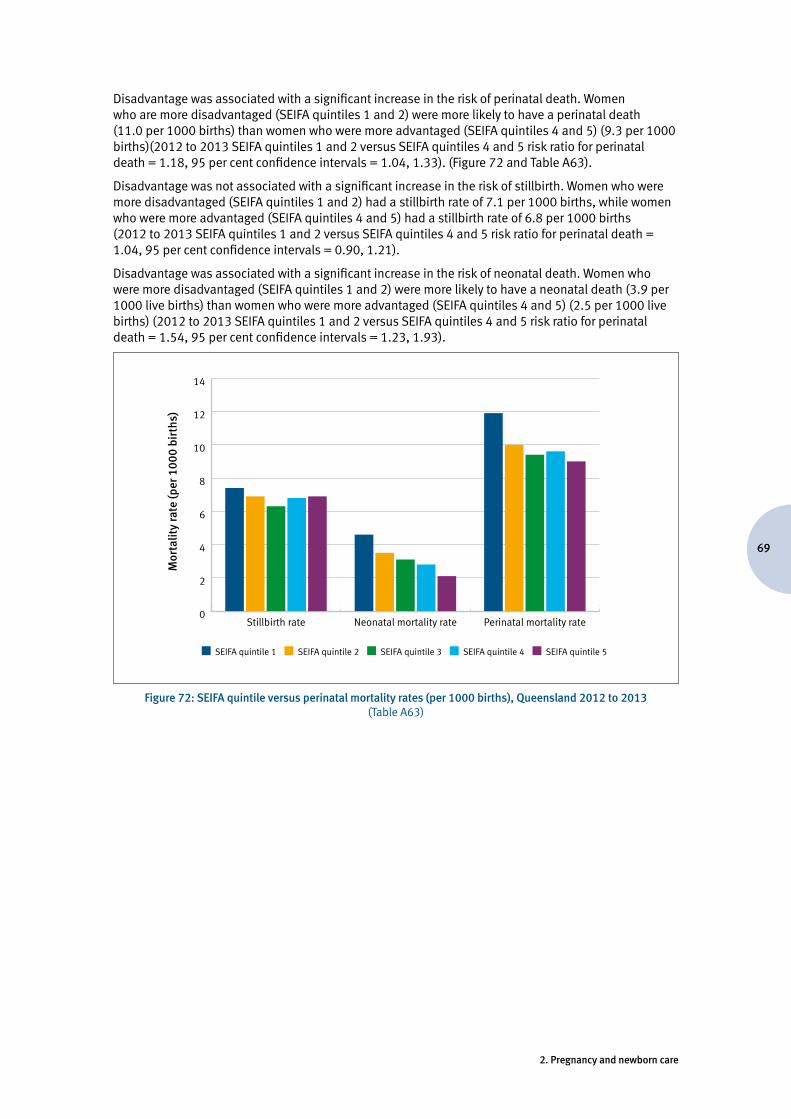
69
2. Pregnancy and newborn care
Disadvantage was associated with a significant increase in the risk of perinatal death. Women who are more disadvantaged (SEIFA quintiles 1 and 2) were more likely to have a perinatal death (11.0 per 1000 births) than women who were more advantaged (SEIFA quintiles 4 and 5) (9.3 per 1000 births)(2012 to 2013 SEIFA quintiles 1 and 2 versus SEIFA quintiles 4 and 5 risk ratio for perinatal death = 1.18, 95 per cent confidence intervals = 1.04, 1.33). (Figure 72 and Table A63).
Disadvantage was not associated with a significant increase in the risk of stillbirth. Women who were more disadvantaged (SEIFA quintiles 1 and 2) had a stillbirth rate of 7.1 per 1000 births, while women who were more advantaged (SEIFA quintiles 4 and 5) had a stillbirth rate of 6.8 per 1000 births (2012 to 2013 SEIFA quintiles 1 and 2 versus SEIFA quintiles 4 and 5 risk ratio for perinatal death = 1.04, 95 per cent confidence intervals = 0.90, 1.21).
Disadvantage was associated with a significant increase in the risk of neonatal death. Women who were more disadvantaged (SEIFA quintiles 1 and 2) were more likely to have a neonatal death (3.9 per 1000 live births) than women who were more advantaged (SEIFA quintiles 4 and 5) (2.5 per 1000 live births) (2012 to 2013 SEIFA quintiles 1 and 2 versus SEIFA quintiles 4 and 5 risk ratio for perinatal death = 1.54, 95 per cent confidence intervals = 1.23, 1.93).
Mor
talit
y ra
te (p
er 1
000
birt
hs)
0
2
4
6
8
10
12
14
Perinatal mortality rateNeonatal mortality rateStillbirth rate
SEIFA quintile 1 SEIFA quintile 2 SEIFA quintile 3 SEIFA quintile 4 SEIFA quintile 5
Figure 72: SEIFA quintile versus perinatal mortality rates (per 1000 births), Queensland 2012 to 2013(Table A63)
Queensland Maternal and Perinatal Quality Council Report 2015
70
3. Congenital anomalies
In the Queensland Perinatal Data Collection (PDC), data are collected regarding congenital anomalies only during the period of the pregnancy, birth and newborn period, up to the time of the discharge of the baby from its post-birth care period.
As the Perinatal Data Collection does not collect data regarding pregnancies ending before 20 weeks’ gestation some of these data are significantly under reported here (e.g. chromosome anomalies, neural tube defects). Further information regarding the impact of reporting issues at gestations less than 20 weeks can be found in Statbite 12 (New initiatives in the surveillance of congenital anomalies in Queensland 2007 to 2008)32 and Technical report 1 (Technical notes on QH_CONG_ANOM: Congenital anomalies in terminations of pregnancy at less than 20 weeks gestation)33.
The Congenital Anomalies Sub-Committee of QMPQC is aware that there are discrepancies between PDC data and Queensland Hospital Admitted Patient Data Collection (QHAPDC) data in relation to the incidence of congenital anomalies, and is working with Health Statistics Branch staff to resolve these issues.
It is clear to the Congenital Anomalies Sub-Committee that some anomalies are not recorded in data collections because their diagnosis has not been clearly recorded in the medical record.
Good practice point:
Clinicians making a diagnosis of a congenital anomaly should take particular care to record that anomaly in the medical record, including in the Discharge Summary.
The recorded congenital anomalies have been divided into anomaly groups as shown in table A64.
Congenital anomalies (one or more) were recorded in 7707 babies (60.7 per 1000 babies) born in Queensland in 2012 and 2013. As a number of such anomalies are relatively minor and there is variation in their reporting, the Congenital Anomalies Sub-Committee of QMPQC determined that there was most value in reviewing major anomaly groups (Table A64). Further information regarding these issues can be found in Technical report 13 (Data quality issues to be aware of when using the Queensland Perinatal Data Collection to estimate the prevalence of congenital anomalies at birth in Queensland)34 and Statistical analysis report 1 (Congenital Anomalies in Queensland: 1 July 2007 to 30 June 2010)35.
32 Howell S. New initiatives in the surveillance of congenital anomalies in Queensland 2007-2008. Statbite 12 Health Statistics Centre, Queensland Health. www.health.qld.gov.au/hsu/pdf/statbite/statbite12.pdf
33 Howell S. Technical notes on QH_CONG_ANOM: Congenital anomalies in terminations of pregnancy at less than 20 weeks gestation. Technical report 1, Health Statistics Centre, Queensland Health. www.health.qld.gov.au/hsu/tech_report/techreport_1.pdf
34 Endo T, Johnston T, Ellerington J. Data quality issues to be aware of when using the Queensland Perinatal Data Collection to estimate the prevalence of congenital anomalies at birth in Queensland. Technical report 13, Health Statistics Centre, Queensland Health. www.health.qld.gov.au/hsu/tech_report/techreport_13.pdf
35 Howell S, Endo T, MacLeod S-L, Cornes S. Congenital Anomalies in Queensland: 1 July 2007 to 30 June 2010. Statistical analysis report 1. www.health.qld.gov.au/hsu/tech_report/anasreport_1.pdf
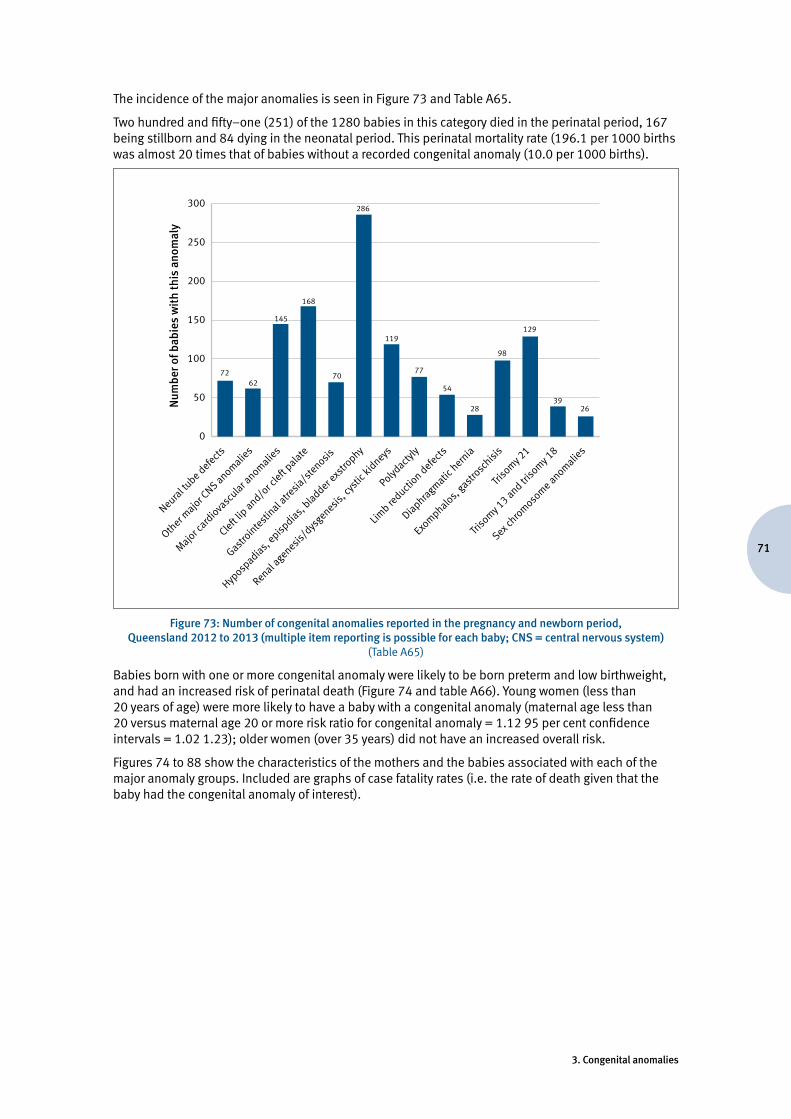
71
3. Congenital anomalies
The incidence of the major anomalies is seen in Figure 73 and Table A65.
Two hundred and fifty–one (251) of the 1280 babies in this category died in the perinatal period, 167 being stillborn and 84 dying in the neonatal period. This perinatal mortality rate (196.1 per 1000 births was almost 20 times that of babies without a recorded congenital anomaly (10.0 per 1000 births).
Num
ber o
f bab
ies
wit
h th
is a
nom
aly
0
50
100
150
200
250
300
Sex chro
moso
me anomalie
s
Triso
my 13 and tr
isomy 1
8
Triso
my 21
Exom
phalos, gastr
oschisi
s
Diaphragmatic
hernia
Limb re
duction defects
Polydacty
ly
Renal agenesis
/dys
genesis, c
ystic
kidneys
Hyposp
adias, episp
dias, bladder e
xstro
phy
Gastroin
testi
nal atre
sia/s
tenosis
Cleft lip
and/or c
left palate
Major card
iovasc
ular anomalie
s
Other m
ajor CNS anomalie
s
Neural tu
be defects
7262
7077
54
28 2639
145
168
119
286
129
98
Figure 73: Number of congenital anomalies reported in the pregnancy and newborn period, Queensland 2012 to 2013 (multiple item reporting is possible for each baby; CNS = central nervous system)
(Table A65)
Babies born with one or more congenital anomaly were likely to be born preterm and low birthweight, and had an increased risk of perinatal death (Figure 74 and table A66). Young women (less than 20 years of age) were more likely to have a baby with a congenital anomaly (maternal age less than 20 versus maternal age 20 or more risk ratio for congenital anomaly = 1.12 95 per cent confidence intervals = 1.02 1.23); older women (over 35 years) did not have an increased overall risk.
Figures 74 to 88 show the characteristics of the mothers and the babies associated with each of the major anomaly groups. Included are graphs of case fatality rates (i.e. the rate of death given that the baby had the congenital anomaly of interest).
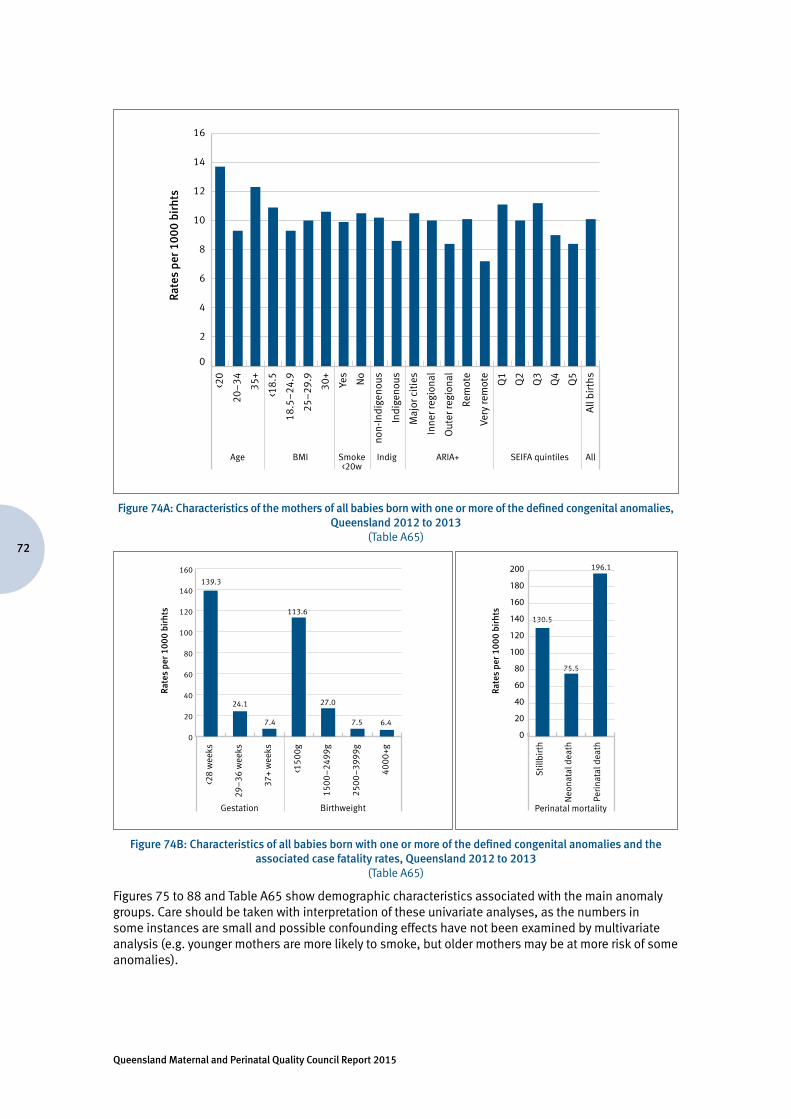
Queensland Maternal and Perinatal Quality Council Report 2015
72
Rate
s pe
r 100
0 bi
rhts
0
2
4
6
8
10
12
14
16
All
birt
hsQ5
Q4
Q3
Q2
Q1
Very
rem
ote
Rem
ote
Out
er re
gion
al
Inne
r reg
iona
l
Maj
or c
itie
s
Indi
geno
us
non-
Indi
geno
usNo
Yes
30+
25–
29.9
18.5
–24
.9
<18.
5
35+
20–
34<20
Age BMI Smoke<20w
Indig ARIA+ SEIFA quintiles All
Figure 74A: Characteristics of the mothers of all babies born with one or more of the defined congenital anomalies, Queensland 2012 to 2013
(Table A65)
Rate
s pe
r 100
0 bi
rhts
0
20
40
60
80
100
120
140
160
4000
+g
2500
–39
99g
1500
–24
99g
<150
0g
37+
wee
ks
29–
36 w
eeks
<28
wee
ks
Gestation
139.3
113.6
27.0
7.5 6.4
24.1
7.4
Birthweight
Rate
s pe
r 100
0 bi
rhts
130.5
75.5
196.1
0
20
40
60
80
100
120
140
160
180
200
Peri
nata
l dea
th
Neo
nata
l dea
th
Stil
lbir
th
Perinatal mortality
Figure 74B: Characteristics of all babies born with one or more of the defined congenital anomalies and the
associated case fatality rates, Queensland 2012 to 2013 (Table A65)
Figures 75 to 88 and Table A65 show demographic characteristics associated with the main anomaly groups. Care should be taken with interpretation of these univariate analyses, as the numbers in some instances are small and possible confounding effects have not been examined by multivariate analysis (e.g. younger mothers are more likely to smoke, but older mothers may be at more risk of some anomalies).
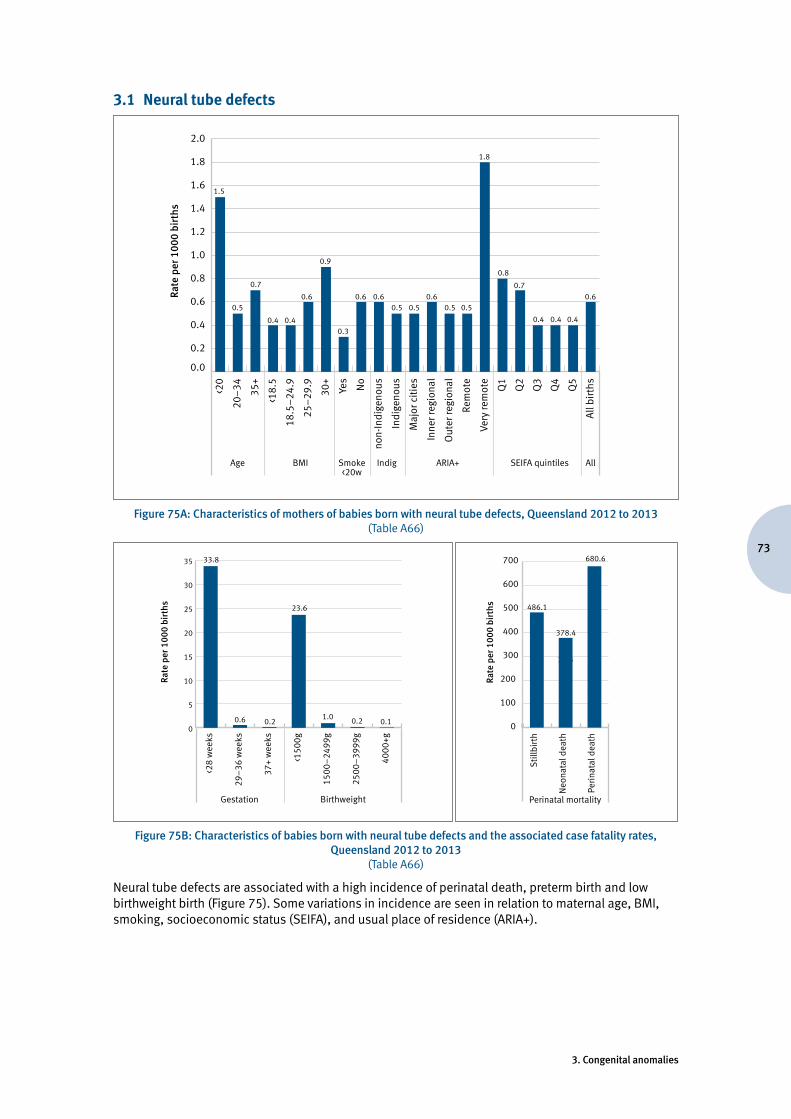
73
3. Congenital anomalies
3.1 Neural tube defects
Rate
per
100
0 bi
rths
0.0
0.2
0.4
0.6
0.8
1.0
1.2
1.4
1.6
1.8
2.0
All
birt
hsQ5
Q4
Q3
Q2
Q1
Very
rem
ote
Rem
ote
Out
er re
gion
al
Inne
r reg
iona
l
Maj
or c
itie
s
Indi
geno
us
non-
Indi
geno
usNo
Yes
30+
25–
29.9
18.5
–24
.9
<18.
5
35+
20–
34<20
Age
1.5
0.5 0.5 0.5 0.5 0.5
0.4 0.4 0.4
0.7
0.6 0.6 0.6 0.6 0.60.7
0.8
1.8
0.4 0.40.3
0.9
BMI Smoke<20w
Indig ARIA+ SEIFA quintiles All
Figure 75A: Characteristics of mothers of babies born with neural tube defects, Queensland 2012 to 2013 (Table A66)
Rate
per
100
0 bi
rths
0
5
10
15
20
25
30
35
4000
+g
2500
–39
99g
1500
–24
99g
<150
0g
37+
wee
ks
29–
36 w
eeks
<28
wee
ks
Gestation
33.8
23.6
1.0 0.2 0.10.6 0.2
Birthweight
Rate
per
100
0 bi
rths
75.5
0
100
200
300
400
500
600
700
378.4
680.6
486.1
Perinatal mortality
Peri
nata
l dea
th
Neo
nata
l dea
th
Stil
lbir
th
Figure 75B: Characteristics of babies born with neural tube defects and the associated case fatality rates,
Queensland 2012 to 2013 (Table A66)
Neural tube defects are associated with a high incidence of perinatal death, preterm birth and low birthweight birth (Figure 75). Some variations in incidence are seen in relation to maternal age, BMI, smoking, socioeconomic status (SEIFA), and usual place of residence (ARIA+).
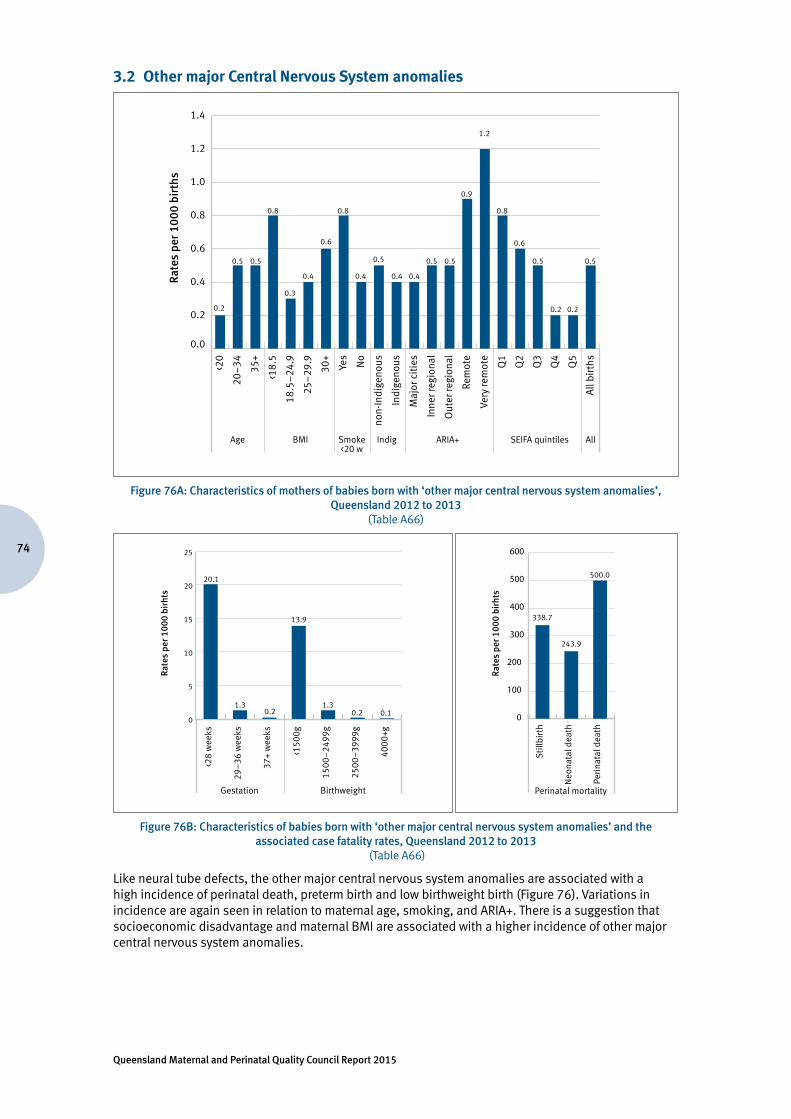
Queensland Maternal and Perinatal Quality Council Report 2015
74
3.2 Other major Central Nervous System anomalies
Rate
s pe
r 100
0 bi
rths
0.0
0.2
0.4
0.6
0.8
1.0
1.2
1.4
All
birt
hsQ5
Q4
Q3
Q2
Q1
Very
rem
ote
Rem
ote
Out
er re
gion
al
Inne
r reg
iona
l
Maj
or c
itie
s
Indi
geno
us
non-
Indi
geno
usNo
Yes
30+
25–
29.9
18.5
–24
.9
<18.
5
35+
20–
34<20
Age BMI Smoke<20 w
Indig ARIA+ SEIFA quintiles All
0.2
0.5
0.4 0.4
0.5
0.9
0.5
0.2 0.2
0.5
0.4 0.4
0.5
0.6
0.5 0.5
0.6
0.8
1.2
0.8
0.3
0.8
Figure 76A: Characteristics of mothers of babies born with ‘other major central nervous system anomalies’, Queensland 2012 to 2013
(Table A66)
Rate
s pe
r 100
0 bi
rhts
0
5
10
15
20
25
Gestation
20.1
13.9
1.30.2 0.1
1.30.2
Birthweight
4000
+g
2500
–39
99g
1500
–24
99g
<150
0g
37+
wee
ks
29–
36 w
eeks
<28
wee
ks
Rate
s pe
r 100
0 bi
rhts
338.7
243.9
500.0
0
100
200
300
400
500
600
Perinatal mortality
Peri
nata
l dea
th
Neo
nata
l dea
th
Stil
lbir
th
Figure 76B: Characteristics of babies born with ‘other major central nervous system anomalies’ and the
associated case fatality rates, Queensland 2012 to 2013 (Table A66)
Like neural tube defects, the other major central nervous system anomalies are associated with a high incidence of perinatal death, preterm birth and low birthweight birth (Figure 76). Variations in incidence are again seen in relation to maternal age, smoking, and ARIA+. There is a suggestion that socioeconomic disadvantage and maternal BMI are associated with a higher incidence of other major central nervous system anomalies.
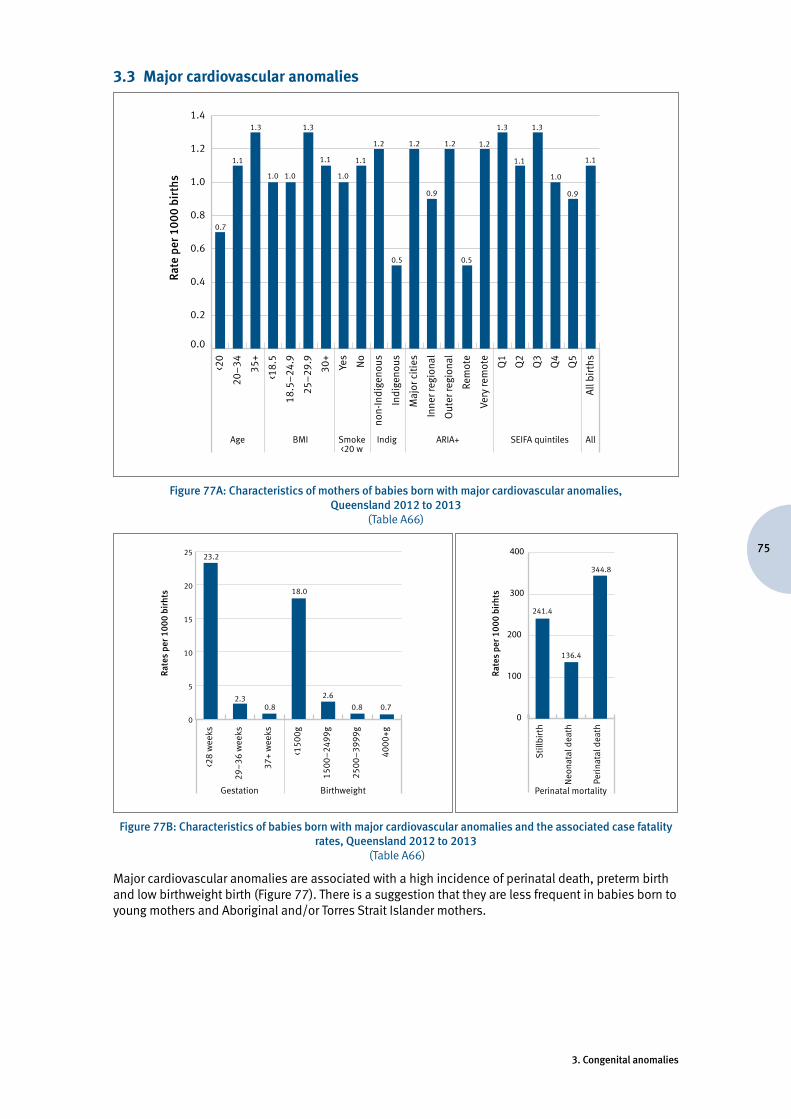
75
3. Congenital anomalies
3.3 Major cardiovascular anomalies
Rate
per
100
0 bi
rths
0.0
0.2
0.4
0.6
0.8
1.0
1.2
1.4
All
birt
hsQ5
Q4
Q3
Q2
Q1
Very
rem
ote
Rem
ote
Out
er re
gion
al
Inne
r reg
iona
l
Maj
or c
itie
s
Indi
geno
us
non-
Indi
geno
usNo
Yes
30+
25–
29.9
18.5
–24
.9
<18.
5
35+
20–
34<20
Age BMI Smoke<20 w
Indig ARIA+ SEIFA quintiles All
0.7
1.1
0.5
1.2 1.2
0.5
1.0
0.9
1.3 1.3
1.1
1.2
0.9
1.11.1
1.3 1.3
1.2
1.0 1.0 1.0
1.1
Figure 77A: Characteristics of mothers of babies born with major cardiovascular anomalies, Queensland 2012 to 2013
(Table A66)
Rate
s pe
r 100
0 bi
rhts
0
5
10
15
20
25
Gestation
23.2
18.0
2.6
0.8 0.72.3
0.8
Birthweight
4000
+g
2500
–39
99g
1500
–24
99g
<150
0g
37+
wee
ks
29–
36 w
eeks
<28
wee
ks
Rate
s pe
r 100
0 bi
rhts
241.4
136.4
344.8
0
100
200
300
400
Perinatal mortality
Peri
nata
l dea
th
Neo
nata
l dea
th
Stil
lbir
th
Figure 77B: Characteristics of babies born with major cardiovascular anomalies and the associated case fatality
rates, Queensland 2012 to 2013 (Table A66)
Major cardiovascular anomalies are associated with a high incidence of perinatal death, preterm birth and low birthweight birth (Figure 77). There is a suggestion that they are less frequent in babies born to young mothers and Aboriginal and/or Torres Strait Islander mothers.
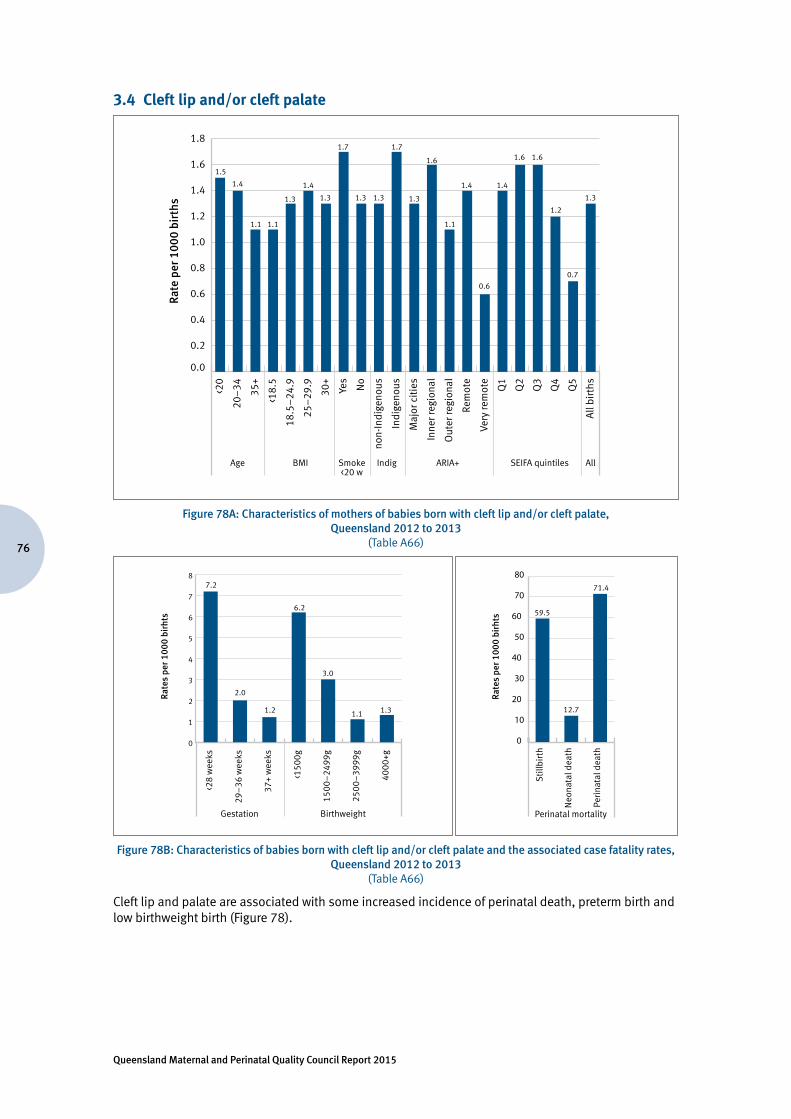
Queensland Maternal and Perinatal Quality Council Report 2015
76
3.4 Cleft lip and/or cleft palate
Rate
per
100
0 bi
rths
0.0
0.2
0.4
0.6
0.8
1.0
1.2
1.4
1.6
1.8
All
birt
hsQ5
Q4
Q3
Q2
Q1
Very
rem
ote
Rem
ote
Out
er re
gion
al
Inne
r reg
iona
l
Maj
or c
itie
s
Indi
geno
us
non-
Indi
geno
usNo
Yes
30+
25–
29.9
18.5
–24
.9
<18.
5
35+
20–
34<20
Age BMI Smoke<20 w
Indig ARIA+ SEIFA quintiles All
1.5
1.4
1.7
1.3
1.1
1.4
1.2
0.7
1.1
1.4
1.3 1.3
1.6
1.3
1.6
1.4
1.6
0.6
1.1
1.3
1.7
1.3
Figure 78A: Characteristics of mothers of babies born with cleft lip and/or cleft palate, Queensland 2012 to 2013
(Table A66)
Rate
s pe
r 100
0 bi
rhts
0
1
2
3
4
5
6
7
8
Gestation
7.2
6.2
3.0
1.1 1.3
2.0
1.2
Birthweight
4000
+g
2500
–39
99g
1500
–24
99g
<150
0g
37+
wee
ks
29–
36 w
eeks
<28
wee
ks
Rate
s pe
r 100
0 bi
rhts
59.5
12.7
71.4
0
10
20
30
40
50
60
70
80
Perinatal mortality
Peri
nata
l dea
th
Neo
nata
l dea
th
Stil
lbir
th
Figure 78B: Characteristics of babies born with cleft lip and/or cleft palate and the associated case fatality rates,
Queensland 2012 to 2013 (Table A66)
Cleft lip and palate are associated with some increased incidence of perinatal death, preterm birth and low birthweight birth (Figure 78).
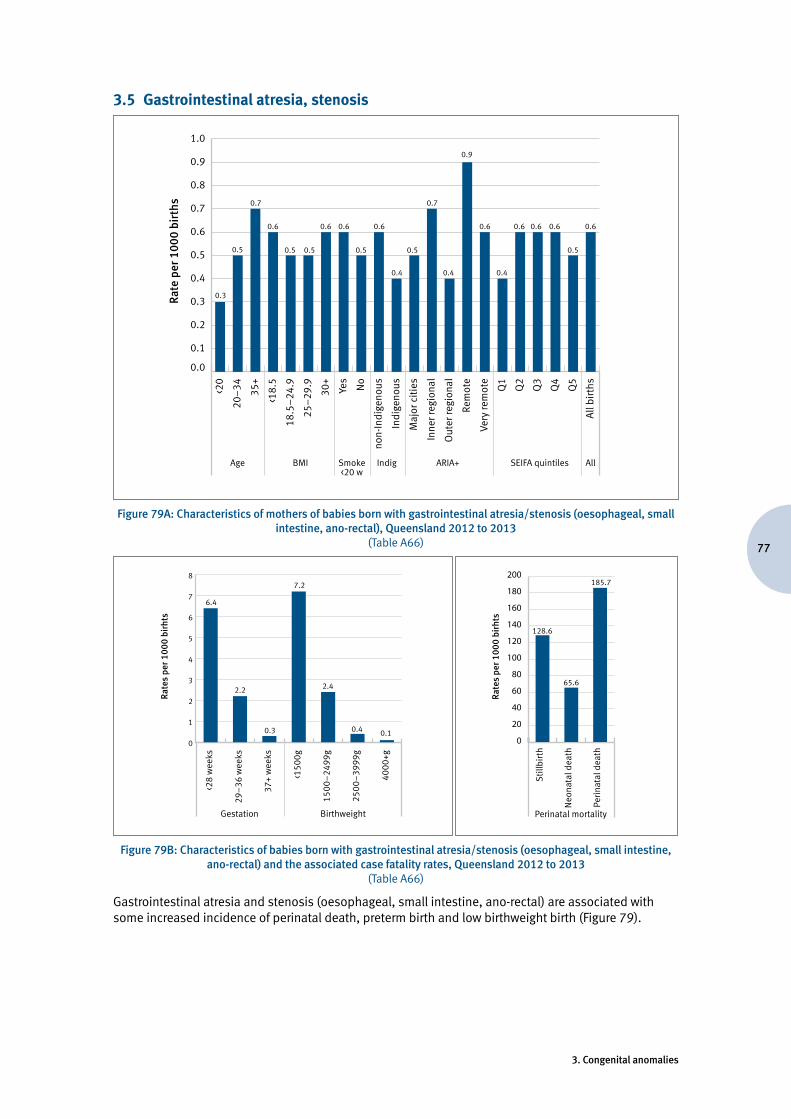
77
3. Congenital anomalies
3.5 Gastrointestinal atresia, stenosis
Rate
per
100
0 bi
rths
0.0
0.1
0.2
0.3
0.4
0.5
0.6
0.7
0.8
0.9
1.0
All
birt
hsQ5
Q4
Q3
Q2
Q1
Very
rem
ote
Rem
ote
Out
er re
gion
al
Inne
r reg
iona
l
Maj
or c
itie
s
Indi
geno
us
non-
Indi
geno
usNo
Yes
30+
25–
29.9
18.5
–24
.9
<18.
5
35+
20–
34<20
Age BMI Smoke<20 w
Indig ARIA+ SEIFA quintiles All
0.3
0.5
0.4 0.4 0.4
0.7 0.7
0.9
0.6 0.6 0.6 0.6 0.6 0.6 0.6 0.6 0.6
0.5 0.5 0.5 0.5 0.5
Figure 79A: Characteristics of mothers of babies born with gastrointestinal atresia/stenosis (oesophageal, small intestine, ano-rectal), Queensland 2012 to 2013
(Table A66)
Rate
s pe
r 100
0 bi
rhts
0
1
2
3
4
5
6
7
8
Gestation
6.4
7.2
2.4
0.4 0.1
2.2
0.3
Birthweight
4000
+g
2500
–39
99g
1500
–24
99g
<150
0g
37+
wee
ks
29–
36 w
eeks
<28
wee
ks
Rate
s pe
r 100
0 bi
rhts
128.6
65.6
185.7
0
20
40
60
80
100
120
140
160
180
200
Perinatal mortality
Peri
nata
l dea
th
Neo
nata
l dea
th
Stil
lbir
th
Figure 79B: Characteristics of babies born with gastrointestinal atresia/stenosis (oesophageal, small intestine,
ano-rectal) and the associated case fatality rates, Queensland 2012 to 2013 (Table A66)
Gastrointestinal atresia and stenosis (oesophageal, small intestine, ano-rectal) are associated with some increased incidence of perinatal death, preterm birth and low birthweight birth (Figure 79).
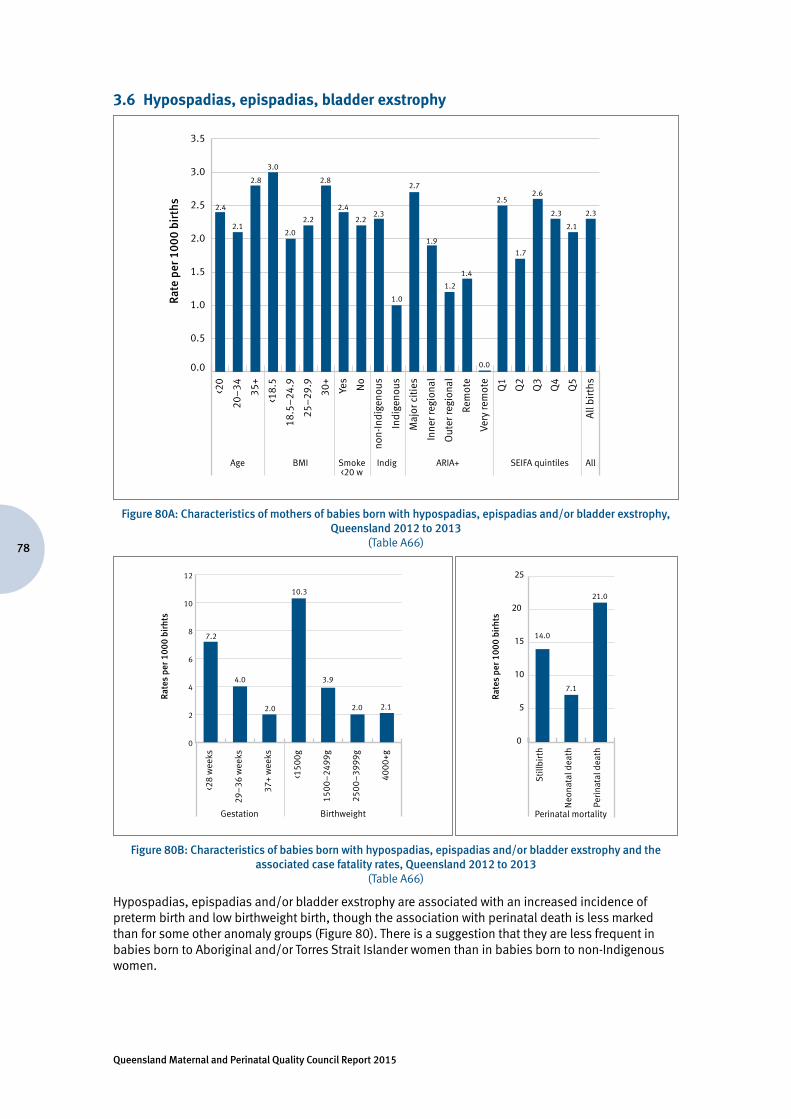
Queensland Maternal and Perinatal Quality Council Report 2015
78
3.6 Hypospadias, epispadias, bladder exstrophy
Rate
per
100
0 bi
rths
0.0
0.5
1.0
1.5
2.0
2.5
3.0
3.5
All
birt
hsQ5
Q4
Q3
Q2
Q1
Very
rem
ote
Rem
ote
Out
er re
gion
al
Inne
r reg
iona
l
Maj
or c
itie
s
Indi
geno
us
non-
Indi
geno
usNo
Yes
30+
25–
29.9
18.5
–24
.9
<18.
5
35+
20–
34<20
Age BMI Smoke<20 w
Indig ARIA+ SEIFA quintiles All
2.4
2.1
1.0
2.7
1.2
1.4
2.3
2.1
2.8
2.2 2.22.3
1.9
2.3
1.7
2.52.6
0.0
3.0
2.0
2.4
2.8
Figure 80A: Characteristics of mothers of babies born with hypospadias, epispadias and/or bladder exstrophy, Queensland 2012 to 2013
(Table A66)
Rate
s pe
r 100
0 bi
rhts
0
2
4
6
8
10
12
Gestation
7.2
10.3
3.9
2.0 2.1
4.0
2.0
Birthweight
4000
+g
2500
–39
99g
1500
–24
99g
<150
0g
37+
wee
ks
29–
36 w
eeks
<28
wee
ks
Rate
s pe
r 100
0 bi
rhts
14.0
7.1
21.0
0
5
10
15
20
25
Perinatal mortality
Peri
nata
l dea
th
Neo
nata
l dea
th
Stil
lbir
th
Figure 80B: Characteristics of babies born with hypospadias, epispadias and/or bladder exstrophy and the
associated case fatality rates, Queensland 2012 to 2013 (Table A66)
Hypospadias, epispadias and/or bladder exstrophy are associated with an increased incidence of preterm birth and low birthweight birth, though the association with perinatal death is less marked than for some other anomaly groups (Figure 80). There is a suggestion that they are less frequent in babies born to Aboriginal and/or Torres Strait Islander women than in babies born to non-Indigenous women.
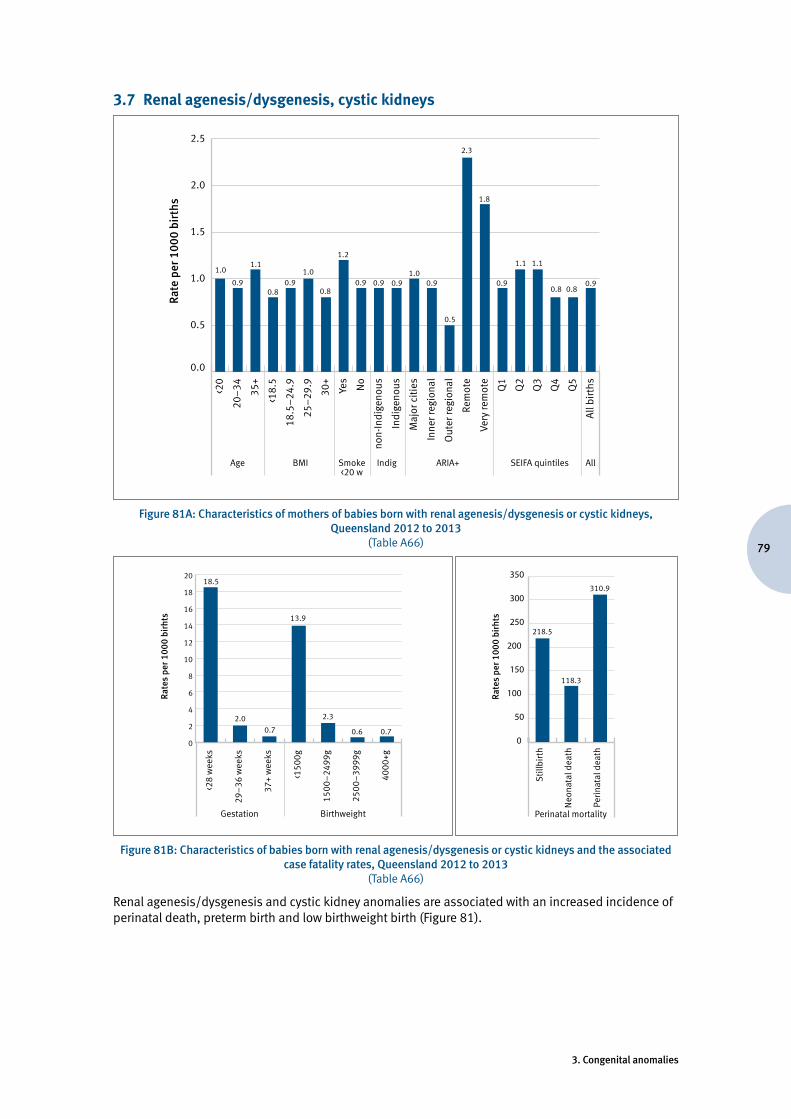
79
3. Congenital anomalies
3.7 Renal agenesis/dysgenesis, cystic kidneys
Rate
per
100
0 bi
rths
0.0
0.5
1.0
1.5
2.0
2.5
All
birt
hsQ5
Q4
Q3
Q2
Q1
Very
rem
ote
Rem
ote
Out
er re
gion
al
Inne
r reg
iona
l
Maj
or c
itie
s
Indi
geno
us
non-
Indi
geno
usNo
Yes
30+
25–
29.9
18.5
–24
.9
<18.
5
35+
20–
34<20
Age BMI Smoke<20 w
Indig ARIA+ SEIFA quintiles All
1.0
0.9 0.9 0.91.0
0.5
2.3
0.8 0.8
1.11.0
0.9 0.9 0.9
1.1
0.9
1.1
1.8
0.80.9
1.2
0.8
Figure 81A: Characteristics of mothers of babies born with renal agenesis/dysgenesis or cystic kidneys, Queensland 2012 to 2013
(Table A66)
Rate
s pe
r 100
0 bi
rhts
0
2
4
6
8
10
12
14
16
18
20
Gestation
18.5
13.9
2.3
0.6 0.7
2.00.7
Birthweight
4000
+g
2500
–39
99g
1500
–24
99g
<150
0g
37+
wee
ks
29–
36 w
eeks
<28
wee
ks
Rate
s pe
r 100
0 bi
rhts
218.5
118.3
310.9
0
50
100
150
200
250
300
350
Perinatal mortality
Peri
nata
l dea
th
Neo
nata
l dea
th
Stil
lbir
th
Figure 81B: Characteristics of babies born with renal agenesis/dysgenesis or cystic kidneys and the associated
case fatality rates, Queensland 2012 to 2013 (Table A66)
Renal agenesis/dysgenesis and cystic kidney anomalies are associated with an increased incidence of perinatal death, preterm birth and low birthweight birth (Figure 81).
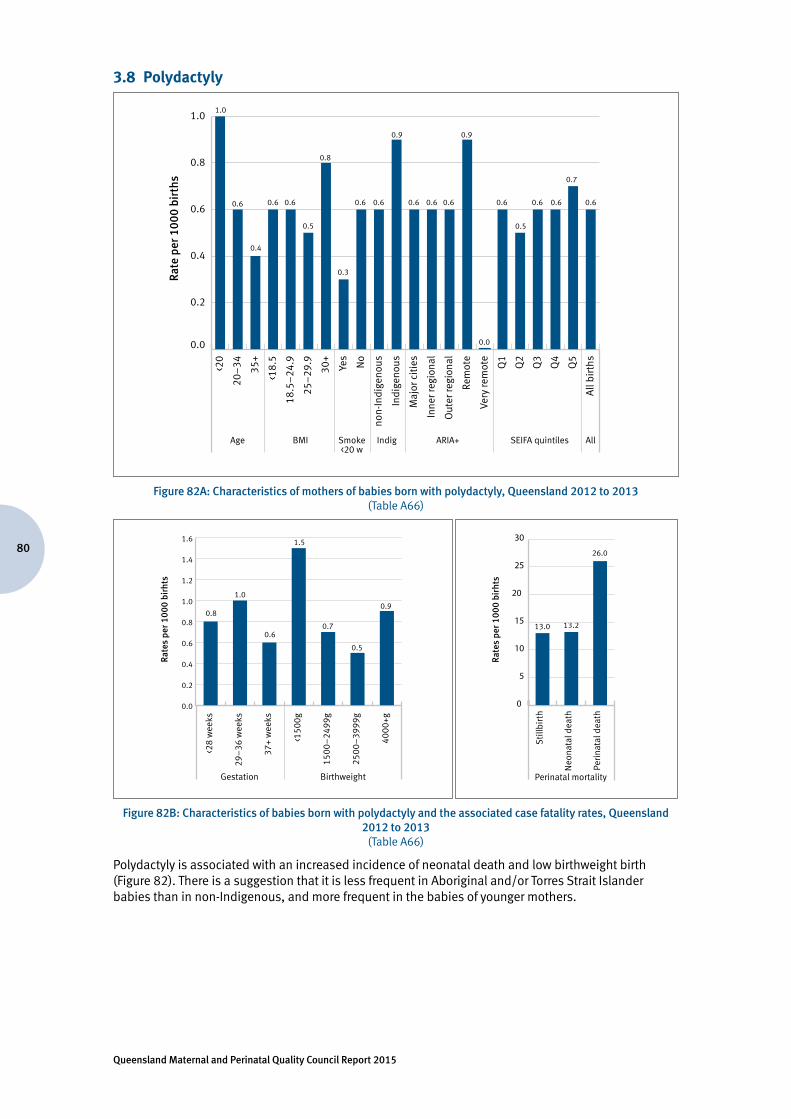
Queensland Maternal and Perinatal Quality Council Report 2015
80
3.8 Polydactyly
Rate
per
100
0 bi
rths
0.0
0.2
0.4
0.6
0.8
1.0
All
birt
hsQ5
Q4
Q3
Q2
Q1
Very
rem
ote
Rem
ote
Out
er re
gion
al
Inne
r reg
iona
l
Maj
or c
itie
s
Indi
geno
us
non-
Indi
geno
usNo
Yes
30+
25–
29.9
18.5
–24
.9
<18.
5
35+
20–
34<20
Age BMI Smoke<20 w
Indig ARIA+ SEIFA quintiles All
1.0
0.6
0.9 0.9
0.6
0.7
0.4
0.5
0.6 0.6 0.6 0.60.6 0.6
0.5
0.6 0.6
0.0
0.6 0.6
0.3
0.8
Figure 82A: Characteristics of mothers of babies born with polydactyly, Queensland 2012 to 2013 (Table A66)
Rate
s pe
r 100
0 bi
rhts
0.0
0.2
0.4
0.6
0.8
1.0
1.2
1.4
1.6
Gestation
0.8
1.5
0.7
0.5
0.9
1.0
0.6
Birthweight
4000
+g
2500
–39
99g
1500
–24
99g
<150
0g
37+
wee
ks
29–
36 w
eeks
<28
wee
ks
Rate
s pe
r 100
0 bi
rhts
13.0 13.2
26.0
0
5
10
15
20
25
30
Perinatal mortality
Peri
nata
l dea
th
Neo
nata
l dea
th
Stil
lbir
th
Figure 82B: Characteristics of babies born with polydactyly and the associated case fatality rates, Queensland
2012 to 2013 (Table A66)
Polydactyly is associated with an increased incidence of neonatal death and low birthweight birth (Figure 82). There is a suggestion that it is less frequent in Aboriginal and/or Torres Strait Islander babies than in non-Indigenous, and more frequent in the babies of younger mothers.
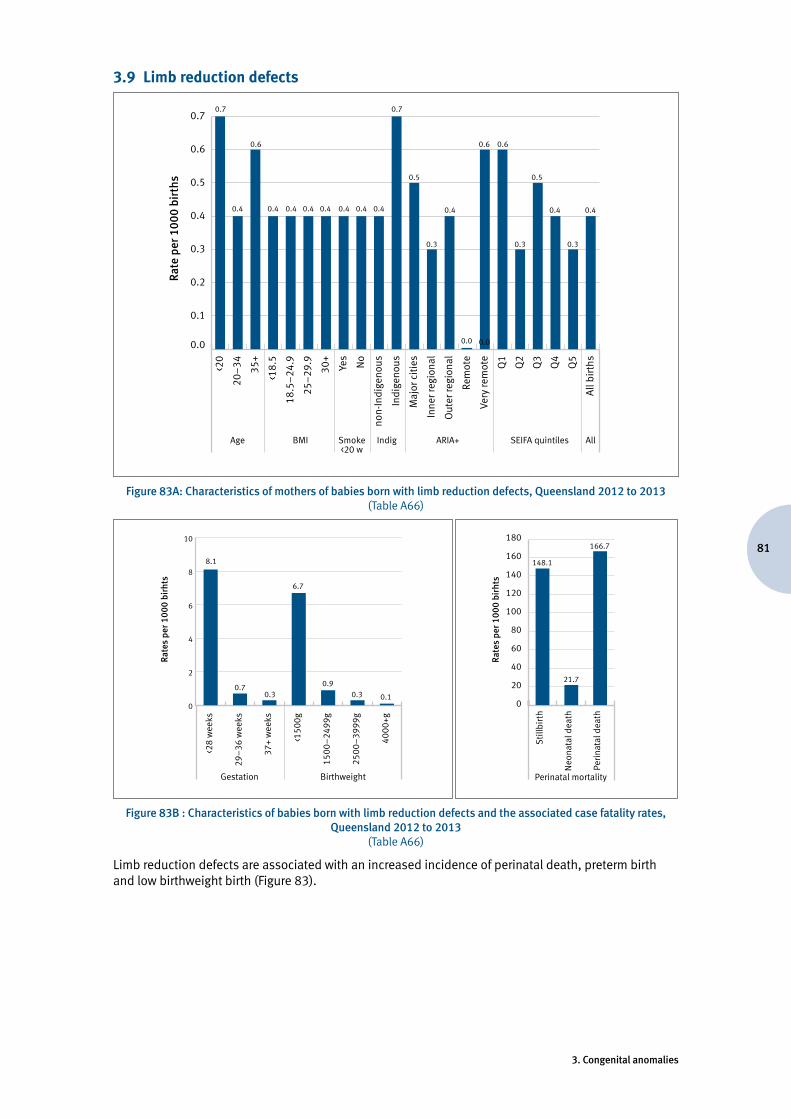
81
3. Congenital anomalies
3.9 Limb reduction defects
Rate
per
100
0 bi
rths
0.0
0.1
0.2
0.3
0.4
0.5
0.6
0.7
All
birt
hsQ5
Q4
Q3
Q2
Q1
Very
rem
ote
Rem
ote
Out
er re
gion
al
Inne
r reg
iona
l
Maj
or c
itie
s
Indi
geno
us
non-
Indi
geno
usNo
Yes
30+
25–
29.9
18.5
–24
.9
<18.
5
35+
20–
34<20
Age BMI Smoke<20 w
Indig ARIA+ SEIFA quintiles All
0.7
0.4 0.4 0.4 0.4 0.4 0.4 0.4 0.4
0.7
0.5 0.5
0.4 0.4 0.4
0.0
0.6 0.6 0.6
0.3 0.3 0.3
0.0
Figure 83A: Characteristics of mothers of babies born with limb reduction defects, Queensland 2012 to 2013(Table A66)
Rate
s pe
r 100
0 bi
rhts
0
2
4
6
8
10
Gestation
8.1
6.7
0.90.3 0.1
0.70.3
Birthweight
4000
+g
2500
–39
99g
1500
–24
99g
<150
0g
37+
wee
ks
29–
36 w
eeks
<28
wee
ks
Rate
s pe
r 100
0 bi
rhts
148.1
21.7
166.7
0
20
40
60
80
100
120
140
160
180
Perinatal mortality
Peri
nata
l dea
th
Neo
nata
l dea
th
Stil
lbir
th
Figure 83B : Characteristics of babies born with limb reduction defects and the associated case fatality rates,
Queensland 2012 to 2013 (Table A66)
Limb reduction defects are associated with an increased incidence of perinatal death, preterm birth and low birthweight birth (Figure 83).
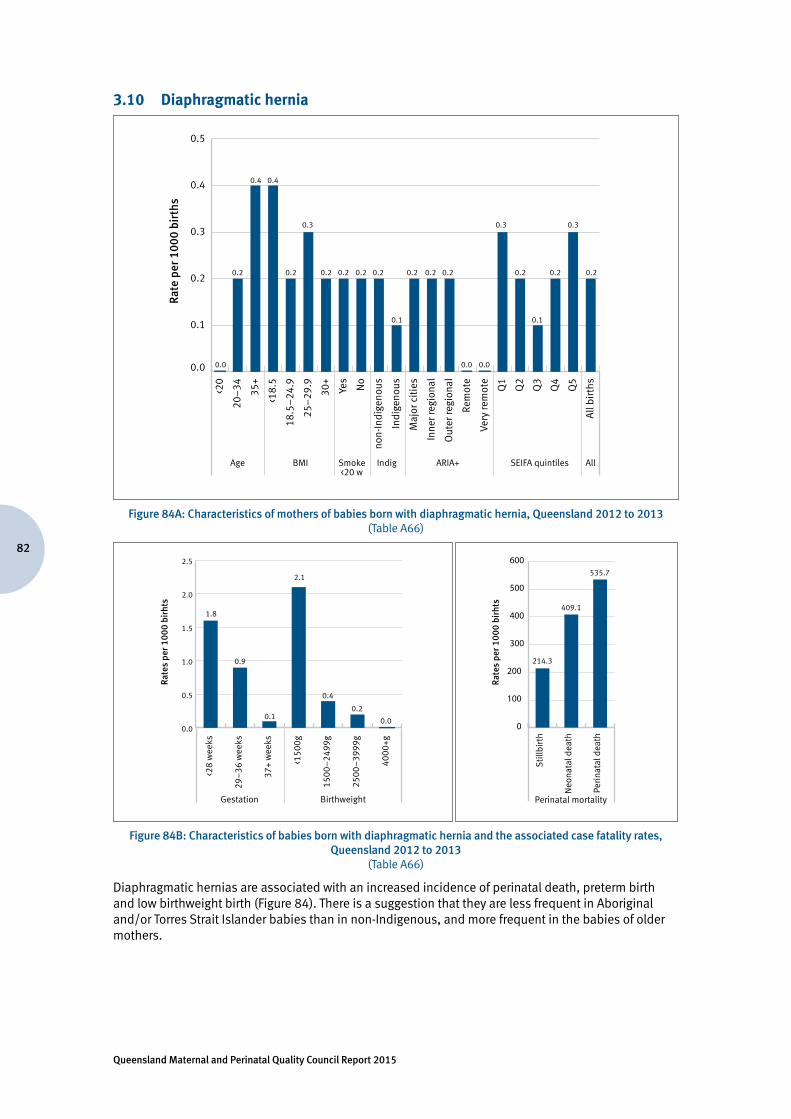
Queensland Maternal and Perinatal Quality Council Report 2015
82
3.10 Diaphragmatic hernia
Rate
per
100
0 bi
rths
0.0
0.1
0.2
0.3
0.4
0.5
All
birt
hsQ5
Q4
Q3
Q2
Q1
Very
rem
ote
Rem
ote
Out
er re
gion
al
Inne
r reg
iona
l
Maj
or c
itie
s
Indi
geno
us
non-
Indi
geno
usNo
Yes
30+
25–
29.9
18.5
–24
.9
<18.
5
35+
20–
34<20
Age BMI Smoke<20 w
Indig ARIA+ SEIFA quintiles All
0.2 0.2 0.2
0.3 0.3 0.3
0.2 0.2 0.2 0.2 0.2 0.2 0.2 0.2 0.2
0.1 0.1
0.4
0.00.00.0
0.4
Figure 84A: Characteristics of mothers of babies born with diaphragmatic hernia, Queensland 2012 to 2013 (Table A66)
Rate
s pe
r 100
0 bi
rhts
0.0
0.5
1.0
1.5
2.0
2.5
Gestation
1.8
2.1
0.4
0.2
0.0
0.9
0.1
Birthweight
4000
+g
2500
–39
99g
1500
–24
99g
<150
0g
37+
wee
ks
29–
36 w
eeks
<28
wee
ks
Rate
s pe
r 100
0 bi
rhts
214.3
409.1
535.7
0
100
200
300
400
500
600
Perinatal mortality
Peri
nata
l dea
th
Neo
nata
l dea
th
Stil
lbir
th
Figure 84B: Characteristics of babies born with diaphragmatic hernia and the associated case fatality rates,
Queensland 2012 to 2013 (Table A66)
Diaphragmatic hernias are associated with an increased incidence of perinatal death, preterm birth and low birthweight birth (Figure 84). There is a suggestion that they are less frequent in Aboriginal and/or Torres Strait Islander babies than in non-Indigenous, and more frequent in the babies of older mothers.
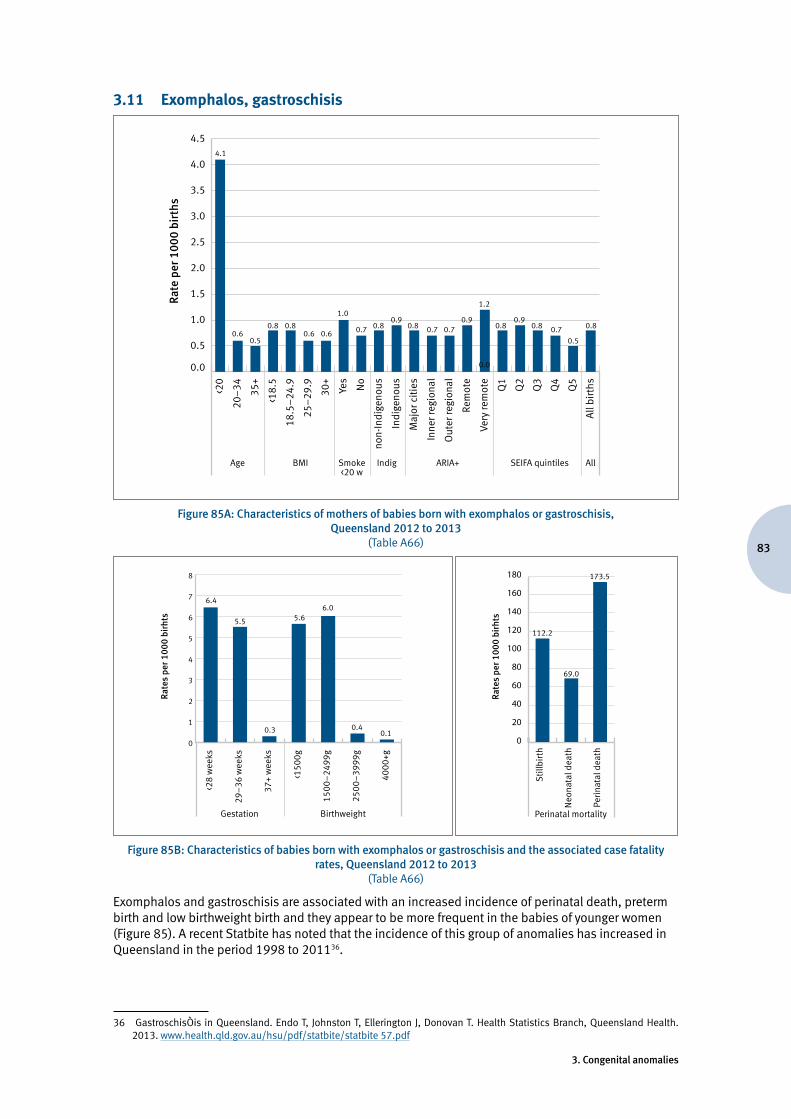
83
3. Congenital anomalies
3.11 Exomphalos, gastroschisis
Rate
per
100
0 bi
rths
0.0
0.5
1.0
1.5
2.0
2.5
3.0
3.5
4.0
4.5
All
birt
hsQ5
Q4
Q3
Q2
Q1
Very
rem
ote
Rem
ote
Out
er re
gion
al
Inne
r reg
iona
l
Maj
or c
itie
s
Indi
geno
us
non-
Indi
geno
usNo
Yes
30+
25–
29.9
18.5
–24
.9
<18.
5
35+
20–
34<20
Age BMI Smoke<20 w
Indig ARIA+ SEIFA quintiles All
4.1
0.6 0.6 0.60.5
0.7 0.7 0.7 0.70.5
0.8 0.8 0.8 0.8 0.8 0.8 0.8
1.00.9 0.9 0.9
1.2
0.0
Figure 85A: Characteristics of mothers of babies born with exomphalos or gastroschisis, Queensland 2012 to 2013
(Table A66)
Rate
s pe
r 100
0 bi
rhts
0
1
2
3
4
5
6
7
8
Gestation
6.4
5.66.0
0.40.1
5.5
0.3
Birthweight
4000
+g
2500
–39
99g
1500
–24
99g
<150
0g
37+
wee
ks
29–
36 w
eeks
<28
wee
ks
Rate
s pe
r 100
0 bi
rhts
69.0
0
20
40
60
80
100
120
140
160
180
Perinatal mortality
Peri
nata
l dea
th
Neo
nata
l dea
th
Stil
lbir
th
112.2
173.5
Figure 85B: Characteristics of babies born with exomphalos or gastroschisis and the associated case fatality
rates, Queensland 2012 to 2013 (Table A66)
Exomphalos and gastroschisis are associated with an increased incidence of perinatal death, preterm birth and low birthweight birth and they appear to be more frequent in the babies of younger women (Figure 85). A recent Statbite has noted that the incidence of this group of anomalies has increased in Queensland in the period 1998 to 201136.
36 GastroschisÒis in Queensland. Endo T, Johnston T, Ellerington J, Donovan T. Health Statistics Branch, Queensland Health. 2013. www.health.qld.gov.au/hsu/pdf/statbite/statbite 57.pdf
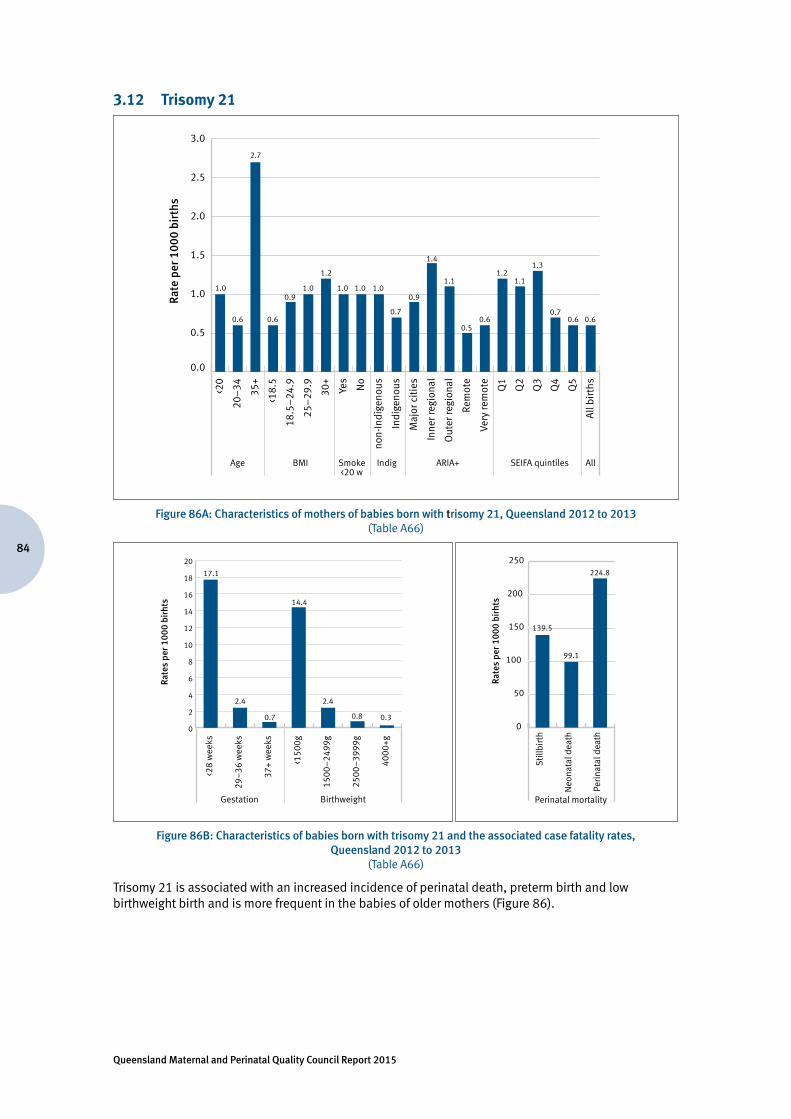
Queensland Maternal and Perinatal Quality Council Report 2015
84
3.12 Trisomy 21
Rate
per
100
0 bi
rths
0.0
0.5
1.0
1.5
2.0
2.5
3.0
All
birt
hsQ5
Q4
Q3
Q2
Q1
Very
rem
ote
Rem
ote
Out
er re
gion
al
Inne
r reg
iona
l
Maj
or c
itie
s
Indi
geno
us
non-
Indi
geno
usNo
Yes
30+
25–
29.9
18.5
–24
.9
<18.
5
35+
20–
34<20
Age BMI Smoke<20 w
Indig ARIA+ SEIFA quintiles All
1.0 1.0 1.0 1.0 1.0
0.6 0.60.7
0.9 0.9
1.4
1.1 1.1
0.50.6 0.6 0.6
0.7
1.21.21.3
2.7
Figure 86A: Characteristics of mothers of babies born with trisomy 21, Queensland 2012 to 2013 (Table A66)
Rate
s pe
r 100
0 bi
rhts
0
2
4
6
8
10
12
14
16
18
20
Gestation
17.1
14.4
2.4
0.8 0.3
2.4
0.7
Birthweight
4000
+g
2500
–39
99g
1500
–24
99g
<150
0g
37+
wee
ks
29–
36 w
eeks
<28
wee
ks
Rate
s pe
r 100
0 bi
rhts
0
50
100
150
200
250
Perinatal mortality
Peri
nata
l dea
th
Neo
nata
l dea
th
Stil
lbir
th
139.5
99.1
224.8
Figure 86B: Characteristics of babies born with trisomy 21 and the associated case fatality rates,
Queensland 2012 to 2013 (Table A66)
Trisomy 21 is associated with an increased incidence of perinatal death, preterm birth and low birthweight birth and is more frequent in the babies of older mothers (Figure 86).
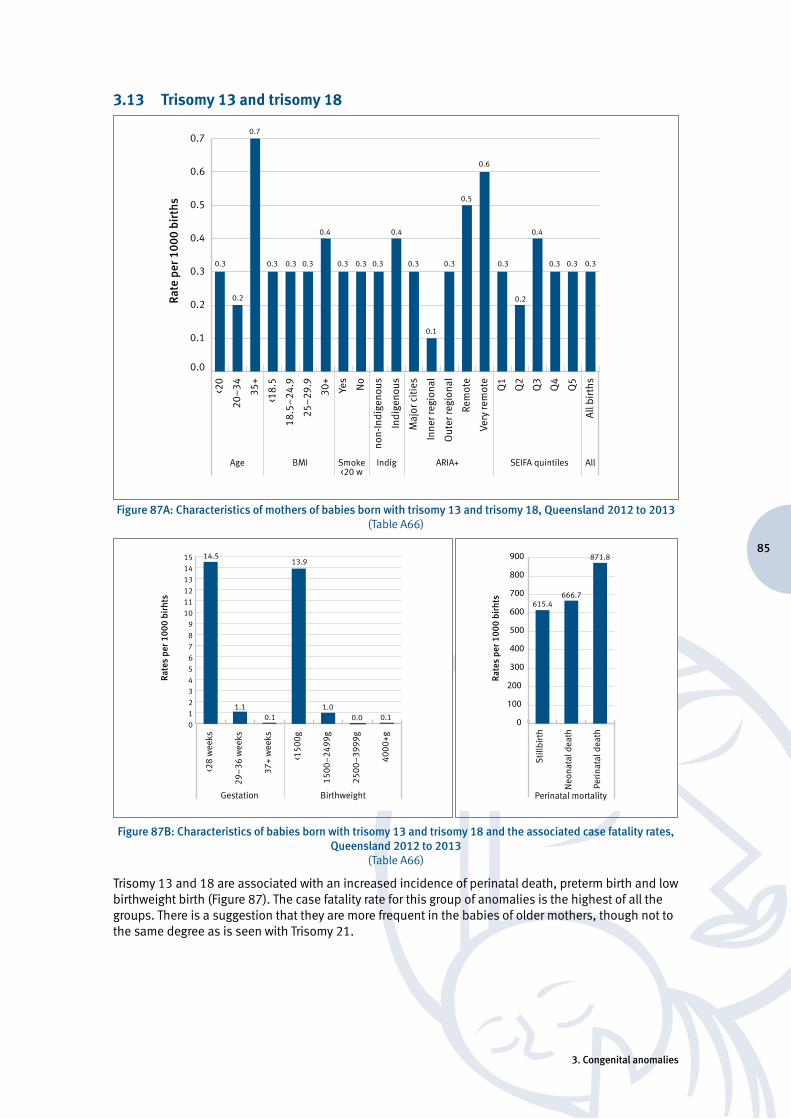
85
3. Congenital anomalies
3.13 Trisomy 13 and trisomy 18
Rate
per
100
0 bi
rths
0.0
0.1
0.2
0.3
0.4
0.5
0.6
0.7
All
birt
hsQ5
Q4
Q3
Q2
Q1
Very
rem
ote
Rem
ote
Out
er re
gion
al
Inne
r reg
iona
l
Maj
or c
itie
s
Indi
geno
us
non-
Indi
geno
usNo
Yes
30+
25–
29.9
18.5
–24
.9
<18.
5
35+
20–
34<20
Age BMI Smoke<20 w
Indig ARIA+ SEIFA quintiles All
0.3 0.3 0.3 0.3
0.4 0.4 0.4
0.5
0.6
0.3 0.3 0.3 0.3
0.1
0.3 0.3 0.3 0.3 0.3
0.20.2
0.7
Figure 87A: Characteristics of mothers of babies born with trisomy 13 and trisomy 18, Queensland 2012 to 2013(Table A66)
Rate
s pe
r 100
0 bi
rhts
0123456789
101112131415
Gestation
14.513.9
1.00.0 0.1
1.10.1
Birthweight
4000
+g
2500
–39
99g
1500
–24
99g
<150
0g
37+
wee
ks
29–
36 w
eeks
<28
wee
ks
Rate
s pe
r 100
0 bi
rhts
0
100
200
300
400
500
600
700
800
900
Perinatal mortality
Peri
nata
l dea
th
Neo
nata
l dea
th
Stil
lbir
th
615.4666.7
871.8
Figure 87B: Characteristics of babies born with trisomy 13 and trisomy 18 and the associated case fatality rates,
Queensland 2012 to 2013 (Table A66)
Trisomy 13 and 18 are associated with an increased incidence of perinatal death, preterm birth and low birthweight birth (Figure 87). The case fatality rate for this group of anomalies is the highest of all the groups. There is a suggestion that they are more frequent in the babies of older mothers, though not to the same degree as is seen with Trisomy 21.
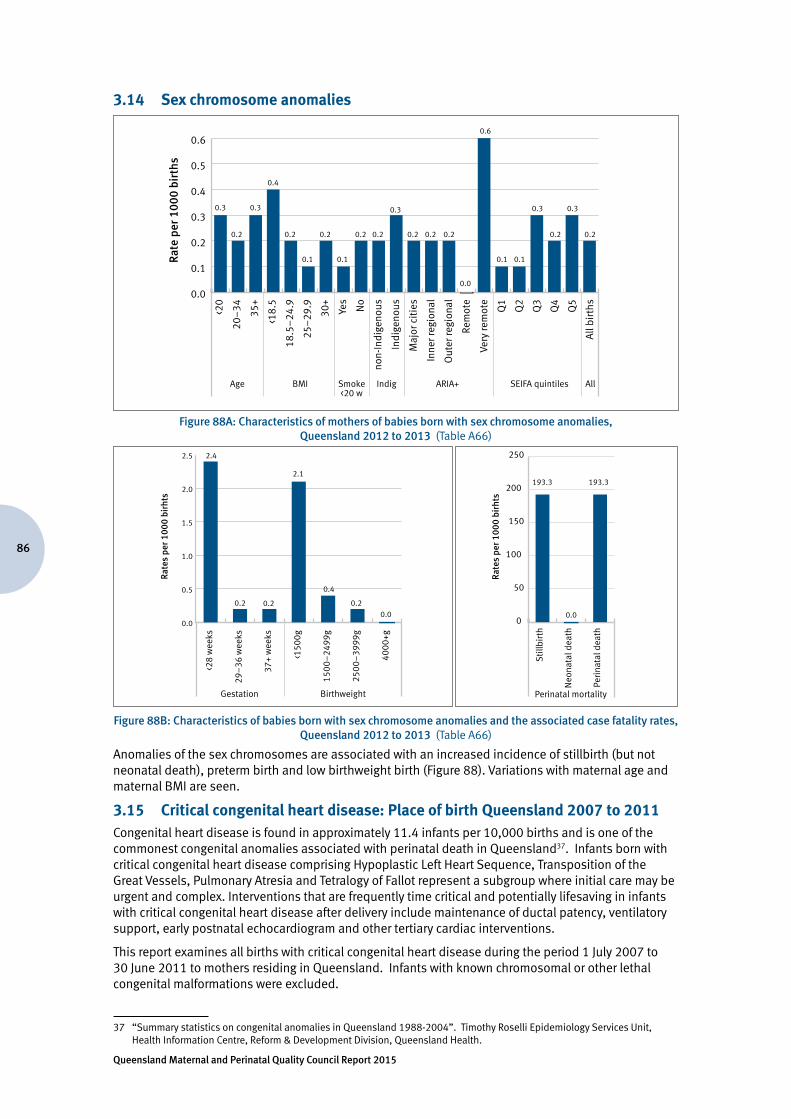
Queensland Maternal and Perinatal Quality Council Report 2015
86
3.14 Sex chromosome anomalies
Rate
per
100
0 bi
rths
All
birt
hsQ5
Q4
Q3
Q2
Q1
Very
rem
ote
Rem
ote
Out
er re
gion
al
Inne
r reg
iona
l
Maj
or c
itie
s
Indi
geno
us
non-
Indi
geno
usNo
Yes
30+
25–
29.9
18.5
–24
.9
<18.
5
35+
20–
34<20
Age BMI Smoke<20 w
Indig ARIA+ SEIFA quintiles All
0.3 0.3 0.3 0.3 0.3
0.6
0.4
0.2 0.2
0.1 0.1 0.1 0.1
0.2 0.2 0.2 0.2 0.2 0.2 0.2 0.2
0.0
0.0
0.1
0.2
0.3
0.4
0.5
0.6
Figure 88A: Characteristics of mothers of babies born with sex chromosome anomalies, Queensland 2012 to 2013 (Table A66)
Rate
s pe
r 100
0 bi
rhts
0.0
0.5
1.0
1.5
2.0
2.5
Gestation
2.4
2.1
0.4
0.00.2 0.2 0.2
Birthweight
4000
+g
2500
–39
99g
1500
–24
99g
<150
0g
37+
wee
ks
29–
36 w
eeks
<28
wee
ks
Rate
s pe
r 100
0 bi
rhts
0.00
50
100
150
200
250
Perinatal mortality
Peri
nata
l dea
th
Neo
nata
l dea
th
Stil
lbir
th
193.3 193.3
Figure 88B: Characteristics of babies born with sex chromosome anomalies and the associated case fatality rates,
Queensland 2012 to 2013 (Table A66)
Anomalies of the sex chromosomes are associated with an increased incidence of stillbirth (but not neonatal death), preterm birth and low birthweight birth (Figure 88). Variations with maternal age and maternal BMI are seen.
3.15 Critical congenital heart disease: Place of birth Queensland 2007 to 2011Congenital heart disease is found in approximately 11.4 infants per 10,000 births and is one of the commonest congenital anomalies associated with perinatal death in Queensland37. Infants born with critical congenital heart disease comprising Hypoplastic Left Heart Sequence, Transposition of the Great Vessels, Pulmonary Atresia and Tetralogy of Fallot represent a subgroup where initial care may be urgent and complex. Interventions that are frequently time critical and potentially lifesaving in infants with critical congenital heart disease after delivery include maintenance of ductal patency, ventilatory support, early postnatal echocardiogram and other tertiary cardiac interventions.
This report examines all births with critical congenital heart disease during the period 1 July 2007 to 30 June 2011 to mothers residing in Queensland. Infants with known chromosomal or other lethal congenital malformations were excluded.
37 “Summary statistics on congenital anomalies in Queensland 1988-2004”. Timothy Roselli Epidemiology Services Unit, Health Information Centre, Reform & Development Division, Queensland Health.
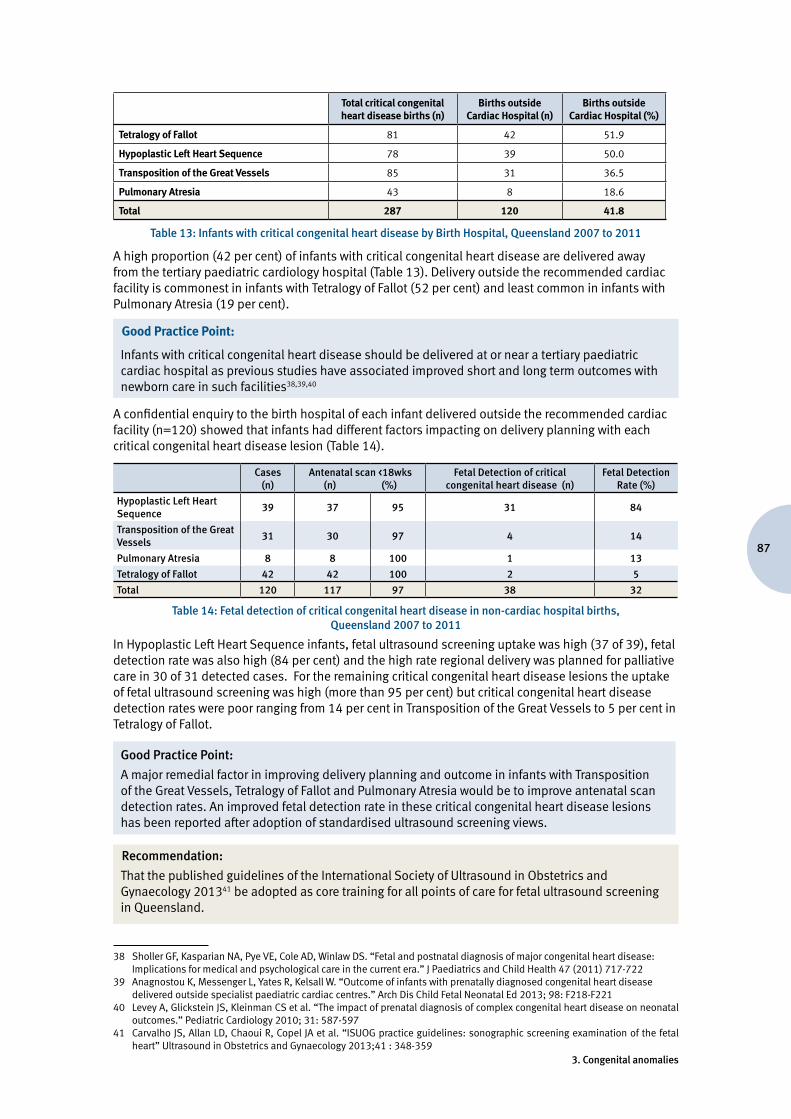
87
3. Congenital anomalies
Total critical congenital heart disease births (n)
Births outside Cardiac Hospital (n)
Births outside Cardiac Hospital (%)
Tetralogy of Fallot 81 42 51.9
Hypoplastic Left Heart Sequence 78 39 50.0
Transposition of the Great Vessels 85 31 36.5
Pulmonary Atresia 43 8 18.6
Total 287 120 41.8
Table 13: Infants with critical congenital heart disease by Birth Hospital, Queensland 2007 to 2011
A high proportion (42 per cent) of infants with critical congenital heart disease are delivered away from the tertiary paediatric cardiology hospital (Table 13). Delivery outside the recommended cardiac facility is commonest in infants with Tetralogy of Fallot (52 per cent) and least common in infants with Pulmonary Atresia (19 per cent).
Good Practice Point:
Infants with critical congenital heart disease should be delivered at or near a tertiary paediatric cardiac hospital as previous studies have associated improved short and long term outcomes with newborn care in such facilities38,39,40
A confidential enquiry to the birth hospital of each infant delivered outside the recommended cardiac facility (n=120) showed that infants had different factors impacting on delivery planning with each critical congenital heart disease lesion (Table 14).
Cases (n)
Antenatal scan <18wks (n) (%)
Fetal Detection of critical congenital heart disease (n)
Fetal Detection Rate (%)
Hypoplastic Left Heart Sequence
39 37 95 31 84
Transposition of the Great Vessels
31 30 97 4 14
Pulmonary Atresia 8 8 100 1 13
Tetralogy of Fallot 42 42 100 2 5
Total 120 117 97 38 32
Table 14: Fetal detection of critical congenital heart disease in non-cardiac hospital births, Queensland 2007 to 2011
In Hypoplastic Left Heart Sequence infants, fetal ultrasound screening uptake was high (37 of 39), fetal detection rate was also high (84 per cent) and the high rate regional delivery was planned for palliative care in 30 of 31 detected cases. For the remaining critical congenital heart disease lesions the uptake of fetal ultrasound screening was high (more than 95 per cent) but critical congenital heart disease detection rates were poor ranging from 14 per cent in Transposition of the Great Vessels to 5 per cent in Tetralogy of Fallot.
Good Practice Point:
A major remedial factor in improving delivery planning and outcome in infants with Transposition of the Great Vessels, Tetralogy of Fallot and Pulmonary Atresia would be to improve antenatal scan detection rates. An improved fetal detection rate in these critical congenital heart disease lesions has been reported after adoption of standardised ultrasound screening views.
Recommendation:
That the published guidelines of the International Society of Ultrasound in Obstetrics and Gynaecology 201341 be adopted as core training for all points of care for fetal ultrasound screening in Queensland.
38 Sholler GF, Kasparian NA, Pye VE, Cole AD, Winlaw DS. “Fetal and postnatal diagnosis of major congenital heart disease: Implications for medical and psychological care in the current era.” J Paediatrics and Child Health 47 (2011) 717-722
39 Anagnostou K, Messenger L, Yates R, Kelsall W. “Outcome of infants with prenatally diagnosed congenital heart disease delivered outside specialist paediatric cardiac centres.” Arch Dis Child Fetal Neonatal Ed 2013; 98: F218-F221
40 Levey A, Glickstein JS, Kleinman CS et al. “The impact of prenatal diagnosis of complex congenital heart disease on neonatal outcomes.” Pediatric Cardiology 2010; 31: 587-597
41 Carvalho JS, Allan LD, Chaoui R, Copel JA et al. “ISUOG practice guidelines: sonographic screening examination of the fetal heart” Ultrasound in Obstetrics and Gynaecology 2013;41 : 348-359
Queensland Maternal and Perinatal Quality Council Report 2015
88
4. Comparisons between hospitals and their outcomes
The purpose of perinatal care indicators and measurement of outcomes of care is to improve the outcomes for mothers and babies by:
• monitoring the quality of care provision and outcomes • allowing health care providers the ability to benchmark their care • providing information to women and their families regarding the outcomes of various care options.
QMPQC has chosen a small group of care indicators to examine in this publication, and would be interested in dialogue regarding potential future indicators.
Tables 16 and 17 show maternal and neonatal profiles of the women and babies cared for. For reporting of group outcomes, the hospitals and other modes of healthcare delivery are grouped in clinically relevant ‘Hospital/facility’ groupings as per Table 15.
Mater Mothers Hospital is reported with Queensland public hospital maternity and newborn services and is included in Group A (Specialist Obstetric Service with a Maternal-Fetal Medicine Unit and a Neonatal Intensive Care Unit). Beaudesert and Cooktown health services were in the process of developing a formal maternity service during these years, but are not included as such in this report. Gold Coast University Hospital was beginning to transition to a Specialist Obstetric Service with a Maternal-Fetal Medicine Unit and a Neonatal Intensive Care Unit during these years, but is reported in Group B (Specialist Obstetric Service and Special Care Nursery; >3000 births/year) for the purposes of this report.
The five public Birth Centres are included with the relevant hospital; it is acknowledged that the incidence of intervention in the pregnancies of women giving birth in these facilities was significantly lower than for the ‘parent’ hospital maternity service.
Group indicator outcomes are reported in bar graphs and statewide rates are also given. It should be clear that the statewide rate is an average rate, and does not represent an ‘ideal’ or evidence-based optimum rate. Data are for Queensland births 2012 to 2013.
Individual public hospital facility outcomes are reported in the form of funnel plots, which are visual tools for investigating possible bias in an analysis. A funnel plot, as used in this report, is a scatter plot of the treatment estimates (e.g. caesarean section rate) from individual facilities against each facility’s birth numbers for the relevant question (e.g. selected primigravida). Individual private hospital data are not available for similar representation.
The name funnel plot arises from the fact that precision of the estimated intervention effect increases as the size of the study increases. Effect estimates from small studies will therefore scatter more widely at the bottom of the graph, with the spread narrowing among larger studies. The standard error of the intervention effect estimate is plotted on the vertical axis. Control limits are then overlaid on the scatter plot. They are the upper and lower control limits that represent the boundary between normal variation and special cause variation. The control limits represent the expected variation in rates assuming that the only source of variation is normal variation. The control limits are computed in a fashion very similar to confidence intervals and exhibit the distinctive funnel shape as a result of smaller expected variability in larger populations. The control limits represent 95 per cent and 99.7 per cent variation from the average or mean.
The indicators shown in Figures 89, 91 and 99 examine women defined as ‘selected primigravida’; these are women whose age is between 20 and 34 years, who have not had previous births, who have a singleton birth in current pregnancy, who gave birth between 37 weeks + 0 days to 41 weeks + 6 days completed weeks of gestation, and whose baby presented in a standard head first flexed manner (cephalic / vertex presentation at birth). These standardised outcomes tend to allow for more valid comparisons across care groups.
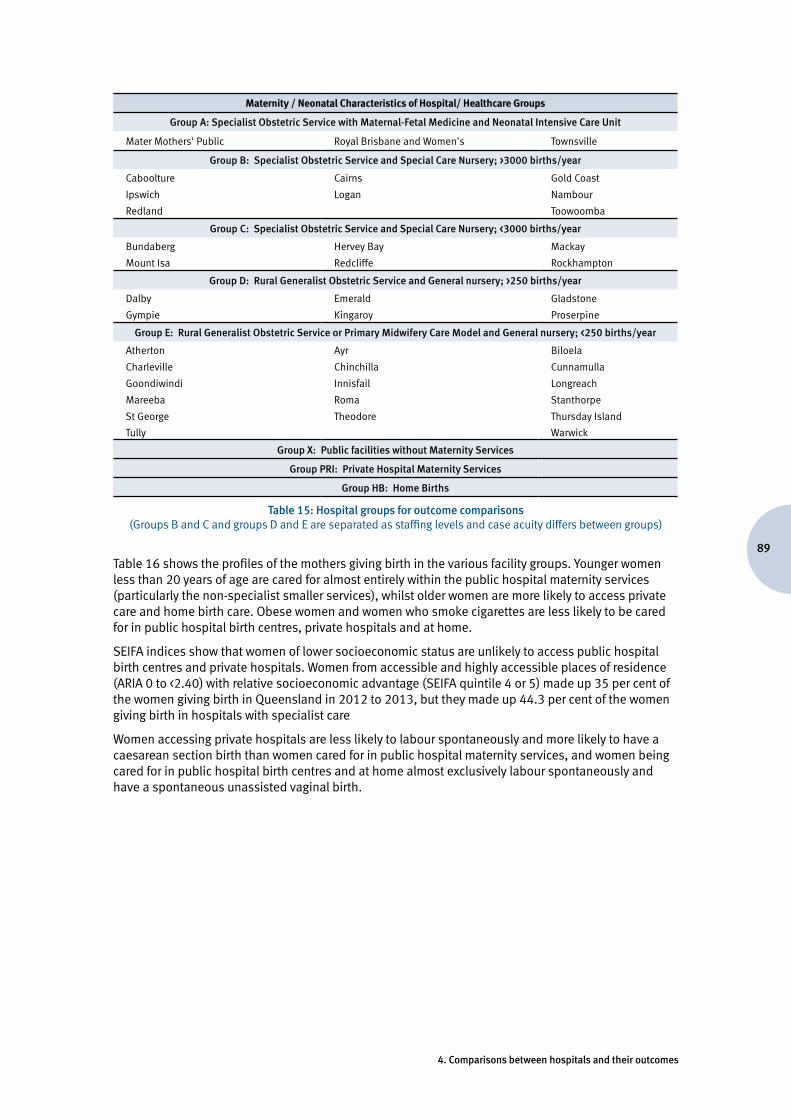
89
4. Comparisons between hospitals and their outcomes
Maternity / Neonatal Characteristics of Hospital/ Healthcare Groups
Group A: Specialist Obstetric Service with Maternal-Fetal Medicine and Neonatal Intensive Care Unit
Mater Mothers' Public Royal Brisbane and Women's Townsville
Group B: Specialist Obstetric Service and Special Care Nursery; >3000 births/year
Caboolture Cairns Gold Coast
Ipswich Logan Nambour
Redland Toowoomba
Group C: Specialist Obstetric Service and Special Care Nursery; <3000 births/year
Bundaberg Hervey Bay Mackay
Mount Isa Redcliffe Rockhampton
Group D: Rural Generalist Obstetric Service and General nursery; >250 births/year
Dalby Emerald Gladstone
Gympie Kingaroy Proserpine
Group E: Rural Generalist Obstetric Service or Primary Midwifery Care Model and General nursery; <250 births/year
Atherton Ayr Biloela
Charleville Chinchilla Cunnamulla
Goondiwindi Innisfail Longreach
Mareeba Roma Stanthorpe
St George Theodore Thursday Island
Tully Warwick
Group X: Public facilities without Maternity Services
Group PRI: Private Hospital Maternity Services
Group HB: Home Births
Table 15: Hospital groups for outcome comparisons (Groups B and C and groups D and E are separated as staffing levels and case acuity differs between groups)
Table 16 shows the profiles of the mothers giving birth in the various facility groups. Younger women less than 20 years of age are cared for almost entirely within the public hospital maternity services (particularly the non-specialist smaller services), whilst older women are more likely to access private care and home birth care. Obese women and women who smoke cigarettes are less likely to be cared for in public hospital birth centres, private hospitals and at home.
SEIFA indices show that women of lower socioeconomic status are unlikely to access public hospital birth centres and private hospitals. Women from accessible and highly accessible places of residence (ARIA 0 to <2.40) with relative socioeconomic advantage (SEIFA quintile 4 or 5) made up 35 per cent of the women giving birth in Queensland in 2012 to 2013, but they made up 44.3 per cent of the women giving birth in hospitals with specialist care
Women accessing private hospitals are less likely to labour spontaneously and more likely to have a caesarean section birth than women cared for in public hospital maternity services, and women being cared for in public hospital birth centres and at home almost exclusively labour spontaneously and have a spontaneous unassisted vaginal birth.
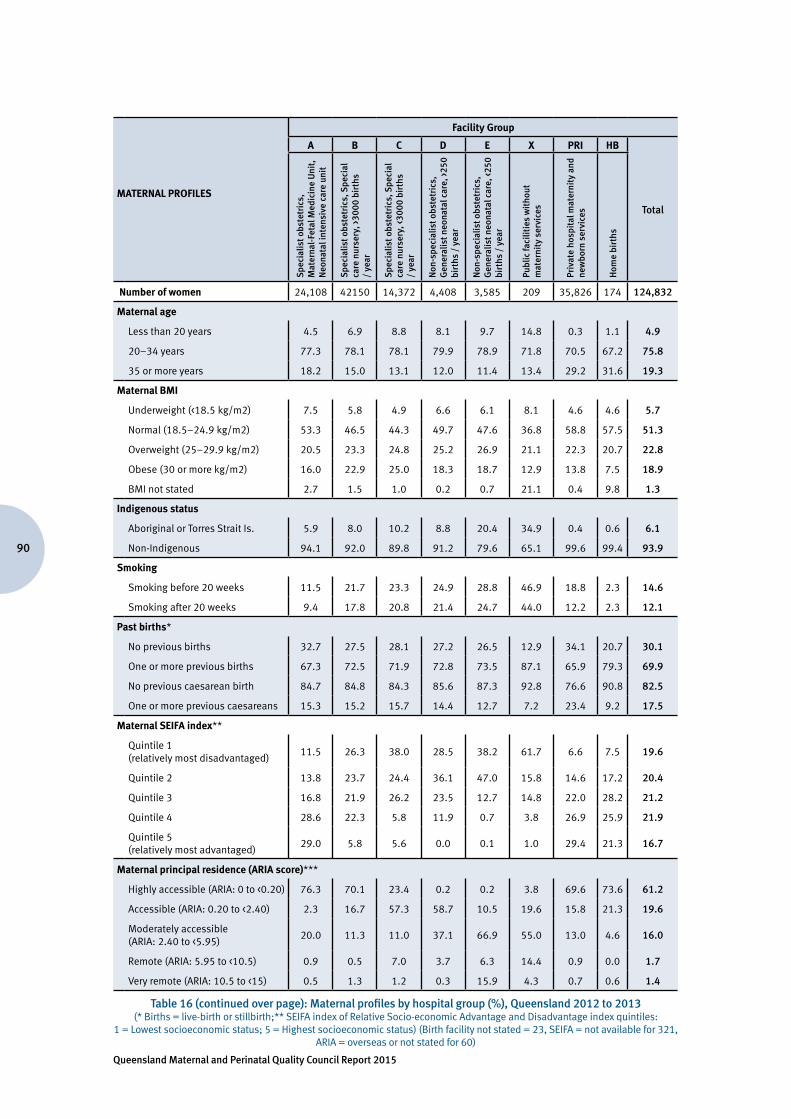
Queensland Maternal and Perinatal Quality Council Report 2015
90
MATERNAL PROFILES
Facility Group
A B C D E X PRI HB
Total
Spe
cial
ist o
bste
tric
s,
Mat
erna
l-Fe
tal M
edic
ine
Uni
t,
Neo
nata
l int
ensi
ve c
are
unit
Spe
cial
ist o
bste
tric
s, S
peci
al
care
nur
sery
, >30
00 b
irth
s /
year
Spe
cial
ist o
bste
tric
s, S
peci
al
care
nur
sery
, <30
00 b
irth
s /
year
Non
-spe
cial
ist o
bste
tric
s,
Gen
eral
ist n
eona
tal c
are,
>25
0 bi
rths
/ y
ear
Non
-spe
cial
ist o
bste
tric
s,
Gen
eral
ist n
eona
tal c
are,
<25
0 bi
rths
/ y
ear
Publ
ic fa
cilit
ies
wit
hout
m
ater
nity
ser
vice
s
Priv
ate
hosp
ital
mat
erni
ty a
nd
new
born
ser
vice
s
Hom
e bi
rths
Number of women 24,108 42150 14,372 4,408 3,585 209 35,826 174 124,832
Maternal age
Less than 20 years 4.5 6.9 8.8 8.1 9.7 14.8 0.3 1.1 4.9
20–34 years 77.3 78.1 78.1 79.9 78.9 71.8 70.5 67.2 75.8
35 or more years 18.2 15.0 13.1 12.0 11.4 13.4 29.2 31.6 19.3
Maternal BMI
Underweight (<18.5 kg/m2) 7.5 5.8 4.9 6.6 6.1 8.1 4.6 4.6 5.7
Normal (18.5–24.9 kg/m2) 53.3 46.5 44.3 49.7 47.6 36.8 58.8 57.5 51.3
Overweight (25–29.9 kg/m2) 20.5 23.3 24.8 25.2 26.9 21.1 22.3 20.7 22.8
Obese (30 or more kg/m2) 16.0 22.9 25.0 18.3 18.7 12.9 13.8 7.5 18.9
BMI not stated 2.7 1.5 1.0 0.2 0.7 21.1 0.4 9.8 1.3
Indigenous status
Aboriginal or Torres Strait Is. 5.9 8.0 10.2 8.8 20.4 34.9 0.4 0.6 6.1
Non-Indigenous 94.1 92.0 89.8 91.2 79.6 65.1 99.6 99.4 93.9
Smoking
Smoking before 20 weeks 11.5 21.7 23.3 24.9 28.8 46.9 18.8 2.3 14.6
Smoking after 20 weeks 9.4 17.8 20.8 21.4 24.7 44.0 12.2 2.3 12.1
Past births*
No previous births 32.7 27.5 28.1 27.2 26.5 12.9 34.1 20.7 30.1
One or more previous births 67.3 72.5 71.9 72.8 73.5 87.1 65.9 79.3 69.9
No previous caesarean birth 84.7 84.8 84.3 85.6 87.3 92.8 76.6 90.8 82.5
One or more previous caesareans 15.3 15.2 15.7 14.4 12.7 7.2 23.4 9.2 17.5
Maternal SEIFA index**
Quintile 1 (relatively most disadvantaged)
11.5 26.3 38.0 28.5 38.2 61.7 6.6 7.5 19.6
Quintile 2 13.8 23.7 24.4 36.1 47.0 15.8 14.6 17.2 20.4
Quintile 3 16.8 21.9 26.2 23.5 12.7 14.8 22.0 28.2 21.2
Quintile 4 28.6 22.3 5.8 11.9 0.7 3.8 26.9 25.9 21.9
Quintile 5 (relatively most advantaged)
29.0 5.8 5.6 0.0 0.1 1.0 29.4 21.3 16.7
Maternal principal residence (ARIA score)***
Highly accessible (ARIA: 0 to <0.20) 76.3 70.1 23.4 0.2 0.2 3.8 69.6 73.6 61.2
Accessible (ARIA: 0.20 to <2.40) 2.3 16.7 57.3 58.7 10.5 19.6 15.8 21.3 19.6
Moderately accessible (ARIA: 2.40 to <5.95)
20.0 11.3 11.0 37.1 66.9 55.0 13.0 4.6 16.0
Remote (ARIA: 5.95 to <10.5) 0.9 0.5 7.0 3.7 6.3 14.4 0.9 0.0 1.7
Very remote (ARIA: 10.5 to <15) 0.5 1.3 1.2 0.3 15.9 4.3 0.7 0.6 1.4
Table 16 (continued over page): Maternal profiles by hospital group (%), Queensland 2012 to 2013 (* Births = live-birth or stillbirth;** SEIFA index of Relative Socio-economic Advantage and Disadvantage index quintiles:
1 = Lowest socioeconomic status; 5 = Highest socioeconomic status) (Birth facility not stated = 23, SEIFA = not available for 321, ARIA = overseas or not stated for 60)
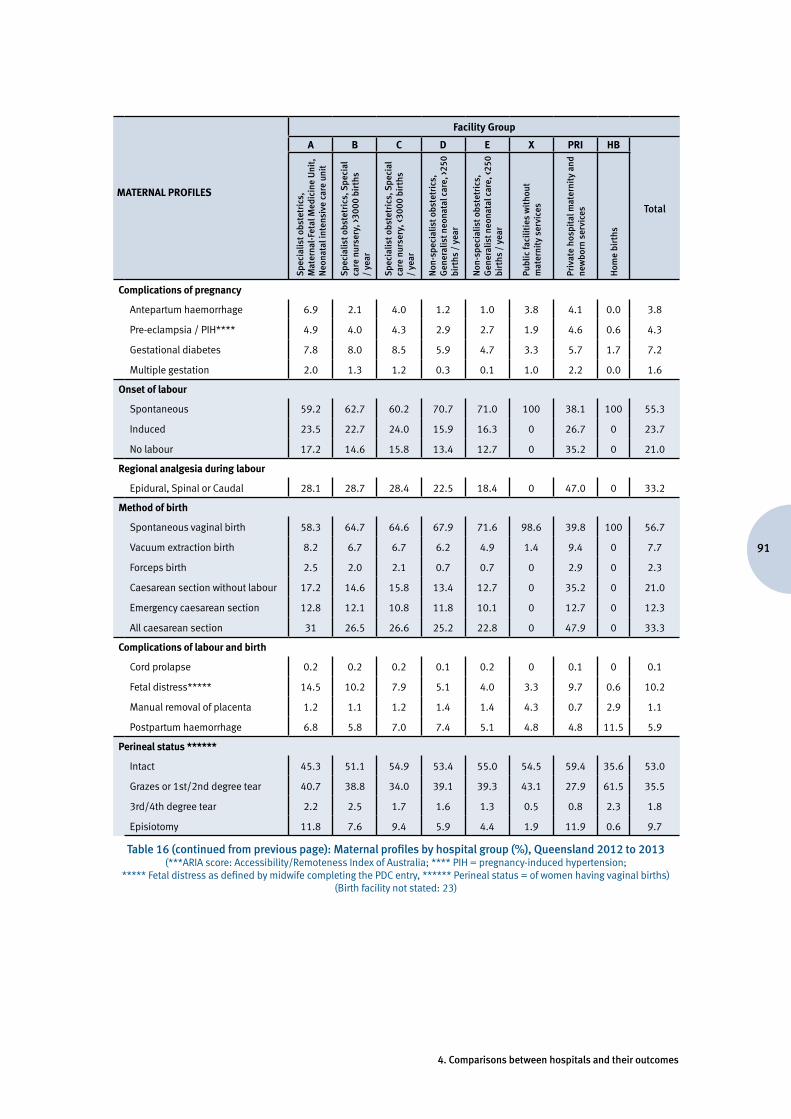
91
4. Comparisons between hospitals and their outcomes
MATERNAL PROFILES
Facility Group
A B C D E X PRI HB
Total
Spe
cial
ist o
bste
tric
s,
Mat
erna
l-Fe
tal M
edic
ine
Uni
t,
Neo
nata
l int
ensi
ve c
are
unit
Spe
cial
ist o
bste
tric
s, S
peci
al
care
nur
sery
, >30
00 b
irth
s /
year
Spe
cial
ist o
bste
tric
s, S
peci
al
care
nur
sery
, <30
00 b
irth
s /
year
Non
-spe
cial
ist o
bste
tric
s,
Gen
eral
ist n
eona
tal c
are,
>25
0 bi
rths
/ y
ear
Non
-spe
cial
ist o
bste
tric
s,
Gen
eral
ist n
eona
tal c
are,
<25
0 bi
rths
/ y
ear
Publ
ic fa
cilit
ies
wit
hout
m
ater
nity
ser
vice
s
Priv
ate
hosp
ital
mat
erni
ty a
nd
new
born
ser
vice
s
Hom
e bi
rths
Complications of pregnancy
Antepartum haemorrhage 6.9 2.1 4.0 1.2 1.0 3.8 4.1 0.0 3.8
Pre-eclampsia / PIH**** 4.9 4.0 4.3 2.9 2.7 1.9 4.6 0.6 4.3
Gestational diabetes 7.8 8.0 8.5 5.9 4.7 3.3 5.7 1.7 7.2
Multiple gestation 2.0 1.3 1.2 0.3 0.1 1.0 2.2 0.0 1.6
Onset of labour
Spontaneous 59.2 62.7 60.2 70.7 71.0 100 38.1 100 55.3
Induced 23.5 22.7 24.0 15.9 16.3 0 26.7 0 23.7
No labour 17.2 14.6 15.8 13.4 12.7 0 35.2 0 21.0
Regional analgesia during labour
Epidural, Spinal or Caudal 28.1 28.7 28.4 22.5 18.4 0 47.0 0 33.2
Method of birth
Spontaneous vaginal birth 58.3 64.7 64.6 67.9 71.6 98.6 39.8 100 56.7
Vacuum extraction birth 8.2 6.7 6.7 6.2 4.9 1.4 9.4 0 7.7
Forceps birth 2.5 2.0 2.1 0.7 0.7 0 2.9 0 2.3
Caesarean section without labour 17.2 14.6 15.8 13.4 12.7 0 35.2 0 21.0
Emergency caesarean section 12.8 12.1 10.8 11.8 10.1 0 12.7 0 12.3
All caesarean section 31 26.5 26.6 25.2 22.8 0 47.9 0 33.3
Complications of labour and birth
Cord prolapse 0.2 0.2 0.2 0.1 0.2 0 0.1 0 0.1
Fetal distress***** 14.5 10.2 7.9 5.1 4.0 3.3 9.7 0.6 10.2
Manual removal of placenta 1.2 1.1 1.2 1.4 1.4 4.3 0.7 2.9 1.1
Postpartum haemorrhage 6.8 5.8 7.0 7.4 5.1 4.8 4.8 11.5 5.9
Perineal status ******
Intact 45.3 51.1 54.9 53.4 55.0 54.5 59.4 35.6 53.0
Grazes or 1st/2nd degree tear 40.7 38.8 34.0 39.1 39.3 43.1 27.9 61.5 35.5
3rd/4th degree tear 2.2 2.5 1.7 1.6 1.3 0.5 0.8 2.3 1.8
Episiotomy 11.8 7.6 9.4 5.9 4.4 1.9 11.9 0.6 9.7
Table 16 (continued from previous page): Maternal profiles by hospital group (%), Queensland 2012 to 2013 (***ARIA score: Accessibility/Remoteness Index of Australia; **** PIH = pregnancy-induced hypertension;
***** Fetal distress as defined by midwife completing the PDC entry, ****** Perineal status = of women having vaginal births)(Birth facility not stated: 23)
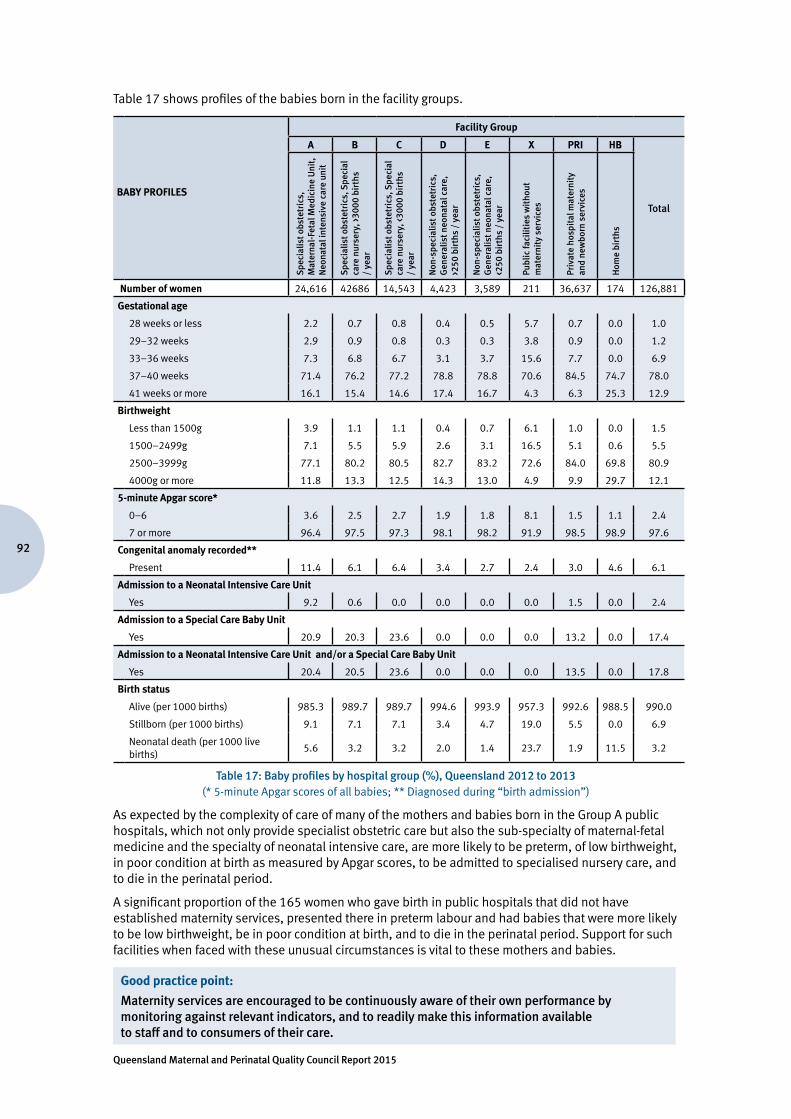
Queensland Maternal and Perinatal Quality Council Report 2015
92
Table 17 shows profiles of the babies born in the facility groups.
BABY PROFILES
Facility Group
A B C D E X PRI HB
Total
Spe
cial
ist o
bste
tric
s,
Mat
erna
l-Fe
tal M
edic
ine
Uni
t,
Neo
nata
l int
ensi
ve c
are
unit
Spe
cial
ist o
bste
tric
s, S
peci
al
care
nur
sery
, >30
00 b
irth
s /
year
Spe
cial
ist o
bste
tric
s, S
peci
al
care
nur
sery
, <30
00 b
irth
s /
year
Non
-spe
cial
ist o
bste
tric
s,
Gen
eral
ist n
eona
tal c
are,
>2
50 b
irth
s /
year
Non
-spe
cial
ist o
bste
tric
s,
Gen
eral
ist n
eona
tal c
are,
<2
50 b
irth
s /
year
Publ
ic fa
cilit
ies
wit
hout
m
ater
nity
ser
vice
s
Priv
ate
hosp
ital
mat
erni
ty
and
new
born
ser
vice
s
Hom
e bi
rths
Number of women 24,616 42686 14,543 4,423 3,589 211 36,637 174 126,881
Gestational age
28 weeks or less 2.2 0.7 0.8 0.4 0.5 5.7 0.7 0.0 1.0
29–32 weeks 2.9 0.9 0.8 0.3 0.3 3.8 0.9 0.0 1.2
33–36 weeks 7.3 6.8 6.7 3.1 3.7 15.6 7.7 0.0 6.9
37–40 weeks 71.4 76.2 77.2 78.8 78.8 70.6 84.5 74.7 78.0
41 weeks or more 16.1 15.4 14.6 17.4 16.7 4.3 6.3 25.3 12.9
Birthweight
Less than 1500g 3.9 1.1 1.1 0.4 0.7 6.1 1.0 0.0 1.5
1500–2499g 7.1 5.5 5.9 2.6 3.1 16.5 5.1 0.6 5.5
2500–3999g 77.1 80.2 80.5 82.7 83.2 72.6 84.0 69.8 80.9
4000g or more 11.8 13.3 12.5 14.3 13.0 4.9 9.9 29.7 12.1
5-minute Apgar score*
0–6 3.6 2.5 2.7 1.9 1.8 8.1 1.5 1.1 2.4
7 or more 96.4 97.5 97.3 98.1 98.2 91.9 98.5 98.9 97.6
Congenital anomaly recorded**
Present 11.4 6.1 6.4 3.4 2.7 2.4 3.0 4.6 6.1
Admission to a Neonatal Intensive Care Unit
Yes 9.2 0.6 0.0 0.0 0.0 0.0 1.5 0.0 2.4
Admission to a Special Care Baby Unit
Yes 20.9 20.3 23.6 0.0 0.0 0.0 13.2 0.0 17.4
Admission to a Neonatal Intensive Care Unit and/or a Special Care Baby Unit
Yes 20.4 20.5 23.6 0.0 0.0 0.0 13.5 0.0 17.8
Birth status
Alive (per 1000 births) 985.3 989.7 989.7 994.6 993.9 957.3 992.6 988.5 990.0
Stillborn (per 1000 births) 9.1 7.1 7.1 3.4 4.7 19.0 5.5 0.0 6.9
Neonatal death (per 1000 live births)
5.6 3.2 3.2 2.0 1.4 23.7 1.9 11.5 3.2
Table 17: Baby profiles by hospital group (%), Queensland 2012 to 2013(* 5-minute Apgar scores of all babies; ** Diagnosed during “birth admission”)
As expected by the complexity of care of many of the mothers and babies born in the Group A public hospitals, which not only provide specialist obstetric care but also the sub-specialty of maternal-fetal medicine and the specialty of neonatal intensive care, are more likely to be preterm, of low birthweight, in poor condition at birth as measured by Apgar scores, to be admitted to specialised nursery care, and to die in the perinatal period.
A significant proportion of the 165 women who gave birth in public hospitals that did not have established maternity services, presented there in preterm labour and had babies that were more likely to be low birthweight, be in poor condition at birth, and to die in the perinatal period. Support for such facilities when faced with these unusual circumstances is vital to these mothers and babies.
Good practice point:
Maternity services are encouraged to be continuously aware of their own performance by monitoring against relevant indicators, and to readily make this information available to staff and to consumers of their care.
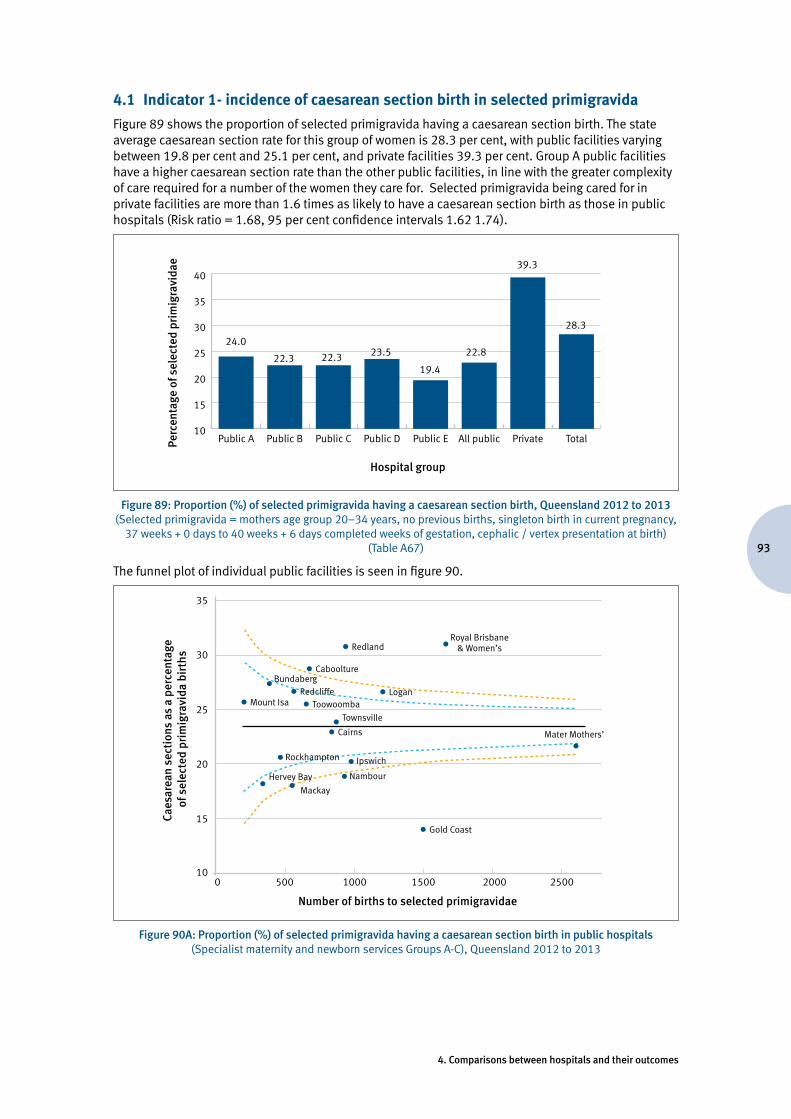
93
4. Comparisons between hospitals and their outcomes
4.1 Indicator 1- incidence of caesarean section birth in selected primigravida
Figure 89 shows the proportion of selected primigravida having a caesarean section birth. The state average caesarean section rate for this group of women is 28.3 per cent, with public facilities varying between 19.8 per cent and 25.1 per cent, and private facilities 39.3 per cent. Group A public facilities have a higher caesarean section rate than the other public facilities, in line with the greater complexity of care required for a number of the women they care for. Selected primigravida being cared for in private facilities are more than 1.6 times as likely to have a caesarean section birth as those in public hospitals (Risk ratio = 1.68, 95 per cent confidence intervals 1.62 1.74).
10
15
20
25
30
35
40
TotalPrivateAll publicPublic EPublic DPublic CPublic BPublic APerc
enta
ge o
f sel
ecte
d pr
imig
ravi
dae
Hospital group
24.0
22.3 22.3 22.823.5
19.4
28.3
39.3
Figure 89: Proportion (%) of selected primigravida having a caesarean section birth, Queensland 2012 to 2013(Selected primigravida = mothers age group 20–34 years, no previous births, singleton birth in current pregnancy,
37 weeks + 0 days to 40 weeks + 6 days completed weeks of gestation, cephalic / vertex presentation at birth) (Table A67)
The funnel plot of individual public facilities is seen in figure 90.
Caes
area
n se
ctio
ns a
s a
perc
enta
ge
of s
elec
ted
prim
igra
vida
bir
ths
Number of births to selected primigravidae
0 500
Nambour
Mackay
10
15
20
25
30
35
1000 1500 2000 2500
Gold Coast
Mater Mothers’
Royal Brisbane& Women’s
Townsville
Cairns
ToowoombaRedcliffe Logan
Caboolture
Mount Isa
Redland
Rockhampton
Bundaberg
Ipswich
Hervey Bay
Figure 90A: Proportion (%) of selected primigravida having a caesarean section birth in public hospitals(Specialist maternity and newborn services Groups A-C), Queensland 2012 to 2013
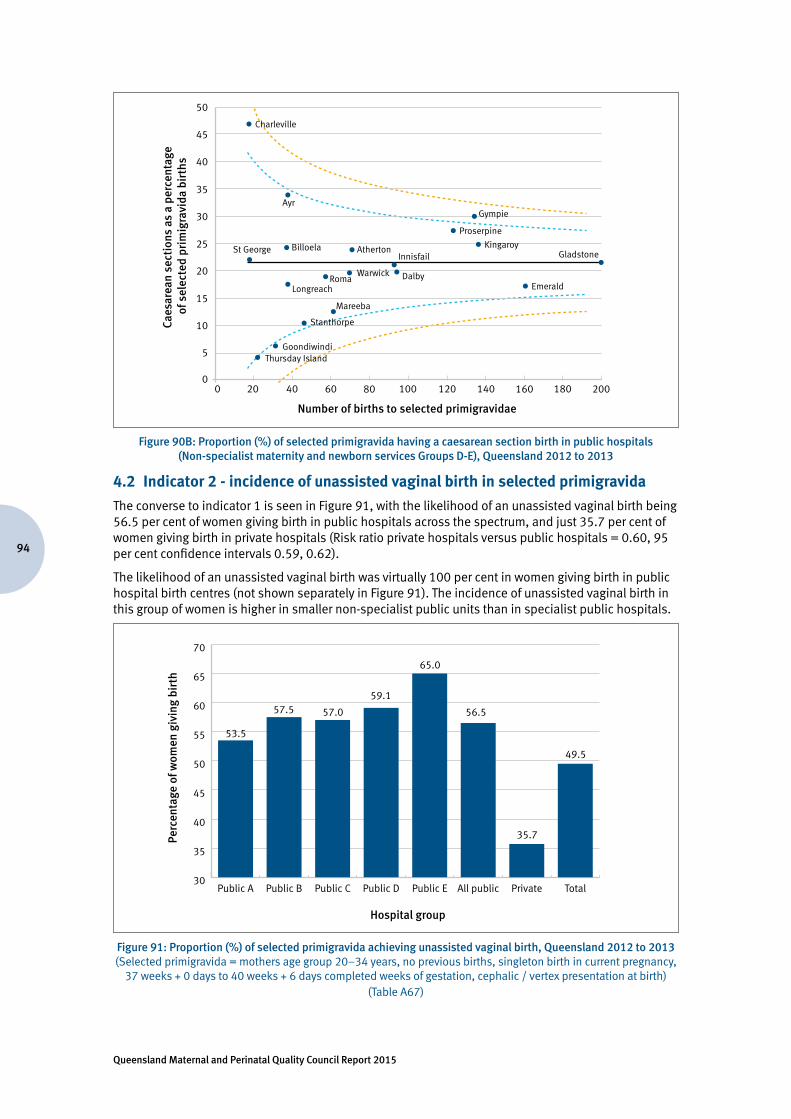
Queensland Maternal and Perinatal Quality Council Report 2015
94
Caes
area
n se
ctio
ns a
s a
perc
enta
ge
of s
elec
ted
prim
igra
vida
bir
ths
Number of births to selected primigravidae
0 20
Stanthorpe
Mareeba
LongreachRoma
St George
0
5
10
15
20
25
30
35
40
45
50
40 60 80 100 120 140 160 180 200
Emerald
GladstoneKingaroy
Proserpine
Gympie
Charleville
Ayr
AthertonBilloela
Dalby
Innisfail
Warwick
GoondiwindiThursday Island
Figure 90B: Proportion (%) of selected primigravida having a caesarean section birth in public hospitals (Non-specialist maternity and newborn services Groups D-E), Queensland 2012 to 2013
4.2 Indicator 2 - incidence of unassisted vaginal birth in selected primigravida
The converse to indicator 1 is seen in Figure 91, with the likelihood of an unassisted vaginal birth being 56.5 per cent of women giving birth in public hospitals across the spectrum, and just 35.7 per cent of women giving birth in private hospitals (Risk ratio private hospitals versus public hospitals = 0.60, 95 per cent confidence intervals 0.59, 0.62).
The likelihood of an unassisted vaginal birth was virtually 100 per cent in women giving birth in public hospital birth centres (not shown separately in Figure 91). The incidence of unassisted vaginal birth in this group of women is higher in smaller non-specialist public units than in specialist public hospitals.
Perc
enta
ge o
f wom
en g
ivin
g bi
rth
Hospital group
30
35
40
45
50
55
60
65
70
TotalPrivateAll publicPublic EPublic DPublic CPublic BPublic A
53.5
57.5 57.0 56.5
59.1
65.0
49.5
35.7
Figure 91: Proportion (%) of selected primigravida achieving unassisted vaginal birth, Queensland 2012 to 2013(Selected primigravida = mothers age group 20–34 years, no previous births, singleton birth in current pregnancy,
37 weeks + 0 days to 40 weeks + 6 days completed weeks of gestation, cephalic / vertex presentation at birth)(Table A67)
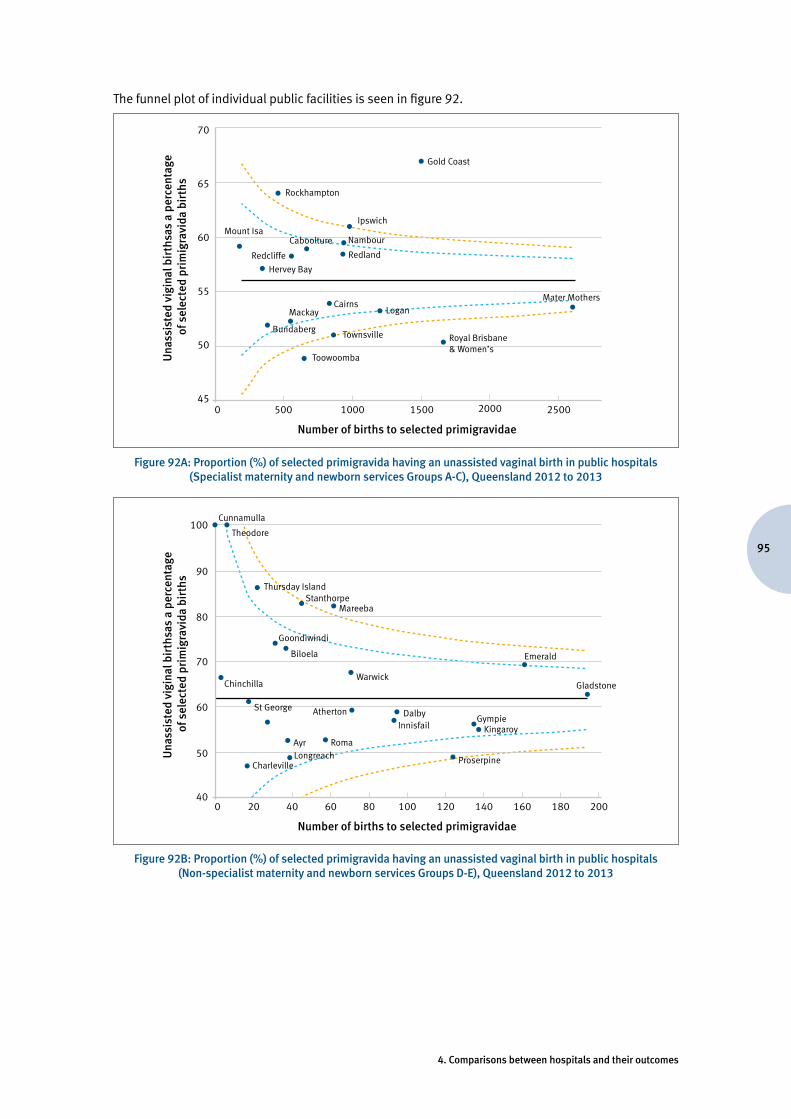
95
4. Comparisons between hospitals and their outcomes
The funnel plot of individual public facilities is seen in figure 92.
Una
ssis
ted
vigi
nal b
irth
sas
a pe
rcen
tage
of
sel
ecte
d pr
imig
ravi
da b
irth
s
Number of births to selected primigravidae
0 500
Mackay
Bundaberg
Cairns
Caboolture
Rockhampton
Mount Isa
45
50
55
60
65
70
1000 1500 2000 2500
Royal Brisbane& Women’s
Mater Mothers
Nambour
Redland
Gold Coast
Redcliffe
Hervey Bay
Logan
Toowoomba
Townsville
Ipswich
Figure 92A: Proportion (%) of selected primigravida having an unassisted vaginal birth in public hospitals (Specialist maternity and newborn services Groups A-C), Queensland 2012 to 2013
Una
ssis
ted
vigi
nal b
irth
sas
a pe
rcen
tage
of
sel
ecte
d pr
imig
ravi
da b
irth
s
Number of births to selected primigravidae
0 20
RomaAyr
CharlevilleLongreach
Chinchilla
St George
40
50
60
70
80
90
100
40 60 80 100 120 140 160 180 200
Cunnamulla
Theodore
Biloela
Goondiwindi
Thursday IslandStanthorpe
Mareeba
Warwick
DalbyGympie
Kingaroy
Gladstone
Emerald
Proserpine
Innisfail
Atherton
Figure 92B: Proportion (%) of selected primigravida having an unassisted vaginal birth in public hospitals (Non-specialist maternity and newborn services Groups D-E), Queensland 2012 to 2013
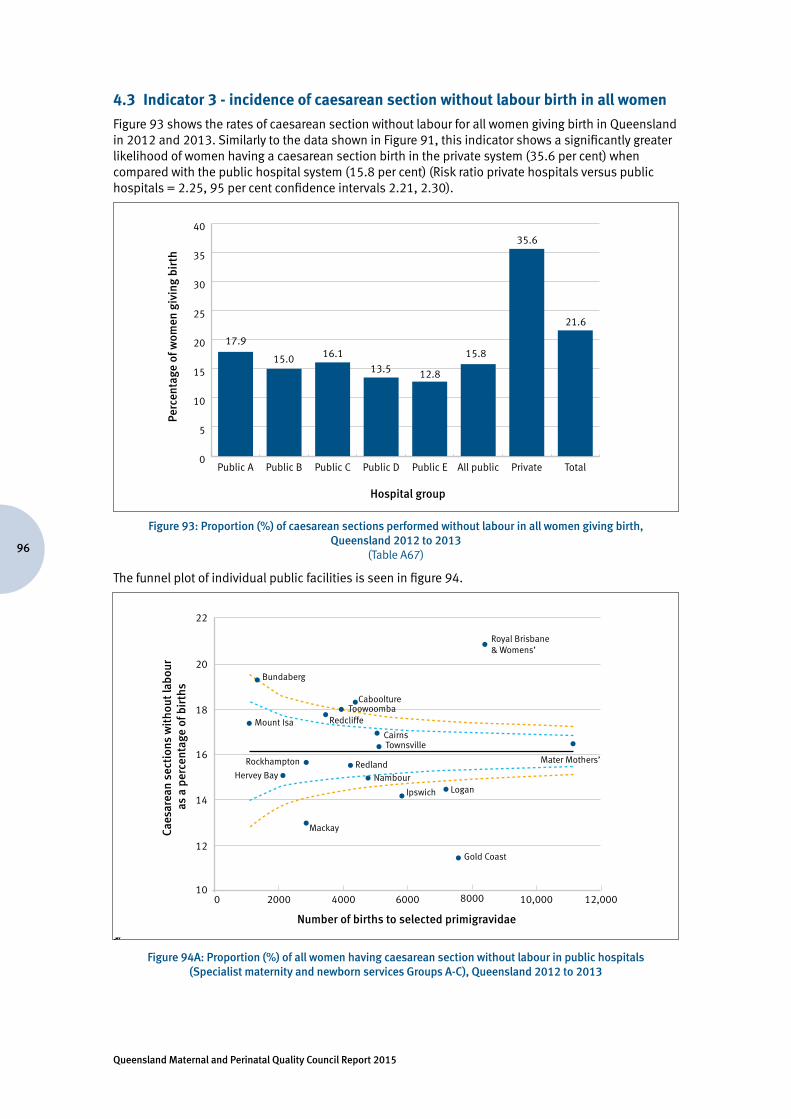
Queensland Maternal and Perinatal Quality Council Report 2015
96
4.3 Indicator 3 - incidence of caesarean section without labour birth in all women
Figure 93 shows the rates of caesarean section without labour for all women giving birth in Queensland in 2012 and 2013. Similarly to the data shown in Figure 91, this indicator shows a significantly greater likelihood of women having a caesarean section birth in the private system (35.6 per cent) when compared with the public hospital system (15.8 per cent) (Risk ratio private hospitals versus public hospitals = 2.25, 95 per cent confidence intervals 2.21, 2.30).
Perc
enta
ge o
f wom
en g
ivin
g bi
rth
Hospital group
0
5
10
15
20
25
30
35
40
TotalPrivateAll publicPublic EPublic DPublic CPublic BPublic A
17.9
15.0 16.1 15.8
13.5 12.8
21.6
35.6
Figure 93: Proportion (%) of caesarean sections performed without labour in all women giving birth, Queensland 2012 to 2013
(Table A67)
The funnel plot of individual public facilities is seen in figure 94.
94.
Caes
area
n se
ctio
ns w
itho
ut la
bour
as
a p
erce
ntag
e of
bir
ths
Number of births to selected primigravidae
0 200010
12
14
16
18
20
22
4000 6000 8000 10,000 12,000
Rockhampton
Mackay
Redland
Bundaberg
Toowoomba
Cairns
Gold Coast
Logan
Mater Mothers’
Royal Brisbane& Womens’
Ipswich
Nambour
Townsville
Hervey Bay
Caboolture
RedcliffeMount Isa
Figure 94A: Proportion (%) of all women having caesarean section without labour in public hospitals (Specialist maternity and newborn services Groups A-C), Queensland 2012 to 2013
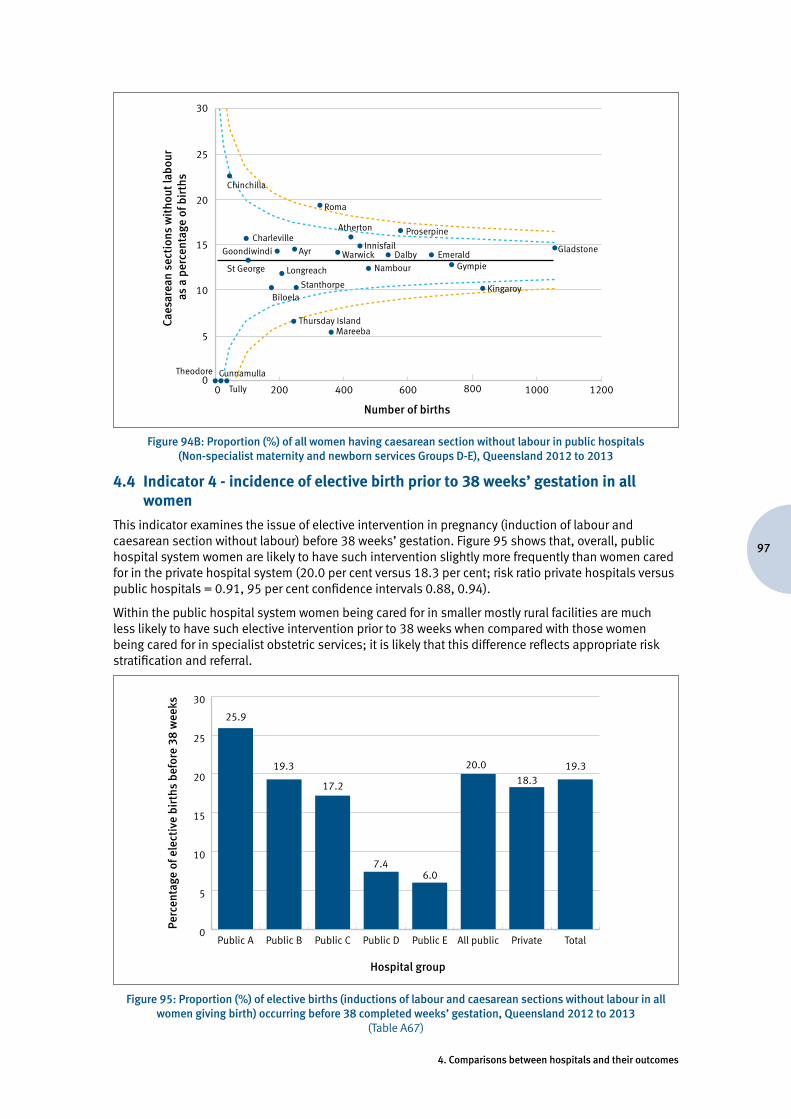
97
4. Comparisons between hospitals and their outcomes
Caes
area
n se
ctio
ns w
itho
ut la
bour
as
a p
erce
ntag
e of
bir
ths
Number of births
0 2000
5
10
15
20
25
30
400 600 800 1000 1200
Thursday Island
Tully
CunnamullaTheodore
Mareeba
Warwick Dalby
Chinchilla
Kingaroy
Gladstone
Biloela
Nambour
ProserpineAtherton
Innisfail
LongreachSt George
Stanthorpe
EmeraldGympie
Roma
Charleville
Goondiwindi Ayr
Figure 94B: Proportion (%) of all women having caesarean section without labour in public hospitals (Non-specialist maternity and newborn services Groups D-E), Queensland 2012 to 2013
4.4 Indicator 4 - incidence of elective birth prior to 38 weeks’ gestation in all women
This indicator examines the issue of elective intervention in pregnancy (induction of labour and caesarean section without labour) before 38 weeks’ gestation. Figure 95 shows that, overall, public hospital system women are likely to have such intervention slightly more frequently than women cared for in the private hospital system (20.0 per cent versus 18.3 per cent; risk ratio private hospitals versus public hospitals = 0.91, 95 per cent confidence intervals 0.88, 0.94).
Within the public hospital system women being cared for in smaller mostly rural facilities are much less likely to have such elective intervention prior to 38 weeks when compared with those women being cared for in specialist obstetric services; it is likely that this difference reflects appropriate risk stratification and referral.
Perc
enta
ge o
f ele
ctiv
e bi
rths
bef
ore
38 w
eeks
Hospital group
0
5
10
15
20
25
30
TotalPrivateAll publicPublic EPublic DPublic CPublic BPublic A
25.9
19.3
17.2
20.0
7.46.0
19.318.3
Figure 95: Proportion (%) of elective births (inductions of labour and caesarean sections without labour in all women giving birth) occurring before 38 completed weeks’ gestation, Queensland 2012 to 2013
(Table A67)
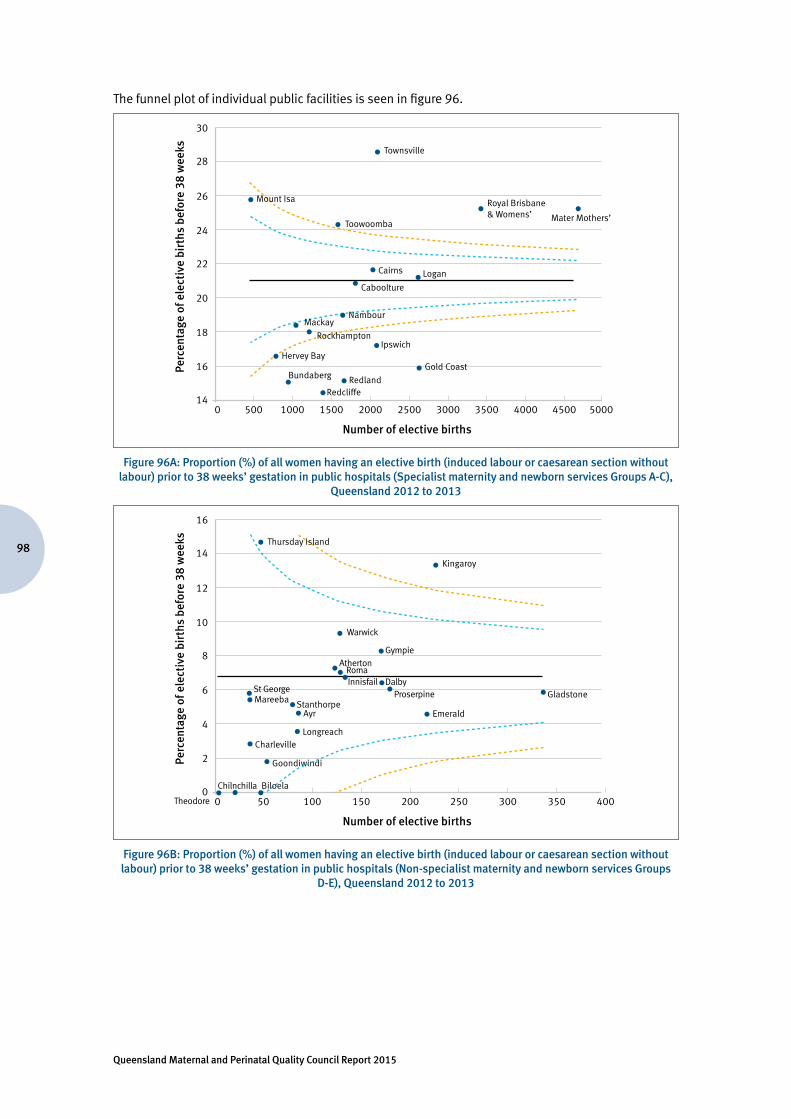
Queensland Maternal and Perinatal Quality Council Report 2015
98
The funnel plot of individual public facilities is seen in figure 96.
Perc
enta
ge o
f ele
ctiv
e bi
rths
bef
ore
38 w
eeks
Number of elective births
0 50014
16
18
20
22
24
26
28
30
1000 1500 2000 2500 3000 3500 4000 4500 5000
Rockhampton
Mackay
Redland
Caboolture
Bundaberg
Toowoomba
Cairns
Gold Coast
Logan
Mater Mothers’
Royal Brisbane& Womens’
Ipswich
Nambour
Townsville
Hervey Bay
Redcliffe
Mount Isa
Figure 96A: Proportion (%) of all women having an elective birth (induced labour or caesarean section without labour) prior to 38 weeks’ gestation in public hospitals (Specialist maternity and newborn services Groups A-C),
Queensland 2012 to 2013
Perc
enta
ge o
f ele
ctiv
e bi
rths
bef
ore
38 w
eeks
Number of elective births
0 500
2
4
6
8
10
12
14
16
100 150 200 250 300 350 400
Emerald
ProserpineDalby
Gympie
Gladstone
Goondiwindi
Chilnchilla
Theodore
CharlevilleLongreach
AyrStanthorpeMareeba
Kingaroy
St George
Warwick
AthertonRomaInnisfail
Biloela
Thursday Island
Figure 96B: Proportion (%) of all women having an elective birth (induced labour or caesarean section without labour) prior to 38 weeks’ gestation in public hospitals (Non-specialist maternity and newborn services Groups
D-E), Queensland 2012 to 2013
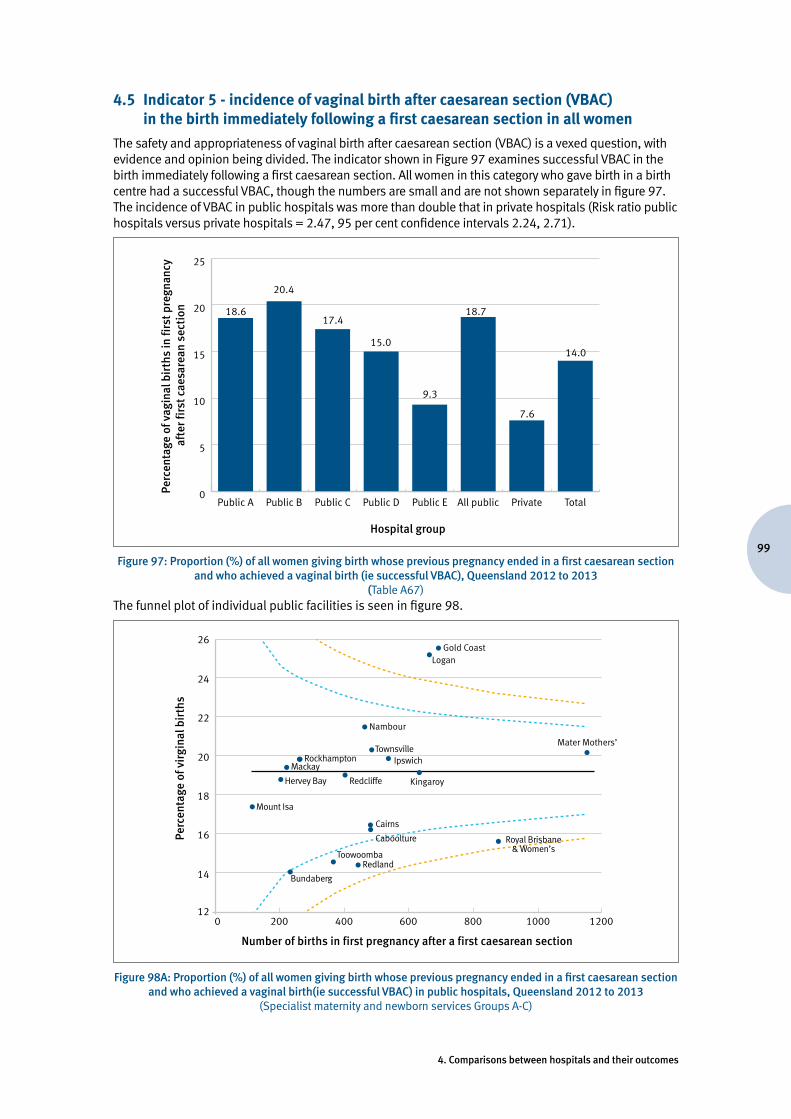
99
4. Comparisons between hospitals and their outcomes
4.5 Indicator 5 - incidence of vaginal birth after caesarean section (VBAC) in the birth immediately following a first caesarean section in all women
The safety and appropriateness of vaginal birth after caesarean section (VBAC) is a vexed question, with evidence and opinion being divided. The indicator shown in Figure 97 examines successful VBAC in the birth immediately following a first caesarean section. All women in this category who gave birth in a birth centre had a successful VBAC, though the numbers are small and are not shown separately in figure 97. The incidence of VBAC in public hospitals was more than double that in private hospitals (Risk ratio public hospitals versus private hospitals = 2.47, 95 per cent confidence intervals 2.24, 2.71).
Perc
enta
ge o
f vag
inal
bir
ths
in fi
rst p
regn
ancy
af
ter f
irst
cae
sare
an s
ecti
on
Hospital group
0
5
10
15
20
25
TotalPrivateAll publicPublic EPublic DPublic CPublic BPublic A
18.6
20.4
17.418.7
15.0
9.3
14.0
7.6
Figure 97: Proportion (%) of all women giving birth whose previous pregnancy ended in a first caesarean section and who achieved a vaginal birth (ie successful VBAC), Queensland 2012 to 2013
(Table A67)The funnel plot of individual public facilities is seen in figure 98.
Perc
enta
ge o
f vir
gina
l bir
ths
Number of births in first pregnancy after a first caesarean section
0 20012
14
16
18
20
22
24
26
400 600 800 1000 1200
TownsvilleIpswich
Mater Mothers’
Hervey Bay Redcliffe
Cairns
Mount Isa
Toowoomba
Bundaberg
Redland
Royal Brisbane& Women’s
Mackay
Gold Coast
Kingaroy
Rockhampton
Nambour
Logan
Caboolture
Figure 98A: Proportion (%) of all women giving birth whose previous pregnancy ended in a first caesarean section and who achieved a vaginal birth(ie successful VBAC) in public hospitals, Queensland 2012 to 2013
(Specialist maternity and newborn services Groups A-C)
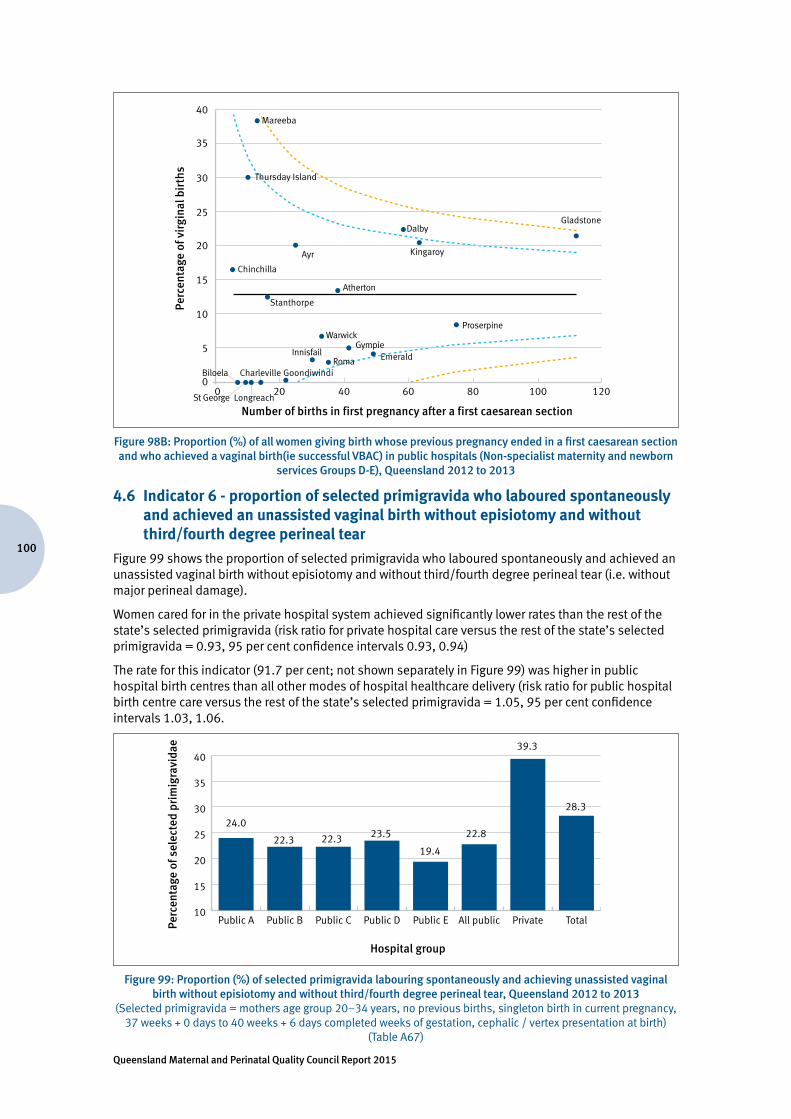
Queensland Maternal and Perinatal Quality Council Report 2015
100
Perc
enta
ge o
f vir
gina
l bir
ths
Number of births in first pregnancy after a first caesarean section
0 200
5
10
15
20
25
30
35
40
40 60 80 100 120
Emerald
Proserpine
DalbyGladstone
GoondiwindiCharleville
Longreach
Ayr
Stanthorpe
Mareeba
Kingaroy
Thursday Island
St George
Biloela
Warwick
Atherton
Innisfail
Chinchilla
Gympie
Roma
Figure 98B: Proportion (%) of all women giving birth whose previous pregnancy ended in a first caesarean section and who achieved a vaginal birth(ie successful VBAC) in public hospitals (Non-specialist maternity and newborn
services Groups D-E), Queensland 2012 to 2013
4.6 Indicator 6 - proportion of selected primigravida who laboured spontaneously and achieved an unassisted vaginal birth without episiotomy and without third/fourth degree perineal tear
Figure 99 shows the proportion of selected primigravida who laboured spontaneously and achieved an unassisted vaginal birth without episiotomy and without third/fourth degree perineal tear (i.e. without major perineal damage).
Women cared for in the private hospital system achieved significantly lower rates than the rest of the state’s selected primigravida (risk ratio for private hospital care versus the rest of the state’s selected primigravida = 0.93, 95 per cent confidence intervals 0.93, 0.94)
The rate for this indicator (91.7 per cent; not shown separately in Figure 99) was higher in public hospital birth centres than all other modes of hospital healthcare delivery (risk ratio for public hospital birth centre care versus the rest of the state’s selected primigravida = 1.05, 95 per cent confidence intervals 1.03, 1.06.
10
15
20
25
30
35
40
TotalPrivateAll publicPublic EPublic DPublic CPublic BPublic APerc
enta
ge o
f sel
ecte
d pr
imig
ravi
dae
Hospital group
24.0
22.3 22.3 22.823.5
19.4
28.3
39.3
Figure 99: Proportion (%) of selected primigravida labouring spontaneously and achieving unassisted vaginal birth without episiotomy and without third/fourth degree perineal tear, Queensland 2012 to 2013
(Selected primigravida = mothers age group 20–34 years, no previous births, singleton birth in current pregnancy, 37 weeks + 0 days to 40 weeks + 6 days completed weeks of gestation, cephalic / vertex presentation at birth)
(Table A67)
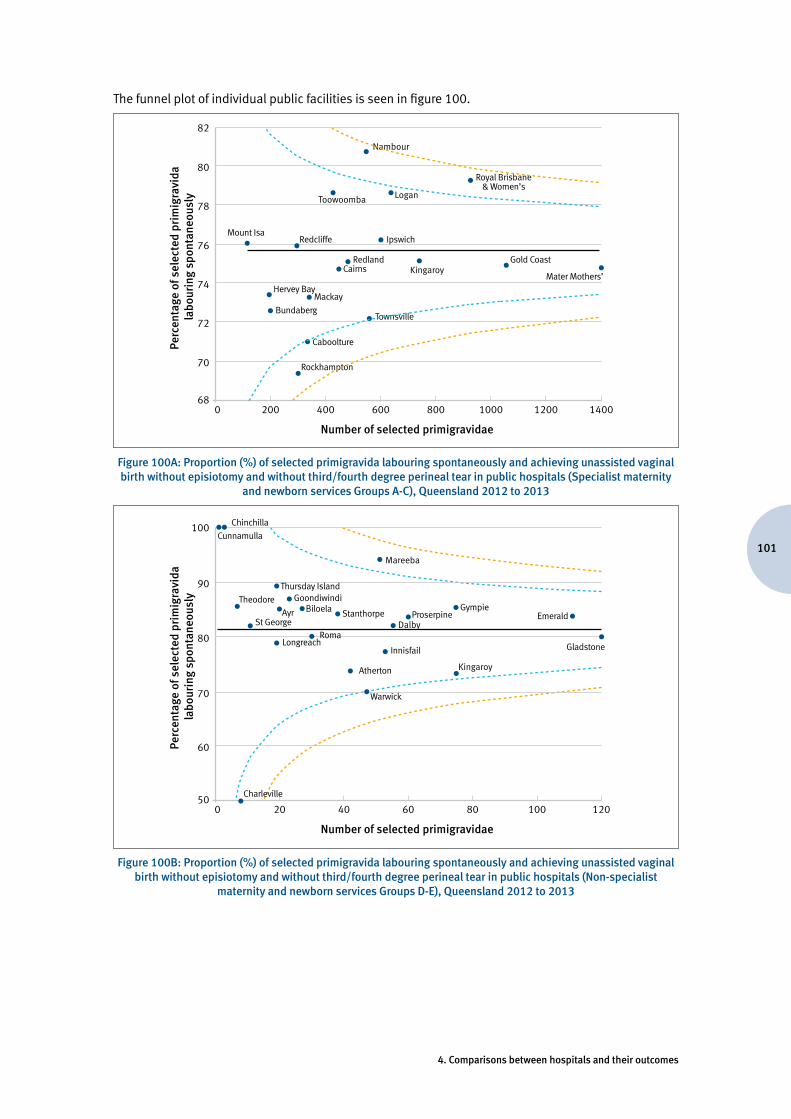
101
4. Comparisons between hospitals and their outcomes
The funnel plot of individual public facilities is seen in figure 100.
Perc
enta
ge o
f sel
ecte
d pr
imig
ravi
da
labo
urin
g sp
onta
neou
sly
Number of selected primigravidae
0 20068
70
72
74
76
78
80
82
400 600 800 1000 1200 1400
Townsville
Ipswich
Mater Mothers’
Gold Coast
Hervey Bay
Bundaberg
Cairns
Mount Isa
Caboolture
Rockhampton
Redland
Royal Brisbane& Women’s
Mackay
Kingaroy
Redcliffe
Logan
Nambour
Toowoomba
Figure 100A: Proportion (%) of selected primigravida labouring spontaneously and achieving unassisted vaginal birth without episiotomy and without third/fourth degree perineal tear in public hospitals (Specialist maternity
and newborn services Groups A-C), Queensland 2012 to 2013
Perc
enta
ge o
f sel
ecte
d pr
imig
ravi
da
labo
urin
g sp
onta
neou
sly
Number of selected primigravidae
0 2050
60
70
80
90
100
40 60 80 100 120
Warwick
Innisfail Gladstone
Emerald
Atherton
Gympie
Kingaroy
LongreachRoma
Stanthorpe ProserpineDalby
Mareeba
Thursday IslandGoondiwindi
Biloela
St George
Theodore
Cunnamulla
Chinchilla
Ayr
Charleville
Figure 100B: Proportion (%) of selected primigravida labouring spontaneously and achieving unassisted vaginal birth without episiotomy and without third/fourth degree perineal tear in public hospitals (Non-specialist
maternity and newborn services Groups D-E), Queensland 2012 to 2013
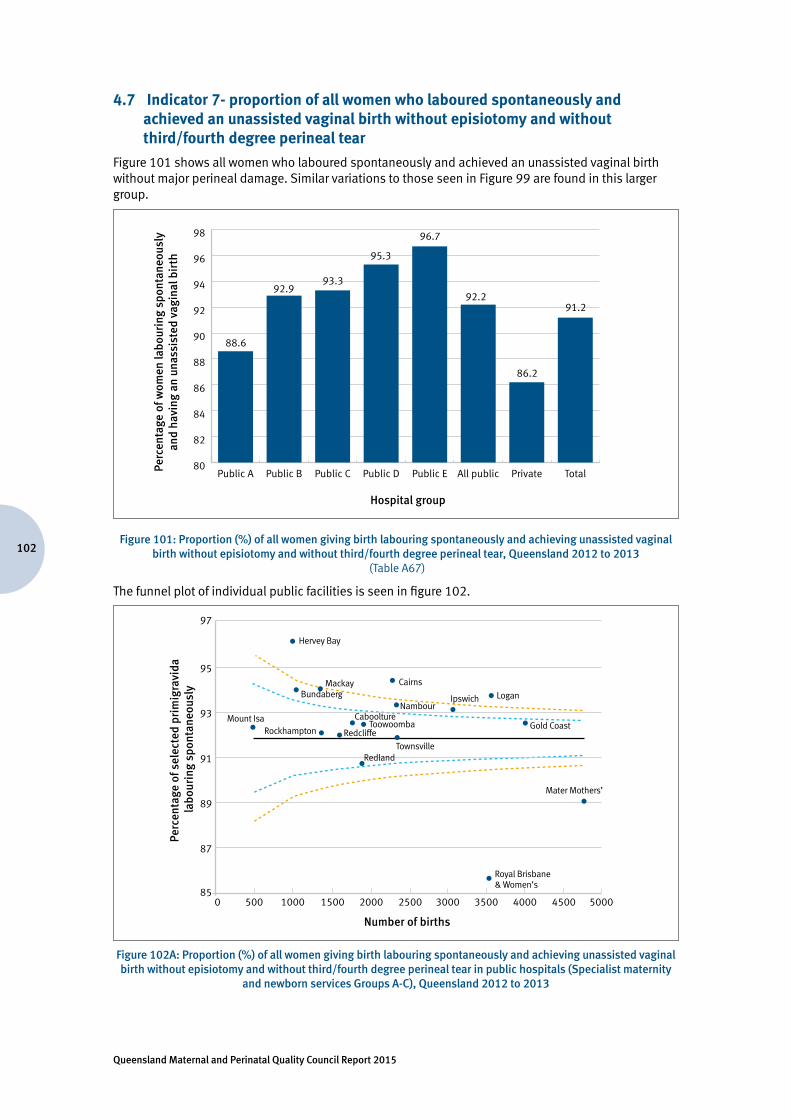
Queensland Maternal and Perinatal Quality Council Report 2015
102
4.7 Indicator 7- proportion of all women who laboured spontaneously and achieved an unassisted vaginal birth without episiotomy and without third/fourth degree perineal tear
Figure 101 shows all women who laboured spontaneously and achieved an unassisted vaginal birth without major perineal damage. Similar variations to those seen in Figure 99 are found in this larger group.
Hospital group
80
82
84
86
88
90
92
94
96
98
TotalPrivateAll publicPublic EPublic DPublic CPublic BPublic A
88.6
92.993.3
92.2
95.3
96.7
91.2
86.2
Perc
enta
ge o
f wom
en la
bour
ing
spon
tane
ousl
yan
d ha
ving
an
unas
sist
ed v
agin
al b
irth
Figure 101: Proportion (%) of all women giving birth labouring spontaneously and achieving unassisted vaginal birth without episiotomy and without third/fourth degree perineal tear, Queensland 2012 to 2013
(Table A67)
The funnel plot of individual public facilities is seen in figure 102.
Perc
enta
ge o
f sel
ecte
d pr
imig
ravi
da
labo
urin
g sp
onta
neou
sly
Number of births
085
87
89
91
93
95
97
3500 45004000 50001500 25002000500 1000 3000
Hervey Bay
MackayBundaberg
RedcliffeToowoomba
TownsvilleRedland
CabooltureNambour
Ipswich Logan
Gold Coast
Mater Mothers’
Royal Brisbane& Women’s
Mount IsaRockhampton
Cairns
Figure 102A: Proportion (%) of all women giving birth labouring spontaneously and achieving unassisted vaginal birth without episiotomy and without third/fourth degree perineal tear in public hospitals (Specialist maternity
and newborn services Groups A-C), Queensland 2012 to 2013
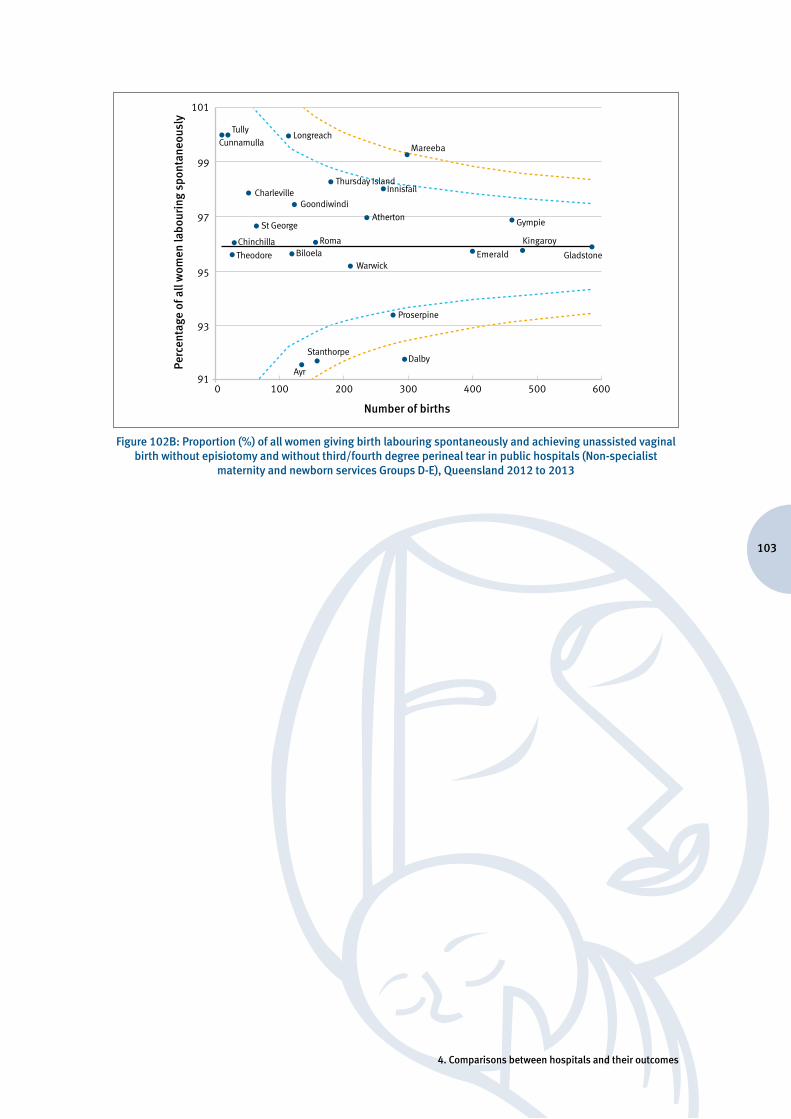
103
4. Comparisons between hospitals and their outcomes
Perc
enta
ge o
f all
wom
en la
bour
ing
spon
tane
ousl
y
Number of births
0 10091
93
95
97
99
101
200 300 400 500 600
Warwick
Innisfail
Gladstone
Atherton Gympie
Kingaroy
Emerald
RomaBiloela
Thursday Island
MareebaLongreach
GoondiwindiCharleville
St George
Theodore
Cunnamulla
Chinchilla
Tully
Dalby
Proserpine
Stanthorpe
Ayr
Figure 102B: Proportion (%) of all women giving birth labouring spontaneously and achieving unassisted vaginal birth without episiotomy and without third/fourth degree perineal tear in public hospitals (Non-specialist
maternity and newborn services Groups D-E), Queensland 2012 to 2013
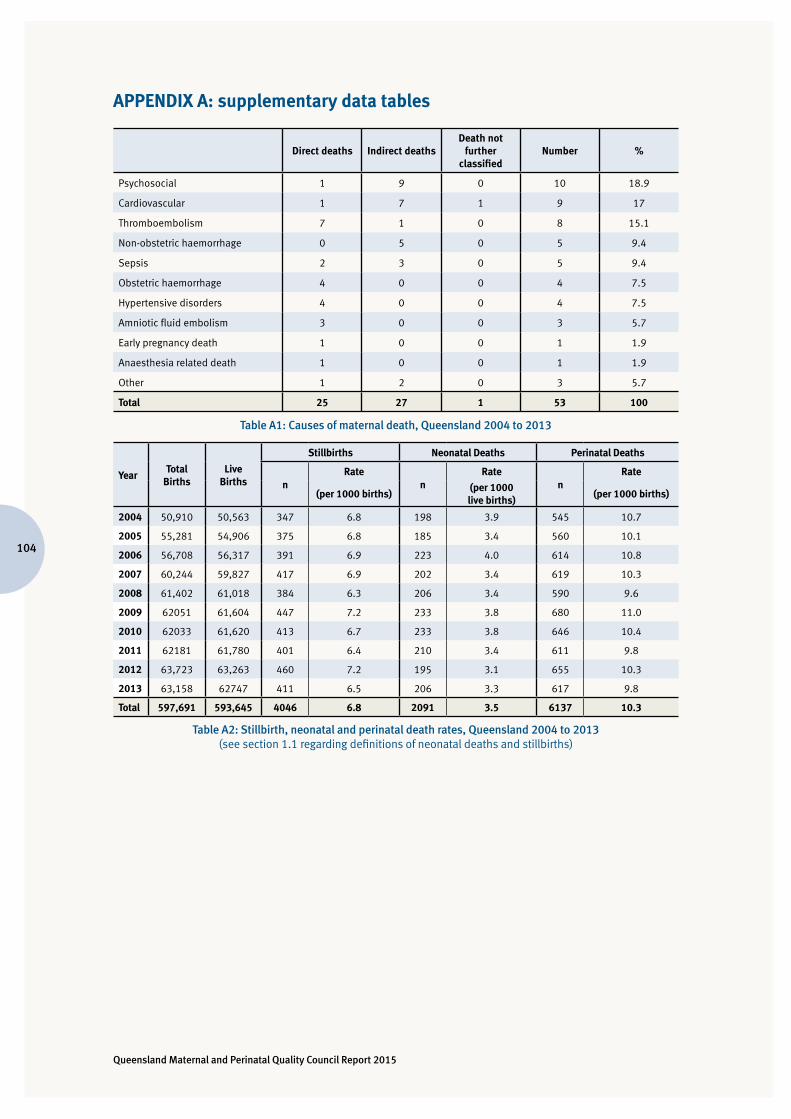
Queensland Maternal and Perinatal Quality Council Report 2015
104
APPENDIX A: supplementary data tables
Direct deaths Indirect deathsDeath not
further classified
Number %
Psychosocial 1 9 0 10 18.9
Cardiovascular 1 7 1 9 17
Thromboembolism 7 1 0 8 15.1
Non-obstetric haemorrhage 0 5 0 5 9.4
Sepsis 2 3 0 5 9.4
Obstetric haemorrhage 4 0 0 4 7.5
Hypertensive disorders 4 0 0 4 7.5
Amniotic fluid embolism 3 0 0 3 5.7
Early pregnancy death 1 0 0 1 1.9
Anaesthesia related death 1 0 0 1 1.9
Other 1 2 0 3 5.7
Total 25 27 1 53 100
Table A1: Causes of maternal death, Queensland 2004 to 2013
YearTotal
BirthsLive
Births
Stillbirths Neonatal Deaths Perinatal Deaths
nRate
nRate
nRate
(per 1000 births)(per 1000 live births)
(per 1000 births)
2004 50,910 50,563 347 6.8 198 3.9 545 10.7
2005 55,281 54,906 375 6.8 185 3.4 560 10.1
2006 56,708 56,317 391 6.9 223 4.0 614 10.8
2007 60,244 59,827 417 6.9 202 3.4 619 10.3
2008 61,402 61,018 384 6.3 206 3.4 590 9.6
2009 62051 61,604 447 7.2 233 3.8 680 11.0
2010 62033 61,620 413 6.7 233 3.8 646 10.4
2011 62181 61,780 401 6.4 210 3.4 611 9.8
2012 63,723 63,263 460 7.2 195 3.1 655 10.3
2013 63,158 62747 411 6.5 206 3.3 617 9.8
Total 597,691 593,645 4046 6.8 2091 3.5 6137 10.3
Table A2: Stillbirth, neonatal and perinatal death rates, Queensland 2004 to 2013(see section 1.1 regarding definitions of neonatal deaths and stillbirths)
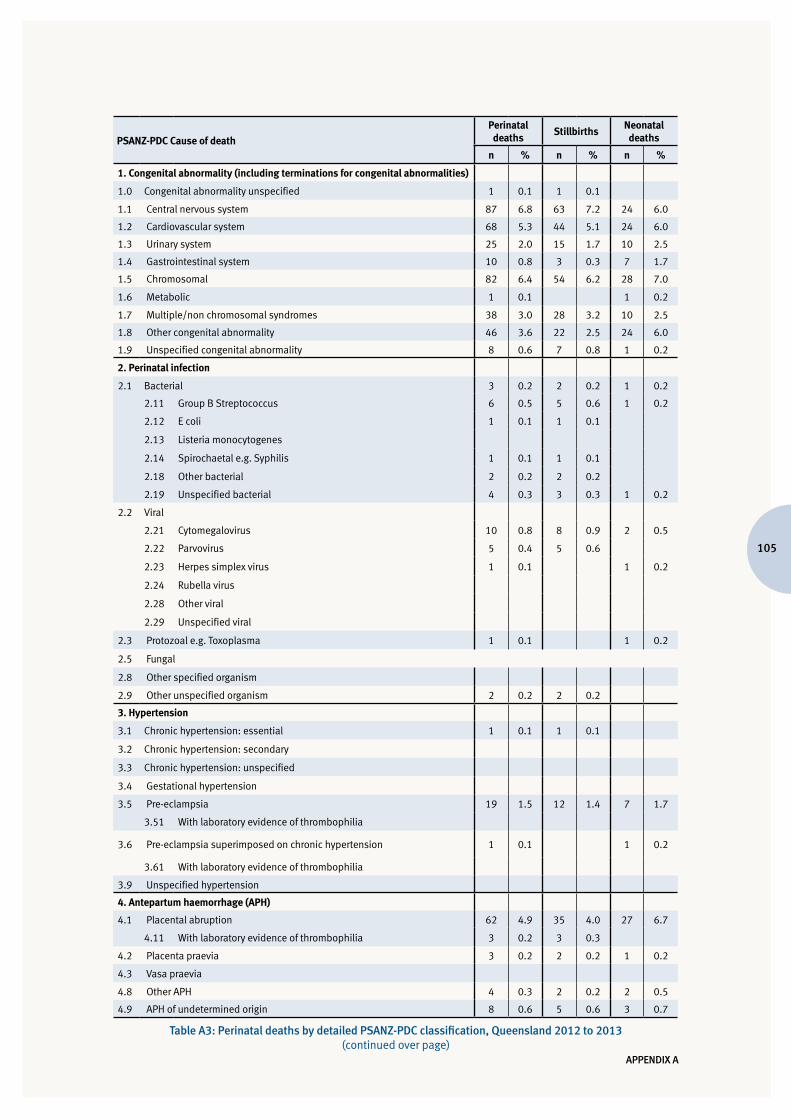
105
APPENDIX A
PSANZ-PDC Cause of death
Perinatal deaths
StillbirthsNeonatal deaths
n % n % n %
1. Congenital abnormality (including terminations for congenital abnormalities)
1.0 Congenital abnormality unspecified 1 0.1 1 0.1
1.1 Central nervous system 87 6.8 63 7.2 24 6.0
1.2 Cardiovascular system 68 5.3 44 5.1 24 6.0
1.3 Urinary system 25 2.0 15 1.7 10 2.5
1.4 Gastrointestinal system 10 0.8 3 0.3 7 1.7
1.5 Chromosomal 82 6.4 54 6.2 28 7.0
1.6 Metabolic 1 0.1 1 0.2
1.7 Multiple/non chromosomal syndromes 38 3.0 28 3.2 10 2.5
1.8 Other congenital abnormality 46 3.6 22 2.5 24 6.0
1.9 Unspecified congenital abnormality 8 0.6 7 0.8 1 0.2
2. Perinatal infection
2.1 Bacterial 3 0.2 2 0.2 1 0.2
2.11 Group B Streptococcus 6 0.5 5 0.6 1 0.2
2.12 E coli 1 0.1 1 0.1
2.13 Listeria monocytogenes
2.14 Spirochaetal e.g. Syphilis 1 0.1 1 0.1
2.18 Other bacterial 2 0.2 2 0.2
2.19 Unspecified bacterial 4 0.3 3 0.3 1 0.2
2.2 Viral
2.21 Cytomegalovirus 10 0.8 8 0.9 2 0.5
2.22 Parvovirus 5 0.4 5 0.6
2.23 Herpes simplex virus 1 0.1 1 0.2
2.24 Rubella virus
2.28 Other viral
2.29 Unspecified viral
2.3 Protozoal e.g. Toxoplasma 1 0.1 1 0.2
2.5 Fungal
2.8 Other specified organism
2.9 Other unspecified organism 2 0.2 2 0.2
3. Hypertension
3.1 Chronic hypertension: essential 1 0.1 1 0.1
3.2 Chronic hypertension: secondary
3.3 Chronic hypertension: unspecified
3.4 Gestational hypertension
3.5 Pre-eclampsia 19 1.5 12 1.4 7 1.7
3.51 With laboratory evidence of thrombophilia
3.6 Pre-eclampsia superimposed on chronic hypertension 1 0.1 1 0.2
3.61 With laboratory evidence of thrombophilia
3.9 Unspecified hypertension
4. Antepartum haemorrhage (APH)
4.1 Placental abruption 62 4.9 35 4.0 27 6.7
4.11 With laboratory evidence of thrombophilia 3 0.2 3 0.3
4.2 Placenta praevia 3 0.2 2 0.2 1 0.2
4.3 Vasa praevia
4.8 Other APH 4 0.3 2 0.2 2 0.5
4.9 APH of undetermined origin 8 0.6 5 0.6 3 0.7
Table A3: Perinatal deaths by detailed PSANZ-PDC classification, Queensland 2012 to 2013(continued over page)
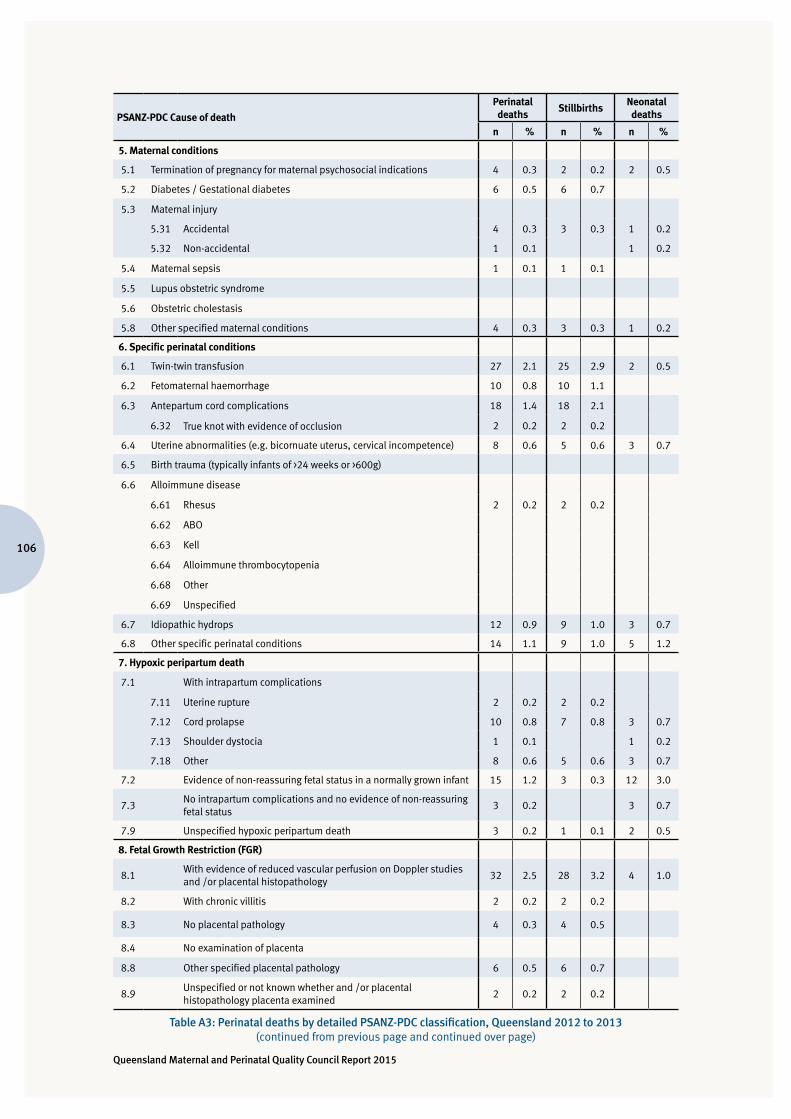
Queensland Maternal and Perinatal Quality Council Report 2015
106
PSANZ-PDC Cause of death
Perinatal deaths
StillbirthsNeonatal deaths
n % n % n %
5. Maternal conditions
5.1 Termination of pregnancy for maternal psychosocial indications 4 0.3 2 0.2 2 0.5
5.2 Diabetes / Gestational diabetes 6 0.5 6 0.7
5.3 Maternal injury
5.31 Accidental 4 0.3 3 0.3 1 0.2
5.32 Non-accidental 1 0.1 1 0.2
5.4 Maternal sepsis 1 0.1 1 0.1
5.5 Lupus obstetric syndrome
5.6 Obstetric cholestasis
5.8 Other specified maternal conditions 4 0.3 3 0.3 1 0.2
6. Specific perinatal conditions
6.1 Twin-twin transfusion 27 2.1 25 2.9 2 0.5
6.2 Fetomaternal haemorrhage 10 0.8 10 1.1
6.3 Antepartum cord complications 18 1.4 18 2.1
6.32 True knot with evidence of occlusion 2 0.2 2 0.2
6.4 Uterine abnormalities (e.g. bicornuate uterus, cervical incompetence) 8 0.6 5 0.6 3 0.7
6.5 Birth trauma (typically infants of >24 weeks or >600g)
6.6 Alloimmune disease
6.61 Rhesus 2 0.2 2 0.2
6.62 ABO
6.63 Kell
6.64 Alloimmune thrombocytopenia
6.68 Other
6.69 Unspecified
6.7 Idiopathic hydrops 12 0.9 9 1.0 3 0.7
6.8 Other specific perinatal conditions 14 1.1 9 1.0 5 1.2
7. Hypoxic peripartum death
7.1 With intrapartum complications
7.11 Uterine rupture 2 0.2 2 0.2
7.12 Cord prolapse 10 0.8 7 0.8 3 0.7
7.13 Shoulder dystocia 1 0.1 1 0.2
7.18 Other 8 0.6 5 0.6 3 0.7
7.2 Evidence of non-reassuring fetal status in a normally grown infant 15 1.2 3 0.3 12 3.0
7.3 No intrapartum complications and no evidence of non-reassuring fetal status
3 0.2 3 0.7
7.9 Unspecified hypoxic peripartum death 3 0.2 1 0.1 2 0.5
8. Fetal Growth Restriction (FGR)
8.1 With evidence of reduced vascular perfusion on Doppler studies and /or placental histopathology
32 2.5 28 3.2 4 1.0
8.2 With chronic villitis 2 0.2 2 0.2
8.3 No placental pathology 4 0.3 4 0.5
8.4 No examination of placenta
8.8 Other specified placental pathology 6 0.5 6 0.7
8.9 Unspecified or not known whether and /or placental histopathology placenta examined
2 0.2 2 0.2
Table A3: Perinatal deaths by detailed PSANZ-PDC classification, Queensland 2012 to 2013(continued from previous page and continued over page)
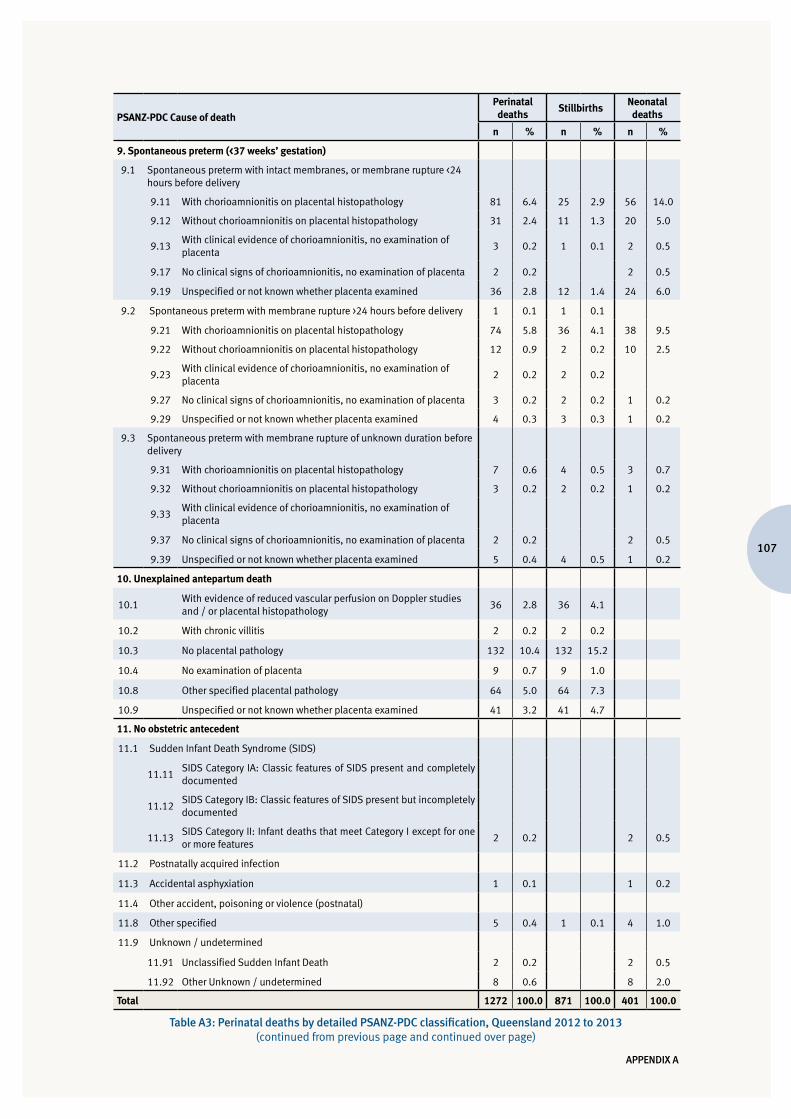
107
APPENDIX A
PSANZ-PDC Cause of death
Perinatal deaths
StillbirthsNeonatal deaths
n % n % n %
9. Spontaneous preterm (<37 weeks’ gestation)
9.1 Spontaneous preterm with intact membranes, or membrane rupture <24 hours before delivery
9.11 With chorioamnionitis on placental histopathology 81 6.4 25 2.9 56 14.0
9.12 Without chorioamnionitis on placental histopathology 31 2.4 11 1.3 20 5.0
9.13With clinical evidence of chorioamnionitis, no examination of placenta
3 0.2 1 0.1 2 0.5
9.17 No clinical signs of chorioamnionitis, no examination of placenta 2 0.2 2 0.5
9.19 Unspecified or not known whether placenta examined 36 2.8 12 1.4 24 6.0
9.2 Spontaneous preterm with membrane rupture >24 hours before delivery 1 0.1 1 0.1
9.21 With chorioamnionitis on placental histopathology 74 5.8 36 4.1 38 9.5
9.22 Without chorioamnionitis on placental histopathology 12 0.9 2 0.2 10 2.5
9.23With clinical evidence of chorioamnionitis, no examination of placenta
2 0.2 2 0.2
9.27 No clinical signs of chorioamnionitis, no examination of placenta 3 0.2 2 0.2 1 0.2
9.29 Unspecified or not known whether placenta examined 4 0.3 3 0.3 1 0.2
9.3 Spontaneous preterm with membrane rupture of unknown duration before delivery
9.31 With chorioamnionitis on placental histopathology 7 0.6 4 0.5 3 0.7
9.32 Without chorioamnionitis on placental histopathology 3 0.2 2 0.2 1 0.2
9.33With clinical evidence of chorioamnionitis, no examination of placenta
9.37 No clinical signs of chorioamnionitis, no examination of placenta 2 0.2 2 0.5
9.39 Unspecified or not known whether placenta examined 5 0.4 4 0.5 1 0.2
10. Unexplained antepartum death
10.1 With evidence of reduced vascular perfusion on Doppler studies and / or placental histopathology
36 2.8 36 4.1
10.2 With chronic villitis 2 0.2 2 0.2
10.3 No placental pathology 132 10.4 132 15.2
10.4 No examination of placenta 9 0.7 9 1.0
10.8 Other specified placental pathology 64 5.0 64 7.3
10.9 Unspecified or not known whether placenta examined 41 3.2 41 4.7
11. No obstetric antecedent
11.1 Sudden Infant Death Syndrome (SIDS)
11.11SIDS Category IA: Classic features of SIDS present and completely documented
11.12SIDS Category IB: Classic features of SIDS present but incompletely documented
11.13SIDS Category II: Infant deaths that meet Category I except for one or more features
2 0.2 2 0.5
11.2 Postnatally acquired infection
11.3 Accidental asphyxiation 1 0.1 1 0.2
11.4 Other accident, poisoning or violence (postnatal)
11.8 Other specified 5 0.4 1 0.1 4 1.0
11.9 Unknown / undetermined
11.91 Unclassified Sudden Infant Death 2 0.2 2 0.5
11.92 Other Unknown / undetermined 8 0.6 8 2.0
Total 1272 100.0 871 100.0 401 100.0
Table A3: Perinatal deaths by detailed PSANZ-PDC classification, Queensland 2012 to 2013(continued from previous page and continued over page)
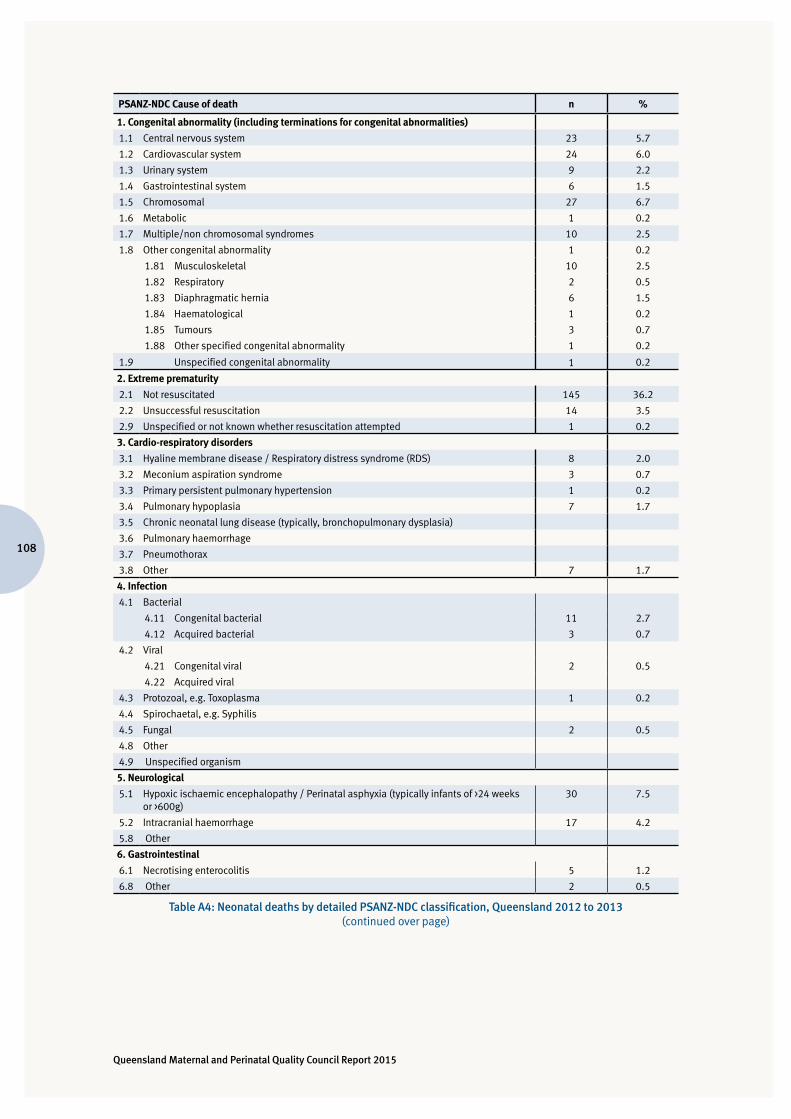
Queensland Maternal and Perinatal Quality Council Report 2015
108
PSANZ-NDC Cause of death n %
1. Congenital abnormality (including terminations for congenital abnormalities)
1.1 Central nervous system 23 5.7
1.2 Cardiovascular system 24 6.0
1.3 Urinary system 9 2.2
1.4 Gastrointestinal system 6 1.5
1.5 Chromosomal 27 6.7
1.6 Metabolic 1 0.2
1.7 Multiple/non chromosomal syndromes 10 2.5
1.8 Other congenital abnormality 1 0.2
1.81 Musculoskeletal 10 2.5
1.82 Respiratory 2 0.5
1.83 Diaphragmatic hernia 6 1.5
1.84 Haematological 1 0.2
1.85 Tumours 3 0.7
1.88 Other specified congenital abnormality 1 0.2
1.9 Unspecified congenital abnormality 1 0.2
2. Extreme prematurity
2.1 Not resuscitated 145 36.2
2.2 Unsuccessful resuscitation 14 3.5
2.9 Unspecified or not known whether resuscitation attempted 1 0.2
3. Cardio-respiratory disorders
3.1 Hyaline membrane disease / Respiratory distress syndrome (RDS) 8 2.0
3.2 Meconium aspiration syndrome 3 0.7
3.3 Primary persistent pulmonary hypertension 1 0.2
3.4 Pulmonary hypoplasia 7 1.7
3.5 Chronic neonatal lung disease (typically, bronchopulmonary dysplasia)
3.6 Pulmonary haemorrhage
3.7 Pneumothorax
3.8 Other 7 1.7
4. Infection
4.1 Bacterial
4.11 Congenital bacterial 11 2.7
4.12 Acquired bacterial 3 0.7
4.2 Viral
4.21 Congenital viral 2 0.5
4.22 Acquired viral
4.3 Protozoal, e.g. Toxoplasma 1 0.2
4.4 Spirochaetal, e.g. Syphilis
4.5 Fungal 2 0.5
4.8 Other
4.9 Unspecified organism
5. Neurological
5.1 Hypoxic ischaemic encephalopathy / Perinatal asphyxia (typically infants of >24 weeks or >600g)
30 7.5
5.2 Intracranial haemorrhage 17 4.2
5.8 Other
6. Gastrointestinal
6.1 Necrotising enterocolitis 5 1.2
6.8 Other 2 0.5
Table A4: Neonatal deaths by detailed PSANZ-NDC classification, Queensland 2012 to 2013(continued over page)
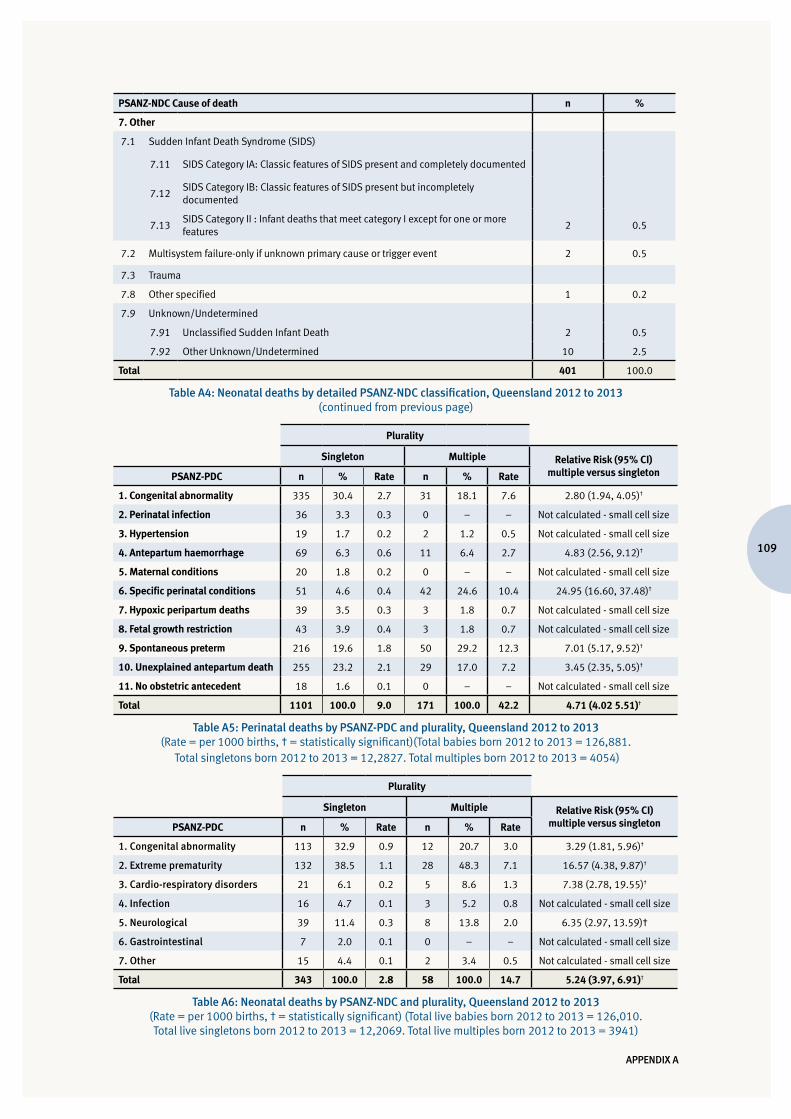
109
APPENDIX A
PSANZ-NDC Cause of death n %
7. Other
7.1 Sudden Infant Death Syndrome (SIDS)
7.11 SIDS Category IA: Classic features of SIDS present and completely documented
7.12SIDS Category IB: Classic features of SIDS present but incompletely documented
7.13SIDS Category II : Infant deaths that meet category I except for one or more features
2 0.5
7.2 Multisystem failure-only if unknown primary cause or trigger event 2 0.5
7.3 Trauma
7.8 Other specified 1 0.2
7.9 Unknown/Undetermined
7.91 Unclassified Sudden Infant Death 2 0.5
7.92 Other Unknown/Undetermined 10 2.5
Total 401 100.0
Table A4: Neonatal deaths by detailed PSANZ-NDC classification, Queensland 2012 to 2013(continued from previous page)
Plurality
Singleton Multiple Relative Risk (95% CI) multiple versus singletonPSANZ-PDC n % Rate n % Rate
1. Congenital abnormality 335 30.4 2.7 31 18.1 7.6 2.80 (1.94, 4.05)†
2. Perinatal infection 36 3.3 0.3 0 – – Not calculated - small cell size
3. Hypertension 19 1.7 0.2 2 1.2 0.5 Not calculated - small cell size
4. Antepartum haemorrhage 69 6.3 0.6 11 6.4 2.7 4.83 (2.56, 9.12)†
5. Maternal conditions 20 1.8 0.2 0 – – Not calculated - small cell size
6. Specific perinatal conditions 51 4.6 0.4 42 24.6 10.4 24.95 (16.60, 37.48)†
7. Hypoxic peripartum deaths 39 3.5 0.3 3 1.8 0.7 Not calculated - small cell size
8. Fetal growth restriction 43 3.9 0.4 3 1.8 0.7 Not calculated - small cell size
9. Spontaneous preterm 216 19.6 1.8 50 29.2 12.3 7.01 (5.17, 9.52)†
10. Unexplained antepartum death 255 23.2 2.1 29 17.0 7.2 3.45 (2.35, 5.05)†
11. No obstetric antecedent 18 1.6 0.1 0 – – Not calculated - small cell size
Total 1101 100.0 9.0 171 100.0 42.2 4.71 (4.02 5.51)†
Table A5: Perinatal deaths by PSANZ-PDC and plurality, Queensland 2012 to 2013(Rate = per 1000 births, † = statistically significant)(Total babies born 2012 to 2013 = 126,881.
Total singletons born 2012 to 2013 = 12,2827. Total multiples born 2012 to 2013 = 4054)
Plurality
Singleton Multiple Relative Risk (95% CI) multiple versus singletonPSANZ-PDC n % Rate n % Rate
1. Congenital abnormality 113 32.9 0.9 12 20.7 3.0 3.29 (1.81, 5.96)†
2. Extreme prematurity 132 38.5 1.1 28 48.3 7.1 16.57 (4.38, 9.87)†
3. Cardio-respiratory disorders 21 6.1 0.2 5 8.6 1.3 7.38 (2.78, 19.55)†
4. Infection 16 4.7 0.1 3 5.2 0.8 Not calculated - small cell size
5. Neurological 39 11.4 0.3 8 13.8 2.0 6.35 (2.97, 13.59)†
6. Gastrointestinal 7 2.0 0.1 0 – – Not calculated - small cell size
7. Other 15 4.4 0.1 2 3.4 0.5 Not calculated - small cell size
Total 343 100.0 2.8 58 100.0 14.7 5.24 (3.97, 6.91)†
Table A6: Neonatal deaths by PSANZ-NDC and plurality, Queensland 2012 to 2013(Rate = per 1000 births, † = statistically significant) (Total live babies born 2012 to 2013 = 126,010. Total live singletons born 2012 to 2013 = 12,2069. Total live multiples born 2012 to 2013 = 3941)
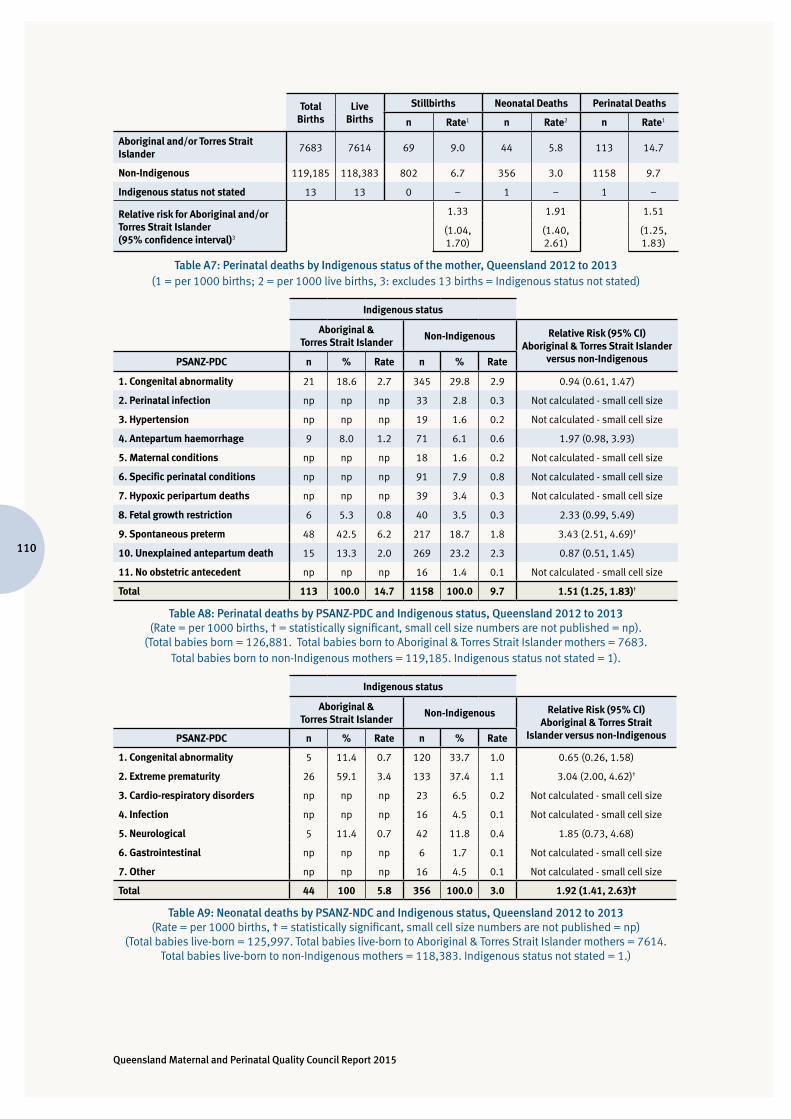
Queensland Maternal and Perinatal Quality Council Report 2015
110
Total Births
Live Births
Stillbirths Neonatal Deaths Perinatal Deaths
n Rate1 n Rate2 n Rate1
Aboriginal and/or Torres Strait Islander
7683 7614 69 9.0 44 5.8 113 14.7
Non-Indigenous 119,185 118,383 802 6.7 356 3.0 1158 9.7
Indigenous status not stated 13 13 0 – 1 – 1 –
Relative risk for Aboriginal and/or Torres Strait Islander (95% confidence interval)3
1.33
1.91
1.51
(1.04, 1.70)
(1.40, 2.61)
(1.25, 1.83)
Table A7: Perinatal deaths by Indigenous status of the mother, Queensland 2012 to 2013(1 = per 1000 births; 2 = per 1000 live births, 3: excludes 13 births = Indigenous status not stated)
Indigenous status
Aboriginal & Torres Strait Islander
Non-Indigenous Relative Risk (95% CI) Aboriginal & Torres Strait Islander
versus non-IndigenousPSANZ-PDC n % Rate n % Rate
1. Congenital abnormality 21 18.6 2.7 345 29.8 2.9 0.94 (0.61, 1.47)
2. Perinatal infection np np np 33 2.8 0.3 Not calculated - small cell size
3. Hypertension np np np 19 1.6 0.2 Not calculated - small cell size
4. Antepartum haemorrhage 9 8.0 1.2 71 6.1 0.6 1.97 (0.98, 3.93)
5. Maternal conditions np np np 18 1.6 0.2 Not calculated - small cell size
6. Specific perinatal conditions np np np 91 7.9 0.8 Not calculated - small cell size
7. Hypoxic peripartum deaths np np np 39 3.4 0.3 Not calculated - small cell size
8. Fetal growth restriction 6 5.3 0.8 40 3.5 0.3 2.33 (0.99, 5.49)
9. Spontaneous preterm 48 42.5 6.2 217 18.7 1.8 3.43 (2.51, 4.69)†
10. Unexplained antepartum death 15 13.3 2.0 269 23.2 2.3 0.87 (0.51, 1.45)
11. No obstetric antecedent np np np 16 1.4 0.1 Not calculated - small cell size
Total 113 100.0 14.7 1158 100.0 9.7 1.51 (1.25, 1.83)†
Table A8: Perinatal deaths by PSANZ-PDC and Indigenous status, Queensland 2012 to 2013(Rate = per 1000 births, † = statistically significant, small cell size numbers are not published = np).
(Total babies born = 126,881. Total babies born to Aboriginal & Torres Strait Islander mothers = 7683. Total babies born to non-Indigenous mothers = 119,185. Indigenous status not stated = 1).
Indigenous status
Aboriginal & Torres Strait Islander
Non-Indigenous Relative Risk (95% CI) Aboriginal & Torres Strait
Islander versus non-IndigenousPSANZ-PDC n % Rate n % Rate
1. Congenital abnormality 5 11.4 0.7 120 33.7 1.0 0.65 (0.26, 1.58)
2. Extreme prematurity 26 59.1 3.4 133 37.4 1.1 3.04 (2.00, 4.62)†
3. Cardio-respiratory disorders np np np 23 6.5 0.2 Not calculated - small cell size
4. Infection np np np 16 4.5 0.1 Not calculated - small cell size
5. Neurological 5 11.4 0.7 42 11.8 0.4 1.85 (0.73, 4.68)
6. Gastrointestinal np np np 6 1.7 0.1 Not calculated - small cell size
7. Other np np np 16 4.5 0.1 Not calculated - small cell size
Total 44 100 5.8 356 100.0 3.0 1.92 (1.41, 2.63)†
Table A9: Neonatal deaths by PSANZ-NDC and Indigenous status, Queensland 2012 to 2013 (Rate = per 1000 births, † = statistically significant, small cell size numbers are not published = np)
(Total babies live-born = 125,997. Total babies live-born to Aboriginal & Torres Strait Islander mothers = 7614. Total babies live-born to non-Indigenous mothers = 118,383. Indigenous status not stated = 1.)
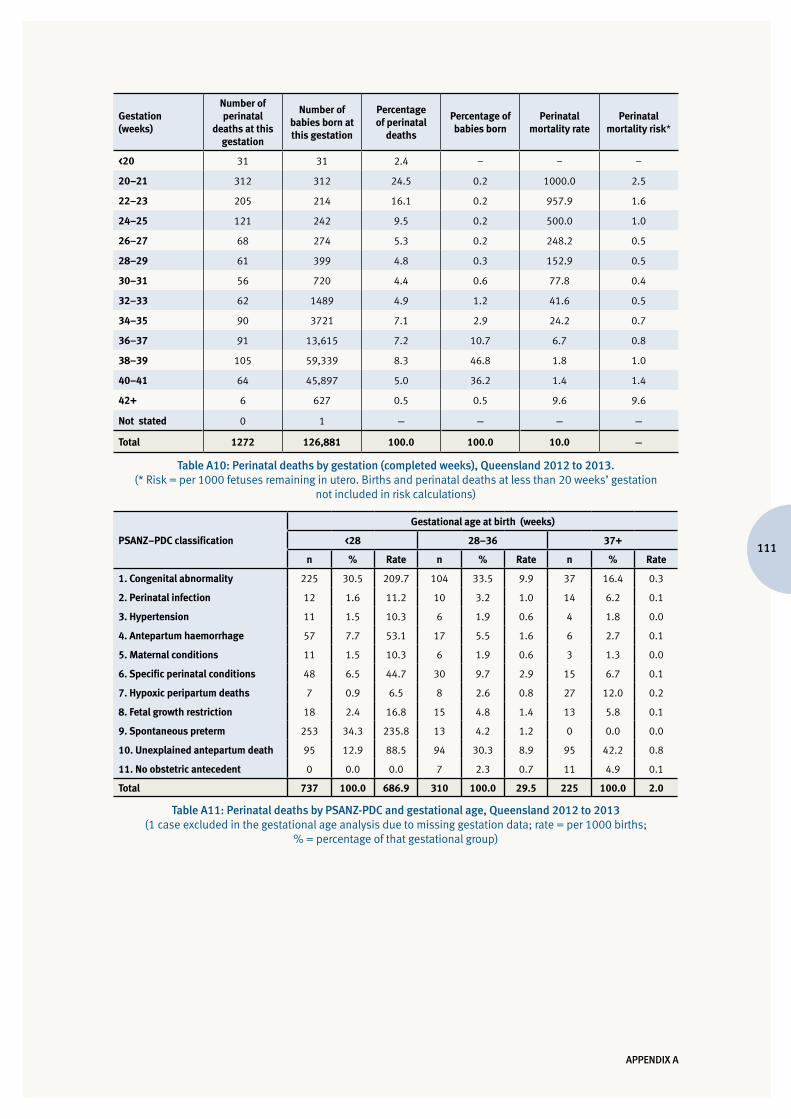
111
APPENDIX A
Gestation (weeks)
Number of perinatal
deaths at this gestation
Number of babies born at this gestation
Percentage of perinatal
deaths
Percentage of babies born
Perinatal mortality rate
Perinatal mortality risk*
<20 31 31 2.4 – – –
20–21 312 312 24.5 0.2 1000.0 2.5
22–23 205 214 16.1 0.2 957.9 1.6
24–25 121 242 9.5 0.2 500.0 1.0
26–27 68 274 5.3 0.2 248.2 0.5
28–29 61 399 4.8 0.3 152.9 0.5
30–31 56 720 4.4 0.6 77.8 0.4
32–33 62 1489 4.9 1.2 41.6 0.5
34–35 90 3721 7.1 2.9 24.2 0.7
36–37 91 13,615 7.2 10.7 6.7 0.8
38–39 105 59,339 8.3 46.8 1.8 1.0
40–41 64 45,897 5.0 36.2 1.4 1.4
42+ 6 627 0.5 0.5 9.6 9.6
Not stated 0 1 – – – –
Total 1272 126,881 100.0 100.0 10.0 –
Table A10: Perinatal deaths by gestation (completed weeks), Queensland 2012 to 2013. (* Risk = per 1000 fetuses remaining in utero. Births and perinatal deaths at less than 20 weeks’ gestation
not included in risk calculations)
PSANZ–PDC classification
Gestational age at birth (weeks)
<28 28–36 37+
n % Rate n % Rate n % Rate
1. Congenital abnormality 225 30.5 209.7 104 33.5 9.9 37 16.4 0.3
2. Perinatal infection 12 1.6 11.2 10 3.2 1.0 14 6.2 0.1
3. Hypertension 11 1.5 10.3 6 1.9 0.6 4 1.8 0.0
4. Antepartum haemorrhage 57 7.7 53.1 17 5.5 1.6 6 2.7 0.1
5. Maternal conditions 11 1.5 10.3 6 1.9 0.6 3 1.3 0.0
6. Specific perinatal conditions 48 6.5 44.7 30 9.7 2.9 15 6.7 0.1
7. Hypoxic peripartum deaths 7 0.9 6.5 8 2.6 0.8 27 12.0 0.2
8. Fetal growth restriction 18 2.4 16.8 15 4.8 1.4 13 5.8 0.1
9. Spontaneous preterm 253 34.3 235.8 13 4.2 1.2 0 0.0 0.0
10. Unexplained antepartum death 95 12.9 88.5 94 30.3 8.9 95 42.2 0.8
11. No obstetric antecedent 0 0.0 0.0 7 2.3 0.7 11 4.9 0.1
Total 737 100.0 686.9 310 100.0 29.5 225 100.0 2.0
Table A11: Perinatal deaths by PSANZ-PDC and gestational age, Queensland 2012 to 2013 (1 case excluded in the gestational age analysis due to missing gestation data; rate = per 1000 births;
% = percentage of that gestational group)
Queensland Maternal and Perinatal Quality Council Report 2015
112
Gestational age at birth (weeks)
PSANZ–NDC classification<28 28–36 37+
n % Rate n % Rate n % Rate
1. Congenital abnormality 43 17.1 0.3 55 68.8 0.4 27 38.6 0.2
2. Extreme prematurity 160 63.7 1.3 0 – – 0 – –
3. Cardio-respiratory disorders 16 6.4 0.1 3 3.8 0.0 7 10.0 0.1
4. Infection 10 4.0 0.1 6 7.5 0.0 3 4.3 0.0
5. Neurological 16 6.4 0.1 6 7.5 0.0 25 35.7 0.2
6. Gastrointestinal 4 1.6 0.0 3 3.8 0.0 0 – –
7. Other 2 0.8 0.0 7 8.8 0.1 8 11.4 0.1
Total 251 100.0 2.0 80 100.0 0.6 70 100.0 0.6
Overall percentage 62.6% 20.0% 17.4%
Table A12: Neonatal deaths by PSANZ-NDC and gestational age, Queensland 2012 to 2013(1 case excluded in the gestational age analysis due to missing gestation data; rate = per 1000 live births;
% = percentage of that gestational group)
Birthweight (g)
Number of perinatal
deaths in this birthweight
group
Number of babies born in
this birthweight group
Percentage of perinatal
deaths
Percentage of babies born
Perinatal mortality rate
<500 493 498 38.8 0.4 990.0
500–999 280 626 22.0 0.5 447.3
1000–1499 88 822 6.9 0.6 107.1
1500–1999 71 1754 5.6 1.4 40.5
2000–2499 81 5216 6.4 4.1 15.5
2500–2999 96 18,640 7.5 14.7 5.2
3000–3499 80 44,499 6.3 35.1 1.8
3500–3999 48 39,505 3.8 31.1 1.2
4000–4499 11 12,961 0.9 10.2 0.8
4500–4999 3 2115 0.2 1.7 1.4
5000+ 1 217 0.1 0.2 4.6
Not stated 20 28 1.6 0.0 –
Total 1272 126,881 100.0 100.0 10.0
Table A13: Perinatal deaths by birthweight, Queensland 2012 to 2013(perinatal mortality rate = per 1000 babies born)
113
APPENDIX A
Birthweight
<1500g 1500–2499g 2500–3999g 4000+g
PSANZ –PDC classification n % Rate n % Rate n % Rate n Rate
1. Congenital abnormality 269 31.2 2.1 55 36.2 0.4 38 17.0 0.3 – –
2. Perinatal infection 16 1.9 0.1 6 3.9 0.0 12 5.4 0.1 2 0.02
3. Hypertension 15 1.7 0.1 4 2.6 0.0 2 0.9 0.0 – –
4. Antepartum haemorrhage 58 6.7 0.5 11 7.2 0.1 11 4.9 0.1 – –
5. Maternal conditions 12 1.4 0.1 3 2.0 0.0 3 1.3 0.0 2 0.02
6. Specific perinatal conditions 59 6.9 0.5 15 9.9 0.1 14 6.3 0.1 – –
7. Hypoxic peripartum deaths 8 0.9 0.1 7 4.6 0.1 24 10.7 0.2 2 0.02
8. Fetal growth restriction 28 3.3 0.2 9 5.9 0.1 9 4.0 0.1 – –
9. Spontaneous preterm 260 30.2 2.0 6 3.9 0.0 – – – – –
10. Unexplained antepartum death
136 15.8 1.1 35 23.0 0.3 96 42.9 0.8 8 0.06
11. No obstetric antecedent – – – 1 0.7 0.0 15 6.7 0.1 1 0.01
Total 861 100.0 6.8 152 100.0 1.2 224 100.0 1.8 15 0.1
Table A14: Perinatal deaths by PSANZ-PDC and birthweight, Queensland 2012 to 2013(20 cases excluded in the birthweight analysis due to missing birthweight data; rate = per 1000 births;
% = percentage of that birthweight group)
Birthweight
<1500g 1500–2499g 2500–3999g 4000+g
PSANZ –PDC classification n % Rate n % Rate n % Rate n Rate
1. Congenital abnormality 59 21.6 0.5 38 70.4 0.3 28 40.0 0.2 – –
2. Extreme prematurity 160 58.6 1.3 – – – – – – – –
3. Cardio-respiratory disorders 17 6.2 0.1 3 5.6 0.0 5 7.1 0.0 1 0.0
4. Infection 13 4.8 0.1 3 5.6 0.0 3 4.3 0.0 – –
5. Neurological 17 6.2 0.1 6 11.1 0.0 23 32.9 0.2 1 0.0
6. Gastrointestinal 5 1.8 0.0 1 1.9 0.0 1 1.4 0.0 – –
7. Other 2 0.7 0.0 3 5.6 0.0 10 14.3 0.1 1 0.0
Total 273 100.0 2.2 54 100.0 0.4 70 100.0 0.6 3 0.0
Table A15: Neonatal deaths by PSANZ-NDC and birthweight, Queensland 2012 to 2013(1 case excluded in the birthweight analysis due to missing birthweight data; rate = per 1000 live births;
% = percentage of that birthweight group)
Autopsy rates (per cent performed)
2004 2005 2006 2007 2008 2009 2010 2011 2012 2013
Stillbirths 22.8 28.3 30.7 34.3 36.5 37.4 35.8 36.9 35.2 31.1
Neonatal deaths
17.2 22.2 29.1 31.2 26.7 27.6 23.1 20.7 20.5 17.5
Perinatal deaths
20.7 26.3 30.1 33.3 33.1 34.0 31.1 31.3 30.8 26.6
Table A16: Perinatal autopsy rates, Queensland 2004 to 2013
Queensland Maternal and Perinatal Quality Council Report 2015
114
YearPublic hospital Private hospital Home birth Data
incompleteTotal women giving birthn % n % n %
2004 34,216 68.4% 15,774 31.5% 57 0.1% 4 50,051
2005 37,374 68.8% 16,919 31.1% 42 0.1% 2 54,337
2006 38,462 69.0% 17,208 30.9% 47 0.1% 2 55,719
2007 41,222 69.6% 17,924 30.3% 81 0.1% 1 59,228
2008 41,903 69.5% 18,312 30.4% 110 0.2% 3 60,328
Maternity Service
Birth Centre
2009 41,944 68.7% 582 1.0% 18,351 30.1% 123 0.2% 23 61,023
2010 41,897 68.7% 674 1.1% 18,362 30.1% 85 0.1% 10 61,028
2011 42,295 69.2% 841 1.4% 17,907 29.3% 69 0.1% 13 61,125
2012 43,586 69.6% 1027 1.6% 17,951 28.6% 84 0.1% 15 62,663
2013 43,194 69.5% 1002 1.6% 17,875 28.8% 90 0.1% 8 62,169
Total 410,219 69.8% 176,583 30.0% 788 0.1% 81 587,671
Table A17: Women giving birth by mode of healthcare delivery, Queensland 2004 to 2013(Data regarding mode of healthcare delivery included the separate definition of public birth centres from 2009)
Gestation (weeks)
24 or less 25–28 29–32 33–36 37–4243 or more
ns Total
Year n % n % n % n % n % n n
2004 248 0.5 216 0.4 538 1.1 2949 5.9 46,087 92.1 6 1 50,051
2005 256 0.5 225 0.4 579 1.1 3204 5.9 50,061 92.1 8 4 54,337
2006 286 0.5 270 0.5 598 1.1 3347 6.0 51,209 91.9 3 6 55,719
2007 306 0.5 233 0.4 610 1.0 3494 5.9 54,569 92.1 5 11 59,228
2008 279 0.5 278 0.5 592 1.0 3490 5.8 55,677 92.3 7 5 60,328
2009 311 0.5 263 0.4 637 1.0 3601 5.9 56,196 92.1 9 6 61,023
2010 319 0.5 268 0.4 610 1.0 3565 5.8 56,253 92.2 7 6 61,028
2011 300 0.5 280 0.5 598 1.0 3633 5.9 56,306 92.1 2 6 61,125
2012 304 0.5 270 0.4 667 1.1 3982 6.4 57,433 91.7 6 1 62,663
2013 329 0.5 231 0.4 650 1.0 3788 6.1 57,162 91.9 9 0 62,169
Table A18: Number and percentage of women giving birth by gestation at birth, Queensland 2004 to 2013 (ns = not stated)
Gestation (weeks)
24 or less 25–28 29–32 33–36 37–4243 or more
ns Total
Year n % n % n % n % n % n n
2004 270 0.5 264 0.5 621 1.2 3,326 6.5 46,416 91.2 6 7 50,910
2005 277 0.5 252 0.5 692 1.3 3,607 6.5 50,441 91.2 8 4 55,281
2006 312 0.6 318 0.6 722 1.3 3,774 6.7 51,573 90.9 3 6 56,708
2007 335 0.6 262 0.4 739 1.2 3,917 6.5 54,975 91.3 5 11 60,244
2008 305 0.5 317 0.5 694 1.1 3,976 6.5 56,098 91.4 7 5 61,402
2009 347 0.6 290 0.5 745 1.2 4,064 6.5 56,590 91.2 9 6 62,051
2010 353 0.6 300 0.5 729 1.2 3,995 6.4 56,643 91.3 7 6 62,033
2011 329 0.5 320 0.5 711 1.1 4,095 6.6 56,718 91.2 2 6 62,181
2012 329 0.5 308 0.5 793 1.3 4,491 7.1 57,795 91.3 6 1 63,273
2013 349 0.6 256 0.4 774 1.2 4,290 6.8 57,480 91.0 9 0 63,158
Table A19: Number and percentage of babies born by gestation at birth, Queensland 2004 to 2013(ns = not stated)
115
APPENDIX A
Public hospitals Private hospitals
Gestation (weeks)
27 or less 28–36 37+Total
27 or less 28–36 37+Total
Year n % n % n % n % n % n %
2004 325 0.9 2492 7.2 31,393 90.5 34,695 71 0.4 1060 6.6 14,642 90.6 16,153
2005 352 0.9 2755 7.4 34,264 91.7 37,374 68 0.4 1089 6.4 15,762 93.2 16,919
2006 414 1.1 2852 7.4 35,191 91.5 38,462 62 0.4 1173 6.8 15,973 92.8 17,208
2007 385 0.9 3007 7.3 37,821 91.7 41,222 60 0.3 1191 6.6 16,672 93.0 17,924
2008 390 0.9 2944 7.0 38,564 92.0 41,903 75 0.4 1225 6.7 17,012 92.9 18,312
2009 412 1.0 3056 7.2 39,052 91.8 42,526 69 0.4 1270 6.9 17,012 92.7 18,351
2010 411 1.0 3027 7.1 39,128 91.9 42,571 89 0.5 1231 6.7 17,042 92.8 18,362
2011 433 1.0 3078 7.1 39,622 91.9 43,136 66 0.4 1232 6.9 16,609 92.8 17,907
2012 403 0.9 3366 7.5 40,843 91.5 44,613 93 0.5 1353 7.5 16,505 91.9 17,951
2013 395 0.9 3243 7.3 40,558 91.8 44,196 88 0.5 1269 7.1 16,518 92.4 17,875
Table A20: Number and percentage of women giving birth by gestation at birth and mode of healthcare delivery, Queensland 2004 to 2013
Public hospitals Private hospitals
Gestation (weeks)
Spontaneous labour
Induced labour
Caesarean section without
labour
Spontaneous labour
Induced labourCaesarean
section without labour
n % n % n % n % n % n %
20 or less 135 38.9 211 60.8 1 0.3 25 34.7 41 56.9 6 8.3
21–22 234 42.7 299 54.6 15 2.7 80 53.0 67 44.4 4 2.6
23–24 289 61.1 142 30.0 42 8.9 60 53.1 39 34.5 14 12.4
25–26 309 57.9 110 20.6 115 21.5 51 51.0 20 20.0 29 29.0
27–28 370 52.9 80 11.4 250 35.7 72 52.6 16 11.7 49 35.8
29–30 557 52.4 91 8.6 414 39.0 108 46.8 12 5.2 111 48.1
31–32 1005 52.5 139 7.3 771 40.3 246 45.6 17 3.1 277 51.3
33–34 2233 56.4 465 11.7 1264 31.9 767 48.3 81 5.1 739 46.6
35–36 5670 55.7 2181 21.4 2320 22.8 2168 41.7 603 11.6 2432 46.7
37–38 26,302 52.9 10,997 22.1 12,379 24.9 8553 25.9 5981 18.1 18,450 55.9
39–40 84,297 72.8 16,287 14.1 15,197 13.1 21,193 47.1 13,733 30.5 10,071 22.4
41–42 17,080 49.0 16,728 48.0 1073 3.1 2347 36.6 3429 53.5 638 9.9
43 or more 17 56.7 10 33.3 3 10.0 0 – 0 – 0 –
Not stated 14 – 1 – – – – –
Total 138,512 62.9 47,741 21.7 33,844 15.4 35,670 38.6 24,039 26.0 32,820 35.5
Total 220,097 92,529
Table A21: Number and percentage of babies born in public and private hospitals, by gestation at birth, mode of healthcare delivery and onset of labour / caesarean section, Queensland 2009 to 2013
(% = percentage at that gestation)
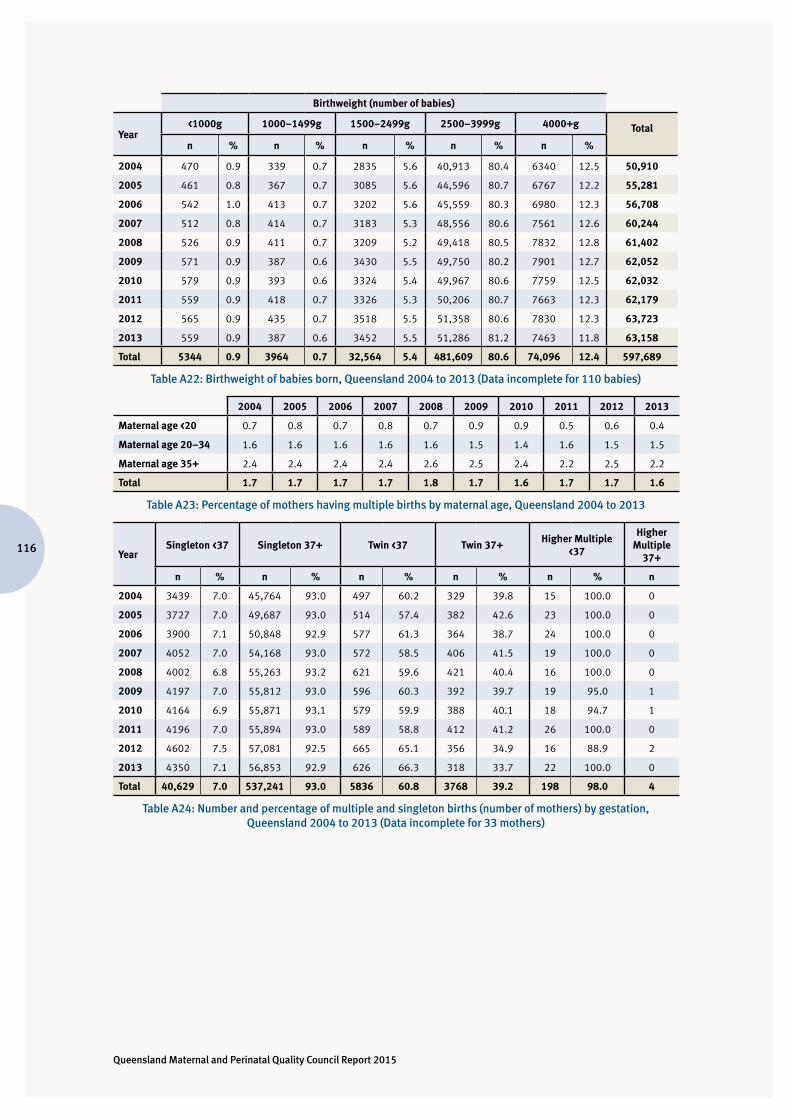
Queensland Maternal and Perinatal Quality Council Report 2015
116
Birthweight (number of babies)
Year<1000g 1000–1499g 1500–2499g 2500–3999g 4000+g Total
n % n % n % n % n %
2004 470 0.9 339 0.7 2835 5.6 40,913 80.4 6340 12.5 50,910
2005 461 0.8 367 0.7 3085 5.6 44,596 80.7 6767 12.2 55,281
2006 542 1.0 413 0.7 3202 5.6 45,559 80.3 6980 12.3 56,708
2007 512 0.8 414 0.7 3183 5.3 48,556 80.6 7561 12.6 60,244
2008 526 0.9 411 0.7 3209 5.2 49,418 80.5 7832 12.8 61,402
2009 571 0.9 387 0.6 3430 5.5 49,750 80.2 7901 12.7 62,052
2010 579 0.9 393 0.6 3324 5.4 49,967 80.6 7759 12.5 62,032
2011 559 0.9 418 0.7 3326 5.3 50,206 80.7 7663 12.3 62,179
2012 565 0.9 435 0.7 3518 5.5 51,358 80.6 7830 12.3 63,723
2013 559 0.9 387 0.6 3452 5.5 51,286 81.2 7463 11.8 63,158
Total 5344 0.9 3964 0.7 32,564 5.4 481,609 80.6 74,096 12.4 597,689
Table A22: Birthweight of babies born, Queensland 2004 to 2013 (Data incomplete for 110 babies)
2004 2005 2006 2007 2008 2009 2010 2011 2012 2013
Maternal age <20 0.7 0.8 0.7 0.8 0.7 0.9 0.9 0.5 0.6 0.4
Maternal age 20–34 1.6 1.6 1.6 1.6 1.6 1.5 1.4 1.6 1.5 1.5
Maternal age 35+ 2.4 2.4 2.4 2.4 2.6 2.5 2.4 2.2 2.5 2.2
Total 1.7 1.7 1.7 1.7 1.8 1.7 1.6 1.7 1.7 1.6
Table A23: Percentage of mothers having multiple births by maternal age, Queensland 2004 to 2013
YearSingleton <37 Singleton 37+ Twin <37 Twin 37+
Higher Multiple <37
Higher Multiple
37+
n % n % n % n % n % n
2004 3439 7.0 45,764 93.0 497 60.2 329 39.8 15 100.0 0
2005 3727 7.0 49,687 93.0 514 57.4 382 42.6 23 100.0 0
2006 3900 7.1 50,848 92.9 577 61.3 364 38.7 24 100.0 0
2007 4052 7.0 54,168 93.0 572 58.5 406 41.5 19 100.0 0
2008 4002 6.8 55,263 93.2 621 59.6 421 40.4 16 100.0 0
2009 4197 7.0 55,812 93.0 596 60.3 392 39.7 19 95.0 1
2010 4164 6.9 55,871 93.1 579 59.9 388 40.1 18 94.7 1
2011 4196 7.0 55,894 93.0 589 58.8 412 41.2 26 100.0 0
2012 4602 7.5 57,081 92.5 665 65.1 356 34.9 16 88.9 2
2013 4350 7.1 56,853 92.9 626 66.3 318 33.7 22 100.0 0
Total 40,629 7.0 537,241 93.0 5836 60.8 3768 39.2 198 98.0 4
Table A24: Number and percentage of multiple and singleton births (number of mothers) by gestation, Queensland 2004 to 2013 (Data incomplete for 33 mothers)
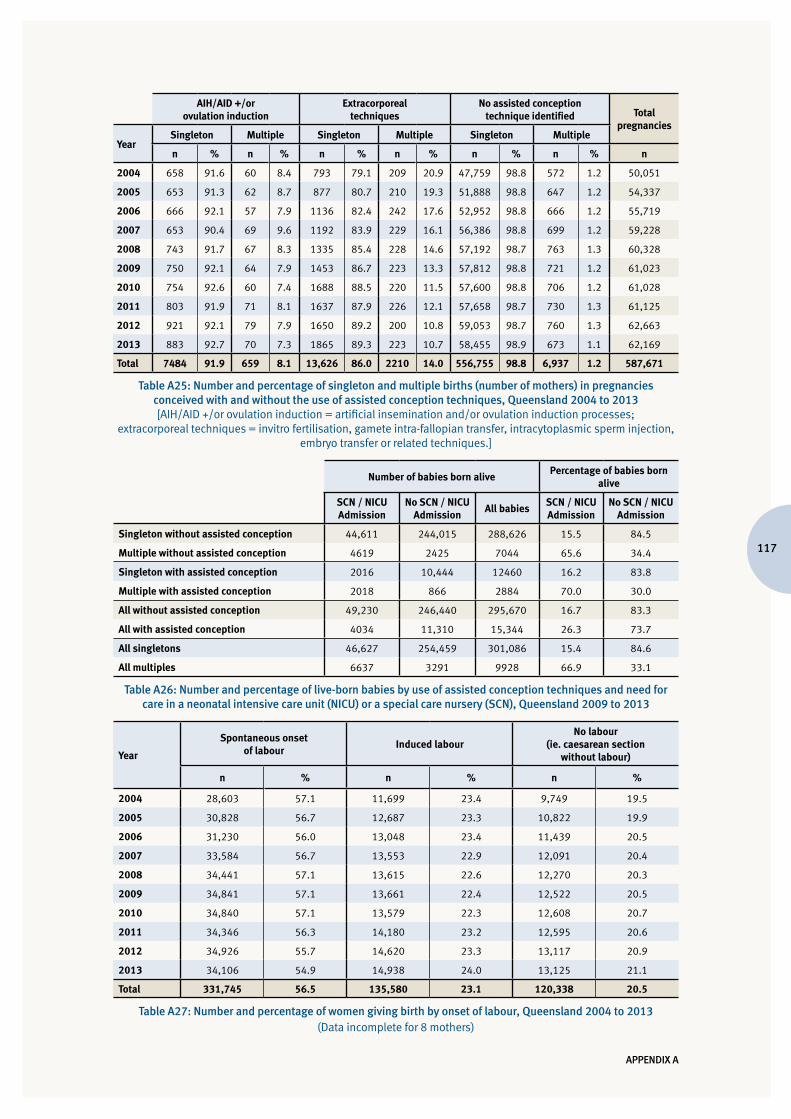
117
APPENDIX A
AIH/AID +/or ovulation induction
Extracorporeal techniques
No assisted conception technique identified Total
pregnancies
YearSingleton Multiple Singleton Multiple Singleton Multiple
n % n % n % n % n % n % n
2004 658 91.6 60 8.4 793 79.1 209 20.9 47,759 98.8 572 1.2 50,051
2005 653 91.3 62 8.7 877 80.7 210 19.3 51,888 98.8 647 1.2 54,337
2006 666 92.1 57 7.9 1136 82.4 242 17.6 52,952 98.8 666 1.2 55,719
2007 653 90.4 69 9.6 1192 83.9 229 16.1 56,386 98.8 699 1.2 59,228
2008 743 91.7 67 8.3 1335 85.4 228 14.6 57,192 98.7 763 1.3 60,328
2009 750 92.1 64 7.9 1453 86.7 223 13.3 57,812 98.8 721 1.2 61,023
2010 754 92.6 60 7.4 1688 88.5 220 11.5 57,600 98.8 706 1.2 61,028
2011 803 91.9 71 8.1 1637 87.9 226 12.1 57,658 98.7 730 1.3 61,125
2012 921 92.1 79 7.9 1650 89.2 200 10.8 59,053 98.7 760 1.3 62,663
2013 883 92.7 70 7.3 1865 89.3 223 10.7 58,455 98.9 673 1.1 62,169
Total 7484 91.9 659 8.1 13,626 86.0 2210 14.0 556,755 98.8 6,937 1.2 587,671
Table A25: Number and percentage of singleton and multiple births (number of mothers) in pregnancies conceived with and without the use of assisted conception techniques, Queensland 2004 to 2013[AIH/AID +/or ovulation induction = artificial insemination and/or ovulation induction processes;
extracorporeal techniques = invitro fertilisation, gamete intra-fallopian transfer, intracytoplasmic sperm injection, embryo transfer or related techniques.]
Number of babies born alivePercentage of babies born
alive
SCN / NICU Admission
No SCN / NICU Admission
All babiesSCN / NICU Admission
No SCN / NICU Admission
Singleton without assisted conception 44,611 244,015 288,626 15.5 84.5
Multiple without assisted conception 4619 2425 7044 65.6 34.4
Singleton with assisted conception 2016 10,444 12460 16.2 83.8
Multiple with assisted conception 2018 866 2884 70.0 30.0
All without assisted conception 49,230 246,440 295,670 16.7 83.3
All with assisted conception 4034 11,310 15,344 26.3 73.7
All singletons 46,627 254,459 301,086 15.4 84.6
All multiples 6637 3291 9928 66.9 33.1
Table A26: Number and percentage of live-born babies by use of assisted conception techniques and need for care in a neonatal intensive care unit (NICU) or a special care nursery (SCN), Queensland 2009 to 2013
Year
Spontaneous onset of labour
Induced labourNo labour
(ie. caesarean section without labour)
n % n % n %
2004 28,603 57.1 11,699 23.4 9,749 19.5
2005 30,828 56.7 12,687 23.3 10,822 19.9
2006 31,230 56.0 13,048 23.4 11,439 20.5
2007 33,584 56.7 13,553 22.9 12,091 20.4
2008 34,441 57.1 13,615 22.6 12,270 20.3
2009 34,841 57.1 13,661 22.4 12,522 20.5
2010 34,840 57.1 13,579 22.3 12,608 20.7
2011 34,346 56.3 14,180 23.2 12,595 20.6
2012 34,926 55.7 14,620 23.3 13,117 20.9
2013 34,106 54.9 14,938 24.0 13,125 21.1
Total 331,745 56.5 135,580 23.1 120,338 20.5
Table A27: Number and percentage of women giving birth by onset of labour, Queensland 2004 to 2013(Data incomplete for 8 mothers)
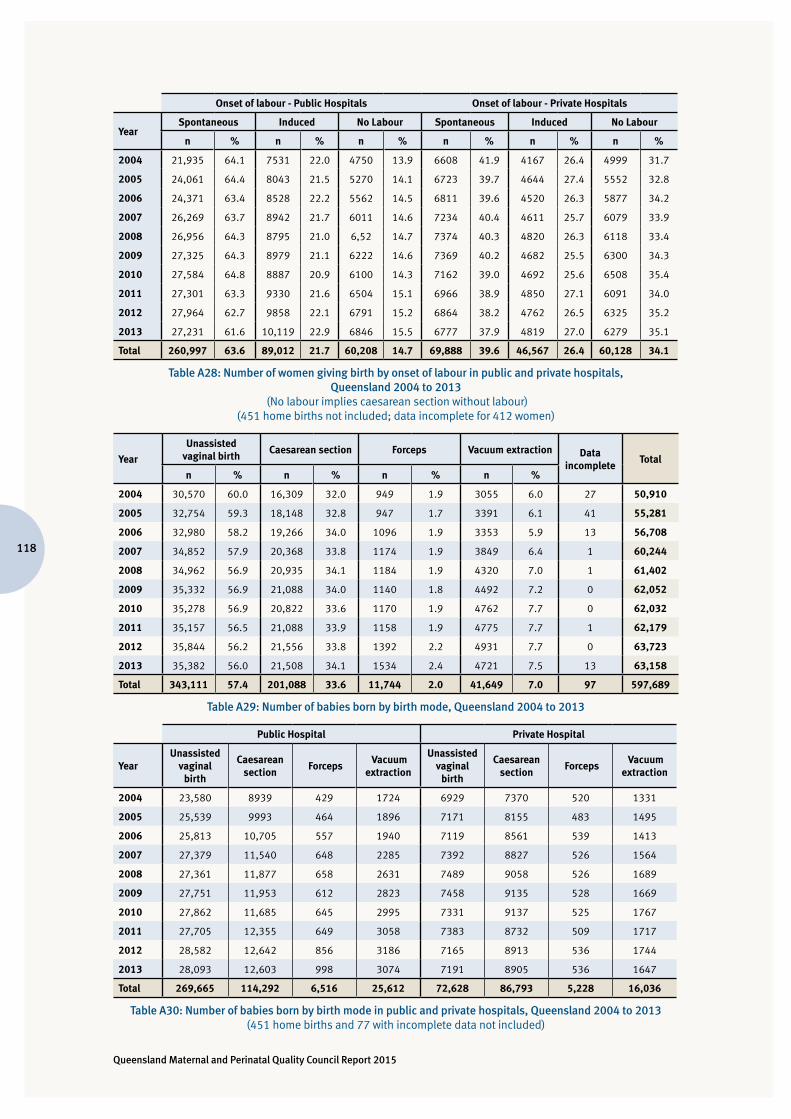
Queensland Maternal and Perinatal Quality Council Report 2015
118
Onset of labour - Public Hospitals Onset of labour - Private Hospitals
YearSpontaneous Induced No Labour Spontaneous Induced No Labour
n % n % n % n % n % n %
2004 21,935 64.1 7531 22.0 4750 13.9 6608 41.9 4167 26.4 4999 31.7
2005 24,061 64.4 8043 21.5 5270 14.1 6723 39.7 4644 27.4 5552 32.8
2006 24,371 63.4 8528 22.2 5562 14.5 6811 39.6 4520 26.3 5877 34.2
2007 26,269 63.7 8942 21.7 6011 14.6 7234 40.4 4611 25.7 6079 33.9
2008 26,956 64.3 8795 21.0 6,52 14.7 7374 40.3 4820 26.3 6118 33.4
2009 27,325 64.3 8979 21.1 6222 14.6 7369 40.2 4682 25.5 6300 34.3
2010 27,584 64.8 8887 20.9 6100 14.3 7162 39.0 4692 25.6 6508 35.4
2011 27,301 63.3 9330 21.6 6504 15.1 6966 38.9 4850 27.1 6091 34.0
2012 27,964 62.7 9858 22.1 6791 15.2 6864 38.2 4762 26.5 6325 35.2
2013 27,231 61.6 10,119 22.9 6846 15.5 6777 37.9 4819 27.0 6279 35.1
Total 260,997 63.6 89,012 21.7 60,208 14.7 69,888 39.6 46,567 26.4 60,128 34.1
Table A28: Number of women giving birth by onset of labour in public and private hospitals, Queensland 2004 to 2013
(No labour implies caesarean section without labour) (451 home births not included; data incomplete for 412 women)
Year
Unassisted vaginal birth
Caesarean section Forceps Vacuum extraction Data incomplete
Total
n % n % n % n %
2004 30,570 60.0 16,309 32.0 949 1.9 3055 6.0 27 50,910
2005 32,754 59.3 18,148 32.8 947 1.7 3391 6.1 41 55,281
2006 32,980 58.2 19,266 34.0 1096 1.9 3353 5.9 13 56,708
2007 34,852 57.9 20,368 33.8 1174 1.9 3849 6.4 1 60,244
2008 34,962 56.9 20,935 34.1 1184 1.9 4320 7.0 1 61,402
2009 35,332 56.9 21,088 34.0 1140 1.8 4492 7.2 0 62,052
2010 35,278 56.9 20,822 33.6 1170 1.9 4762 7.7 0 62,032
2011 35,157 56.5 21,088 33.9 1158 1.9 4775 7.7 1 62,179
2012 35,844 56.2 21,556 33.8 1392 2.2 4931 7.7 0 63,723
2013 35,382 56.0 21,508 34.1 1534 2.4 4721 7.5 13 63,158
Total 343,111 57.4 201,088 33.6 11,744 2.0 41,649 7.0 97 597,689
Table A29: Number of babies born by birth mode, Queensland 2004 to 2013
Public Hospital Private Hospital
YearUnassisted
vaginal birth
Caesarean section
Forceps Vacuum
extraction
Unassisted vaginal
birth
Caesarean section
Forceps Vacuum
extraction
2004 23,580 8939 429 1724 6929 7370 520 1331
2005 25,539 9993 464 1896 7171 8155 483 1495
2006 25,813 10,705 557 1940 7119 8561 539 1413
2007 27,379 11,540 648 2285 7392 8827 526 1564
2008 27,361 11,877 658 2631 7489 9058 526 1689
2009 27,751 11,953 612 2823 7458 9135 528 1669
2010 27,862 11,685 645 2995 7331 9137 525 1767
2011 27,705 12,355 649 3058 7383 8732 509 1717
2012 28,582 12,642 856 3186 7165 8913 536 1744
2013 28,093 12,603 998 3074 7191 8905 536 1647
Total 269,665 114,292 6,516 25,612 72,628 86,793 5,228 16,036
Table A30: Number of babies born by birth mode in public and private hospitals, Queensland 2004 to 2013 (451 home births and 77 with incomplete data not included)
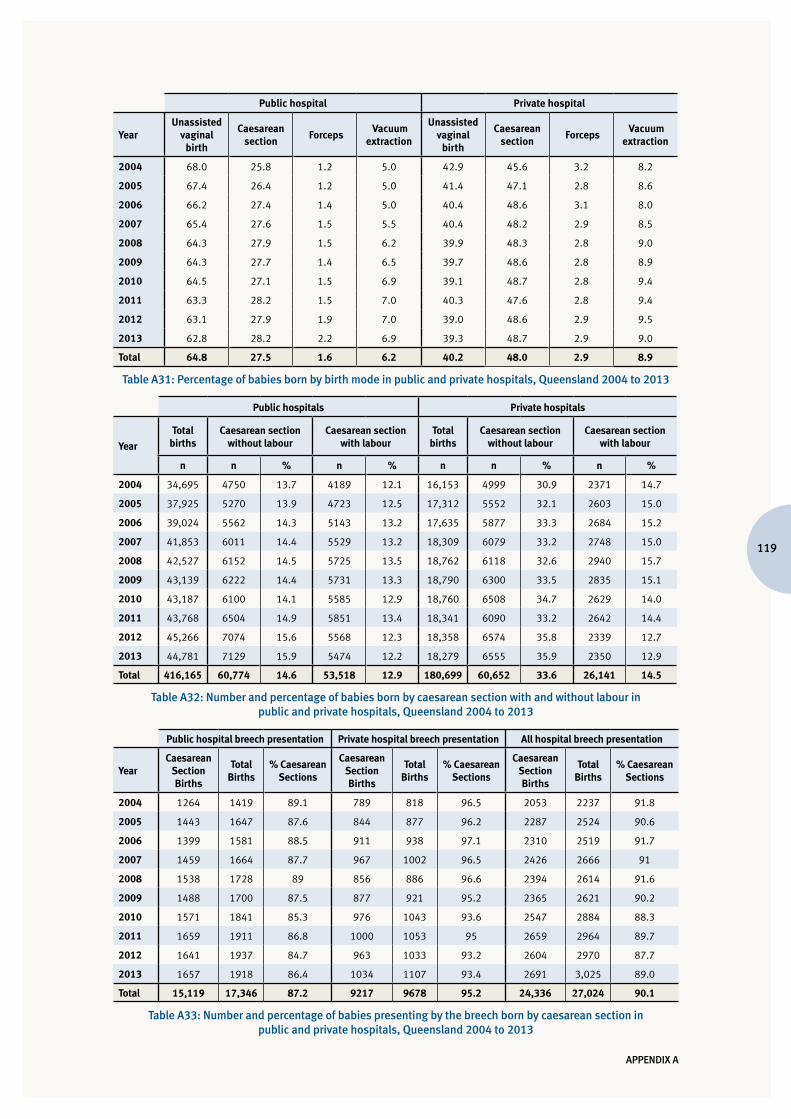
119
APPENDIX A
Public hospital Private hospital
YearUnassisted
vaginal birth
Caesarean section
Forceps Vacuum
extraction
Unassisted vaginal
birth
Caesarean section
Forceps Vacuum
extraction
2004 68.0 25.8 1.2 5.0 42.9 45.6 3.2 8.2
2005 67.4 26.4 1.2 5.0 41.4 47.1 2.8 8.6
2006 66.2 27.4 1.4 5.0 40.4 48.6 3.1 8.0
2007 65.4 27.6 1.5 5.5 40.4 48.2 2.9 8.5
2008 64.3 27.9 1.5 6.2 39.9 48.3 2.8 9.0
2009 64.3 27.7 1.4 6.5 39.7 48.6 2.8 8.9
2010 64.5 27.1 1.5 6.9 39.1 48.7 2.8 9.4
2011 63.3 28.2 1.5 7.0 40.3 47.6 2.8 9.4
2012 63.1 27.9 1.9 7.0 39.0 48.6 2.9 9.5
2013 62.8 28.2 2.2 6.9 39.3 48.7 2.9 9.0
Total 64.8 27.5 1.6 6.2 40.2 48.0 2.9 8.9
Table A31: Percentage of babies born by birth mode in public and private hospitals, Queensland 2004 to 2013
Public hospitals Private hospitals
Year
Total births
Caesarean section without labour
Caesarean section with labour
Total births
Caesarean section without labour
Caesarean section with labour
n n % n % n n % n %
2004 34,695 4750 13.7 4189 12.1 16,153 4999 30.9 2371 14.7
2005 37,925 5270 13.9 4723 12.5 17,312 5552 32.1 2603 15.0
2006 39,024 5562 14.3 5143 13.2 17,635 5877 33.3 2684 15.2
2007 41,853 6011 14.4 5529 13.2 18,309 6079 33.2 2748 15.0
2008 42,527 6152 14.5 5725 13.5 18,762 6118 32.6 2940 15.7
2009 43,139 6222 14.4 5731 13.3 18,790 6300 33.5 2835 15.1
2010 43,187 6100 14.1 5585 12.9 18,760 6508 34.7 2629 14.0
2011 43,768 6504 14.9 5851 13.4 18,341 6090 33.2 2642 14.4
2012 45,266 7074 15.6 5568 12.3 18,358 6574 35.8 2339 12.7
2013 44,781 7129 15.9 5474 12.2 18,279 6555 35.9 2350 12.9
Total 416,165 60,774 14.6 53,518 12.9 180,699 60,652 33.6 26,141 14.5
Table A32: Number and percentage of babies born by caesarean section with and without labour in public and private hospitals, Queensland 2004 to 2013
Public hospital breech presentation Private hospital breech presentation All hospital breech presentation
YearCaesarean
Section Births
Total Births
% Caesarean Sections
Caesarean Section Births
Total Births
% Caesarean Sections
Caesarean Section Births
Total Births
% Caesarean Sections
2004 1264 1419 89.1 789 818 96.5 2053 2237 91.8
2005 1443 1647 87.6 844 877 96.2 2287 2524 90.6
2006 1399 1581 88.5 911 938 97.1 2310 2519 91.7
2007 1459 1664 87.7 967 1002 96.5 2426 2666 91
2008 1538 1728 89 856 886 96.6 2394 2614 91.6
2009 1488 1700 87.5 877 921 95.2 2365 2621 90.2
2010 1571 1841 85.3 976 1043 93.6 2547 2884 88.3
2011 1659 1911 86.8 1000 1053 95 2659 2964 89.7
2012 1641 1937 84.7 963 1033 93.2 2604 2970 87.7
2013 1657 1918 86.4 1034 1107 93.4 2691 3,025 89.0
Total 15,119 17,346 87.2 9217 9678 95.2 24,336 27,024 90.1
Table A33: Number and percentage of babies presenting by the breech born by caesarean section in public and private hospitals, Queensland 2004 to 2013
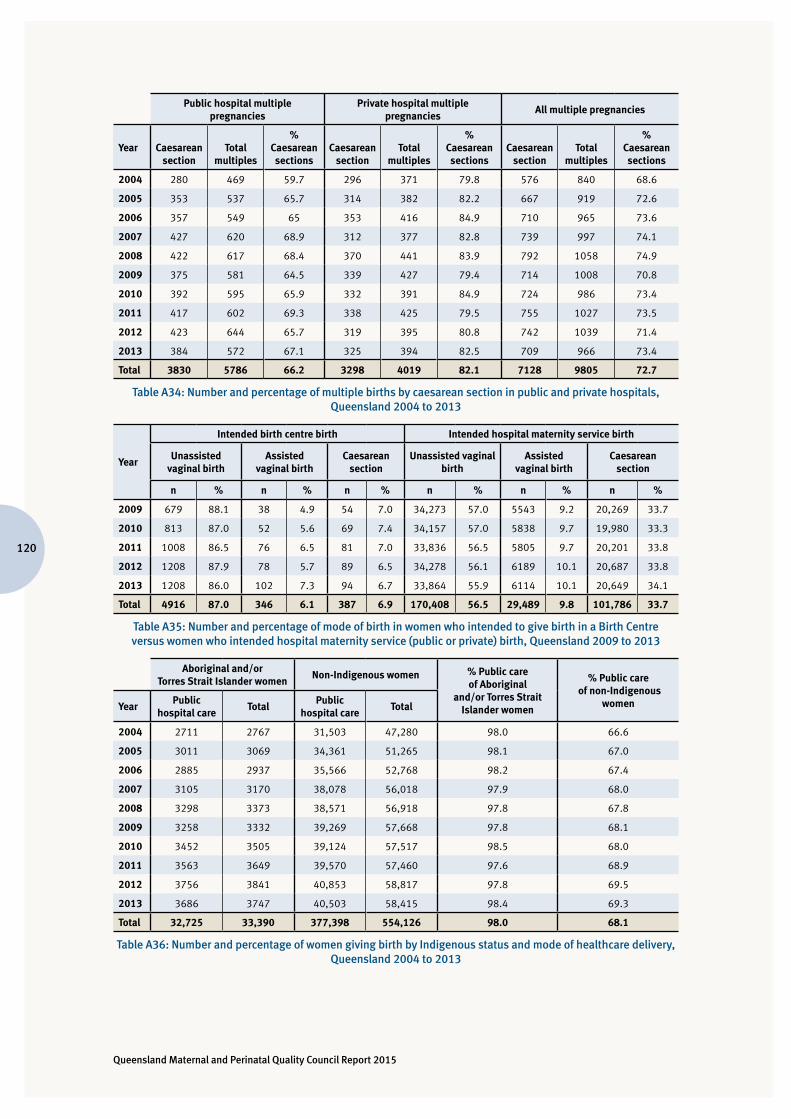
Queensland Maternal and Perinatal Quality Council Report 2015
120
Public hospital multiple pregnancies
Private hospital multiple pregnancies
All multiple pregnancies
Year Caesarean section
Total multiples
% Caesarean sections
Caesarean section
Total multiples
% Caesarean sections
Caesarean section
Total multiples
% Caesarean sections
2004 280 469 59.7 296 371 79.8 576 840 68.6
2005 353 537 65.7 314 382 82.2 667 919 72.6
2006 357 549 65 353 416 84.9 710 965 73.6
2007 427 620 68.9 312 377 82.8 739 997 74.1
2008 422 617 68.4 370 441 83.9 792 1058 74.9
2009 375 581 64.5 339 427 79.4 714 1008 70.8
2010 392 595 65.9 332 391 84.9 724 986 73.4
2011 417 602 69.3 338 425 79.5 755 1027 73.5
2012 423 644 65.7 319 395 80.8 742 1039 71.4
2013 384 572 67.1 325 394 82.5 709 966 73.4
Total 3830 5786 66.2 3298 4019 82.1 7128 9805 72.7
Table A34: Number and percentage of multiple births by caesarean section in public and private hospitals, Queensland 2004 to 2013
Year
Intended birth centre birth Intended hospital maternity service birth
Unassisted vaginal birth
Assisted vaginal birth
Caesarean section
Unassisted vaginal birth
Assisted vaginal birth
Caesarean section
n % n % n % n % n % n %
2009 679 88.1 38 4.9 54 7.0 34,273 57.0 5543 9.2 20,269 33.7
2010 813 87.0 52 5.6 69 7.4 34,157 57.0 5838 9.7 19,980 33.3
2011 1008 86.5 76 6.5 81 7.0 33,836 56.5 5805 9.7 20,201 33.8
2012 1208 87.9 78 5.7 89 6.5 34,278 56.1 6189 10.1 20,687 33.8
2013 1208 86.0 102 7.3 94 6.7 33,864 55.9 6114 10.1 20,649 34.1
Total 4916 87.0 346 6.1 387 6.9 170,408 56.5 29,489 9.8 101,786 33.7
Table A35: Number and percentage of mode of birth in women who intended to give birth in a Birth Centre versus women who intended hospital maternity service (public or private) birth, Queensland 2009 to 2013
Aboriginal and/or Torres Strait Islander women
Non-Indigenous women % Public care of Aboriginal
and/or Torres Strait Islander women
% Public care of non-Indigenous
womenYearPublic
hospital careTotal
Public hospital care
Total
2004 2711 2767 31,503 47,280 98.0 66.6
2005 3011 3069 34,361 51,265 98.1 67.0
2006 2885 2937 35,566 52,768 98.2 67.4
2007 3105 3170 38,078 56,018 97.9 68.0
2008 3298 3373 38,571 56,918 97.8 67.8
2009 3258 3332 39,269 57,668 97.8 68.1
2010 3452 3505 39,124 57,517 98.5 68.0
2011 3563 3649 39,570 57,460 97.6 68.9
2012 3756 3841 40,853 58,817 97.8 69.5
2013 3686 3747 40,503 58,415 98.4 69.3
Total 32,725 33,390 377,398 554,126 98.0 68.1
Table A36: Number and percentage of women giving birth by Indigenous status and mode of healthcare delivery, Queensland 2004 to 2013
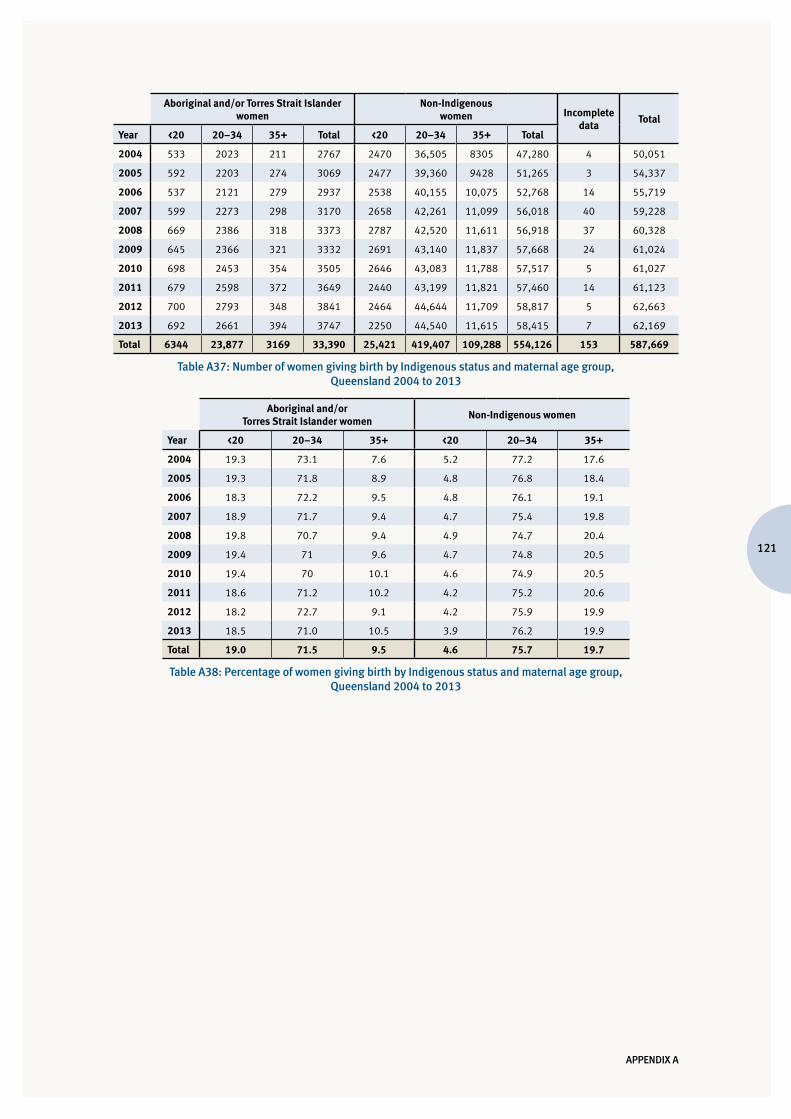
121
APPENDIX A
Aboriginal and/or Torres Strait Islander women
Non-Indigenous women Incomplete
dataTotal
Year <20 20–34 35+ Total <20 20–34 35+ Total
2004 533 2023 211 2767 2470 36,505 8305 47,280 4 50,051
2005 592 2203 274 3069 2477 39,360 9428 51,265 3 54,337
2006 537 2121 279 2937 2538 40,155 10,075 52,768 14 55,719
2007 599 2273 298 3170 2658 42,261 11,099 56,018 40 59,228
2008 669 2386 318 3373 2787 42,520 11,611 56,918 37 60,328
2009 645 2366 321 3332 2691 43,140 11,837 57,668 24 61,024
2010 698 2453 354 3505 2646 43,083 11,788 57,517 5 61,027
2011 679 2598 372 3649 2440 43,199 11,821 57,460 14 61,123
2012 700 2793 348 3841 2464 44,644 11,709 58,817 5 62,663
2013 692 2661 394 3747 2250 44,540 11,615 58,415 7 62,169
Total 6344 23,877 3169 33,390 25,421 419,407 109,288 554,126 153 587,669
Table A37: Number of women giving birth by Indigenous status and maternal age group, Queensland 2004 to 2013
Aboriginal and/or Torres Strait Islander women
Non-Indigenous women
Year <20 20–34 35+ <20 20–34 35+
2004 19.3 73.1 7.6 5.2 77.2 17.6
2005 19.3 71.8 8.9 4.8 76.8 18.4
2006 18.3 72.2 9.5 4.8 76.1 19.1
2007 18.9 71.7 9.4 4.7 75.4 19.8
2008 19.8 70.7 9.4 4.9 74.7 20.4
2009 19.4 71 9.6 4.7 74.8 20.5
2010 19.4 70 10.1 4.6 74.9 20.5
2011 18.6 71.2 10.2 4.2 75.2 20.6
2012 18.2 72.7 9.1 4.2 75.9 19.9
2013 18.5 71.0 10.5 3.9 76.2 19.9
Total 19.0 71.5 9.5 4.6 75.7 19.7
Table A38: Percentage of women giving birth by Indigenous status and maternal age group, Queensland 2004 to 2013
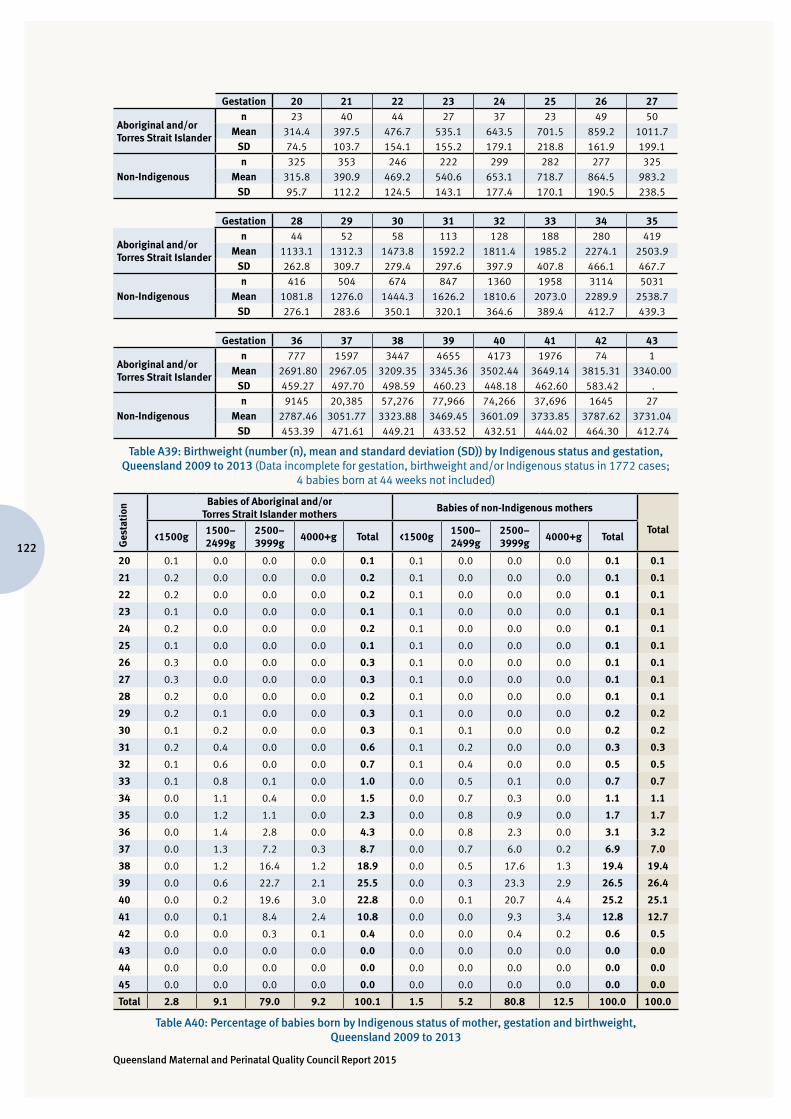
Queensland Maternal and Perinatal Quality Council Report 2015
122
Gestation 20 21 22 23 24 25 26 27
Aboriginal and/or Torres Strait Islander
n 23 40 44 27 37 23 49 50Mean 314.4 397.5 476.7 535.1 643.5 701.5 859.2 1011.7
SD 74.5 103.7 154.1 155.2 179.1 218.8 161.9 199.1
Non-Indigenousn 325 353 246 222 299 282 277 325
Mean 315.8 390.9 469.2 540.6 653.1 718.7 864.5 983.2SD 95.7 112.2 124.5 143.1 177.4 170.1 190.5 238.5
Gestation 28 29 30 31 32 33 34 35
Aboriginal and/or Torres Strait Islander
n 44 52 58 113 128 188 280 419Mean 1133.1 1312.3 1473.8 1592.2 1811.4 1985.2 2274.1 2503.9
SD 262.8 309.7 279.4 297.6 397.9 407.8 466.1 467.7
Non-Indigenousn 416 504 674 847 1360 1958 3114 5031
Mean 1081.8 1276.0 1444.3 1626.2 1810.6 2073.0 2289.9 2538.7SD 276.1 283.6 350.1 320.1 364.6 389.4 412.7 439.3
Gestation 36 37 38 39 40 41 42 43
Aboriginal and/or Torres Strait Islander
n 777 1597 3447 4655 4173 1976 74 1Mean 2691.80 2967.05 3209.35 3345.36 3502.44 3649.14 3815.31 3340.00
SD 459.27 497.70 498.59 460.23 448.18 462.60 583.42 .
Non-Indigenousn 9145 20,385 57,276 77,966 74,266 37,696 1645 27
Mean 2787.46 3051.77 3323.88 3469.45 3601.09 3733.85 3787.62 3731.04 SD 453.39 471.61 449.21 433.52 432.51 444.02 464.30 412.74
Table A39: Birthweight (number (n), mean and standard deviation (SD)) by Indigenous status and gestation, Queensland 2009 to 2013 (Data incomplete for gestation, birthweight and/or Indigenous status in 1772 cases;
4 babies born at 44 weeks not included)
Ges
tati
on
Babies of Aboriginal and/or Torres Strait Islander mothers
Babies of non-Indigenous mothers
Total<1500g
1500–2499g
2500–3999g
4000+g Total <1500g1500–2499g
2500–3999g
4000+g Total
20 0.1 0.0 0.0 0.0 0.1 0.1 0.0 0.0 0.0 0.1 0.1
21 0.2 0.0 0.0 0.0 0.2 0.1 0.0 0.0 0.0 0.1 0.1
22 0.2 0.0 0.0 0.0 0.2 0.1 0.0 0.0 0.0 0.1 0.1
23 0.1 0.0 0.0 0.0 0.1 0.1 0.0 0.0 0.0 0.1 0.1
24 0.2 0.0 0.0 0.0 0.2 0.1 0.0 0.0 0.0 0.1 0.1
25 0.1 0.0 0.0 0.0 0.1 0.1 0.0 0.0 0.0 0.1 0.1
26 0.3 0.0 0.0 0.0 0.3 0.1 0.0 0.0 0.0 0.1 0.1
27 0.3 0.0 0.0 0.0 0.3 0.1 0.0 0.0 0.0 0.1 0.1
28 0.2 0.0 0.0 0.0 0.2 0.1 0.0 0.0 0.0 0.1 0.1
29 0.2 0.1 0.0 0.0 0.3 0.1 0.0 0.0 0.0 0.2 0.2
30 0.1 0.2 0.0 0.0 0.3 0.1 0.1 0.0 0.0 0.2 0.2
31 0.2 0.4 0.0 0.0 0.6 0.1 0.2 0.0 0.0 0.3 0.3
32 0.1 0.6 0.0 0.0 0.7 0.1 0.4 0.0 0.0 0.5 0.5
33 0.1 0.8 0.1 0.0 1.0 0.0 0.5 0.1 0.0 0.7 0.7
34 0.0 1.1 0.4 0.0 1.5 0.0 0.7 0.3 0.0 1.1 1.1
35 0.0 1.2 1.1 0.0 2.3 0.0 0.8 0.9 0.0 1.7 1.7
36 0.0 1.4 2.8 0.0 4.3 0.0 0.8 2.3 0.0 3.1 3.2
37 0.0 1.3 7.2 0.3 8.7 0.0 0.7 6.0 0.2 6.9 7.0
38 0.0 1.2 16.4 1.2 18.9 0.0 0.5 17.6 1.3 19.4 19.4
39 0.0 0.6 22.7 2.1 25.5 0.0 0.3 23.3 2.9 26.5 26.4
40 0.0 0.2 19.6 3.0 22.8 0.0 0.1 20.7 4.4 25.2 25.1
41 0.0 0.1 8.4 2.4 10.8 0.0 0.0 9.3 3.4 12.8 12.7
42 0.0 0.0 0.3 0.1 0.4 0.0 0.0 0.4 0.2 0.6 0.5
43 0.0 0.0 0.0 0.0 0.0 0.0 0.0 0.0 0.0 0.0 0.0
44 0.0 0.0 0.0 0.0 0.0 0.0 0.0 0.0 0.0 0.0 0.0
45 0.0 0.0 0.0 0.0 0.0 0.0 0.0 0.0 0.0 0.0 0.0
Total 2.8 9.1 79.0 9.2 100.1 1.5 5.2 80.8 12.5 100.0 100.0
Table A40: Percentage of babies born by Indigenous status of mother, gestation and birthweight, Queensland 2009 to 2013
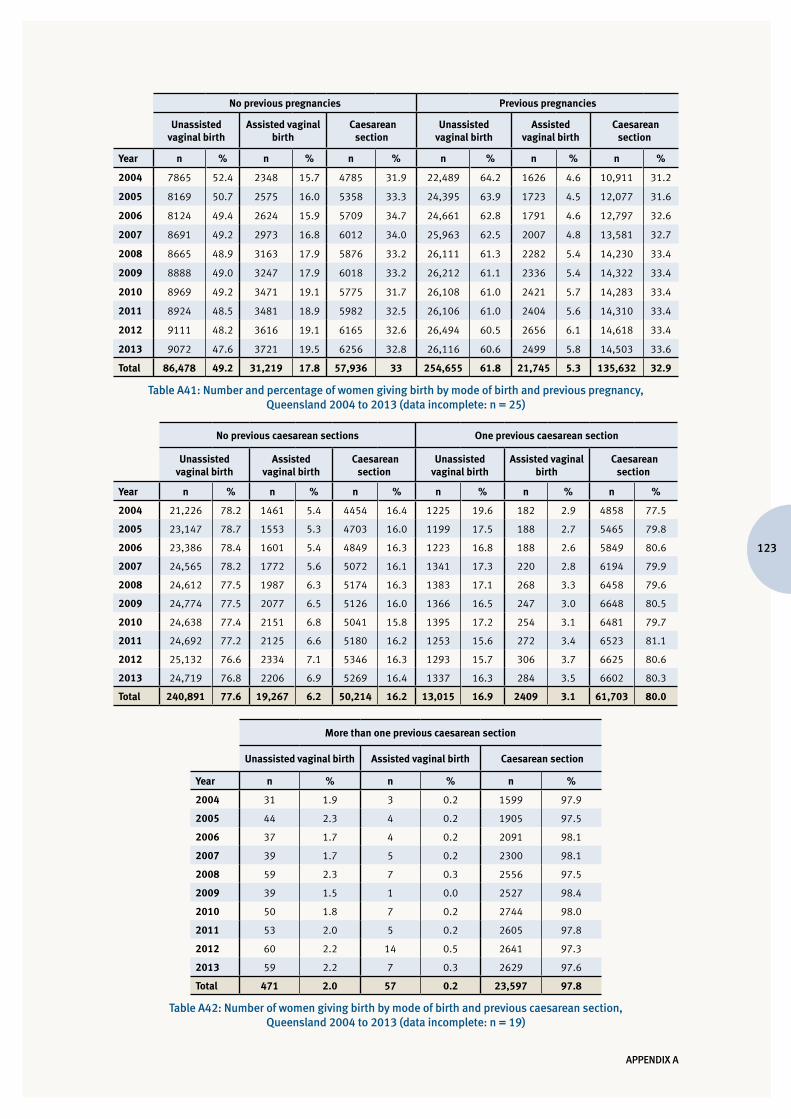
123
APPENDIX A
No previous pregnancies Previous pregnancies
Unassisted vaginal birth
Assisted vaginal birth
Caesarean section
Unassisted vaginal birth
Assisted vaginal birth
Caesarean section
Year n % n % n % n % n % n %
2004 7865 52.4 2348 15.7 4785 31.9 22,489 64.2 1626 4.6 10,911 31.2
2005 8169 50.7 2575 16.0 5358 33.3 24,395 63.9 1723 4.5 12,077 31.6
2006 8124 49.4 2624 15.9 5709 34.7 24,661 62.8 1791 4.6 12,797 32.6
2007 8691 49.2 2973 16.8 6012 34.0 25,963 62.5 2007 4.8 13,581 32.7
2008 8665 48.9 3163 17.9 5876 33.2 26,111 61.3 2282 5.4 14,230 33.4
2009 8888 49.0 3247 17.9 6018 33.2 26,212 61.1 2336 5.4 14,322 33.4
2010 8969 49.2 3471 19.1 5775 31.7 26,108 61.0 2421 5.7 14,283 33.4
2011 8924 48.5 3481 18.9 5982 32.5 26,106 61.0 2404 5.6 14,310 33.4
2012 9111 48.2 3616 19.1 6165 32.6 26,494 60.5 2656 6.1 14,618 33.4
2013 9072 47.6 3721 19.5 6256 32.8 26,116 60.6 2499 5.8 14,503 33.6
Total 86,478 49.2 31,219 17.8 57,936 33 254,655 61.8 21,745 5.3 135,632 32.9
Table A41: Number and percentage of women giving birth by mode of birth and previous pregnancy, Queensland 2004 to 2013 (data incomplete: n = 25)
No previous caesarean sections One previous caesarean section
Unassisted vaginal birth
Assisted vaginal birth
Caesarean section
Unassisted vaginal birth
Assisted vaginal birth
Caesarean section
Year n % n % n % n % n % n %
2004 21,226 78.2 1461 5.4 4454 16.4 1225 19.6 182 2.9 4858 77.5
2005 23,147 78.7 1553 5.3 4703 16.0 1199 17.5 188 2.7 5465 79.8
2006 23,386 78.4 1601 5.4 4849 16.3 1223 16.8 188 2.6 5849 80.6
2007 24,565 78.2 1772 5.6 5072 16.1 1341 17.3 220 2.8 6194 79.9
2008 24,612 77.5 1987 6.3 5174 16.3 1383 17.1 268 3.3 6458 79.6
2009 24,774 77.5 2077 6.5 5126 16.0 1366 16.5 247 3.0 6648 80.5
2010 24,638 77.4 2151 6.8 5041 15.8 1395 17.2 254 3.1 6481 79.7
2011 24,692 77.2 2125 6.6 5180 16.2 1253 15.6 272 3.4 6523 81.1
2012 25,132 76.6 2334 7.1 5346 16.3 1293 15.7 306 3.7 6625 80.6
2013 24,719 76.8 2206 6.9 5269 16.4 1337 16.3 284 3.5 6602 80.3
Total 240,891 77.6 19,267 6.2 50,214 16.2 13,015 16.9 2409 3.1 61,703 80.0
More than one previous caesarean section
Unassisted vaginal birth Assisted vaginal birth Caesarean section
Year n % n % n %
2004 31 1.9 3 0.2 1599 97.9
2005 44 2.3 4 0.2 1905 97.5
2006 37 1.7 4 0.2 2091 98.1
2007 39 1.7 5 0.2 2300 98.1
2008 59 2.3 7 0.3 2556 97.5
2009 39 1.5 1 0.0 2527 98.4
2010 50 1.8 7 0.2 2744 98.0
2011 53 2.0 5 0.2 2605 97.8
2012 60 2.2 14 0.5 2641 97.3
2013 59 2.2 7 0.3 2629 97.6
Total 471 2.0 57 0.2 23,597 97.8
Table A42: Number of women giving birth by mode of birth and previous caesarean section, Queensland 2004 to 2013 (data incomplete: n = 19)
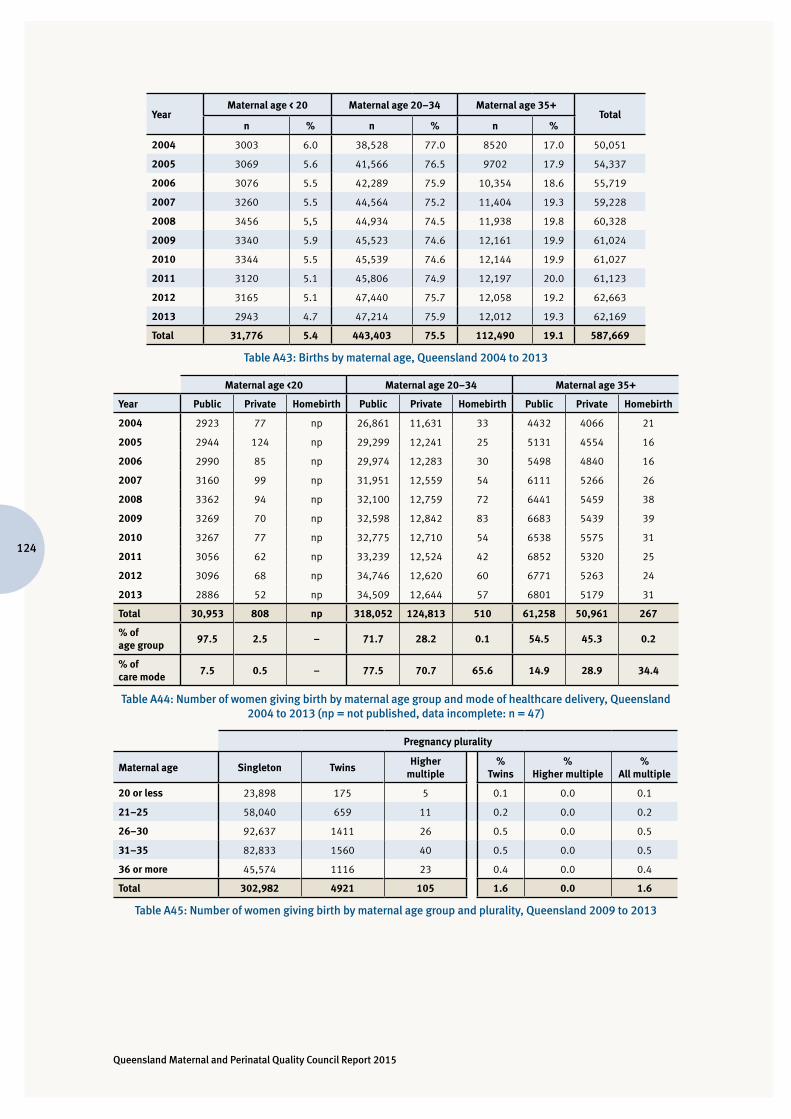
Queensland Maternal and Perinatal Quality Council Report 2015
124
YearMaternal age < 20 Maternal age 20–34 Maternal age 35+
Totaln % n % n %
2004 3003 6.0 38,528 77.0 8520 17.0 50,051
2005 3069 5.6 41,566 76.5 9702 17.9 54,337
2006 3076 5.5 42,289 75.9 10,354 18.6 55,719
2007 3260 5.5 44,564 75.2 11,404 19.3 59,228
2008 3456 5,5 44,934 74.5 11,938 19.8 60,328
2009 3340 5.9 45,523 74.6 12,161 19.9 61,024
2010 3344 5.5 45,539 74.6 12,144 19.9 61,027
2011 3120 5.1 45,806 74.9 12,197 20.0 61,123
2012 3165 5.1 47,440 75.7 12,058 19.2 62,663
2013 2943 4.7 47,214 75.9 12,012 19.3 62,169
Total 31,776 5.4 443,403 75.5 112,490 19.1 587,669
Table A43: Births by maternal age, Queensland 2004 to 2013
Maternal age <20 Maternal age 20–34 Maternal age 35+
Year Public Private Homebirth Public Private Homebirth Public Private Homebirth
2004 2923 77 np 26,861 11,631 33 4432 4066 21
2005 2944 124 np 29,299 12,241 25 5131 4554 16
2006 2990 85 np 29,974 12,283 30 5498 4840 16
2007 3160 99 np 31,951 12,559 54 6111 5266 26
2008 3362 94 np 32,100 12,759 72 6441 5459 38
2009 3269 70 np 32,598 12,842 83 6683 5439 39
2010 3267 77 np 32,775 12,710 54 6538 5575 31
2011 3056 62 np 33,239 12,524 42 6852 5320 25
2012 3096 68 np 34,746 12,620 60 6771 5263 24
2013 2886 52 np 34,509 12,644 57 6801 5179 31
Total 30,953 808 np 318,052 124,813 510 61,258 50,961 267
% of age group
97.5 2.5 – 71.7 28.2 0.1 54.5 45.3 0.2
% of care mode
7.5 0.5 – 77.5 70.7 65.6 14.9 28.9 34.4
Table A44: Number of women giving birth by maternal age group and mode of healthcare delivery, Queensland 2004 to 2013 (np = not published, data incomplete: n = 47)
Pregnancy plurality
Maternal age Singleton TwinsHigher
multiple%
Twins%
Higher multiple%
All multiple
20 or less 23,898 175 5 0.1 0.0 0.1
21–25 58,040 659 11 0.2 0.0 0.2
26–30 92,637 1411 26 0.5 0.0 0.5
31–35 82,833 1560 40 0.5 0.0 0.5
36 or more 45,574 1116 23 0.4 0.0 0.4
Total 302,982 4921 105 1.6 0.0 1.6
Table A45: Number of women giving birth by maternal age group and plurality, Queensland 2009 to 2013
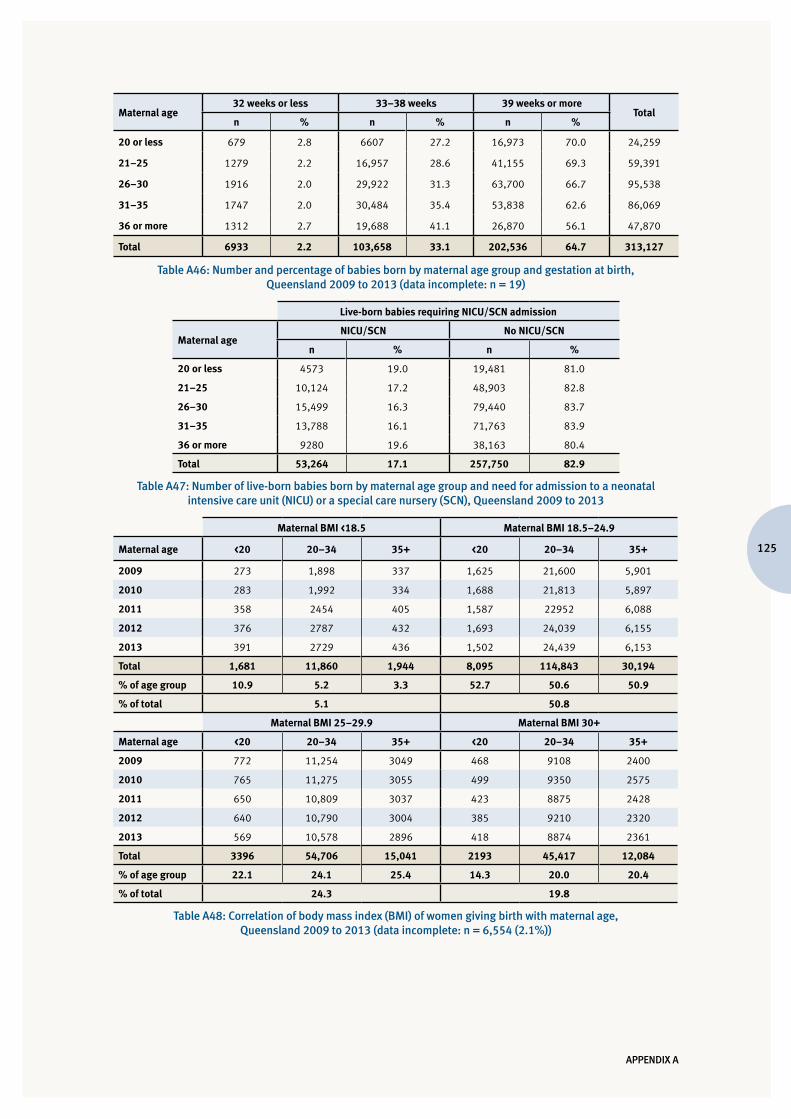
125
APPENDIX A
Maternal age32 weeks or less 33–38 weeks 39 weeks or more
Totaln % n % n %
20 or less 679 2.8 6607 27.2 16,973 70.0 24,259
21–25 1279 2.2 16,957 28.6 41,155 69.3 59,391
26–30 1916 2.0 29,922 31.3 63,700 66.7 95,538
31–35 1747 2.0 30,484 35.4 53,838 62.6 86,069
36 or more 1312 2.7 19,688 41.1 26,870 56.1 47,870
Total 6933 2.2 103,658 33.1 202,536 64.7 313,127
Table A46: Number and percentage of babies born by maternal age group and gestation at birth, Queensland 2009 to 2013 (data incomplete: n = 19)
Live-born babies requiring NICU/SCN admission
Maternal ageNICU/SCN No NICU/SCN
n % n %
20 or less 4573 19.0 19,481 81.0
21–25 10,124 17.2 48,903 82.8
26–30 15,499 16.3 79,440 83.7
31–35 13,788 16.1 71,763 83.9
36 or more 9280 19.6 38,163 80.4
Total 53,264 17.1 257,750 82.9
Table A47: Number of live-born babies born by maternal age group and need for admission to a neonatal intensive care unit (NICU) or a special care nursery (SCN), Queensland 2009 to 2013
Maternal BMI <18.5 Maternal BMI 18.5–24.9
Maternal age <20 20–34 35+ <20 20–34 35+
2009 273 1,898 337 1,625 21,600 5,901
2010 283 1,992 334 1,688 21,813 5,897
2011 358 2454 405 1,587 22952 6,088
2012 376 2787 432 1,693 24,039 6,155
2013 391 2729 436 1,502 24,439 6,153
Total 1,681 11,860 1,944 8,095 114,843 30,194
% of age group 10.9 5.2 3.3 52.7 50.6 50.9
% of total 5.1 50.8
Maternal BMI 25–29.9 Maternal BMI 30+
Maternal age <20 20–34 35+ <20 20–34 35+
2009 772 11,254 3049 468 9108 2400
2010 765 11,275 3055 499 9350 2575
2011 650 10,809 3037 423 8875 2428
2012 640 10,790 3004 385 9210 2320
2013 569 10,578 2896 418 8874 2361
Total 3396 54,706 15,041 2193 45,417 12,084
% of age group 22.1 24.1 25.4 14.3 20.0 20.4
% of total 24.3 19.8
Table A48: Correlation of body mass index (BMI) of women giving birth with maternal age, Queensland 2009 to 2013 (data incomplete: n = 6,554 (2.1%))
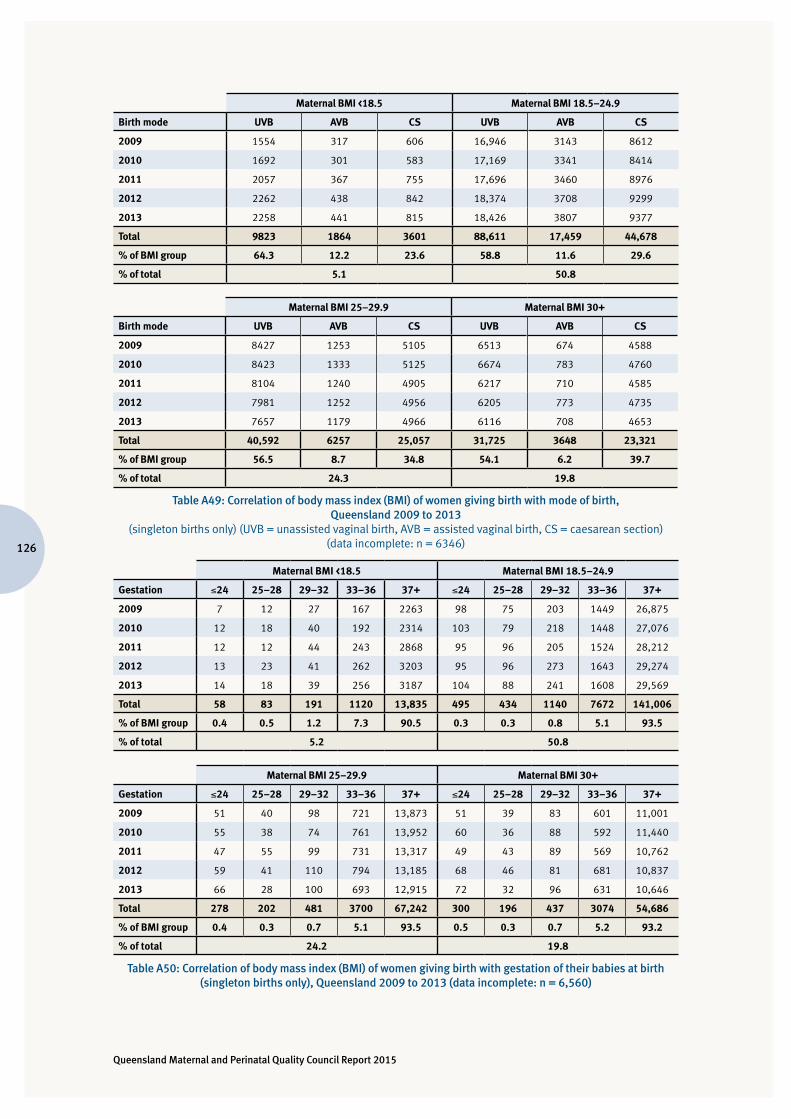
Queensland Maternal and Perinatal Quality Council Report 2015
126
Maternal BMI <18.5 Maternal BMI 18.5–24.9
Birth mode UVB AVB CS UVB AVB CS
2009 1554 317 606 16,946 3143 8612
2010 1692 301 583 17,169 3341 8414
2011 2057 367 755 17,696 3460 8976
2012 2262 438 842 18,374 3708 9299
2013 2258 441 815 18,426 3807 9377
Total 9823 1864 3601 88,611 17,459 44,678
% of BMI group 64.3 12.2 23.6 58.8 11.6 29.6
% of total 5.1 50.8
Maternal BMI 25–29.9 Maternal BMI 30+
Birth mode UVB AVB CS UVB AVB CS
2009 8427 1253 5105 6513 674 4588
2010 8423 1333 5125 6674 783 4760
2011 8104 1240 4905 6217 710 4585
2012 7981 1252 4956 6205 773 4735
2013 7657 1179 4966 6116 708 4653
Total 40,592 6257 25,057 31,725 3648 23,321
% of BMI group 56.5 8.7 34.8 54.1 6.2 39.7
% of total 24.3 19.8
Table A49: Correlation of body mass index (BMI) of women giving birth with mode of birth, Queensland 2009 to 2013
(singleton births only) (UVB = unassisted vaginal birth, AVB = assisted vaginal birth, CS = caesarean section) (data incomplete: n = 6346)
Maternal BMI <18.5 Maternal BMI 18.5–24.9
Gestation ≤24 25–28 29–32 33–36 37+ ≤24 25–28 29–32 33–36 37+
2009 7 12 27 167 2263 98 75 203 1449 26,875
2010 12 18 40 192 2314 103 79 218 1448 27,076
2011 12 12 44 243 2868 95 96 205 1524 28,212
2012 13 23 41 262 3203 95 96 273 1643 29,274
2013 14 18 39 256 3187 104 88 241 1608 29,569
Total 58 83 191 1120 13,835 495 434 1140 7672 141,006
% of BMI group 0.4 0.5 1.2 7.3 90.5 0.3 0.3 0.8 5.1 93.5
% of total 5.2 50.8
Maternal BMI 25–29.9 Maternal BMI 30+
Gestation ≤24 25–28 29–32 33–36 37+ ≤24 25–28 29–32 33–36 37+
2009 51 40 98 721 13,873 51 39 83 601 11,001
2010 55 38 74 761 13,952 60 36 88 592 11,440
2011 47 55 99 731 13,317 49 43 89 569 10,762
2012 59 41 110 794 13,185 68 46 81 681 10,837
2013 66 28 100 693 12,915 72 32 96 631 10,646
Total 278 202 481 3700 67,242 300 196 437 3074 54,686
% of BMI group 0.4 0.3 0.7 5.1 93.5 0.5 0.3 0.7 5.2 93.2
% of total 24.2 19.8
Table A50: Correlation of body mass index (BMI) of women giving birth with gestation of their babies at birth (singleton births only), Queensland 2009 to 2013 (data incomplete: n = 6,560)
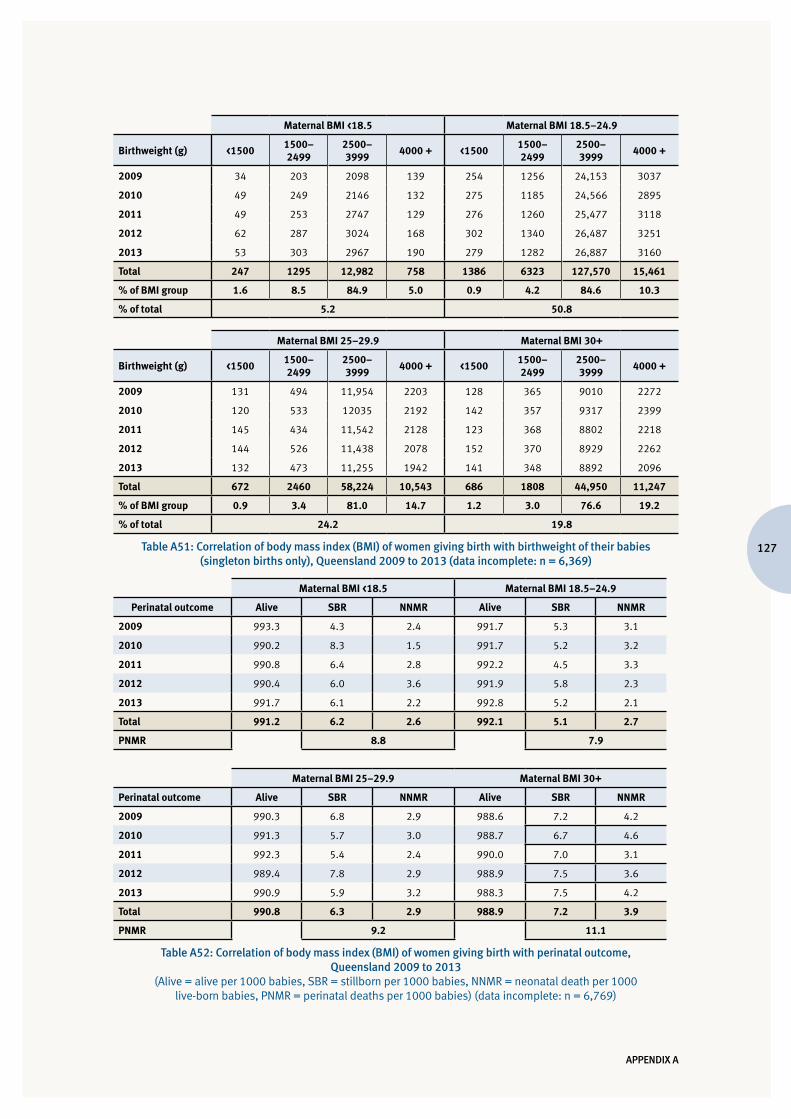
127
APPENDIX A
Maternal BMI <18.5 Maternal BMI 18.5–24.9
Birthweight (g) <15001500–2499
2500–3999
4000 + <15001500–2499
2500–3999
4000 +
2009 34 203 2098 139 254 1256 24,153 3037
2010 49 249 2146 132 275 1185 24,566 2895
2011 49 253 2747 129 276 1260 25,477 3118
2012 62 287 3024 168 302 1340 26,487 3251
2013 53 303 2967 190 279 1282 26,887 3160
Total 247 1295 12,982 758 1386 6323 127,570 15,461
% of BMI group 1.6 8.5 84.9 5.0 0.9 4.2 84.6 10.3
% of total 5.2 50.8
Maternal BMI 25–29.9 Maternal BMI 30+
Birthweight (g) <15001500–2499
2500–3999
4000 + <15001500–2499
2500–3999
4000 +
2009 131 494 11,954 2203 128 365 9010 2272
2010 120 533 12035 2192 142 357 9317 2399
2011 145 434 11,542 2128 123 368 8802 2218
2012 144 526 11,438 2078 152 370 8929 2262
2013 132 473 11,255 1942 141 348 8892 2096
Total 672 2460 58,224 10,543 686 1808 44,950 11,247
% of BMI group 0.9 3.4 81.0 14.7 1.2 3.0 76.6 19.2
% of total 24.2 19.8
Table A51: Correlation of body mass index (BMI) of women giving birth with birthweight of their babies (singleton births only), Queensland 2009 to 2013 (data incomplete: n = 6,369)
Maternal BMI <18.5 Maternal BMI 18.5–24.9
Perinatal outcome Alive SBR NNMR Alive SBR NNMR
2009 993.3 4.3 2.4 991.7 5.3 3.1
2010 990.2 8.3 1.5 991.7 5.2 3.2
2011 990.8 6.4 2.8 992.2 4.5 3.3
2012 990.4 6.0 3.6 991.9 5.8 2.3
2013 991.7 6.1 2.2 992.8 5.2 2.1
Total 991.2 6.2 2.6 992.1 5.1 2.7
PNMR 8.8 7.9
Maternal BMI 25–29.9 Maternal BMI 30+
Perinatal outcome Alive SBR NNMR Alive SBR NNMR
2009 990.3 6.8 2.9 988.6 7.2 4.2
2010 991.3 5.7 3.0 988.7 6.7 4.6
2011 992.3 5.4 2.4 990.0 7.0 3.1
2012 989.4 7.8 2.9 988.9 7.5 3.6
2013 990.9 5.9 3.2 988.3 7.5 4.2
Total 990.8 6.3 2.9 988.9 7.2 3.9
PNMR 9.2 11.1
Table A52: Correlation of body mass index (BMI) of women giving birth with perinatal outcome, Queensland 2009 to 2013
(Alive = alive per 1000 babies, SBR = stillborn per 1000 babies, NNMR = neonatal death per 1000 live-born babies, PNMR = perinatal deaths per 1000 babies) (data incomplete: n = 6,769)
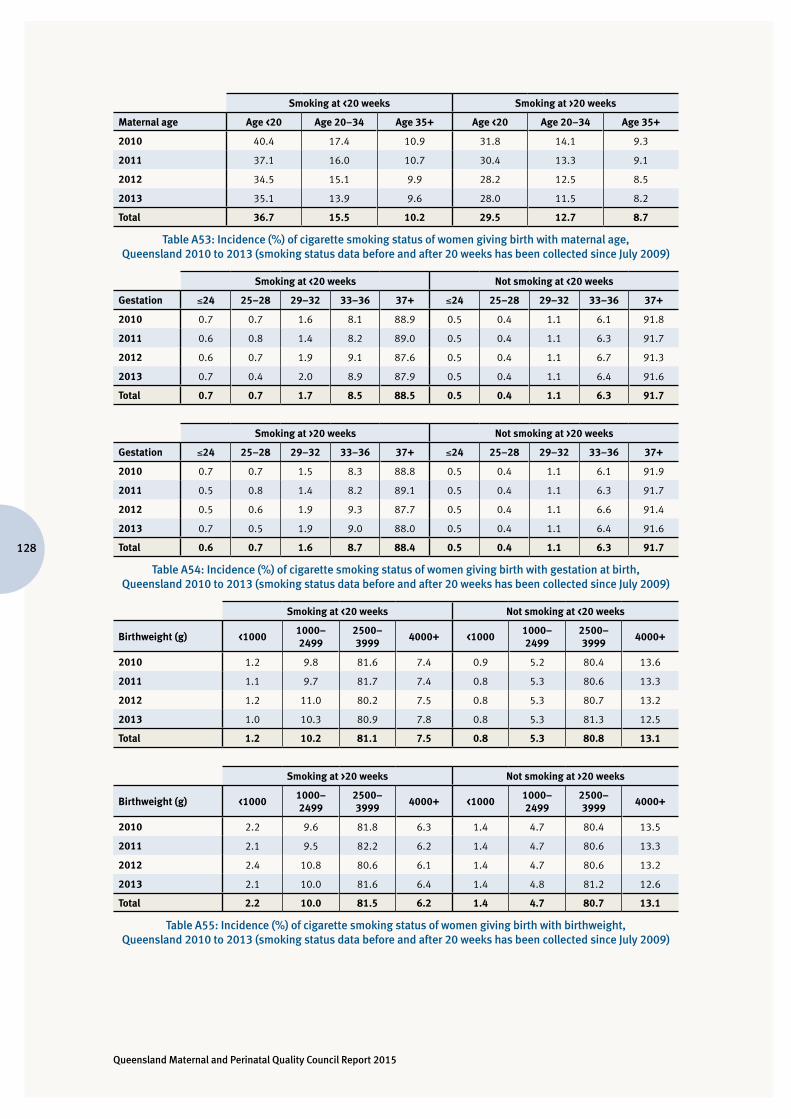
Queensland Maternal and Perinatal Quality Council Report 2015
128
Smoking at <20 weeks Smoking at >20 weeks
Maternal age Age <20 Age 20–34 Age 35+ Age <20 Age 20–34 Age 35+
2010 40.4 17.4 10.9 31.8 14.1 9.3
2011 37.1 16.0 10.7 30.4 13.3 9.1
2012 34.5 15.1 9.9 28.2 12.5 8.5
2013 35.1 13.9 9.6 28.0 11.5 8.2
Total 36.7 15.5 10.2 29.5 12.7 8.7
Table A53: Incidence (%) of cigarette smoking status of women giving birth with maternal age, Queensland 2010 to 2013 (smoking status data before and after 20 weeks has been collected since July 2009)
Smoking at <20 weeks Not smoking at <20 weeks
Gestation ≤24 25–28 29–32 33–36 37+ ≤24 25–28 29–32 33–36 37+
2010 0.7 0.7 1.6 8.1 88.9 0.5 0.4 1.1 6.1 91.8
2011 0.6 0.8 1.4 8.2 89.0 0.5 0.4 1.1 6.3 91.7
2012 0.6 0.7 1.9 9.1 87.6 0.5 0.4 1.1 6.7 91.3
2013 0.7 0.4 2.0 8.9 87.9 0.5 0.4 1.1 6.4 91.6
Total 0.7 0.7 1.7 8.5 88.5 0.5 0.4 1.1 6.3 91.7
Smoking at >20 weeks Not smoking at >20 weeks
Gestation ≤24 25–28 29–32 33–36 37+ ≤24 25–28 29–32 33–36 37+
2010 0.7 0.7 1.5 8.3 88.8 0.5 0.4 1.1 6.1 91.9
2011 0.5 0.8 1.4 8.2 89.1 0.5 0.4 1.1 6.3 91.7
2012 0.5 0.6 1.9 9.3 87.7 0.5 0.4 1.1 6.6 91.4
2013 0.7 0.5 1.9 9.0 88.0 0.5 0.4 1.1 6.4 91.6
Total 0.6 0.7 1.6 8.7 88.4 0.5 0.4 1.1 6.3 91.7
Table A54: Incidence (%) of cigarette smoking status of women giving birth with gestation at birth, Queensland 2010 to 2013 (smoking status data before and after 20 weeks has been collected since July 2009)
Smoking at <20 weeks Not smoking at <20 weeks
Birthweight (g) <10001000–2499
2500–3999
4000+ <10001000–2499
2500–3999
4000+
2010 1.2 9.8 81.6 7.4 0.9 5.2 80.4 13.6
2011 1.1 9.7 81.7 7.4 0.8 5.3 80.6 13.3
2012 1.2 11.0 80.2 7.5 0.8 5.3 80.7 13.2
2013 1.0 10.3 80.9 7.8 0.8 5.3 81.3 12.5
Total 1.2 10.2 81.1 7.5 0.8 5.3 80.8 13.1
Smoking at >20 weeks Not smoking at >20 weeks
Birthweight (g) <10001000–2499
2500–3999
4000+ <10001000–2499
2500–3999
4000+
2010 2.2 9.6 81.8 6.3 1.4 4.7 80.4 13.5
2011 2.1 9.5 82.2 6.2 1.4 4.7 80.6 13.3
2012 2.4 10.8 80.6 6.1 1.4 4.7 80.6 13.2
2013 2.1 10.0 81.6 6.4 1.4 4.8 81.2 12.6
Total 2.2 10.0 81.5 6.2 1.4 4.7 80.7 13.1
Table A55: Incidence (%) of cigarette smoking status of women giving birth with birthweight, Queensland 2010 to 2013 (smoking status data before and after 20 weeks has been collected since July 2009)
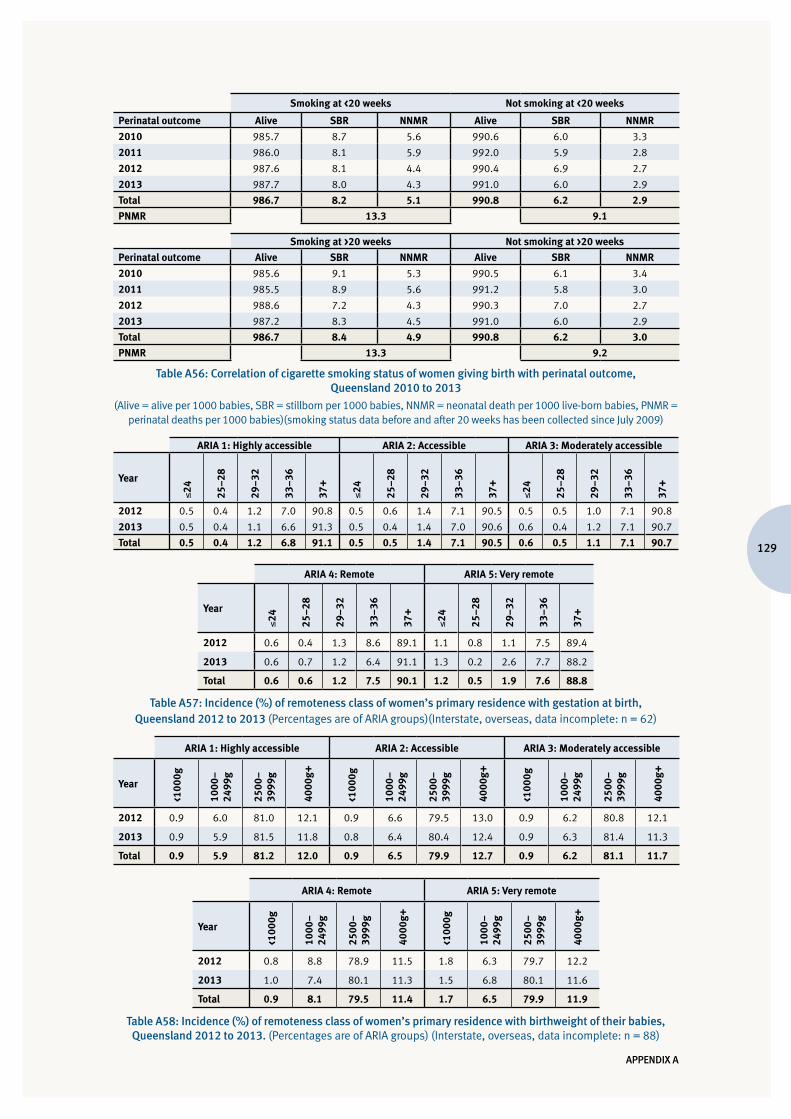
129
APPENDIX A
Smoking at <20 weeks Not smoking at <20 weeks
Perinatal outcome Alive SBR NNMR Alive SBR NNMR
2010 985.7 8.7 5.6 990.6 6.0 3.3
2011 986.0 8.1 5.9 992.0 5.9 2.8
2012 987.6 8.1 4.4 990.4 6.9 2.7
2013 987.7 8.0 4.3 991.0 6.0 2.9
Total 986.7 8.2 5.1 990.8 6.2 2.9
PNMR 13.3 9.1
Smoking at >20 weeks Not smoking at >20 weeks
Perinatal outcome Alive SBR NNMR Alive SBR NNMR
2010 985.6 9.1 5.3 990.5 6.1 3.4
2011 985.5 8.9 5.6 991.2 5.8 3.0
2012 988.6 7.2 4.3 990.3 7.0 2.7
2013 987.2 8.3 4.5 991.0 6.0 2.9
Total 986.7 8.4 4.9 990.8 6.2 3.0
PNMR 13.3 9.2
Table A56: Correlation of cigarette smoking status of women giving birth with perinatal outcome, Queensland 2010 to 2013
(Alive = alive per 1000 babies, SBR = stillborn per 1000 babies, NNMR = neonatal death per 1000 live-born babies, PNMR = perinatal deaths per 1000 babies)(smoking status data before and after 20 weeks has been collected since July 2009)
ARIA 1: Highly accessible ARIA 2: Accessible ARIA 3: Moderately accessible
Year
≤24
25–2
8
29–3
2
33–3
6
37+
≤24
25–2
8
29–3
2
33–3
6
37+
≤24
25–2
8
29–3
2
33–3
6
37+
2012 0.5 0.4 1.2 7.0 90.8 0.5 0.6 1.4 7.1 90.5 0.5 0.5 1.0 7.1 90.8
2013 0.5 0.4 1.1 6.6 91.3 0.5 0.4 1.4 7.0 90.6 0.6 0.4 1.2 7.1 90.7
Total 0.5 0.4 1.2 6.8 91.1 0.5 0.5 1.4 7.1 90.5 0.6 0.5 1.1 7.1 90.7
ARIA 4: Remote ARIA 5: Very remote
Year
≤24
25–2
8
29–3
2
33–3
6
37+
≤24
25–2
8
29–3
2
33–3
6
37+
2012 0.6 0.4 1.3 8.6 89.1 1.1 0.8 1.1 7.5 89.4
2013 0.6 0.7 1.2 6.4 91.1 1.3 0.2 2.6 7.7 88.2
Total 0.6 0.6 1.2 7.5 90.1 1.2 0.5 1.9 7.6 88.8
Table A57: Incidence (%) of remoteness class of women’s primary residence with gestation at birth, Queensland 2012 to 2013 (Percentages are of ARIA groups)(Interstate, overseas, data incomplete: n = 62)
ARIA 1: Highly accessible ARIA 2: Accessible ARIA 3: Moderately accessible
Year
<100
0g
1000
–24
99g
2500
–39
99g
4000
g+
<100
0g
1000
–24
99g
2500
–39
99g
4000
g+
<100
0g
1000
–24
99g
2500
–39
99g
4000
g+
2012 0.9 6.0 81.0 12.1 0.9 6.6 79.5 13.0 0.9 6.2 80.8 12.1
2013 0.9 5.9 81.5 11.8 0.8 6.4 80.4 12.4 0.9 6.3 81.4 11.3
Total 0.9 5.9 81.2 12.0 0.9 6.5 79.9 12.7 0.9 6.2 81.1 11.7
ARIA 4: Remote ARIA 5: Very remote
Year
<100
0g
1000
–24
99g
2500
–39
99g
4000
g+
<100
0g
1000
–24
99g
2500
–39
99g
4000
g+
2012 0.8 8.8 78.9 11.5 1.8 6.3 79.7 12.2
2013 1.0 7.4 80.1 11.3 1.5 6.8 80.1 11.6
Total 0.9 8.1 79.5 11.4 1.7 6.5 79.9 11.9
Table A58: Incidence (%) of remoteness class of women’s primary residence with birthweight of their babies, Queensland 2012 to 2013. (Percentages are of ARIA groups) (Interstate, overseas, data incomplete: n = 88)
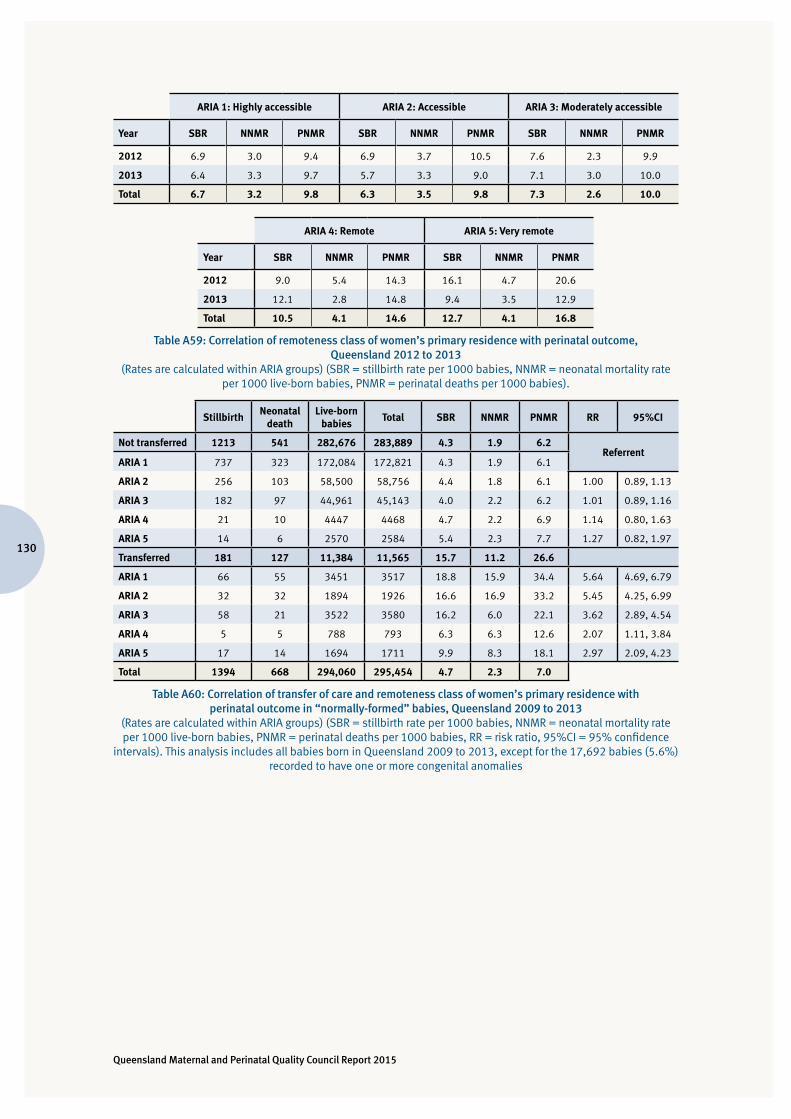
Queensland Maternal and Perinatal Quality Council Report 2015
130
ARIA 1: Highly accessible ARIA 2: Accessible ARIA 3: Moderately accessible
Year SBR NNMR PNMR SBR NNMR PNMR SBR NNMR PNMR
2012 6.9 3.0 9.4 6.9 3.7 10.5 7.6 2.3 9.9
2013 6.4 3.3 9.7 5.7 3.3 9.0 7.1 3.0 10.0
Total 6.7 3.2 9.8 6.3 3.5 9.8 7.3 2.6 10.0
ARIA 4: Remote ARIA 5: Very remote
Year SBR NNMR PNMR SBR NNMR PNMR
2012 9.0 5.4 14.3 16.1 4.7 20.6
2013 12.1 2.8 14.8 9.4 3.5 12.9
Total 10.5 4.1 14.6 12.7 4.1 16.8
Table A59: Correlation of remoteness class of women’s primary residence with perinatal outcome, Queensland 2012 to 2013
(Rates are calculated within ARIA groups) (SBR = stillbirth rate per 1000 babies, NNMR = neonatal mortality rate per 1000 live-born babies, PNMR = perinatal deaths per 1000 babies).
StillbirthNeonatal
deathLive-born
babiesTotal SBR NNMR PNMR RR 95%CI
Not transferred 1213 541 282,676 283,889 4.3 1.9 6.2Referrent
ARIA 1 737 323 172,084 172,821 4.3 1.9 6.1
ARIA 2 256 103 58,500 58,756 4.4 1.8 6.1 1.00 0.89, 1.13
ARIA 3 182 97 44,961 45,143 4.0 2.2 6.2 1.01 0.89, 1.16
ARIA 4 21 10 4447 4468 4.7 2.2 6.9 1.14 0.80, 1.63
ARIA 5 14 6 2570 2584 5.4 2.3 7.7 1.27 0.82, 1.97
Transferred 181 127 11,384 11,565 15.7 11.2 26.6
ARIA 1 66 55 3451 3517 18.8 15.9 34.4 5.64 4.69, 6.79
ARIA 2 32 32 1894 1926 16.6 16.9 33.2 5.45 4.25, 6.99
ARIA 3 58 21 3522 3580 16.2 6.0 22.1 3.62 2.89, 4.54
ARIA 4 5 5 788 793 6.3 6.3 12.6 2.07 1.11, 3.84
ARIA 5 17 14 1694 1711 9.9 8.3 18.1 2.97 2.09, 4.23
Total 1394 668 294,060 295,454 4.7 2.3 7.0
Table A60: Correlation of transfer of care and remoteness class of women’s primary residence with perinatal outcome in “normally-formed” babies, Queensland 2009 to 2013
(Rates are calculated within ARIA groups) (SBR = stillbirth rate per 1000 babies, NNMR = neonatal mortality rate per 1000 live-born babies, PNMR = perinatal deaths per 1000 babies, RR = risk ratio, 95%CI = 95% confidence
intervals). This analysis includes all babies born in Queensland 2009 to 2013, except for the 17,692 babies (5.6%) recorded to have one or more congenital anomalies
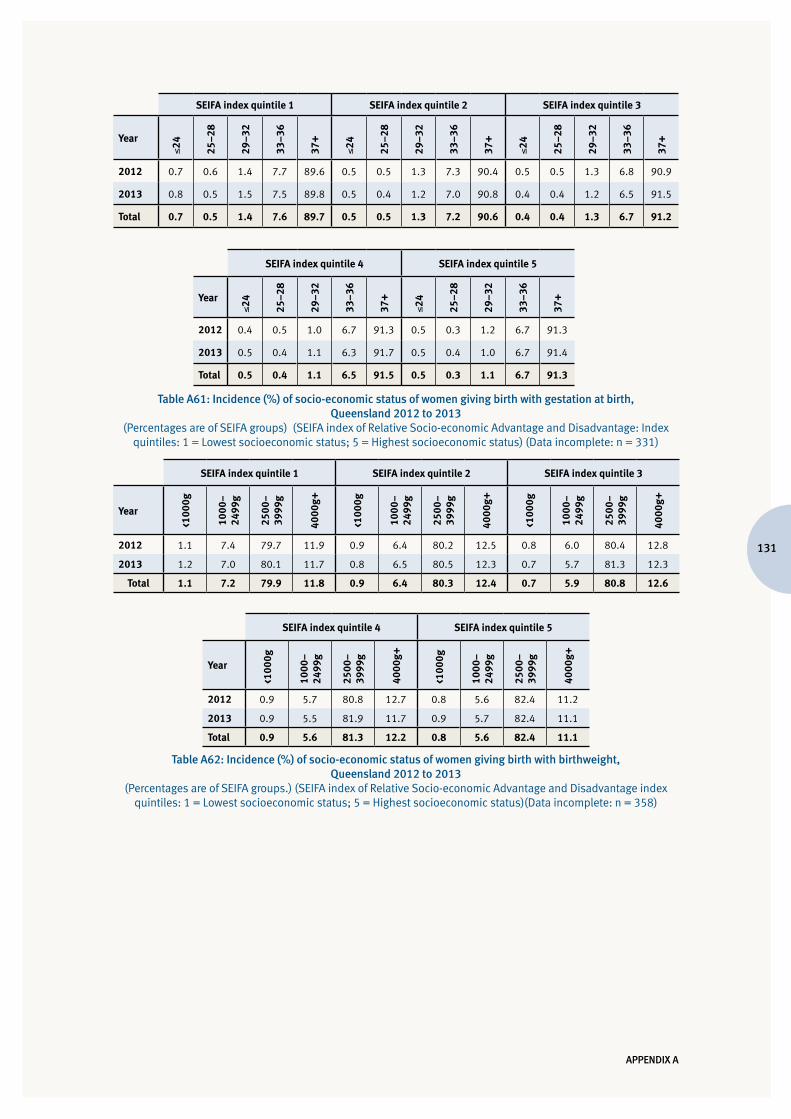
131
APPENDIX A
SEIFA index quintile 1 SEIFA index quintile 2 SEIFA index quintile 3
Year
≤24
25–2
8
29–3
2
33–3
6
37+
≤24
25–2
8
29–3
2
33–3
6
37+
≤24
25–2
8
29–3
2
33–3
6
37+
2012 0.7 0.6 1.4 7.7 89.6 0.5 0.5 1.3 7.3 90.4 0.5 0.5 1.3 6.8 90.9
2013 0.8 0.5 1.5 7.5 89.8 0.5 0.4 1.2 7.0 90.8 0.4 0.4 1.2 6.5 91.5
Total 0.7 0.5 1.4 7.6 89.7 0.5 0.5 1.3 7.2 90.6 0.4 0.4 1.3 6.7 91.2
SEIFA index quintile 4 SEIFA index quintile 5
Year
≤24
25–2
8
29–3
2
33–3
6
37+
≤24
25–2
8
29–3
2
33–3
6
37+
2012 0.4 0.5 1.0 6.7 91.3 0.5 0.3 1.2 6.7 91.3
2013 0.5 0.4 1.1 6.3 91.7 0.5 0.4 1.0 6.7 91.4
Total 0.5 0.4 1.1 6.5 91.5 0.5 0.3 1.1 6.7 91.3
Table A61: Incidence (%) of socio-economic status of women giving birth with gestation at birth, Queensland 2012 to 2013
(Percentages are of SEIFA groups) (SEIFA index of Relative Socio-economic Advantage and Disadvantage: Index quintiles: 1 = Lowest socioeconomic status; 5 = Highest socioeconomic status) (Data incomplete: n = 331)
SEIFA index quintile 1 SEIFA index quintile 2 SEIFA index quintile 3
Year
<100
0g
1000
–24
99g
2500
–39
99g
4000
g+
<100
0g
1000
–24
99g
2500
–39
99g
4000
g+
<100
0g
1000
–24
99g
2500
–39
99g
4000
g+
2012 1.1 7.4 79.7 11.9 0.9 6.4 80.2 12.5 0.8 6.0 80.4 12.8
2013 1.2 7.0 80.1 11.7 0.8 6.5 80.5 12.3 0.7 5.7 81.3 12.3
Total 1.1 7.2 79.9 11.8 0.9 6.4 80.3 12.4 0.7 5.9 80.8 12.6
SEIFA index quintile 4 SEIFA index quintile 5
Year
<100
0g
1000
–24
99g
2500
–39
99g
4000
g+
<100
0g
1000
–24
99g
2500
–39
99g
4000
g+
2012 0.9 5.7 80.8 12.7 0.8 5.6 82.4 11.2
2013 0.9 5.5 81.9 11.7 0.9 5.7 82.4 11.1
Total 0.9 5.6 81.3 12.2 0.8 5.6 82.4 11.1
Table A62: Incidence (%) of socio-economic status of women giving birth with birthweight, Queensland 2012 to 2013
(Percentages are of SEIFA groups.) (SEIFA index of Relative Socio-economic Advantage and Disadvantage index quintiles: 1 = Lowest socioeconomic status; 5 = Highest socioeconomic status)(Data incomplete: n = 358)
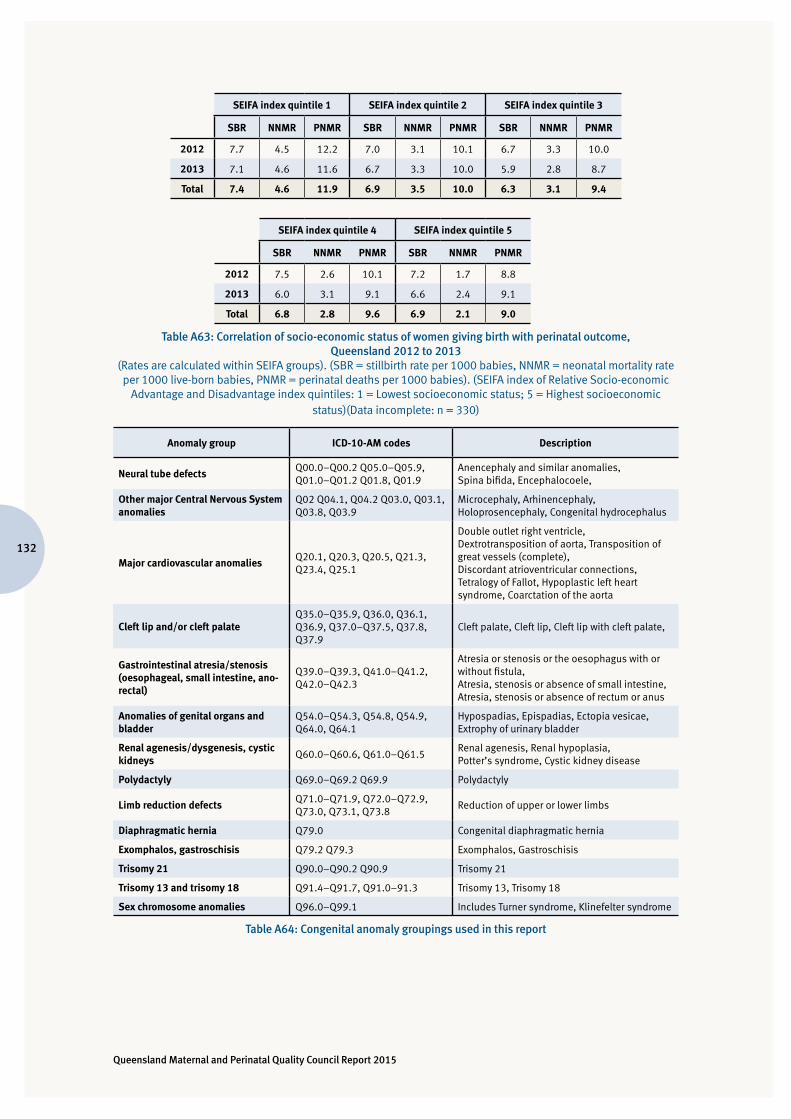
Queensland Maternal and Perinatal Quality Council Report 2015
132
SEIFA index quintile 1 SEIFA index quintile 2 SEIFA index quintile 3
SBR NNMR PNMR SBR NNMR PNMR SBR NNMR PNMR
2012 7.7 4.5 12.2 7.0 3.1 10.1 6.7 3.3 10.0
2013 7.1 4.6 11.6 6.7 3.3 10.0 5.9 2.8 8.7
Total 7.4 4.6 11.9 6.9 3.5 10.0 6.3 3.1 9.4
SEIFA index quintile 4 SEIFA index quintile 5
SBR NNMR PNMR SBR NNMR PNMR
2012 7.5 2.6 10.1 7.2 1.7 8.8
2013 6.0 3.1 9.1 6.6 2.4 9.1
Total 6.8 2.8 9.6 6.9 2.1 9.0
Table A63: Correlation of socio-economic status of women giving birth with perinatal outcome, Queensland 2012 to 2013
(Rates are calculated within SEIFA groups). (SBR = stillbirth rate per 1000 babies, NNMR = neonatal mortality rate per 1000 live-born babies, PNMR = perinatal deaths per 1000 babies). (SEIFA index of Relative Socio-economic
Advantage and Disadvantage index quintiles: 1 = Lowest socioeconomic status; 5 = Highest socioeconomic status)(Data incomplete: n = 330)
Anomaly group ICD-10-AM codes Description
Neural tube defectsQ00.0–Q00.2 Q05.0–Q05.9, Q01.0–Q01.2 Q01.8, Q01.9
Anencephaly and similar anomalies, Spina bifida, Encephalocoele,
Other major Central Nervous System anomalies
Q02 Q04.1, Q04.2 Q03.0, Q03.1, Q03.8, Q03.9
Microcephaly, Arhinencephaly, Holoprosencephaly, Congenital hydrocephalus
Major cardiovascular anomaliesQ20.1, Q20.3, Q20.5, Q21.3, Q23.4, Q25.1
Double outlet right ventricle, Dextrotransposition of aorta, Transposition of great vessels (complete), Discordant atrioventricular connections, Tetralogy of Fallot, Hypoplastic left heart syndrome, Coarctation of the aorta
Cleft lip and/or cleft palateQ35.0–Q35.9, Q36.0, Q36.1, Q36.9, Q37.0–Q37.5, Q37.8, Q37.9
Cleft palate, Cleft lip, Cleft lip with cleft palate,
Gastrointestinal atresia/stenosis (oesophageal, small intestine, ano-rectal)
Q39.0–Q39.3, Q41.0–Q41.2, Q42.0–Q42.3
Atresia or stenosis or the oesophagus with or without fistula,Atresia, stenosis or absence of small intestine,Atresia, stenosis or absence of rectum or anus
Anomalies of genital organs and bladder
Q54.0–Q54.3, Q54.8, Q54.9, Q64.0, Q64.1
Hypospadias, Epispadias, Ectopia vesicae,Extrophy of urinary bladder
Renal agenesis/dysgenesis, cystic kidneys
Q60.0–Q60.6, Q61.0–Q61.5Renal agenesis, Renal hypoplasia,Potter’s syndrome, Cystic kidney disease
Polydactyly Q69.0–Q69.2 Q69.9 Polydactyly
Limb reduction defectsQ71.0–Q71.9, Q72.0–Q72.9, Q73.0, Q73.1, Q73.8
Reduction of upper or lower limbs
Diaphragmatic hernia Q79.0 Congenital diaphragmatic hernia
Exomphalos, gastroschisis Q79.2 Q79.3 Exomphalos, Gastroschisis
Trisomy 21 Q90.0–Q90.2 Q90.9 Trisomy 21
Trisomy 13 and trisomy 18 Q91.4–Q91.7, Q91.0–91.3 Trisomy 13, Trisomy 18
Sex chromosome anomalies Q96.0–Q99.1 Includes Turner syndrome, Klinefelter syndrome
Table A64: Congenital anomaly groupings used in this report
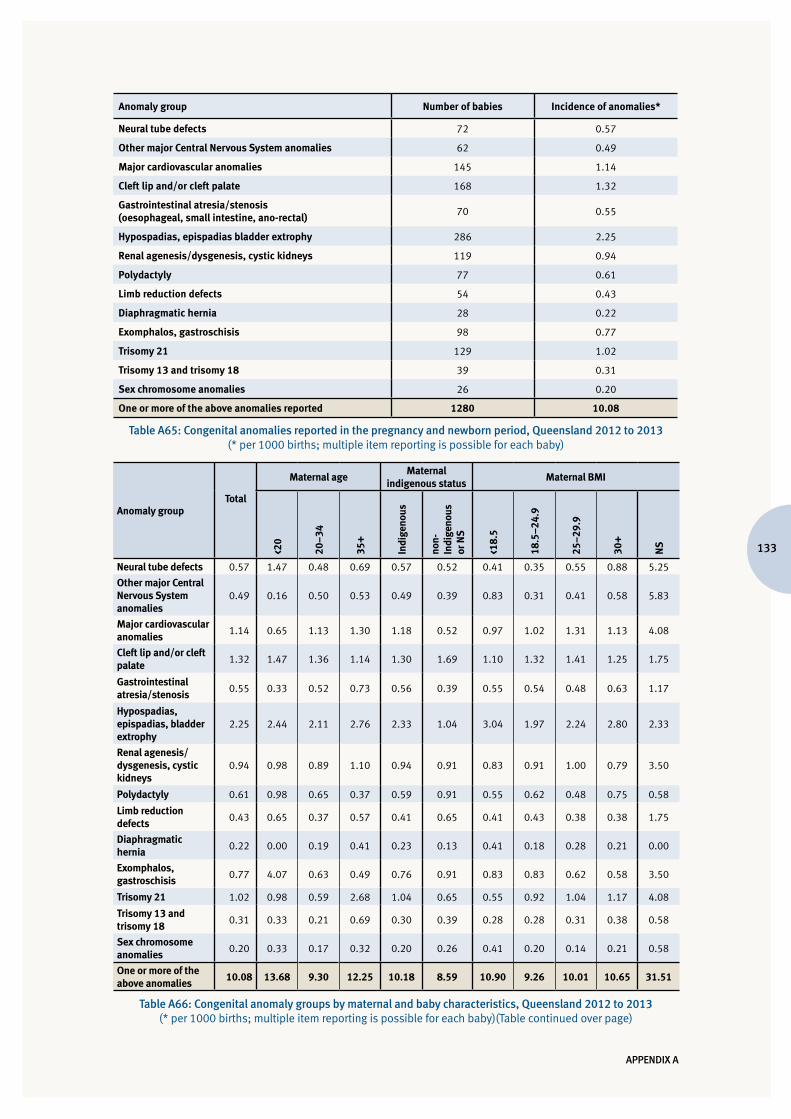
133
APPENDIX A
Anomaly group Number of babies Incidence of anomalies*
Neural tube defects 72 0.57
Other major Central Nervous System anomalies 62 0.49
Major cardiovascular anomalies 145 1.14
Cleft lip and/or cleft palate 168 1.32
Gastrointestinal atresia/stenosis (oesophageal, small intestine, ano-rectal)
70 0.55
Hypospadias, epispadias bladder extrophy 286 2.25
Renal agenesis/dysgenesis, cystic kidneys 119 0.94
Polydactyly 77 0.61
Limb reduction defects 54 0.43
Diaphragmatic hernia 28 0.22
Exomphalos, gastroschisis 98 0.77
Trisomy 21 129 1.02
Trisomy 13 and trisomy 18 39 0.31
Sex chromosome anomalies 26 0.20
One or more of the above anomalies reported 1280 10.08
Table A65: Congenital anomalies reported in the pregnancy and newborn period, Queensland 2012 to 2013 (* per 1000 births; multiple item reporting is possible for each baby)
Anomaly groupTotal
Maternal ageMaternal
indigenous statusMaternal BMI
<20
20–3
4
35+
Indi
geno
us
non-
Indi
geno
us
or N
S
<18.
5
18.5
–24.
9
25–2
9.9
30+
NS
Neural tube defects 0.57 1.47 0.48 0.69 0.57 0.52 0.41 0.35 0.55 0.88 5.25
Other major Central Nervous System anomalies
0.49 0.16 0.50 0.53 0.49 0.39 0.83 0.31 0.41 0.58 5.83
Major cardiovascular anomalies
1.14 0.65 1.13 1.30 1.18 0.52 0.97 1.02 1.31 1.13 4.08
Cleft lip and/or cleft palate
1.32 1.47 1.36 1.14 1.30 1.69 1.10 1.32 1.41 1.25 1.75
Gastrointestinal atresia/stenosis
0.55 0.33 0.52 0.73 0.56 0.39 0.55 0.54 0.48 0.63 1.17
Hypospadias, epispadias, bladder extrophy
2.25 2.44 2.11 2.76 2.33 1.04 3.04 1.97 2.24 2.80 2.33
Renal agenesis/ dysgenesis, cystic kidneys
0.94 0.98 0.89 1.10 0.94 0.91 0.83 0.91 1.00 0.79 3.50
Polydactyly 0.61 0.98 0.65 0.37 0.59 0.91 0.55 0.62 0.48 0.75 0.58
Limb reduction defects
0.43 0.65 0.37 0.57 0.41 0.65 0.41 0.43 0.38 0.38 1.75
Diaphragmatic hernia
0.22 0.00 0.19 0.41 0.23 0.13 0.41 0.18 0.28 0.21 0.00
Exomphalos, gastroschisis
0.77 4.07 0.63 0.49 0.76 0.91 0.83 0.83 0.62 0.58 3.50
Trisomy 21 1.02 0.98 0.59 2.68 1.04 0.65 0.55 0.92 1.04 1.17 4.08
Trisomy 13 and trisomy 18
0.31 0.33 0.21 0.69 0.30 0.39 0.28 0.28 0.31 0.38 0.58
Sex chromosome anomalies
0.20 0.33 0.17 0.32 0.20 0.26 0.41 0.20 0.14 0.21 0.58
One or more of the above anomalies
10.08 13.68 9.30 12.25 10.18 8.59 10.90 9.26 10.01 10.65 31.51
Table A66: Congenital anomaly groups by maternal and baby characteristics, Queensland 2012 to 2013 (* per 1000 births; multiple item reporting is possible for each baby)(Table continued over page)
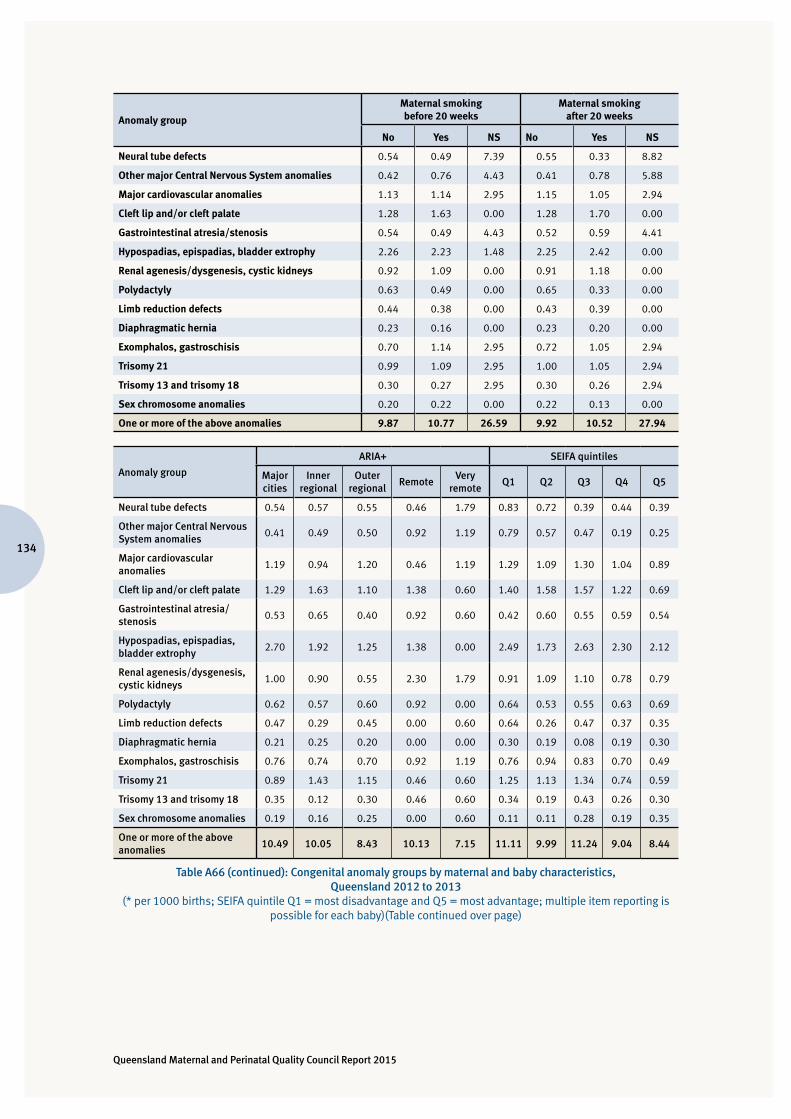
Queensland Maternal and Perinatal Quality Council Report 2015
134
Anomaly group
Maternal smoking before 20 weeks
Maternal smoking after 20 weeks
No Yes NS No Yes NS
Neural tube defects 0.54 0.49 7.39 0.55 0.33 8.82
Other major Central Nervous System anomalies 0.42 0.76 4.43 0.41 0.78 5.88
Major cardiovascular anomalies 1.13 1.14 2.95 1.15 1.05 2.94
Cleft lip and/or cleft palate 1.28 1.63 0.00 1.28 1.70 0.00
Gastrointestinal atresia/stenosis 0.54 0.49 4.43 0.52 0.59 4.41
Hypospadias, epispadias, bladder extrophy 2.26 2.23 1.48 2.25 2.42 0.00
Renal agenesis/dysgenesis, cystic kidneys 0.92 1.09 0.00 0.91 1.18 0.00
Polydactyly 0.63 0.49 0.00 0.65 0.33 0.00
Limb reduction defects 0.44 0.38 0.00 0.43 0.39 0.00
Diaphragmatic hernia 0.23 0.16 0.00 0.23 0.20 0.00
Exomphalos, gastroschisis 0.70 1.14 2.95 0.72 1.05 2.94
Trisomy 21 0.99 1.09 2.95 1.00 1.05 2.94
Trisomy 13 and trisomy 18 0.30 0.27 2.95 0.30 0.26 2.94
Sex chromosome anomalies 0.20 0.22 0.00 0.22 0.13 0.00
One or more of the above anomalies 9.87 10.77 26.59 9.92 10.52 27.94
Anomaly group
ARIA+ SEIFA quintiles
Major cities
Inner regional
Outer regional
RemoteVery
remoteQ1 Q2 Q3 Q4 Q5
Neural tube defects 0.54 0.57 0.55 0.46 1.79 0.83 0.72 0.39 0.44 0.39
Other major Central Nervous System anomalies
0.41 0.49 0.50 0.92 1.19 0.79 0.57 0.47 0.19 0.25
Major cardiovascular anomalies
1.19 0.94 1.20 0.46 1.19 1.29 1.09 1.30 1.04 0.89
Cleft lip and/or cleft palate 1.29 1.63 1.10 1.38 0.60 1.40 1.58 1.57 1.22 0.69
Gastrointestinal atresia/stenosis
0.53 0.65 0.40 0.92 0.60 0.42 0.60 0.55 0.59 0.54
Hypospadias, epispadias, bladder extrophy
2.70 1.92 1.25 1.38 0.00 2.49 1.73 2.63 2.30 2.12
Renal agenesis/dysgenesis, cystic kidneys
1.00 0.90 0.55 2.30 1.79 0.91 1.09 1.10 0.78 0.79
Polydactyly 0.62 0.57 0.60 0.92 0.00 0.64 0.53 0.55 0.63 0.69
Limb reduction defects 0.47 0.29 0.45 0.00 0.60 0.64 0.26 0.47 0.37 0.35
Diaphragmatic hernia 0.21 0.25 0.20 0.00 0.00 0.30 0.19 0.08 0.19 0.30
Exomphalos, gastroschisis 0.76 0.74 0.70 0.92 1.19 0.76 0.94 0.83 0.70 0.49
Trisomy 21 0.89 1.43 1.15 0.46 0.60 1.25 1.13 1.34 0.74 0.59
Trisomy 13 and trisomy 18 0.35 0.12 0.30 0.46 0.60 0.34 0.19 0.43 0.26 0.30
Sex chromosome anomalies 0.19 0.16 0.25 0.00 0.60 0.11 0.11 0.28 0.19 0.35
One or more of the above anomalies
10.49 10.05 8.43 10.13 7.15 11.11 9.99 11.24 9.04 8.44
Table A66 (continued): Congenital anomaly groups by maternal and baby characteristics, Queensland 2012 to 2013
(* per 1000 births; SEIFA quintile Q1 = most disadvantage and Q5 = most advantage; multiple item reporting is possible for each baby)(Table continued over page)
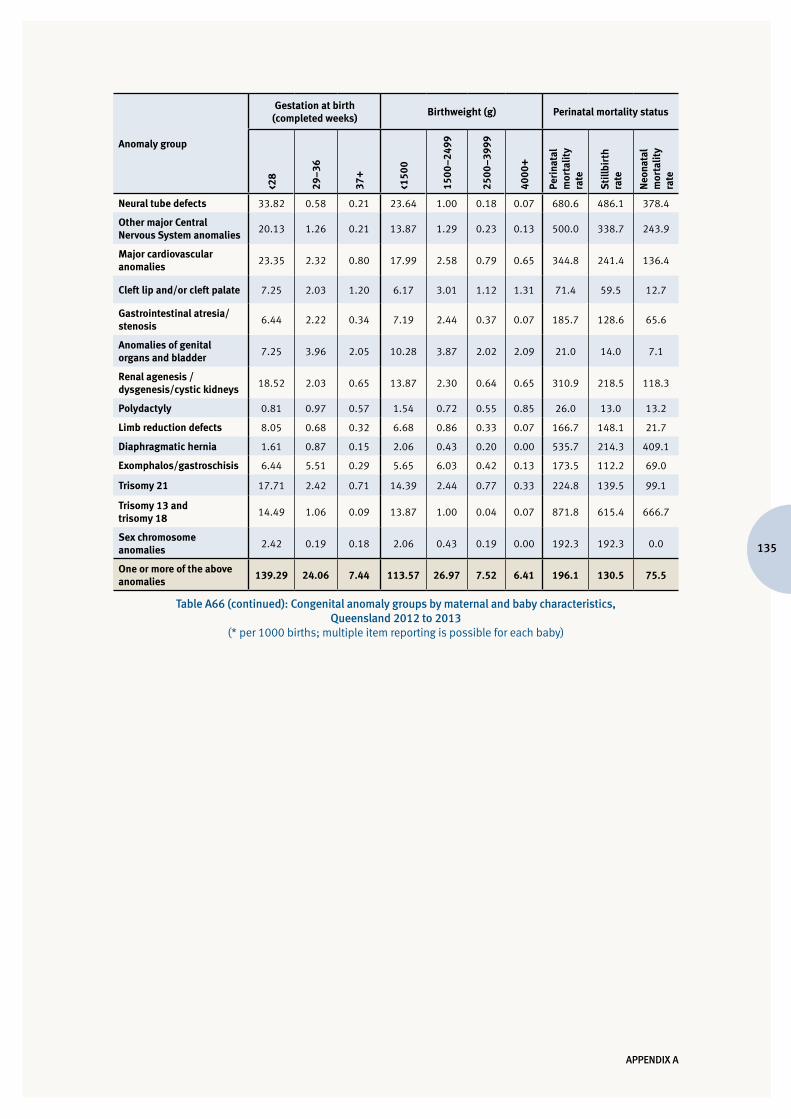
135
APPENDIX A
Anomaly group
Gestation at birth (completed weeks)
Birthweight (g) Perinatal mortality status
<28
29–3
6
37+
<150
0
1500
–249
9
2500
–399
9
4000
+
Peri
nata
l m
orta
lity
rate
Sti
llbir
th
rate
Neo
nata
l m
orta
lity
rate
Neural tube defects 33.82 0.58 0.21 23.64 1.00 0.18 0.07 680.6 486.1 378.4
Other major Central Nervous System anomalies
20.13 1.26 0.21 13.87 1.29 0.23 0.13 500.0 338.7 243.9
Major cardiovascular anomalies
23.35 2.32 0.80 17.99 2.58 0.79 0.65 344.8 241.4 136.4
Cleft lip and/or cleft palate 7.25 2.03 1.20 6.17 3.01 1.12 1.31 71.4 59.5 12.7
Gastrointestinal atresia/stenosis
6.44 2.22 0.34 7.19 2.44 0.37 0.07 185.7 128.6 65.6
Anomalies of genital organs and bladder
7.25 3.96 2.05 10.28 3.87 2.02 2.09 21.0 14.0 7.1
Renal agenesis / dysgenesis/cystic kidneys
18.52 2.03 0.65 13.87 2.30 0.64 0.65 310.9 218.5 118.3
Polydactyly 0.81 0.97 0.57 1.54 0.72 0.55 0.85 26.0 13.0 13.2
Limb reduction defects 8.05 0.68 0.32 6.68 0.86 0.33 0.07 166.7 148.1 21.7
Diaphragmatic hernia 1.61 0.87 0.15 2.06 0.43 0.20 0.00 535.7 214.3 409.1
Exomphalos/gastroschisis 6.44 5.51 0.29 5.65 6.03 0.42 0.13 173.5 112.2 69.0
Trisomy 21 17.71 2.42 0.71 14.39 2.44 0.77 0.33 224.8 139.5 99.1
Trisomy 13 and trisomy 18
14.49 1.06 0.09 13.87 1.00 0.04 0.07 871.8 615.4 666.7
Sex chromosome anomalies
2.42 0.19 0.18 2.06 0.43 0.19 0.00 192.3 192.3 0.0
One or more of the above anomalies
139.29 24.06 7.44 113.57 26.97 7.52 6.41 196.1 130.5 75.5
Table A66 (continued): Congenital anomaly groups by maternal and baby characteristics, Queensland 2012 to 2013
(* per 1000 births; multiple item reporting is possible for each baby)
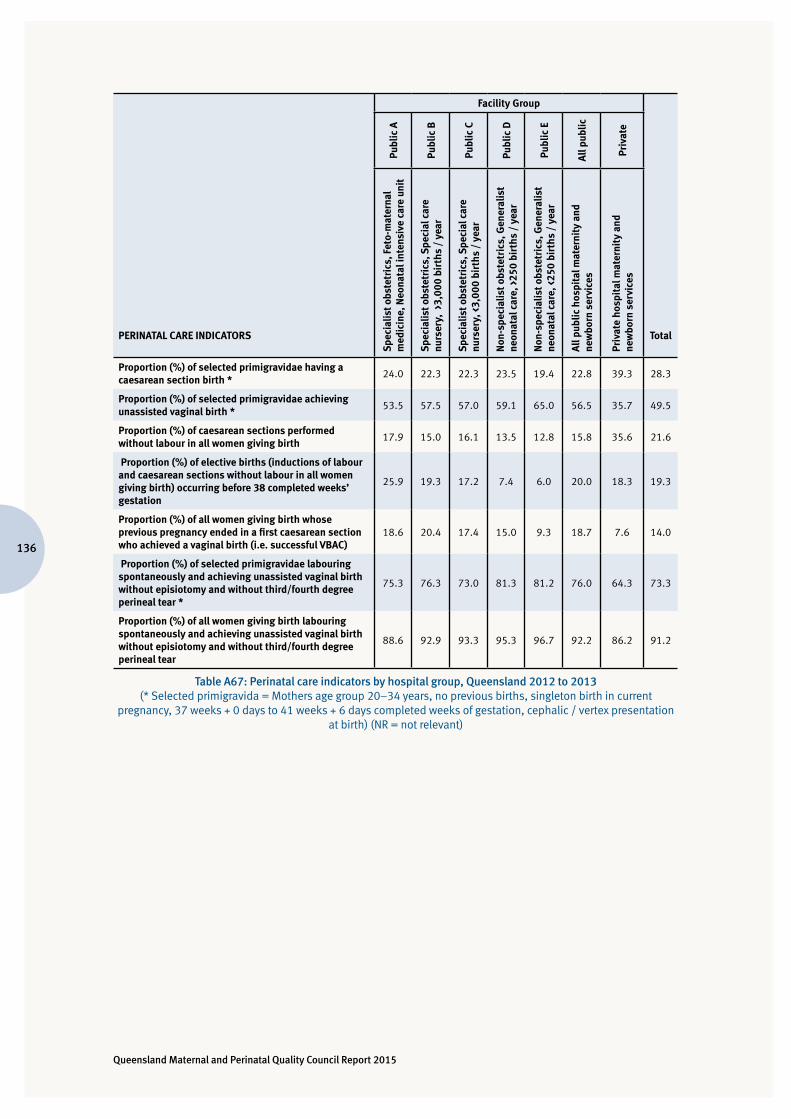
Queensland Maternal and Perinatal Quality Council Report 2015
136
PERINATAL CARE INDICATORS
Facility Group
Total
Publ
ic A
Publ
ic B
Publ
ic C
Publ
ic D
Publ
ic E
All p
ublic
Priv
ate
Spec
ialis
t obs
tetr
ics,
Fet
o-m
ater
nal
med
icin
e, N
eona
tal i
nten
sive
car
e un
it
Spec
ialis
t obs
tetr
ics,
Spe
cial
car
e nu
rser
y, >
3,00
0 bi
rths
/ y
ear
Spec
ialis
t obs
tetr
ics,
Spe
cial
car
e nu
rser
y, <
3,00
0 bi
rths
/ y
ear
Non
-spe
cial
ist o
bste
tric
s, G
ener
alis
t ne
onat
al c
are,
>25
0 bi
rths
/ y
ear
Non
-spe
cial
ist o
bste
tric
s, G
ener
alis
t ne
onat
al c
are,
<25
0 bi
rths
/ y
ear
All p
ublic
hos
pita
l mat
erni
ty a
nd
new
born
ser
vice
s
Priv
ate
hosp
ital
mat
erni
ty a
nd
new
born
ser
vice
s
Proportion (%) of selected primigravidae having a caesarean section birth *
24.0 22.3 22.3 23.5 19.4 22.8 39.3 28.3
Proportion (%) of selected primigravidae achieving unassisted vaginal birth *
53.5 57.5 57.0 59.1 65.0 56.5 35.7 49.5
Proportion (%) of caesarean sections performed without labour in all women giving birth
17.9 15.0 16.1 13.5 12.8 15.8 35.6 21.6
Proportion (%) of elective births (inductions of labour and caesarean sections without labour in all women giving birth) occurring before 38 completed weeks’ gestation
25.9 19.3 17.2 7.4 6.0 20.0 18.3 19.3
Proportion (%) of all women giving birth whose previous pregnancy ended in a first caesarean section who achieved a vaginal birth (i.e. successful VBAC)
18.6 20.4 17.4 15.0 9.3 18.7 7.6 14.0
Proportion (%) of selected primigravidae labouring spontaneously and achieving unassisted vaginal birth without episiotomy and without third/fourth degree perineal tear *
75.3 76.3 73.0 81.3 81.2 76.0 64.3 73.3
Proportion (%) of all women giving birth labouring spontaneously and achieving unassisted vaginal birth without episiotomy and without third/fourth degree perineal tear
88.6 92.9 93.3 95.3 96.7 92.2 86.2 91.2
Table A67: Perinatal care indicators by hospital group, Queensland 2012 to 2013(* Selected primigravida = Mothers age group 20–34 years, no previous births, singleton birth in current
pregnancy, 37 weeks + 0 days to 41 weeks + 6 days completed weeks of gestation, cephalic / vertex presentation at birth) (NR = not relevant)

137
APPENDIX B
APPENDIX B. Data sources used in this report
Joanne Ellerington, Principal Data Collection Officer, Health Statistics Branch, Queensland Department of Health, provided major support to QMPQC over this period with regular review of the Perinatal Data Collection, particularly regarding maternal and perinatal deaths.
Pregnancy, birth and neonatal data for the 10 year period 2004 to 2013 were sourced from the Queensland Health Perinatal Data Collection and prepared by Ms Vesna Dunne, Principal Statistical Output Officer, Statistical Output and Library Services, Health Statistics Branch, Queensland Department of Health.
Congenital anomaly data were provided by Dr Trisha Johnston and Taku Endo of the Statistical Analysis and Linkage Team (SALT), Health Statistics Branch, Queensland Government.
These data were further analysed and collated by Professor Michael Humphrey, Chair, Queensland Maternal and Perinatal Quality Council.
Previous reports by the Queensland Maternal and Perinatal Quality Council and Queensland Council on Obstetric and Paediatric Morbidity and Mortality (QCOPMM) were sources of data regarding maternal and perinatal deaths from 1988 to 2003, as were Australian Institute of Health and Welfare (AIHW) reports on Maternal Deaths in Australia.
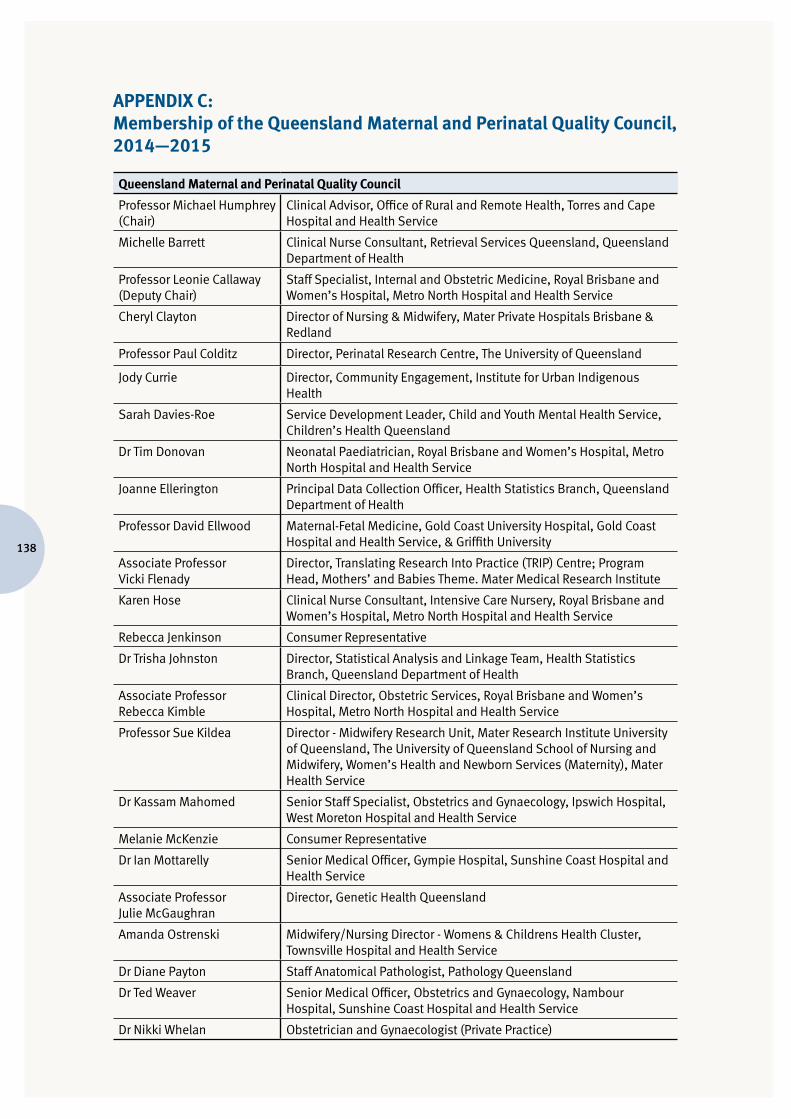
138
APPENDIX C: Membership of the Queensland Maternal and Perinatal Quality Council, 2014—2015
Queensland Maternal and Perinatal Quality Council
Professor Michael Humphrey (Chair)
Clinical Advisor, Office of Rural and Remote Health, Torres and Cape Hospital and Health Service
Michelle Barrett Clinical Nurse Consultant, Retrieval Services Queensland, Queensland Department of Health
Professor Leonie Callaway (Deputy Chair)
Staff Specialist, Internal and Obstetric Medicine, Royal Brisbane and Women’s Hospital, Metro North Hospital and Health Service
Cheryl Clayton Director of Nursing & Midwifery, Mater Private Hospitals Brisbane & Redland
Professor Paul Colditz Director, Perinatal Research Centre, The University of Queensland
Jody Currie Director, Community Engagement, Institute for Urban Indigenous Health
Sarah Davies-Roe Service Development Leader, Child and Youth Mental Health Service, Children’s Health Queensland
Dr Tim Donovan Neonatal Paediatrician, Royal Brisbane and Women’s Hospital, Metro North Hospital and Health Service
Joanne Ellerington Principal Data Collection Officer, Health Statistics Branch, Queensland Department of Health
Professor David Ellwood Maternal-Fetal Medicine, Gold Coast University Hospital, Gold Coast Hospital and Health Service, & Griffith University
Associate Professor Vicki Flenady
Director, Translating Research Into Practice (TRIP) Centre; Program Head, Mothers’ and Babies Theme. Mater Medical Research Institute
Karen Hose Clinical Nurse Consultant, Intensive Care Nursery, Royal Brisbane and Women’s Hospital, Metro North Hospital and Health Service
Rebecca Jenkinson Consumer Representative
Dr Trisha Johnston Director, Statistical Analysis and Linkage Team, Health Statistics Branch, Queensland Department of Health
Associate Professor Rebecca Kimble
Clinical Director, Obstetric Services, Royal Brisbane and Women’s Hospital, Metro North Hospital and Health Service
Professor Sue Kildea Director - Midwifery Research Unit, Mater Research Institute University of Queensland, The University of Queensland School of Nursing and Midwifery, Women’s Health and Newborn Services (Maternity), Mater Health Service
Dr Kassam Mahomed Senior Staff Specialist, Obstetrics and Gynaecology, Ipswich Hospital, West Moreton Hospital and Health Service
Melanie McKenzie Consumer Representative
Dr Ian Mottarelly Senior Medical Officer, Gympie Hospital, Sunshine Coast Hospital and Health Service
Associate Professor Julie McGaughran
Director, Genetic Health Queensland
Amanda Ostrenski Midwifery/Nursing Director - Womens & Childrens Health Cluster, Townsville Hospital and Health Service
Dr Diane Payton Staff Anatomical Pathologist, Pathology Queensland
Dr Ted Weaver Senior Medical Officer, Obstetrics and Gynaecology, Nambour Hospital, Sunshine Coast Hospital and Health Service
Dr Nikki Whelan Obstetrician and Gynaecologist (Private Practice)
139
APPENDIX C
Maternal Mortality Sub-Committee
Dr Nikki Whelan (Chair) Obstetrician and Gynaecologist (Private Practice)
Professor Leonie Callaway Staff Specialist, Internal and Obstetric Medicine, Royal Brisbane and Women’s Hospital
Sarah Davies-Roe Service Development Leader, Child and Youth Mental Health Service, Children’s Health Queensland
Dr Peter Harms Director, Anaesthesia, Mater Mothers’ Hospital, Mater Health Services
Dr Nathan Milne Forensic Pathologist, Forensic and Scientific Services
Dr Ian Mottarelly Senior Medical Officer, Gympie Hospital, Sunshine Coast Hospital and Health Service
Amanda Ostrenski Midwifery/Nursing Director - Womens & Childrens Health Cluster, Townsville Hospital and Health Service
Dr William Parsonage Adjunct Professor and Senior Staff Specialist, Cardiology, Royal Brisbane and Women’s Hospital, Metro North Hospital and Health Service
Maree Reynolds Director Women’s Health and Newborn Services, Mater Mothers’ Hospital
Dr Ted Weaver Senior Medical Officer, Obstetrics and Gynaecology, Nambour Hospital, Sunshine Coast Hospital and Health Service
Dr Rebecca Williams Forensic Pathologist, Forensic and Scientific Services
Perinatal Mortality Sub-Committee
Associate Professor Vicki Flenady (Co-chair)
Director, Translating Research Into Practice (TRIP) Centre; Program Head, Mothers’ and Babies Theme. Mater Medical Research Institute
Professor David Ellwood (Co-chair)
Maternal-Fetal Medicine, Gold Coast University Hospital, Gold Coast Hospital and Health Service, & Griffith University
Dr Stephen Elgey Obstetrician and Gynaecologist (Private Practice)
Joanne Ellerington Principal Data Collections Officer, Health Statistics Branch, Queensland Department of Health
Dr Lucy Cooke Staff Specialist, Neonatology, Mater Health Services
Dr Helen Liley Senior Staff Specialist, Neonatology, Mater Health Services
Dr Rohan Lourie Consultant Pathologist, Mater Health Services
Dr Kassam Mahomed Senior Staff Specialist, Ipswich Hospital
Melanie McKenzie Consumer Representative
Amanda Ostrenski Midwifery/Nursing Director - Womens & Childrens Health Cluster, Townsville Hospital and Health Service
Dr Diane Payton Staff Anatomical Pathologist, Pathology Queensland
Teresa Walsh Caseload Midwife
Dr Nikki Whelan Obstetrician and Gynaecologist (Private Practice)
140
Congenital Anomaly Sub-Committee
Professor Paul Colditz (Chair)
Professor, Perinatal Medicine, University of Queensland
Dr Timothy Donovan Neonatal Paediatrician, Royal Brisbane and Womens Hospital, Metro North Hospital and Health Service
Dr Gregory Duncombe Staff Specialist, Maternal Fetal Medicine, Royal Brisbane and Women’s Hospital, Metro North Hospital and Health Service
Joanne Ellerington Principal Data Collections Officer, Health Statistics Branch, Queensland Department of Health
Associate Professor Julie McGaughran
Director, Genetic Health Queensland
Dr Trisha Johnston Director, Statistical Analysis and Linkage Team, Health Statistics Branch, Queensland Department of Health
Melanie McKenzie Consumer Representative
Dr Diane Payton Staff Anatomical Pathologist, Pathology Queensland
Dr Renuka Sekar Staff Specialist Obstetrics—Maternal and Fetal Medicine, Royal Brisbane and Women’s Hospital, Metro North Hospital and Health Service
Aboriginal and Torres Strait Islander Perinatal Health Sub-Committee (reconvened August 2014)
Jody Currie (Chair) Director, Community Engagement, Institute for Urban Indigenous Health
Associate Professor Vicki Flenady
Director, Translating Research Into Practice (TRIP) Centre; Program Head, Mothers’ and Babies Theme. Mater Medical Research Institute
Professor Sue Kildea Director - Midwifery Research Unit, Mater Research Institute University of Queensland, The University of Queensland School of Nursing and Midwifery, Women’s Health and Newborn Services (Maternity), Mater Health Service
Karen McGill Team Leader, Statistical Analysis and Linkage, Health Statistics Branch, Queensland Department of Health
Dr Carmel Nelson Clinical Director, Institute for Urban Indigenous Health
Associate Professor Katie Panaretto
Director, Population Health Hub, Queensland Aboriginal and Islander Health Council and Deputy Director, Centre for Indigenous Health, The University of Queensland
Dr Diane Payton Staff Anatomical Pathologist, Pathology Queensland
Professor Roianne West Indigenous Health and Workforce Development, Griffith University, School of Nursing and Midwifery/Townsville Hospital and Health Service.
Dr Alan Ruben Community Paediatrician and Public Health Physician, Torres and Cape Hospital and Health Service
Daniel Williamson Manager, Aboriginal and Torres Strait Islander Health Branch, Queensland Department of Health
Dr Paul Woodgate Senior Staff Specialist, Neonatology, Mater Health Services
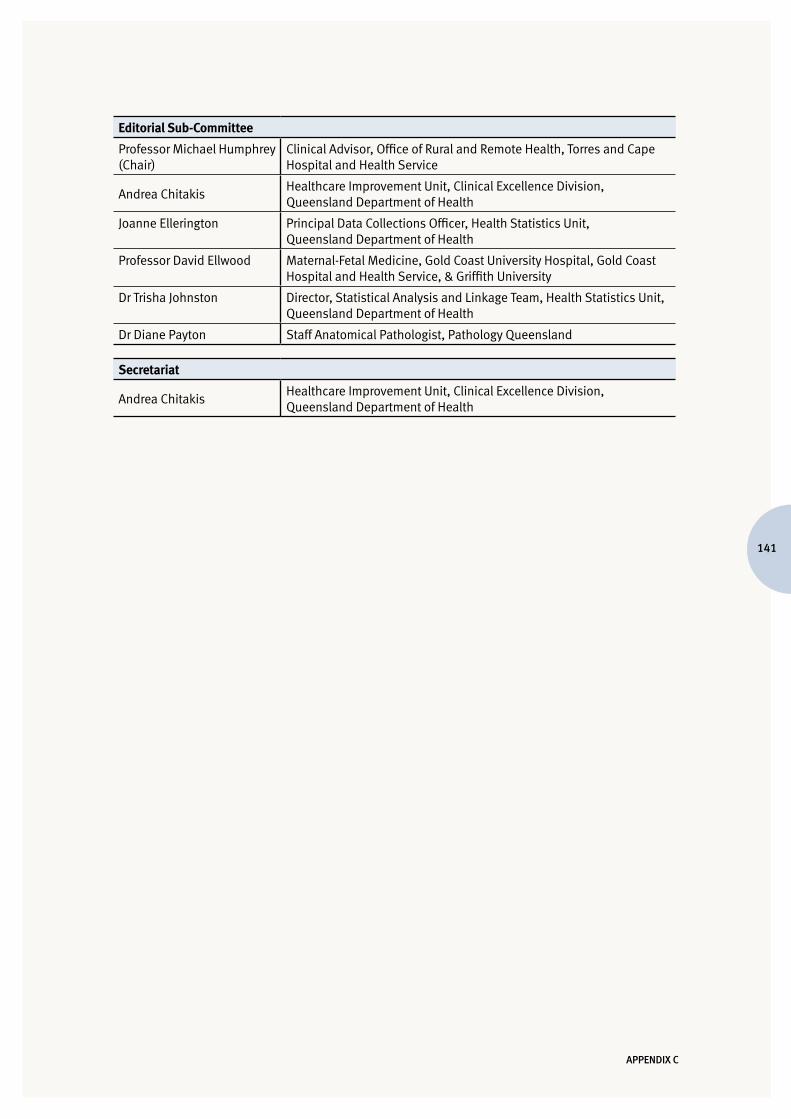
141
APPENDIX C
Editorial Sub-Committee
Professor Michael Humphrey (Chair)
Clinical Advisor, Office of Rural and Remote Health, Torres and Cape Hospital and Health Service
Andrea ChitakisHealthcare Improvement Unit, Clinical Excellence Division, Queensland Department of Health
Joanne Ellerington Principal Data Collections Officer, Health Statistics Unit, Queensland Department of Health
Professor David Ellwood Maternal-Fetal Medicine, Gold Coast University Hospital, Gold Coast Hospital and Health Service, & Griffith University
Dr Trisha Johnston Director, Statistical Analysis and Linkage Team, Health Statistics Unit, Queensland Department of Health
Dr Diane Payton Staff Anatomical Pathologist, Pathology Queensland
Secretariat
Andrea ChitakisHealthcare Improvement Unit, Clinical Excellence Division, Queensland Department of Health
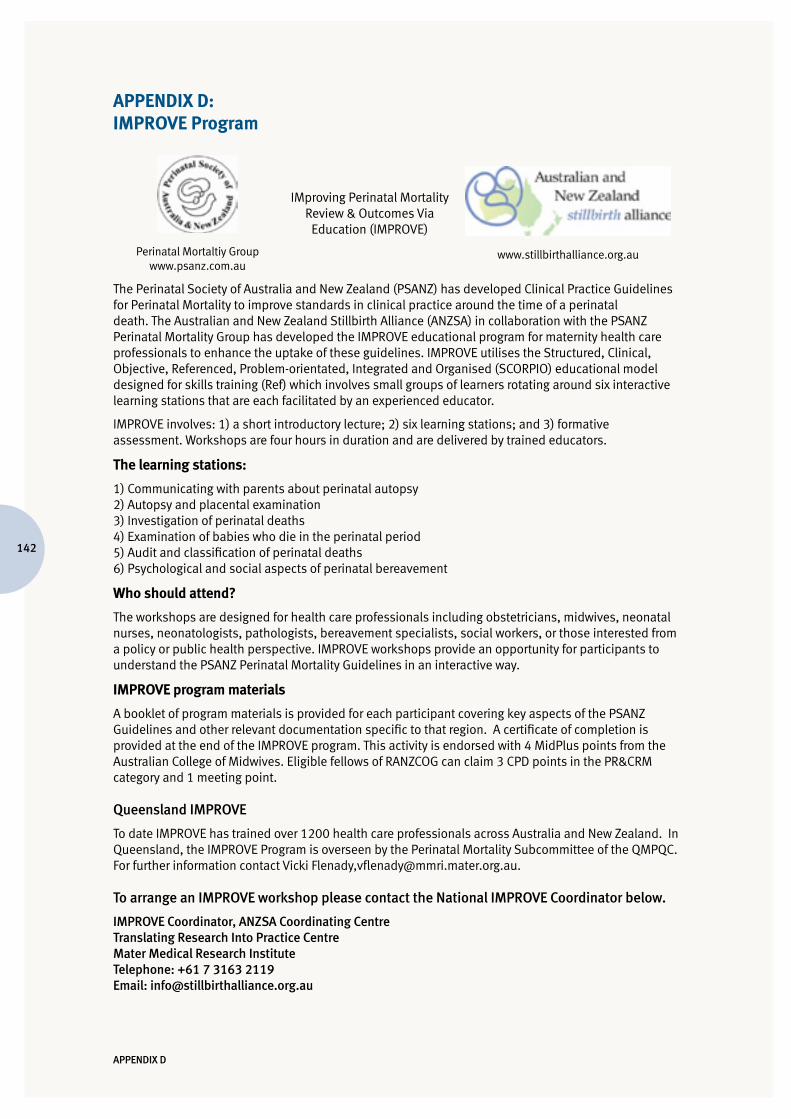
142
APPENDIX D: IMPROVE Program
Perinatal Mortaltiy Group www.psanz.com.au
IMproving Perinatal Mortality Review & Outcomes Via
Education (IMPROVE)
www.stillbirthalliance.org.au
The Perinatal Society of Australia and New Zealand (PSANZ) has developed Clinical Practice Guidelines for Perinatal Mortality to improve standards in clinical practice around the time of a perinatal death. The Australian and New Zealand Stillbirth Alliance (ANZSA) in collaboration with the PSANZ Perinatal Mortality Group has developed the IMPROVE educational program for maternity health care professionals to enhance the uptake of these guidelines. IMPROVE utilises the Structured, Clinical, Objective, Referenced, Problem-orientated, Integrated and Organised (SCORPIO) educational model designed for skills training (Ref) which involves small groups of learners rotating around six interactive learning stations that are each facilitated by an experienced educator.
IMPROVE involves: 1) a short introductory lecture; 2) six learning stations; and 3) formative assessment. Workshops are four hours in duration and are delivered by trained educators.
The learning stations:
1) Communicating with parents about perinatal autopsy2) Autopsy and placental examination3) Investigation of perinatal deaths4) Examination of babies who die in the perinatal period5) Audit and classification of perinatal deaths6) Psychological and social aspects of perinatal bereavement
Who should attend?
The workshops are designed for health care professionals including obstetricians, midwives, neonatal nurses, neonatologists, pathologists, bereavement specialists, social workers, or those interested from a policy or public health perspective. IMPROVE workshops provide an opportunity for participants to understand the PSANZ Perinatal Mortality Guidelines in an interactive way.
IMPROVE program materials
A booklet of program materials is provided for each participant covering key aspects of the PSANZ Guidelines and other relevant documentation specific to that region. A certificate of completion is provided at the end of the IMPROVE program. This activity is endorsed with 4 MidPlus points from the Australian College of Midwives. Eligible fellows of RANZCOG can claim 3 CPD points in the PR&CRM category and 1 meeting point.
Queensland IMPROVE
To date IMPROVE has trained over 1200 health care professionals across Australia and New Zealand. In Queensland, the IMPROVE Program is overseen by the Perinatal Mortality Subcommittee of the QMPQC. For further information contact Vicki Flenady,[email protected].
To arrange an IMPROVE workshop please contact the National IMPROVE Coordinator below.
IMPROVE Coordinator, ANZSA Coordinating CentreTranslating Research Into Practice CentreMater Medical Research InstituteTelephone: +61 7 3163 2119 Email: [email protected]
APPENDIX D
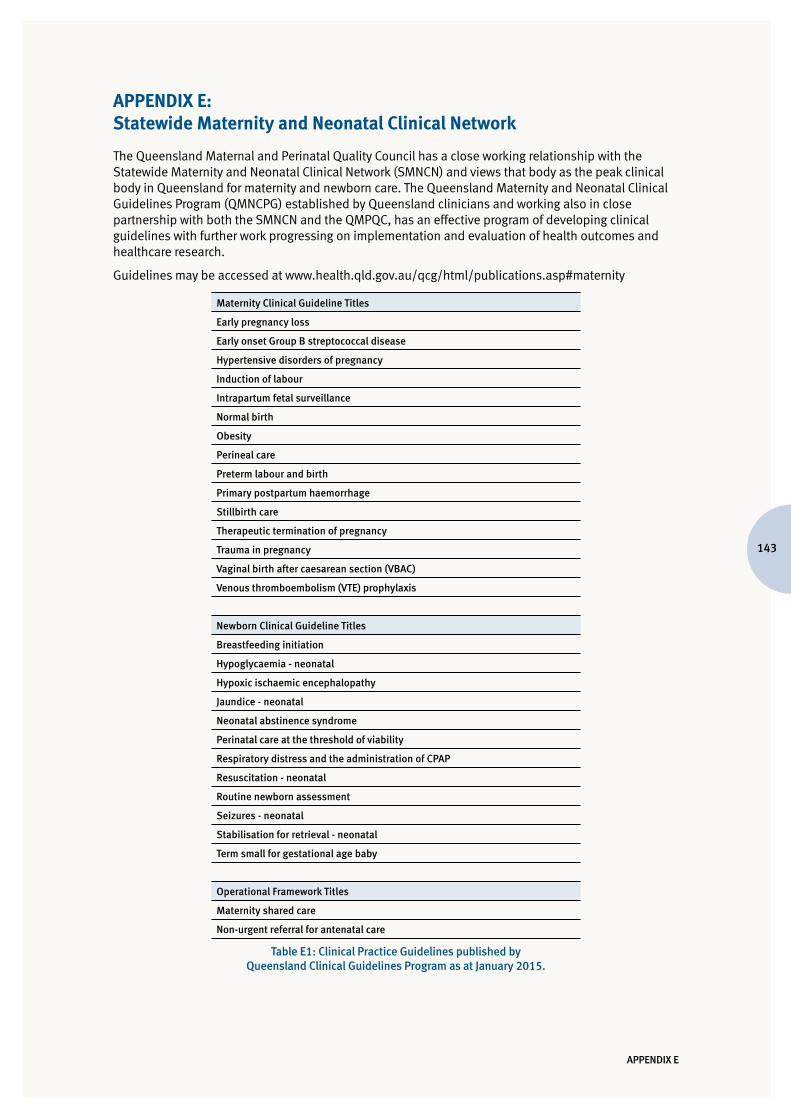
143
APPENDIX E: Statewide Maternity and Neonatal Clinical Network
The Queensland Maternal and Perinatal Quality Council has a close working relationship with the Statewide Maternity and Neonatal Clinical Network (SMNCN) and views that body as the peak clinical body in Queensland for maternity and newborn care. The Queensland Maternity and Neonatal Clinical Guidelines Program (QMNCPG) established by Queensland clinicians and working also in close partnership with both the SMNCN and the QMPQC, has an effective program of developing clinical guidelines with further work progressing on implementation and evaluation of health outcomes and healthcare research.
Guidelines may be accessed at www.health.qld.gov.au/qcg/html/publications.asp#maternity
Maternity Clinical Guideline Titles
Early pregnancy loss
Early onset Group B streptococcal disease
Hypertensive disorders of pregnancy
Induction of labour
Intrapartum fetal surveillance
Normal birth
Obesity
Perineal care
Preterm labour and birth
Primary postpartum haemorrhage
Stillbirth care
Therapeutic termination of pregnancy
Trauma in pregnancy
Vaginal birth after caesarean section (VBAC)
Venous thromboembolism (VTE) prophylaxis
Newborn Clinical Guideline Titles
Breastfeeding initiation
Hypoglycaemia - neonatal
Hypoxic ischaemic encephalopathy
Jaundice - neonatal
Neonatal abstinence syndrome
Perinatal care at the threshold of viability
Respiratory distress and the administration of CPAP
Resuscitation - neonatal
Routine newborn assessment
Seizures - neonatal
Stabilisation for retrieval - neonatal
Term small for gestational age baby
Operational Framework Titles
Maternity shared care
Non-urgent referral for antenatal care
Table E1: Clinical Practice Guidelines published by Queensland Clinical Guidelines Program as at January 2015.
APPENDIX E
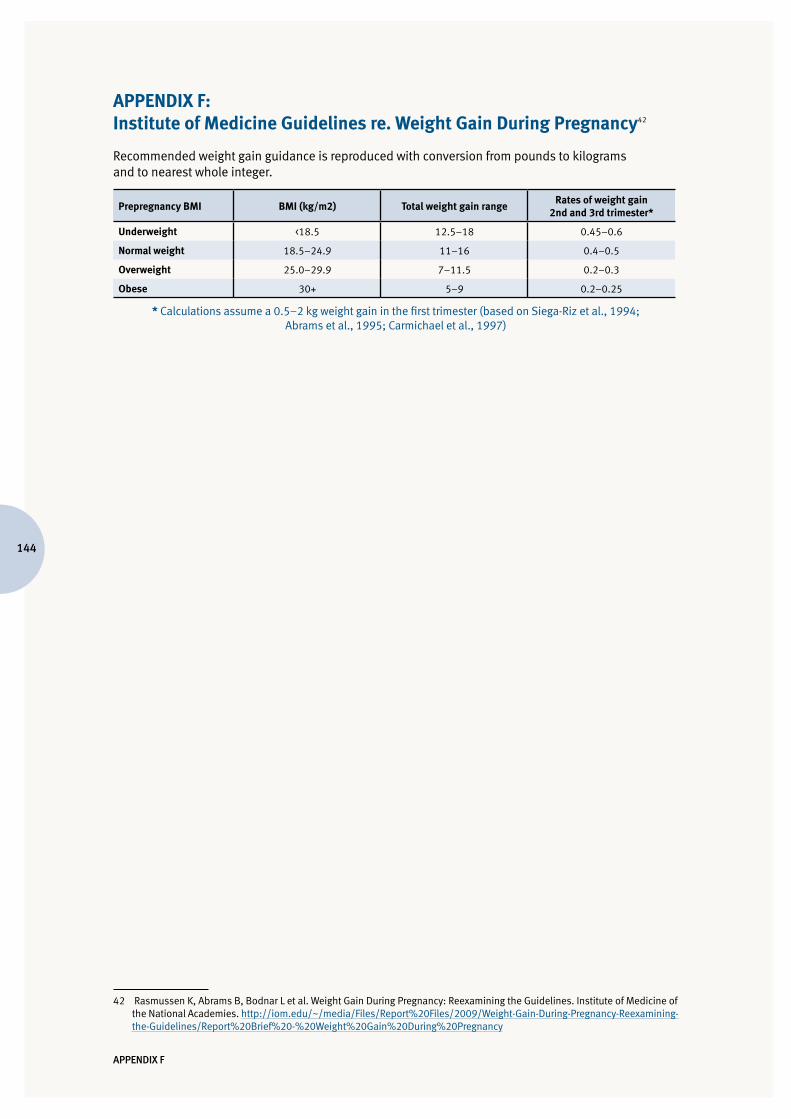
144
APPENDIX F: Institute of Medicine Guidelines re. Weight Gain During Pregnancy42
Recommended weight gain guidance is reproduced with conversion from pounds to kilograms and to nearest whole integer.
Prepregnancy BMI BMI (kg/m2) Total weight gain rangeRates of weight gain
2nd and 3rd trimester*
Underweight <18.5 12.5–18 0.45–0.6
Normal weight 18.5–24.9 11–16 0.4–0.5
Overweight 25.0–29.9 7–11.5 0.2–0.3
Obese 30+ 5–9 0.2–0.25
* Calculations assume a 0.5–2 kg weight gain in the first trimester (based on Siega-Riz et al., 1994; Abrams et al., 1995; Carmichael et al., 1997)
42 Rasmussen K, Abrams B, Bodnar L et al. Weight Gain During Pregnancy: Reexamining the Guidelines. Institute of Medicine of the National Academies. http://iom.edu/~/media/Files/Report%20Files/2009/Weight-Gain-During-Pregnancy-Reexamining-the-Guidelines/Report%20Brief%20-%20Weight%20Gain%20During%20Pregnancy
APPENDIX F

145
APPENDIX G: Acknowledgements
The Queensland Maternal and Perinatal Quality Council acknowledges and thanks the clinicians who have participated in hospital committee perinatal mortality review and classification.
We also thank the Perinatal Data Collection Team, in particular Joanne Ellerington and Colleen Morris, for their support in perinatal death review and reporting and in performing a major case ascertainment exercise relating to maternal deaths, Vesna Dunne and Taku Endo, Health Statistics Unit, for assistance with data retrieval, and Dr Trisha Johnston, Director Statistical Analysis and Linkage Team for advice and assistance with data interpretation.
The support of the following individuals is acknowledged:
Sue Cornes, Executive Director, Health Statistics Unit, Queensland Department of Health.
Kirstine Sketcher-Baker, Senior Director, Patient Safety Unit, Healthcare Innovation and Research Branch, Queensland Department of Health.
Michael Zanco, Executive Director, Healthcare Improvement Unit, Healthcare Innovation and Research Branch, Queensland Department of Health.
Cathy Urquhart, Manager, Healthcare Improvement Unit, Healthcare Innovation and Research Branch, Queensland Department of Health
Lucy Fisher, Executive Director, Private Hospitals Association of Qld Inc.
Helen Borradale and Angela Lynam, Regulatory Policy Unit, Queensland Department of Health.
The Media & Communications Unit, Queensland Department of Health.
The Queensland State Coroners, and the staff of the Office of the State Coroner.
Professor Charles Naylor, Chief Forensic Pathologist, Forensic and Scientific Services.
Samantha Mason, Executive Secretary to Chief Forensic Pathologist, Forensic and Scientific Services.
APPENDIX G

Blank page

Inside back page
Department of Health