Embed Size (px)
Citation preview
Maternal, Perinatal and PaediatricMortality in Queensland
1999
Queensland Council on Obstetric and PaediatricMorbidity and Mortality
September 2001
ii Queensland Council on Obstetric and Paediatric Morbidity and Mortality
© Queensland Council on Obstetric and Paediatric Morbidity and Mortality 2001
ISSN 1442-8350 (Print version)ISSN 1442-8369 (Online version URL: http://www.uq.net.au/qcopmm)
Suggested citationQueensland Council on Obstetric and Paediatric Morbidity and Mortality. Maternal, Perinatal andPaediatric Mortality in Queensland, 1999. Brisbane: QCOPMM; 2001.
Contact details
All correspondence should be addressed to:The SecretariatQuality CouncilsOffice of the Chief Health OfficerPO Box 48BRISBANE QLD 4001Ph: (07) 3234 0607Fax: (07) 3221 7535Email: [email protected]
Printed by ColourWise Reproductions
Maternal, Perinatal and Paediatric Mortality in Queensland, 1999
Queensland Council on Obstetric and Paediatric Morbidity and Mortality iii
Message from the Director-General
This is the final report of the Queensland Council on Obstetric and Paediatric Morbidity and Mortality(QCOPMM). QCOPMM has been dissolved and replaced by two quality councils: The QueenslandPaediatric Quality Council and the Queensland Maternal and Perinatal Quality Council. This changerecognises the difficulties faced by QCOPMM to adequately address the broad scope of its terms ofreference. It is anticipated that each new council will be able to concentrate on activities and energies withinits discipline and build on the achievements of QCOPMM.
I would like to acknowledge and thank the members of QCOPMM, and those who support them, for theirhard work and dedication in their efforts to improve obstetric, perinatal and paediatric outcomes forQueenslanders.
This report highlights the importance of maternal, infant and paediatric mortality as indicators which can beused to monitor trends and improvements in the health of the community, and offers opportunities tobenchmark and compare outcomes between regions and populations.
The report has been produced and coordinated by the secretariat of QCOPMM and the Mater PerinatalEpidemiology Unit and with the collaboration of clinicians across the State.
(Dr) R L StableDirector-General11/02/2002
iv Queensland Council on Obstetric and Paediatric Morbidity and Mortality
Report from the Chair, 2000/2001In May 2000, Associate Professor James King resigned from Chair of the Queensland Council of Obstetricand Paediatric Morbidity and Mortality (QCOPMM) to accept the position of Chair of the VictorianConsultative Council on Obstetric and Paediatric Mortality and Morbidity. Following the resignation ofProfessor King, Professor David Tudehope was appointed as Chair in December 2000. The Councilsecretariat remained within the Mater Perinatal Epidemiology Unit (MPEU) with Vicki Flenady as ResearchOfficer of the Council until June 30th 2001. Council reported to the Queensland Health Minister and DirectorGeneral of Health through the Chief Health Officer. The MPEU provided a core staff to support Councilactivities and a permanent point of contact for the many interactions between Council and healthcareproviders across the State and with various agencies within Queensland Health including the HealthOutcomes Unit and the Health Information Centre and in particular the Perinatal Data Collection Unit andthe Epidemiology Services Unit. Council also had frequent contact with similar bodies in other States andTerritories and with other local regional, national and international organisations. The Terms of Reference ofQCOPMM developed in 1995 were broad ranging and included Quality Assurance activities, audit, specificinvestigational enquiries, perinatal outreach education and operational issues for Queensland Hospitals.
Review of QCOPMMThe departure of the Chair of QCOPMM and appointment of the new Chief Health Officer, (Professor BryanCampbell), provided a unique opportunity to review the function of QCOPMM.The outcomes of the extensive review proposed the establishment of two new Councils.
Queensland Maternal and Perinatal Quality Council; andQueensland Paediatric Quality Council
which would be the prototype of other Quality Councils in Queensland Health. The function of the newQuality Councils is to provide advice to the Minister for Health and Director General of Health through theChief Health Officer on obstetric, perinatal and paediatric disciplines. The Councils will be gazetted asapproved Quality Assurance Committees pursuant to Section 31, Health Services Act 1991.
Achievements of QCOPMMAt this time of transition it is appropriate to reflect on the achievements of Council.
Classification systems for perinatal and paediatric deathsFrom 1994 until 1997 all perinatal deaths were classified centrally by the Secretariat of QCOPMM utilisinginformation obtained from various sources including the MR63 Perinatal Data Collection form, deathcertificates, autopsy and placental pathology when available, and coronial autopsies and reports. Ofnecessity, the data set available centrally for clinical classification is limited. Council considered that eachmaternity unit should systematically review all perinatal deaths in order to ascertain the cause of death and toaccess avoidable and preventable factors. Council provided all maternity units in Queensland, both publicand private, with a package of information containing guidelines for local maternal and perinatal mortalityaudit and classification.
QCOPMM worked tirelessly on improving clinical classification systems for evaluating perinatal and infantdeaths. Although the ICD9 classification of perinatal deaths was useful for statistical purposes it was notprecise enough for use by clinicians in considerations about causation. Initially the Whitfield modification ofthe Aberdeen classification was used by Council. This system was further refined and renamed theQueensland Council of Perinatal Mortality and Morbidity Classification and was circulated to clinicians inQueensland for piloting and feedback. QCOPMM adopted the system of classifying neonatal deaths whichwas developed by the South Australian Perinatal Committee. This classification system attempted tounequivocally identify the primary maternal and/or fetal factors that led to the death. Members ofQCOPMM, James King, Vicki Flenady and David Tudehope collaborated with perinatal clinicians inAustralia and New Zealand to achieve consensus on new clinical classification systems for perinatal deaths;The Australian and New Zealand antecedent classification for perinatal mortality (ANZACPM) and theAustralian and New Zealand neonatal death classification (ANZNNDC).
Maternal, Perinatal and Paediatric Mortality in Queensland, 1999
Queensland Council on Obstetric and Paediatric Morbidity and Mortality v
Zonal maternal and perinatal mortality and morbidity committees.The Peninsular and Torres Strait Island Committee under the Chairmanship of Professor Michael Humphreywas established to audit and classify all perinatal deaths in the zone. Similar committees were established in1998 in the Southern Zone (Chairman Professor David Tudehope) and Central Zone (Chairman AssociateProfessor David Cartwright), to promote systematic maternal and perinatal mortality review throughoutQueensland. By close collaboration with maternity hospitals, these committees provided support andeducation to maternity hospitals. The success of zonal committees can be assessed by the fact that in 1998only 47% of perinatal deaths were classified at local hospital where as in 1999 this had increased to 57%. Inthe new structure, zonal committees will still provide a key clinical network facilitated by zonal clinical auditmanagers.
Coroners Bill 2000 consultation draft.QCOPMM responded to the invitation of the Department of Justice and Attorney General to comment on thedraft of the Coroners Bill 2000.
ObicareQCOPMM played a significant role in the development of the Obicare reporting system. This data collectionsystem provides easy access to data and meets national requirements for the collection of maternal perinatalmorbidity and mortality data.
PublicationsThe Paediatric Mortality and Morbidity Report for 1994-1996 was the first comprehensive report onpaediatric deaths in Queensland.Trends in perinatal and paediatric mortality in Queensland.Maternal, perinatal and paediatric morbidity and mortality in Queensland 1994-1996Maternal, perinatal and paediatric mortality in Queensland. Annual reports; 1997/1998/1999.Maternal and perinatal mortality audit: Guidelines for Queensland Hospitals. April 1999, updated January2001A review of sudden unexpected deaths in infants (SUDI) in Queensland in 1997 and 1998A review of sudden unexpected deaths in infants (SUDI) Autopsies in Queensland 1997-1998
I would like to acknowledge the major contributions to the production of the 1999 report from Vicki FlenadyMMedSc (Clin Epi) Perinatal Epidemiology Research Officer, QCOPMM/MPEU, Richard Hockey BSc,DipAgr Sc Senior Data Analyst MPEU/Queensland Injury Surveillance Unit and Dr Paul Woodgate MBBS,FRACP, MMedSc (Clin Epi). I would like to sincerely thank my colleagues on the Council of QCOPMMover the past 6 years and members of the subcommittees for the successes achieved. The Chief HealthOfficer, Professor Bryan Campbell and his Principal Project Officer Joan Kennedy need to be congratulatedon the review of QCOPMM and establishment of the new quality councils.
Respectfully submitted,
Professor David Tudehope AM, MBBS, FRACPChair
vi Queensland Council on Obstetric and Paediatric Morbidity and Mortality
Queensland Council on Obstetric and Paediatric Morbidity and Mortality (QCOPMM)
MembershipDr David Tudehope (Chair) Neonatologist, Director of Neonatology, Mater Mothers’ HospitalMs Marie Barton Midwifery Course Coordinator, Redcliffe HospitalDr Donald Cave Obstetrician, Director of Obstetrics, Royal Women’s HospitalProf Paul Colditz Neonatologist, Director, Perinatal Research Centre,
Royal Women’s HospitalMs Jan Cornfoot Consumer RepresentativeDr John Evans General Practitioner Obstetrician, Chair Rural Doctors AssociationProf Michael Humphrey Director, Department of Obstetrics and Gynaecology,
Cairns Base HospitalMs Laurel McCarthy District Manager, Cape York District HealthDr Diane Payton Director, Anatomical Pathology, Mater Misericordiae HospitalDr Richard Roylance Paediatrician, Child Health Unit, Queensland HealthDr Margaret Shapiro Director of Post-Graduate Research Studies, School of Social Work and
Social Policy, University of QueenslandDr Ifor Thomas Obstetrician, Medical Superintendent, Royal Women’s Hospital
Ex-officioProf Bryan Campbell Chief Health Officer, Queensland HealthDr Ian Ring Manager and Principal Epidemiologist, Health Information Centre,
Queensland Health
QCOPMM SecretariatVicki Flenady Research Officer, QCOPMM; Manager, Perinatal Epidemiology Unit,
Mater Hospital.Other Mater Perinatal Epidemiology Unit staff assisting the CouncilRichard Hockey Biostatistician/ Data AnalystDr Paul Woodgate Neonatologist, Mater Mothers’ Hospital
Terms of referenceThe Council was established to provide advice to the Minister for Health and has the following terms ofreference:• to consider, investigate and report to the Minister for Health on the patterns and causation of obstetric and
paediatric morbidity and mortality in Queensland so that action may be taken to reduce preventable death anddisability;
• to provide direction that will enable Queensland Health to develop and review policies that impact onobstetric and paediatric morbidity and mortality;
• to identify avoidable factors associated with maternal, perinatal and paediatric deaths and implementmeasures that could assist with the prevention of such deaths, including improvements in health services;
• to provide information and guidance required for members of the health professions and for the communitygenerally in order to assist in the reduction of obstetric and paediatric morbidity and mortality;
• to assist perinatal committees in Queensland Health Regions with data collection, classification and reportingof maternal, perinatal and paediatric deaths;
• to steer the development of a reporting system that will provide easy access to data and meet nationalrequirements for the collection of maternal, perinatal and paediatric morbidity and mortality data;
• to undertake research and other activities relevant to the performance of its functions;• select members for the Council's subcommittees and determine priority areas to be examined by these
subcommittees;• to co-opt people to assist with the investigation of particular issues where the nature or complexity of the
issue renders such an approach as appropriate; and• to provide a report to the Minister and report on issues as requested by the Minister.
Maternal, Perinatal and Paediatric Mortality in Queensland, 1999
Queensland Council on Obstetric and Paediatric Morbidity and Mortality vii
Executive summary
Maternal mortality• There were 13 maternal deaths (4 Direct, 3 Indirect and 6 Incidental) identified in Queensland during 1999,
and 48 044 mothers giving a maternal mortality ratio of 27.1 per 100 000 mothers.
• For the triennium 1997-99 a total of 26 maternal deaths (8 direct, 5 indirect and 13 incidental) were reportedto the Council giving a maternal mortality ratio for Queensland of 18.2 per 100 000 mothers.
• The maternal mortality ratio in Queensland by triennia has been consistently higher that the ratio reported forAustralia since 1991. The ratios for Queensland and Australia for the triennium 1991-93 were 16.8 and 10.9and for 1994-96 18.3 and 13.0 per 100 000 mothers respectively.
• The higher maternal death ratio in Queensland compared to Australia is in part due to the higher ratio ofindirect deaths but largely due to a consistently higher ratio of incidental deaths.
• The ratio of maternal deaths in Queensland from direct and indirect causes has been fairly stable for the lastthree triennia over the period 1988 to 1999, however the incidental death ratio has slowly increased from 3.9per 100 000 mothers in the 1988-90 triennium to 9.1 in the 1997-99 triennium.
• In Queensland for the period 1997-99, the most frequent principal cause of incidental maternal deaths washomicide (3 of the 13 deaths). Homicide was also the most frequent principal cause of incidental deaths forAustralia for the period 1994-96 (6 of the 34 incidental deaths).
• In the triennium 1997-99, avoidable factors were thought to be present in 11 (42%) of the 26 maternal deaths.The proportion of direct maternal deaths considered to have avoidable factors (50%) was similar to thatreported for Australia (48%).
• In Queensland over the period 1997-99, identification of maternal deaths was increased by 38% with the useof additional sources to that of routine reporting mechanisms (Australian Bureau of Statistics). This level ofunder reporting is slightly higher than the proportion identified by the Council for the 1994-99 triennium of27%. All of the additional deaths identified were classified as indirect or incidental deaths.
Perinatal mortality• There were 48 749 births and 518 perinatal deaths in Queensland for 1999 giving a crude perinatal
mortality rate of 10.6 per 1 000 total births. This was comprised of a fetal mortality rate of 7.1 per 1 000total births and a neonatal mortality rate of 3.5 per 1 000 livebirths.
• Since 1983 the rate of perinatal deaths in Queensland has been similar to that observed for Australia.
• Preterm births (<37 weeks) accounted for 8% of infants and 79% of perinatal deaths. Very preterm births(<28 weeks) accounted for <1% of infants and 57% of perinatal deaths.
• Twins and higher order multiple births account for 3% of births, and was considered the primary cause ofperinatal death (using the QCPMC classification) in 12% of perinatal deaths.
• The main causes of death according to the Queensland Council Perinatal Mortality Classification werecongenital anomaly (24%), unexplained antepartum death (18%) and unexplained preterm (18%).
• The overall rate of unexplained antepartum death was 2.0 per 1 000 births which is over three times therate of SIDS.
viii Queensland Council on Obstetric and Paediatric Morbidity and Mortality
• Compared with Australia as a whole Queensland had a higher perinatal mortality rate due to congenitalanomalies (2.5 compared with 1.6 per 1000 births).
• Of all fetal deaths 10% were attributed to voluntary interruption of pregnancy ≥20 weeks.
• When perinatal mortality for public facility types is corrected for gestational age the perinatal mortalityrate for tertiary women’s hospitals was 9.7 per 1 000 births, compared with a rate of 12.5 and 13.3 per 1000 births for major and other public hospitals respectively.
• The rate of perinatal autopsies for Queensland in 1999 (45%) is lower than the rates observed elsewherein Australia and overseas.
Paediatric mortality• During 1999, there were 422 deaths of infants and children aged less than 15 years in Queensland.
• There were 252 post-neonatal deaths (28 days to 14 years), accounting for 60% of all deaths, resulting ina paediatric mortality rate of 34.5 per 100 000 persons for 1999.
• In 1999 Queensland had a similar infant mortality rate compared with the rest of Australia. Previously,Queensland’s infant mortality rate has been consistently higher than the rest of Australia.
• In the post-neonatal paediatric population, the mortality rate was highest in the first year of life at 269.2per 100 000 persons. This has fallen by 16% since 1997.
• Injuries were the most frequent major cause of death, accounting for 92 of the 252 post-neonatal deaths(37%). The overall rate of death for injury was 12.4 per 100 000 persons.
• Among post-neonatal infants, the most frequent cause of death was from conditions determined at birthwith a mortality rate of 101.3 per 100 000 persons.
• There were 31 deaths determined to be due to SIDS. Seventeen (58%) of these deaths occurred in maleinfants.
• The rate of SIDS in Queensland for 1999 was similar to the rest of Australia (0.64 compared with 0.66per 1 000 live births).
• In those under 5 years, injury accounted for 67% of all injury deaths, and was the most frequent cause ofdeath in the age groups 1 to 4 years and 10 to 14 years.
• Of all paediatric deaths due to injury, 29% were transport related deaths. Most of these were deaths of apassenger.
• Twelve of the 92 injury deaths were due to intentional injuries. Six of these were possible or stated selfharm and occurred in the 10 to 14 year age group.
• Acquired conditions were responsible for 21% of paediatric deaths in 1999. Malignancies (cancer)accounted for 39% of deaths due to acquired conditions. The most frequent malignancy causing death inthe paediatric population remains acute lymphoblastic leukaemia.
Indigenous mortality• Data used to calculate perinatal and paediatric mortality rates are derived from different sources.
Identification as “Indigenous” is not rigorously and consistently sought, and may be reliant upon self-identification, or the individual who completes the death certificate. Under-ascertainment of indigenous
Maternal, Perinatal and Paediatric Mortality in Queensland, 1999
Queensland Council on Obstetric and Paediatric Morbidity and Mortality ix
status is likely. In this report “Indigenous” refers to the combined total of peoples of “Aboriginal” and“Torres Strait Islander” origin.
• There was one registered death of an indigenous mother (maternal death) in 1999.
• In 1999, 6% of births were to indigenous mothers, whilst 9% of perinatal deaths were in babies ofIndigenous mothers. The indigenous perinatal mortality rate remains 1.6 times higher than the non-indigenous perinatal mortality rate.
• The perinatal mortality rates for indigenous populations were higher in most gestational age and birth-weight categories. The cause of perinatal death accounting for most of the increased perinatal mortalityin indigenous populations was unexplained preterm, which occurred at a frequency greater than twicethat of the non-indigenous population.
• Neonatal death rate due to respiratory disorders was almost four times higher in the indigenouspopulation.
• The indigenous paediatric mortality rate was two times higher than that in the non-indigenouspopulation. The rate of death due to SIDS was also two times higher in indigenous infants.
x Queensland Council on Obstetric and Paediatric Morbidity and Mortality
Recommendations
• Suggested areas for further investigation include the reasons for the higher rates of preterm birth in theindigenous population.
• Consideration be given to the establishment of a comprehensive register of congenital abnormalitieswhich includes all terminations of pregnancy for birth defects and those detected following dischargefrom the hospital of birth.
• A systematic approach be established for the development, implementation and ongoing evaluation ofclinical practice guidelines in the areas of pregnancy and childbirth, neonatal and paediatric health care.
• Guidelines prepared by Council for investigation of maternal and perinatal deaths in Queensland beendorsed and disseminated by Queensland Health.
• Consideration be given to the development and implementation of:
− Guidelines for maternal and perinatal mortality autopsy
− Guidelines for investigation of paediatric deaths in Queensland which include national standards forinvestigation of infant deaths.
Maternal, Perinatal and Paediatric Mortality in Queensland, 1999
Queensland Council on Obstetric and Paediatric Morbidity and Mortality xi
Contents
Message from the Director-General ............................................................................................................. iii
Report from the Chair, 2000/2001 ................................................................................................................ iv
Review of QCOPMM ..................................................................................................................................... iv
Achievements of QCOPMM.......................................................................................................................... iv
Publications...................................................................................................................................................... v
Classification systems for perinatal and paediatric deaths......................................................................... iv
Zonal maternal and perinatal mortality and morbidity committees. ......................................................... v
Coroners Bill 2000 consultation draft............................................................................................................ v
Obicare ............................................................................................................................................................. v
Queensland Council on Obstetric and Paediatric Morbidity and Mortality (QCOPMM)...................... viMembership.................................................................................................................................................. viTerms of reference........................................................................................................................................ vi
Executive summary ....................................................................................................................................... viiMaternal mortality ....................................................................................................................................... viiPerinatal mortality ....................................................................................................................................... viiPaediatric mortality .................................................................................................................................... viiiIndigenous mortality................................................................................................................................... viii
Recommendations............................................................................................................................................ x
Contents........................................................................................................................................................... xi
List of tables .................................................................................................................................................. xiv
List of figures ................................................................................................................................................ xvi
CHAPTER 1: MATERNAL MORTALITY............................................................................. 1Executive summary ......................................................................................................................................... 1
Introduction ..................................................................................................................................................... 2
Definitions ........................................................................................................................................................ 2
Data sources ..................................................................................................................................................... 3
Modus operandi ............................................................................................................................................... 3
Definitions for maternal mortality................................................................................................................. 3
Maternal mortality ratios and trends ............................................................................................................ 3
Classification of maternal deaths, Queensland 1997-1999........................................................................... 5
Causes of maternal deaths, Queensland 1997-1999...................................................................................... 5Direct maternal deaths ................................................................................................................................... 5Indirect maternal deaths................................................................................................................................. 5Incidental maternal deaths ............................................................................................................................. 5
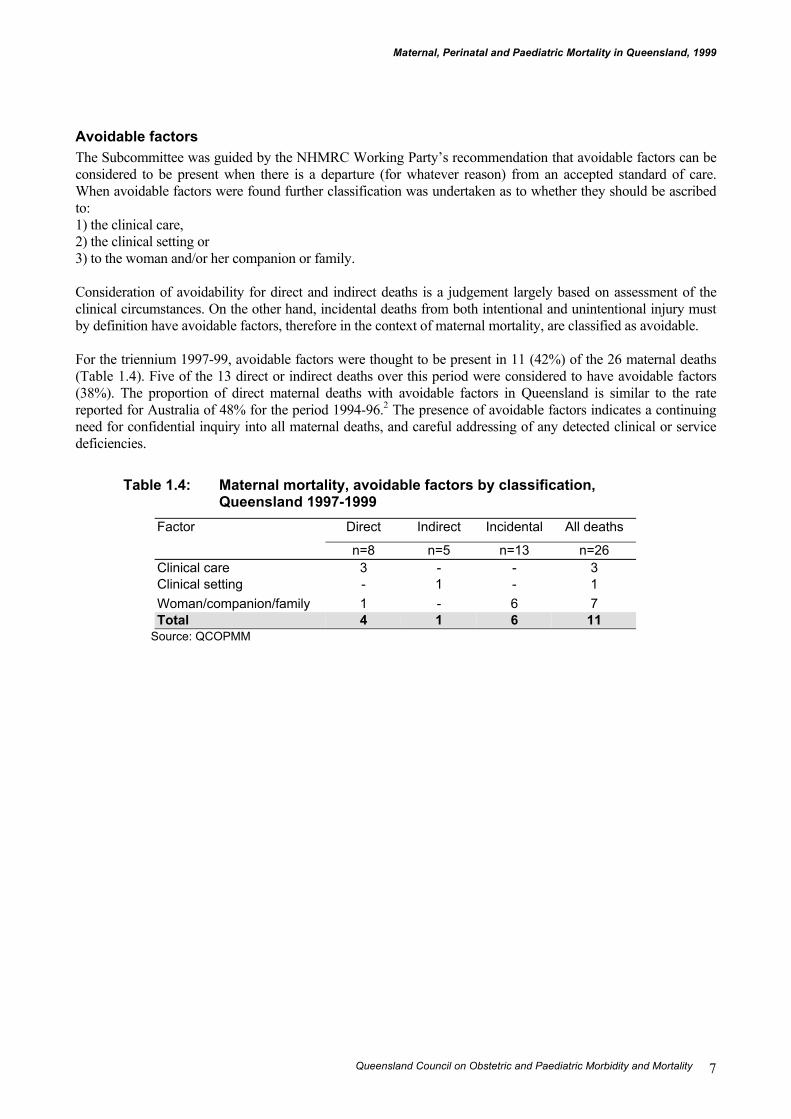
Avoidable factors ............................................................................................................................................. 7
Ascertainment of maternal deaths in Queensland........................................................................................ 8
Review of individual maternal deaths, by classification, Queensland 1999 ............................................... 9Direct maternal deaths, Queensland 1999 ..................................................................................................... 9Indirect maternal deaths, Queensland 1999................................................................................................. 10Incidental maternal deaths, Queensland 1999 ............................................................................................. 11
xii Queensland Council on Obstetric and Paediatric Morbidity and Mortality
CHAPTER 2: PERINATAL MORTALITY .......................................................................... 12Executive summary ........................................................................................................................................ 12
Modus operandi ............................................................................................................................................. 13Clinical classification for perinatal death .................................................................................................... 13
Data sources ................................................................................................................................................... 14
Definitions ...................................................................................................................................................... 14
Rates and trends ............................................................................................................................................ 15Comparison with Australia.......................................................................................................................... 16Gestational age and birthweight specific perinatal mortality rates.............................................................. 17Multiple pregnancy...................................................................................................................................... 21Facility type ................................................................................................................................................. 22
Clinical classification (QCPMC) .................................................................................................................. 23Congenital anomaly..................................................................................................................................... 23Unexplained antepartum death .................................................................................................................... 23Unexplained preterm birth........................................................................................................................... 23Maternal Conditions .................................................................................................................................... 24Hypoxic peripartum death ........................................................................................................................... 24Antepartum haemorrhage ............................................................................................................................ 24Cause of death by gestational age and birthweight ..................................................................................... 25
Neonatal Classification.................................................................................................................................. 27
Perinatal Autopsies........................................................................................................................................ 33
CHAPTER 3: PAEDIATRIC MORTALITY......................................................................... 34Executive summary ....................................................................................................................................... 34
Introduction ................................................................................................................................................... 35
Definitions ...................................................................................................................................................... 35
Data sources and methods ............................................................................................................................ 35
QC Paediatric Classification (QCPaedC).................................................................................................... 35
All cause paediatric deaths ........................................................................................................................... 36
Infant mortality ............................................................................................................................................. 41
Sudden Unexpected Death in Infancy (SUDI), including Sudden Infant Death Syndrome (SIDS)....... 42
Injury deaths.................................................................................................................................................. 45
Conditions determined at birth .................................................................................................................... 49Congenital conditions/birth defects ............................................................................................................. 49Other conditions determined at birth ........................................................................................................... 49
Acquired conditions....................................................................................................................................... 49Infection....................................................................................................................................................... 49Malignancy .................................................................................................................................................. 49
Post mortems.................................................................................................................................................. 54
CHAPTER 4: INDIGENOUS MORTALITY........................................................................ 55Executive summary ....................................................................................................................................... 55
Introduction ................................................................................................................................................... 56
Definitions ...................................................................................................................................................... 56
Maternal, Perinatal and Paediatric Mortality in Queensland, 1999
Queensland Council on Obstetric and Paediatric Morbidity and Mortality xiii
Data sources and quality............................................................................................................................... 56
Maternal mortality ........................................................................................................................................ 57
Perinatal mortality ........................................................................................................................................ 57Rates and trends........................................................................................................................................... 58Clinical classification (QCPMC)................................................................................................................. 61Neonatal Classification................................................................................................................................ 63
Paediatric mortality....................................................................................................................................... 64Infant mortality............................................................................................................................................ 65
Appendix 1: QCOPMM classification of perinatal deaths (QCPMC) .................................... 66
Appendix 2: Classification of neonatal deaths........................................................................... 68
Appendix 3: QCOPMM classification of paediatric deaths (QCPaedC) ................................ 69
Appendix 4: Working group membership .................................................................................................. 72
Maternal Mortality Working Group ........................................................................................................... 72Membership................................................................................................................................................. 72
Perinatal Mortality Working Group ........................................................................................................... 72Membership................................................................................................................................................. 72
Zonal Committees.......................................................................................................................................... 72Northern Zone Maternal and Perinatal Mortality Committee ..................................................................... 72Central Zone Maternal and Perinatal Mortality Committee ........................................................................ 72Southern Zone Maternal and Perinatal Mortality Committee ..................................................................... 73
Paediatric Mortality Working Group.......................................................................................................... 73Membership................................................................................................................................................. 73
Acknowledgments.......................................................................................................................................... 74
xiv Queensland Council on Obstetric and Paediatric Morbidity and Mortality
List of tablesTable 1.1 Maternal mortality, Queensland 1988-99................................................................... 4Table 1.2 Maternal mortality by triennia, Queensland 1988-99 and Australia 1988-99 ........... 4Table 1.3: Maternal mortality by cause of death, Queensland 1997-1999 .................................. 6Table 1.4: Maternal mortality, avoidable factors by classification, Queensland 1997-1999 ...... 7Table 1.5: Maternal mortality, notification sources by classification, Queensland 1994-1999 . 8Table 2.1: Fetal, neonatal and perinatal deaths, Queensland 1999............................................ 15Table 2.2: Perinatal mortality rates by gestational age, Queensland 1999 ................................ 19Table 2.3: Perinatal mortality rates by birthweight, Queensland 1999 ..................................... 20Table 2.4: Perinatal deaths by plurality, Queensland 1999 ....................................................... 21Table 2.5: Perinatal mortality rate by gestational age and standardised perinatal mortality rate
by facility type, Queensland 1999............................................................................ 22Table 2.6: Perinatal deaths by cause (QCPMC) and type, Queensland 1999............................ 25Table 2.7: Perinatal deaths by cause (QCPMC) and gestational age, Queensland 1999........... 26Table 2.8: Perinatal deaths by cause (QCPMC) and birthweight, Queensland 1999 ............... 26Table 2.9: Neonatal mortality by cause (Neonatal Classification) and gestational age,
Queensland 1999 ...................................................................................................... 27Table 2.10: Neonatal deaths by cause (Neonatal Classification) and birthweight, Queensland
1999.......................................................................................................................... 28Table 2.11: Perinatal deaths by cause (QCPMC), all categories, Queensland 1999 ................... 30Table 2.12: Neonatal deaths by cause (NNDC), all categories, Queensland 1999...................... 32Table 2.13: Perinatal autopsies by cause (QCPMC) and type of death, Queensland 1999 ......... 33Table 3.1: Paediatric deaths by age and sex, Queensland 1999. ............................................... 36Table 3.2: Estimated resident paediatric population by age and gender, Queensland 1999..... 36Table 3.3: All cause paediatric mortality by age and gender, Queensland 1999...................... 36Table.3.4: Paediatric deaths by major cause (QCPaedC), age and gender, Queensland 1999 .. 37Table.3.5: Paediatric mortality rate1 by major cause (QCPaedC), age and gender, Queensland
1999.......................................................................................................................... 37Table 3.6: Paediatric mortality rates1 by major cause (QCPaedC), and year, Queensland 1994-
1999.......................................................................................................................... 39Table.3.7 The three most common causes of death (QCPaedC), by age and gender,
Queensland 1999. ..................................................................................................... 40Table 3.8: Infant mortality by gender, Queensland 1999 .......................................................... 41Table 3.9: Infant mortality rates by year of registration, Queensland and the rest of Australia
1987-1999................................................................................................................. 41Table 3.10: Infant SUDI deaths by cause (QCPaedC), Queensland 1999................................... 43Table 3.11: Classification of SIDS (QCPaedC)........................................................................... 43Table 3.12: Paediatric and neonatal deaths from SIDS (QCPaedC) by age and gender,
Queensland 1999. ..................................................................................................... 44Table 3.13: Paediatric injury deaths by major cause (QCPaedC), age and gender, Queensland
1999.......................................................................................................................... 46Table 3.14 Numbers and location of drowning deaths of children aged 28 days to 4 years,
Queensland 1994–1999. ........................................................................................... 46Table 3.15: Paediatric injury deaths by intent and age, Queensland 1999 .................................. 46Table 3.16: Paediatric injury deaths by cause (QCPaedC), age and gender, Queensland 1999.. 47Table 3.17: Paediatric deaths from conditions determined at birth (QCPaedC) by age and
gender, Queensland 1999. ........................................................................................ 51Table 3.18: Paediatric deaths from acquired conditions (QCPaedC) by age and gender,
Queensland 1999. ..................................................................................................... 52Table 3.19: Paediatric deaths from cancer (QCPaedC) by age and gender, Queensland 1999... 53Table 3.20 Percentage of paediatric deaths receiving a post mortem by major cause (QCPaedC)
and age, Queensland 1999........................................................................................ 54Table 4.1: Indigenous and non-Indigenous perinatal mortality, Queensland 1999 ................... 58Table 4.2: Perinatal mortality by gestational age and Indigenous status, Queensland 1999 ..... 60Table 4.3: Perinatal mortality by birthweight and Indigenous status, Queensland 1999 ......... 61
Maternal, Perinatal and Paediatric Mortality in Queensland, 1999
Queensland Council on Obstetric and Paediatric Morbidity and Mortality xv
Table 4.4: Perinatal mortality rates by cause (QCPMC) and Indigenous status, Queensland 1999.......................................................................................................................... 62
Table 4.5: Neonatal deaths by selected cause (Neonatal Classification) and Indigenous status, Queensland 1999 ...................................................................................................... 63
Table 4.6 Estimated resident paediatric population by age, gender and Indigenous status, Queensland 1999 ...................................................................................................... 64
Table 4.7: Neonatal and paediatric deaths by age and Indigenous status, Queensland 1999 .... 64Table 4.8 Paediatric deaths by gender and Indigenous status, Queensland 1999..................... 64Table 4.9: Paediatric mortality rate by major cause (QCPaedC) and Indigenous status,
Queensland 1999 ...................................................................................................... 64Table 4.10: Neonatal, post neonatal and infant mortality by Indigenous status, Queensland 1999
65
xvi Queensland Council on Obstetric and Paediatric Morbidity and Mortality
List of figures
Figure 2.1: Fetal, neonatal and perinatal mortality rates, Queensland 1987-1999 ..................... 15Figure 2.2: Perinatal mortality rates, Queensland and Australia 1983-1999 .............................. 16Figure 2.3: Perinatal mortality rate by plurality, Queensland 1999............................................... 21Figure 2.4: Fetal, neonatal and perinatal mortality rates corrected for late terminations,
Queensland 1987-1999............................................................................................. 24Figure 2.5: Perinatal deaths by cause (QCPMC) and type, Queensland 1999............................ 25Figure 2.6: Neonatal deaths by cause (Neonatal Classification), Queensland 1999................... 28Figure 2.7: Neonatal deaths by cause (Neonatal Classification) and birthweight, Queensland
1999.......................................................................................................................... 29Figure 3.1: Paediatric mortality rate1 by age and gender, Queensland 1999 .............................. 38Figure 3.2: Paediatric deaths as a proportion of all deaths by major cause (QCPaedC), age and
gender, Queensland 1999 ......................................................................................... 38Figure 3.3: Paediatric mortality rate1 by major cause (QCPaedC) and year Queensland 1994-98
40Figure 3.4: Infant mortality rate, Queensland and the rest of Australia by year, 1987-1999...... 42Figure 3.5: Paediatric mortality rate1 for cancer by year and gender, Queensland 1994-98. .... 50Figure 4.1: Indigenous and non-Indigenous fetal mortality rates, Queensland 1987-1999 ....... 58Figure 4.2: Indigenous and non-Indigenous neonatal mortality rates, Queensland 1987-1999. 59Figure 4.3: Indigenous and non-Indigenous perinatal mortality rates, Queensland 1987-1999 59Figure 4.4: Perinatal mortality rates by selected cause (QCPMC) and Indigenous status,
Queensland 1999 ...................................................................................................... 62Figure 4.5: Neonatal mortality rate by selected cause (Neonatal Classification) and Indigenous
status, Queensland 1999 ........................................................................................... 63Figure 4.6: Indigenous paediatric mortality rate1, compared with non Indigenous, by major
cause (QCPaedC), Queensland 1999........................................................................ 65
Maternal, Perinatal and Paediatric Mortality in Queensland, 1999
Queensland Council on Obstetric and Paediatric Morbidity and Mortality 1
Chapter 1: Maternal Mortality
Executive summary• There were 13 maternal deaths (4 Direct, 3 Indirect and 6 Incidental) identified in Queensland during 1999,
and 48 044 mothers giving a maternal mortality ratio of 27.1 per 100 000 mothers.
• For the triennium 1997-99 a total of 26 maternal deaths (8 direct, 5 indirect and 13 incidental) were reportedto the Council giving a maternal mortality ratio for Queensland of 18.2 per 100 000 mothers.
• The maternal mortality ratio in Queensland by triennia has been consistently higher that the ratio reported forAustralia since 1991. The ratios for Queensland and Australia for the triennium 1991-93 were 16.8 and 10.9and for 1994-96 18.3 and 13.0 per 100 000 mothers respectively.
• The higher maternal death ratio in Queensland compared to Australia is in part due to the higher ratio ofindirect deaths but largely due to a consistently higher ratio of incidental deaths.
• The ratio of maternal deaths in Queensland from direct and indirect causes has been fairly stable for the lastthree triennia over the period 1988 to 1999, however the incidental death ratio has slowly increased from 3.9per 100 000 mothers in the 1988-90 triennium to 9.1 in the 1997-99 triennium.
• In Queensland for the period 1997-99, the most frequent principal cause of incidental maternal deaths washomicide (3 of the 13 deaths). Homicide was also the most frequent principal cause of incidental deaths forAustralia for the period 1994-96 (6 of the 34 incidental deaths).
• In the triennium 1997-99, avoidable factors were thought to be present in 11 (42%) of the 26 maternal deaths.The proportion of direct maternal deaths considered to have avoidable factors (50%) was similar to thatreported for Australia (48%).
• In Queensland over the period 1997-99, identification of maternal deaths was increased by 38% with the useof additional sources to that of routine reporting mechanisms (Australian Bureau of Statistics). This level ofunder reporting is slightly higher than the proportion identified by the Council for the 1994-99 triennium of27%. All of the additional deaths identified were classified as indirect or incidental deaths.
Chapter 2: Maternal Mortality
Queensland Council on Obstetric and Paediatric Morbidity and Mortality2
IntroductionMaternal mortality is now a very rare event, indicating a high standard of safety in the maternity services, but adetailed review of the circumstances surrounding maternal deaths still reveals aspects where improvements incare can be made. The Maternal Morbidity and Mortality Subcommittee carried out a confidential inquiry anddetailed review of all the maternal deaths that occurred in Queensland in 1999. This report includes results ofthis review for 13 maternal deaths in 1999 and also includes analyses of 26 maternal deaths reported to theCouncil for the triennium 1997-99.
DefinitionsFetal deaths = stillbirth Defined by the Registration of Births, Deaths and Marriages Act as a child whose
heart has not beaten after it has been completely expelled or extracted from itsmother and who is either of not less than 20 weeks gestation; or of not less than400g by weight at birth.
Livebirths: Defined by the Registration of Births, Deaths and Marriages Act as a child whoseheart has beaten after it has been completely expelled or extracted from itsmother.
Mothers: For the purposes of this report a mother is defined as the number of women havinga pregnancy which resulted in a livebirth or fetal death.
Maternal death: A maternal death is defined by the World Health Organisation (WHO) as the deathof a woman while pregnant or within 42 days of termination of pregnancy,irrespective of the duration and the site of the pregnancy, from any cause related toor aggravated by the pregnancy or its management. This definition excludes deathsfrom accidental or incidental causes.The definition used in this report includes, in addition to the WHO definition,incidental deaths and deaths occurring more than 42 days after termination of thepregnancy, when their origin and illness related to the pregnancy1.
Maternal mortality ratio: The maternal mortality ratio is defined as:
Number of maternal deathsNumber of mothers
Classification of maternal deaths.
Direct deaths are those which result from obstetric complications of the pregnant state (pregnancy,labour and puerperium) including deaths from interventions, omissions, inappropriate treatment, or froma chain of events resulting from any of the above. They are complications of the pregnancy itself.Indirect deaths are those which result from pre-existing disease or disease that developed duringpregnancy and was not due to direct obstetric causes, but which may have been aggravated byphysiological effects of pregnancy.Incidental deaths are those due to conditions occurring during pregnancy, where the pregnancy isunlikely to have contributed significantly to the death, although it is sometimes possible to postulate adistant association.
Avoidable factors are defined as departures from the accepted standard of satisfactory care that may haveplayed a part in the death. It is not suggested that in cases in which avoidable factors are considered present,death could certainly have been prevented, but such judgements indicate that the expert panel consideredthat the risk of death could have been lessened had the management been different. The subcommitteeapplied these criteria to the individual cases, and further considered whether the avoidability related to theclinical care, or to the setting in which the treatment was provided, or to factors associated with non-compliance. 1 Maternal Mortality Working Party, NHMRC. Report on Maternal Deaths in Australia 1991-93. Canberra: NHMRC;
1998
X 100,000
Maternal, Perinatal and Paediatric Mortality in Queensland, 1999
Queensland Council on Obstetric and Paediatric Morbidity and Mortality 3
Data sourcesAll deaths, including maternal deaths, are reported via the Registrar General's Office to the Australian Bureau ofStatistics (ABS), where deaths are coded according to the International Classification of Diseases 10th Revision(ICD10). A quarterly report is provided via the (Queensland) Office of the Government Statistician (OGS) to theSecretariat of the Council. Notifications of maternal deaths are also received through the annual survey ofmaternity institutions conducted by the Council Secretariat and by direct notification by clinicians.
Modus operandiWhen a maternal death is notified to the Council Secretariat, a confidential inquiry is undertaken, with theauthorisation and protection of Sections 154 M&N of the Health Act. The Council relies for the successfulconduct of these inquiries on the cooperation it receives from clinicians across the State. The members of theMaternal Morbidity and Mortality Subcommittee are provided with the clinical details for review. Followingconsideration of these details and the setting in which the death occurred, the primary cause of death isascertained, the classification is applied, and a judgement is made about the presence of avoidable factors.
Definitions for maternal mortalityDifferent definitions for maternal mortality are reported.1 The national Advisory Committee on MaternalMorbidity and Mortality reports the maternal mortality for Australia ratio using the denominator of births(livebirths or stillbirths) of at least 400g or 20 weeks if the weight is unknown. This differs from thedefinition used for maternal mortality in Queensland in that the denominator includes all liveborn babiesregardless of gestation or birthweight and fetal deaths of either at least 20 weeks or 400g. Althoughdifferences in definitions should be considered when making comparisons with national maternal mortalityratio it is reasonable to do so due to the very low numbers of maternal deaths.The national Advisory Committee also reports national ratios using the World Health Organisation (WHO)definition to facilitate international comparisons. The WHO defines maternal mortality ratio as the number ofmaternal deaths, related to the numbers of livebirths, as this denominator is more widely available. In anattempt to achieve more uniform data collection across Australia, the national Advisory Committee, in themost recent report on maternal deaths in Australia, has modified this definition to include only deaths amongpregnant women or within 42 days of pregnancy being delivered or terminated.2
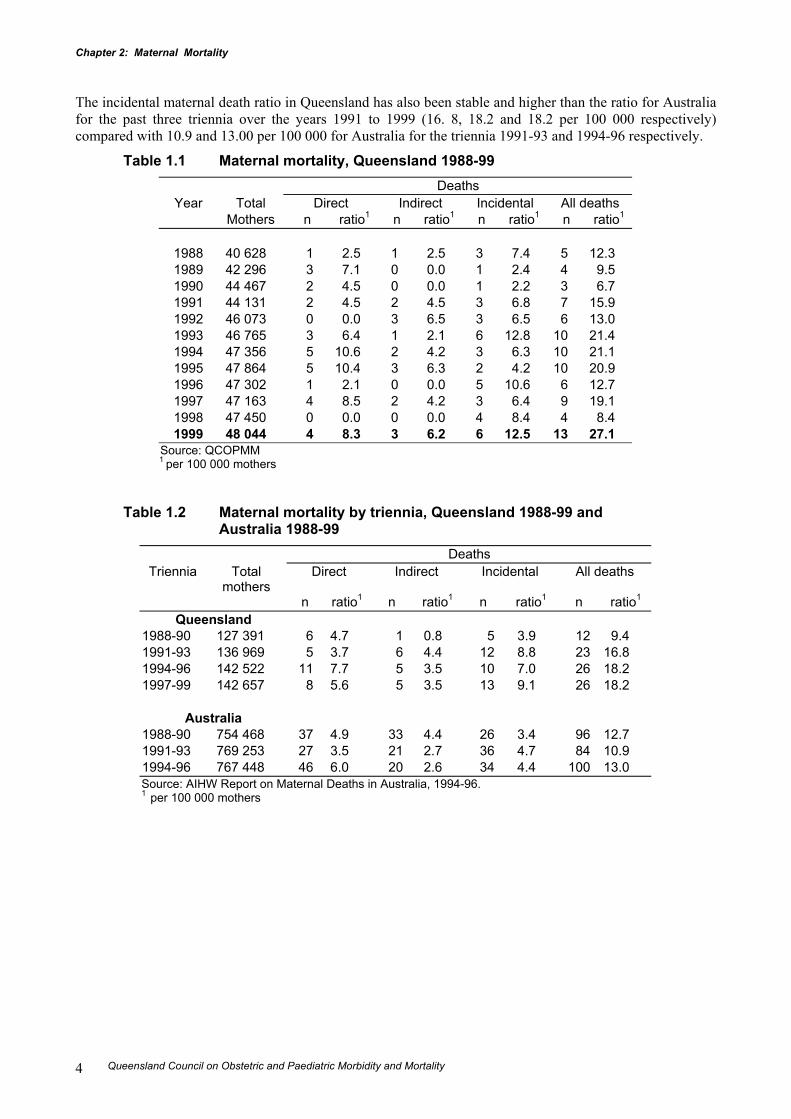
Maternal mortality ratios and trendsThe ratios for direct, indirect and incidental maternal deaths in Queensland for the triennium 1997-99 were5.6, 3.5 and 9.1 per 100 000 mothers respectively. The ratio for direct deaths for the period 1997-99 is lowerthan the previous two triennium 1991-93 (3.7) and 1994-96 (7.7) and is similar to the ratio for Australia1994-96 of 6.9 per 100 000.
Maternal mortality ratios for Queensland for the years 1988 to 1999 by classification are shown in Table 1.1.The overall maternal mortality ratio increased from 1988 to 1993 (12.3 and 21.4 per 100 000 mothersrespectively) and has since stabilised. The overall maternal mortality ratio for Queensland for 1999 was 27.1 per100 000 mothers.
When numerators are small and denominators large, as with the maternal mortality ratio, differences in rates andshort-term fluctuations render interpretation difficult. To enable more meaningful consideration of maternaldeath in Queensland including national comparisons, maternal deaths for the years 1997 to 1999 have beencombined. The ratio for Queensland for the triennium 1997-99 was 18.2 per 100 000 mothers, which was higherthan the national ratio of 13.0 per 100 000 for the triennium 1994-96. Over the period 1991-99 the ratio observedin Queensland was higher than the ratio reported for Australia mainly due to more incidental deaths Table 1.2.This may be directly related to the efforts that the Council in Queensland has made to maximise ascertainment.
The indirect maternal death ratio in Queensland has been stable for the past three triennia over the years1991 to 1999 (4.4, 3.5 and 3,5 per 100 000 mothers) and has been slightly higher than the ratio for Australiafor the triennia 1991-93 and 1994-96 (2.7 and 2.6 per 100 000 mothers respectively).
2 Advisory Committee on Maternal Mortality and Morbidity. Report on Maternal Deaths in Australia 1994-96. AIHW
cat. no. PER 13. Canberra: AIHW; 2001.
Chapter 2: Maternal Mortality
Queensland Council on Obstetric and Paediatric Morbidity and Mortality4
The incidental maternal death ratio in Queensland has also been stable and higher than the ratio for Australiafor the past three triennia over the years 1991 to 1999 (16. 8, 18.2 and 18.2 per 100 000 respectively)compared with 10.9 and 13.00 per 100 000 for Australia for the triennia 1991-93 and 1994-96 respectively.
Table 1.1 Maternal mortality, Queensland 1988-99Deaths
Year Total Direct Indirect Incidental All deathsMothers n ratio1 n ratio1 n ratio1 n ratio1
1988 40 628 1 2.5 1 2.5 3 7.4 5 12.31989 42 296 3 7.1 0 0.0 1 2.4 4 9.51990 44 467 2 4.5 0 0.0 1 2.2 3 6.71991 44 131 2 4.5 2 4.5 3 6.8 7 15.91992 46 073 0 0.0 3 6.5 3 6.5 6 13.01993 46 765 3 6.4 1 2.1 6 12.8 10 21.41994 47 356 5 10.6 2 4.2 3 6.3 10 21.11995 47 864 5 10.4 3 6.3 2 4.2 10 20.91996 47 302 1 2.1 0 0.0 5 10.6 6 12.71997 47 163 4 8.5 2 4.2 3 6.4 9 19.11998 47 450 0 0.0 0 0.0 4 8.4 4 8.41999 48 044 4 8.3 3 6.2 6 12.5 13 27.1
Source: QCOPMM1 per 100 000 mothers
Table 1.2 Maternal mortality by triennia, Queensland 1988-99 andAustralia 1988-99
DeathsTriennia Total
mothersDirect Indirect Incidental All deaths
n ratio1 n ratio1 n ratio1 n ratio1
Queensland1988-90 127 391 6 4.7 1 0.8 5 3.9 12 9.41991-93 136 969 5 3.7 6 4.4 12 8.8 23 16.81994-96 142 522 11 7.7 5 3.5 10 7.0 26 18.21997-99 142 657 8 5.6 5 3.5 13 9.1 26 18.2
Australia1988-90 754 468 37 4.9 33 4.4 26 3.4 96 12.71991-93 769 253 27 3.5 21 2.7 36 4.7 84 10.91994-96 767 448 46 6.0 20 2.6 34 4.4 100 13.0Source: AIHW Report on Maternal Deaths in Australia, 1994-96.1 per 100 000 mothers
Maternal, Perinatal and Paediatric Mortality in Queensland, 1999
Queensland Council on Obstetric and Paediatric Morbidity and Mortality 5
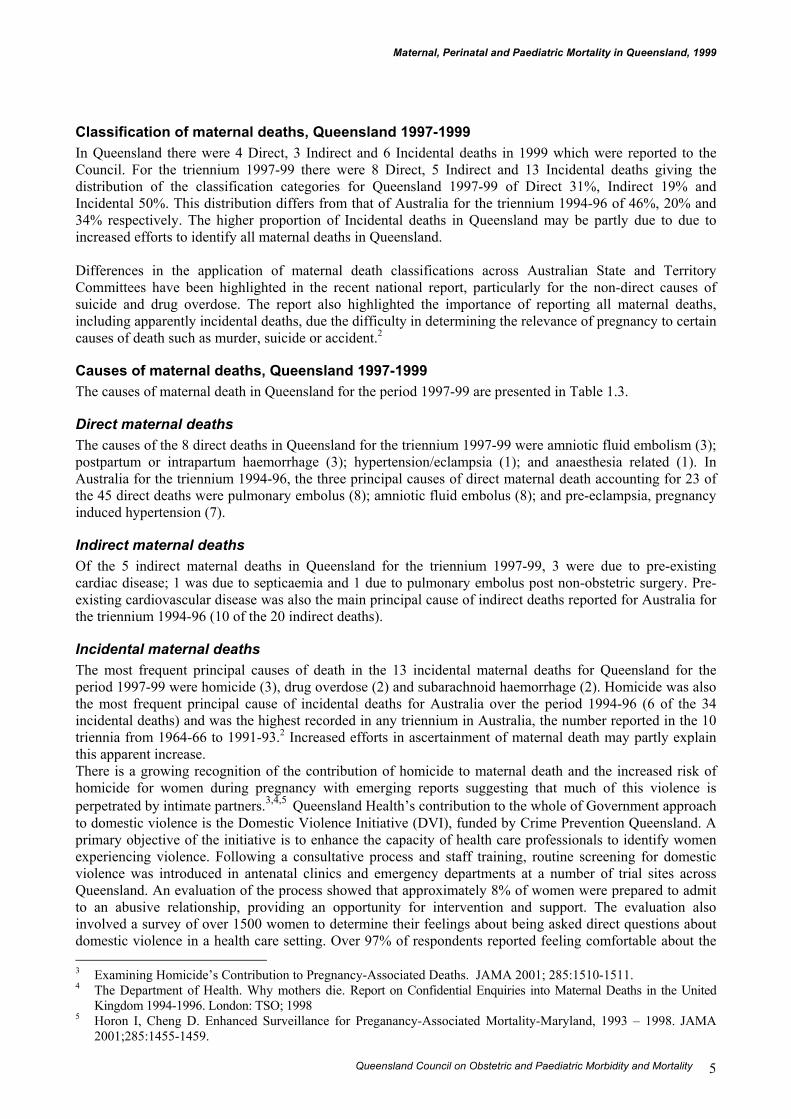
Classification of maternal deaths, Queensland 1997-1999In Queensland there were 4 Direct, 3 Indirect and 6 Incidental deaths in 1999 which were reported to theCouncil. For the triennium 1997-99 there were 8 Direct, 5 Indirect and 13 Incidental deaths giving thedistribution of the classification categories for Queensland 1997-99 of Direct 31%, Indirect 19% andIncidental 50%. This distribution differs from that of Australia for the triennium 1994-96 of 46%, 20% and34% respectively. The higher proportion of Incidental deaths in Queensland may be partly due to due toincreased efforts to identify all maternal deaths in Queensland.
Differences in the application of maternal death classifications across Australian State and TerritoryCommittees have been highlighted in the recent national report, particularly for the non-direct causes ofsuicide and drug overdose. The report also highlighted the importance of reporting all maternal deaths,including apparently incidental deaths, due the difficulty in determining the relevance of pregnancy to certaincauses of death such as murder, suicide or accident.2
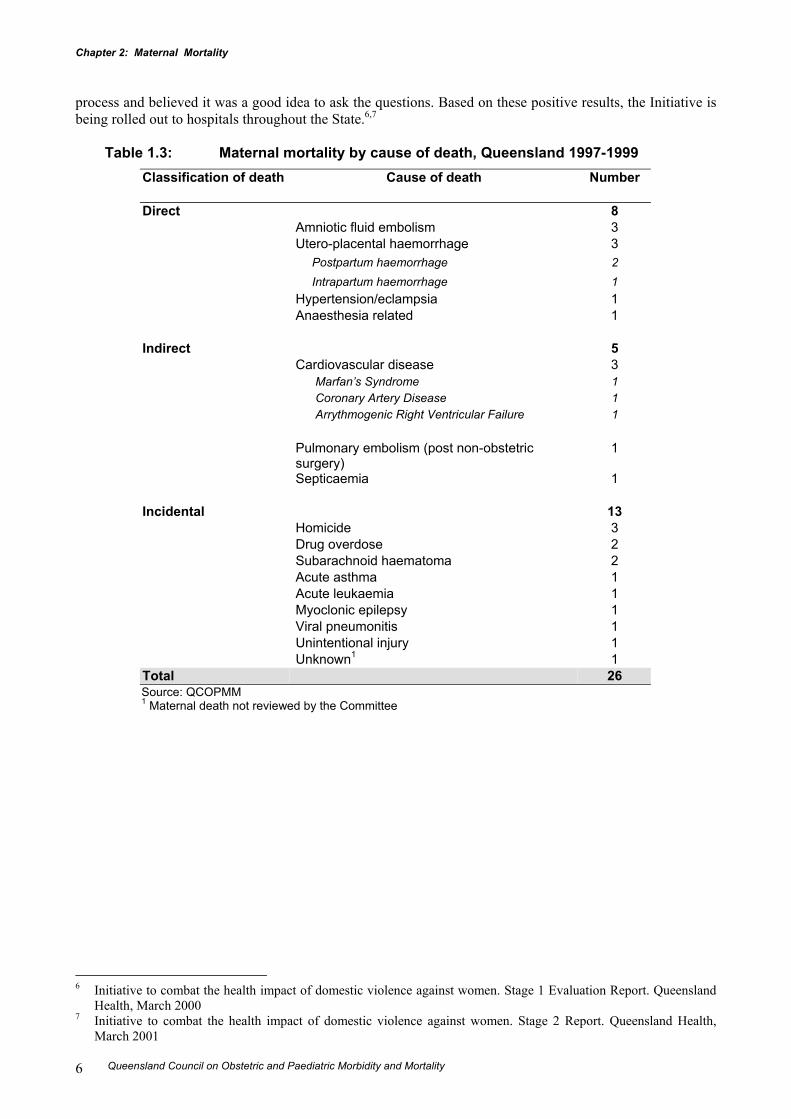
Causes of maternal deaths, Queensland 1997-1999The causes of maternal death in Queensland for the period 1997-99 are presented in Table 1.3.
Direct maternal deathsThe causes of the 8 direct deaths in Queensland for the triennium 1997-99 were amniotic fluid embolism (3);postpartum or intrapartum haemorrhage (3); hypertension/eclampsia (1); and anaesthesia related (1). InAustralia for the triennium 1994-96, the three principal causes of direct maternal death accounting for 23 ofthe 45 direct deaths were pulmonary embolus (8); amniotic fluid embolus (8); and pre-eclampsia, pregnancyinduced hypertension (7).
Indirect maternal deathsOf the 5 indirect maternal deaths in Queensland for the triennium 1997-99, 3 were due to pre-existingcardiac disease; 1 was due to septicaemia and 1 due to pulmonary embolus post non-obstetric surgery. Pre-existing cardiovascular disease was also the main principal cause of indirect deaths reported for Australia forthe triennium 1994-96 (10 of the 20 indirect deaths).
Incidental maternal deathsThe most frequent principal causes of death in the 13 incidental maternal deaths for Queensland for theperiod 1997-99 were homicide (3), drug overdose (2) and subarachnoid haemorrhage (2). Homicide was alsothe most frequent principal cause of incidental deaths for Australia over the period 1994-96 (6 of the 34incidental deaths) and was the highest recorded in any triennium in Australia, the number reported in the 10triennia from 1964-66 to 1991-93.2 Increased efforts in ascertainment of maternal death may partly explainthis apparent increase.There is a growing recognition of the contribution of homicide to maternal death and the increased risk ofhomicide for women during pregnancy with emerging reports suggesting that much of this violence isperpetrated by intimate partners.3,4,5 Queensland Health’s contribution to the whole of Government approachto domestic violence is the Domestic Violence Initiative (DVI), funded by Crime Prevention Queensland. Aprimary objective of the initiative is to enhance the capacity of health care professionals to identify womenexperiencing violence. Following a consultative process and staff training, routine screening for domesticviolence was introduced in antenatal clinics and emergency departments at a number of trial sites acrossQueensland. An evaluation of the process showed that approximately 8% of women were prepared to admitto an abusive relationship, providing an opportunity for intervention and support. The evaluation alsoinvolved a survey of over 1500 women to determine their feelings about being asked direct questions aboutdomestic violence in a health care setting. Over 97% of respondents reported feeling comfortable about the 3 Examining Homicide’s Contribution to Pregnancy-Associated Deaths. JAMA 2001; 285:1510-1511.4 The Department of Health. Why mothers die. Report on Confidential Enquiries into Maternal Deaths in the United
Kingdom 1994-1996. London: TSO; 19985 Horon I, Cheng D. Enhanced Surveillance for Preganancy-Associated Mortality-Maryland, 1993 – 1998. JAMA
2001;285:1455-1459.
Chapter 2: Maternal Mortality
Queensland Council on Obstetric and Paediatric Morbidity and Mortality6
process and believed it was a good idea to ask the questions. Based on these positive results, the Initiative isbeing rolled out to hospitals throughout the State.6,7
Table 1.3: Maternal mortality by cause of death, Queensland 1997-1999Classification of death Cause of death Number
Direct 8 Amniotic fluid embolism 3 Utero-placental haemorrhage 3 Postpartum haemorrhage 2 Intrapartum haemorrhage 1 Hypertension/eclampsia 1 Anaesthesia related 1
Indirect 5 Cardiovascular disease 3 Marfan’s Syndrome 1 Coronary Artery Disease 1 Arrythmogenic Right Ventricular Failure 1
Pulmonary embolism (post non-obstetric surgery)
1
Septicaemia 1
Incidental 13 Homicide 3 Drug overdose 2 Subarachnoid haematoma 2 Acute asthma 1 Acute leukaemia 1 Myoclonic epilepsy 1 Viral pneumonitis 1 Unintentional injury 1 Unknown1 1
Total 26Source: QCOPMM1 Maternal death not reviewed by the Committee
6 Initiative to combat the health impact of domestic violence against women. Stage 1 Evaluation Report. Queensland
Health, March 20007 Initiative to combat the health impact of domestic violence against women. Stage 2 Report. Queensland Health,
March 2001
Maternal, Perinatal and Paediatric Mortality in Queensland, 1999
Queensland Council on Obstetric and Paediatric Morbidity and Mortality 7
Avoidable factorsThe Subcommittee was guided by the NHMRC Working Party’s recommendation that avoidable factors can beconsidered to be present when there is a departure (for whatever reason) from an accepted standard of care.When avoidable factors were found further classification was undertaken as to whether they should be ascribedto:1) the clinical care,2) the clinical setting or3) to the woman and/or her companion or family.
Consideration of avoidability for direct and indirect deaths is a judgement largely based on assessment of theclinical circumstances. On the other hand, incidental deaths from both intentional and unintentional injury mustby definition have avoidable factors, therefore in the context of maternal mortality, are classified as avoidable.
For the triennium 1997-99, avoidable factors were thought to be present in 11 (42%) of the 26 maternal deaths(Table 1.4). Five of the 13 direct or indirect deaths over this period were considered to have avoidable factors(38%). The proportion of direct maternal deaths with avoidable factors in Queensland is similar to the ratereported for Australia of 48% for the period 1994-96.2 The presence of avoidable factors indicates a continuingneed for confidential inquiry into all maternal deaths, and careful addressing of any detected clinical or servicedeficiencies.
Table 1.4: Maternal mortality, avoidable factors by classification,Queensland 1997-1999
Direct Indirect Incidental All deathsFactor
n=8 n=5 n=13 n=26Clinical care 3 - - 3Clinical setting - 1 - 1Woman/companion/family 1 - 6 7Total 4 1 6 11
Source: QCOPMM
Chapter 2: Maternal Mortality
Queensland Council on Obstetric and Paediatric Morbidity and Mortality8
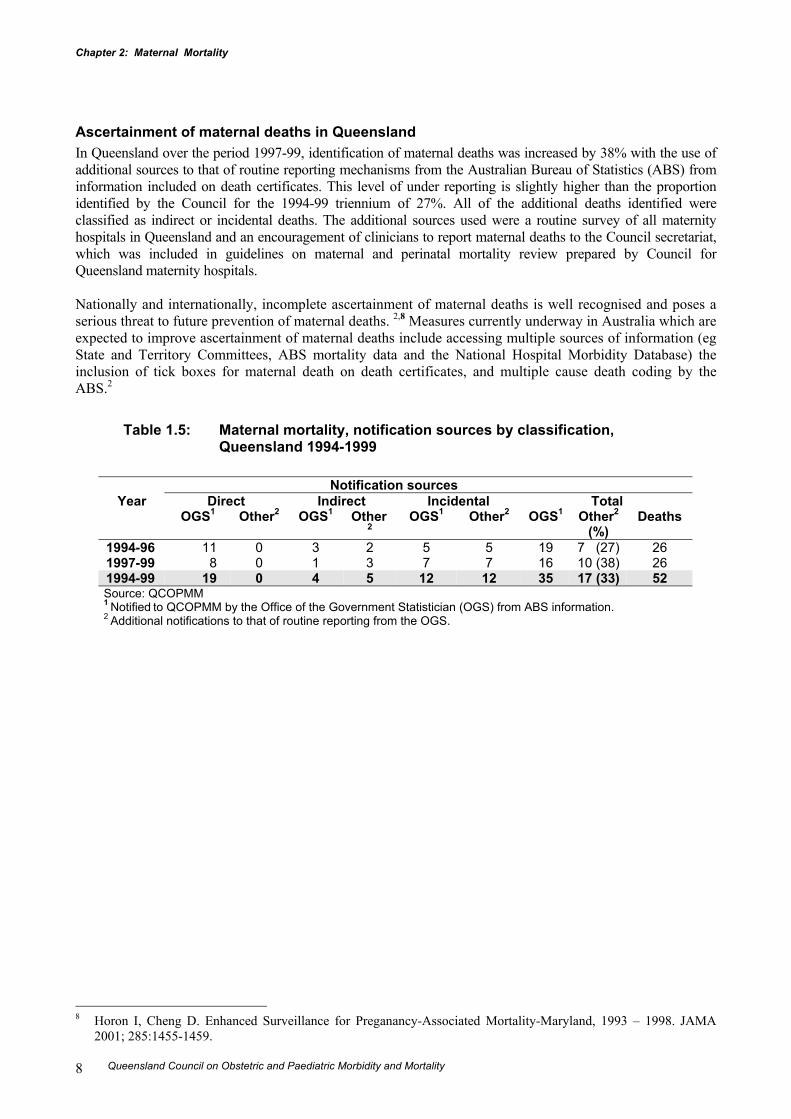
Ascertainment of maternal deaths in QueenslandIn Queensland over the period 1997-99, identification of maternal deaths was increased by 38% with the use ofadditional sources to that of routine reporting mechanisms from the Australian Bureau of Statistics (ABS) frominformation included on death certificates. This level of under reporting is slightly higher than the proportionidentified by the Council for the 1994-99 triennium of 27%. All of the additional deaths identified wereclassified as indirect or incidental deaths. The additional sources used were a routine survey of all maternityhospitals in Queensland and an encouragement of clinicians to report maternal deaths to the Council secretariat,which was included in guidelines on maternal and perinatal mortality review prepared by Council forQueensland maternity hospitals.
Nationally and internationally, incomplete ascertainment of maternal deaths is well recognised and poses aserious threat to future prevention of maternal deaths. 2,8 Measures currently underway in Australia which areexpected to improve ascertainment of maternal deaths include accessing multiple sources of information (egState and Territory Committees, ABS mortality data and the National Hospital Morbidity Database) theinclusion of tick boxes for maternal death on death certificates, and multiple cause death coding by theABS.2
Table 1.5: Maternal mortality, notification sources by classification,Queensland 1994-1999
Notification sourcesYear Direct Indirect Incidental Total
OGS1 Other2 OGS1 Other2
OGS1 Other2 OGS1 Other2
(%)Deaths
1994-96 11 0 3 2 5 5 19 7 (27) 261997-99 8 0 1 3 7 7 16 10 (38) 261994-99 19 0 4 5 12 12 35 17 (33) 52Source: QCOPMM1 Notified to QCOPMM by the Office of the Government Statistician (OGS) from ABS information.2 Additional notifications to that of routine reporting from the OGS.
8 Horon I, Cheng D. Enhanced Surveillance for Preganancy-Associated Mortality-Maryland, 1993 – 1998. JAMA
2001; 285:1455-1459.
Maternal, Perinatal and Paediatric Mortality in Queensland, 1999
Queensland Council on Obstetric and Paediatric Morbidity and Mortality 9
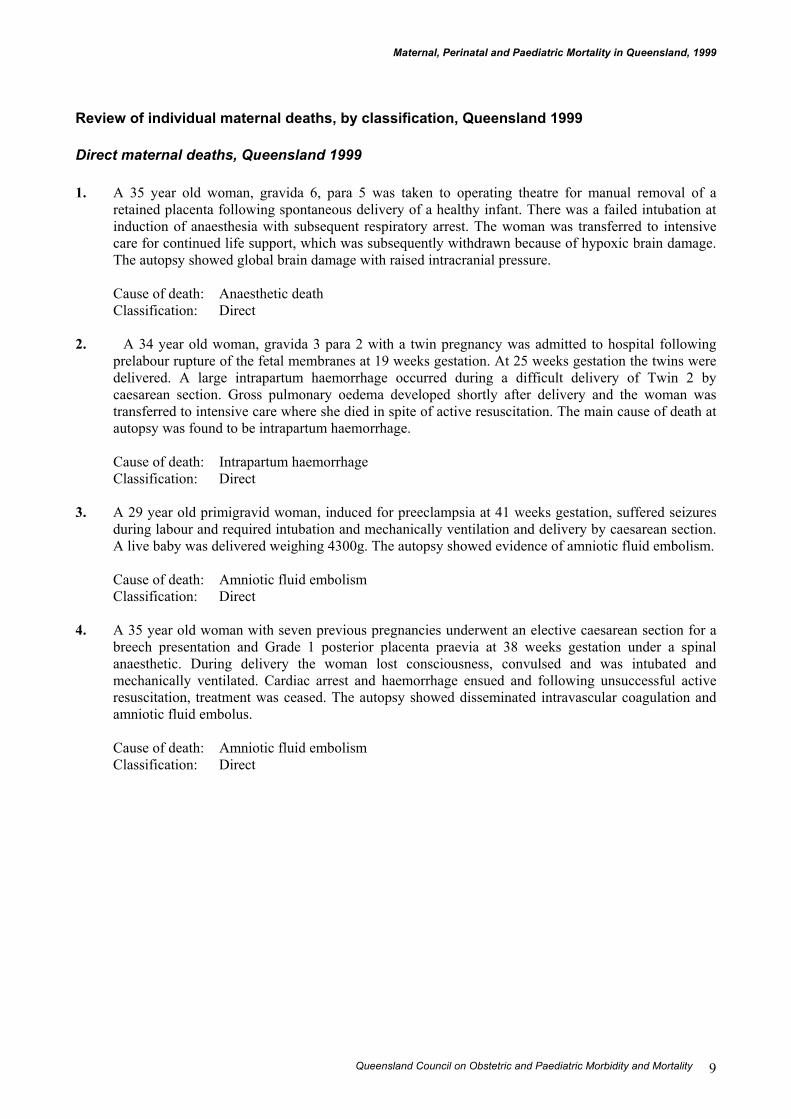
Review of individual maternal deaths, by classification, Queensland 1999
Direct maternal deaths, Queensland 1999
1. A 35 year old woman, gravida 6, para 5 was taken to operating theatre for manual removal of aretained placenta following spontaneous delivery of a healthy infant. There was a failed intubation atinduction of anaesthesia with subsequent respiratory arrest. The woman was transferred to intensivecare for continued life support, which was subsequently withdrawn because of hypoxic brain damage.The autopsy showed global brain damage with raised intracranial pressure.
Cause of death: Anaesthetic deathClassification: Direct
2. A 34 year old woman, gravida 3 para 2 with a twin pregnancy was admitted to hospital followingprelabour rupture of the fetal membranes at 19 weeks gestation. At 25 weeks gestation the twins weredelivered. A large intrapartum haemorrhage occurred during a difficult delivery of Twin 2 bycaesarean section. Gross pulmonary oedema developed shortly after delivery and the woman wastransferred to intensive care where she died in spite of active resuscitation. The main cause of death atautopsy was found to be intrapartum haemorrhage.
Cause of death: Intrapartum haemorrhageClassification: Direct
3. A 29 year old primigravid woman, induced for preeclampsia at 41 weeks gestation, suffered seizuresduring labour and required intubation and mechanically ventilation and delivery by caesarean section.A live baby was delivered weighing 4300g. The autopsy showed evidence of amniotic fluid embolism.
Cause of death: Amniotic fluid embolismClassification: Direct
4. A 35 year old woman with seven previous pregnancies underwent an elective caesarean section for abreech presentation and Grade 1 posterior placenta praevia at 38 weeks gestation under a spinalanaesthetic. During delivery the woman lost consciousness, convulsed and was intubated andmechanically ventilated. Cardiac arrest and haemorrhage ensued and following unsuccessful activeresuscitation, treatment was ceased. The autopsy showed disseminated intravascular coagulation andamniotic fluid embolus.
Cause of death: Amniotic fluid embolismClassification: Direct
Chapter 2: Maternal Mortality
Queensland Council on Obstetric and Paediatric Morbidity and Mortality10
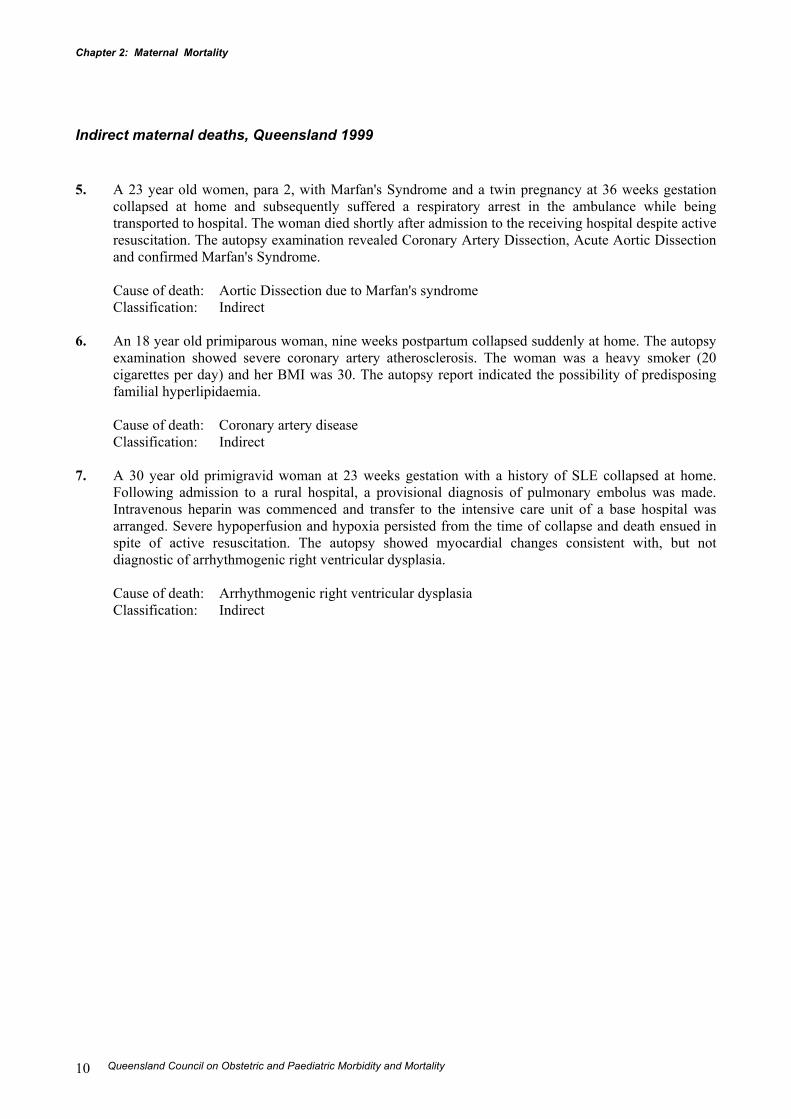
Indirect maternal deaths, Queensland 1999
5. A 23 year old women, para 2, with Marfan's Syndrome and a twin pregnancy at 36 weeks gestationcollapsed at home and subsequently suffered a respiratory arrest in the ambulance while beingtransported to hospital. The woman died shortly after admission to the receiving hospital despite activeresuscitation. The autopsy examination revealed Coronary Artery Dissection, Acute Aortic Dissectionand confirmed Marfan's Syndrome.
Cause of death: Aortic Dissection due to Marfan's syndromeClassification: Indirect
6. An 18 year old primiparous woman, nine weeks postpartum collapsed suddenly at home. The autopsyexamination showed severe coronary artery atherosclerosis. The woman was a heavy smoker (20cigarettes per day) and her BMI was 30. The autopsy report indicated the possibility of predisposingfamilial hyperlipidaemia.
Cause of death: Coronary artery diseaseClassification: Indirect
7. A 30 year old primigravid woman at 23 weeks gestation with a history of SLE collapsed at home.Following admission to a rural hospital, a provisional diagnosis of pulmonary embolus was made.Intravenous heparin was commenced and transfer to the intensive care unit of a base hospital wasarranged. Severe hypoperfusion and hypoxia persisted from the time of collapse and death ensued inspite of active resuscitation. The autopsy showed myocardial changes consistent with, but notdiagnostic of arrhythmogenic right ventricular dysplasia.
Cause of death: Arrhythmogenic right ventricular dysplasiaClassification: Indirect
Maternal, Perinatal and Paediatric Mortality in Queensland, 1999
Queensland Council on Obstetric and Paediatric Morbidity and Mortality 11
Incidental maternal deaths, Queensland 1999
8. A 24 year old woman in her first pregnancy at approximately 15 weeks gestation died as a result ofdrowning following a helicopter crash.
Cause of death: Helicopter crash - drowningClassification: Incidental
9. A 27 year old woman, para 4, was admitted to hospital following collapse and seizures at home. Onadmission to hospital a history of intravenous amphetamine use throughout the pregnancy andcomplaints of a headache prior to having the seizure was noted. Mechanical ventilation wascommenced. A CT scan was performed which showed a large subdural haematoma. Autopsy revealeda subarachnoid haemorrhage from a ruptured left middle cerebral artery saccular aneurysm.
Cause of death: Subarachnoid haemorrhageClassification: Incidental
10. A 24 year old woman in her fourth pregnancy at 32 weeks gestation died suddenly at home. At thetime of finalisation of this report, details were not available from the Coroner or the GovernmentMedical Officer who performed an autopsy to enable review by the Subcommittee. Based on theinformation available, the death has been provisionally classified as incidental.
Cause of death: UnknownClassification: Incidental
11. A 37 year old woman at approximately 12 weeks gestation with a previous history of acute severerecurrent asthma, cardiomyopathy and heavy smoking, presented at the emergency department of alevel 2 hospital with an acute episode of asthma. Treatment included oxygen, ventolin, hydrocortisoneand (within a few hours of admission) intubation and ventilation. Due to continued deterioration,transfer was not possible. Cardiac arrest and death ensued. No post mortem examination wasconducted.
Cause of death: Acute AsthmaClassification: Incidental
12. A 33 year old woman of unknown parity, known to be a heroin addict on the Naltrexone program, diedsuddenly at home. The woman was said to be suffering depression following a relationship failure.The autopsy examination revealed a pregnancy of 10 week gestation and multiple drug toxicity.
Cause of death: Drug overdoseClassification: Incidental
13. A 19 year old woman with a history of heroin use was admitted to an intensive care unit with asuspected drug overdose and cardiopulmonary arrest and was noted to have a pregnancy of beapproximately twelve weeks gestation. Significant hypoxic brain damage was suspected and deathensured at approximately 36hours after admission. An autopsy was undertaken showing the cause ofdeath as cardiac and respiratory arrest due to a drug overdose.
Cause of death: Drug overdoseClassification: Incidental
Chapter 2: Perinatal Mortality
Queensland Council on Obstetric and Paediatric Morbidity and Mortality12
Chapter 2: Perinatal Mortality
Executive summary• There were 48 749 births and 518 perinatal deaths in Queensland for 1999 giving a crude perinatal
mortality rate of 10.6 per 1 000 total births. This was comprised of a fetal mortality rate of 7.1 per 1 000total births and a neonatal mortality rate of 3.5 per 1 000 livebirths.
• Since 1983 the rate of perinatal deaths in Queensland has been similar to that observed for Australia.
• Preterm births (<37 weeks) accounted for 8% of infants and 79% of perinatal deaths. Very preterm births(<28 weeks) accounted for <1% of infants and 57% of perinatal deaths.
• Twins and higher order multiple births account for 3% of births, and was considered the primary cause ofperinatal death (using the QCPMC classification) in 12% of perinatal deaths.
• The main causes of death according to the Queensland Council Perinatal Mortality Classification wereCongenital Anomaly (24%), Unexplained Antepartum Death (18%) and Unexplained Preterm (18%).
• The overall rate of Unexplained Antepartum Death was 2.0 per 1 000 births which is over three times therate of SIDS.
• Compared with Australia as a whole Queensland had a higher perinatal mortality rate due to CongenitalAnomalies (2.5 compared with 1.6 per 1000 births).
• Of all fetal deaths 10% were attributed to voluntary interruption of pregnancy ≥20 weeks.
• When perinatal mortality for public facility types is corrected for gestational age the perinatal mortalityrate for Tertiary Women’s Hospitals was 9.7 per 1 000 births, compared with a rate of 12.5 and 13.3 per1 000 births for Major and Other Public Hospitals respectively.
• The rate of perinatal autopsies for Queensland in 1999 (45%) compares unfavourably with rates observedelsewhere in Australia and overseas and is well below the recommended rate of 75%.
Maternal, Perinatal and Paediatric Mortality in Queensland, 1999
Queensland Council on Obstetric and Paediatric Morbidity and Mortality 13
Modus operandiPerinatal deaths are notified by the Registrar General’s Office to the Perinatal Data Collection (PDC), DataServices Unit of Queensland Health. The Chief Health Officer then requests on behalf of the Council that acopy of the autopsy and other relevant material be sent to the PDC to facilitate classification by the PerinatalMortality Working Group of the Council Perinatal Subcommittee. The PDC collates and makes available allinformation on the deaths for review by the Working Group. For the review of deaths for 1999, the WorkingGroup consisted of an obstetrician (Jeremy Oats), neonatologist (David Tudehope), perinatal pathologist(Diane Payton) and the Council Research Officer (Vicki Flenady). During 1999 a number of institutionalMortality Committees collaborated with the Council in the perinatal mortality review process. These werecommittees at the Mater Mothers’ and Royal Women’s Hospital, Brisbane; the Kirwan Hospital for Women,Townsville; Ipswich, Nambour, Redcliffe, Caboolture, Rockhampton Hospitals and the Peninsula and TorresStrait Island Committee. The Working Group received case summaries and cause of death classificationsassigned by these Committees for 293 (57%) perinatal deaths occurring in 1999.
Each case was classified according to the primary cause of death using the clinical classifications developedby the Council. Two classifications were applied to perinatal deaths: an obstetric antecedent classification(Queensland Council Perinatal Mortality Classification – QCPMC) for all perinatal deaths and the NeonatalMortality Classification for all neonatal deaths.
Clinical classification for perinatal death
Queensland Council Perinatal Mortality Classification (QCPMC)In order to develop preventive strategies, it is necessary to be able to focus on those maternal/fetal factorswhich may have contributed to the death. After extensive experience with classifying perinatal deaths, and inorder to overcome several perceived shortcomings of the earlier classification systems and with the ICD 9system, members of the Council developed a more inclusive, hierarchical and user-friendly system. ThisQueensland Council Perinatal Mortality Classification system identifies the primary maternal and/ or fetalfactors that led to the death, and is the classification system used in this report (Appendix 1).In 1998 this system was further refined and renamed the Queensland Council Perinatal MortalityClassification, (QCPMC) and was circulated to clinicians in Queensland as part of the document Maternaland Perinatal Mortality Audit- Guidelines for Queensland Hospitals, April 1999.
Neonatal ClassificationA separate neonatal mortality classification was considered necessary by the Council as the classification ofperinatal deaths by obstetric antecedent frequently does not provide sufficient information to appreciate thecause of neonatal death. The Council has adopted (and slightly modified) the system of classifying neonataldeaths developed by the South Australian Perinatal Committee. The Neonatal Classification assists in theidentification of preventable aspects of neonatal mortality and is applied to all babies who were born aliveand died within 28 days of birth (Appendix 2).
Australia and New Zealand perinatal mortality classificationsIn early 2000, the National Perinatal Data Development Committee (NPDDC), following two previousworkshops in 1996 and 1998, agreed to attempt to develop uniform classification systems for use throughoutAustralia and New Zealand. It was agreed at this meeting that draft classifications be developed by theQueensland and South Australian representatives and circulated for comment. At a subsequent workshop inJuly 2000 the two new classifications, the Australian and New Zealand Classification of Perinatal Mortality(ANZACPM) and the Australian and New Zealand Neonatal Death Classification (ANZNDC) wereaccepted. These classifications have been circulated to Queensland hospitals in the guidelines update fordeaths in Queensland from 2001.
Chapter 2: Perinatal Mortality
Queensland Council on Obstetric and Paediatric Morbidity and Mortality14
Data sourcesThe data used in this chapter have been obtained from participating institutional Committees (see above), thePerinatal Data Collection (PDC) of the Data Services Unit in the Health Information Centre of QueenslandHealth, the Australian Institute of Health and Welfare’s National Perinatal Statistics Unit (NPSU) and fromthe Australian Bureau of Statistics (ABS). It should be noted that there are differences between the reportingpractices of the ABS and the PDC with respect to time periods covered, place of usual residence and entrycriteria and therefore information from the two sources is not directly comparable.
• The ABS records deaths by year of registration and place of usual residence of the mother and the PDC byyear and State of birth occurrence.
• The ABS reports only on deaths of babies of at least 400g birthweight or 20 weeks gestation wherebirthweight is unknown, whereas the PDC uses either 400g or 20 weeks as the entry criteria. In 1999 therewere 99 births (all perinatal deaths) collected by PDC which fell outside the ABS criteria.
DefinitionsFetal death Defined by the Registration of Births, Deaths and Marriages Act as a child whose
heart has not beaten after it has been completely expelled or extracted from itsmother and who is either of not less than 20 weeks gestation; or of not less than400g by weight at birth.
Live birth Defined by the Registration of Births, Deaths and Marriages Act as a child whoseheart has beaten after it has been completely expelled or extracted from itsmother.
Neonatal death The death of an infant within 28 days of birth.Infant death The death of an infant under one year of age.Perinatal mortality rate The number of fetal and neonatal deaths per 1 000 total births.Fetal mortality rate The number of fetal deaths per 1 000 total births.Neonatal mortality rate The number of deaths of live born infants under 28 days of age per 1 000 live
births.Infant mortality rate The number of deaths of infants under one year of age in a period per 1 000 live
births in the same period.
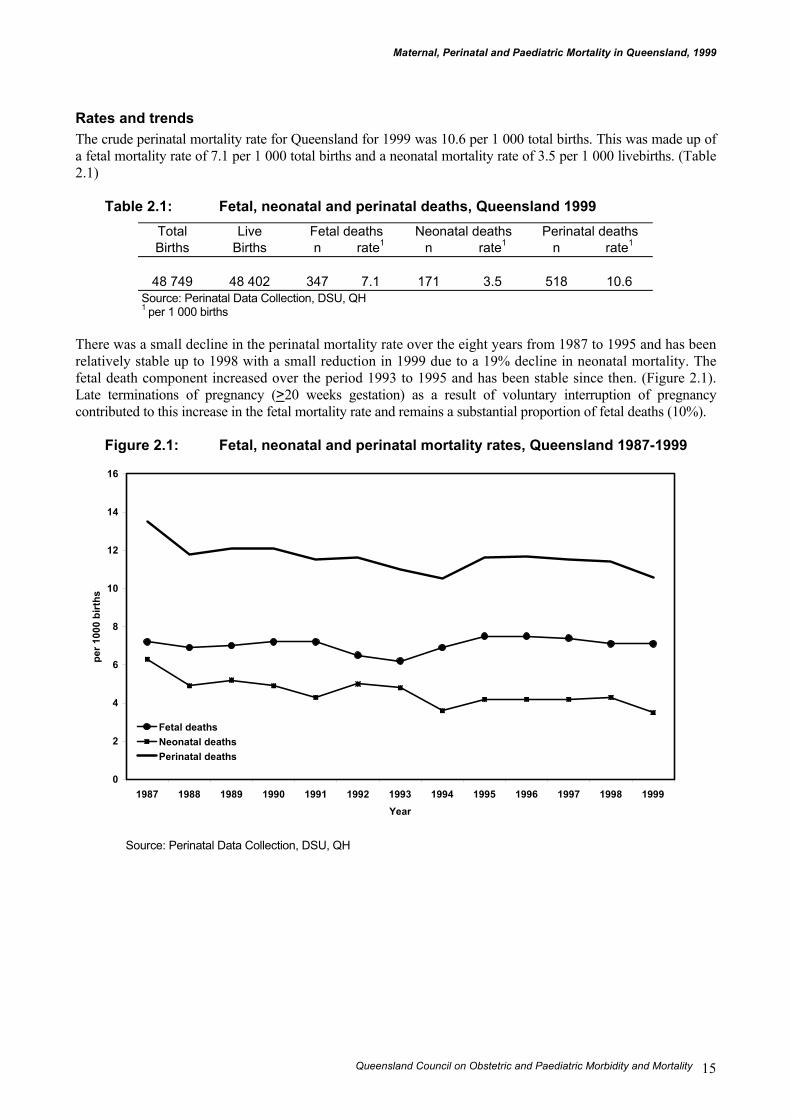
Maternal, Perinatal and Paediatric Mortality in Queensland, 1999
Queensland Council on Obstetric and Paediatric Morbidity and Mortality 15
Rates and trendsThe crude perinatal mortality rate for Queensland for 1999 was 10.6 per 1 000 total births. This was made up ofa fetal mortality rate of 7.1 per 1 000 total births and a neonatal mortality rate of 3.5 per 1 000 livebirths. (Table2.1)
Table 2.1: Fetal, neonatal and perinatal deaths, Queensland 1999Total Live Fetal deaths Neonatal deaths Perinatal deathsBirths Births n rate1 n rate1 n rate1
48 749 48 402 347 7.1 171 3.5 518 10.6Source: Perinatal Data Collection, DSU, QH1 per 1 000 births
There was a small decline in the perinatal mortality rate over the eight years from 1987 to 1995 and has beenrelatively stable up to 1998 with a small reduction in 1999 due to a 19% decline in neonatal mortality. Thefetal death component increased over the period 1993 to 1995 and has been stable since then. (Figure 2.1).Late terminations of pregnancy (>20 weeks gestation) as a result of voluntary interruption of pregnancycontributed to this increase in the fetal mortality rate and remains a substantial proportion of fetal deaths (10%).
Figure 2.1: Fetal, neonatal and perinatal mortality rates, Queensland 1987-1999
Source: Perinatal Data Collection, DSU, QH
0
2
4
6
8
10
12
14
16
1987 1988 1989 1990 1991 1992 1993 1994 1995 1996 1997 1998 1999Year
per 1
000
birt
hs
Fetal deathsNeonatal deathsPerinatal deaths
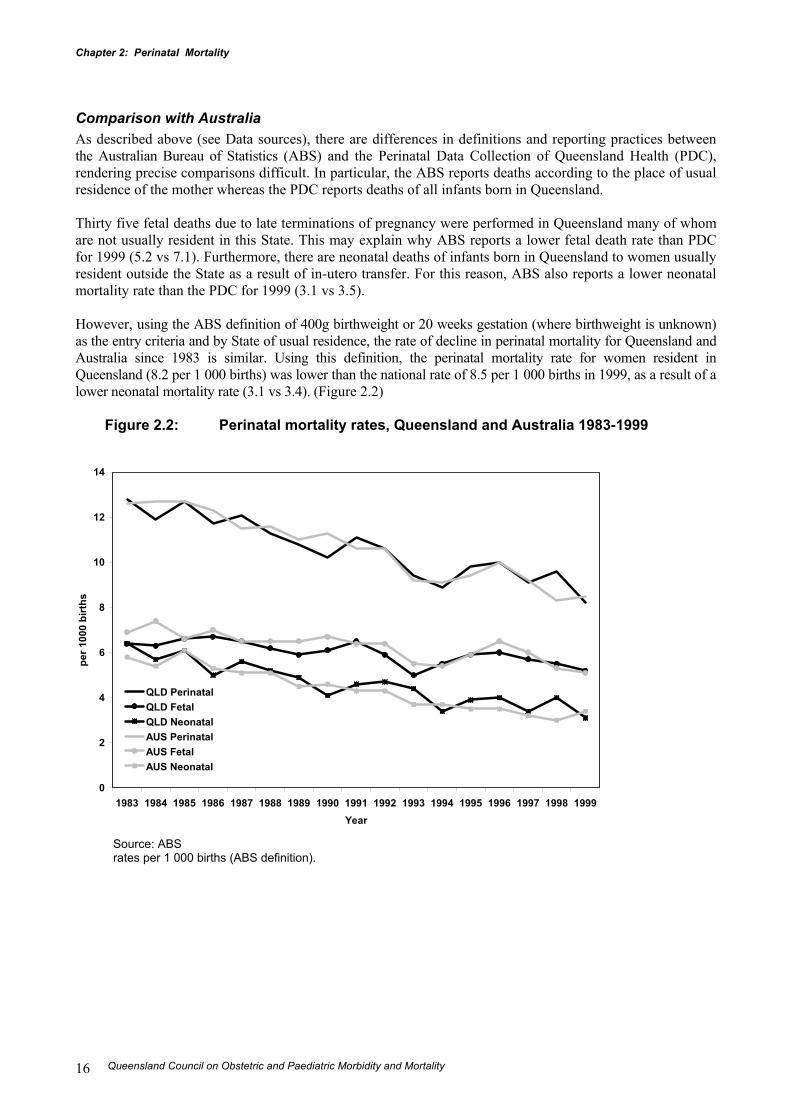
Chapter 2: Perinatal Mortality
Queensland Council on Obstetric and Paediatric Morbidity and Mortality16
Comparison with AustraliaAs described above (see Data sources), there are differences in definitions and reporting practices betweenthe Australian Bureau of Statistics (ABS) and the Perinatal Data Collection of Queensland Health (PDC),rendering precise comparisons difficult. In particular, the ABS reports deaths according to the place of usualresidence of the mother whereas the PDC reports deaths of all infants born in Queensland.
Thirty five fetal deaths due to late terminations of pregnancy were performed in Queensland many of whomare not usually resident in this State. This may explain why ABS reports a lower fetal death rate than PDCfor 1999 (5.2 vs 7.1). Furthermore, there are neonatal deaths of infants born in Queensland to women usuallyresident outside the State as a result of in-utero transfer. For this reason, ABS also reports a lower neonatalmortality rate than the PDC for 1999 (3.1 vs 3.5).
However, using the ABS definition of 400g birthweight or 20 weeks gestation (where birthweight is unknown)as the entry criteria and by State of usual residence, the rate of decline in perinatal mortality for Queensland andAustralia since 1983 is similar. Using this definition, the perinatal mortality rate for women resident inQueensland (8.2 per 1 000 births) was lower than the national rate of 8.5 per 1 000 births in 1999, as a result of alower neonatal mortality rate (3.1 vs 3.4). (Figure 2.2)
Figure 2.2: Perinatal mortality rates, Queensland and Australia 1983-1999
Source: ABSrates per 1 000 births (ABS definition).
0
2
4
6
8
10
12
14
1983 1984 1985 1986 1987 1988 1989 1990 1991 1992 1993 1994 1995 1996 1997 1998 1999Year
per 1
000
birt
hs
QLD PerinatalQLD FetalQLD NeonatalAUS PerinatalAUS FetalAUS Neonatal
Maternal, Perinatal and Paediatric Mortality in Queensland, 1999
Queensland Council on Obstetric and Paediatric Morbidity and Mortality 17
Gestational age and birthweight specific perinatal mortality ratesPerinatal mortality rates by gestational age and birthweight are displayed in Table 2.2 and Table 2.3, as cruderates and rates corrected for major congenital abnormality.
Preterm births (<37 weeks) accounted for 8% of infants and 79% of perinatal deaths. Very preterm births (<28weeks) accounted for 0.9% of infants and 57% of perinatal deaths.
When corrected for major congenital abnormality, the perinatal mortality rate for infants born at term isextremely low (1.6 per 1000). For non-malformed infants born alive at term (37 to 41 completed weeks), lessthan one death per 2000 occurred within 28 days. For non-malformed infants at term, the risk of death beforebirth (fetal death) is four times higher than the risk of death in the 28 days following birth (1.3 compared with0.3 per 1000).
The fetal death rate for infants born at 42 weeks or greater was 4.8 per 1000 births compared to 1.5 per 1000 forthose born at term. The widely disseminated results of the systematic review of randomised trials for post-term pregnancies in 1992 indicated benefit for induction of labour for women at 41 weeks gestation orgreater.9 Although the rate of post-term deliveries has decreased from 3.8% in the triennia 1987-89 to 2.7%over the period 1994-9710, increasing the application of evidence based practice for women in this high riskgroup may further reduce the risk of adverse outcome.
9 Crowley P. Interventions for preventing or improving the outcome of delivery at or beyond term (Cochrane
Review). In: The Cochrane Library, Issue 3, 2001. Oxford: Update Software.10 Perinatal Data Collection, Data Services Unit, Queensland Health.

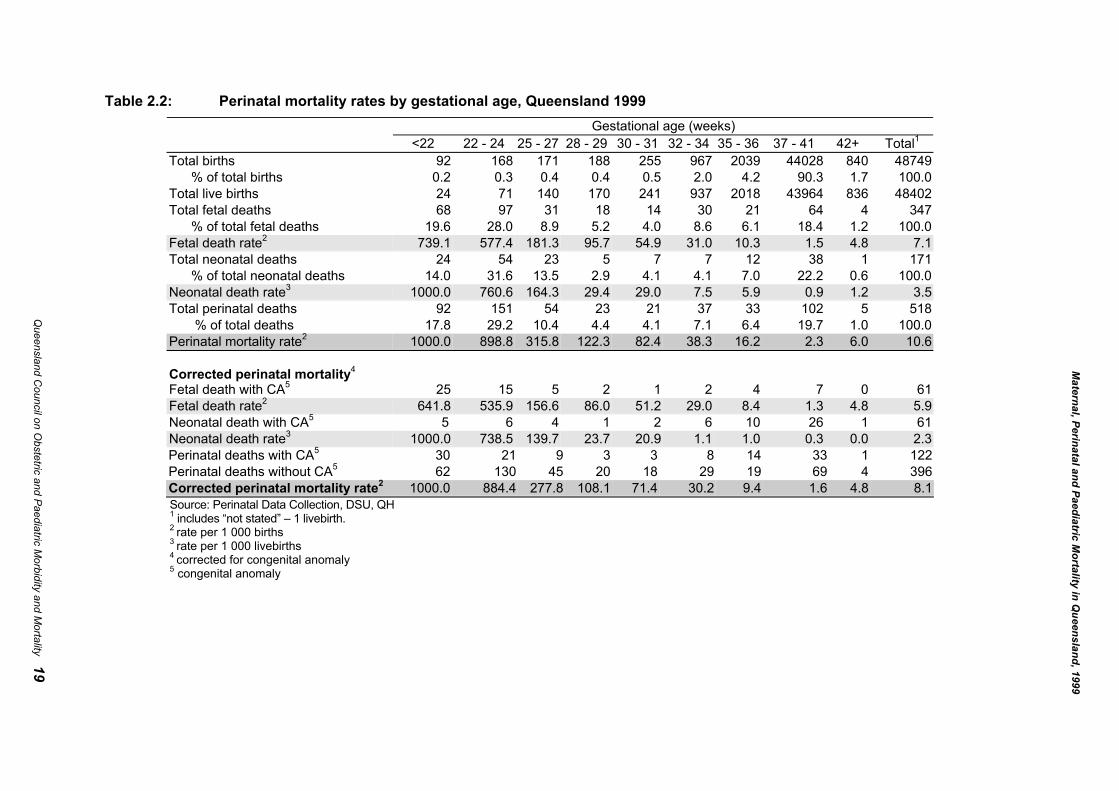
Table 2.2: Perinatal mortality rates by gestational age, Queensland 1999Gestational age (weeks)
<22 22 - 24 25 - 27 28 - 29 30 - 31 32 - 34 35 - 36 37 - 41 42+ Total1
Total births 92 168 171 188 255 967 2039 44028 840 48749 % of total births 0.2 0.3 0.4 0.4 0.5 2.0 4.2 90.3 1.7 100.0Total live births 24 71 140 170 241 937 2018 43964 836 48402Total fetal deaths 68 97 31 18 14 30 21 64 4 347 % of total fetal deaths 19.6 28.0 8.9 5.2 4.0 8.6 6.1 18.4 1.2 100.0Fetal death rate2 739.1 577.4 181.3 95.7 54.9 31.0 10.3 1.5 4.8 7.1Total neonatal deaths 24 54 23 5 7 7 12 38 1 171 % of total neonatal deaths 14.0 31.6 13.5 2.9 4.1 4.1 7.0 22.2 0.6 100.0Neonatal death rate3 1000.0 760.6 164.3 29.4 29.0 7.5 5.9 0.9 1.2 3.5Total perinatal deaths 92 151 54 23 21 37 33 102 5 518 % of total deaths 17.8 29.2 10.4 4.4 4.1 7.1 6.4 19.7 1.0 100.0Perinatal mortality rate2 1000.0 898.8 315.8 122.3 82.4 38.3 16.2 2.3 6.0 10.6
Corrected perinatal mortality4
Fetal death with CA5 25 15 5 2 1 2 4 7 0 61Fetal death rate2 641.8 535.9 156.6 86.0 51.2 29.0 8.4 1.3 4.8 5.9Neonatal death with CA5 5 6 4 1 2 6 10 26 1 61Neonatal death rate3 1000.0 738.5 139.7 23.7 20.9 1.1 1.0 0.3 0.0 2.3Perinatal deaths with CA5 30 21 9 3 3 8 14 33 1 122Perinatal deaths without CA5 62 130 45 20 18 29 19 69 4 396Corrected perinatal mortality rate2 1000.0 884.4 277.8 108.1 71.4 30.2 9.4 1.6 4.8 8.1Source: Perinatal Data Collection, DSU, QH1 includes “not stated” – 1 livebirth.2 rate per 1 000 births3 rate per 1 000 livebirths4 corrected for congenital anomaly5 congenital anomaly
Maternal, Perinatal and Paediatric M
ortality in Queensland, 1999
Queensland C
ouncil on Obstetric and Paediatric M
orbidity and Mortality 19
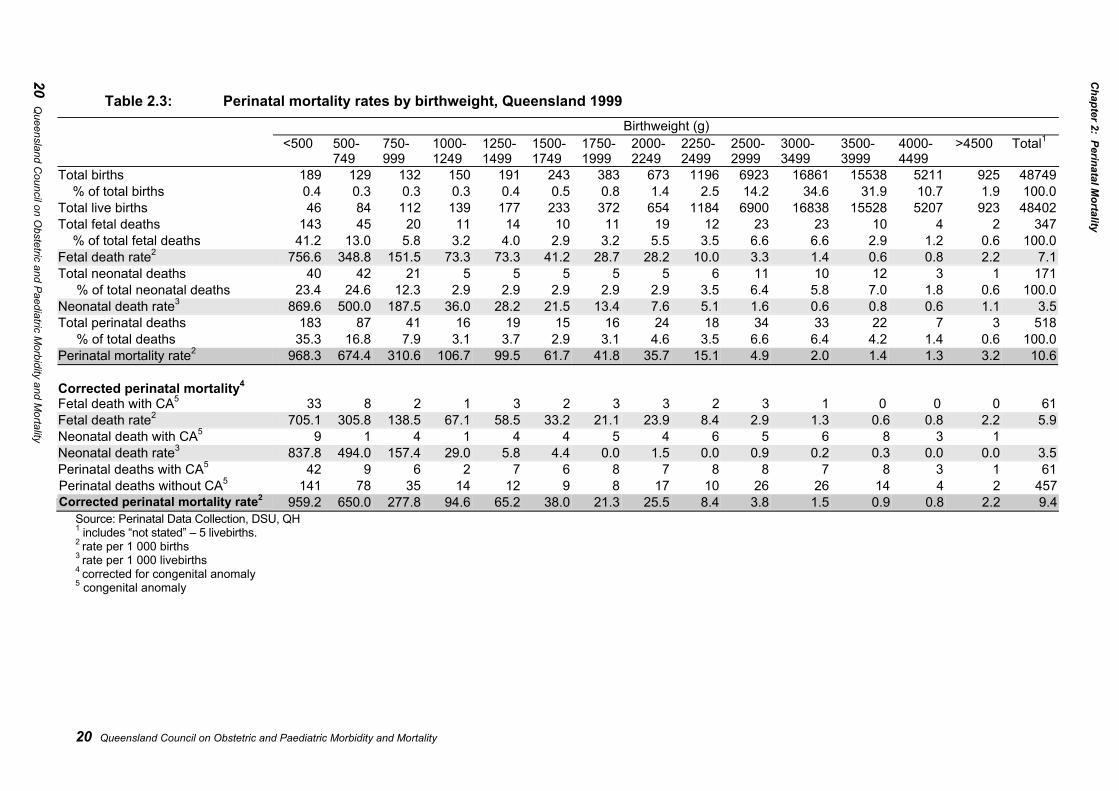
20 Queensland Council on Obstetric and Paediatric Morbidity and Mortality
Table 2.3: Perinatal mortality rates by birthweight, Queensland 1999Birthweight (g)
<500 500-749
750-999
1000-1249
1250-1499
1500-1749
1750-1999
2000-2249
2250-2499
2500-2999
3000-3499
3500-3999
4000-4499
>4500 Total1
Total births 189 129 132 150 191 243 383 673 1196 6923 16861 15538 5211 925 48749 % of total births 0.4 0.3 0.3 0.3 0.4 0.5 0.8 1.4 2.5 14.2 34.6 31.9 10.7 1.9 100.0Total live births 46 84 112 139 177 233 372 654 1184 6900 16838 15528 5207 923 48402Total fetal deaths 143 45 20 11 14 10 11 19 12 23 23 10 4 2 347 % of total fetal deaths 41.2 13.0 5.8 3.2 4.0 2.9 3.2 5.5 3.5 6.6 6.6 2.9 1.2 0.6 100.0Fetal death rate2 756.6 348.8 151.5 73.3 73.3 41.2 28.7 28.2 10.0 3.3 1.4 0.6 0.8 2.2 7.1Total neonatal deaths 40 42 21 5 5 5 5 5 6 11 10 12 3 1 171 % of total neonatal deaths 23.4 24.6 12.3 2.9 2.9 2.9 2.9 2.9 3.5 6.4 5.8 7.0 1.8 0.6 100.0Neonatal death rate3 869.6 500.0 187.5 36.0 28.2 21.5 13.4 7.6 5.1 1.6 0.6 0.8 0.6 1.1 3.5Total perinatal deaths 183 87 41 16 19 15 16 24 18 34 33 22 7 3 518 % of total deaths 35.3 16.8 7.9 3.1 3.7 2.9 3.1 4.6 3.5 6.6 6.4 4.2 1.4 0.6 100.0Perinatal mortality rate2 968.3 674.4 310.6 106.7 99.5 61.7 41.8 35.7 15.1 4.9 2.0 1.4 1.3 3.2 10.6
Corrected perinatal mortality4
Fetal death with CA5 33 8 2 1 3 2 3 3 2 3 1 0 0 0 61Fetal death rate2 705.1 305.8 138.5 67.1 58.5 33.2 21.1 23.9 8.4 2.9 1.3 0.6 0.8 2.2 5.9Neonatal death with CA5 9 1 4 1 4 4 5 4 6 5 6 8 3 1Neonatal death rate3 837.8 494.0 157.4 29.0 5.8 4.4 0.0 1.5 0.0 0.9 0.2 0.3 0.0 0.0 3.5Perinatal deaths with CA5 42 9 6 2 7 6 8 7 8 8 7 8 3 1 61Perinatal deaths without CA5 141 78 35 14 12 9 8 17 10 26 26 14 4 2 457Corrected perinatal mortality rate2 959.2 650.0 277.8 94.6 65.2 38.0 21.3 25.5 8.4 3.8 1.5 0.9 0.8 2.2 9.4
Source: Perinatal Data Collection, DSU, QH1 includes “not stated” – 5 livebirths.2 rate per 1 000 births3 rate per 1 000 livebirths4 corrected for congenital anomaly5 congenital anomaly
20 Queensland C
ouncil on Obstetric and Paediatric M
orbidity and Mortality
Chapter 2: Perinatal M
ortality
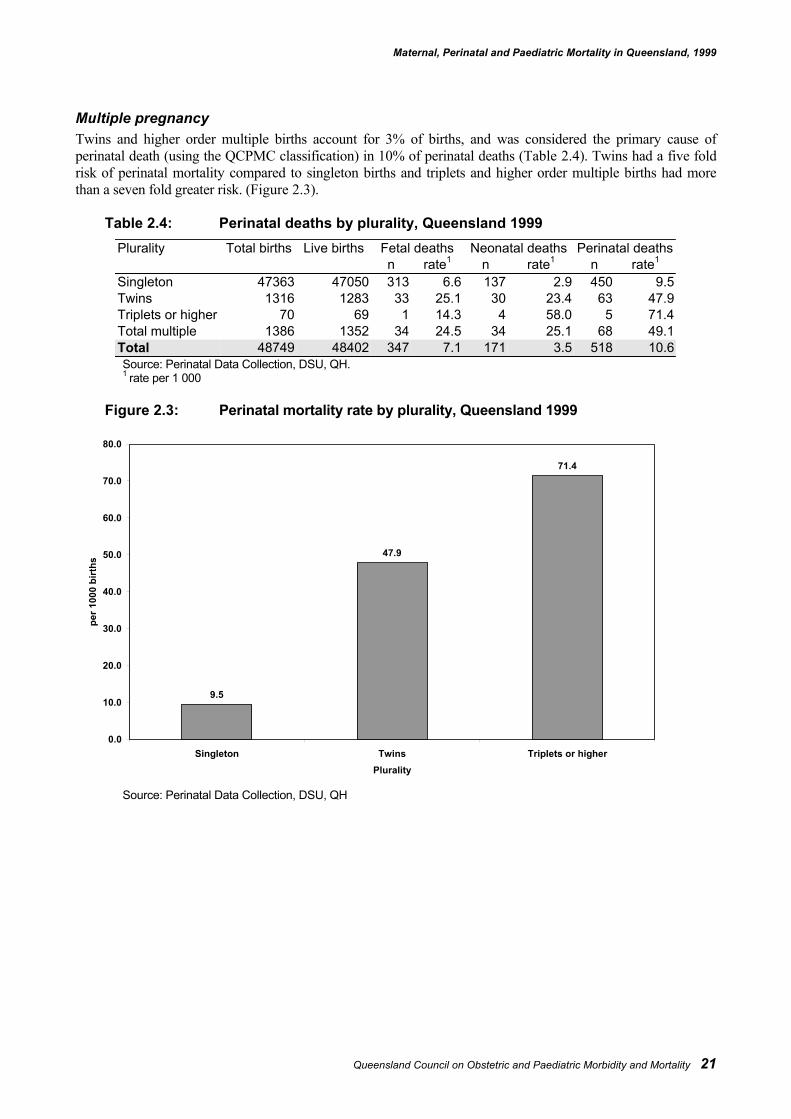
Maternal, Perinatal and Paediatric Mortality in Queensland, 1999
Queensland Council on Obstetric and Paediatric Morbidity and Mortality 21
Multiple pregnancyTwins and higher order multiple births account for 3% of births, and was considered the primary cause ofperinatal death (using the QCPMC classification) in 10% of perinatal deaths (Table 2.4). Twins had a five foldrisk of perinatal mortality compared to singleton births and triplets and higher order multiple births had morethan a seven fold greater risk. (Figure 2.3).
Table 2.4: Perinatal deaths by plurality, Queensland 1999Plurality Total births Live births Fetal deaths Neonatal deaths Perinatal deaths
n rate1 n rate1 n rate1
Singleton 47363 47050 313 6.6 137 2.9 450 9.5Twins 1316 1283 33 25.1 30 23.4 63 47.9Triplets or higher 70 69 1 14.3 4 58.0 5 71.4Total multiple 1386 1352 34 24.5 34 25.1 68 49.1Total 48749 48402 347 7.1 171 3.5 518 10.6Source: Perinatal Data Collection, DSU, QH.1 rate per 1 000
Figure 2.3: Perinatal mortality rate by plurality, Queensland 1999
Source: Perinatal Data Collection, DSU, QH
9.5
47.9
71.4
0.0
10.0
20.0
30.0
40.0
50.0
60.0
70.0
80.0
Singleton Twins Triplets or higherPlurality
per 1
000
birt
hs
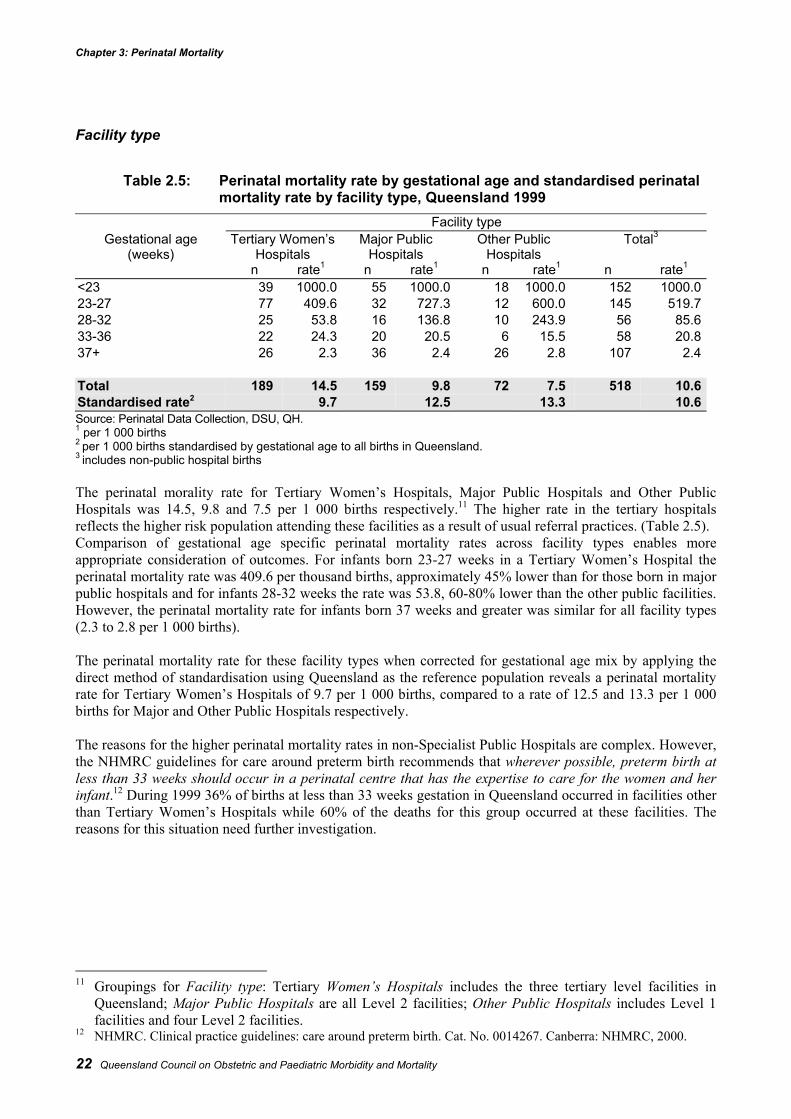
Chapter 3: Perinatal Mortality
22 Queensland Council on Obstetric and Paediatric Morbidity and Mortality
Facility type
Table 2.5: Perinatal mortality rate by gestational age and standardised perinatalmortality rate by facility type, Queensland 1999
Facility typeGestational age
(weeks)Tertiary Women’s
HospitalsMajor Public
HospitalsOther Public
HospitalsTotal3
n rate1 n rate1 n rate1 n rate1
<23 39 1000.0 55 1000.0 18 1000.0 152 1000.023-27 77 409.6 32 727.3 12 600.0 145 519.728-32 25 53.8 16 136.8 10 243.9 56 85.633-36 22 24.3 20 20.5 6 15.5 58 20.837+ 26 2.3 36 2.4 26 2.8 107 2.4
Total 189 14.5 159 9.8 72 7.5 518 10.6Standardised rate2 9.7 12.5 13.3 10.6Source: Perinatal Data Collection, DSU, QH.1 per 1 000 births2 per 1 000 births standardised by gestational age to all births in Queensland.3 includes non-public hospital births
The perinatal morality rate for Tertiary Women’s Hospitals, Major Public Hospitals and Other PublicHospitals was 14.5, 9.8 and 7.5 per 1 000 births respectively.11 The higher rate in the tertiary hospitalsreflects the higher risk population attending these facilities as a result of usual referral practices. (Table 2.5).Comparison of gestational age specific perinatal mortality rates across facility types enables moreappropriate consideration of outcomes. For infants born 23-27 weeks in a Tertiary Women’s Hospital theperinatal mortality rate was 409.6 per thousand births, approximately 45% lower than for those born in majorpublic hospitals and for infants 28-32 weeks the rate was 53.8, 60-80% lower than the other public facilities.However, the perinatal mortality rate for infants born 37 weeks and greater was similar for all facility types(2.3 to 2.8 per 1 000 births).
The perinatal mortality rate for these facility types when corrected for gestational age mix by applying thedirect method of standardisation using Queensland as the reference population reveals a perinatal mortalityrate for Tertiary Women’s Hospitals of 9.7 per 1 000 births, compared to a rate of 12.5 and 13.3 per 1 000births for Major and Other Public Hospitals respectively.
The reasons for the higher perinatal mortality rates in non-Specialist Public Hospitals are complex. However,the NHMRC guidelines for care around preterm birth recommends that wherever possible, preterm birth atless than 33 weeks should occur in a perinatal centre that has the expertise to care for the women and herinfant.12 During 1999 36% of births at less than 33 weeks gestation in Queensland occurred in facilities otherthan Tertiary Women’s Hospitals while 60% of the deaths for this group occurred at these facilities. Thereasons for this situation need further investigation.
11 Groupings for Facility type: Tertiary Women’s Hospitals includes the three tertiary level facilities in
Queensland; Major Public Hospitals are all Level 2 facilities; Other Public Hospitals includes Level 1facilities and four Level 2 facilities.
12 NHMRC. Clinical practice guidelines: care around preterm birth. Cat. No. 0014267. Canberra: NHMRC, 2000.
Maternal, Perinatal and Paediatric Mortality in Queensland, 1999
Queensland Council on Obstetric and Paediatric Morbidity and Mortality 23
Clinical classification (QCPMC)Table 2.6 and Figure 2.5 summarises the main causes of death using the Queensland Council PerinatalMortality Classification (QCPMC). The main causes of death comprising 60% of all perinatal deaths wereCongenital Anomaly, Unexplained Antepartum Death and Unexplained Preterm.
Congenital anomalyCongenital Anomaly (CA) was the leading cause of perinatal mortality with 24% of all deaths (18% of fetaldeaths and 36% of neonatal deaths) being attributed to major anomalies. The rate of death from CA was 2.5 per1 000 total births. This is slightly higher than in 1997 where CA contributed to 19% of perinatal deaths with arate of 2.2 per 1 000 births. These rates are also higher than those reported for Australia where congenitalanomalies accounted for 18% of perinatal deaths in 1996, a rate of 1.6 per 1 000 births.13
The three most common categories of congenital anomalies were those of the central nervous system (20%),cardiovascular system (18%) and chromosomal/recognised syndrome (40%). (Table 2.11).
The Cochrane Systematic Review on periconceptual folate supplementation shows a strong protective effectagainst neural tube defects.14
There is, however, no current accurate mechanism in Queensland for monitoring terminations of pregnancy bygestational age or by indication. This lack of information is a major barrier to monitoring the rate of congenitalmalformations and renders it impossible to gauge the effectiveness or otherwise of public health programs suchas periconceptual folate supplementation, as the true incidence of malformations cannot be determined.
Unexplained antepartum deathThe next most frequent category of perinatal death was Unexplained Antepartum Death. This category includesnormally formed infants where no reason for the death can be ascertained. This category accounted for 18% ofperinatal and 28% of fetal deaths. When reviewing the information on the 96 deaths in this category, thePerinatal Working Group were aware of deficiencies in the information available which, if available, may haveassisted in determining a cause of death. In particular autopsy and placental pathology were not performed in30% of cases.
The overall rate of unexplained fetal death is 2.0 per 1 000 births which is over three times the rate of SuddenInfant Death Syndrome (SIDS). SIDS has been the focus of much attention in the form of public healthcampaigns and research. The rate of unexplained fetal death indicates that it is equally deserving of attention.
Unexplained preterm birthPreterm birth accounted for 8% of births, and 79% of deaths. In 22% of preterm deaths there was no explanationfor the death. Unexplained preterm birth accounted for 18% of all perinatal deaths. Ninety two per cent of deathsin this category occurred in the 0.9% of infants who were born at less than 28 weeks gestation.Any intervention which reduces the rate of preterm birth will result in a reduction in the perinatal death rate.
Prevention of preterm birth continues to be a major focus of research. Despite this, no reduction in the rate ofpreterm birth is evident over the past 10 years. It is essential that all health care providers follow the bestavailable evidence for care of preterm birth following the NHMRC publication care around preterm birth thatsummarises the best available evidence for the management of preterm birth and provides recommendations forpractice.15
13 Hurst T, Hafir E, Day P & Lancaster P. Congenital Malformations Australia 1995 and 1996. AIHW Cat. No. PER
8, 1999. Sydney: Australian Institute of Health and Welfare National Perinatal Statistics Unit (Birth Defects SeriesNo.3).
14 Lumley J, Watson L, Watson M, Bower C. Periconceptional supplementation with folate and/ormultivitamins for preventing neural tube defects (Cochrane Review). In: The Cochrane Library, Issue 3,2001. Oxford: Update Software.
15 NHMRC. Clinical practice guidelines: care around preterm birth. Cat. No. 0014267. Canberra: NHMRC, 2000
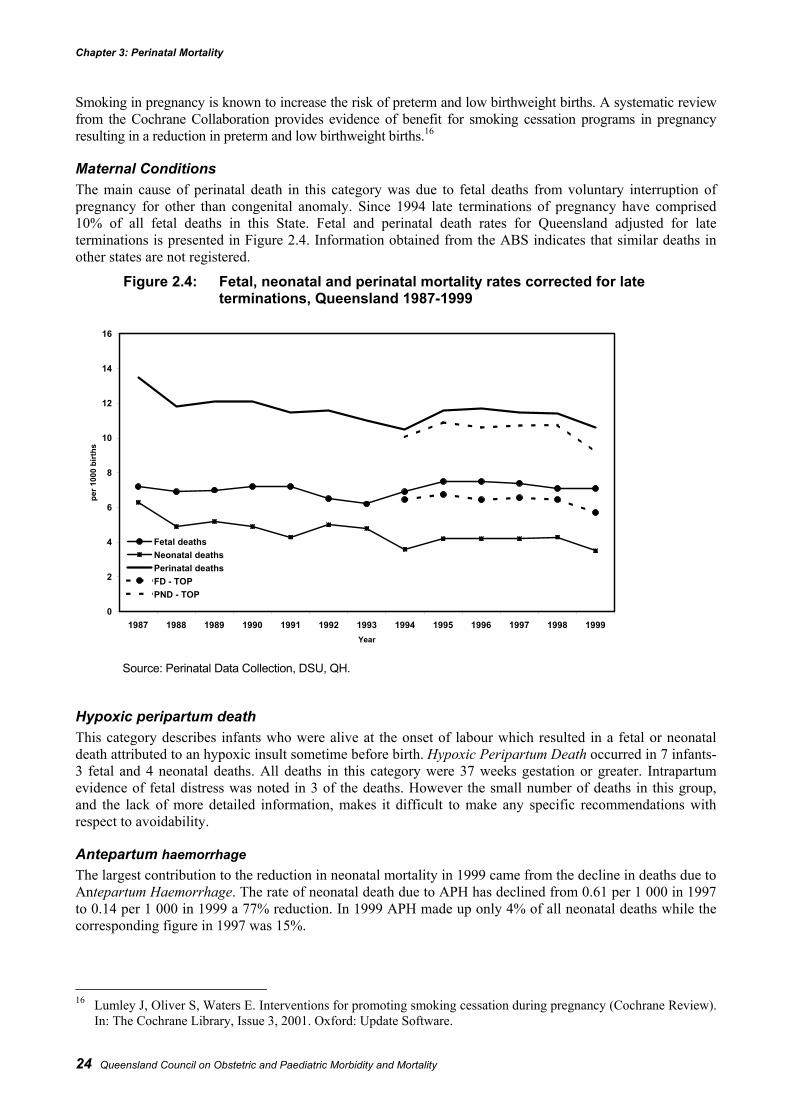
Chapter 3: Perinatal Mortality
24 Queensland Council on Obstetric and Paediatric Morbidity and Mortality
Smoking in pregnancy is known to increase the risk of preterm and low birthweight births. A systematic reviewfrom the Cochrane Collaboration provides evidence of benefit for smoking cessation programs in pregnancyresulting in a reduction in preterm and low birthweight births.16
Maternal ConditionsThe main cause of perinatal death in this category was due to fetal deaths from voluntary interruption ofpregnancy for other than congenital anomaly. Since 1994 late terminations of pregnancy have comprised10% of all fetal deaths in this State. Fetal and perinatal death rates for Queensland adjusted for lateterminations is presented in Figure 2.4. Information obtained from the ABS indicates that similar deaths inother states are not registered.
Figure 2.4: Fetal, neonatal and perinatal mortality rates corrected for lateterminations, Queensland 1987-1999
Source: Perinatal Data Collection, DSU, QH.
Hypoxic peripartum deathThis category describes infants who were alive at the onset of labour which resulted in a fetal or neonataldeath attributed to an hypoxic insult sometime before birth. Hypoxic Peripartum Death occurred in 7 infants-3 fetal and 4 neonatal deaths. All deaths in this category were 37 weeks gestation or greater. Intrapartumevidence of fetal distress was noted in 3 of the deaths. However the small number of deaths in this group,and the lack of more detailed information, makes it difficult to make any specific recommendations withrespect to avoidability.
Antepartum haemorrhageThe largest contribution to the reduction in neonatal mortality in 1999 came from the decline in deaths due toAntepartum Haemorrhage. The rate of neonatal death due to APH has declined from 0.61 per 1 000 in 1997to 0.14 per 1 000 in 1999 a 77% reduction. In 1999 APH made up only 4% of all neonatal deaths while thecorresponding figure in 1997 was 15%.
16 Lumley J, Oliver S, Waters E. Interventions for promoting smoking cessation during pregnancy (Cochrane Review).
In: The Cochrane Library, Issue 3, 2001. Oxford: Update Software.
0
2
4
6
8
10
12
14
16
1987 1988 1989 1990 1991 1992 1993 1994 1995 1996 1997 1998 1999Year
per 1
000
birt
hs
Fetal deathsNeonatal deathsPerinatal deathsFD - TOPPND - TOP
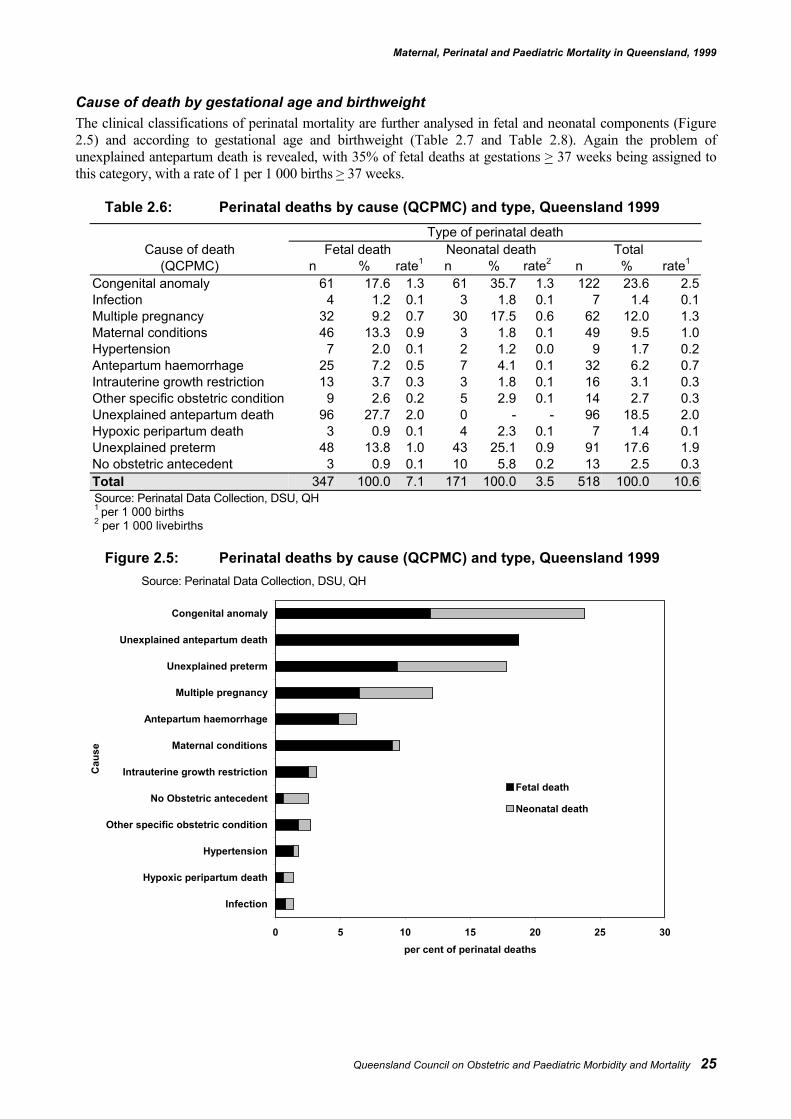
Maternal, Perinatal and Paediatric Mortality in Queensland, 1999
Queensland Council on Obstetric and Paediatric Morbidity and Mortality 25
Cause of death by gestational age and birthweightThe clinical classifications of perinatal mortality are further analysed in fetal and neonatal components (Figure2.5) and according to gestational age and birthweight (Table 2.7 and Table 2.8). Again the problem ofunexplained antepartum death is revealed, with 35% of fetal deaths at gestations > 37 weeks being assigned tothis category, with a rate of 1 per 1 000 births > 37 weeks.
Table 2.6: Perinatal deaths by cause (QCPMC) and type, Queensland 1999Type of perinatal death
Cause of death Fetal death Neonatal death Total(QCPMC) n % rate1 n % rate2 n % rate1
Congenital anomaly 61 17.6 1.3 61 35.7 1.3 122 23.6 2.5Infection 4 1.2 0.1 3 1.8 0.1 7 1.4 0.1Multiple pregnancy 32 9.2 0.7 30 17.5 0.6 62 12.0 1.3Maternal conditions 46 13.3 0.9 3 1.8 0.1 49 9.5 1.0Hypertension 7 2.0 0.1 2 1.2 0.0 9 1.7 0.2Antepartum haemorrhage 25 7.2 0.5 7 4.1 0.1 32 6.2 0.7Intrauterine growth restriction 13 3.7 0.3 3 1.8 0.1 16 3.1 0.3Other specific obstetric condition 9 2.6 0.2 5 2.9 0.1 14 2.7 0.3Unexplained antepartum death 96 27.7 2.0 0 - - 96 18.5 2.0Hypoxic peripartum death 3 0.9 0.1 4 2.3 0.1 7 1.4 0.1Unexplained preterm 48 13.8 1.0 43 25.1 0.9 91 17.6 1.9No obstetric antecedent 3 0.9 0.1 10 5.8 0.2 13 2.5 0.3Total 347 100.0 7.1 171 100.0 3.5 518 100.0 10.6Source: Perinatal Data Collection, DSU, QH1 per 1 000 births2 per 1 000 livebirths
Figure 2.5: Perinatal deaths by cause (QCPMC) and type, Queensland 1999Source: Perinatal Data Collection, DSU, QH
0 5 10 15 20 25 30
Infection
Hypoxic peripartum death
Hypertension
Other specific obstetric condition
No Obstetric antecedent
Intrauterine growth restriction
Maternal conditions
Antepartum haemorrhage
Multiple pregnancy
Unexplained preterm
Unexplained antepartum death
Congenital anomaly
Cau
se
per cent of perinatal deaths
Fetal death
Neonatal death
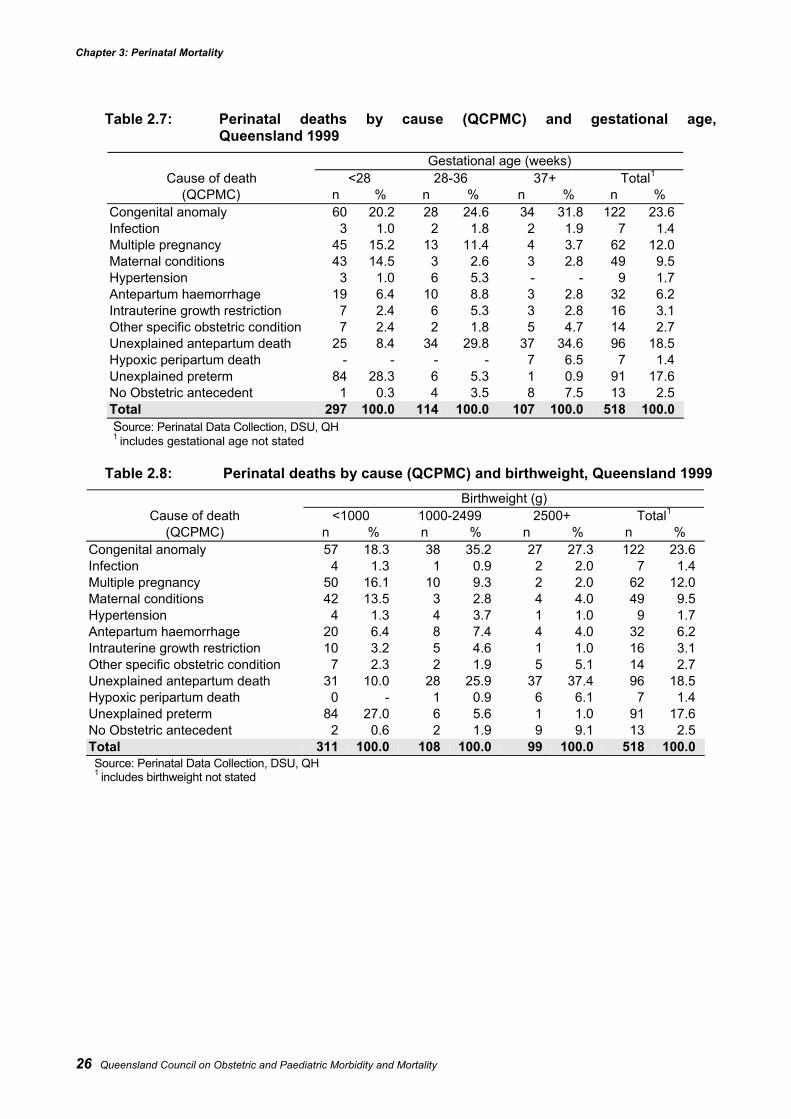
Chapter 3: Perinatal Mortality
26 Queensland Council on Obstetric and Paediatric Morbidity and Mortality
Table 2.7: Perinatal deaths by cause (QCPMC) and gestational age,Queensland 1999
Gestational age (weeks)Cause of death <28 28-36 37+ Total1
(QCPMC) n % n % n % n %Congenital anomaly 60 20.2 28 24.6 34 31.8 122 23.6Infection 3 1.0 2 1.8 2 1.9 7 1.4Multiple pregnancy 45 15.2 13 11.4 4 3.7 62 12.0Maternal conditions 43 14.5 3 2.6 3 2.8 49 9.5Hypertension 3 1.0 6 5.3 - - 9 1.7Antepartum haemorrhage 19 6.4 10 8.8 3 2.8 32 6.2Intrauterine growth restriction 7 2.4 6 5.3 3 2.8 16 3.1Other specific obstetric condition 7 2.4 2 1.8 5 4.7 14 2.7Unexplained antepartum death 25 8.4 34 29.8 37 34.6 96 18.5Hypoxic peripartum death - - - - 7 6.5 7 1.4Unexplained preterm 84 28.3 6 5.3 1 0.9 91 17.6No Obstetric antecedent 1 0.3 4 3.5 8 7.5 13 2.5Total 297 100.0 114 100.0 107 100.0 518 100.0Source: Perinatal Data Collection, DSU, QH1 includes gestational age not stated
Table 2.8: Perinatal deaths by cause (QCPMC) and birthweight, Queensland 1999Birthweight (g)
Cause of death <1000 1000-2499 2500+ Total1
(QCPMC) n % n % n % n %Congenital anomaly 57 18.3 38 35.2 27 27.3 122 23.6Infection 4 1.3 1 0.9 2 2.0 7 1.4Multiple pregnancy 50 16.1 10 9.3 2 2.0 62 12.0Maternal conditions 42 13.5 3 2.8 4 4.0 49 9.5Hypertension 4 1.3 4 3.7 1 1.0 9 1.7Antepartum haemorrhage 20 6.4 8 7.4 4 4.0 32 6.2Intrauterine growth restriction 10 3.2 5 4.6 1 1.0 16 3.1Other specific obstetric condition 7 2.3 2 1.9 5 5.1 14 2.7Unexplained antepartum death 31 10.0 28 25.9 37 37.4 96 18.5Hypoxic peripartum death 0 - 1 0.9 6 6.1 7 1.4Unexplained preterm 84 27.0 6 5.6 1 1.0 91 17.6No Obstetric antecedent 2 0.6 2 1.9 9 9.1 13 2.5Total 311 100.0 108 100.0 99 100.0 518 100.0Source: Perinatal Data Collection, DSU, QH1 includes birthweight not stated
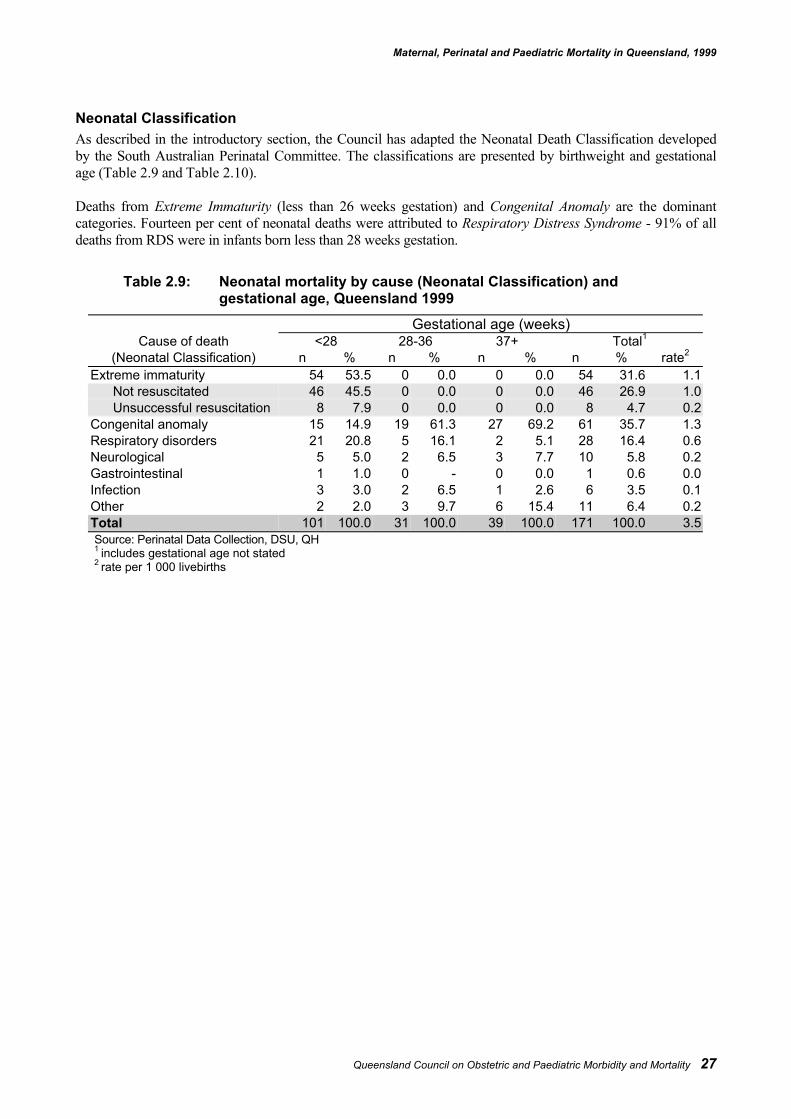
Maternal, Perinatal and Paediatric Mortality in Queensland, 1999
Queensland Council on Obstetric and Paediatric Morbidity and Mortality 27
Neonatal ClassificationAs described in the introductory section, the Council has adapted the Neonatal Death Classification developedby the South Australian Perinatal Committee. The classifications are presented by birthweight and gestationalage (Table 2.9 and Table 2.10).
Deaths from Extreme Immaturity (less than 26 weeks gestation) and Congenital Anomaly are the dominantcategories. Fourteen per cent of neonatal deaths were attributed to Respiratory Distress Syndrome - 91% of alldeaths from RDS were in infants born less than 28 weeks gestation.
Table 2.9: Neonatal mortality by cause (Neonatal Classification) andgestational age, Queensland 1999
Gestational age (weeks)Cause of death <28 28-36 37+ Total1
(Neonatal Classification) n % n % n % n % rate2
Extreme immaturity 54 53.5 0 0.0 0 0.0 54 31.6 1.1Not resuscitated 46 45.5 0 0.0 0 0.0 46 26.9 1.0Unsuccessful resuscitation 8 7.9 0 0.0 0 0.0 8 4.7 0.2
Congenital anomaly 15 14.9 19 61.3 27 69.2 61 35.7 1.3Respiratory disorders 21 20.8 5 16.1 2 5.1 28 16.4 0.6Neurological 5 5.0 2 6.5 3 7.7 10 5.8 0.2Gastrointestinal 1 1.0 0 - 0 0.0 1 0.6 0.0Infection 3 3.0 2 6.5 1 2.6 6 3.5 0.1Other 2 2.0 3 9.7 6 15.4 11 6.4 0.2Total 101 100.0 31 100.0 39 100.0 171 100.0 3.5Source: Perinatal Data Collection, DSU, QH1 includes gestational age not stated2 rate per 1 000 livebirths
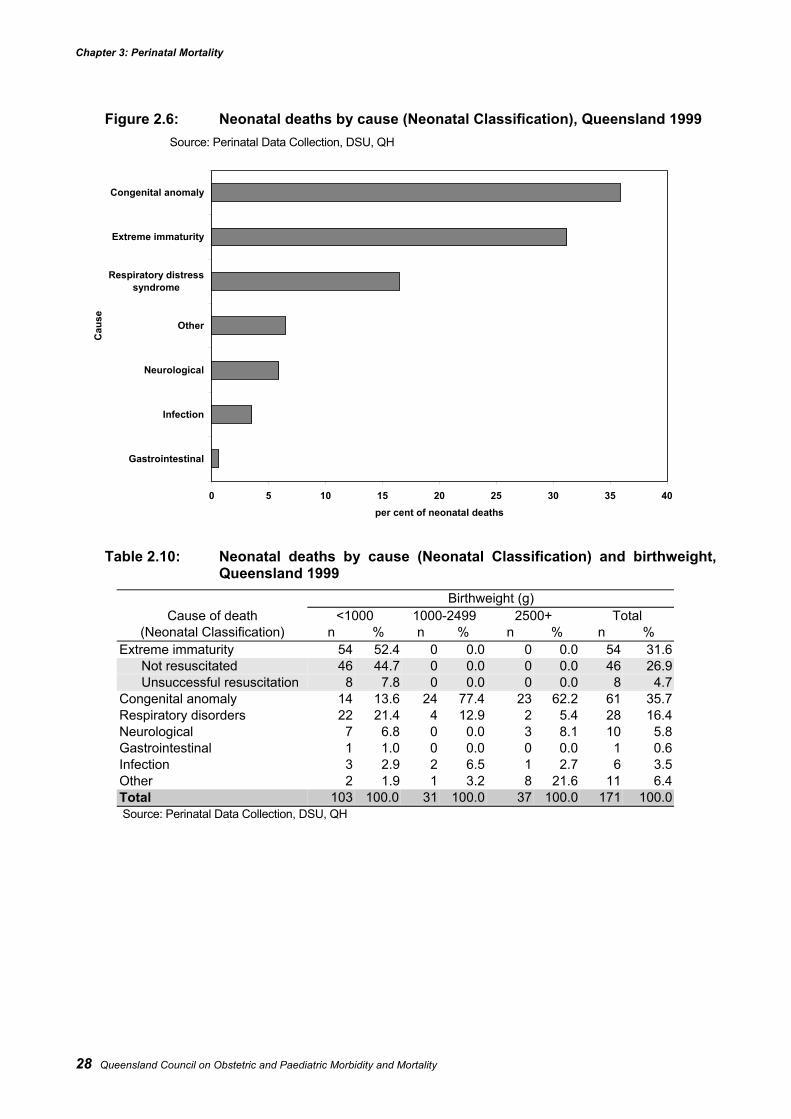
Chapter 3: Perinatal Mortality
28 Queensland Council on Obstetric and Paediatric Morbidity and Mortality
Figure 2.6: Neonatal deaths by cause (Neonatal Classification), Queensland 1999Source: Perinatal Data Collection, DSU, QH
Table 2.10: Neonatal deaths by cause (Neonatal Classification) and birthweight,Queensland 1999
Birthweight (g)Cause of death <1000 1000-2499 2500+ Total
(Neonatal Classification) n % n % n % n %Extreme immaturity 54 52.4 0 0.0 0 0.0 54 31.6
Not resuscitated 46 44.7 0 0.0 0 0.0 46 26.9Unsuccessful resuscitation 8 7.8 0 0.0 0 0.0 8 4.7
Congenital anomaly 14 13.6 24 77.4 23 62.2 61 35.7Respiratory disorders 22 21.4 4 12.9 2 5.4 28 16.4Neurological 7 6.8 0 0.0 3 8.1 10 5.8Gastrointestinal 1 1.0 0 0.0 0 0.0 1 0.6Infection 3 2.9 2 6.5 1 2.7 6 3.5Other 2 1.9 1 3.2 8 21.6 11 6.4Total 103 100.0 31 100.0 37 100.0 171 100.0Source: Perinatal Data Collection, DSU, QH
0 5 10 15 20 25 30 35 40
Gastrointestinal
Infection
Neurological
Other
Respiratory distresssyndrome
Extreme immaturity
Congenital anomaly
Cau
se
per cent of neonatal deaths
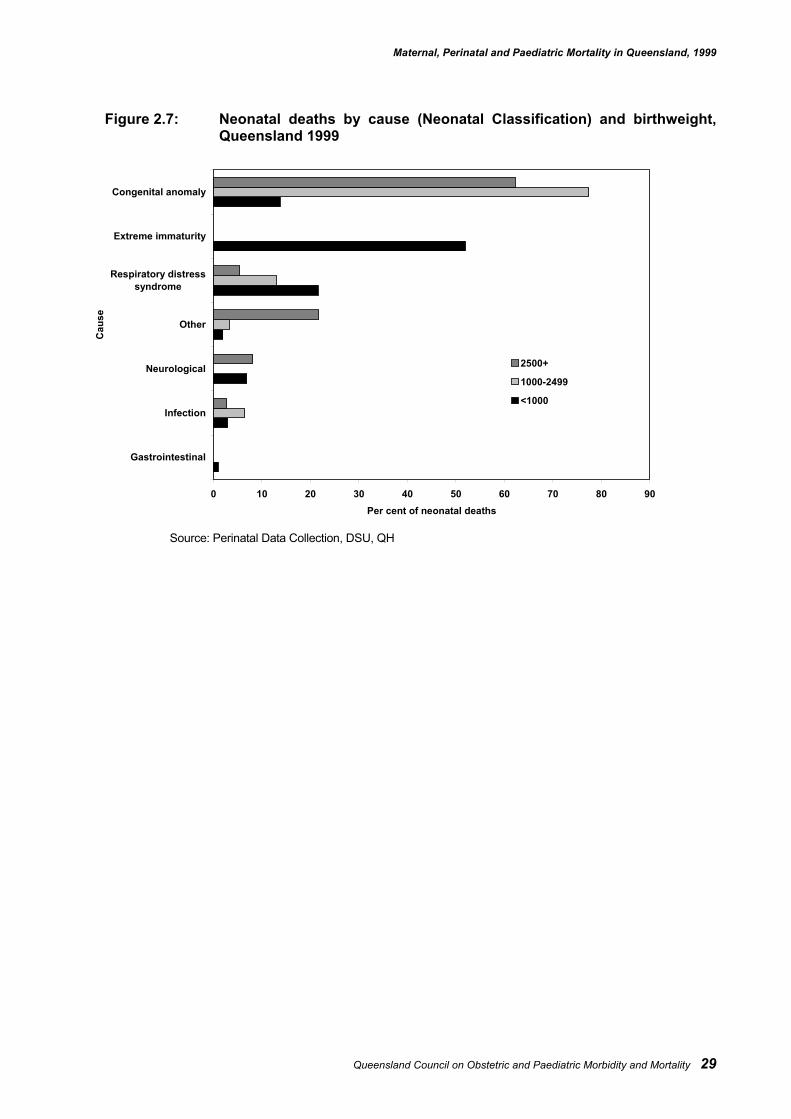
Maternal, Perinatal and Paediatric Mortality in Queensland, 1999
Queensland Council on Obstetric and Paediatric Morbidity and Mortality 29
Figure 2.7: Neonatal deaths by cause (Neonatal Classification) and birthweight,Queensland 1999
Source: Perinatal Data Collection, DSU, QH
0 10 20 30 40 50 60 70 80 90
Gastrointestinal
Infection
Neurological
Other
Respiratory distresssyndrome
Extreme immaturity
Congenital anomaly
Cau
se
Per cent of neonatal deaths
2500+
1000-2499
<1000
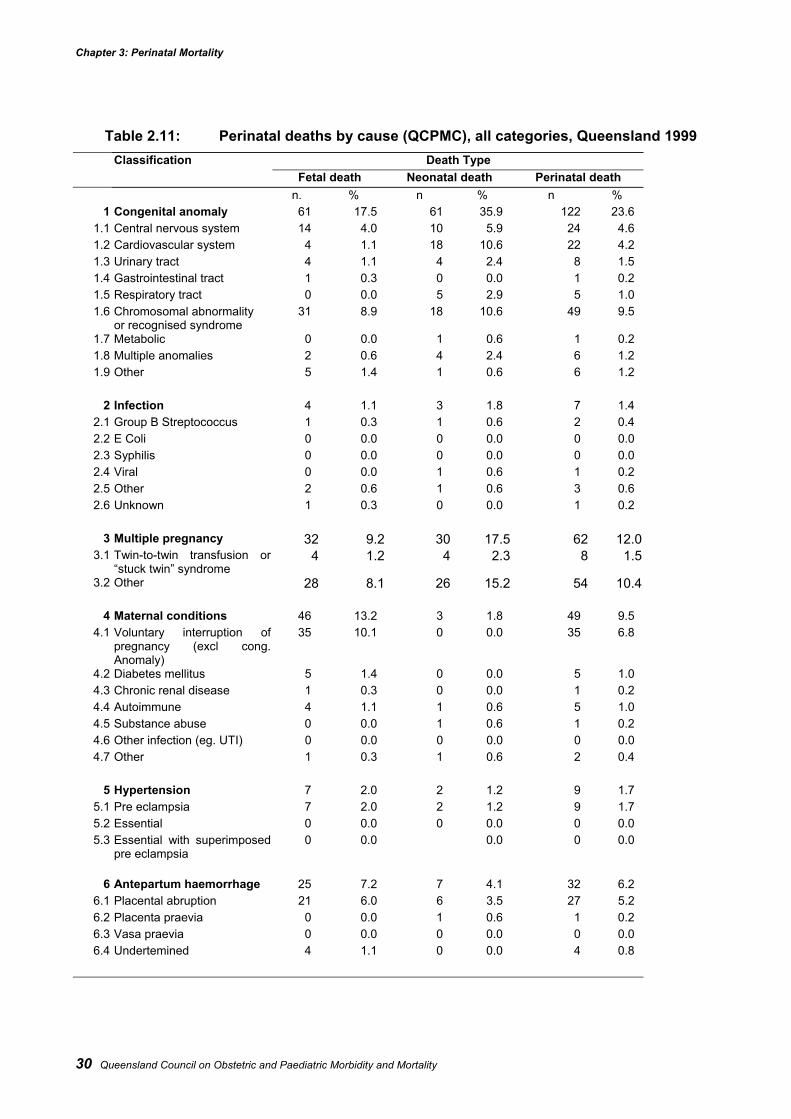
Chapter 3: Perinatal Mortality
30 Queensland Council on Obstetric and Paediatric Morbidity and Mortality
Table 2.11: Perinatal deaths by cause (QCPMC), all categories, Queensland 1999Classification Death Type
Fetal death Neonatal death Perinatal deathn. % n % n %
1 Congenital anomaly 61 17.5 61 35.9 122 23.61.1 Central nervous system 14 4.0 10 5.9 24 4.61.2 Cardiovascular system 4 1.1 18 10.6 22 4.21.3 Urinary tract 4 1.1 4 2.4 8 1.51.4 Gastrointestinal tract 1 0.3 0 0.0 1 0.21.5 Respiratory tract 0 0.0 5 2.9 5 1.01.6 Chromosomal abnormality
or recognised syndrome31 8.9 18 10.6 49 9.5
1.7 Metabolic 0 0.0 1 0.6 1 0.21.8 Multiple anomalies 2 0.6 4 2.4 6 1.21.9 Other 5 1.4 1 0.6 6 1.2
2 Infection 4 1.1 3 1.8 7 1.42.1 Group B Streptococcus 1 0.3 1 0.6 2 0.42.2 E Coli 0 0.0 0 0.0 0 0.02.3 Syphilis 0 0.0 0 0.0 0 0.02.4 Viral 0 0.0 1 0.6 1 0.22.5 Other 2 0.6 1 0.6 3 0.62.6 Unknown 1 0.3 0 0.0 1 0.2
3 Multiple pregnancy 32 9.2 30 17.5 62 12.03.1 Twin-to-twin transfusion or
“stuck twin” syndrome4 1.2 4 2.3 8 1.5
3.2 Other 28 8.1 26 15.2 54 10.4
4 Maternal conditions 46 13.2 3 1.8 49 9.54.1 Voluntary interruption of
pregnancy (excl cong.Anomaly)
35 10.1 0 0.0 35 6.8
4.2 Diabetes mellitus 5 1.4 0 0.0 5 1.04.3 Chronic renal disease 1 0.3 0 0.0 1 0.24.4 Autoimmune 4 1.1 1 0.6 5 1.04.5 Substance abuse 0 0.0 1 0.6 1 0.24.6 Other infection (eg. UTI) 0 0.0 0 0.0 0 0.04.7 Other 1 0.3 1 0.6 2 0.4
5 Hypertension 7 2.0 2 1.2 9 1.75.1 Pre eclampsia 7 2.0 2 1.2 9 1.75.2 Essential 0 0.0 0 0.0 0 0.05.3 Essential with superimposed
pre eclampsia0 0.0 0.0 0 0.0
6 Antepartum haemorrhage 25 7.2 7 4.1 32 6.26.1 Placental abruption 21 6.0 6 3.5 27 5.26.2 Placenta praevia 0 0.0 1 0.6 1 0.26.3 Vasa praevia 0 0.0 0 0.0 0 0.06.4 Undertemined 4 1.1 0 0.0 4 0.8
Maternal, Perinatal and Paediatric Mortality in Queensland, 1999
Queensland Council on Obstetric and Paediatric Morbidity and Mortality 31
Table 2.11: Perinatal deaths by cause (QCPMC), all categories, Queensland 1999(Continued)
Classification Death TypeFetal death Neonatal death Perinatal death
n. % n % n %7 Intrauterine growth
restriction13 3.7 3 1.8 16 3.1
7.1 Placental pathology 10 2.9 2 1.2 12 2.37.2 No explanation 3 0.9 1 0.6 4 0.8
8 Other specific obstetricconditions
9 2.6 5 2.9 14 2.7
8.1 Idiopathic hydrops 1 0.3 1 0.6 2 0.48.2 Fetomaternal haemorrhage 0 0.0 0 0.0 0 0.08.3 Cord complications 5 1.4 0 0.0 5 1.08.4 Uterine
abnormalities/cervicalincompetence etc
0 0.0 3 1.8 3 0.6
8.5 Haemolytic disease 0 0.0 0 0.0 0 0.08.6 Birth trauma 0 0.0 0 0.0 0 0.08.7 Other (includes uterine
rupture)3 0.9 1 0.6 4 0.8
9 Unexplained antepartumdeath
96 27.6 0 0.0 96 18.5
10 Hypoxic peripartum death 3 0.9 4 2.4 7 1.410.1 Intrapartum complications +/-
“Fetal distress”1 0.3 2 1.2 3 0.6
10.2 No apparent cause 2 0.6 2 1.2 4 0.8
11 Unexplained preterm 48 13.8 43 25.3 91 17.611.1 Previous bleeding 16 4.6 10 5.9 26 5.011.2 No previous bleeding 32 9.2 33 19.4 65 12.5
12 No obstetric antecedent 3 0.9 10 5.9 13 2.512.1 SIDS 0 0.0 4 2.4 4 0.812.2 Postnatally acquired infection
in term infants0 0.0 0 0.0 0 0.0
12.3 Other (eg.MVA)
3 0.9 6 3.5 9 1.7
Total 347 100.0 171 100.0 518 100.0Source: Perinatal Data Collection, DSU, QH
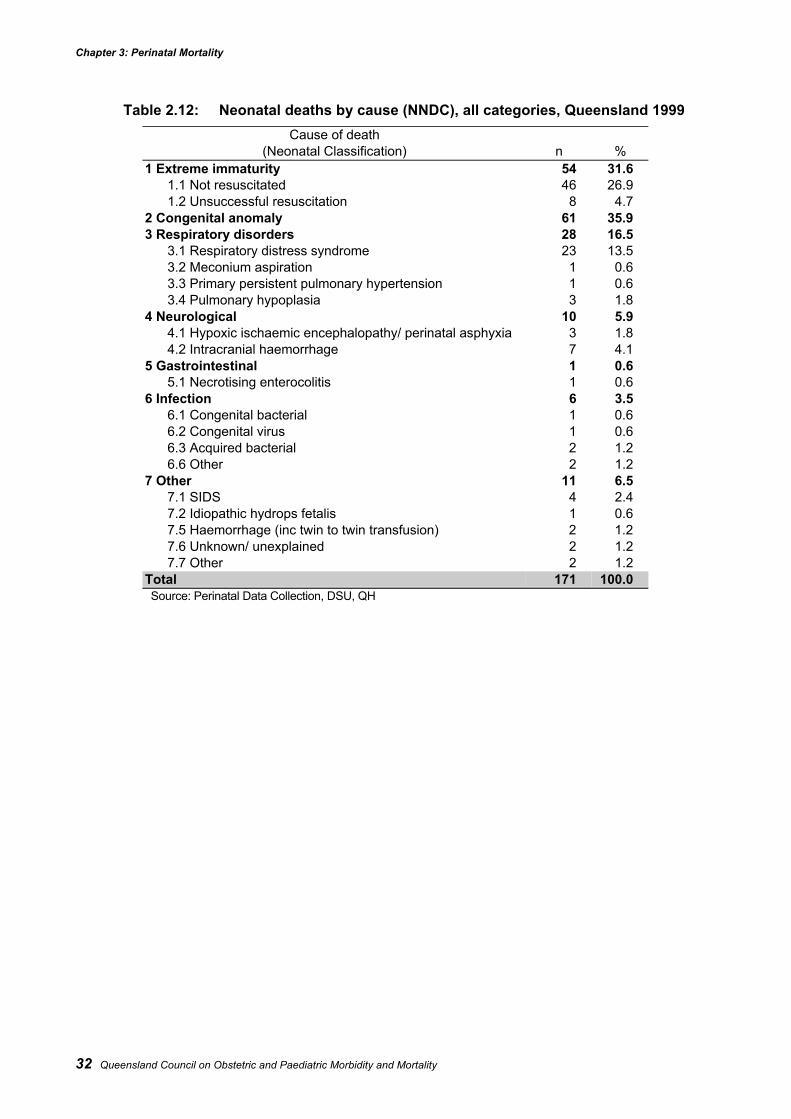
Chapter 3: Perinatal Mortality
32 Queensland Council on Obstetric and Paediatric Morbidity and Mortality
Table 2.12: Neonatal deaths by cause (NNDC), all categories, Queensland 1999Cause of death
(Neonatal Classification) n %1 Extreme immaturity 54 31.6
1.1 Not resuscitated 46 26.91.2 Unsuccessful resuscitation 8 4.7
2 Congenital anomaly 61 35.93 Respiratory disorders 28 16.5
3.1 Respiratory distress syndrome 23 13.53.2 Meconium aspiration 1 0.63.3 Primary persistent pulmonary hypertension 1 0.63.4 Pulmonary hypoplasia 3 1.8
4 Neurological 10 5.94.1 Hypoxic ischaemic encephalopathy/ perinatal asphyxia 3 1.84.2 Intracranial haemorrhage 7 4.1
5 Gastrointestinal 1 0.65.1 Necrotising enterocolitis 1 0.6
6 Infection 6 3.56.1 Congenital bacterial 1 0.66.2 Congenital virus 1 0.66.3 Acquired bacterial 2 1.26.6 Other 2 1.2
7 Other 11 6.57.1 SIDS 4 2.47.2 Idiopathic hydrops fetalis 1 0.67.5 Haemorrhage (inc twin to twin transfusion) 2 1.27.6 Unknown/ unexplained 2 1.27.7 Other 2 1.2
Total 171 100.0Source: Perinatal Data Collection, DSU, QH
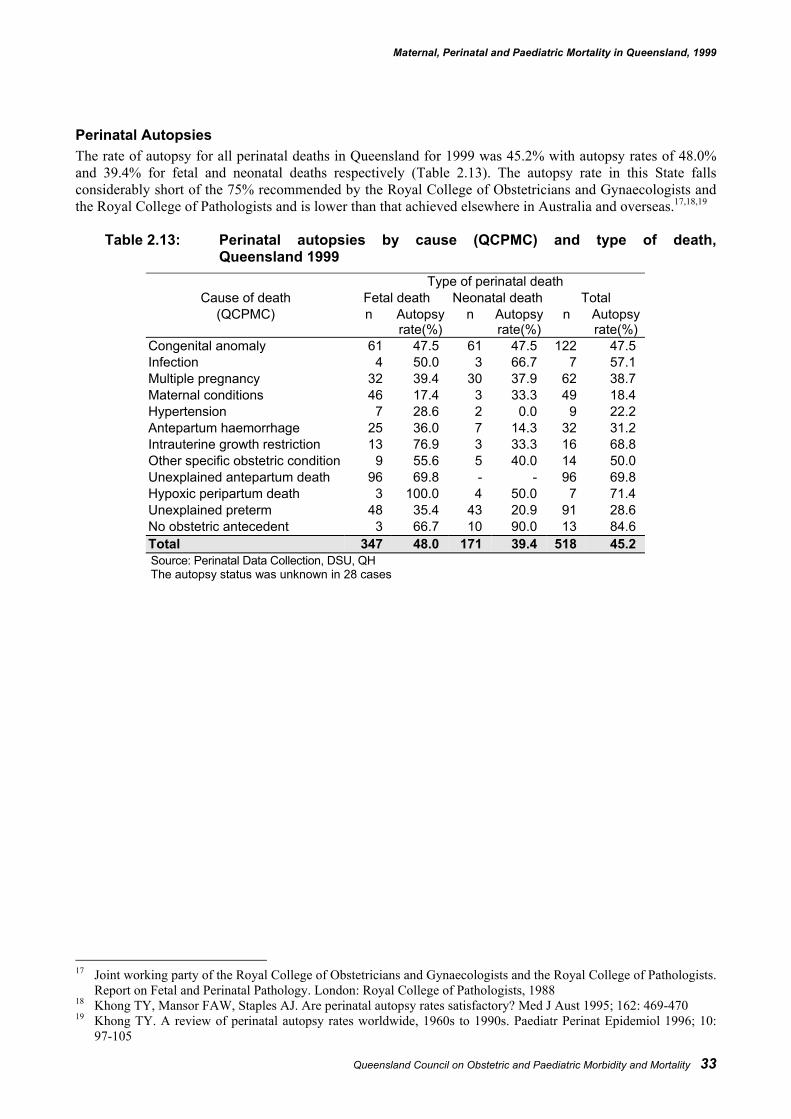
Maternal, Perinatal and Paediatric Mortality in Queensland, 1999
Queensland Council on Obstetric and Paediatric Morbidity and Mortality 33
Perinatal AutopsiesThe rate of autopsy for all perinatal deaths in Queensland for 1999 was 45.2% with autopsy rates of 48.0%and 39.4% for fetal and neonatal deaths respectively (Table 2.13). The autopsy rate in this State fallsconsiderably short of the 75% recommended by the Royal College of Obstetricians and Gynaecologists andthe Royal College of Pathologists and is lower than that achieved elsewhere in Australia and overseas.17,18,19
Table 2.13: Perinatal autopsies by cause (QCPMC) and type of death,Queensland 1999
Type of perinatal deathCause of death Fetal death Neonatal death Total
(QCPMC) n Autopsyrate(%)
n Autopsyrate(%)
n Autopsyrate(%)
Congenital anomaly 61 47.5 61 47.5 122 47.5Infection 4 50.0 3 66.7 7 57.1Multiple pregnancy 32 39.4 30 37.9 62 38.7Maternal conditions 46 17.4 3 33.3 49 18.4Hypertension 7 28.6 2 0.0 9 22.2Antepartum haemorrhage 25 36.0 7 14.3 32 31.2Intrauterine growth restriction 13 76.9 3 33.3 16 68.8Other specific obstetric condition 9 55.6 5 40.0 14 50.0Unexplained antepartum death 96 69.8 - - 96 69.8Hypoxic peripartum death 3 100.0 4 50.0 7 71.4Unexplained preterm 48 35.4 43 20.9 91 28.6No obstetric antecedent 3 66.7 10 90.0 13 84.6Total 347 48.0 171 39.4 518 45.2Source: Perinatal Data Collection, DSU, QHThe autopsy status was unknown in 28 cases
17 Joint working party of the Royal College of Obstetricians and Gynaecologists and the Royal College of Pathologists.
Report on Fetal and Perinatal Pathology. London: Royal College of Pathologists, 198818 Khong TY, Mansor FAW, Staples AJ. Are perinatal autopsy rates satisfactory? Med J Aust 1995; 162: 469-47019 Khong TY. A review of perinatal autopsy rates worldwide, 1960s to 1990s. Paediatr Perinat Epidemiol 1996; 10:
97-105
Chapter 3: Paediatric Mortality
34 Queensland Council on Obstetric and Paediatric Morbidity and Mortality
Chapter 3: Paediatric Mortality
Executive summary• There were 252 post-neonatal deaths (28 days to 14 years), accounting for 60% of all deaths, resulting in
a paediatric mortality rate of 34.5 per 100 000 persons for 1999.
• In 1999 Queensland had a similar infant mortality rate compared with the rest of Australia. Previously,Queensland’s infant mortality rate has been consistently higher than the rest of Australia.
• In the post-neonatal paediatric population, the mortality rate was highest in the first year of life at 269.2per 100 000 persons. This has fallen by 16% since 1997.
• Injuries were the most frequent major cause of death, accounting for 92 of the 252 post-neonatal deaths(37%). The overall rate of death for injury was 12.4 per 100 000 persons.
• Among post-neonatal infants, the most frequent cause of death was from conditions determined at birthwith a mortality rate of 101.3 per 100 000 persons.
• There were 31 deaths determined to be due to SIDS. Seventeen (58%) of these deaths occurred in maleinfants.
• The rate of SIDS in Queensland for 1999 was similar to the rest of Australia (0.64 compared with 0.66per 1 000 live births).
• In those under 5 years, injury accounted for 67% of all injury deaths, and was the most frequent cause ofdeath in the age groups 1 to 4 years and 10 to 14 years.
• Of all paediatric deaths due to injury, 29% were transport related deaths. Most of these were deaths of apassenger.
• Twelve of the 92 injury deaths were due to intentional injuries. Six of these were possible or stated selfharm and occurred in the 10 to 14 year age group.
• Acquired conditions were responsible for 21% of paediatric deaths in 1999. Malignancies (cancer)accounted for 39% of deaths due to acquired conditions. The most frequent malignancy causing death inthe paediatric population remains acute lymphoblastic leukaemia.
Maternal, Perinatal and Paediatric Mortality in Queensland, 1999
Queensland Council on Obstetric and Paediatric Morbidity and Mortality 35
IntroductionThis chapter contains information on deaths of children aged greater than 27 days and less than 15 years. Forthe purpose of analysis, this paediatric population has been further divided into four sub-groups: 28 to 364days; 1 to 4 years; 5 to 9 years; and 10 to 14 years. Information on infant mortality (aged <1 year) is alsopresented.
DefinitionsPaediatric population: Children aged greater than 27 days and less than 15 years.Paediatric mortality rate: The number of deaths of children greater than 27 days and less than 15
years in a period per 100 000 person years.Infant mortality rate: The number of deaths of infants under one year of age in a period per
1 000 live births in the same period.Neonatal mortality rate: The number of deaths of live born infants under 28 days of age in a
period per 1 000 live births in the same period.Post-neonatal mortality rate: The number of deaths of infants aged greater than 27 days and less than
one year in a period per 1 000 live births in the same period.
Data sources and methodsThe Council obtained information on all paediatric deaths occurring in Queensland from the Registrar ofBirths, Deaths and Marriages. These deaths were then classified by the Paediatric Subcommittee accordingto the Queensland Council Paediatric Classification (QCPaedC), using information contained on the deathcertificate, in post mortem, police reports and coronial inquests, if these were conducted.Rates for mortality were calculated using estimated resident populations published by the Australian Bureauof Statistics (ABS). In the case of the 28 to 364 day age-group population, estimates were derived usingestimated populations for persons aged less than one year, total live births and neonatal deaths.Unless otherwise stated, all rates are presented per 100 000 person years.
QC Paediatric Classification (QCPaedC)The Council’s charter to investigate all paediatric deaths in Queensland and report on the nature and extentof preventable deaths in the State required a system for classifying these deaths.
The Council’s system of classification consists of four major cause categories:1. Conditions Determined at Birth2. Acquired Conditions3. Sudden Infant Death Syndrome (SIDS) and4. Injury
They are further subdivided into several levels of minor categories. The full classification is given inAppendix 3. Despite extensive review by the appropriate experts, the cause of death is not always apparentfrom the available information. These deaths are classified as Unable to be Determined.To maintain uniformity and comparability, cancer deaths (within Acquired conditions) are classified usingthe scheme adopted by of the Paediatric Cancer Registry of Queensland, a scheme based on the ICD-Oclassification system20. Similarly, the injury deaths classification is based on the National Data Standards forInjury Surveillance Ver 2.1 developed by the National Injury Surveillance Unit, AIHW21.This manner of reporting paediatric deaths in Queensland is still being refined and it is hoped that it will gainwide acceptance and be a forerunner of a uniform classification system for paediatric deaths withinAustralia.
20 Birch JM, Marsden HB. (1987). A Classification Scheme for Childhood Cancer. Int J Cancer. 40, 620-62421 Australian Institute of Health and Welfare National Injury Surveillance Unit, (1998) National Data Standards for
Injury Surveillance, Version 2.1. Adelaide: AIHW National Injury Surveillance Unit
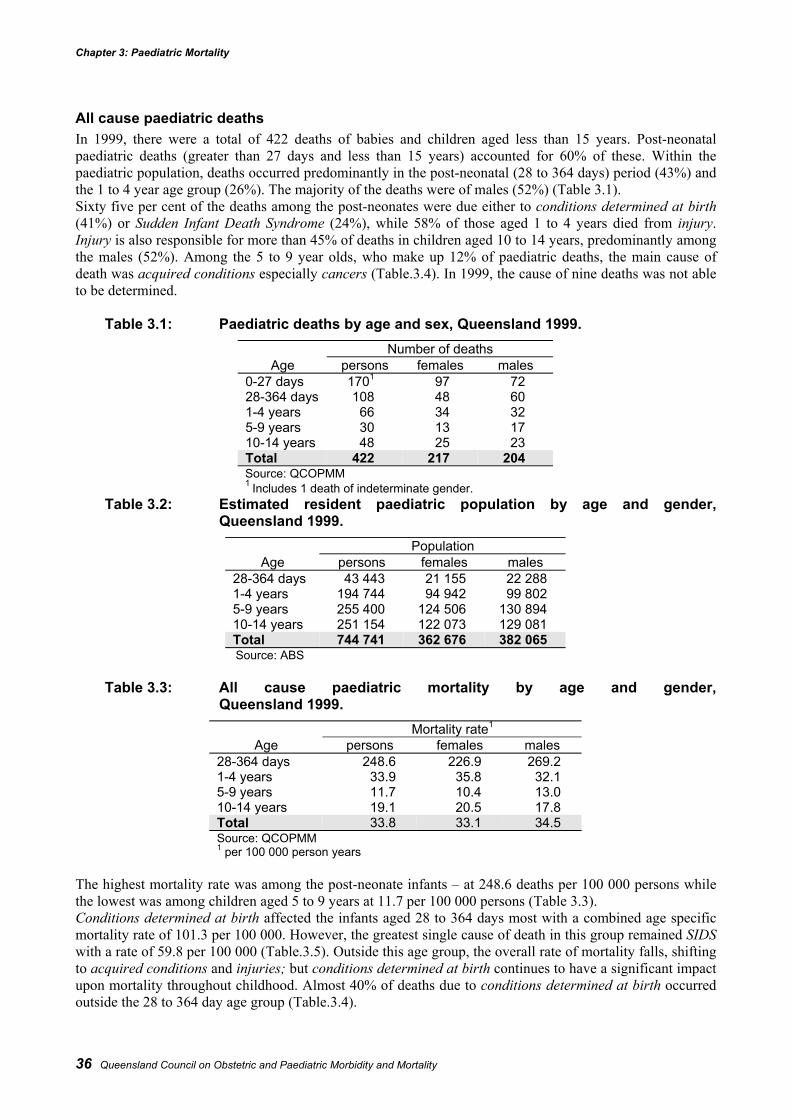
Chapter 3: Paediatric Mortality
36 Queensland Council on Obstetric and Paediatric Morbidity and Mortality
All cause paediatric deathsIn 1999, there were a total of 422 deaths of babies and children aged less than 15 years. Post-neonatalpaediatric deaths (greater than 27 days and less than 15 years) accounted for 60% of these. Within thepaediatric population, deaths occurred predominantly in the post-neonatal (28 to 364 days) period (43%) andthe 1 to 4 year age group (26%). The majority of the deaths were of males (52%) (Table 3.1).Sixty five per cent of the deaths among the post-neonates were due either to conditions determined at birth(41%) or Sudden Infant Death Syndrome (24%), while 58% of those aged 1 to 4 years died from injury.Injury is also responsible for more than 45% of deaths in children aged 10 to 14 years, predominantly amongthe males (52%). Among the 5 to 9 year olds, who make up 12% of paediatric deaths, the main cause ofdeath was acquired conditions especially cancers (Table.3.4). In 1999, the cause of nine deaths was not ableto be determined.
Table 3.1: Paediatric deaths by age and sex, Queensland 1999.Number of deaths
Age persons females males0-27 days 1701 97 7228-364 days 108 48 601-4 years 66 34 325-9 years 30 13 1710-14 years 48 25 23Total 422 217 204Source: QCOPMM1 Includes 1 death of indeterminate gender.
Table 3.2: Estimated resident paediatric population by age and gender,Queensland 1999.
PopulationAge persons females males
28-364 days 43 443 21 155 22 2881-4 years 194 744 94 942 99 8025-9 years 255 400 124 506 130 89410-14 years 251 154 122 073 129 081Total 744 741 362 676 382 065Source: ABS
Table 3.3: All cause paediatric mortality by age and gender,Queensland 1999.
Mortality rate1
Age persons females males28-364 days 248.6 226.9 269.21-4 years 33.9 35.8 32.15-9 years 11.7 10.4 13.010-14 years 19.1 20.5 17.8Total 33.8 33.1 34.5Source: QCOPMM1 per 100 000 person years
The highest mortality rate was among the post-neonate infants – at 248.6 deaths per 100 000 persons whilethe lowest was among children aged 5 to 9 years at 11.7 per 100 000 persons (Table 3.3).Conditions determined at birth affected the infants aged 28 to 364 days most with a combined age specificmortality rate of 101.3 per 100 000. However, the greatest single cause of death in this group remained SIDSwith a rate of 59.8 per 100 000 (Table.3.5). Outside this age group, the overall rate of mortality falls, shiftingto acquired conditions and injuries; but conditions determined at birth continues to have a significant impactupon mortality throughout childhood. Almost 40% of deaths due to conditions determined at birth occurredoutside the 28 to 364 day age group (Table.3.4).
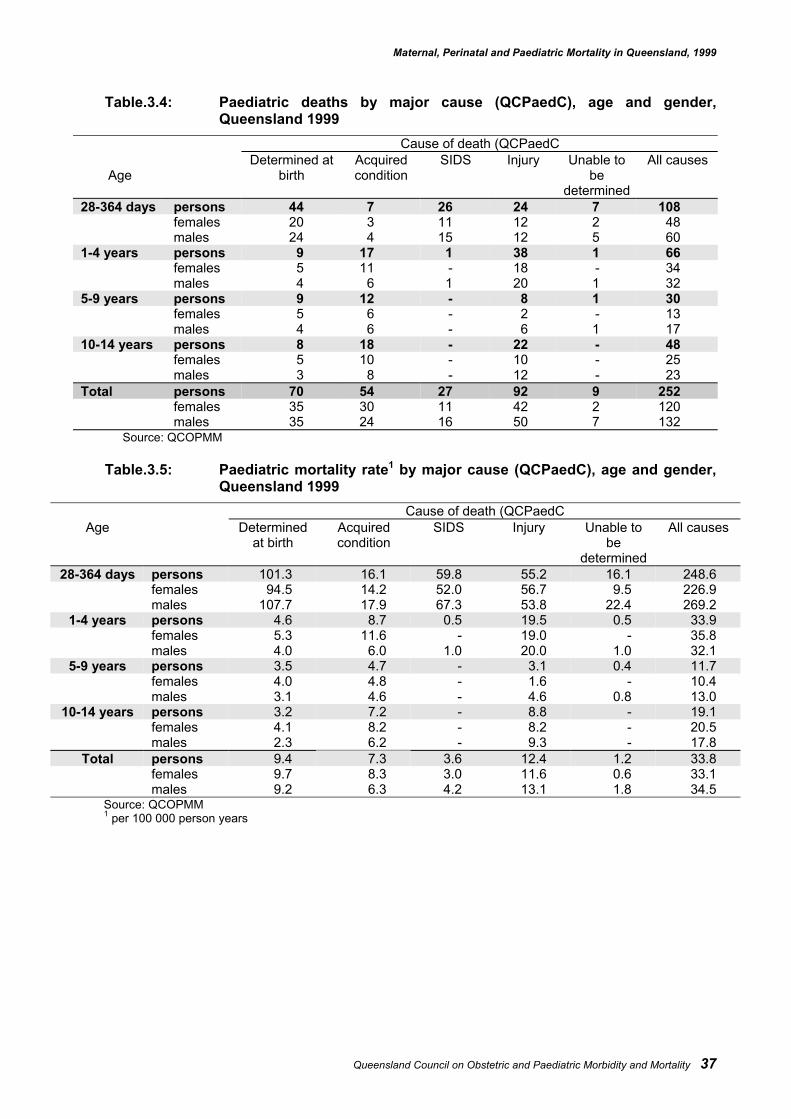
Maternal, Perinatal and Paediatric Mortality in Queensland, 1999
Queensland Council on Obstetric and Paediatric Morbidity and Mortality 37
Table.3.4: Paediatric deaths by major cause (QCPaedC), age and gender,Queensland 1999
Cause of death (QCPaedC
AgeDetermined at
birthAcquiredcondition
SIDS Injury Unable tobe
determined
All causes
28-364 days persons 44 7 26 24 7 108females 20 3 11 12 2 48males 24 4 15 12 5 60
1-4 years persons 9 17 1 38 1 66females 5 11 - 18 - 34males 4 6 1 20 1 32
5-9 years persons 9 12 - 8 1 30females 5 6 - 2 - 13males 4 6 - 6 1 17
10-14 years persons 8 18 - 22 - 48females 5 10 - 10 - 25males 3 8 - 12 - 23
Total persons 70 54 27 92 9 252females 35 30 11 42 2 120males 35 24 16 50 7 132
Source: QCOPMM
Table.3.5: Paediatric mortality rate1 by major cause (QCPaedC), age and gender,Queensland 1999
Cause of death (QCPaedCAge Determined
at birthAcquiredcondition
SIDS Injury Unable tobe
determined
All causes
28-364 days persons 101.3 16.1 59.8 55.2 16.1 248.6females 94.5 14.2 52.0 56.7 9.5 226.9males 107.7 17.9 67.3 53.8 22.4 269.2
1-4 years persons 4.6 8.7 0.5 19.5 0.5 33.9females 5.3 11.6 - 19.0 - 35.8males 4.0 6.0 1.0 20.0 1.0 32.1
5-9 years persons 3.5 4.7 - 3.1 0.4 11.7females 4.0 4.8 - 1.6 - 10.4males 3.1 4.6 - 4.6 0.8 13.0
10-14 years persons 3.2 7.2 - 8.8 - 19.1females 4.1 8.2 - 8.2 - 20.5males 2.3 6.2 - 9.3 - 17.8
Total persons 9.4 7.3 3.6 12.4 1.2 33.8females 9.7 8.3 3.0 11.6 0.6 33.1males 9.2 6.3 4.2 13.1 1.8 34.5
Source: QCOPMM1 per 100 000 person years
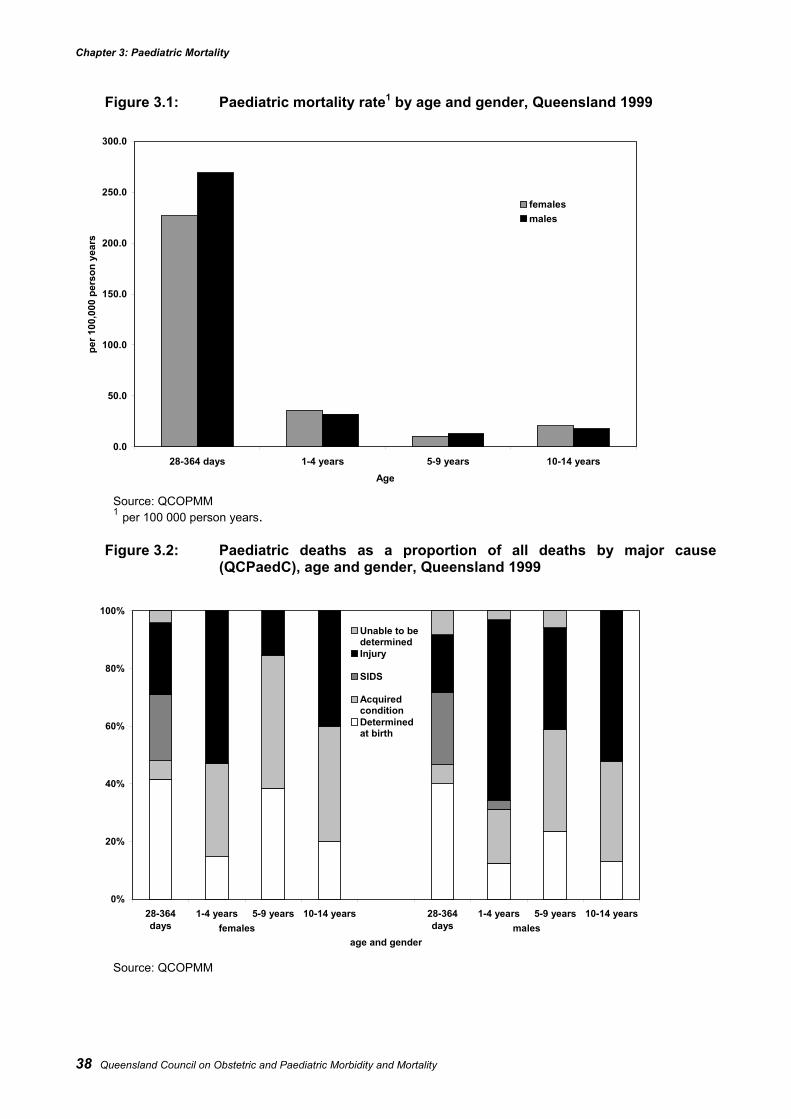
Chapter 3: Paediatric Mortality
38 Queensland Council on Obstetric and Paediatric Morbidity and Mortality
Figure 3.1: Paediatric mortality rate1 by age and gender, Queensland 1999
Source: QCOPMM1 per 100 000 person years.
Figure 3.2: Paediatric deaths as a proportion of all deaths by major cause(QCPaedC), age and gender, Queensland 1999
Source: QCOPMM
0%
20%
40%
60%
80%
100%
28-364days
1-4 years 5-9 years 10-14 years 28-364days
1-4 years 5-9 years 10-14 years
age and gender
Unable to bedeterminedInjury
SIDS
Acquiredcondition Determinedat birth
females males
0.0
50.0
100.0
150.0
200.0
250.0
300.0
28-364 days 1-4 years 5-9 years 10-14 yearsAge
per 1
00,0
00 p
erso
n ye
ars
females males
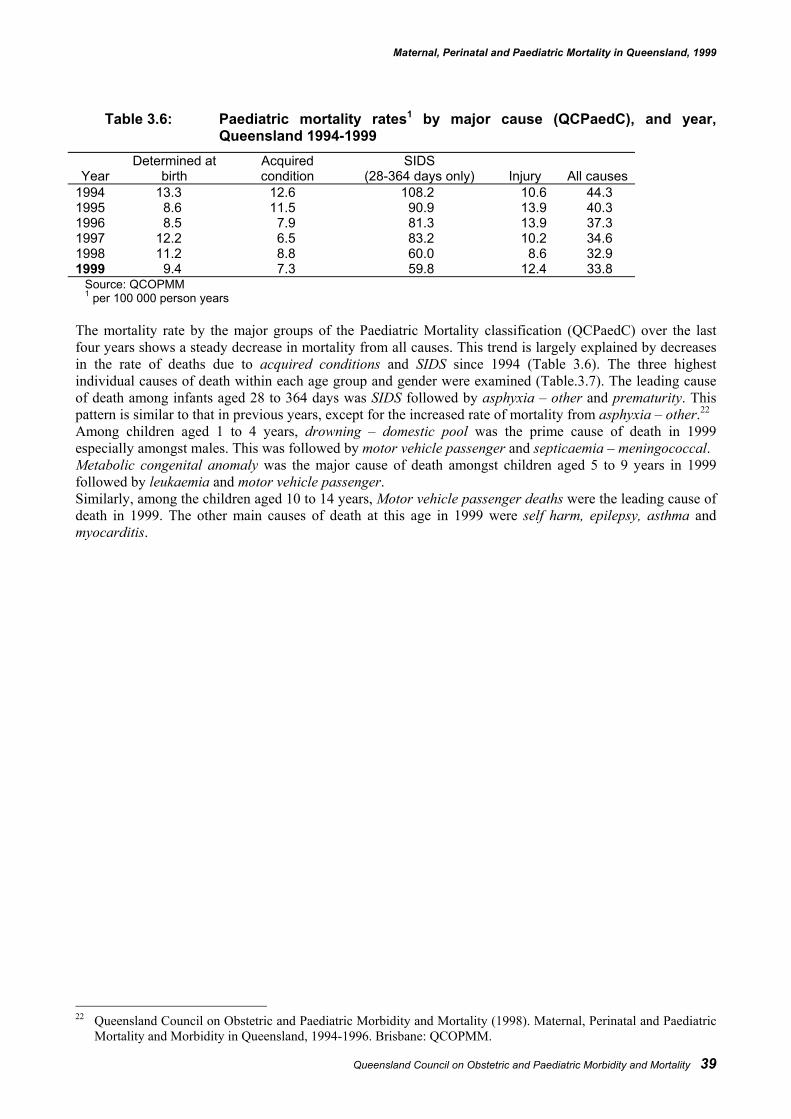
Maternal, Perinatal and Paediatric Mortality in Queensland, 1999
Queensland Council on Obstetric and Paediatric Morbidity and Mortality 39
Table 3.6: Paediatric mortality rates1 by major cause (QCPaedC), and year,Queensland 1994-1999
YearDetermined at
birthAcquiredcondition
SIDS(28-364 days only) Injury All causes
1994 13.3 12.6 108.2 10.6 44.31995 8.6 11.5 90.9 13.9 40.31996 8.5 7.9 81.3 13.9 37.31997 12.2 6.5 83.2 10.2 34.61998 11.2 8.8 60.0 8.6 32.91999 9.4 7.3 59.8 12.4 33.8
Source: QCOPMM1 per 100 000 person years
The mortality rate by the major groups of the Paediatric Mortality classification (QCPaedC) over the lastfour years shows a steady decrease in mortality from all causes. This trend is largely explained by decreasesin the rate of deaths due to acquired conditions and SIDS since 1994 (Table 3.6). The three highestindividual causes of death within each age group and gender were examined (Table.3.7). The leading causeof death among infants aged 28 to 364 days was SIDS followed by asphyxia – other and prematurity. Thispattern is similar to that in previous years, except for the increased rate of mortality from asphyxia – other.22
Among children aged 1 to 4 years, drowning – domestic pool was the prime cause of death in 1999especially amongst males. This was followed by motor vehicle passenger and septicaemia – meningococcal.Metabolic congenital anomaly was the major cause of death amongst children aged 5 to 9 years in 1999followed by leukaemia and motor vehicle passenger.Similarly, among the children aged 10 to 14 years, Motor vehicle passenger deaths were the leading cause ofdeath in 1999. The other main causes of death at this age in 1999 were self harm, epilepsy, asthma andmyocarditis.
22 Queensland Council on Obstetric and Paediatric Morbidity and Mortality (1998). Maternal, Perinatal and Paediatric
Mortality and Morbidity in Queensland, 1994-1996. Brisbane: QCOPMM.
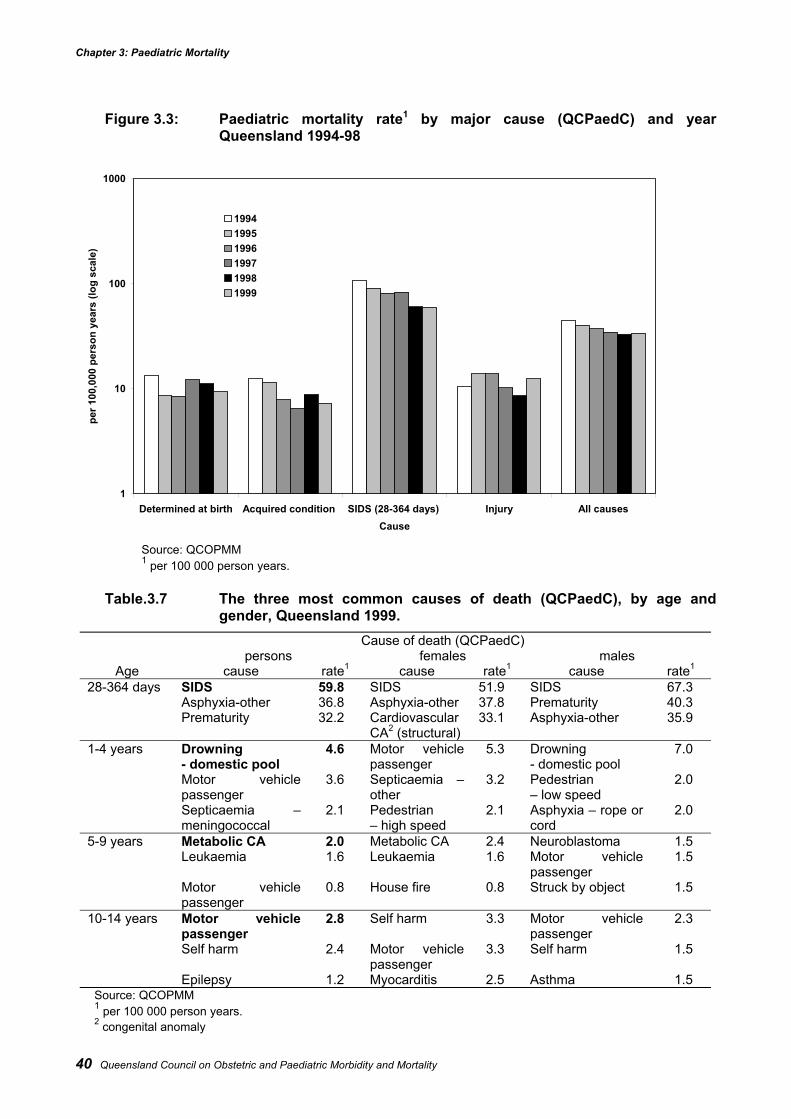
Chapter 3: Paediatric Mortality
40 Queensland Council on Obstetric and Paediatric Morbidity and Mortality
Figure 3.3: Paediatric mortality rate1 by major cause (QCPaedC) and yearQueensland 1994-98
Source: QCOPMM1 per 100 000 person years.
Table.3.7 The three most common causes of death (QCPaedC), by age andgender, Queensland 1999.
Cause of death (QCPaedC)persons females males
Age cause rate1 cause rate1 cause rate1
28-364 days SIDS 59.8 SIDS 51.9 SIDS 67.3Asphyxia-other 36.8 Asphyxia-other 37.8 Prematurity 40.3Prematurity 32.2 Cardiovascular
CA2 (structural)33.1 Asphyxia-other 35.9
1-4 years Drowning- domestic pool
4.6 Motor vehiclepassenger
5.3 Drowning- domestic pool
7.0
Motor vehiclepassenger
3.6 Septicaemia –other
3.2 Pedestrian– low speed
2.0
Septicaemia –meningococcal
2.1 Pedestrian– high speed
2.1 Asphyxia – rope orcord
2.0
5-9 years Metabolic CA 2.0 Metabolic CA 2.4 Neuroblastoma 1.5Leukaemia 1.6 Leukaemia 1.6 Motor vehicle
passenger1.5
Motor vehiclepassenger
0.8 House fire 0.8 Struck by object 1.5
10-14 years Motor vehiclepassenger
2.8 Self harm 3.3 Motor vehiclepassenger
2.3
Self harm 2.4 Motor vehiclepassenger
3.3 Self harm 1.5
Epilepsy 1.2 Myocarditis 2.5 Asthma 1.5Source: QCOPMM1 per 100 000 person years.2 congenital anomaly
1
10
100
1000
Determined at birth Acquired condition SIDS (28-364 days) Injury All causesCause
per 1
00,0
00 p
erso
n ye
ars
(log
scal
e)
199419951996199719981999
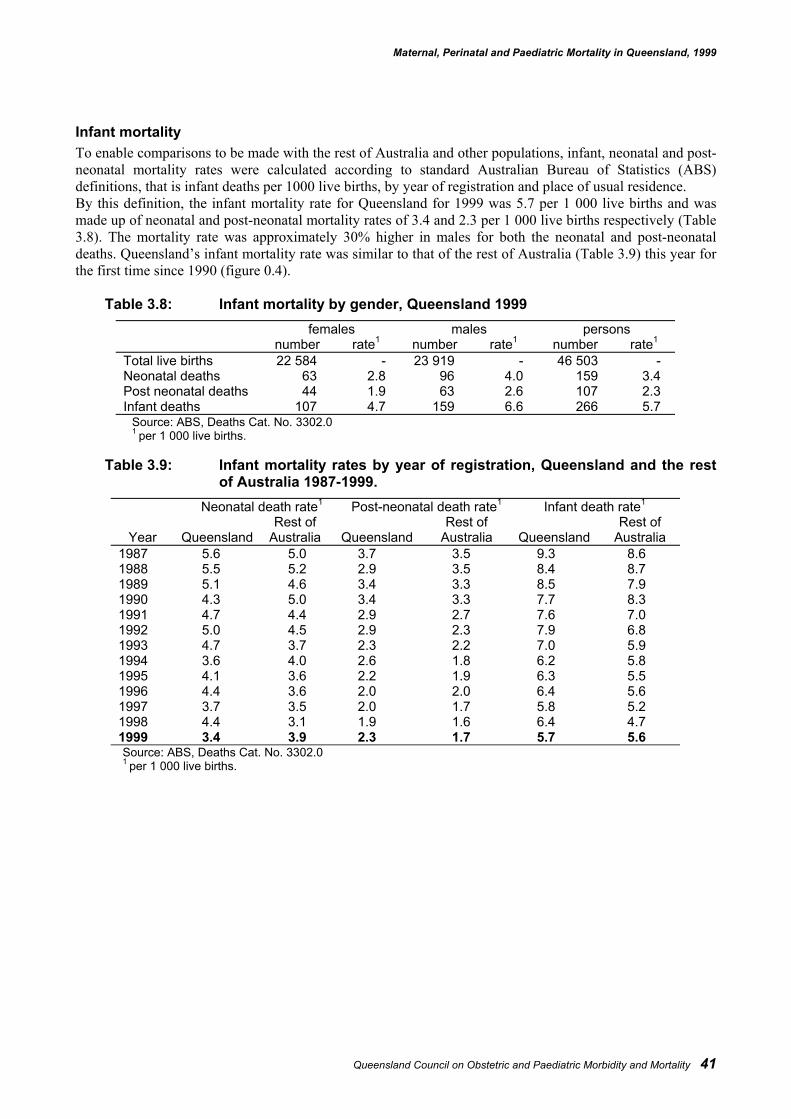
Maternal, Perinatal and Paediatric Mortality in Queensland, 1999
Queensland Council on Obstetric and Paediatric Morbidity and Mortality 41
Infant mortalityTo enable comparisons to be made with the rest of Australia and other populations, infant, neonatal and post-neonatal mortality rates were calculated according to standard Australian Bureau of Statistics (ABS)definitions, that is infant deaths per 1000 live births, by year of registration and place of usual residence.By this definition, the infant mortality rate for Queensland for 1999 was 5.7 per 1 000 live births and wasmade up of neonatal and post-neonatal mortality rates of 3.4 and 2.3 per 1 000 live births respectively (Table3.8). The mortality rate was approximately 30% higher in males for both the neonatal and post-neonataldeaths. Queensland’s infant mortality rate was similar to that of the rest of Australia (Table 3.9) this year forthe first time since 1990 (figure 0.4).
Table 3.8: Infant mortality by gender, Queensland 1999females males persons
number rate1 number rate1 number rate1
Total live births 22 584 - 23 919 - 46 503 -Neonatal deaths 63 2.8 96 4.0 159 3.4Post neonatal deaths 44 1.9 63 2.6 107 2.3Infant deaths 107 4.7 159 6.6 266 5.7
Source: ABS, Deaths Cat. No. 3302.01 per 1 000 live births.
Table 3.9: Infant mortality rates by year of registration, Queensland and the restof Australia 1987-1999.
Neonatal death rate1 Post-neonatal death rate1 Infant death rate1
Year QueenslandRest of
Australia QueenslandRest of
Australia QueenslandRest of
Australia1987 5.6 5.0 3.7 3.5 9.3 8.61988 5.5 5.2 2.9 3.5 8.4 8.71989 5.1 4.6 3.4 3.3 8.5 7.91990 4.3 5.0 3.4 3.3 7.7 8.31991 4.7 4.4 2.9 2.7 7.6 7.01992 5.0 4.5 2.9 2.3 7.9 6.81993 4.7 3.7 2.3 2.2 7.0 5.91994 3.6 4.0 2.6 1.8 6.2 5.81995 4.1 3.6 2.2 1.9 6.3 5.51996 4.4 3.6 2.0 2.0 6.4 5.61997 3.7 3.5 2.0 1.7 5.8 5.21998 4.4 3.1 1.9 1.6 6.4 4.71999 3.4 3.9 2.3 1.7 5.7 5.6Source: ABS, Deaths Cat. No. 3302.01 per 1 000 live births.
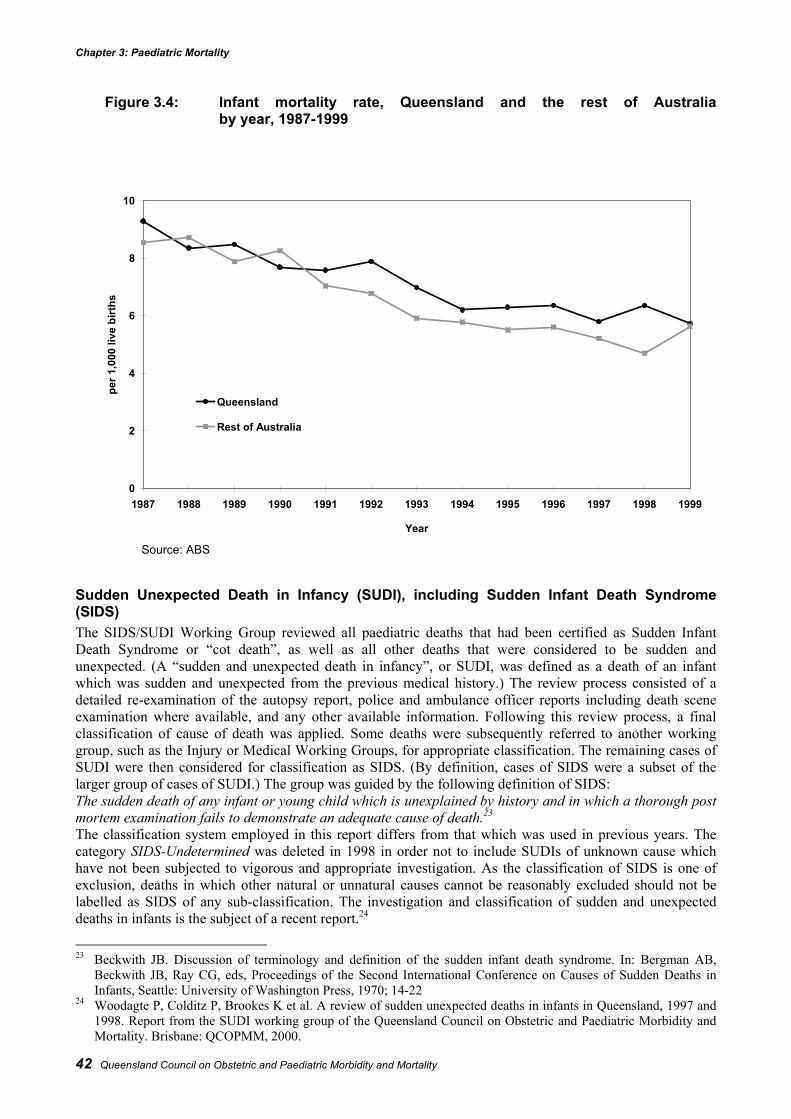
Chapter 3: Paediatric Mortality
42 Queensland Council on Obstetric and Paediatric Morbidity and Mortality
Figure 3.4: Infant mortality rate, Queensland and the rest of Australiaby year, 1987-1999
Source: ABS
Sudden Unexpected Death in Infancy (SUDI), including Sudden Infant Death Syndrome(SIDS)The SIDS/SUDI Working Group reviewed all paediatric deaths that had been certified as Sudden InfantDeath Syndrome or “cot death”, as well as all other deaths that were considered to be sudden andunexpected. (A “sudden and unexpected death in infancy”, or SUDI, was defined as a death of an infantwhich was sudden and unexpected from the previous medical history.) The review process consisted of adetailed re-examination of the autopsy report, police and ambulance officer reports including death sceneexamination where available, and any other available information. Following this review process, a finalclassification of cause of death was applied. Some deaths were subsequently referred to another workinggroup, such as the Injury or Medical Working Groups, for appropriate classification. The remaining cases ofSUDI were then considered for classification as SIDS. (By definition, cases of SIDS were a subset of thelarger group of cases of SUDI.) The group was guided by the following definition of SIDS:The sudden death of any infant or young child which is unexplained by history and in which a thorough postmortem examination fails to demonstrate an adequate cause of death.23
The classification system employed in this report differs from that which was used in previous years. Thecategory SIDS-Undetermined was deleted in 1998 in order not to include SUDIs of unknown cause whichhave not been subjected to vigorous and appropriate investigation. As the classification of SIDS is one ofexclusion, deaths in which other natural or unnatural causes cannot be reasonably excluded should not belabelled as SIDS of any sub-classification. The investigation and classification of sudden and unexpecteddeaths in infants is the subject of a recent report.24
23 Beckwith JB. Discussion of terminology and definition of the sudden infant death syndrome. In: Bergman AB,
Beckwith JB, Ray CG, eds, Proceedings of the Second International Conference on Causes of Sudden Deaths inInfants, Seattle: University of Washington Press, 1970; 14-22
24 Woodagte P, Colditz P, Brookes K et al. A review of sudden unexpected deaths in infants in Queensland, 1997 and1998. Report from the SUDI working group of the Queensland Council on Obstetric and Paediatric Morbidity andMortality. Brisbane: QCOPMM, 2000.
0
2
4
6
8
10
1987 1988 1989 1990 1991 1992 1993 1994 1995 1996 1997 1998 1999
Year
per 1
,000
live
birt
hs
Queensland
Rest of Australia
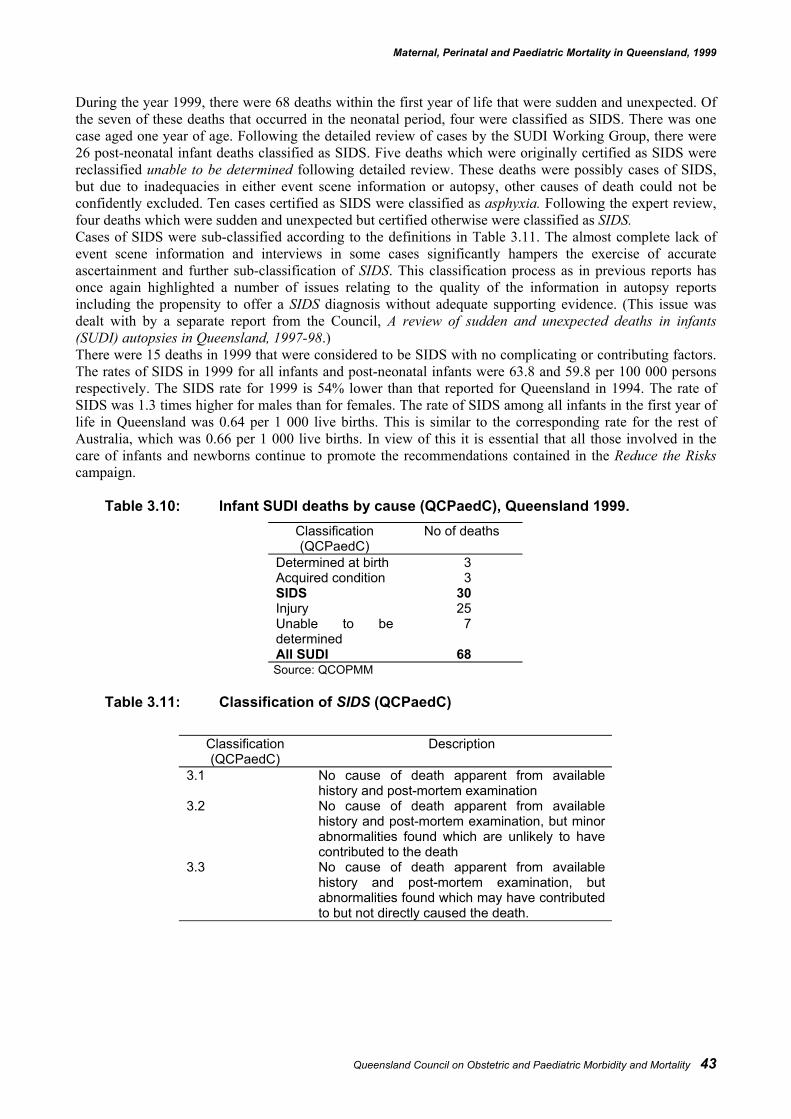
Maternal, Perinatal and Paediatric Mortality in Queensland, 1999
Queensland Council on Obstetric and Paediatric Morbidity and Mortality 43
During the year 1999, there were 68 deaths within the first year of life that were sudden and unexpected. Ofthe seven of these deaths that occurred in the neonatal period, four were classified as SIDS. There was onecase aged one year of age. Following the detailed review of cases by the SUDI Working Group, there were26 post-neonatal infant deaths classified as SIDS. Five deaths which were originally certified as SIDS werereclassified unable to be determined following detailed review. These deaths were possibly cases of SIDS,but due to inadequacies in either event scene information or autopsy, other causes of death could not beconfidently excluded. Ten cases certified as SIDS were classified as asphyxia. Following the expert review,four deaths which were sudden and unexpected but certified otherwise were classified as SIDS.Cases of SIDS were sub-classified according to the definitions in Table 3.11. The almost complete lack ofevent scene information and interviews in some cases significantly hampers the exercise of accurateascertainment and further sub-classification of SIDS. This classification process as in previous reports hasonce again highlighted a number of issues relating to the quality of the information in autopsy reportsincluding the propensity to offer a SIDS diagnosis without adequate supporting evidence. (This issue wasdealt with by a separate report from the Council, A review of sudden and unexpected deaths in infants(SUDI) autopsies in Queensland, 1997-98.)There were 15 deaths in 1999 that were considered to be SIDS with no complicating or contributing factors.The rates of SIDS in 1999 for all infants and post-neonatal infants were 63.8 and 59.8 per 100 000 personsrespectively. The SIDS rate for 1999 is 54% lower than that reported for Queensland in 1994. The rate ofSIDS was 1.3 times higher for males than for females. The rate of SIDS among all infants in the first year oflife in Queensland was 0.64 per 1 000 live births. This is similar to the corresponding rate for the rest ofAustralia, which was 0.66 per 1 000 live births. In view of this it is essential that all those involved in thecare of infants and newborns continue to promote the recommendations contained in the Reduce the Riskscampaign.
Table 3.10: Infant SUDI deaths by cause (QCPaedC), Queensland 1999.Classification(QCPaedC)
No of deaths
Determined at birth 3Acquired condition 3SIDS 30Injury 25Unable to bedetermined
7
All SUDI 68Source: QCOPMM
Table 3.11: Classification of SIDS (QCPaedC)
Classification(QCPaedC)
Description
3.1 No cause of death apparent from availablehistory and post-mortem examination
3.2 No cause of death apparent from availablehistory and post-mortem examination, but minorabnormalities found which are unlikely to havecontributed to the death
3.3 No cause of death apparent from availablehistory and post-mortem examination, butabnormalities found which may have contributedto but not directly caused the death.
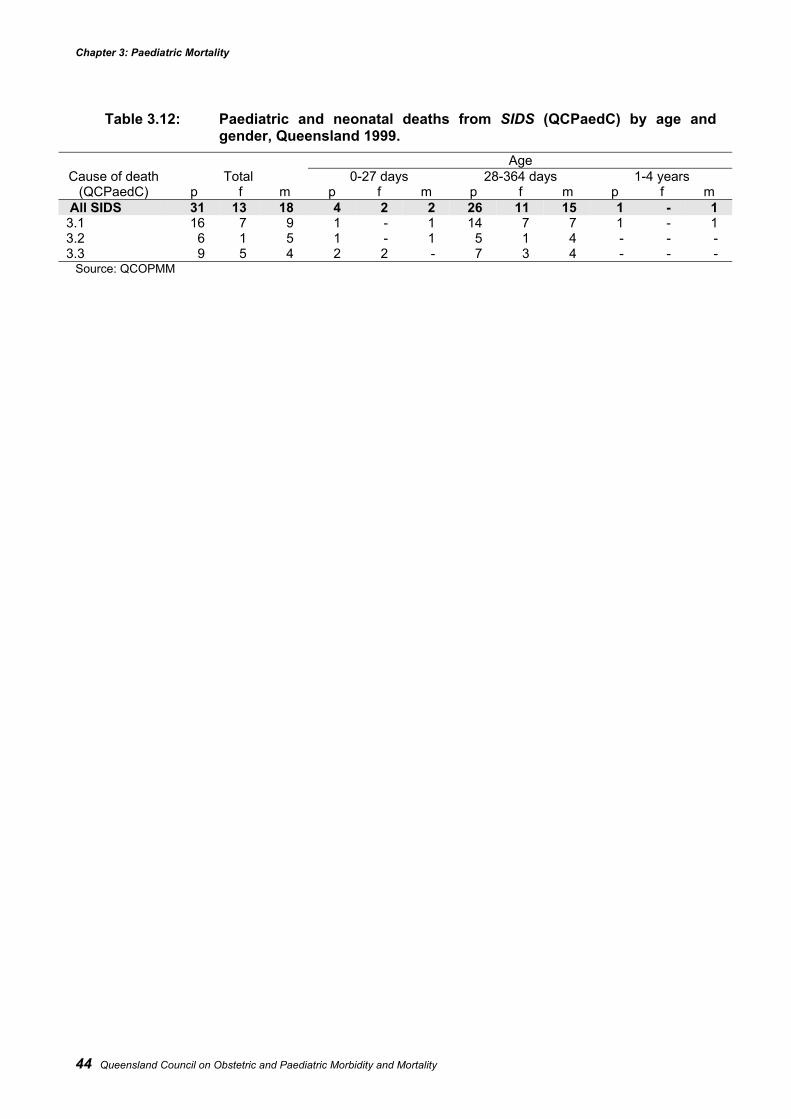
Chapter 3: Paediatric Mortality
44 Queensland Council on Obstetric and Paediatric Morbidity and Mortality
Table 3.12: Paediatric and neonatal deaths from SIDS (QCPaedC) by age andgender, Queensland 1999.
AgeCause of death Total 0-27 days 28-364 days 1-4 years
(QCPaedC) p f m p f m p f m p f m All SIDS 31 13 18 4 2 2 26 11 15 1 - 13.1 16 7 9 1 - 1 14 7 7 1 - 13.2 6 1 5 1 - 1 5 1 4 - - -3.3 9 5 4 2 2 - 7 3 4 - - -
Source: QCOPMM
Maternal, Perinatal and Paediatric Mortality in Queensland, 1999
Queensland Council on Obstetric and Paediatric Morbidity and Mortality 45
Injury deathsInjuries resulted in 92 child deaths in Queensland in 1999. This represents nearly 37% of all paediatricdeaths in the State. More than 40% of all child injury deaths involved children aged between 1 and 4 years.Drowning and motor vehicle passenger were the most common cause of death among children aged 1 to 4years in 1999. Children of this age (1 to 4 years) are of particular interest in that a disproportionate numberof injury deaths occur within this age group and their pattern of injury deaths is different to the other ages. Atthis age, a child cannot take responsibility for its own welfare and is entirely dependent on his or her carer,and on society to avoid preventable death. Drowning in domestic swimming pools or dams and slow speedpedestrian deaths are almost entirely restricted to this age group and together with high speed pedestriandeaths, comprise some of the highest rates of any specific cause of injury deaths between 1 and 14 years.Drowning in containers, dams and natural water hazards occur with similar incidence in this age group andtogether comprise almost as many fatalities as domestic pool drownings (Table 3.14). There was nearly a50% increase in domestic pool drownings in 1999 compared with the previous five years (especially amongthe males) while there was a decrease in drownings in dams.Deaths due to slow speed runovers were similar to the previous year. Most of these deaths involve 4-wheeldrive or similar vehicle with restricted rear vision and almost all involved the victim’s parent or closerelative, as the driver. These two leading causes of death due to injury in this age group were examined ingreater detail in the Council’s 1994 to 1996 report.For children within the 10 to 14 years age group, motor vehicle passenger deaths was the most commoncause of death. This group differs from other transport related deaths in older age groups because most aredetermined by factors outside the control of the child. With the exception of a very few deaths, (such asinvolving motor cycle riders) the child’s role in the death is purely passive. In the 1 to 4 year age grouppedestrian traffic fatalities usually outnumber motor vehicle passenger deaths but this situation is reversedfor both of the older age groups. For pedestrian and pedal cyclist deaths of older children it might be arguedthat the child’s own behaviour made some contribution, although the majority of child pedestrian deathsoccur before the fifth birthday - an age when the child must be considered the victim of a dangerous roadenvironment.Of the remaining other injury deaths, the majority was due to asphyxiation (29%), being struck by person orobject (8%) and house fire (3%).Thirteen percent of all paediatric injury deaths were recorded as being intentional of which half were due topossible or stated self harm. Children aged less than five years were most at risk from death from parentalmaltreatment while self harm was confined to the 10 to 14 years age group. Amongst females aged 10 to 14self harm was the most frequent cause of death for males the second most frequent cause. A recent study bythe Queensland Injury Surveillance Unit examining ED presentations for self harm for this age group foundan overall presentation rate for self harm of 64 per 100 000 with increased rates in females and in ruralareas25. These data suggest that for every completed suicide in this age group there are approximately 20unsuccessful attempts requiring medical attention. Reducing injury due to self harm is a priority area and EDbased interventions targeted at this age group should be investigated.During 1999 there were 16 deaths of children aged 28 to 365 days classified as asphyxia – other comprising60% of the injury deaths in this age group. (The majority of these deaths were the result of ‘sleepingaccidents’ and had been certified as deaths due to SIDS.) The apparent sharp increase in deaths due to thiscause may reflect a more critical and objective approach to the classification of sudden and unexpecteddeaths in infants. A recent report by the NSW Child Death review Team which undertook a review of allSIDS/SUDI deaths in that State also found similar discrepancies.26
This further highlights the need for a systematic approach to compiling information on unexpected deaths inthis State, to help identify any patterns or trends such as in SIDS or product related deaths. The establishmentof a centralised State Coroner’s Office and a State-wide Coronial Information database will go some way toachieving this.
25 Thomson F, Pitt R. Intentional acts of self harm in 10-14 year olds in three Queensland regions. 17th Annual
Scientific Meeting of the Australian College for Emergency medicine. Canberra, 2000.26 NSW Child Death Review Team. 1999-2000 Report. NSW Commission for Children and Young People.
Sydney: 2000.
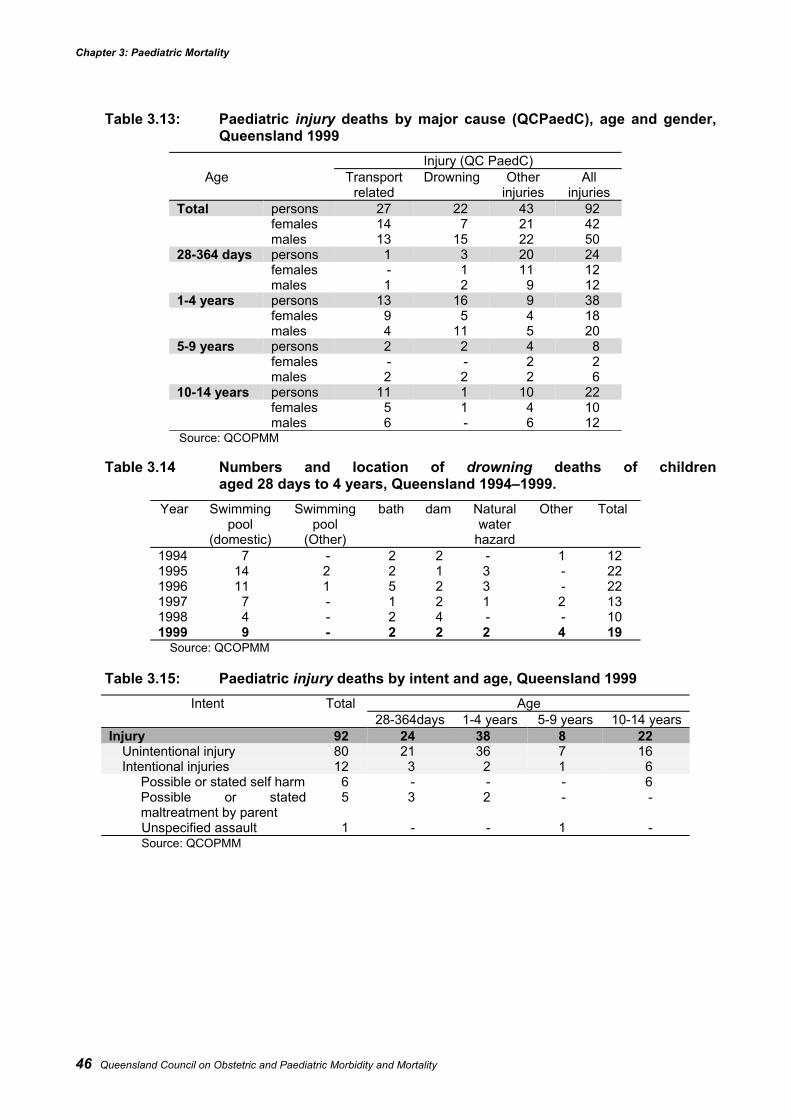
Chapter 3: Paediatric Mortality
46 Queensland Council on Obstetric and Paediatric Morbidity and Mortality
Table 3.13: Paediatric injury deaths by major cause (QCPaedC), age and gender,Queensland 1999
Injury (QC PaedC)Age Transport
relatedDrowning Other
injuriesAll
injuriesTotal persons 27 22 43 92
females 14 7 21 42males 13 15 22 50
28-364 days persons 1 3 20 24females - 1 11 12males 1 2 9 12
1-4 years persons 13 16 9 38females 9 5 4 18males 4 11 5 20
5-9 years persons 2 2 4 8females - - 2 2males 2 2 2 6
10-14 years persons 11 1 10 22females 5 1 4 10males 6 - 6 12
Source: QCOPMM
Table 3.14 Numbers and location of drowning deaths of childrenaged 28 days to 4 years, Queensland 1994–1999.
Year Swimmingpool
(domestic)
Swimmingpool
(Other)
bath dam Naturalwater
hazard
Other Total
1994 7 - 2 2 - 1 121995 14 2 2 1 3 - 221996 11 1 5 2 3 - 221997 7 - 1 2 1 2 131998 4 - 2 4 - - 101999 9 - 2 2 2 4 19
Source: QCOPMM
Table 3.15: Paediatric injury deaths by intent and age, Queensland 1999Intent Total Age
28-364days 1-4 years 5-9 years 10-14 yearsInjury 92 24 38 8 22
Unintentional injury 80 21 36 7 16Intentional injuries 12 3 2 1 6
Possible or stated self harm 6 - - - 6Possible or statedmaltreatment by parent
5 3 2 - -
Unspecified assault 1 - - 1 -Source: QCOPMM
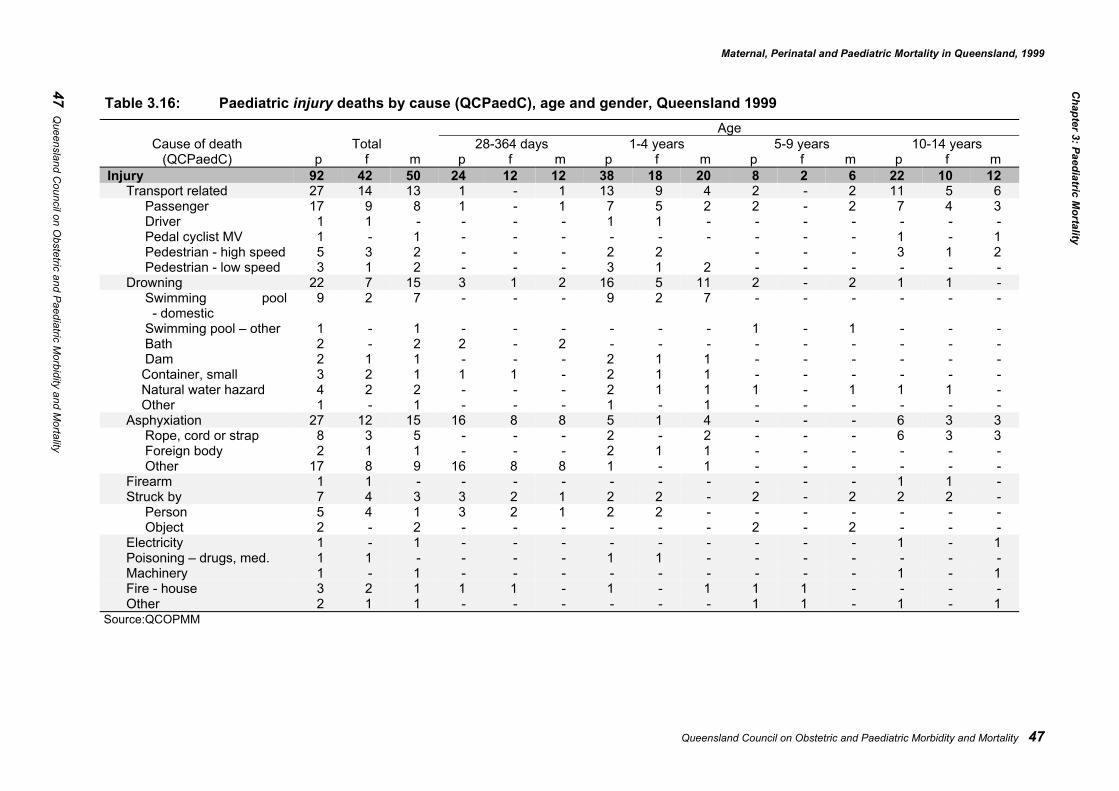
Maternal, Perinatal and Paediatric Mortality in Queensland, 1999
Queensland Council on Obstetric and Paediatric Morbidity and Mortality 47
Table 3.16: Paediatric injury deaths by cause (QCPaedC), age and gender, Queensland 1999Age
Cause of death Total 28-364 days 1-4 years 5-9 years 10-14 years(QCPaedC) p f m p f m p f m p f m p f m
Injury 92 42 50 24 12 12 38 18 20 8 2 6 22 10 12Transport related 27 14 13 1 - 1 13 9 4 2 - 2 11 5 6
Passenger 17 9 8 1 - 1 7 5 2 2 - 2 7 4 3Driver 1 1 - - - - 1 1 - - - - - - -Pedal cyclist MV 1 - 1 - - - - - - - - - 1 - 1Pedestrian - high speed 5 3 2 - - - 2 2 - - - 3 1 2Pedestrian - low speed 3 1 2 - - - 3 1 2 - - - - - -
Drowning 22 7 15 3 1 2 16 5 11 2 - 2 1 1 -Swimming pool - domestic
9 2 7 - - - 9 2 7 - - - - - -
Swimming pool – other 1 - 1 - - - - - - 1 - 1 - - -Bath 2 - 2 2 - 2 - - - - - - - - -Dam 2 1 1 - - - 2 1 1 - - - - - -Container, small 3 2 1 1 1 - 2 1 1 - - - - - -Natural water hazard 4 2 2 - - - 2 1 1 1 - 1 1 1 -Other 1 - 1 - - - 1 - 1 - - - - - -
Asphyxiation 27 12 15 16 8 8 5 1 4 - - - 6 3 3Rope, cord or strap 8 3 5 - - - 2 - 2 - - - 6 3 3Foreign body 2 1 1 - - - 2 1 1 - - - - - -Other 17 8 9 16 8 8 1 - 1 - - - - - -
Firearm 1 1 - - - - - - - - - - 1 1 -Struck by 7 4 3 3 2 1 2 2 - 2 - 2 2 2 -
Person 5 4 1 3 2 1 2 2 - - - - - - -Object 2 - 2 - - - - - - 2 - 2 - - -
Electricity 1 - 1 - - - - - - - - - 1 - 1Poisoning – drugs, med. 1 1 - - - - 1 1 - - - - - - -Machinery 1 - 1 - - - - - - - - - 1 - 1Fire - house 3 2 1 1 1 - 1 - 1 1 1 - - - -Other 2 1 1 - - - - - - 1 1 - 1 - 1
Source:QCOPMM
Chapter 3: Paediatric M
ortality
47 Queensland C
ouncil on Obstetric and Paediatric M
orbidity and Mortality

Maternal, Perinatal and Paediatric Mortality in Queensland, 1999
Queensland Council on Obstetric and Paediatric Morbidity and Mortality 49
Conditions determined at birthConditions determined at birth made up 28% of all paediatric mortality in 1999, which was slightly less thanthat observed in 1998 (Table 3.6).
Congenital conditions/birth defectsStructural cardiovascular anomalies accounted for almost a third of the deaths associated with congenitalconditions and/or birth defects (Table 3.17). Neurological and metabolic anomalies were the other commoncongenital conditions that caused death. The 10 deaths due to metabolic anomalies included pyruvatedehydrogenase deficiency, mitochondrial encephalopathy/cytopathy, methylmalonicacidemia, Alpers'disease and Hurler's syndrome.
Other conditions determined at birthThree of the five deaths in this sub-category were from cerebral palsy. Cerebral palsy was the conditionrecorded in the death certificate for these cases although it is not an adequate diagnosis for cause of death.
Acquired conditionsThere has been a general decline in deaths from acquired conditions since 1994, (Table 3.6). The numbers ofdeaths due to infections and other acquired conditions reported in 1999 remains virtually unchanged from1998, while cancers have declined.
InfectionAs a proportion of all mortality, infections as a cause of death are approximately a third less than they werein 1994. There were no deaths from H. influenza meningitis or pertussis in 1999.
Other acquired conditionsAs in the previous four years, epilepsy and asthma continue to cause deaths in the paediatric population especially among the older age groups. In 1999 there were two deaths classified other acquired – otherwhich included one death due to adrenoleukodystrophy and one death following a ‘near SIDS’.
MalignancyThe 21 deaths from cancers made up 8% of all paediatric deaths and 39% of deaths from acquired conditionsin 1999. Almost 40% of these childhood cancer deaths were due to leukaemias especially acutelymphoblastic leukaemia (Table 3.19).In the 1994 to 1996 triennium, most of the deaths from malignancy occurred in the first two years of thistriennium (Figure 3.5). The decline observed up until 1997 has continued for 1999. Data from the AustralianPaediatric Cancer Registry also suggests that 70% of patients with childhood cancer can be expected to becured of their disease. Some types of cancer have a particularly good prognosis and it is encouraging to notethat there were no recorded deaths in 1999 from retinoblastoma and only one from Wilms’ tumour.
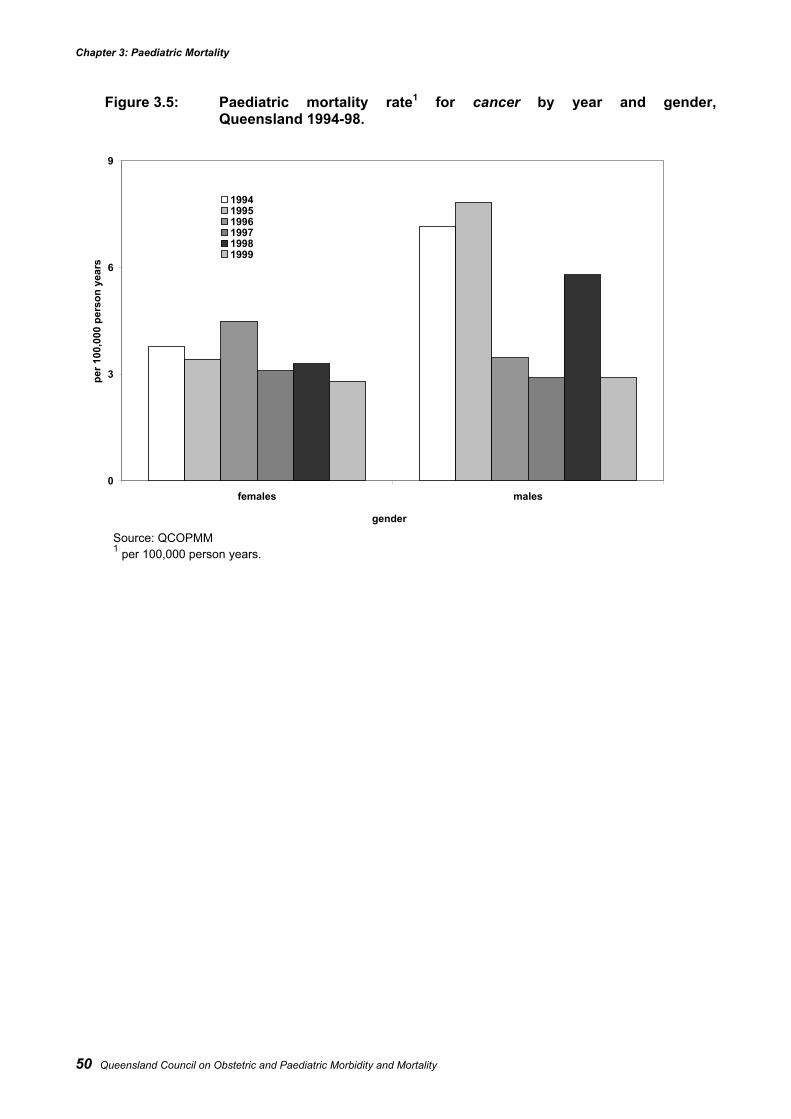
Chapter 3: Paediatric Mortality
50 Queensland Council on Obstetric and Paediatric Morbidity and Mortality
Figure 3.5: Paediatric mortality rate1 for cancer by year and gender,Queensland 1994-98.
Source: QCOPMM1 per 100,000 person years.
0
3
6
9
females males
gender
per 1
00,0
00 p
erso
n ye
ars
199419951996199719981999
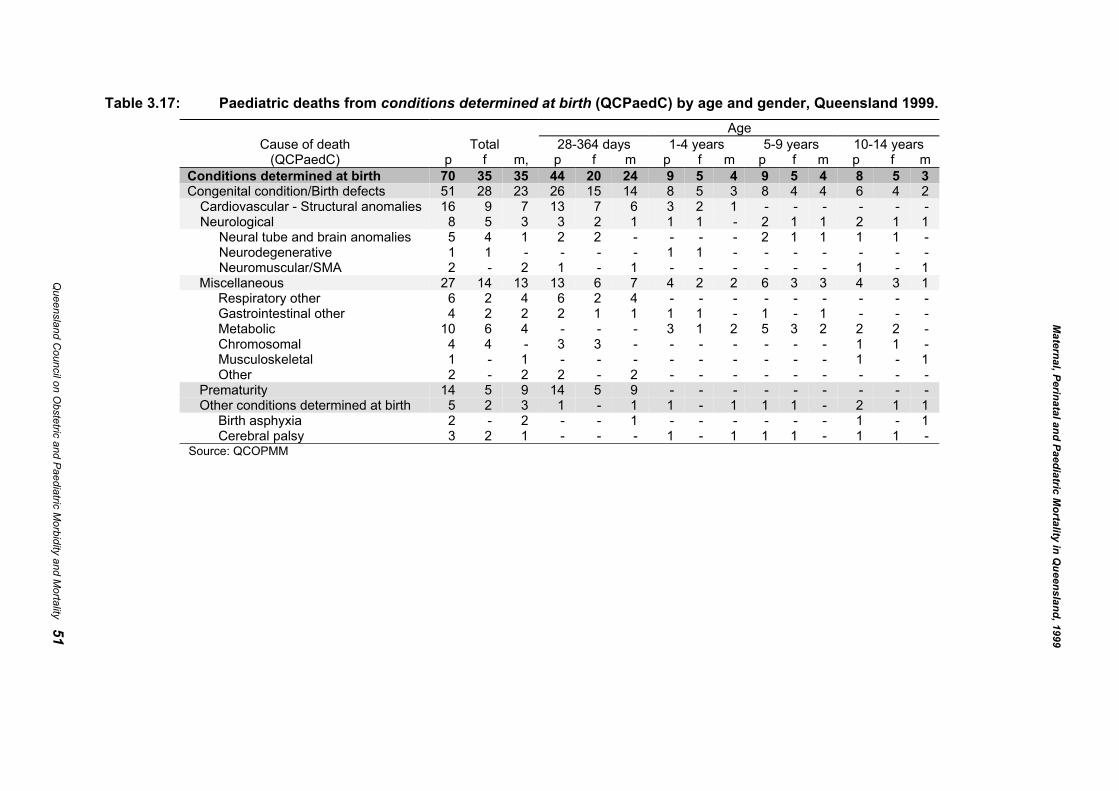
Table 3.17: Paediatric deaths from conditions determined at birth (QCPaedC) by age and gender, Queensland 1999.Age
Cause of death Total 28-364 days 1-4 years 5-9 years 10-14 years(QCPaedC) p f m, p f m p f m p f m p f m
Conditions determined at birth 70 35 35 44 20 24 9 5 4 9 5 4 8 5 3Congenital condition/Birth defects 51 28 23 26 15 14 8 5 3 8 4 4 6 4 2
Cardiovascular - Structural anomalies 16 9 7 13 7 6 3 2 1 - - - - - -Neurological 8 5 3 3 2 1 1 1 - 2 1 1 2 1 1
Neural tube and brain anomalies 5 4 1 2 2 - - - - 2 1 1 1 1 -Neurodegenerative 1 1 - - - - 1 1 - - - - - - -Neuromuscular/SMA 2 - 2 1 - 1 - - - - - - 1 - 1
Miscellaneous 27 14 13 13 6 7 4 2 2 6 3 3 4 3 1Respiratory other 6 2 4 6 2 4 - - - - - - - - -Gastrointestinal other 4 2 2 2 1 1 1 1 - 1 - 1 - - -Metabolic 10 6 4 - - - 3 1 2 5 3 2 2 2 -Chromosomal 4 4 - 3 3 - - - - - - - 1 1 -Musculoskeletal 1 - 1 - - - - - - - - - 1 - 1Other 2 - 2 2 - 2 - - - - - - - - -
Prematurity 14 5 9 14 5 9 - - - - - - - - -Other conditions determined at birth 5 2 3 1 - 1 1 - 1 1 1 - 2 1 1
Birth asphyxia 2 - 2 - - 1 - - - - - - 1 - 1Cerebral palsy 3 2 1 - - - 1 - 1 1 1 - 1 1 -
Source: QCOPMM
Queensland C
ouncil on Obstetric and Paediatric M
orbidity and Mortality 51
Maternal, Perinatal and Paediatric M
ortality in Queensland, 1999
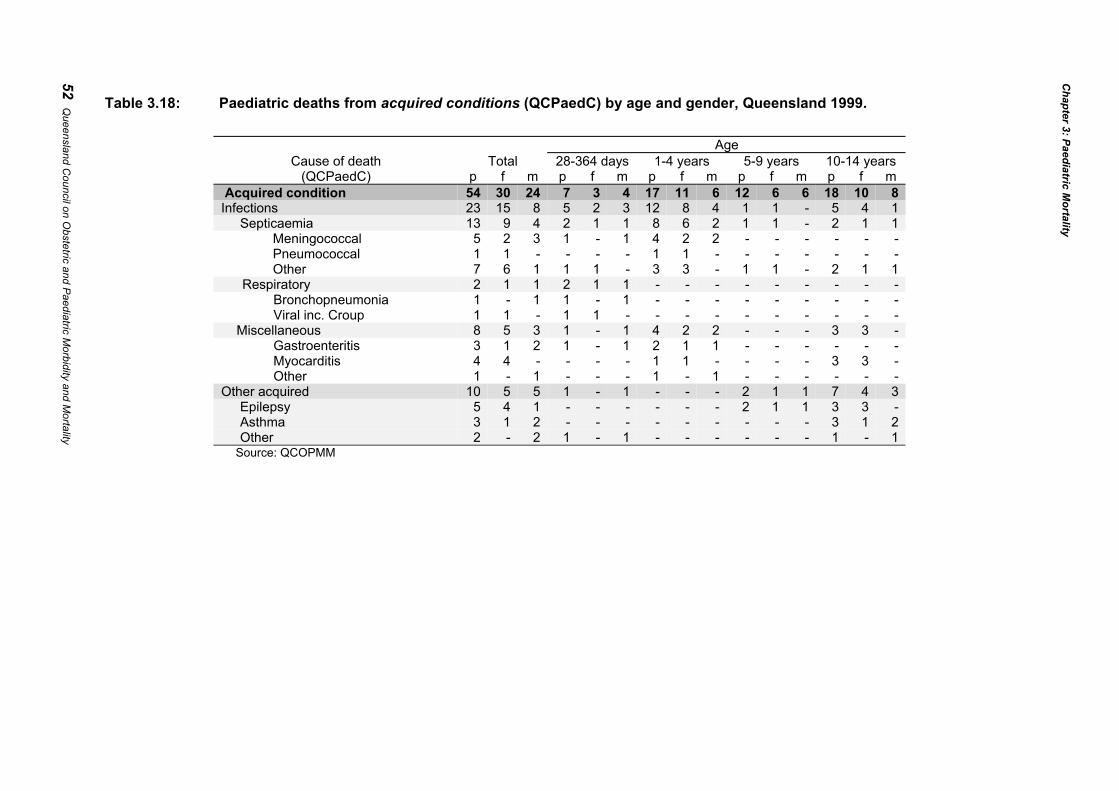
Table 3.18: Paediatric deaths from acquired conditions (QCPaedC) by age and gender, Queensland 1999.
AgeCause of death Total 28-364 days 1-4 years 5-9 years 10-14 years
(QCPaedC) p f m p f m p f m p f m p f m Acquired condition 54 30 24 7 3 4 17 11 6 12 6 6 18 10 8Infections 23 15 8 5 2 3 12 8 4 1 1 - 5 4 1
Septicaemia 13 9 4 2 1 1 8 6 2 1 1 - 2 1 1Meningococcal 5 2 3 1 - 1 4 2 2 - - - - - -Pneumococcal 1 1 - - - - 1 1 - - - - - - -Other 7 6 1 1 1 - 3 3 - 1 1 - 2 1 1
Respiratory 2 1 1 2 1 1 - - - - - - - - -Bronchopneumonia 1 - 1 1 - 1 - - - - - - - - -Viral inc. Croup 1 1 - 1 1 - - - - - - - - - -
Miscellaneous 8 5 3 1 - 1 4 2 2 - - - 3 3 -Gastroenteritis 3 1 2 1 - 1 2 1 1 - - - - - -Myocarditis 4 4 - - - - 1 1 - - - - 3 3 -Other 1 - 1 - - - 1 - 1 - - - - - -
Other acquired 10 5 5 1 - 1 - - - 2 1 1 7 4 3Epilepsy 5 4 1 - - - - - - 2 1 1 3 3 -Asthma 3 1 2 - - - - - - - - - 3 1 2Other 2 - 2 1 - 1 - - - - - - 1 - 1
Source: QCOPMM
52 Queensland C
ouncil on Obstetric and Paediatric M
orbidity and Mortality
Chapter 3: Paediatric M
ortality
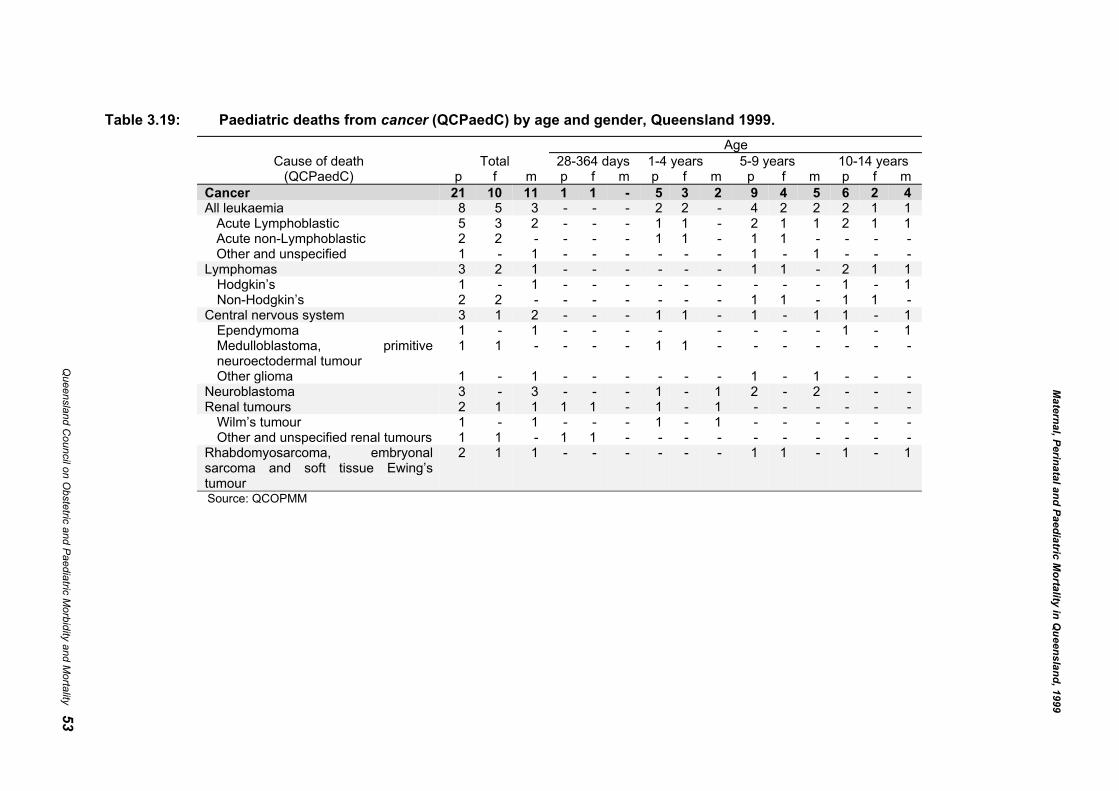
Table 3.19: Paediatric deaths from cancer (QCPaedC) by age and gender, Queensland 1999.Age
Cause of death Total 28-364 days 1-4 years 5-9 years 10-14 years(QCPaedC) p f m p f m p f m p f m p f m
Cancer 21 10 11 1 1 - 5 3 2 9 4 5 6 2 4All leukaemia 8 5 3 - - - 2 2 - 4 2 2 2 1 1
Acute Lymphoblastic 5 3 2 - - - 1 1 - 2 1 1 2 1 1Acute non-Lymphoblastic 2 2 - - - - 1 1 - 1 1 - - - -Other and unspecified 1 - 1 - - - - - - 1 - 1 - - -
Lymphomas 3 2 1 - - - - - - 1 1 - 2 1 1Hodgkin’s 1 - 1 - - - - - - - - - 1 - 1Non-Hodgkin’s 2 2 - - - - - - - 1 1 - 1 1 -
Central nervous system 3 1 2 - - - 1 1 - 1 - 1 1 - 1Ependymoma 1 - 1 - - - - - - - - 1 - 1Medulloblastoma, primitiveneuroectodermal tumour
1 1 - - - - 1 1 - - - - - - -
Other glioma 1 - 1 - - - - - - 1 - 1 - - -Neuroblastoma 3 - 3 - - - 1 - 1 2 - 2 - - -Renal tumours 2 1 1 1 1 - 1 - 1 - - - - - -
Wilm’s tumour 1 - 1 - - - 1 - 1 - - - - - -Other and unspecified renal tumours 1 1 - 1 1 - - - - - - - - - -
Rhabdomyosarcoma, embryonalsarcoma and soft tissue Ewing’stumour
2 1 1 - - - - - - 1 1 - 1 - 1
Source: QCOPMM
Maternal, Perinatal and Paediatric M
ortality in Queensland, 1999
Queensland C
ouncil on Obstetric and Paediatric M
orbidity and Mortality 53
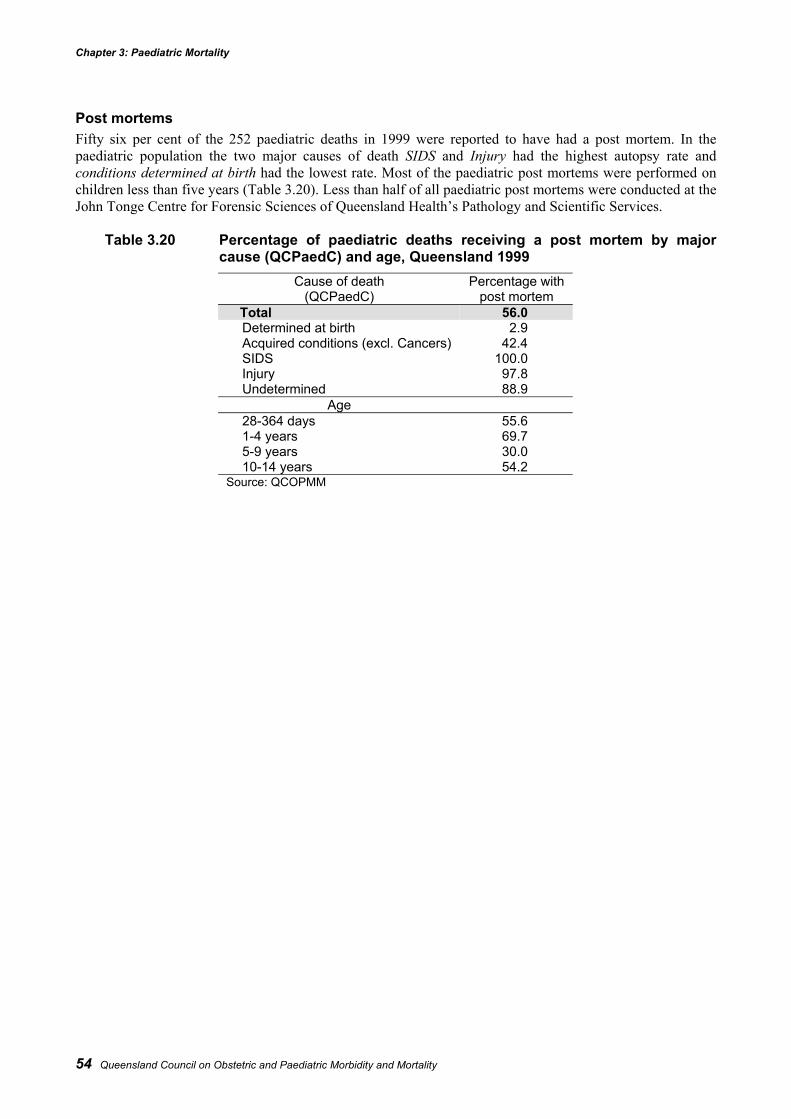
Chapter 3: Paediatric Mortality
54 Queensland Council on Obstetric and Paediatric Morbidity and Mortality
Post mortemsFifty six per cent of the 252 paediatric deaths in 1999 were reported to have had a post mortem. In thepaediatric population the two major causes of death SIDS and Injury had the highest autopsy rate andconditions determined at birth had the lowest rate. Most of the paediatric post mortems were performed onchildren less than five years (Table 3.20). Less than half of all paediatric post mortems were conducted at theJohn Tonge Centre for Forensic Sciences of Queensland Health’s Pathology and Scientific Services.
Table 3.20 Percentage of paediatric deaths receiving a post mortem by majorcause (QCPaedC) and age, Queensland 1999
Cause of death(QCPaedC)
Percentage withpost mortem
Total 56.0Determined at birth 2.9Acquired conditions (excl. Cancers) 42.4SIDS 100.0Injury 97.8Undetermined 88.9
Age28-364 days 55.61-4 years 69.75-9 years 30.010-14 years 54.2
Source: QCOPMM
Maternal, Perinatal and Paediatric Mortality in Queensland, 1999
Queensland Council on Obstetric and Paediatric Morbidity and Mortality 55
Chapter 4: Indigenous Mortality
Executive summary• Data used to calculate perinatal and paediatric mortality rates are derived from different sources.
Identification as “Indigenous” is not rigorously and consistently sought, and may be reliant upon self-identification, or the individual who completes the death certificate. Under-ascertainment of Indigenousstatus is likely. In this report “Indigenous” refers to the combined total of peoples of “Aboriginal” and“Torres Strait Islander” origin.
• There was one death of a mother who was registered as Indigenous (maternal death) in 1999.
• In 1999, 6% of births were to Indigenous mothers, whilst 9% of perinatal deaths were in babies ofIndigenous mothers. The Indigenous perinatal mortality rate remains 1.6 times higher than the non-Indigenous perinatal mortality rate.
• The perinatal mortality rates for Indigenous populations were higher in most gestational age and birth-weight categories. The cause of perinatal death accounting for most of the increased perinatal mortalityin Indigenous populations was unexplained preterm, which was more than two times more frequent thanin the non-Indigenous population.
• Neonatal death rate due to respiratory disorders was almost four times higher in the Indigenouspopulation.
• The Indigenous paediatric mortality rate was two times higher than that in the non-Indigenouspopulation. The rate of death due to SIDS was also two times higher in Indigenous infants.
Chapter 4: Indigenous Mortality
56 Queensland Council on Obstetric and Paediatric Morbidity and Mortality
IntroductionImproving the health and well being of the Indigenous population of Australia has been widely accepted bygovernments as a national priority, and Queensland Health as the leading health agency in Queensland hasexpressed firm commitment to this.27 Indigenous outcomes are therefore reported separately in this chapter.It contains information on deaths of mothers, babies and children (to age 14 years), identified as Aboriginal,Torres Strait Islander or both in the perinatal and mortality data.
DefinitionsThe term Indigenous in this chapter refers to an Aboriginal or Torres Strait Islander person. The definition of anAboriginal or Torres Strait Islander person, as accepted by Queensland Health and other agencies including theCommonwealth government, is:
a person of Aboriginal or Torres Strait Islander descent who identifies as an Aboriginal or Torres Strait Islanderand is accepted as such by the community in which he or she lives.
Fetal death Defined by the Registration of Births, Deaths and Marriages Act as a childwhose heart has not beaten after it has been completely expelled or extractedfrom its mother and who is either of not less than 20 weeks gestation; or ofnot less than 400g by weight at birth.
Live birth Defined by the Registration of Births, Deaths and Marriages Act as a childwhose heart has beaten after it has been completely expelled or extractedfrom its mother.
Neonatal death The death of a live born infant within 28 days of birth.Perinatal mortality rate The number of fetal and neonatal deaths per 1,000 total births.Fetal mortality rate The number of fetal deaths per 1,000 total births.Neonatal mortality rate: The number of deaths of live born infants under 28 days of age per 1000
live births.Post-neonatal mortality rate The number of deaths of infants aged greater than 27 days and less than one
year in a period per 1000 live births in the same period.Paediatric population Children aged greater than 27 days and less than 15 years.Paediatric mortality rate The number of deaths of children greater than 27 days and less than 15 years
in a period per 100,000 person years.Infant mortality rate The number of deaths of infants under one year of age in a period per 1000
live births in the same period.
Data sources and qualityPerinatal and paediatric deaths are reported separately as they are derived from different sources. The dataused for perinatal mortality were obtained from the Perinatal Data Collection (PDC) of the Data ServicesUnit in the Health Information Centre of Queensland Health, the Australian Institute of Health and Welfare’sNational Perinatal Statistics Unit (NPSU) and from the Australian Bureau of Statistics (ABS). Informationon paediatric deaths is from the Registrar General of Births, Deaths and Marriages.With perinatal information, it should be noted that there are differences in the numbers of births and deathsreported (both Indigenous and non-Indigenous) according to whether the data are derived from ABS reportsor from the Perinatal Data Collection (PDC). Births, perinatal deaths and infant deaths are reported by ABSaccording to the State of residence of the mother and year of registration, whereas the PDC reports on birthsand perinatal deaths which occur in Queensland in the year of their occurrence.The PDC records only the Indigenous status of the mother while birth registration information (used byABS) is the result of self identification and includes the father’s Indigenous status. The ABS estimates that in1999 nearly 26% of Indigenous births registered in Queensland had an Indigenous father and a non-Indigenous mother.28
27 Communicable Diseases Unit Queensland Health. Public Health Systems Indigenous Identifiers Project. 1998.
Brisbane: Queensland Health.28 Australian Bureau of Statistics. Births Australia 1998. Cat. No. 3301.0, 1999. Canberra: ABS.
Maternal, Perinatal and Paediatric Mortality in Queensland, 1999
Queensland Council on Obstetric and Paediatric Morbidity and Mortality 57
The system relied upon by the PDC, whereby the birth attendant assigns maternal Indigenous status, hasbeen shown in Victoria to be inconsistent, and highly likely to result in under-ascertainment29.Information on Indigenous mortality in Queensland is subject to the death being registered with the Registrarof Births, Deaths and Marriages and to the quality of information on Indigenous status. While information onmaternal Indigenous status has been available from perinatal death certificates in Queensland since 1987,general death certificates included a question about Indigenous status only since mid 1996. Thus, 1999 wasthe first year in which information on Indigenous status of infant and paediatric deaths was recorded andascertainment of Indigenous status from these improved forms is likely to be still incomplete. Further, thequality of information on Indigenous status is reliant on the individual who includes such information on thedeath certificate (usually the funeral director or doctor). The reduced propensity to ascertain Indigenousstatus of the deceased where it is unclear, is likely to result in significant under-reporting of Indigenousdeaths. Unlike birth registrations that are self identified and may be required for some benefits andentitlements, death registration is a less rigorous process. Deaths in the rural and remoter parts of Queensland(with a high Indigenous population), may be less likely to be registered.Inconsistencies in the ascertainment of Indigenous status of births and deaths means that estimations ofIndigenous perinatal, infant and paediatric mortality rates need to be interpreted cautiously.The estimate of the Indigenous paediatric population for 1999 was based on ABS experimental projections30
and is subject to its assumptions. In the case of the population aged between 28 and 364 days, estimates werederived using estimated populations for persons aged less than one year, total live births and neonatal deaths.These ABS experimental projections are based on the 1996 Census whose estimates of the Indigenouspopulation have been questioned because they showed an increase of approximately 100% since the 1991Census. This discrepancy in the Indigenous populations between the two census periods applied particularlyto the east coast of Australia. ABS estimates that only about half of this ‘significant inter-censal volatility’can be explained by natural increase31 - thus requiring caution with the denominators as well.
Maternal mortalityDuring 1999 there was one Indigenous maternal death recorded. The rates of rare events in small populations(such as maternal mortality in the Indigenous population) are prone to unstable fluctuations and cannot beused as indicators of the health of the community. However, the NHMRC report on Maternal Deaths inAustralia, 1994-96 found that the relative risk of maternal mortality for Indigenous women versus non-Indigenous women for this period was 3.45 (95% CI, 1.67-7.16).32
Perinatal mortalityFor the purposes of this Report, perinatal mortality rates for women reported as of Aboriginal or Torres StraitIslander origin are presented in combined form as the numbers are too small to permit valid statisticalcomparison. Although it is appreciated that combining the data for these two populations may obscure someimportant differences, there is a risk in over-interpreting differences in rates between populations when thenumbers are small.Perinatal outcomes reflect overall maternal health, which in turn is directly related to socio-economic well-being.Thus declines in the perinatal mortality rate for the Indigenous population will require a larger contribution fromimprovements in socio-economic conditions than from improvements in medical care alone.There can be no doubt that in order to reduce morbidity and mortality improvements need to be made in theservices available to Indigenous women and many of the recommendations in these reports await appropriatefunding.
29 Koori Health Unit. How midwives identify women as Aboriginal or Torres Strait Islanders, Koori Health Counts,
Number 1: 1994. Melbourne: Department of Human Services, Victoria.30 Australian Bureau of Statistics. Experimental projections of the Aboriginal and Torres Strait Islander population 30
June 1996 to 30 June 2006. Cat. No. 3231.0, 1998. Canberra: ABS.31 ABS, AIHW. The Health and Welfare of Australia’s Aboriginal and Torres Strait Islander Peoples. Cat. No. 4704.0,
1999. Canberra: ABS.32 Maternal Mortality Working Party, NHMRC. Report on Maternal Deaths in Australia 1991-93. Canberra: NHMRC;
1998.
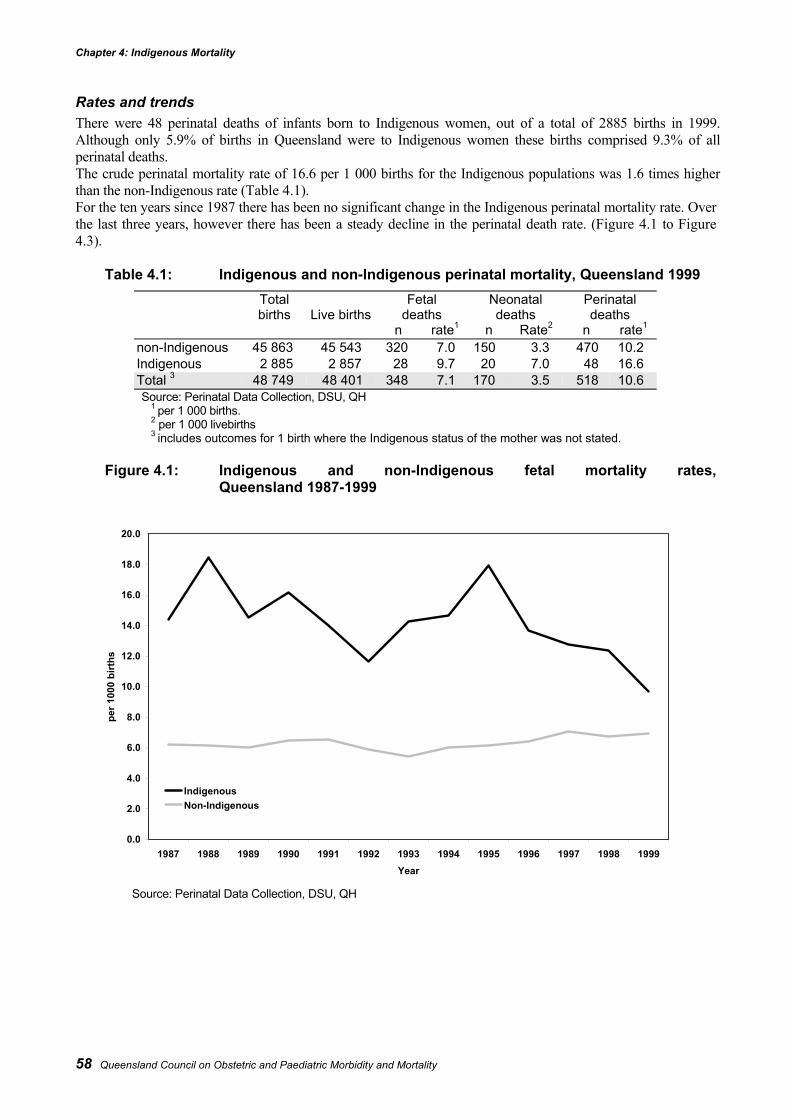
Chapter 4: Indigenous Mortality
58 Queensland Council on Obstetric and Paediatric Morbidity and Mortality
Rates and trendsThere were 48 perinatal deaths of infants born to Indigenous women, out of a total of 2885 births in 1999.Although only 5.9% of births in Queensland were to Indigenous women these births comprised 9.3% of allperinatal deaths.The crude perinatal mortality rate of 16.6 per 1 000 births for the Indigenous populations was 1.6 times higherthan the non-Indigenous rate (Table 4.1).For the ten years since 1987 there has been no significant change in the Indigenous perinatal mortality rate. Overthe last three years, however there has been a steady decline in the perinatal death rate. (Figure 4.1 to Figure4.3).
Table 4.1: Indigenous and non-Indigenous perinatal mortality, Queensland 1999Totalbirths Live births
Fetaldeaths
Neonataldeaths
Perinataldeaths
n rate1 n Rate2 n rate1
non-Indigenous 45 863 45 543 320 7.0 150 3.3 470 10.2Indigenous 2 885 2 857 28 9.7 20 7.0 48 16.6Total 3 48 749 48 401 348 7.1 170 3.5 518 10.6Source: Perinatal Data Collection, DSU, QH
1 per 1 000 births.2 per 1 000 livebirths3 includes outcomes for 1 birth where the Indigenous status of the mother was not stated.
Figure 4.1: Indigenous and non-Indigenous fetal mortality rates,Queensland 1987-1999
Source: Perinatal Data Collection, DSU, QH
0.0
2.0
4.0
6.0
8.0
10.0
12.0
14.0
16.0
18.0
20.0
1987 1988 1989 1990 1991 1992 1993 1994 1995 1996 1997 1998 1999Year
per 1
000
birt
hs
IndigenousNon-Indigenous
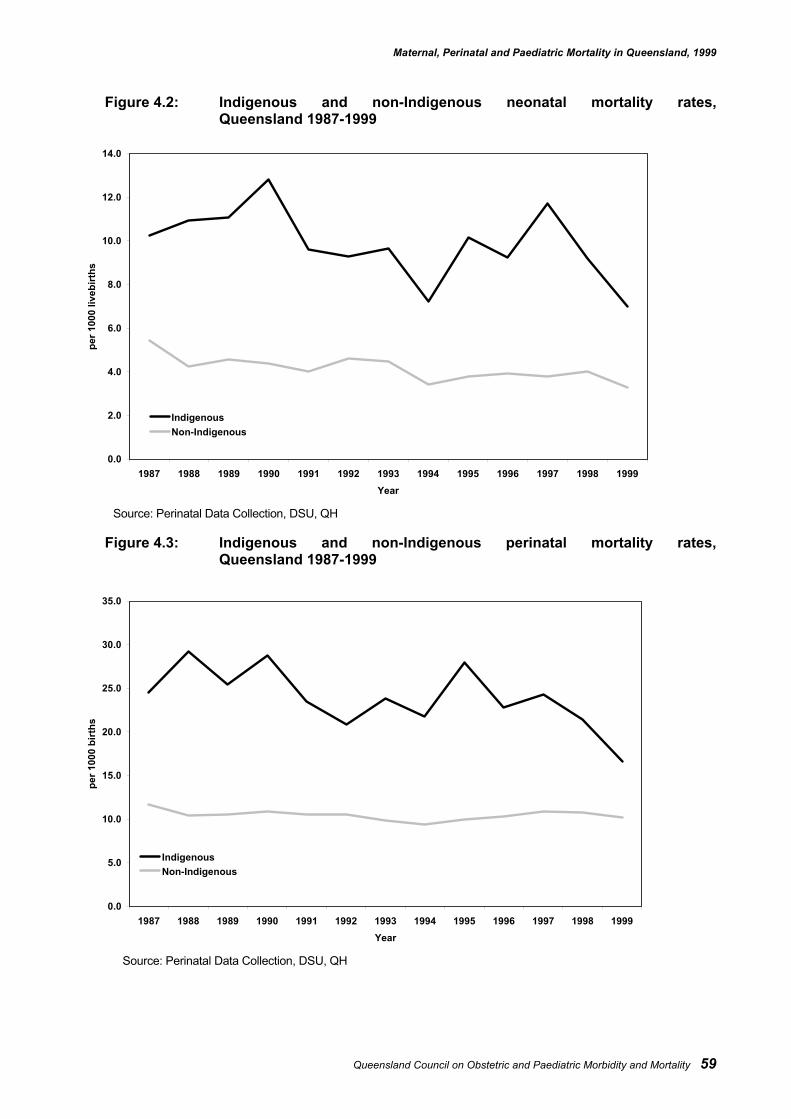
Maternal, Perinatal and Paediatric Mortality in Queensland, 1999
Queensland Council on Obstetric and Paediatric Morbidity and Mortality 59
Figure 4.2: Indigenous and non-Indigenous neonatal mortality rates,Queensland 1987-1999
Source: Perinatal Data Collection, DSU, QH
Figure 4.3: Indigenous and non-Indigenous perinatal mortality rates,Queensland 1987-1999
Source: Perinatal Data Collection, DSU, QH
0.0
2.0
4.0
6.0
8.0
10.0
12.0
14.0
1987 1988 1989 1990 1991 1992 1993 1994 1995 1996 1997 1998 1999Year
per 1
000
liveb
irths
IndigenousNon-Indigenous
0.0
5.0
10.0
15.0
20.0
25.0
30.0
35.0
1987 1988 1989 1990 1991 1992 1993 1994 1995 1996 1997 1998 1999Year
per 1
000
birt
hs
IndigenousNon-Indigenous
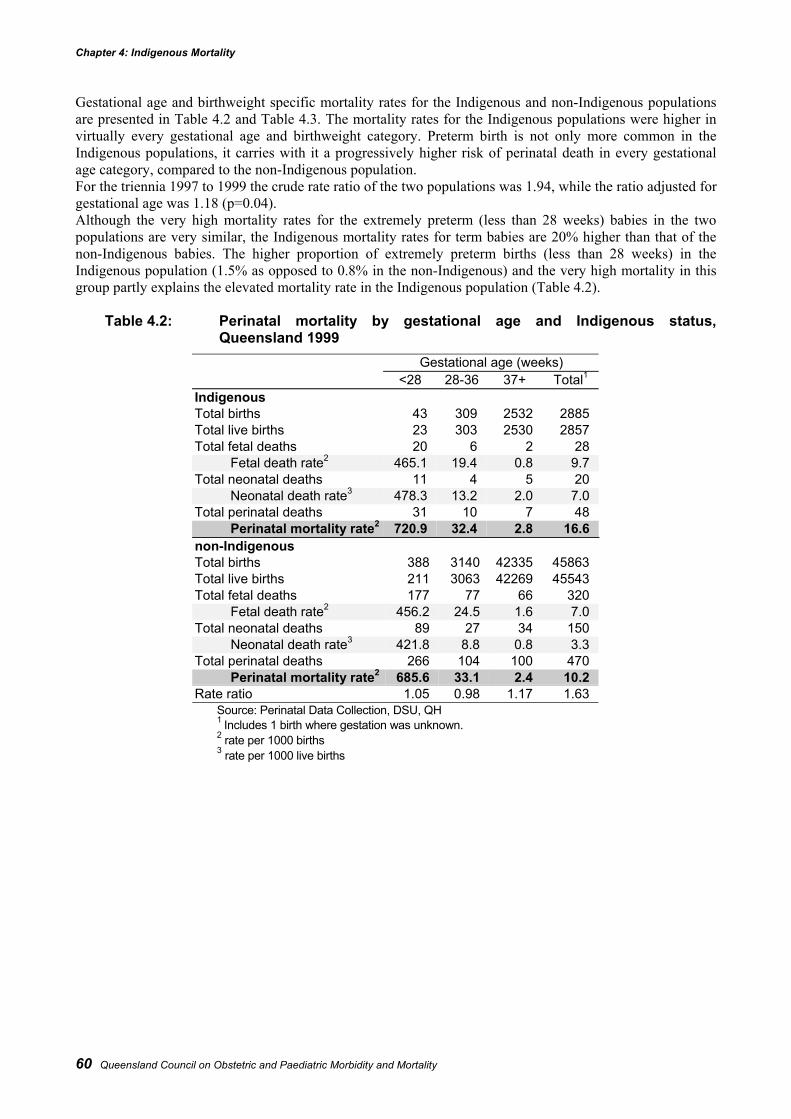
Chapter 4: Indigenous Mortality
60 Queensland Council on Obstetric and Paediatric Morbidity and Mortality
Gestational age and birthweight specific mortality rates for the Indigenous and non-Indigenous populationsare presented in Table 4.2 and Table 4.3. The mortality rates for the Indigenous populations were higher invirtually every gestational age and birthweight category. Preterm birth is not only more common in theIndigenous populations, it carries with it a progressively higher risk of perinatal death in every gestationalage category, compared to the non-Indigenous population.For the triennia 1997 to 1999 the crude rate ratio of the two populations was 1.94, while the ratio adjusted forgestational age was 1.18 (p=0.04).Although the very high mortality rates for the extremely preterm (less than 28 weeks) babies in the twopopulations are very similar, the Indigenous mortality rates for term babies are 20% higher than that of thenon-Indigenous babies. The higher proportion of extremely preterm births (less than 28 weeks) in theIndigenous population (1.5% as opposed to 0.8% in the non-Indigenous) and the very high mortality in thisgroup partly explains the elevated mortality rate in the Indigenous population (Table 4.2).
Table 4.2: Perinatal mortality by gestational age and Indigenous status,Queensland 1999
Gestational age (weeks)<28 28-36 37+ Total1
IndigenousTotal births 43 309 2532 2885Total live births 23 303 2530 2857Total fetal deaths 20 6 2 28
Fetal death rate2 465.1 19.4 0.8 9.7Total neonatal deaths 11 4 5 20
Neonatal death rate3 478.3 13.2 2.0 7.0Total perinatal deaths 31 10 7 48
Perinatal mortality rate2 720.9 32.4 2.8 16.6non-IndigenousTotal births 388 3140 42335 45863Total live births 211 3063 42269 45543Total fetal deaths 177 77 66 320
Fetal death rate2 456.2 24.5 1.6 7.0Total neonatal deaths 89 27 34 150
Neonatal death rate3 421.8 8.8 0.8 3.3Total perinatal deaths 266 104 100 470
Perinatal mortality rate2 685.6 33.1 2.4 10.2Rate ratio 1.05 0.98 1.17 1.63
Source: Perinatal Data Collection, DSU, QH1 Includes 1 birth where gestation was unknown.2 rate per 1000 births3 rate per 1000 live births
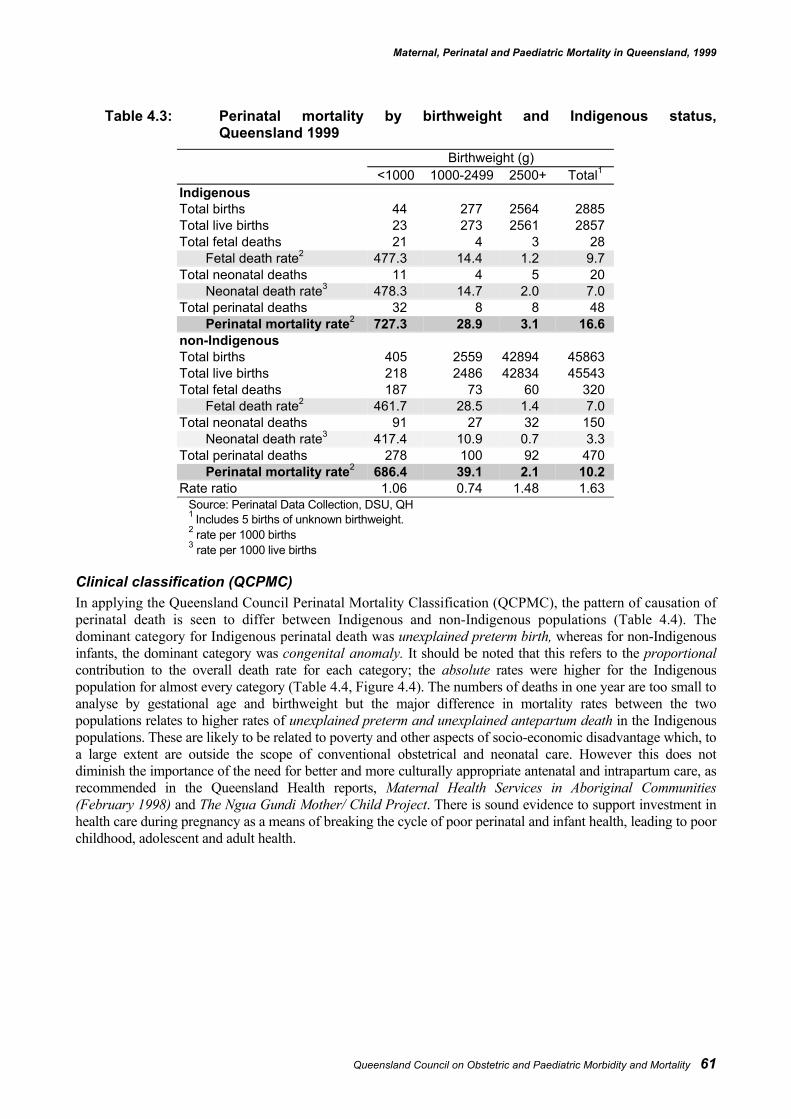
Maternal, Perinatal and Paediatric Mortality in Queensland, 1999
Queensland Council on Obstetric and Paediatric Morbidity and Mortality 61
Table 4.3: Perinatal mortality by birthweight and Indigenous status,Queensland 1999
Birthweight (g)<1000 1000-2499 2500+ Total1
IndigenousTotal births 44 277 2564 2885Total live births 23 273 2561 2857Total fetal deaths 21 4 3 28
Fetal death rate2 477.3 14.4 1.2 9.7Total neonatal deaths 11 4 5 20
Neonatal death rate3 478.3 14.7 2.0 7.0Total perinatal deaths 32 8 8 48
Perinatal mortality rate2 727.3 28.9 3.1 16.6non-IndigenousTotal births 405 2559 42894 45863Total live births 218 2486 42834 45543Total fetal deaths 187 73 60 320
Fetal death rate2 461.7 28.5 1.4 7.0Total neonatal deaths 91 27 32 150
Neonatal death rate3 417.4 10.9 0.7 3.3Total perinatal deaths 278 100 92 470
Perinatal mortality rate2 686.4 39.1 2.1 10.2Rate ratio 1.06 0.74 1.48 1.63
Source: Perinatal Data Collection, DSU, QH1 Includes 5 births of unknown birthweight.2 rate per 1000 births3 rate per 1000 live births
Clinical classification (QCPMC)In applying the Queensland Council Perinatal Mortality Classification (QCPMC), the pattern of causation ofperinatal death is seen to differ between Indigenous and non-Indigenous populations (Table 4.4). Thedominant category for Indigenous perinatal death was unexplained preterm birth, whereas for non-Indigenousinfants, the dominant category was congenital anomaly. It should be noted that this refers to the proportionalcontribution to the overall death rate for each category; the absolute rates were higher for the Indigenouspopulation for almost every category (Table 4.4, Figure 4.4). The numbers of deaths in one year are too small toanalyse by gestational age and birthweight but the major difference in mortality rates between the twopopulations relates to higher rates of unexplained preterm and unexplained antepartum death in the Indigenouspopulations. These are likely to be related to poverty and other aspects of socio-economic disadvantage which, toa large extent are outside the scope of conventional obstetrical and neonatal care. However this does notdiminish the importance of the need for better and more culturally appropriate antenatal and intrapartum care, asrecommended in the Queensland Health reports, Maternal Health Services in Aboriginal Communities(February 1998) and The Ngua Gundi Mother/ Child Project. There is sound evidence to support investment inhealth care during pregnancy as a means of breaking the cycle of poor perinatal and infant health, leading to poorchildhood, adolescent and adult health.
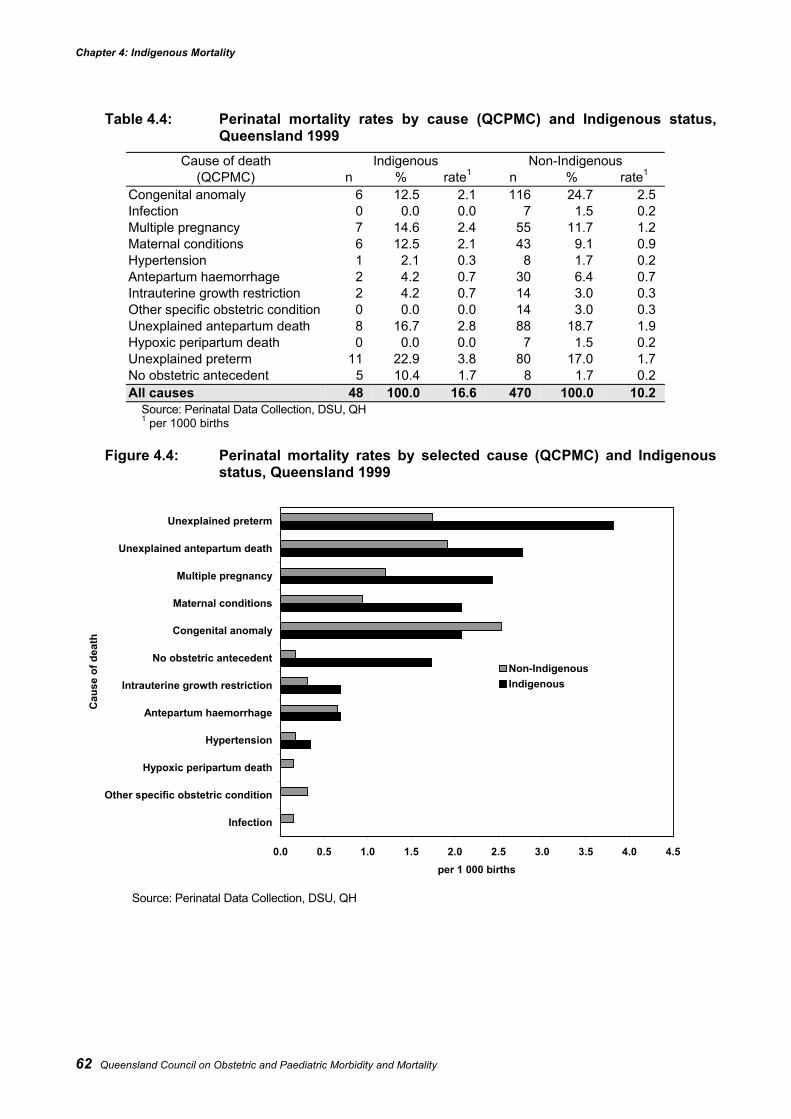
Chapter 4: Indigenous Mortality
62 Queensland Council on Obstetric and Paediatric Morbidity and Mortality
Table 4.4: Perinatal mortality rates by cause (QCPMC) and Indigenous status,Queensland 1999
Cause of death Indigenous Non-Indigenous(QCPMC) n % rate1 n % rate1
Congenital anomaly 6 12.5 2.1 116 24.7 2.5Infection 0 0.0 0.0 7 1.5 0.2Multiple pregnancy 7 14.6 2.4 55 11.7 1.2Maternal conditions 6 12.5 2.1 43 9.1 0.9Hypertension 1 2.1 0.3 8 1.7 0.2Antepartum haemorrhage 2 4.2 0.7 30 6.4 0.7Intrauterine growth restriction 2 4.2 0.7 14 3.0 0.3Other specific obstetric condition 0 0.0 0.0 14 3.0 0.3Unexplained antepartum death 8 16.7 2.8 88 18.7 1.9Hypoxic peripartum death 0 0.0 0.0 7 1.5 0.2Unexplained preterm 11 22.9 3.8 80 17.0 1.7No obstetric antecedent 5 10.4 1.7 8 1.7 0.2All causes 48 100.0 16.6 470 100.0 10.2
Source: Perinatal Data Collection, DSU, QH1 per 1000 births
Figure 4.4: Perinatal mortality rates by selected cause (QCPMC) and Indigenousstatus, Queensland 1999
Source: Perinatal Data Collection, DSU, QH
0.0 0.5 1.0 1.5 2.0 2.5 3.0 3.5 4.0 4.5
Infection
Other specific obstetric condition
Hypoxic peripartum death
Hypertension
Antepartum haemorrhage
Intrauterine growth restriction
No obstetric antecedent
Congenital anomaly
Maternal conditions
Multiple pregnancy
Unexplained antepartum death
Unexplained preterm
Cau
se o
f dea
th
per 1 000 births
Non-IndigenousIndigenous
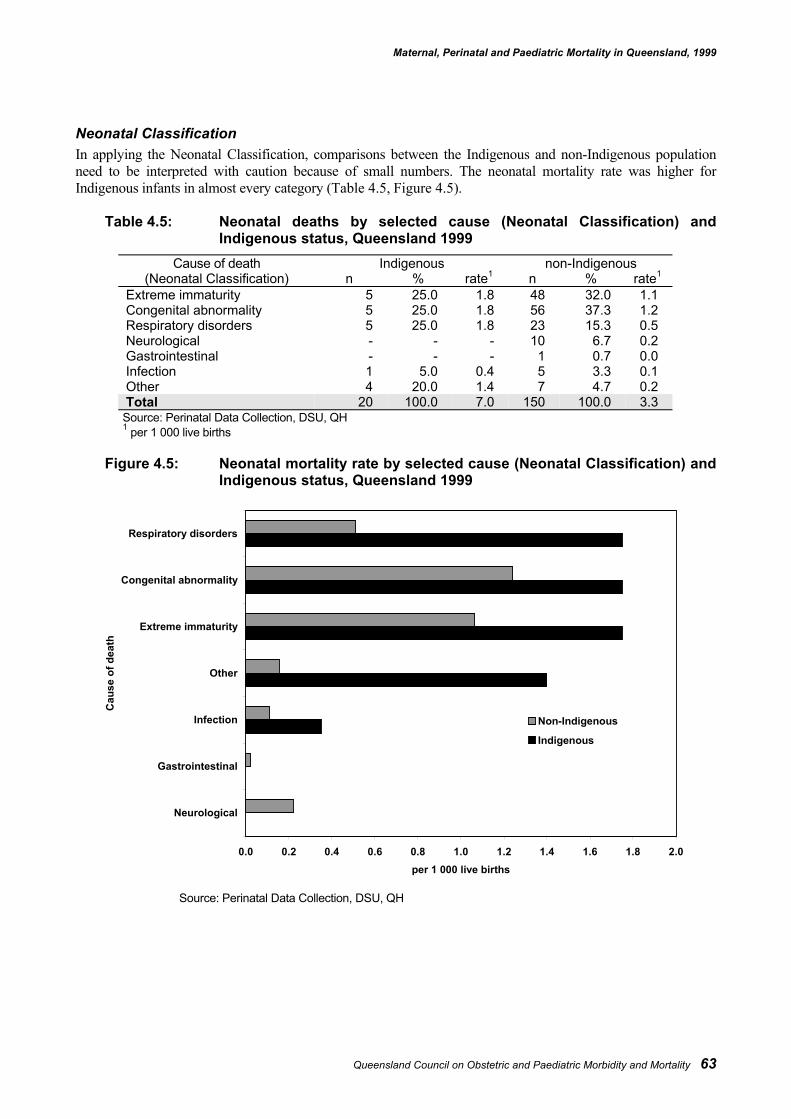
Maternal, Perinatal and Paediatric Mortality in Queensland, 1999
Queensland Council on Obstetric and Paediatric Morbidity and Mortality 63
Neonatal ClassificationIn applying the Neonatal Classification, comparisons between the Indigenous and non-Indigenous populationneed to be interpreted with caution because of small numbers. The neonatal mortality rate was higher forIndigenous infants in almost every category (Table 4.5, Figure 4.5).
Table 4.5: Neonatal deaths by selected cause (Neonatal Classification) andIndigenous status, Queensland 1999
Cause of death Indigenous non-Indigenous(Neonatal Classification) n % rate1 n % rate1
Extreme immaturity 5 25.0 1.8 48 32.0 1.1Congenital abnormality 5 25.0 1.8 56 37.3 1.2Respiratory disorders 5 25.0 1.8 23 15.3 0.5Neurological - - - 10 6.7 0.2Gastrointestinal - - - 1 0.7 0.0Infection 1 5.0 0.4 5 3.3 0.1Other 4 20.0 1.4 7 4.7 0.2Total 20 100.0 7.0 150 100.0 3.3
Source: Perinatal Data Collection, DSU, QH1 per 1 000 live births
Figure 4.5: Neonatal mortality rate by selected cause (Neonatal Classification) andIndigenous status, Queensland 1999
Source: Perinatal Data Collection, DSU, QH
0.0 0.2 0.4 0.6 0.8 1.0 1.2 1.4 1.6 1.8 2.0
Neurological
Gastrointestinal
Infection
Other
Extreme immaturity
Congenital abnormality
Respiratory disorders
Cau
se o
f dea
th
per 1 000 live births
Non-Indigenous
Indigenous
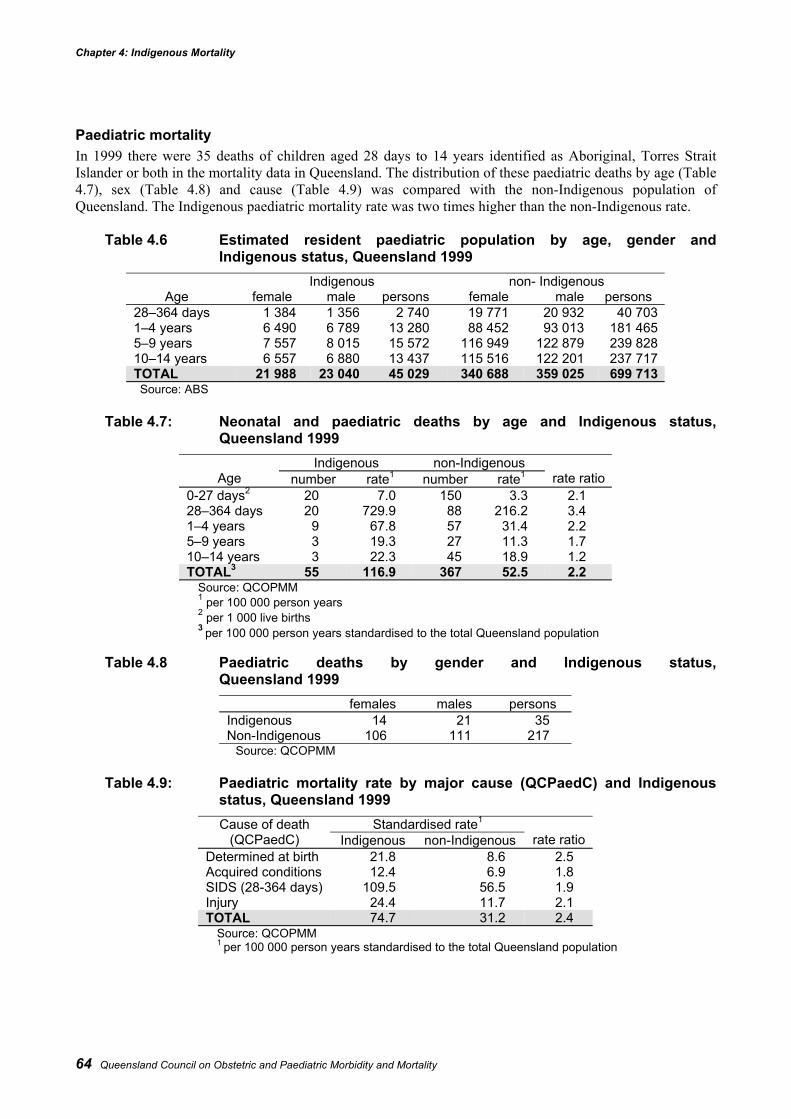
Chapter 4: Indigenous Mortality
64 Queensland Council on Obstetric and Paediatric Morbidity and Mortality
Paediatric mortalityIn 1999 there were 35 deaths of children aged 28 days to 14 years identified as Aboriginal, Torres StraitIslander or both in the mortality data in Queensland. The distribution of these paediatric deaths by age (Table4.7), sex (Table 4.8) and cause (Table 4.9) was compared with the non-Indigenous population ofQueensland. The Indigenous paediatric mortality rate was two times higher than the non-Indigenous rate.
Table 4.6 Estimated resident paediatric population by age, gender andIndigenous status, Queensland 1999
Indigenous non- IndigenousAge female male persons female male persons
28–364 days 1 384 1 356 2 740 19 771 20 932 40 7031–4 years 6 490 6 789 13 280 88 452 93 013 181 4655–9 years 7 557 8 015 15 572 116 949 122 879 239 82810–14 years 6 557 6 880 13 437 115 516 122 201 237 717TOTAL 21 988 23 040 45 029 340 688 359 025 699 713Source: ABS
Table 4.7: Neonatal and paediatric deaths by age and Indigenous status,Queensland 1999
Indigenous non-IndigenousAge number rate1 number rate1 rate ratio
0-27 days2 20 7.0 150 3.3 2.128–364 days 20 729.9 88 216.2 3.41–4 years 9 67.8 57 31.4 2.25–9 years 3 19.3 27 11.3 1.710–14 years 3 22.3 45 18.9 1.2TOTAL3 55 116.9 367 52.5 2.2
Source: QCOPMM1 per 100 000 person years2 per 1 000 live births3 per 100 000 person years standardised to the total Queensland population
Table 4.8 Paediatric deaths by gender and Indigenous status,Queensland 1999
females males personsIndigenous 14 21 35Non-Indigenous 106 111 217
Source: QCOPMM
Table 4.9: Paediatric mortality rate by major cause (QCPaedC) and Indigenousstatus, Queensland 1999
Standardised rate1Cause of death(QCPaedC) Indigenous non-Indigenous rate ratio
Determined at birth 21.8 8.6 2.5Acquired conditions 12.4 6.9 1.8SIDS (28-364 days) 109.5 56.5 1.9Injury 24.4 11.7 2.1TOTAL 74.7 31.2 2.4
Source: QCOPMM1 per 100 000 person years standardised to the total Queensland population
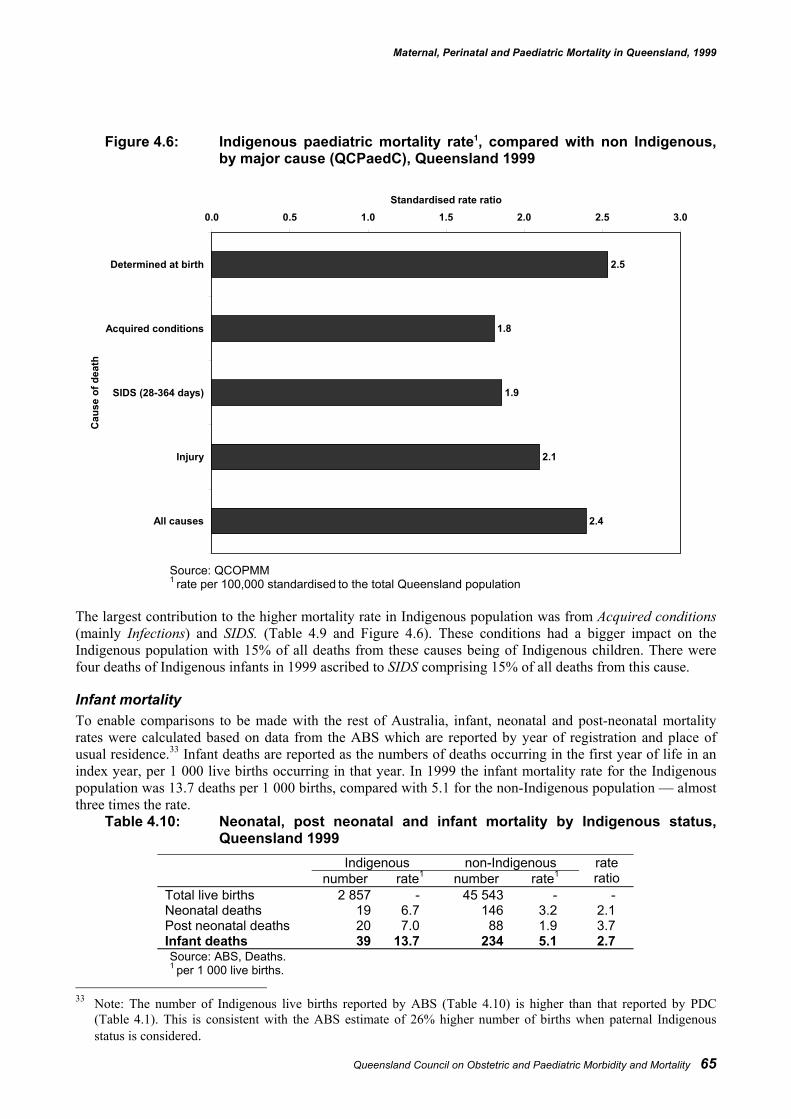
Maternal, Perinatal and Paediatric Mortality in Queensland, 1999
Queensland Council on Obstetric and Paediatric Morbidity and Mortality 65
Figure 4.6: Indigenous paediatric mortality rate1, compared with non Indigenous,by major cause (QCPaedC), Queensland 1999
Source: QCOPMM1 rate per 100,000 standardised to the total Queensland population
The largest contribution to the higher mortality rate in Indigenous population was from Acquired conditions(mainly Infections) and SIDS. (Table 4.9 and Figure 4.6). These conditions had a bigger impact on theIndigenous population with 15% of all deaths from these causes being of Indigenous children. There werefour deaths of Indigenous infants in 1999 ascribed to SIDS comprising 15% of all deaths from this cause.
Infant mortalityTo enable comparisons to be made with the rest of Australia, infant, neonatal and post-neonatal mortalityrates were calculated based on data from the ABS which are reported by year of registration and place ofusual residence.33 Infant deaths are reported as the numbers of deaths occurring in the first year of life in anindex year, per 1 000 live births occurring in that year. In 1999 the infant mortality rate for the Indigenouspopulation was 13.7 deaths per 1 000 births, compared with 5.1 for the non-Indigenous population — almostthree times the rate.
Table 4.10: Neonatal, post neonatal and infant mortality by Indigenous status,Queensland 1999
Indigenous non-Indigenousnumber rate1 number rate1
rateratio
Total live births 2 857 - 45 543 - -Neonatal deaths 19 6.7 146 3.2 2.1Post neonatal deaths 20 7.0 88 1.9 3.7Infant deaths 39 13.7 234 5.1 2.7Source: ABS, Deaths.1 per 1 000 live births.
33 Note: The number of Indigenous live births reported by ABS (Table 4.10) is higher than that reported by PDC
(Table 4.1). This is consistent with the ABS estimate of 26% higher number of births when paternal Indigenousstatus is considered.
2.5
1.8
1.9
2.1
2.4
0.0 0.5 1.0 1.5 2.0 2.5 3.0
Determined at birth
Acquired conditions
SIDS (28-364 days)
Injury
All causes
Cau
se o
f dea
th
Standardised rate ratio
Appendix 1: QCOPMM classification of perinatal deaths
66 Queensland Council on Obstetric and Paediatric Morbidity and Mortality
Appendix 1: QCOPMM classification of perinatal deaths (QCPMC)
1. Congenital anomaly1.1 Central nervous system1.2 Cardiovascular system1.3 Urinary tract1.4 Gastrointestinal tract1.5 Respiratory tract1.6 Chromosomal abnormality or recognised syndrome1.7 Metabolic1.8 Multiple anomalies1.9 Other
2. Infection2.1 Group B Streptococcus2.2 E Coli2.3 Syphilis2.4 Viral2.5 Other2.6 Unknown
3. Multiple pregnancy3.1 Twin-to-twin transfusion or “stuck twin” syndrome3.2 Other (includes IUGR, APH, hypertension, and no other explanation)
4. Maternal conditions4.1 Voluntary interruption of pregnancy (excluding congenital anomaly)4.2 Diabetes mellitus
4.2.1 Pre existing diabetes4.2.2 Gestational diabetes
4.3 Chronic renal disease4.4 Autoimmune (eg. Lupus)4.5 Substance abuse4.6 Other infection (eg. UTI)4.7 Other
5. Hypertension5.1 Pre eclampsia5.2 Essential5.3 Essential with superimposed pre eclampsia
6. Antepartum haemorrhage6.1 Placental abruption6.2 Placenta praevia6.3 Vasa praevia6.4 Undetermined
7. Intrauterine growth restriction7.1 Placental pathology7.2 No explanation
8. Other specific obstetric conditions8.1 Idiopathic hydrops8.2 Fetomaternal haemorrhage8.3 Cord complications (eg cord prolapse at term, true knot with evidence of occlusion)8.4 Uterine abnormalities / cervical incompetence etc.8.5 Haemolytic disease8.6 Birth trauma (>24 weeks gestation)8.7 Other (includes uterine rupture)
Maternal, Perinatal and Paediatric Mortality in Queensland, 1999
Queensland Council on Obstetric and Paediatric Morbidity and Mortality 67
9. Unexplained antepartum death
10. Hypoxic peripartum death (>24 weeks gestation)10.1 Intrapartum complications +/- “Fetal distress”10.2 No apparent cause
11. Unexplained preterm.11.1 Previous bleeding
11.1.1 Chorioamnionitis with membranes ruptured >12 hours11.1.2 Chorioamnionitis with membranes intact or membranes ruptured
<12 hours11.1.3 No chorioamnionitis
11.2 No previous bleeding11.2.1 Chorioamnionitis with membranes ruptured >12 hours11.2.2 Chorioamnionitis with membranes intact or membranes ruptured
<12 hours11.2.3 No chorioamnionitis
12. No obstetric antecedent12.1 SIDS12.2 Postnatally acquired infection in term infants12.3 Other (e.g MVA)
Classification of neonatal deaths
68 Queensland Council on Obstetric and Paediatric Morbidity and Mortality
Appendix 2: Classification of neonatal deaths
1 Extreme immaturity (<26 weeks gestation)1.1 Not resuscitated1.2 Unsuccessful resuscitation
2 Congenital abnormality
3 Respiratory disorders3.1 Respiratory Distress Syndrome
3.1.1 RDS alone3.1.2 RDS with pulmonary air leak3.1.3 RDS with pulmonary haemorrhage3.1.4 RDS with septicaemia3.1.5 RDS with IVH3.1.6 RDS with NEC
3.2 Meconium aspiration3.3 Primary persistent pulmonary hypertension3.4 Pulmonary hypoplasia3.5 Bronchopulmonary dysplasia3.6 Other
4 Neurological4.1 Hypoxic ischaemic encephalopathy/Perinatal asphyxia4.2 Intracranial haemorrhage4.3 Other
5 Gastrointestinal5.1 Necrotising enterocolitis5.2 Other
6 Infection6.1 Congenital bacterial6.2 Congenital viral6.3 Acquired bacterial6.4 Acquired viral6.5 Acquired fungal6.6 Other
7 Other7.1 SIDS7.2 Idiopathic hydrops fetalis7.3 Birth trauma7.4 Accident, poisoning or violence (postnatal)7.5 Haemorrhage (includes twin to twin transfusion)7.6 Unknown/unexplained7.7 Other
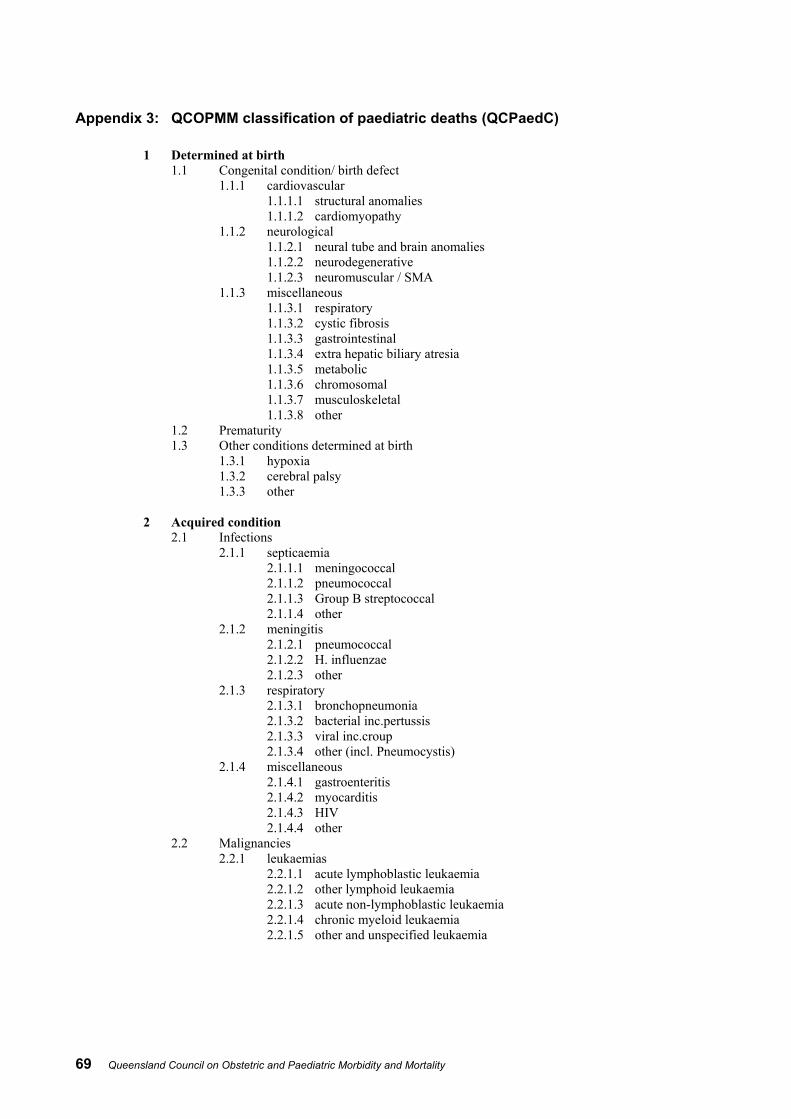
69 Queensland Council on Obstetric and Paediatric Morbidity and Mortality
Appendix 3: QCOPMM classification of paediatric deaths (QCPaedC)
1 Determined at birth1.1 Congenital condition/ birth defect
1.1.1 cardiovascular1.1.1.1 structural anomalies1.1.1.2 cardiomyopathy
1.1.2 neurological1.1.2.1 neural tube and brain anomalies1.1.2.2 neurodegenerative1.1.2.3 neuromuscular / SMA
1.1.3 miscellaneous1.1.3.1 respiratory1.1.3.2 cystic fibrosis1.1.3.3 gastrointestinal1.1.3.4 extra hepatic biliary atresia1.1.3.5 metabolic1.1.3.6 chromosomal1.1.3.7 musculoskeletal1.1.3.8 other
1.2 Prematurity1.3 Other conditions determined at birth
1.3.1 hypoxia1.3.2 cerebral palsy1.3.3 other
2 Acquired condition2.1 Infections
2.1.1 septicaemia2.1.1.1 meningococcal2.1.1.2 pneumococcal2.1.1.3 Group B streptococcal2.1.1.4 other
2.1.2 meningitis2.1.2.1 pneumococcal2.1.2.2 H. influenzae2.1.2.3 other
2.1.3 respiratory2.1.3.1 bronchopneumonia2.1.3.2 bacterial inc.pertussis2.1.3.3 viral inc.croup2.1.3.4 other (incl. Pneumocystis)
2.1.4 miscellaneous2.1.4.1 gastroenteritis2.1.4.2 myocarditis2.1.4.3 HIV2.1.4.4 other
2.2 Malignancies2.2.1 leukaemias
2.2.1.1 acute lymphoblastic leukaemia2.2.1.2 other lymphoid leukaemia2.2.1.3 acute non-lymphoblastic leukaemia2.2.1.4 chronic myeloid leukaemia2.2.1.5 other and unspecified leukaemia
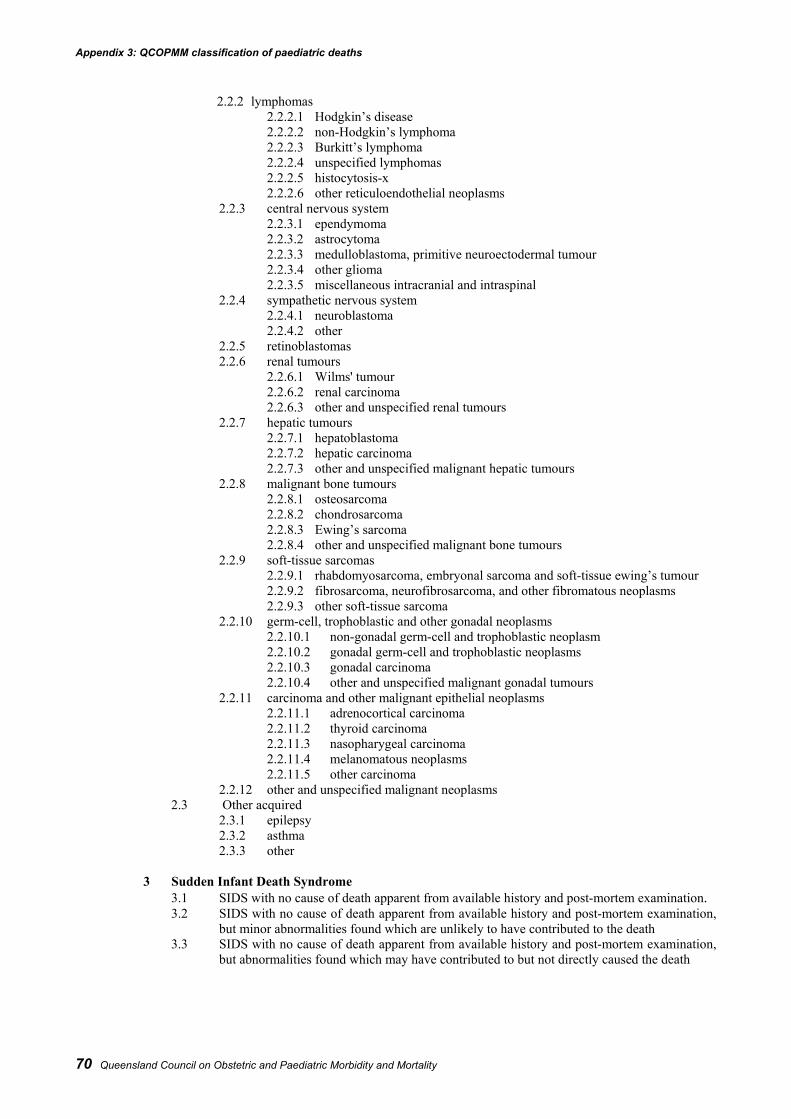
Appendix 3: QCOPMM classification of paediatric deaths
70 Queensland Council on Obstetric and Paediatric Morbidity and Mortality
2.2.2 lymphomas2.2.2.1 Hodgkin’s disease2.2.2.2 non-Hodgkin’s lymphoma2.2.2.3 Burkitt’s lymphoma2.2.2.4 unspecified lymphomas2.2.2.5 histocytosis-x2.2.2.6 other reticuloendothelial neoplasms
2.2.3 central nervous system2.2.3.1 ependymoma2.2.3.2 astrocytoma2.2.3.3 medulloblastoma, primitive neuroectodermal tumour2.2.3.4 other glioma2.2.3.5 miscellaneous intracranial and intraspinal
2.2.4 sympathetic nervous system2.2.4.1 neuroblastoma2.2.4.2 other
2.2.5 retinoblastomas2.2.6 renal tumours
2.2.6.1 Wilms' tumour2.2.6.2 renal carcinoma2.2.6.3 other and unspecified renal tumours
2.2.7 hepatic tumours2.2.7.1 hepatoblastoma2.2.7.2 hepatic carcinoma2.2.7.3 other and unspecified malignant hepatic tumours
2.2.8 malignant bone tumours2.2.8.1 osteosarcoma2.2.8.2 chondrosarcoma2.2.8.3 Ewing’s sarcoma2.2.8.4 other and unspecified malignant bone tumours
2.2.9 soft-tissue sarcomas2.2.9.1 rhabdomyosarcoma, embryonal sarcoma and soft-tissue ewing’s tumour2.2.9.2 fibrosarcoma, neurofibrosarcoma, and other fibromatous neoplasms2.2.9.3 other soft-tissue sarcoma
2.2.10 germ-cell, trophoblastic and other gonadal neoplasms2.2.10.1 non-gonadal germ-cell and trophoblastic neoplasm2.2.10.2 gonadal germ-cell and trophoblastic neoplasms2.2.10.3 gonadal carcinoma2.2.10.4 other and unspecified malignant gonadal tumours
2.2.11 carcinoma and other malignant epithelial neoplasms2.2.11.1 adrenocortical carcinoma2.2.11.2 thyroid carcinoma2.2.11.3 nasopharygeal carcinoma2.2.11.4 melanomatous neoplasms2.2.11.5 other carcinoma
2.2.12 other and unspecified malignant neoplasms2.3 Other acquired
2.3.1 epilepsy2.3.2 asthma2.3.3 other
3 Sudden Infant Death Syndrome3.1 SIDS with no cause of death apparent from available history and post-mortem examination.3.2 SIDS with no cause of death apparent from available history and post-mortem examination,
but minor abnormalities found which are unlikely to have contributed to the death3.3 SIDS with no cause of death apparent from available history and post-mortem examination,
but abnormalities found which may have contributed to but not directly caused the death
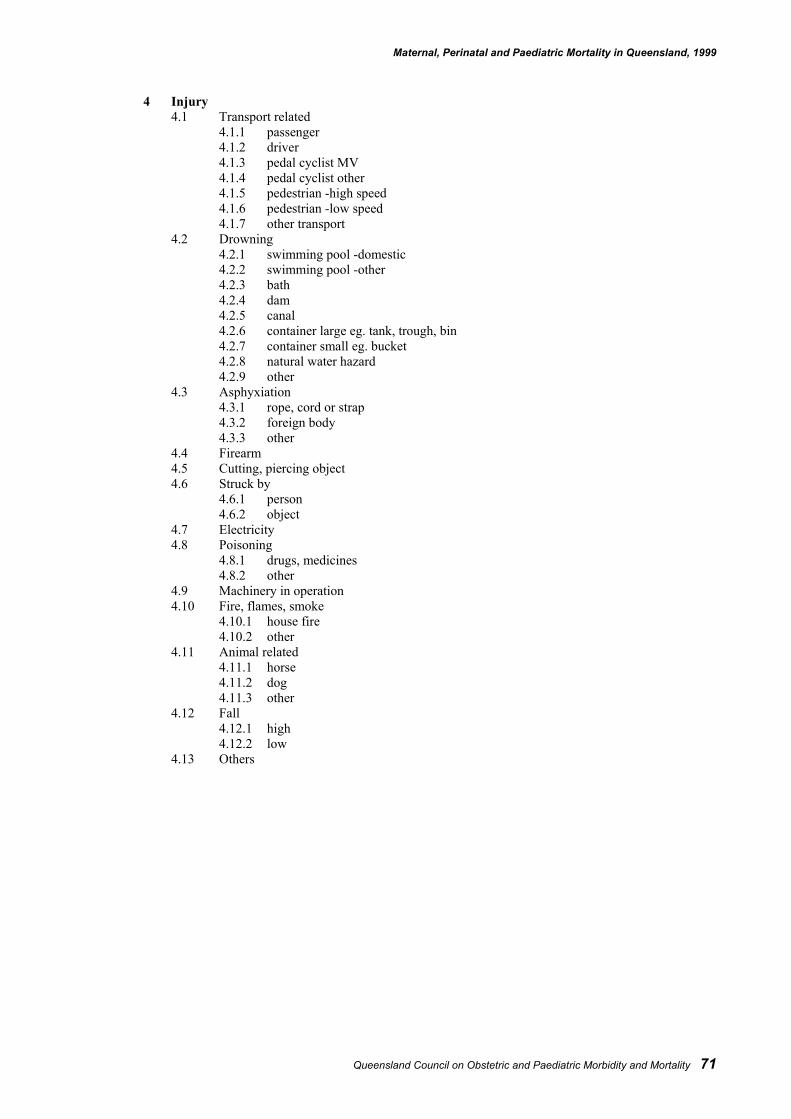
Maternal, Perinatal and Paediatric Mortality in Queensland, 1999
Queensland Council on Obstetric and Paediatric Morbidity and Mortality 71
4 Injury4.1 Transport related
4.1.1 passenger4.1.2 driver4.1.3 pedal cyclist MV4.1.4 pedal cyclist other4.1.5 pedestrian -high speed4.1.6 pedestrian -low speed4.1.7 other transport
4.2 Drowning4.2.1 swimming pool -domestic4.2.2 swimming pool -other4.2.3 bath4.2.4 dam4.2.5 canal4.2.6 container large eg. tank, trough, bin4.2.7 container small eg. bucket4.2.8 natural water hazard4.2.9 other
4.3 Asphyxiation4.3.1 rope, cord or strap4.3.2 foreign body4.3.3 other
4.4 Firearm4.5 Cutting, piercing object4.6 Struck by
4.6.1 person4.6.2 object
4.7 Electricity4.8 Poisoning
4.8.1 drugs, medicines4.8.2 other
4.9 Machinery in operation4.10 Fire, flames, smoke
4.10.1 house fire4.10.2 other
4.11 Animal related4.11.1 horse4.11.2 dog4.11.3 other
4.12 Fall4.12.1 high4.12.2 low
4.13 Others
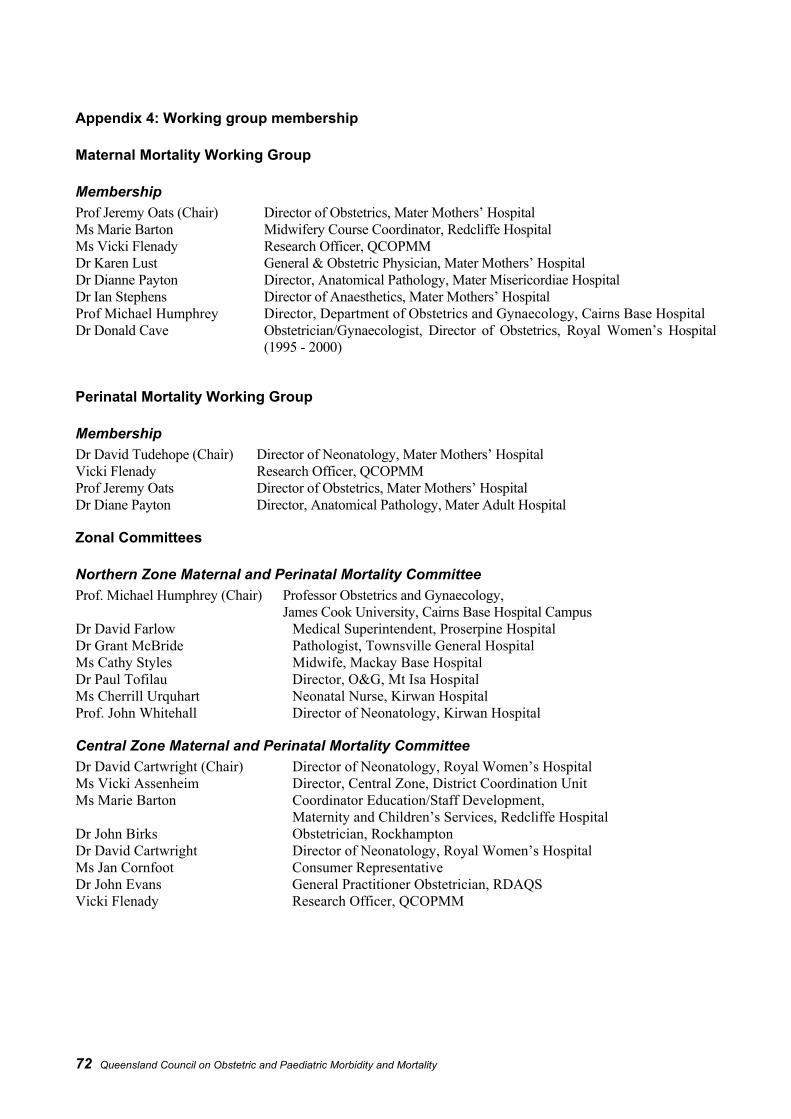
72 Queensland Council on Obstetric and Paediatric Morbidity and Mortality
Appendix 4: Working group membership
Maternal Mortality Working Group
MembershipProf Jeremy Oats (Chair) Director of Obstetrics, Mater Mothers’ HospitalMs Marie Barton Midwifery Course Coordinator, Redcliffe HospitalMs Vicki Flenady Research Officer, QCOPMMDr Karen Lust General & Obstetric Physician, Mater Mothers’ HospitalDr Dianne Payton Director, Anatomical Pathology, Mater Misericordiae HospitalDr Ian Stephens Director of Anaesthetics, Mater Mothers’ HospitalProf Michael Humphrey Director, Department of Obstetrics and Gynaecology, Cairns Base HospitalDr Donald Cave Obstetrician/Gynaecologist, Director of Obstetrics, Royal Women’s Hospital
(1995 - 2000)
Perinatal Mortality Working Group
MembershipDr David Tudehope (Chair) Director of Neonatology, Mater Mothers’ HospitalVicki Flenady Research Officer, QCOPMMProf Jeremy Oats Director of Obstetrics, Mater Mothers’ HospitalDr Diane Payton Director, Anatomical Pathology, Mater Adult Hospital
Zonal Committees
Northern Zone Maternal and Perinatal Mortality CommitteeProf. Michael Humphrey (Chair) Professor Obstetrics and Gynaecology,
James Cook University, Cairns Base Hospital CampusDr David Farlow Medical Superintendent, Proserpine HospitalDr Grant McBride Pathologist, Townsville General HospitalMs Cathy Styles Midwife, Mackay Base HospitalDr Paul Tofilau Director, O&G, Mt Isa HospitalMs Cherrill Urquhart Neonatal Nurse, Kirwan HospitalProf. John Whitehall Director of Neonatology, Kirwan Hospital
Central Zone Maternal and Perinatal Mortality CommitteeDr David Cartwright (Chair) Director of Neonatology, Royal Women’s HospitalMs Vicki Assenheim Director, Central Zone, District Coordination UnitMs Marie Barton Coordinator Education/Staff Development,
Maternity and Children’s Services, Redcliffe HospitalDr John Birks Obstetrician, RockhamptonDr David Cartwright Director of Neonatology, Royal Women’s HospitalMs Jan Cornfoot Consumer RepresentativeDr John Evans General Practitioner Obstetrician, RDAQSVicki Flenady Research Officer, QCOPMM
Maternal, Perinatal and Paediatric Mortality in Queensland, 1999
Queensland Council on Obstetric and Paediatric Morbidity and Mortality 73
Southern Zone Maternal and Perinatal Mortality CommitteeProf David Tudehope (Chair) Director of Neonatology, Mater Mothers’ HospitalMs Ann Brosnan Clinical Nurse Manager, Sunnybank Private HospitalDr Yogesh Chadha Director, Obstetrics and Gynaecology, Toowoomba HospitalDr Deryck Charters Director, Obstetrics and Gynaecology, Gold Coast HospitalMs Freda Coorey CNC, SCN, Toowoomba HospitalVicki Flenady Research Officer, QCOPMMDr John Gavranich Director Paediatrics, Ipswich HospitalDr Susan Moloney Director of Paediatrics, Gold Coast HospitalProf Jeremy Oats Director, Obstetrics and Gynaecology,
Mater Mothers’ HospitalDr Lucinda Pallis Staff Specialist, Obstetrics and Gynaecology,
Gold Coast HospitalDr Diane Payton Director, Anatomical Pathology, Mater HospitalMs Barbara Soong Maternal Fetal Medicine, Mater Mothers’ HospitalDr Thomas Tait Director, Obstetrics and Gynaecology,
Gold Coast HospitalDr Grahame Vaughan Director of Obstetric and Gynaecology, Redland HospitalDr Stephen Withers Director of Paediatrics, Logan HospitalDr Paul Woodgate Neonatologist, Mater Mothers’ Hospital
Paediatric Mortality Working Group
MembershipMs Kathleen Brookes Chief Executive Officer, SIDS QueenslandProf Paul Colditz Neonatologist, Director, Perinatal Research Centre, Royal Women’s HospitalDr Julie McEniery Director, Paediatric Intensive Care, Royal Children’s HospitalDr Diane Payton Director, Anatomical Pathology, Mater Adult HospitalDr Robert Pitt Director, Emergency Department, Mater Children’s Hospital; Director, QISUDr Phil Sargent Paediatric Intensivist, Mater Children’s HospitalDr Paul Woodgate Neonatologist, Mater Mothers’ Hospital
74 Queensland Council on Obstetric and Paediatric Morbidity and Mortality
Acknowledgments
Apart from those whose assistance has already been acknowledged in the body of the report, the Councilwould like to thank the following people and organisations for their assistance and advice in preparing thisreport:
Associate Professor Charles Naylor, Chief Pathologist, Queensland Health Scientific ServicesPeter Burke, Health Statistics Unit, Australian Bureau of StatisticsCecily Dobson, Australian Paediatric Cancer RegistryNeil Gardiner, Manager, Client Services, Health Information Centre, Queensland HealthLynn Collins, Office of the Government Statistician, QueenslandWendy Ryan, Health Information Centre, Queensland HealthDes Tanner, Registrar General of Births, Deaths and Marriages, QueenslandJanine Brookes, John Tonge Centre for Forensic Sciences, Queensland HealthLynn Barratt, Department of JusticeQueensland’s CoronersJoan Webster, Nursing Director, Research, Royal Brisbane and Royal Women’s Hospitals