Embed Size (px)
DESCRIPTION
Tree Diagrams. Slideshow 58, Mathematics Mr Richard Sasaki, Room 307. Review how tree diagrams appear Draw tree diagrams for three events Introduce tree diagrams where events are dependent. Objectives. Tree Diagrams. - PowerPoint PPT Presentation
Citation preview

Tree Diagrams
Slideshow 58, MathematicsMr Richard Sasaki, Room 307

Objectives
• Review how tree diagrams appear• Draw tree diagrams for three events• Introduce tree diagrams where events are
dependent
Tree Diagrams
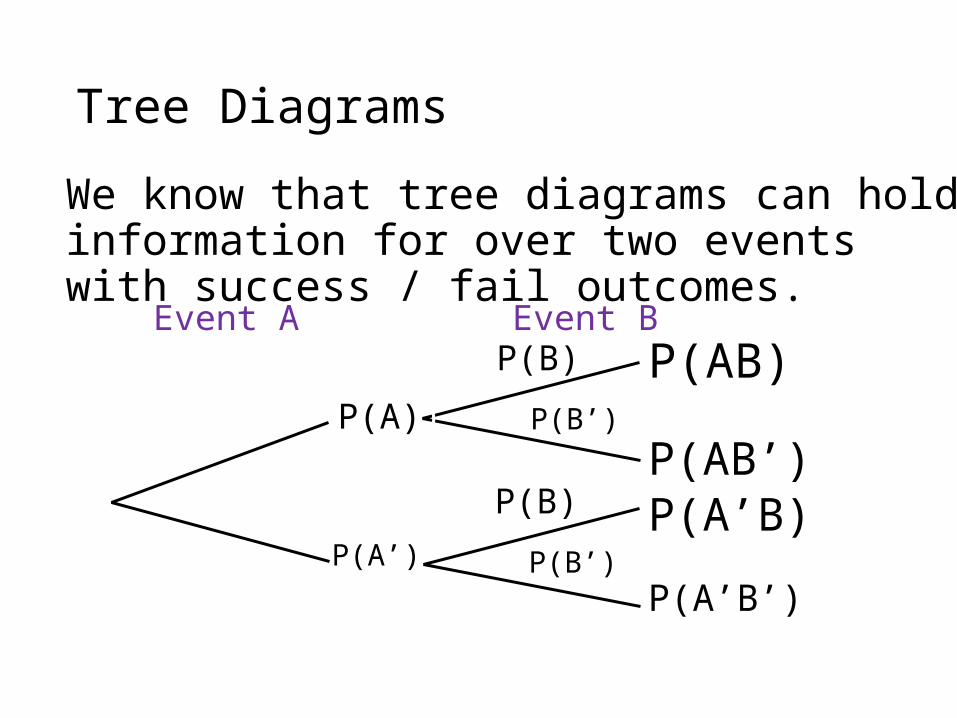
We know that tree diagrams can hold information for over two events with success / fail outcomes.
Event A Event B
P(A))
P(A’)
P(B)P(B’)
P(B)P(B’)
P(AB)
P(AB’)P(A’B)
P(A’B’)
Tree Diagrams
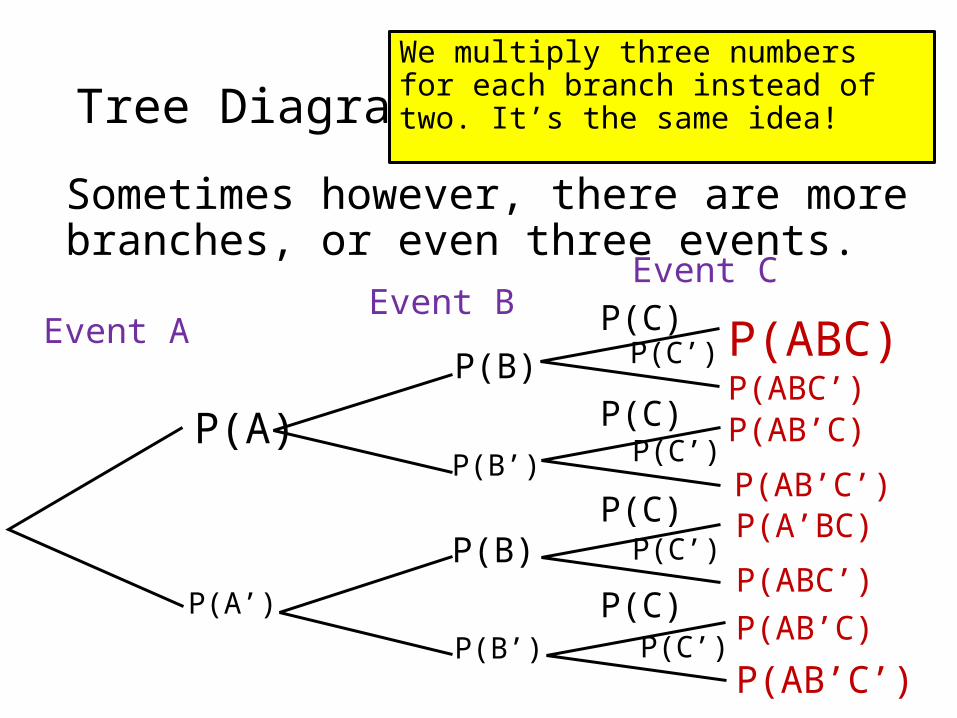
Sometimes however, there are more branches, or even three events.
Event AEvent B
P(A)
P(A’)
P(B)
P(B’)
P(B)
P(B’)
Event CP(C)
P(C)
P(C)
P(C)
P(C’)
P(C’)
P(C’)
P(C’)
P(ABC)P(ABC’)P(AB’C)
P(AB’C’)P(A’BC)
P(ABC’)P(AB’C)
P(AB’C’)
We multiply three numbers for each branch instead of two. It’s the same idea!

Answers - Easy
Coin A Coin BCoin C
P(A)
P(A’)
P(B)
P(B’)
P(B)
P(B’)
P(C)P(C’)P(C)P(C’)P(C)P(C’)P(C)P(C’)
=
= =
= =
= =
=
𝑃 (𝐴∩𝐵∩𝐶)𝑃 (𝐴∩𝐵∩𝐶 ′ )𝑃 (𝐴∩𝐵 ′ ∩𝐶 )𝑃 (𝐴∩𝐵 ′ ∩𝐶 ′)𝑃 (𝐴 ′ ∩𝐵∩𝐶 )𝑃 (𝐴 ′ ∩𝐵∩𝐶 ′)𝑃 (𝐴 ′ ∩𝐵 ′ ∩𝐶 )𝑃 (𝐴 ′ ∩𝐵 ′ ∩𝐶 ′)
Event A Event BEvent C
P(A)
P(A’)
P(B)
P(B’)
P(B)
P(B’)
P(C)P(C’)P(C)P(C’)P(C)P(C’)P(C)P(C’)
12
12
1212
12
12
1212121212121212
13
13
13
23
23
23
13
13
13
13
23
23
23
23
P(A)=
P(A)=
P()= or
P(A’)=
P(1 at least twice)=
1 - P(A’)=
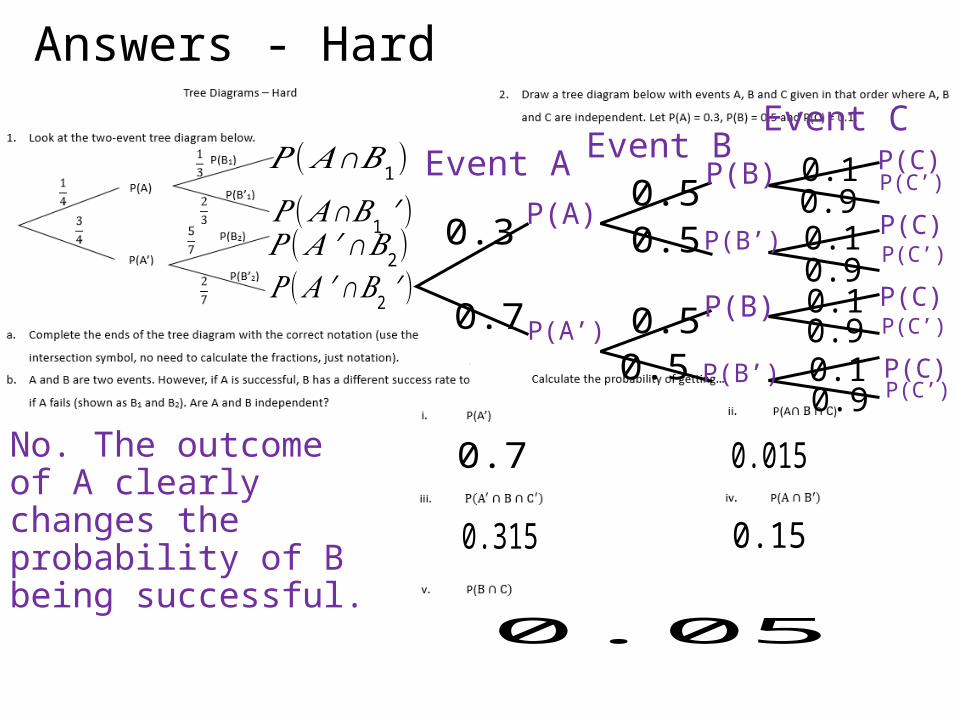
Answers - Hard
𝑃 (𝐴∩𝐵1)𝑃 (𝐴∩𝐵1 ′ )𝑃 (𝐴 ′ ∩𝐵2)𝑃 (𝐴 ′ ∩𝐵2 ′)
No. The outcome of A clearly changes the probability of B being successful.
Event A Event BEvent C
P(A)
P(A’)
P(B)
P(B’)
P(B)
P(B’)
P(C)P(C’)P(C)P(C’)P(C)P(C’)P(C)P(C’)
0.30.5
0.50.7
0.5
0.5
0.1
0.1
0.1
0.1
0.9
0.9
0.9
0.9
0.7 0.015
0.315 0.15
0.05

Dependence
What is dependence?Dependence is the opposite of independence. It means that two (or more) things do affect each others outcome.
Event A Event B
P(A))
P(A’)
0.4
0.6
0.9
0.10.2
0.8
In this example, we can see if A is successful, B is likely to be successful too. But if A fails, B is likely to fail as well.
Conditional Probability
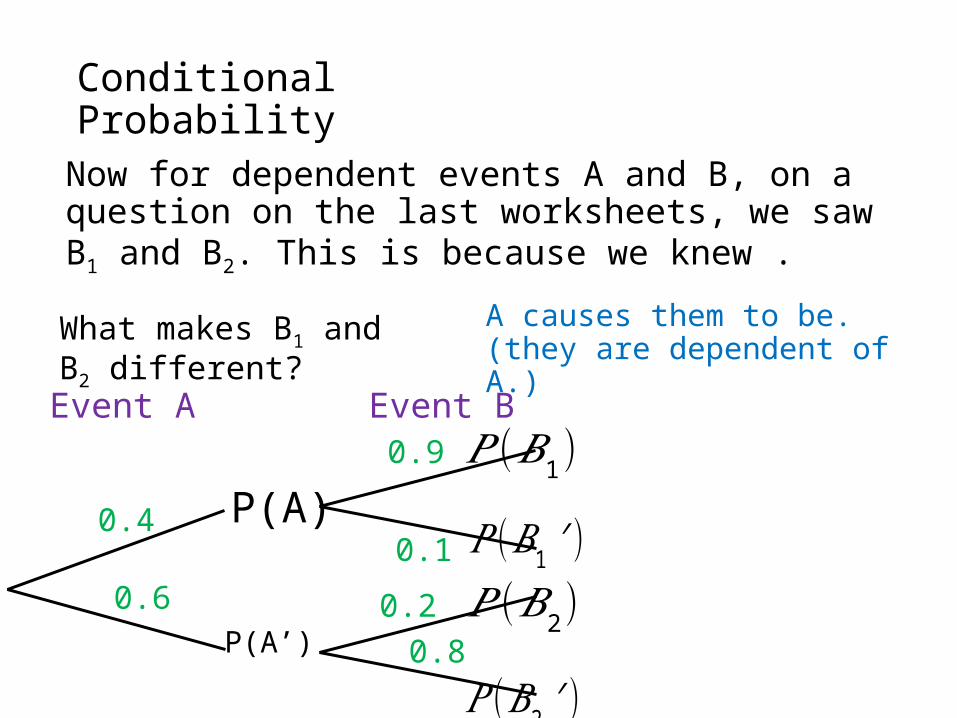
Now for dependent events A and B, on a question on the last worksheets, we saw B1 and B2. This is because we knew .
Event A Event B
P(A)
P(A’)
0.4
0.6
0.9
0.10.2
0.8
𝑃 (𝐵1)
𝑃 (𝐵1 ′)𝑃 (𝐵2)
𝑃 (𝐵2 ′)
What makes B1 and B2 different?
A causes them to be. (they are dependent of A.)
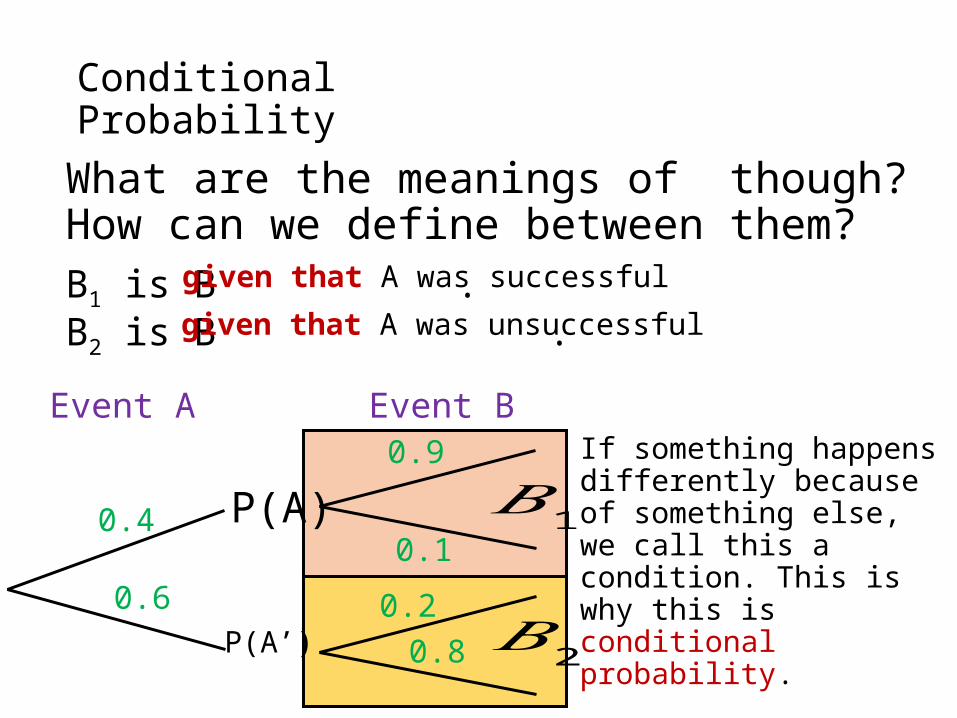
Conditional Probability
What are the meanings of though? How can we define between them?
Event A Event B
P(A)
P(A’)
0.4
0.6
0.9
0.10.2
0.8
𝐵1
𝐵2
B1 is B .given that A was successfulB2 is B .given that A was unsuccessful
If something happens differently because of something else, we call this a condition. This is why this is conditional probability.
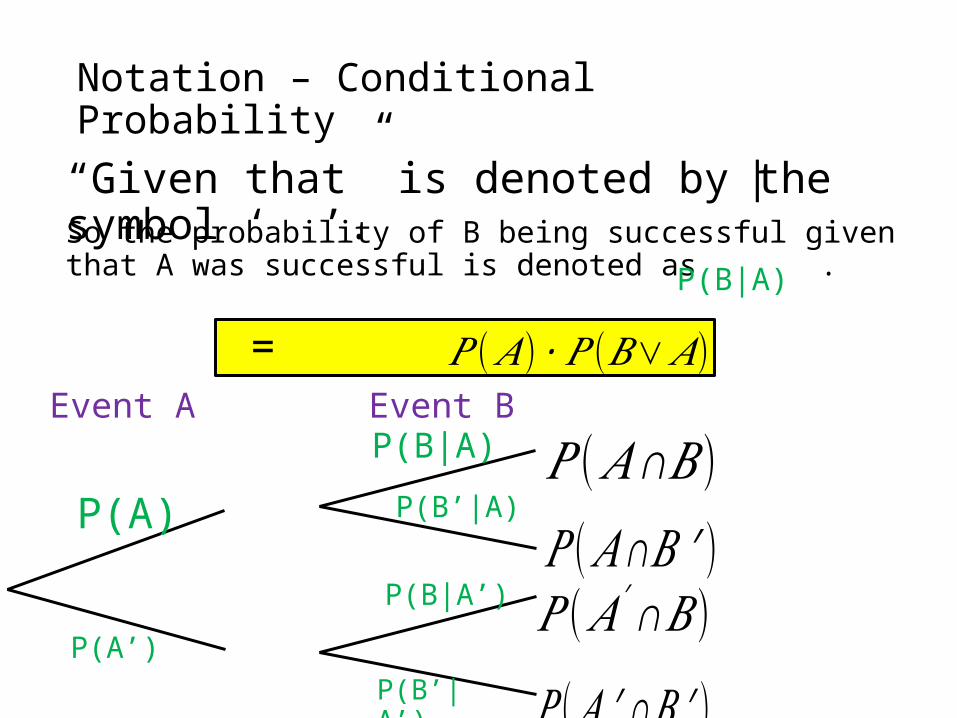
Notation – Conditional Probability
“Given that” is denoted by the symbol ‘ ’.
Event A Event B
P(A)
P(A’)
|So the probability of B being successful given that A was successful is denoted as .P(B|A)
P(B|A)P(B’|A)
P(B|A’)
P(B’|A’)
𝑃 (𝐴∩𝐵)𝑃 (𝐴∩𝐵 ′ )𝑃 (𝐴′∩𝐵)
𝑃 (𝐴 ′ ∩𝐵 ′)
= 𝑃 (𝐴)∙𝑃 (𝐵∨𝐴)
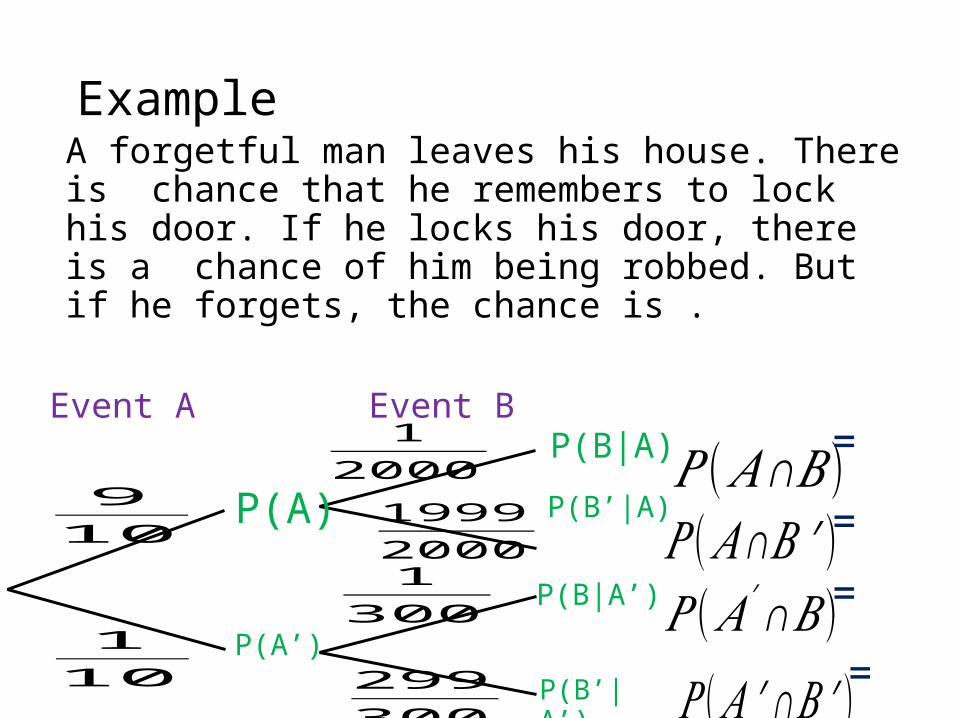
ExampleA forgetful man leaves his house. There is chance that he remembers to lock his door. If he locks his door, there is a chance of him being robbed. But if he forgets, the chance is .
Event A Event B
P(A)
P(A’)
P(B|A)P(B’|A)
P(B|A’)
P(B’|A’)
𝑃 (𝐴∩𝐵)𝑃 (𝐴∩𝐵 ′ )𝑃 (𝐴′∩𝐵)
𝑃 (𝐴 ′ ∩𝐵 ′)
910
110
12000199920001300
299300
=
=
=
=
Event A Event B
P(A)
P(A’)
P(B|A)
P(B’|A)
P(B|A’)
P(B’|A’)
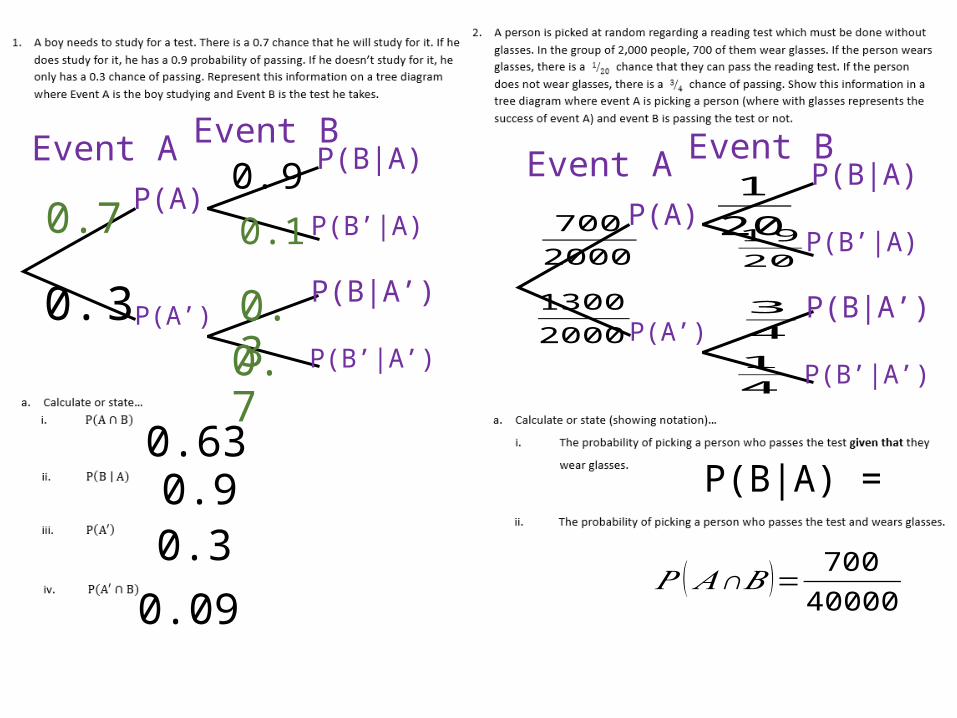
0.7
0.3
0.90.1
0.30.7
0.630.90.3
0.09
Event A Event B
P(A)
P(A’)
P(B|A)
P(B’|A)
P(B|A’)
P(B’|A’)
7002000
13002000
1201920
34
14
P(B|A) =
𝑃 ( 𝐴∩𝐵 )= 70040000

Event A Event B
P(A)
P(A’)
P(B|A)
P(B’|A)
P(B|A’)
P(B’|A’)
0.95
0.05
0.70.3
0.350.65
0.285A
0.050.3
1 - 1 – 0.0325 = 0.9675
Event A Event B
P(A)
P(A’)
P(B|A)
P(B’|A)
P(B|A’)
P(B’|A’)
3050
2050
210009981000
250
4850
9602500𝐵𝐴250