Embed Size (px)
Citation preview
Page 1
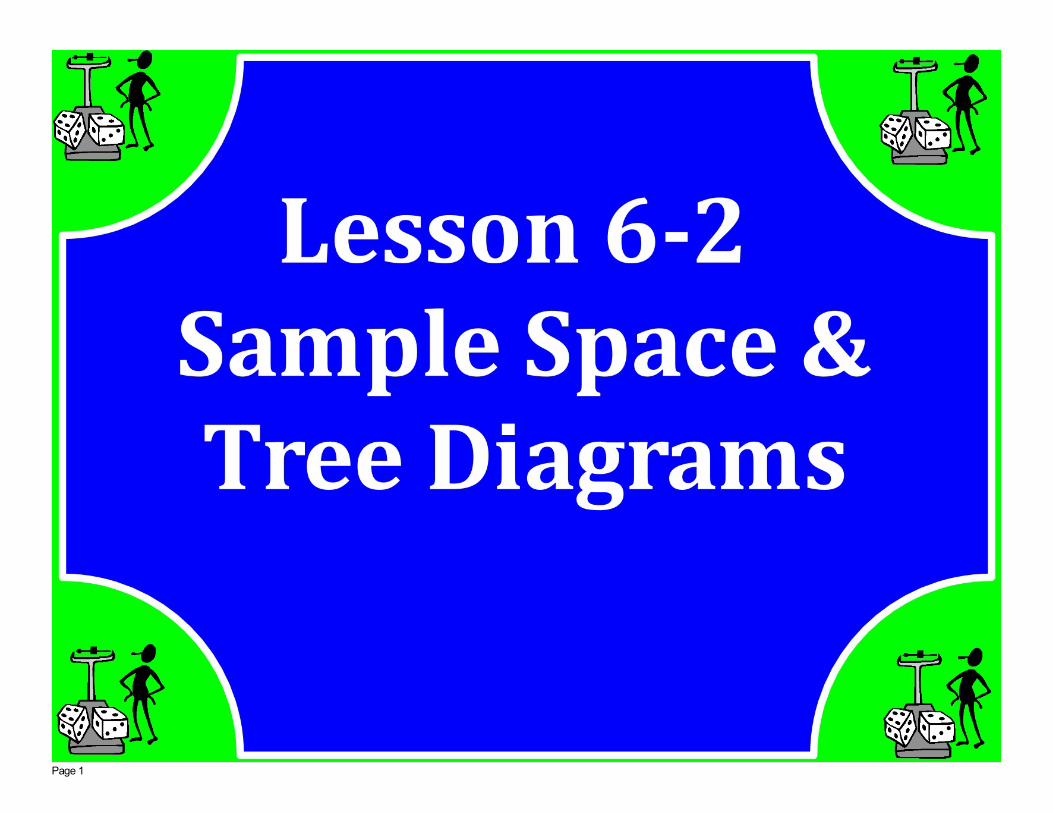
Page 2
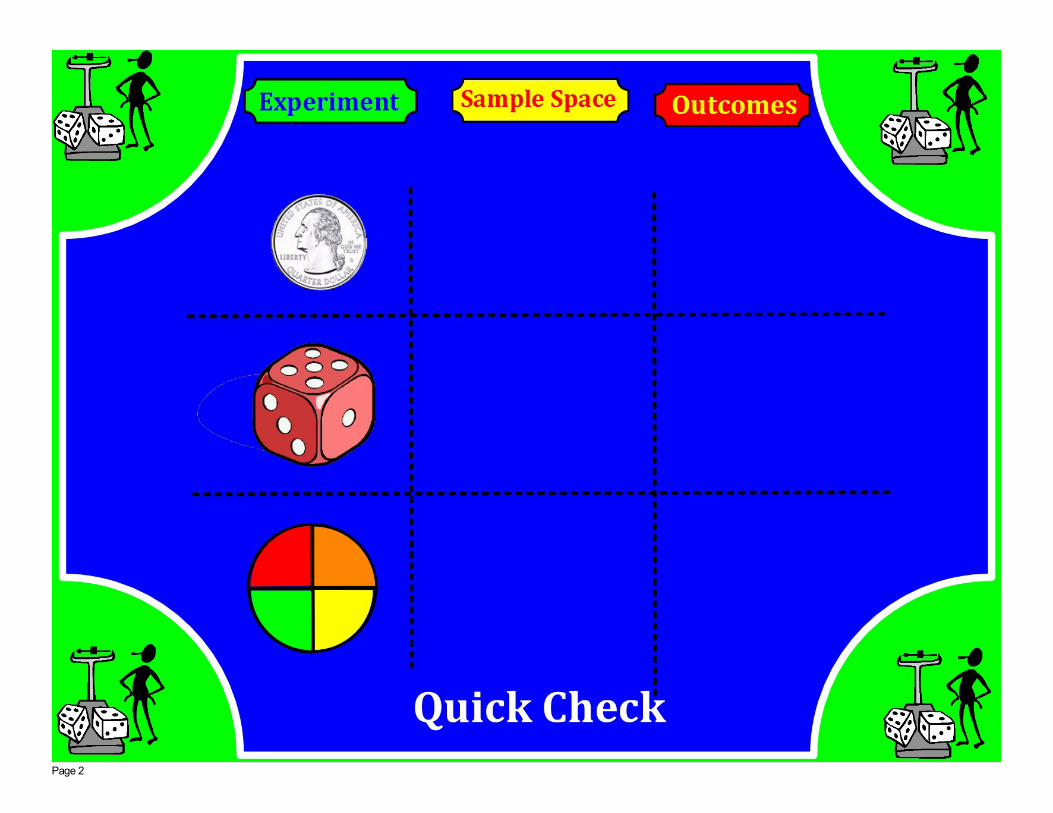
Page 3

Page 4
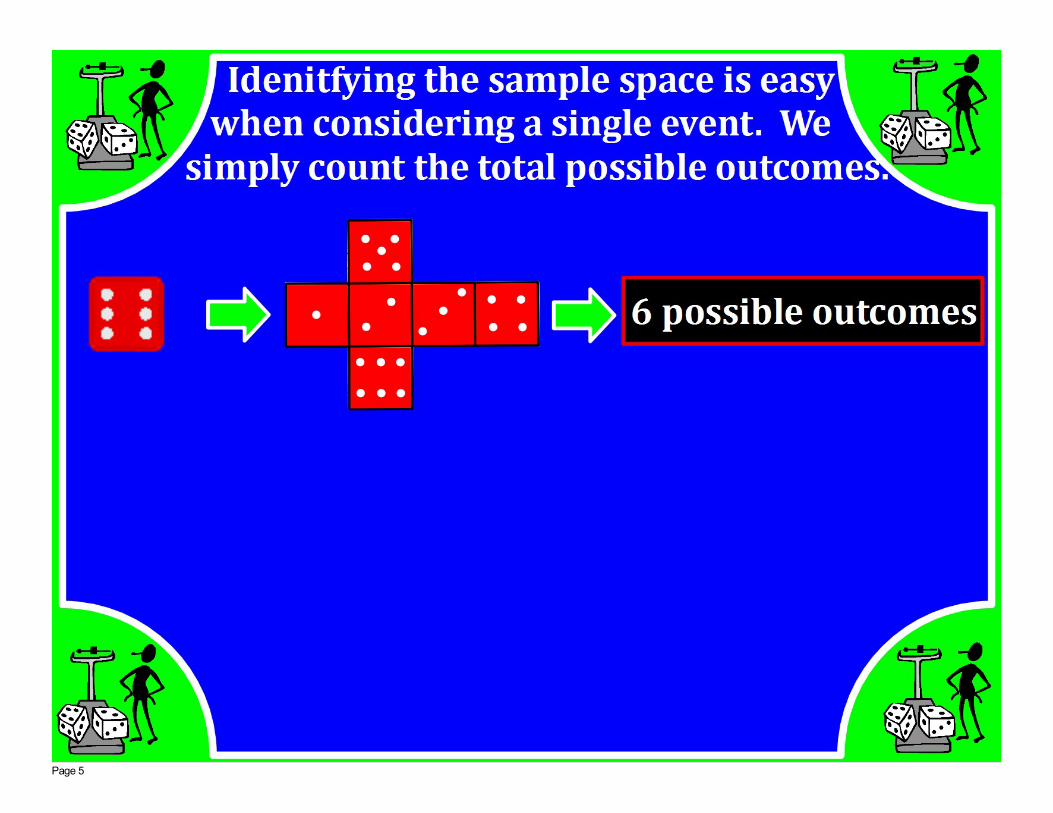
Page 5
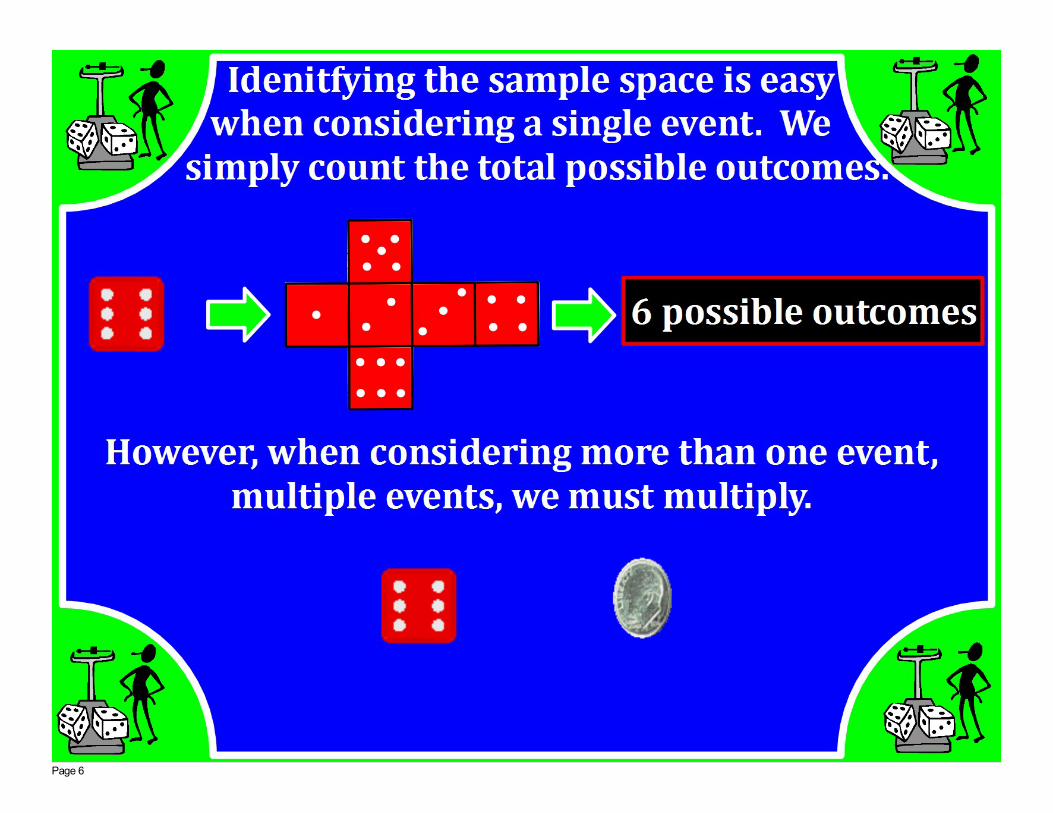
Page 6
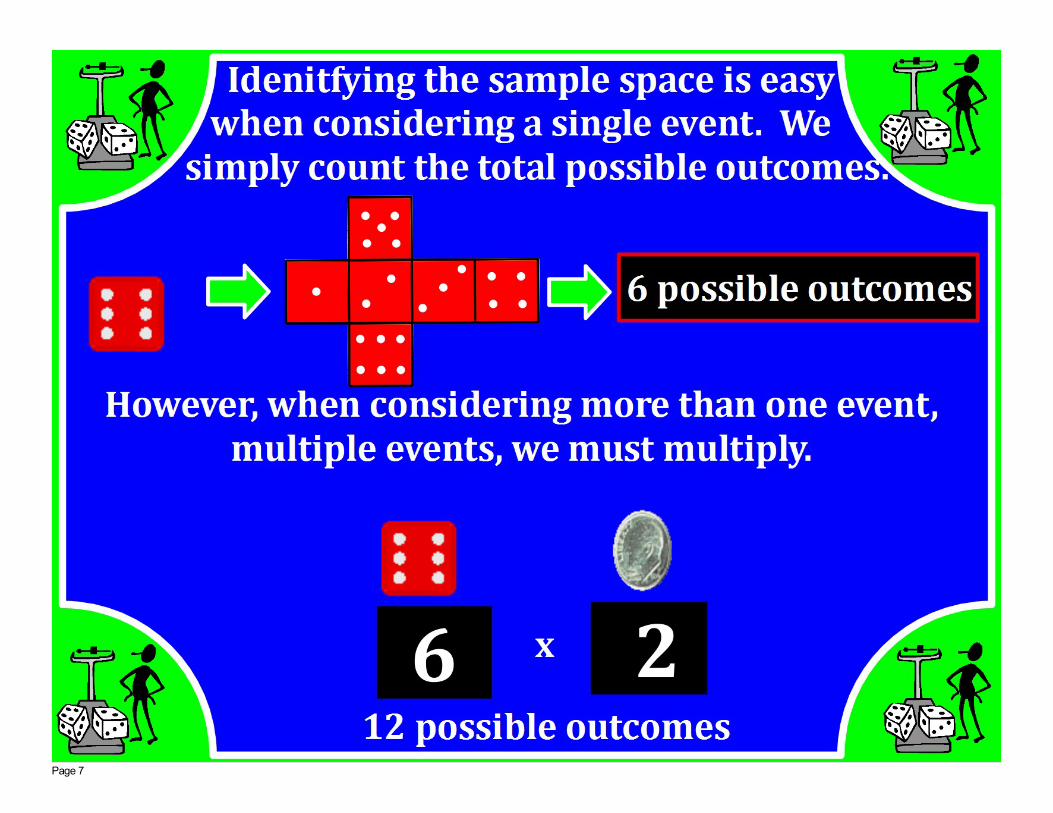
Page 7
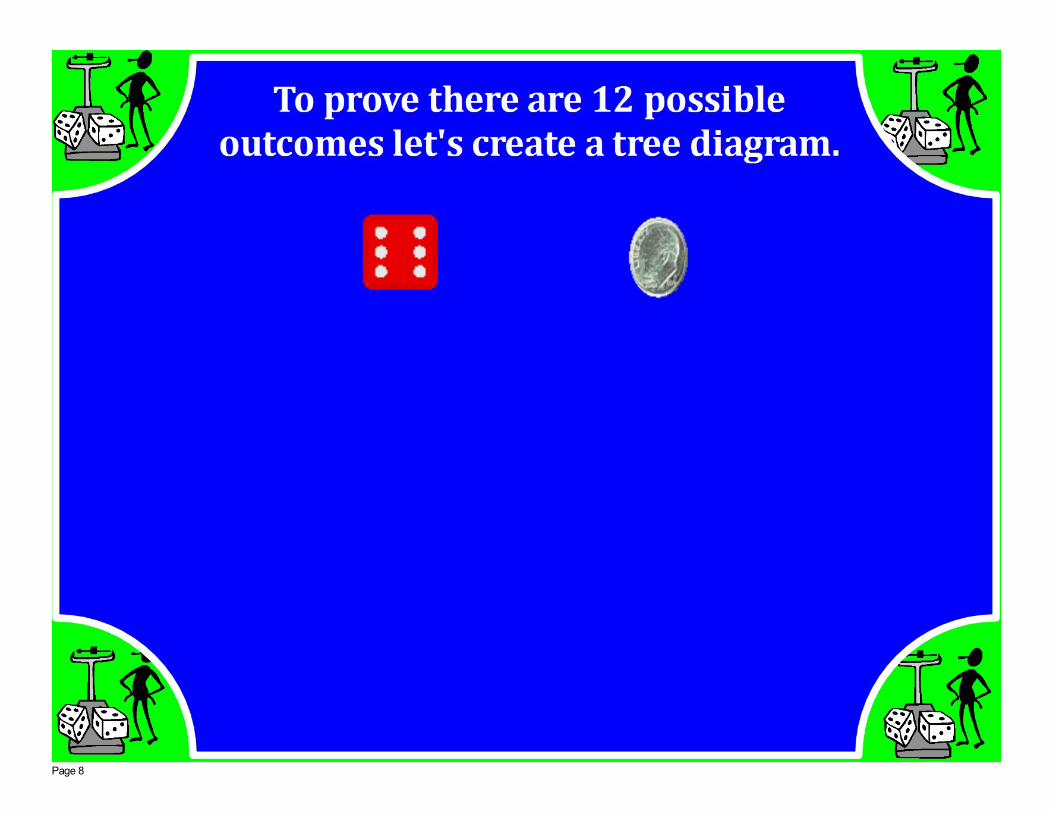
Page 8

Page 9
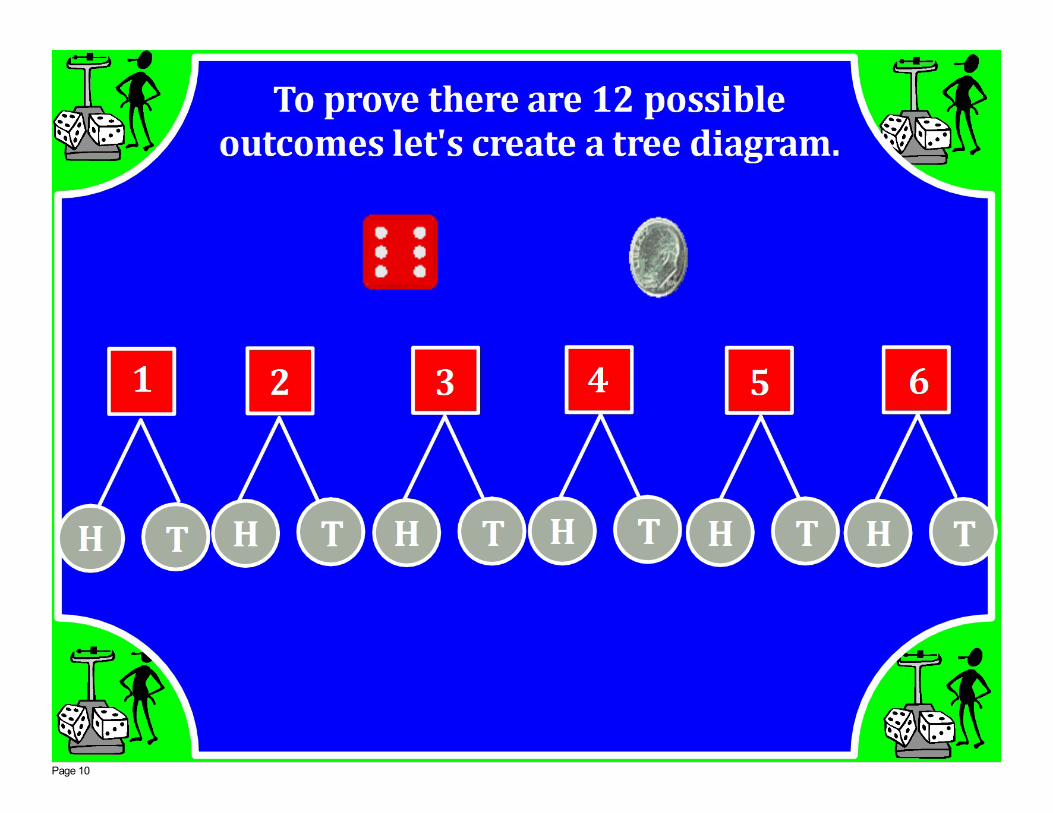
Page 10
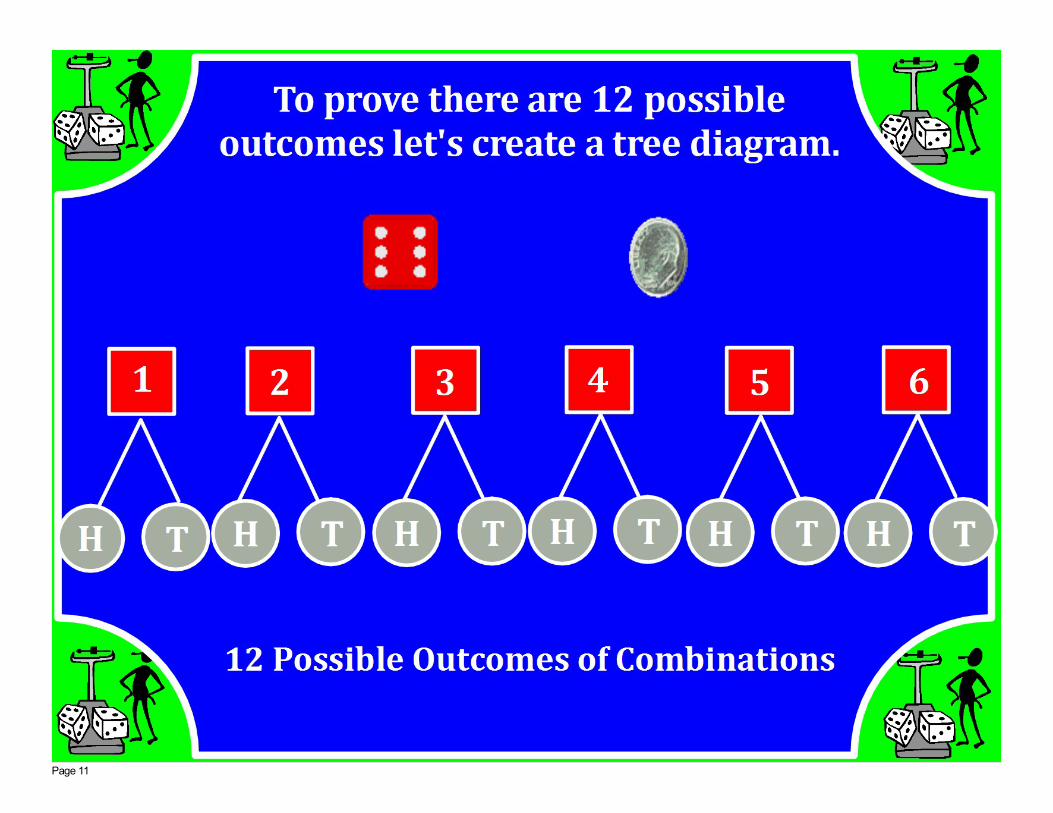
Page 11
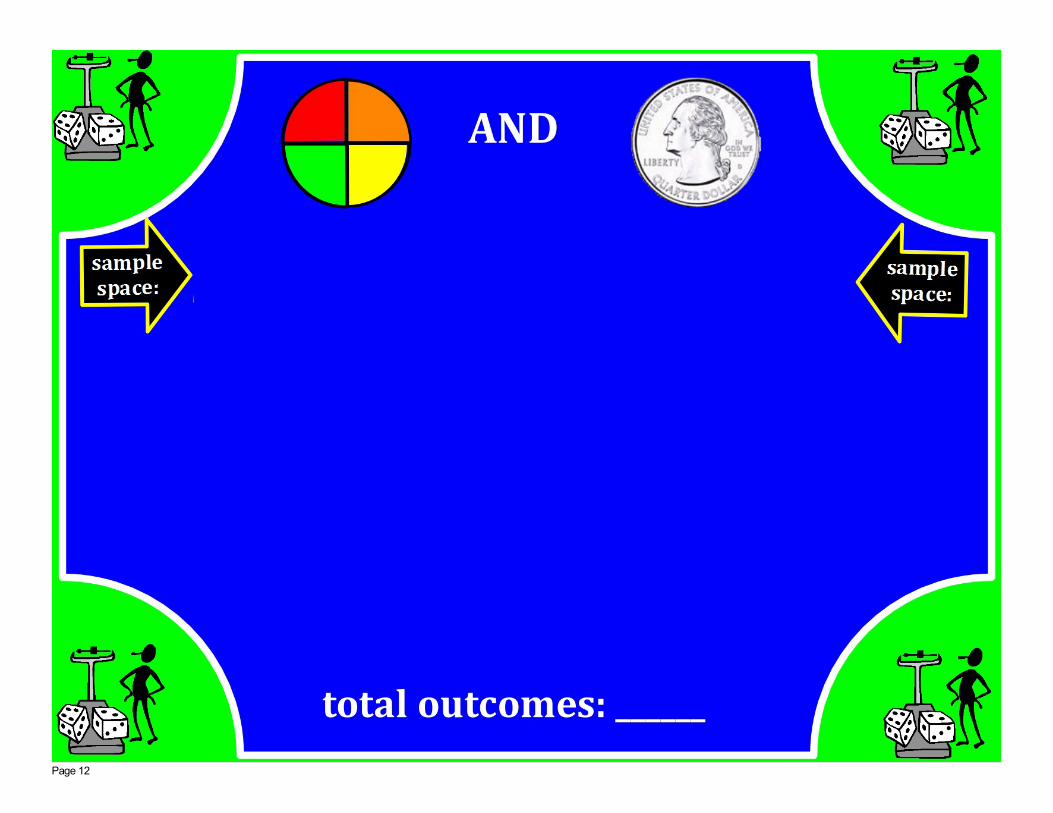
Page 12

Page 13

Page 14
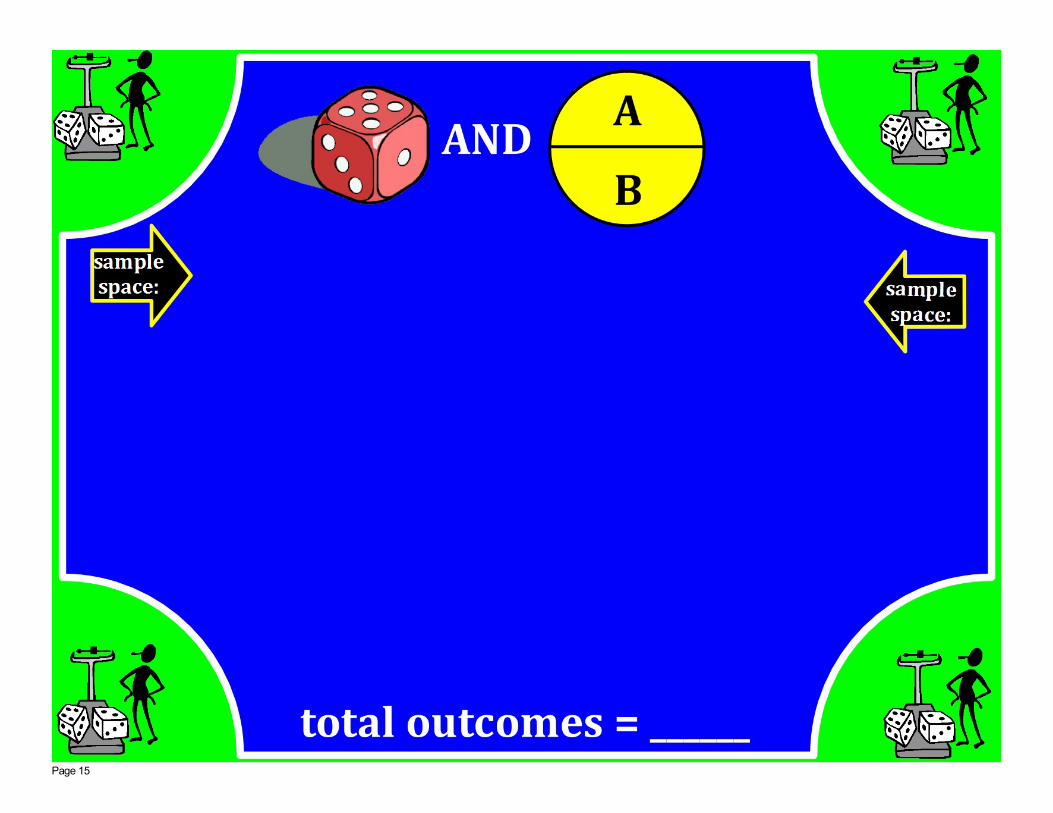
Page 15
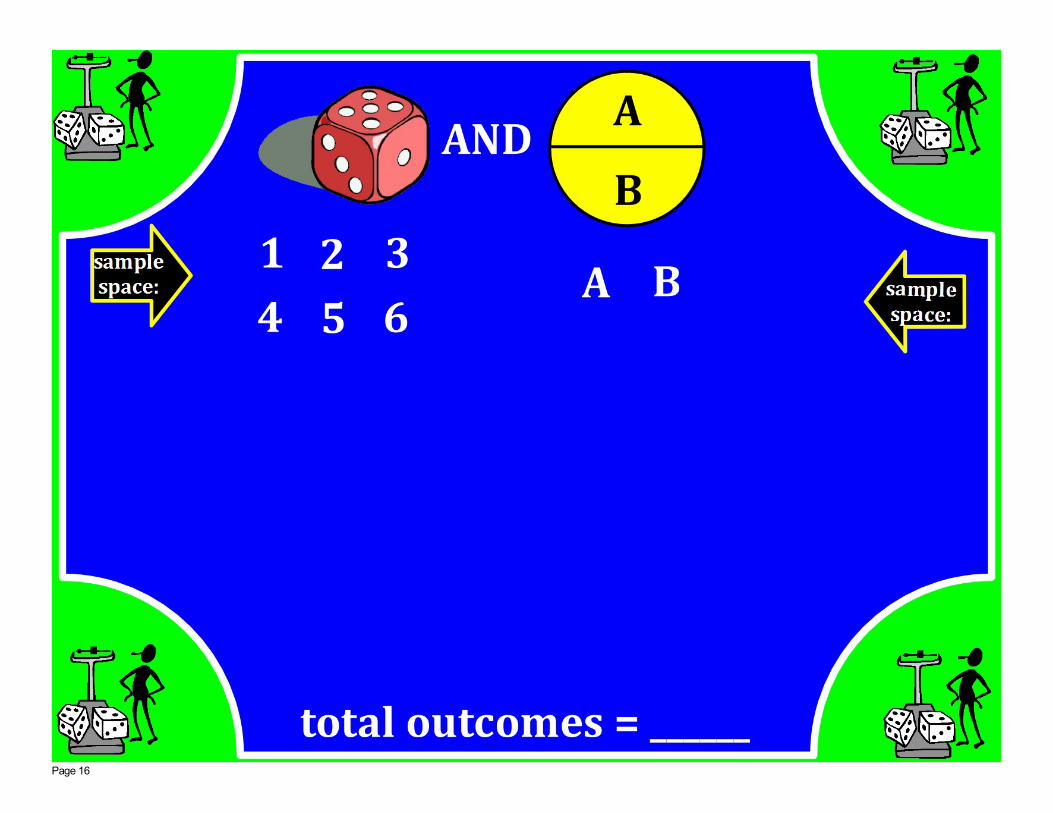
Page 16
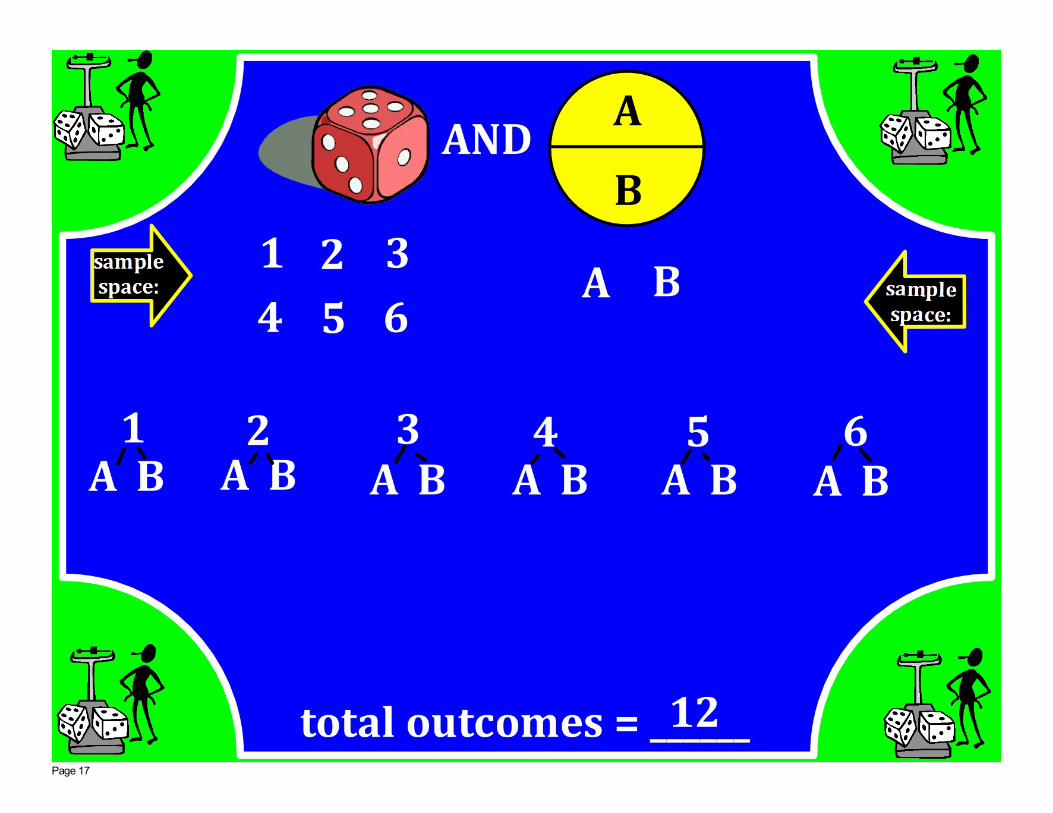
Page 17

Page 18

Page 19

Page 20
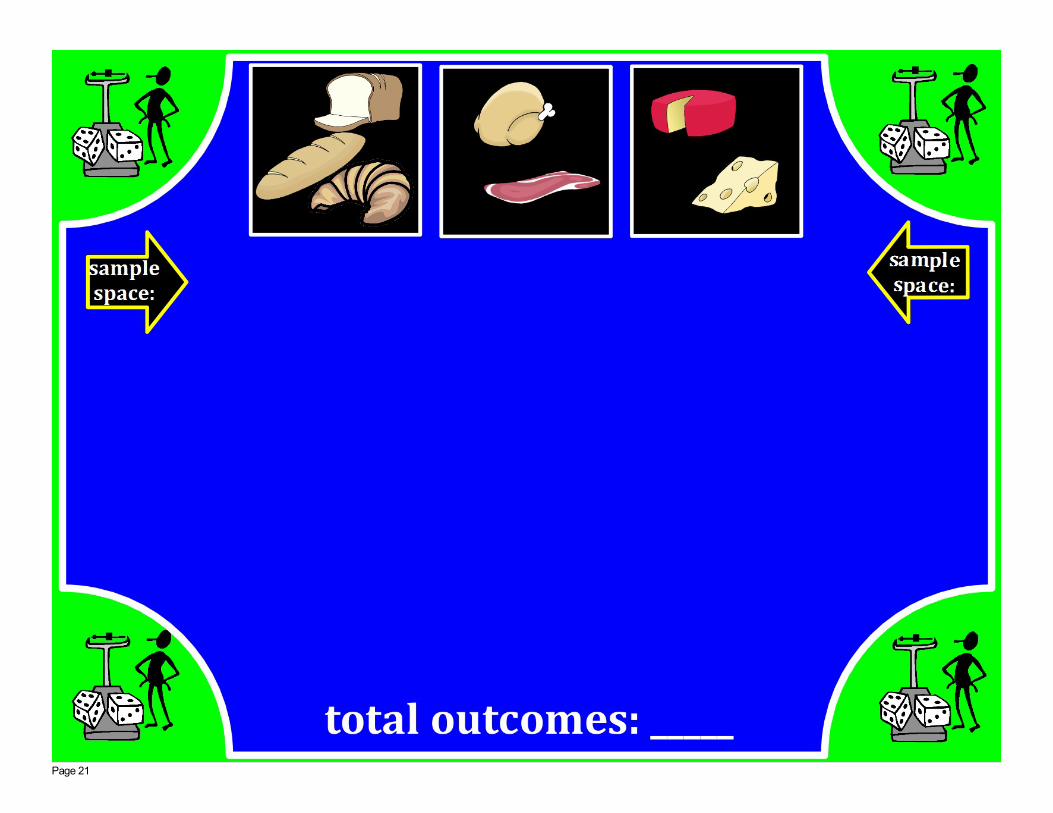
Page 21

Page 22
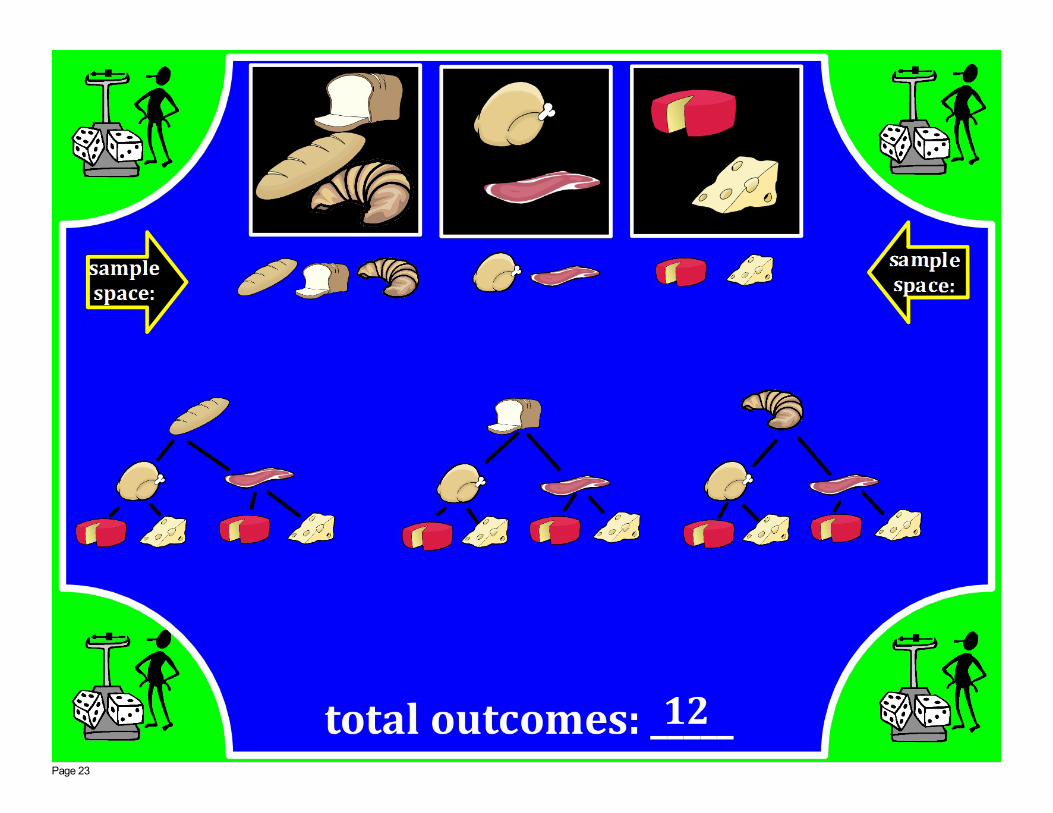
Page 23
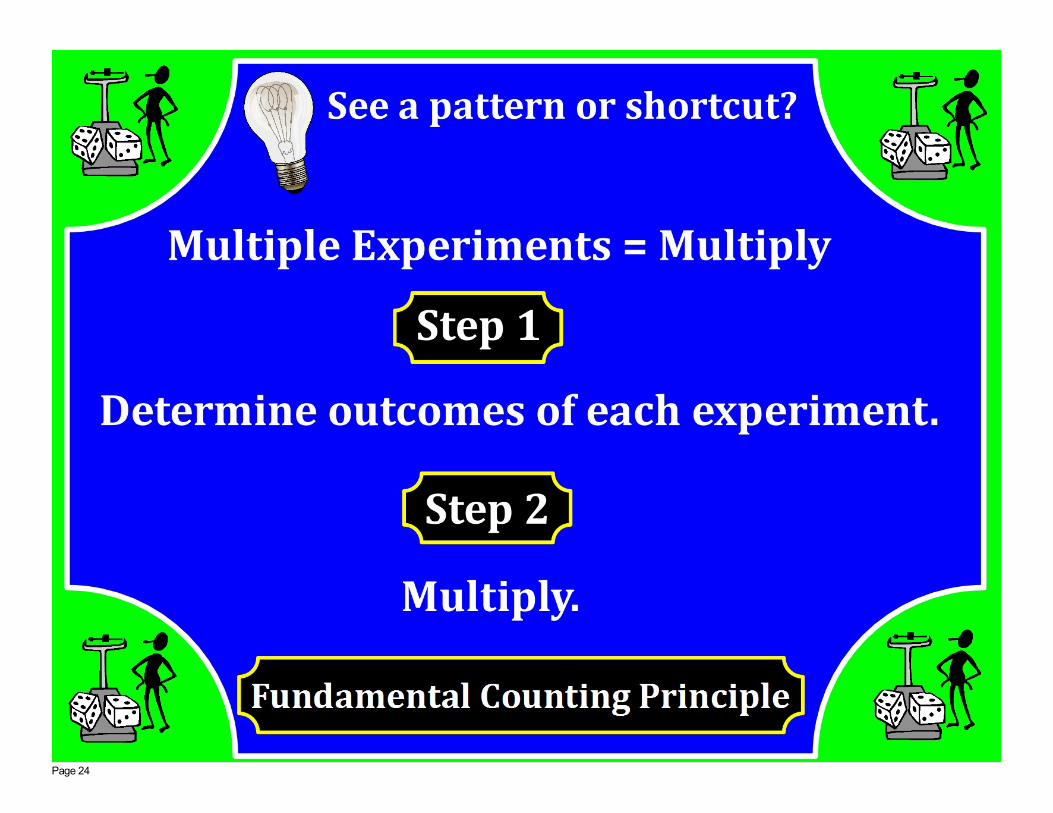
Page 24

Page 25
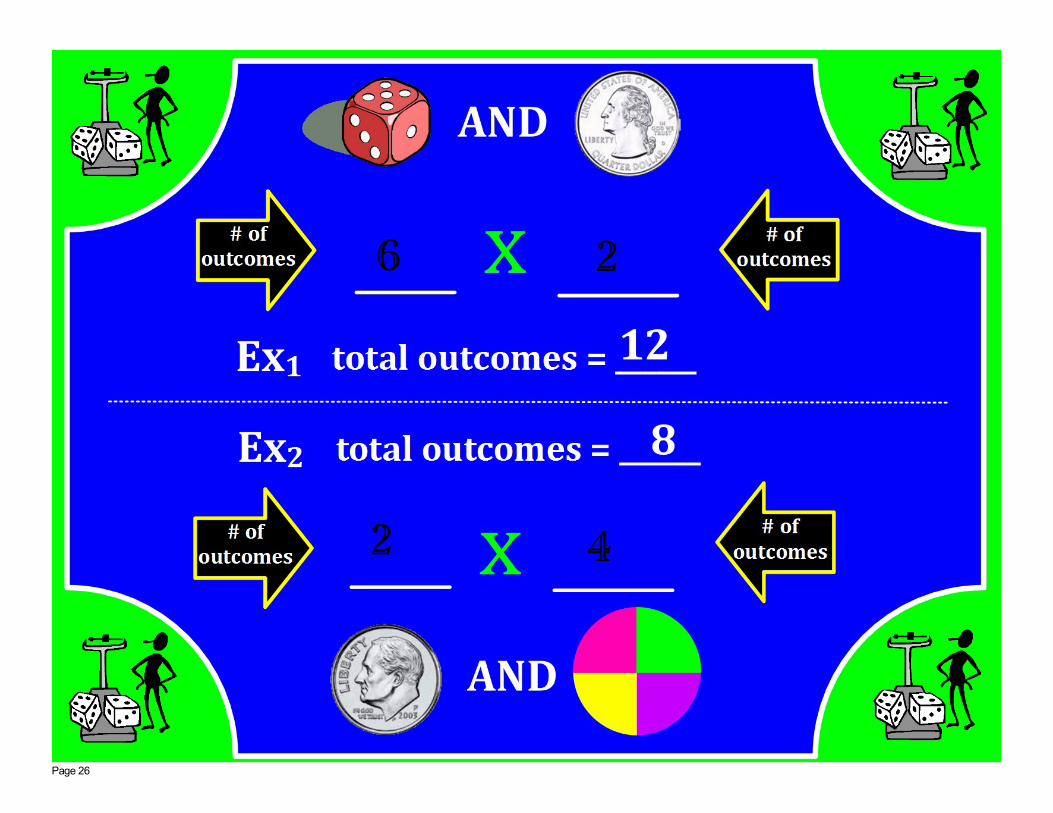
Page 26
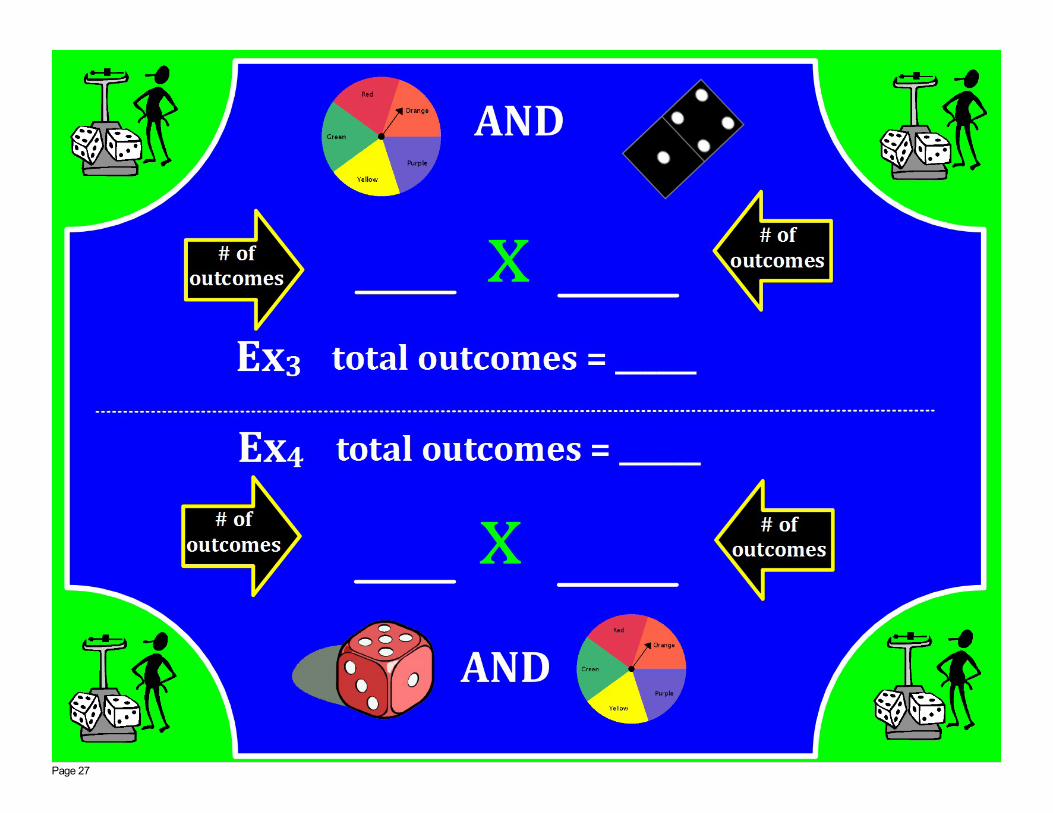
Page 27

Page 28

Page 29
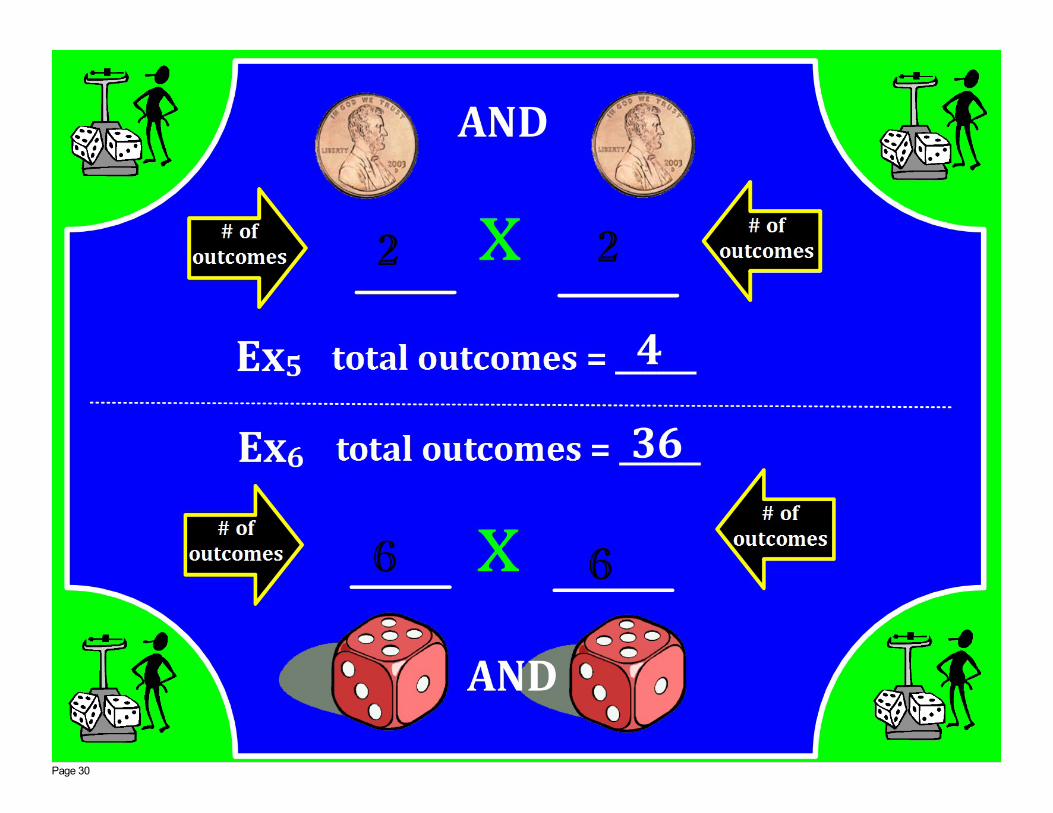
Page 30
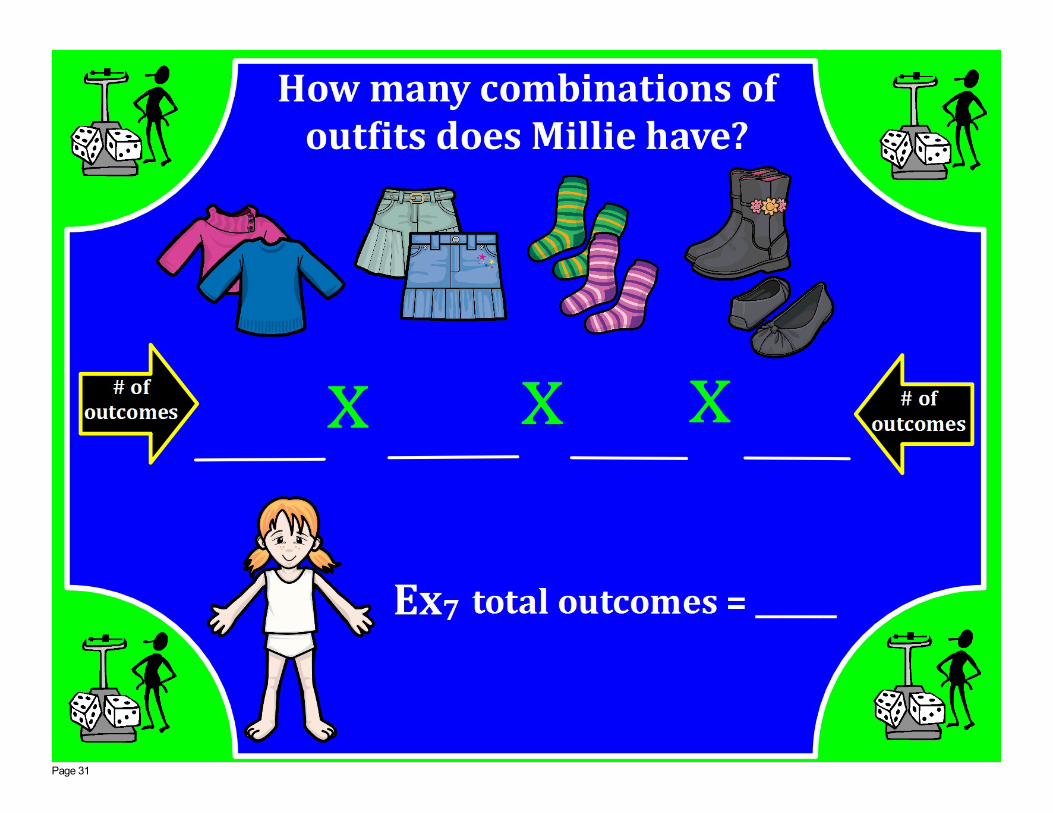
Page 31

Page 32

Page 33

Page 34
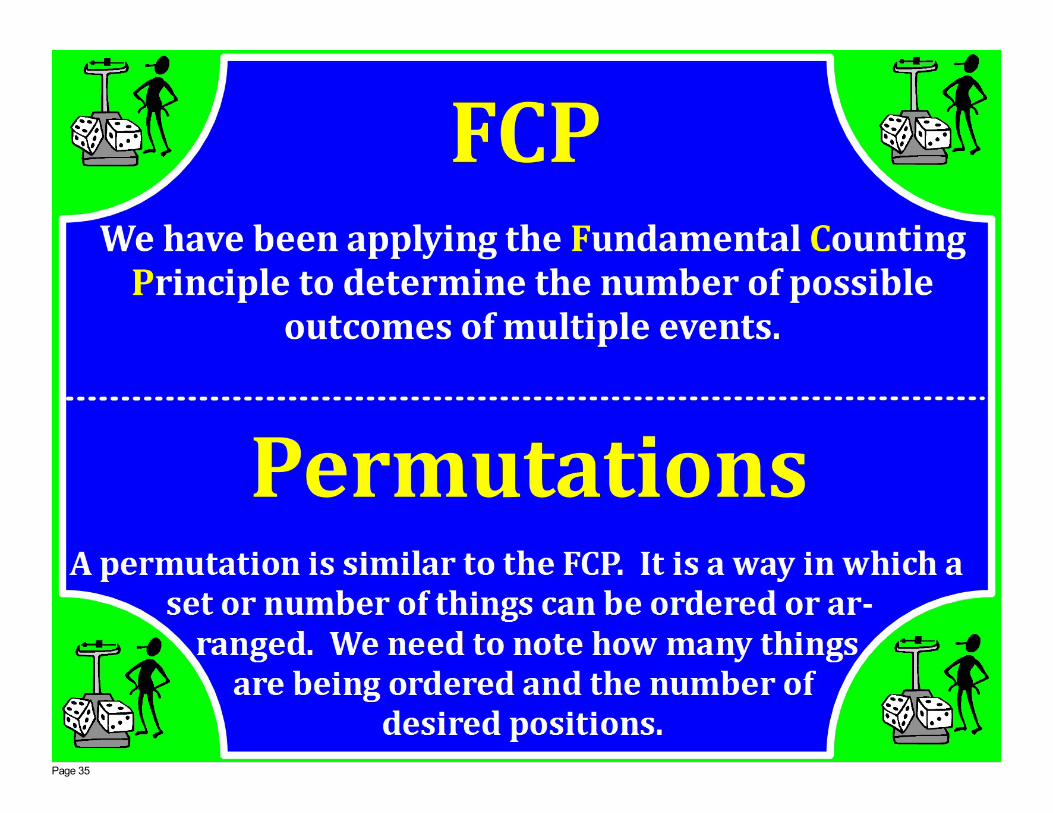
Page 35
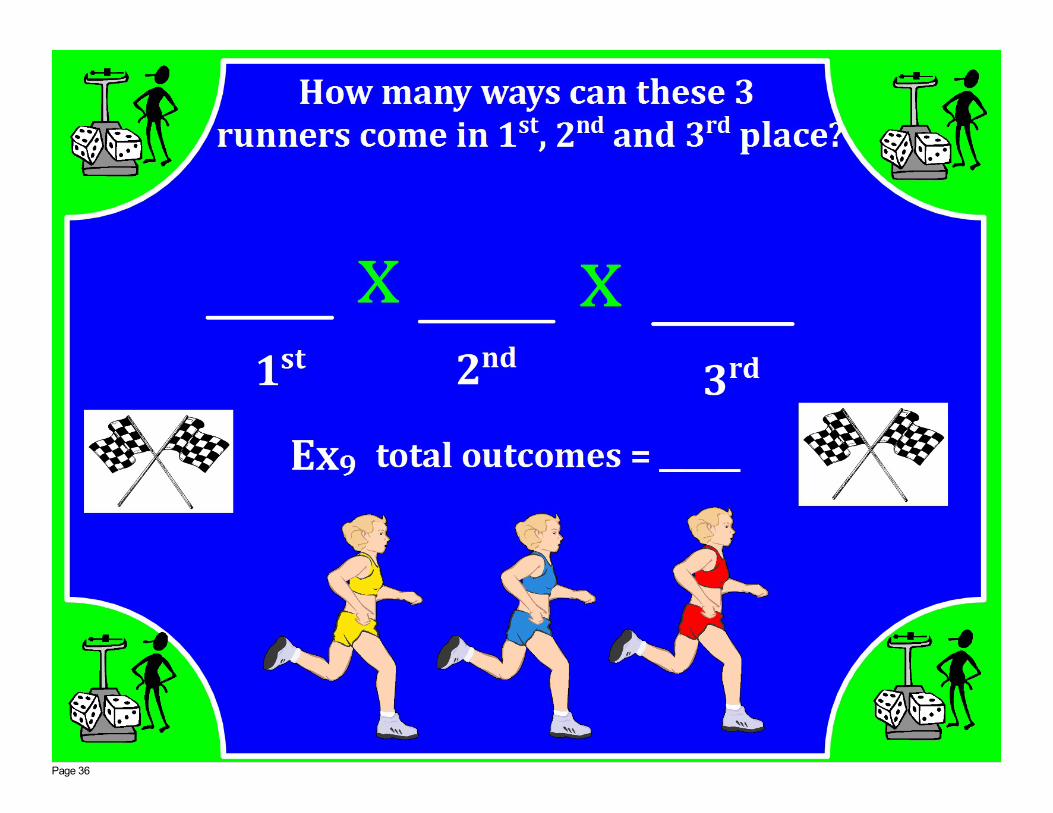
Page 36
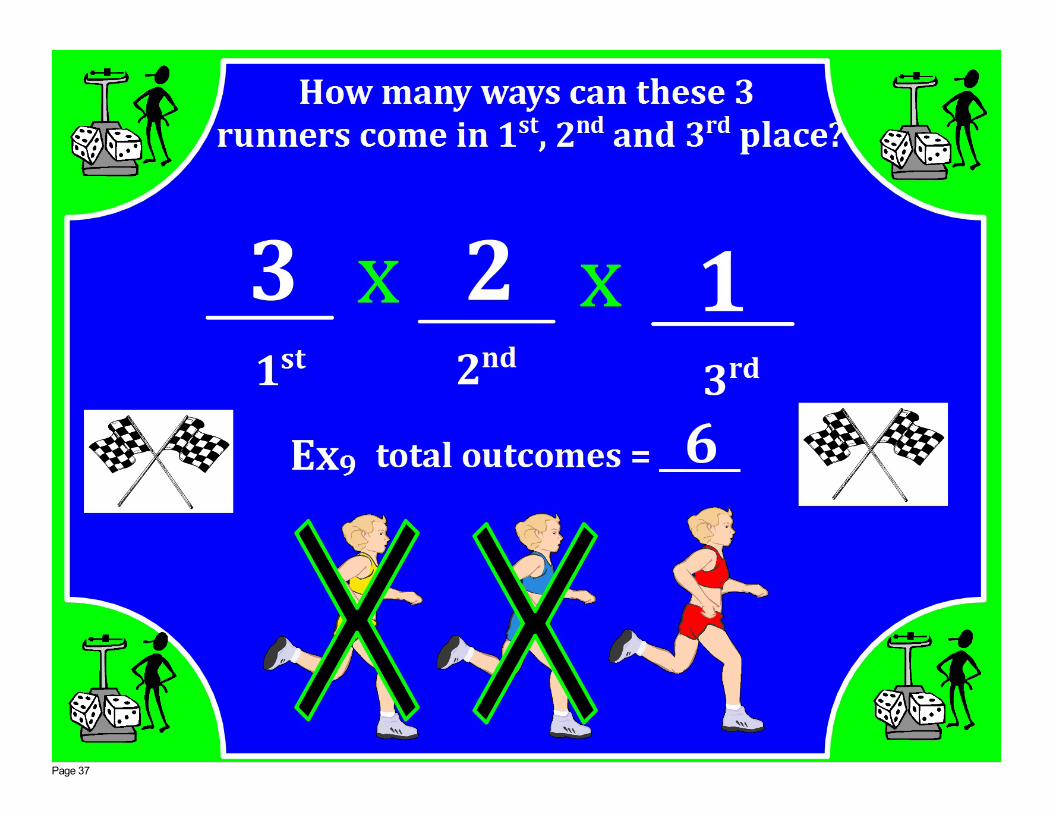
Page 37

Page 38

Page 39

Page 40
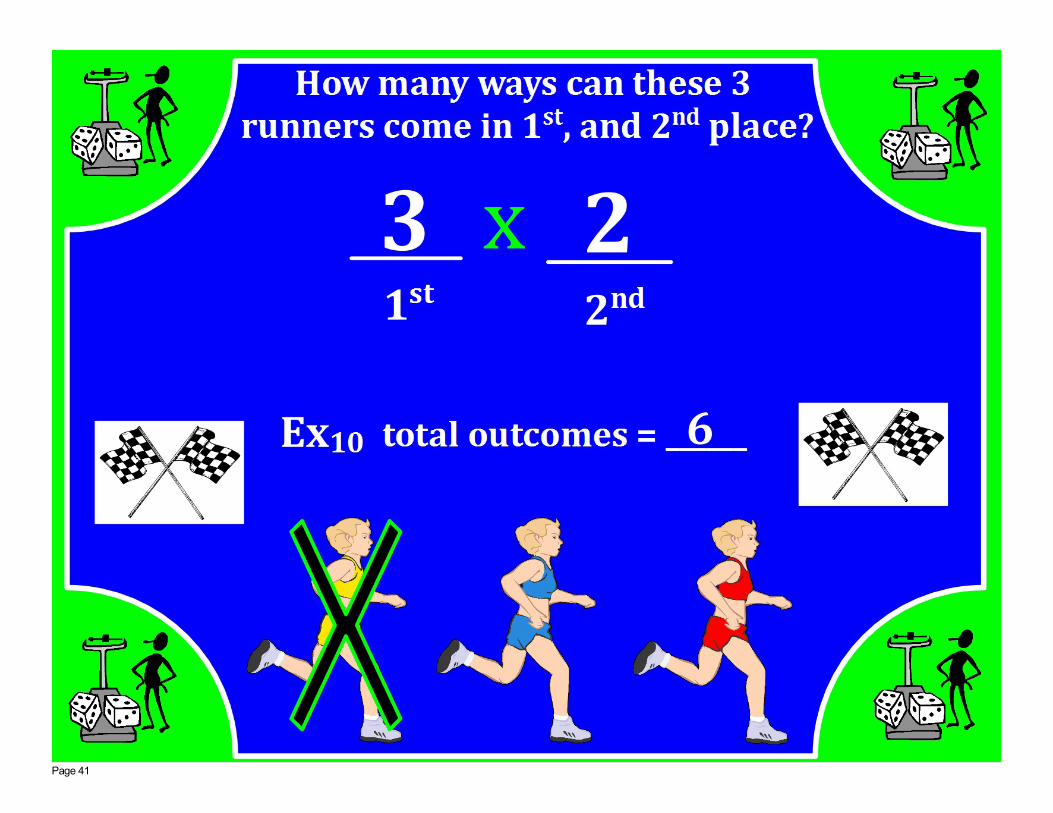
Page 41

Page 42
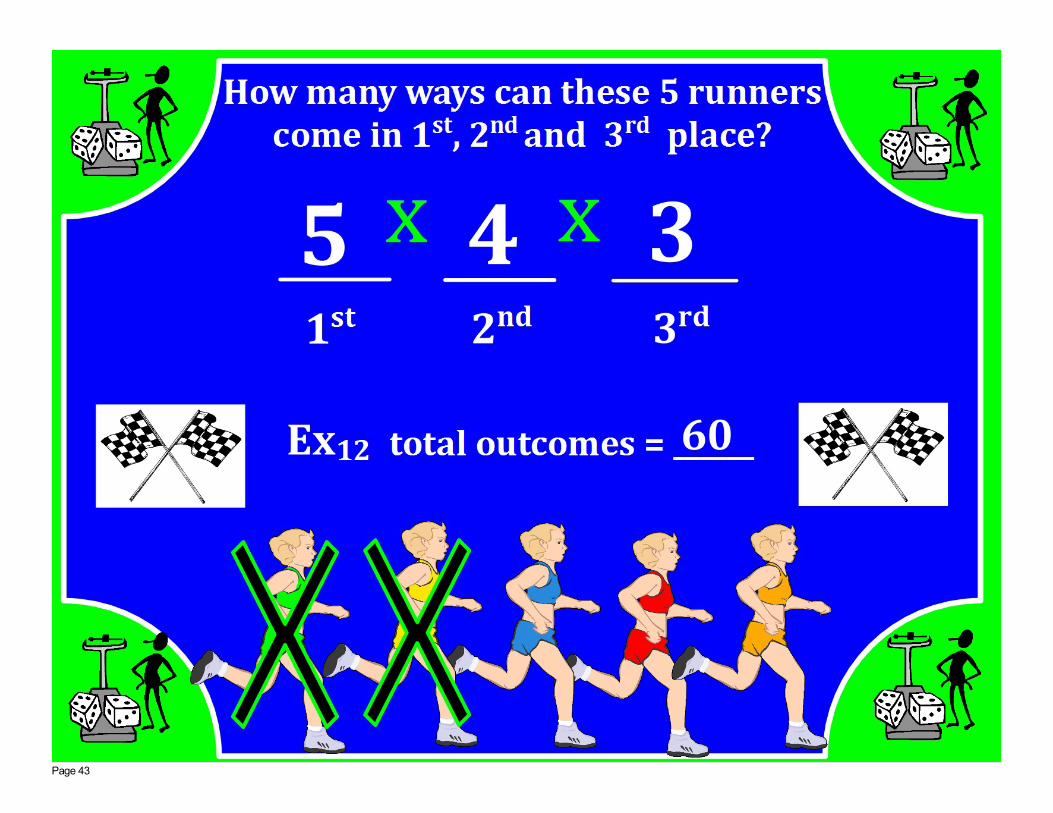
Page 43

Page 44

Page 45
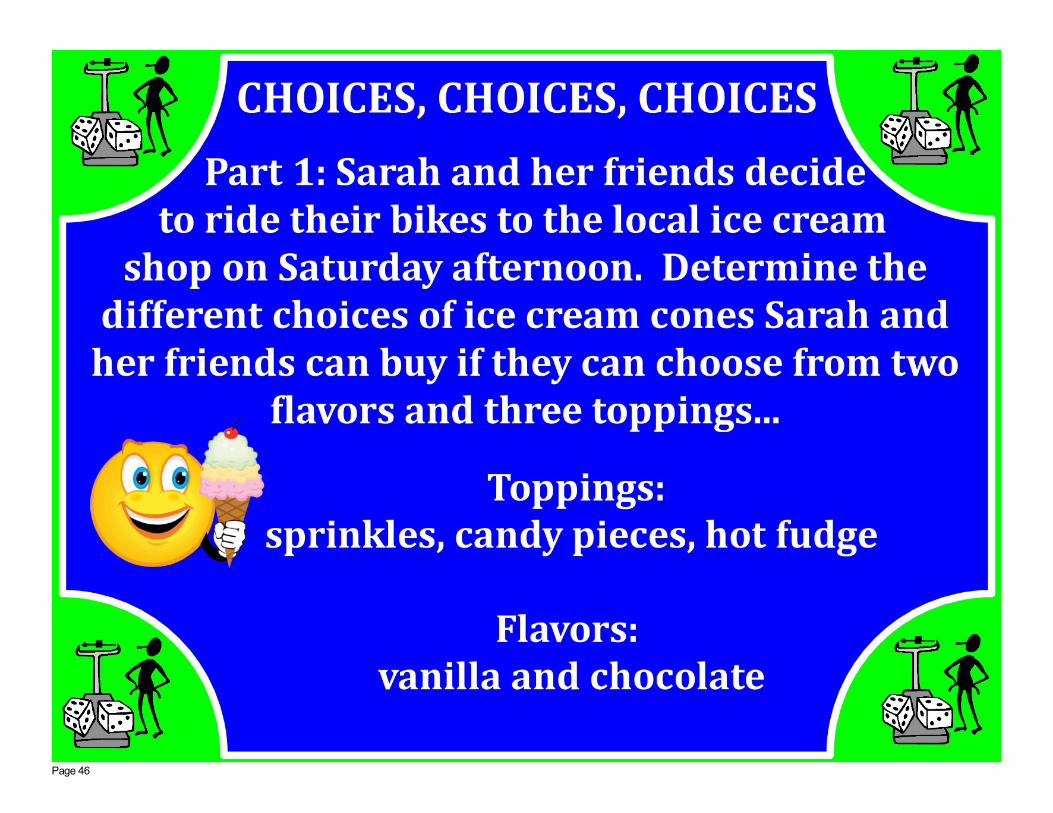
Page 46

Page 47
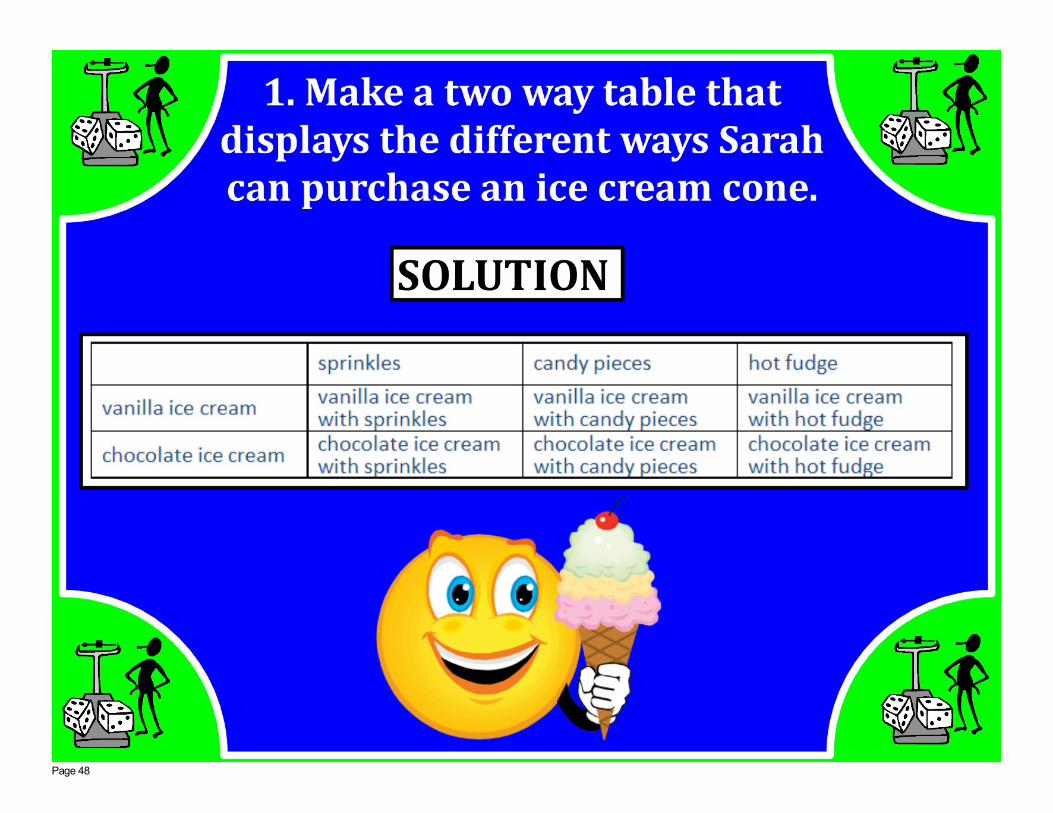
Page 48

Page 49

Page 50