Embed Size (px)
Citation preview

In devising strategies for congestion mitigation, one set of recommendations addresses the demand side of
travel behavior. In other words, these strategies attempt to reduce the demand for drive-alone (also known
as single-occupant vehicle or SOV) travel on roadways by offering alternatives to driving alone. Rail transit,
ridesharing, and bicycling are examples of alternate modes to driving alone, which reduce the demand of
the roadway supply (capacity). Fewer vehicles on the road, especially during peak travel periods, allow
traffic to move more efficiently along a roadway. Aside from reducing SOV demand, higher occupancy
travel modes, such as rail transit and high occupancy vehicles (HOV), are more efficient in the context of
person-carrying capacity – one vehicle can transport more people without occupying the extra space for
additional vehicles.
The set of travel demand management (TDM) strategies described and recommended in this chapter of the
plan are relatively low-cost, quick-implementation projects and programs that encourage alternate travel
modes to driving alone. The more cost-intensive and implementally-complex TDM modes and projects,
such as transit systems, HOV (carpool and transit) lanes, and bicycle routes, are described in other
chapters of Mobility 2030.
Aside from the mobility benefits described earlier, TDM activities also address air quality concerns. By
reducing the number of vehicles on the roads, and as commuters and travelers find other modes of travel,
the number of cold-start emissions are reduced accordingly. Furthermore, overall emission levels are
reduced, because fewer vehicles are being driven. TDM Programs that shift drive-alone travel from peak
periods also serve to reduce the emission of air pollutants. This effect is especially important in the morning
hours when the build-up of pollutants is at its most critical stage in the formation of ground-level ozone. In
addition to mode shifts, other examples of TDM strategies that reduce the peak-period travel include flexible
work hours (in which employees arrive at work during non-peak hours), compressed work weeks (in which
employees work the same number of weekly hours over fewer days), and telecommuting (in which
employees work from a home office or telework center).
TDM also has a role in sustainable development because TDM strategies support high occupancy modes,
walking, and bicycling, which are all sustainable in nature. Park-and-ride lots, for instance, make the
connection between different travel modes. In turn, sustainable land use development, which by design
encourages alternative modes, enhances the involvement of the traveling public in TDM modes. Employers
that locate their businesses in areas supported by transit help promote the use of alternative transportation
modes.
1100.. TTrraavveell DDeemmaanndd MMaannaaggeemmeenntt
North Central Texas Council of Governments 121

Mobility 2030 – 2009 Amendment 10. Travel Demand Management
The TDM-related congestion mitigation strategies recommended as part of Mobility 2030 are described in
detail below. A summary of the TDM recommendations is provided in Exhibit 10-1. The North Central
Texas Council of Governments (NCTCOG) conducts its work on TDM as part of its Congestion
Management Process (CMP) Program, which also includes Transportation System Management (TSM) and
Intelligent Transportation Systems (ITS).
Exhibit 10-1. Summary of Travel Demand Management Recommendations
Year 2030 Program/Project Description
Policy Guidance for Strategy Implementation
Estimated Costs and Impacts of Strategy
Employer Trip Reduction Program Voluntary public/private initiative targets region’s large employers. Includes: • Education and recruitment • Assistance with program setup • Program maintenance • Data collection and reporting of results
• Voluntary program should target the region’s large employers (100+ employees).
• Program focus should be within and outside transit service areas, and within nonattainment area.
• Comprehensive programs should include carpool/vanpool support, transit education, telecommuting, etc.
• Performance reporting is required.
Estimated Cost: $1.22 million per year operating costs Estimated Impact of Strategy: Reduction of 39,160+ vehicle trips per day
Vanpool Program Vanpool Subsidy Program, targeting long home-based work commute trips. Program scope: 1,780 vanpools. Major Investment Study process can be used to identify vanpool market areas.
• Program should target long home-based work commute trips.
• Vanpools must have either their origin or destination inside nonattainment area.
• Fare structure should be established so that public subsidy does not exceed 50 percent of total operating cost.
• Vans should be fuel-efficient (alternative fuel, if possible).
• Vanpool programs should not compete with one another.
• Performance reporting is required.
Estimated Cost: $11.9 million per year operating costs at full implementation Estimated Impact of Strategy: Reduction of 39,160+ vehicle trips per day
Park-and-Ride Facilities 48 facilities Candidate corridors identified for further study. Refine recommendations and identify additional sites through Major Investment Studies.
• Projects should seek to maximize local government involvement as sponsor.
• Projects should seek to include public/private partnerships in park-and-ride development and operation.
• Facilities should be located and designed to serve HOV lanes, bus and rail transit, vanpools, carpools, and other forms of ridesharing.
• Facilities should be located to serve long commute trips into the nonattainment area.
Estimated Cost: Capital cost = $99 million Estimated Impact of Strategy: Reduction of 320,000+ vehicle miles of travel per day Reduction of 8,000+ vehicle hours of travel per day
Transportation Management Associations Candidate corridors identified for further study. Refine recommendations and identify additional sites through Major Investment Studies.
• Primary transportation services are the reduction of drive-alone or peak period travel by 1) providing TDM services, and 2) promoting alternative travel modes.
• Secondary transportation services include information provision and advocacy services.
• Coordination with other local and/or regional TDM interest groups.
• Performance reporting is required.
Estimated Cost: $1.2 million per year operating costs at full implementation Estimated Impact of Strategy: Program effects are assumed to be captured in the Employee Trip Reduction Program highlighted above
Total TDM Costs Capital cost = $99 million Operating cost = $14.3 million/year at full implementation
North Central Texas Council of Governments 122

Mobility 2030 – 2009 Amendment 10. Travel Demand Management
EMPLOYER TRIP REDUCTION PROGRAM A cooperative program between NCTCOG, Dallas Area Rapid Transit (DART), the Fort Worth
Transportation Authority (FWTA or the T), Denton County Transportation Authority, and other public and
private-sector organizations is being implemented. Commonly referred to as the Employer Trip Reduction
(ETR) Program, this effort targets commute vehicle trips of employees that work for large employers in the
region. It is a voluntary program that markets alternatives to driving alone on a commute to employers with
100 or more employees. The implementation of rideshare programs (such as carpooling and vanpooling),
telecommuting, flexible work hour programs, transit pass subsidies, and bicycle facilities are examples of
TDM programs that are encouraged through this marketing effort.
The role of the transportation/transit authorities involved in the program has been to market voluntary TDM
programs to major employers, both inside and outside of their transit service areas. One of the main tasks
is assisting major employers with the formation of their programs. Employers are encouraged to designate
or hire an Employee Transportation Coordinator (ETC) for the company. The ETC acts as a liaison
between the company, the transportation/transit authorities, and NCTCOG in the administration of the
program, aside from marketing alternative commute options to fellow coworkers. The transportation/transit
authorities also provide support to the ETC and employers by offering marketing materials, ETC training and
education, administering employee surveys to better determine what programs will work best at that work
site, and providing information on tax credits and other incentives from which the employer may benefit.
The transportation/transit authorities have been indispensable in implementing the ETR Program.
At least 568 major employers in the region offer some sort of ETR Program or alternative commute
incentive. The degree of implementation within a company or organization varies greatly, but with most
employers offering only a few types of commute trip reduction programs, additional marketing of TDM
programs is necessary. As transit services and systems are expanded and added, including the
construction of rail lines and HOV lanes, increased transportation options will be available to more
employees as employers find increased opportunities to implement trip reduction programs. Hence, it is
recommended that the ETR Program be continued in this region.
Policy Guidance A voluntary program of this nature requires strong public support to ensure success. Public support is
needed in recruiting employers and establishing Transportation Management Associations, assisting
employers with implementation of their trip reduction programs, and training on-site employee transportation
coordinators. Education and promotion need to come from the public sector, as well as collection,
assimilation, and maintenance of program performance data.
Another critical need in ensuring the success of this program is public sector leadership. In order to lead by
example, public sector employers within the region are called upon to develop aggressive trip reduction
programs for their employees. The public sector is expected to set the pace in this arena and establish
North Central Texas Council of Governments 123

Mobility 2030 – 2009 Amendment 10. Travel Demand Management
targets and programs in excess of average trip reduction efforts, monitor the effectiveness of these
programs, and share their expertise and experience with private sector employers. If public sector
employers assume a position of leadership, meaningful reductions in regional travel can be realized.
Employers that encourage higher vehicle occupancy by promoting carpooling, vanpooling, and transit use
trip-making incentives should develop policies. For instance, parking management and pricing policies save
employers’ money, and the savings can be passed on to employees in the form of subsidized transit passes
and guaranteed ride home programs. It is recommended that program goals of individual employers should
target a minimum 20 percent reduction in vehicle commute trips. Creative employer policies that
incorporate changes in employee scheduling of work hours, combined with incentives to use alternative
travel modes, should allow the flexibility and means in achieving such a goal.
VANPOOL PROGRAM Ridesharing programs are key elements of any region's TDM effort. The Vanpool Program is one type of
ridesharing alternative that is popular among commuters. As a very effective ridesharing alternative, this
strategy is aimed at increasing average vehicle occupancy during peak travel periods, thereby decreasing
drive-alone travel.
In order to increase the participation of commuters in ridesharing, vanpool programs should be primarily
aimed at longer commute trips – those home-based work (HBW) trips of 25 miles or more in distance. This
region is expected to generate over 6.7 million HBW trips daily in the year 2030, accounting for
approximately a quarter of all trips. This is the market from which vanpools can most successfully gain the
greatest participation.
Programs of this type can take various forms. Employers, private interest groups, Transportation
Management Associations, and transportation/transit authorities may implement vanpools.
Transportation/transit authorities, as part of their ETR Program marketing efforts, can assist large employers
in setting up vanpool programs for their employees.
The expected operating cost for the Vanpool Program at full implementation is projected to be $11.9 million
per year (2006 dollars). At full implementation, with the possible participation of 4,254 employers and over
1.3 million commuters, the program is anticipated to reduce travel by over 39,160 vehicle trips per day.
Federal funds can also be applied to vanpool operating costs in order to assist participating employees and
employers financially. Federal funds for vanpool subsidies are recommended not to exceed 50 percent of
the operating costs. In recent years, Metropolitan Planning Organizations (MPOs) and transportation/transit
authorities have contributed funds needed to subsidized vanpool operating costs. The balance of the funds
can come from various sources, including a subsidy from the employer, vanpool rider fare, private grants,
advertisers, and other commercial sponsors.
North Central Texas Council of Governments 124

Mobility 2030 – 2009 Amendment 10. Travel Demand Management
Policy Guidance Care in program implementation should be exercised so different vanpool programs do not compete with
one another. As a result, program development should be coordinated with existing public and private
sector vanpool programs. Taking air quality considerations into account, the program should target
vanpools that either have their origin or destination inside the nonattainment area and that use fuel-efficient
or low-emitting vehicles when possible. Regular performance reporting ensures standardization of
subsidies and service delivery in the appropriate areas.
The coupling of ETR marketing with a public subsidy for vanpool operations should produce a program that
captures nearly 21,000 vanpool riders per day in this region and reduces travel by over 39,160 vehicle trips
per day. By the end of 2008, 334 vanpools were operating in the Dallas-Fort Worth (DFW) Metropolitan
Area, with an estimated 1,780 vanpools expected to be operating by the year 2030. The program calls for a
subsidy directed to the vanpool rider, and targets resources to vanpool start-up programs. From current
levels of vanpool costs, the total subsidy cost of the Vanpool Program is estimated to be $4.76 million per
year (2006 dollars) at full program implementation.
PARK-AND-RIDE FACILITIES Park-and-ride facilities serve as collection areas for persons transferring to higher occupancy vehicles.
They are often located and designed to serve bus or rail transit, but many are used by carpoolers and
vanpoolers as well. Park-and-ride facilities can be located near a Central Business District (CBD) to serve
public transit or pedestrian activity, or located in suburban areas to collect riders near the origin of their trips.
Combined with HOV lanes, park-and-ride facilities can be an effective incentive for increasing vehicle
occupancy, thus reducing congestion and vehicle emissions.
Site Analysis Considering the magnitude of investment in HOV, rail, and managed tollway facility construction by the year
2030, and the changes in travel behavior that should result, it is estimated that 48 park-and-ride facilities,
serving over 10,000 users, will need to be constructed in addition to existing park-and-ride facilities. Major
Investment Studies (MISs), technical studies, transit service planning, and local government initiatives are
the main tools used to identify candidate park-and-ride facilities. Inventories of existing, planned, and
candidate park-and-ride facilities are provided in Exhibit 10-2 through Exhibit 10-4. In technical studies
and MISs, candidate sites are selected based on the results of transit service simulations, as well as the
consideration of forecasted congestion levels, the location of HOV and light rail facilities, and the distribution
of long HBW trips. As Major Investment Studies are initiated, previously identified sites should be reviewed
and additional sites should be identified.
North Central Texas Council of Governments 125
Mobility 2030 – 2009 Amendment 10. Travel Demand Management
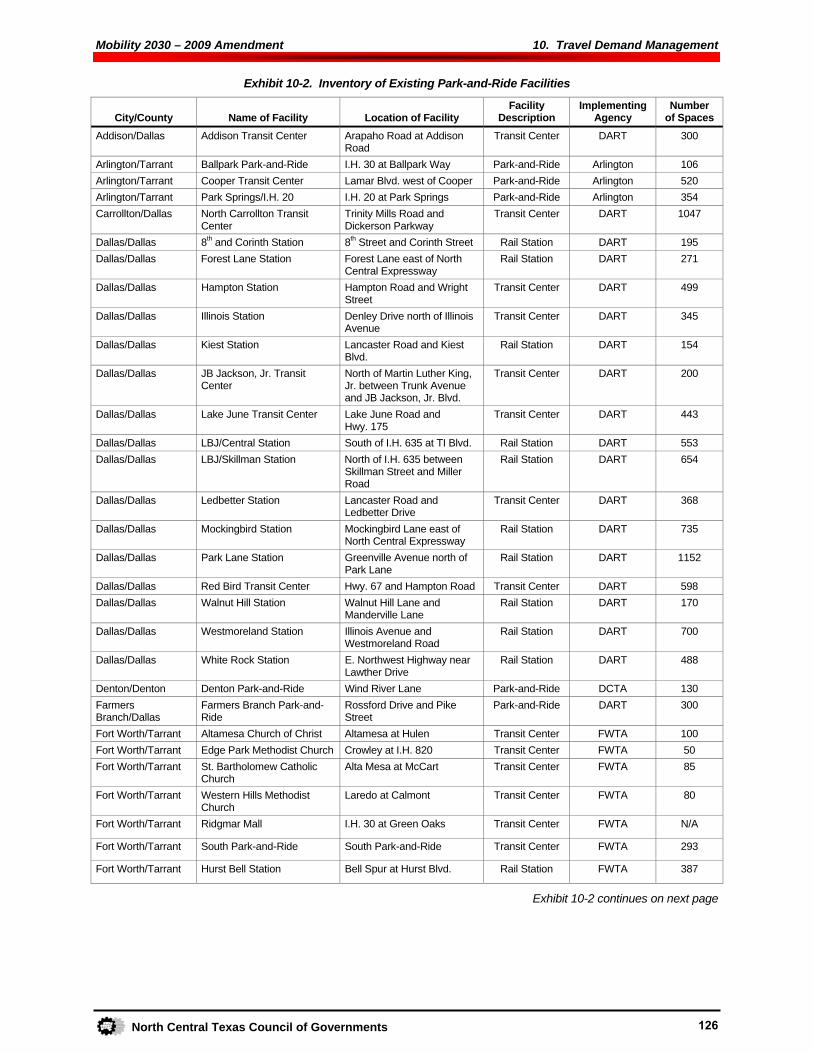
Exhibit 10-2. Inventory of Existing Park-and-Ride Facilities
City/County Name of Facility Location of Facility Facility
Description Implementing
Agency Number
of Spaces Addison/Dallas Addison Transit Center Arapaho Road at Addison
Road Transit Center DART 300
Arlington/Tarrant Ballpark Park-and-Ride I.H. 30 at Ballpark Way Park-and-Ride Arlington 106 Arlington/Tarrant Cooper Transit Center Lamar Blvd. west of Cooper Park-and-Ride Arlington 520 Arlington/Tarrant Park Springs/I.H. 20 I.H. 20 at Park Springs Park-and-Ride Arlington 354 Carrollton/Dallas North Carrollton Transit
Center Trinity Mills Road and Dickerson Parkway
Transit Center DART 1047
Dallas/Dallas 8th and Corinth Station 8th Street and Corinth Street Rail Station DART 195 Dallas/Dallas Forest Lane Station Forest Lane east of North
Central Expressway Rail Station DART 271
Dallas/Dallas Hampton Station Hampton Road and Wright Street
Transit Center DART 499
Dallas/Dallas Illinois Station Denley Drive north of Illinois Avenue
Transit Center DART 345
Dallas/Dallas Kiest Station Lancaster Road and Kiest Blvd.
Rail Station DART 154
Dallas/Dallas JB Jackson, Jr. Transit Center
North of Martin Luther King, Jr. between Trunk Avenue and JB Jackson, Jr. Blvd.
Transit Center DART 200
Dallas/Dallas Lake June Transit Center Lake June Road and Hwy. 175
Transit Center DART 443
Dallas/Dallas LBJ/Central Station South of I.H. 635 at TI Blvd. Rail Station DART 553 Dallas/Dallas LBJ/Skillman Station North of I.H. 635 between
Skillman Street and Miller Road
Rail Station DART 654
Dallas/Dallas Ledbetter Station Lancaster Road and Ledbetter Drive
Transit Center DART 368
Dallas/Dallas Mockingbird Station Mockingbird Lane east of North Central Expressway
Rail Station DART 735
Dallas/Dallas Park Lane Station Greenville Avenue north of Park Lane
Rail Station DART 1152
Dallas/Dallas Red Bird Transit Center Hwy. 67 and Hampton Road Transit Center DART 598 Dallas/Dallas Walnut Hill Station Walnut Hill Lane and
Manderville Lane Rail Station DART 170
Dallas/Dallas Westmoreland Station Illinois Avenue and Westmoreland Road
Rail Station DART 700
Dallas/Dallas White Rock Station E. Northwest Highway near Lawther Drive
Rail Station DART 488
Denton/Denton Denton Park-and-Ride Wind River Lane Park-and-Ride DCTA 130 Farmers Branch/Dallas
Farmers Branch Park-and-Ride
Rossford Drive and Pike Street
Park-and-Ride DART 300
Fort Worth/Tarrant Altamesa Church of Christ Altamesa at Hulen Transit Center FWTA 100 Fort Worth/Tarrant Edge Park Methodist Church Crowley at I.H. 820 Transit Center FWTA 50 Fort Worth/Tarrant St. Bartholomew Catholic
Church Alta Mesa at McCart Transit Center FWTA 85
Fort Worth/Tarrant Western Hills Methodist Church
Laredo at Calmont Transit Center FWTA 80
Fort Worth/Tarrant Ridgmar Mall I.H. 30 at Green Oaks Transit Center FWTA N/A
Fort Worth/Tarrant South Park-and-Ride South Park-and-Ride Transit Center FWTA 293
Fort Worth/Tarrant Hurst Bell Station Bell Spur at Hurst Blvd. Rail Station FWTA 387
Exhibit 10-2 continues on next page
North Central Texas Council of Governments 126

Mobility 2030 – 2009 Amendment 10. Travel Demand Management
Exhibit 10-2. Inventory of Existing Park-and-Ride Facilities
City/County Name of Facility Location of Facility Facility
Description Implementing
Agency Number
of Spaces Fort Worth/Tarrant Centerport Station Statler at Breezewood (DFW
International Airport) Rail Station FWTA 985
Fort Worth/Tarrant T&P Station W. Lancaster Avenue Rail Station FWTA 376 Fort Worth/Tarrant Vickery Blvd. Vickery Blvd. at Main Street Rail Station FWTA 167 Garland/Dallas Downtown Garland Station Walnut Street at 5th Street Rail Station DART 550 Garland/Dallas Forest/Jupiter Station Forest Lane at Barnes Drive Rail Station DART 561 Garland/Dallas Lake Ray Hubbard Transit
Center Duck Creek Drive west of Broadway
Transit Center DART 660
Garland/Dallas South Garland Transit Center
LBJ Freeway service road between Shiloh Road and Leon Road
Transit Center DART 600
Glenn Heights/Dallas
Glenn Heights Park-and-Ride
West of I.H. 35E at Gateway Blvd. and Bear Creek Road East
Park-and-Ride DART 370
Irving/Dallas North Irving Transit Center North O'Conner Blvd. and Northwest Highway
Transit Center DART 715
Irving/Dallas South Irving Station Rock Island Road east of O'Conner Road
Transit Center DART 457
Irving/Dallas West Irving Station Jackson Street near Esters Road
Rail Station DART 500
Lewisville/Denton Lewisville Park-and-Ride Oak Blend Blvd. Park-and-Ride DCTA 65 Lewisville/Denton Lewisville Park-and-Ride Summit Avenue Park-and-Ride DCTA 20 Plano/Collin Parker Road Station Archerwood Street between
East Park Blvd. and Parker Road
Rail Station DART 1555
Plano/Collin West Plano Transit Center 15th Street west of Coit Road Transit Center DART 822 Richardson/Collin Bush Turnpike Station President George Bush
Turnpike frontage road east of North Central Expressway and west of Plano Road
Rail Station DART 778
Richardson/Dallas Arapaho Center Station Arapaho Road at Greenville Avenue
Rail Station DART 1100
Richardson/Dallas Spring Valley Station Spring Valley Road east of North Central Expressway at Lingoc Drive
Rail Station DART 393
Richland Hills/Tarrant
Richland Hills Station Burns at Handley Ederville Rail Station FWTA 364
Rowlett/Dallas Rowlett Park-and-Ride Industrial Street and Martin Drive
Park-and-Ride DART 326
Exhibit 10-3. Inventory of Planned Park-and-Ride Facilities
City/County Location of Facility Facility
Description Implementing
Agency Number
of Spaces Arlington/Tarrant F.M. 157/TRE Station Rail FWTA N/A Carrollton/Dallas Downtown Carrollton Rail DART 155 Carrollton/Dallas North Carrollton Transit Center –
Expansion Rail DART 450
Carrollton/Denton Frankford Rail DART 275 Dallas/Dallas Bachman Rail DART 280 Dallas/Dallas Royal Lane Rail DART 130 Dallas/Dallas Inwood Rail DART 200 Dallas/Dallas Lawnview Rail DART 200 Dallas/Dallas Buckner Rail DART 715 Denton/Denton Downtown Denton at Hickory and
Railroad Rail DCTA 280
Exhibit 10-3 continues on next page
North Central Texas Council of Governments 127

Mobility 2030 – 2009 Amendment 10. Travel Demand Management
Exhibit 10-3. Inventory of Planned Park-and-Ride Facilities
City/County Location of Facility Facility
Description Implementing
Agency Number
of Spaces Denton/Denton South Denton Colorado and Mayhill Rail DCTA 780 Fort Worth/Tarrant North Fort Worth Rail FWTA 500 Frisco/Collin Dallas North Tollway Park-and-Ride Frisco 350 Grand Prairie/Dallas I.H. 30 and Beltline Park-and-Ride Grand Prairie 366 Highland Village/Denton
Copperas Branch Park Park-and-Ride DCTA 20
Joshua/Johnson Plum Street Park-and-Ride Joshua 255 Lewisville/Denton Lewisville Downtown Rail DART 1050 Lewisville/Denton North Lewisville/Highland Village Rail DCTA 210-850 Lewisville/Denton Lewisville South Rail DCTA 640 Lewisville/Denton Hebron Parkway east of I.H. 35E Park-and-Ride DCTA N/A North Richland Hills/Tarrant
I.H. 820 Park-and-Ride North Richland Hills
100
Plano/Collin Northwest Plano Rail DART 544-716 Plano/Collin Parker Road Station – Expansion Rail DART 167 Richardson/Dallas Bush Turnpike Station – Expansion Rail DART 709 Richardson/Dallas Richardson/Dallas County Park-and-Ride Richardson 300 Rowlett/Rockwall Rowlett Waterfront Station Park-and-Ride Rowlett 1000
Exhibit 10-4. Inventory of Candidate Park-and-Ride Facilities
City/County Candidate Locations Source Comments Waxahachie/Ellis South Town City of Waxahachie Possible future facility Colleyville/Tarrant Colleyville FWTA Alternatives Analysis
for the Cotton Bowl Corridor Performed by NCTCOG Transit Team
Fort Worth/Tarrant Hulen FWTA Alternatives Analysis for the Cotton Bowl Corridor
Performed by NCTCOG Transit Team
Fort Worth/Tarrant Seminary FWTA Alternatives Analysis for the Cotton Bowl Corridor
Performed by NCTCOG Transit Team
Fort Worth/Tarrant Berry – TCU FWTA Alternatives Analysis for the Cotton Bowl Corridor
Performed by NCTCOG Transit Team
Fort Worth/Tarrant Medical – Fort Worth FWTA Alternatives Analysis for the Cotton Bowl Corridor
Performed by NCTCOG Transit Team
Fort Worth/Tarrant Stockyards – 28th Street FWTA Alternatives Analysis for the Cotton Bowl Corridor
Performed by NCTCOG Transit Team
Fort Worth/Tarrant Beach FWTA Alternatives Analysis for the Cotton Bowl Corridor
Performed by NCTCOG Transit Team
Fort Worth/Tarrant S.H. 287/I.H. 35 FWTA Park-and-Ride Study Performed by NCTCOG TDM Team
Fort Worth/Tarrant Basswood/Riverside FWTA Park-and-Ride Study Performed by NCTCOG TDM Team
Fort Worth/Tarrant SH 199/Loop 820 FWTA Park-and-Ride Study Performed by NCTCOG TDM Team
Fort Worth/Tarrant Loop 820/White Settlement Road FWTA Park-and-Ride Study Performed by NCTCOG TDM Team
Fort Worth/Tarrant I.H.30/I.H.820 FWTA Park-and-Ride Study Performed by NCTCOG TDM Team
Fort Worth/Tarrant I.H. 20/I.H. 30 Merge FWTA Park-and-Ride Study Performed by NCTCOG TDM Team
Fort Worth/Tarrant I.H. 20/Aledo FWTA Park-and-Ride Study Performed by NCTCOG TDM Team
Fort Worth/Tarrant Altamesa Dirks Road/Granbury Road FWTA Park-and-Ride Study Performed by NCTCOG Transit Team
Fort Worth/Tarrant Lancaster/Pine Street FWTA Park-and-Ride Study Performed by NCTCOG Transit Team
Exhibit 10-4 continues on next page
North Central Texas Council of Governments 128

Mobility 2030 – 2009 Amendment 10. Travel Demand Management
Exhibit 10-4. Inventory of Candidate Park-and-Ride Facilities
City/County Candidate Locations Source Comments Fort Worth/Tarrant Loop 820/Mansfield Hwy. FWTA Park-and-Ride Study Performed by NCTCOG
TDM Team Fort Worth/Tarrant Loop 820/Lancaster FWTA Park-and-Ride Study Performed by NCTCOG
Transit Team Fort Worth/Tarrant I.H. 30/Eastchase Pkwy. FWTA Park-and-Ride Study Performed by NCTCOG
TDM Team Grapevine/Tarrant Grapevine – Main Street FWTA Alternatives Analysis
for the Cotton Bowl Corridor Performed by NCTCOG Transit Team
Grapevine/Tarrant DFW North Park-and-Ride FWTA Alternatives Analysis for the Cotton Bowl Corridor
Performed by NCTCOG Transit Team
North Richland Hills/Tarrant Loop 820 – North Richland Hills FWTA Alternatives Analysis for the Cotton Bowl Corridor
Performed by NCTCOG Transit Team
North Richland Hills/Tarrant Main – Davis FWTA Alternatives Analysis for the Cotton Bowl Corridor
Performed by NCTCOG Transit Team
As part of the 2006 Local Air Quality Call for Projects, the Regional Transportation Council approved the
funding of park-and-ride facilities in the Rowlett/Rockwall County area, Grand Prairie/Dallas County area,
and the expansion of the Parker Road Station in the Plano/Collin County area. This stance recognizes the
fact that commuters from the outer suburbs and neighboring communities are also contributing to air quality
problems. In fact, some vanpools presently operating in the area are eliminating single-occupant vehicle
round trips that are 80 or more miles long. Ridesharing from these areas into the nonattainment region is
one way to assist in meeting air quality goals.
The geographical scope of park-and-ride facility infrastructure including existing, planned, and candidate
sites, is provided in Exhibit 10-5. While many park-and-ride facilities exist primarily in transit service areas,
other facilities are planned for fringe counties of the nonattainment area. Federal and local funding has
been identified for several projects occurring outside of transit service areas.
The cost of the 48 recommended park-and-ride programs is estimated to be $99 million (2006 dollars).
Expected benefits include a reduction of over 320,000 vehicle miles of travel per day, and a reduction of
over 8,000 vehicle hours of delay per day.
TRANSPORTATION MANAGEMENT ASSOCIATIONS Transportation Management Associations (TMAs), also known as Transportation Management
Organizations or TMOs, are private and public/private organizations that implement congestion mitigation
strategies and work together on local transportation issues. Many are incorporated, non-profit
organizations; they tend to be membership organizations, made up of employers, developers, building
owners, and local government representatives. Most TMAs are located in areas of dense employment and
focus on the TDM programs of public and private employers.
In recent years, TMAs have played increased roles in new areas, including CMP development, ITS
initiatives, and in development of residential and tourism travel markets. Usually, the principle role of a TMA
is to involve the business community in transportation planning and to provide a forum for the private sector
North Central Texas Council of Governments 129
Mobility 2030 – 2009 Amendment 10. Travel Demand Management
Exhibit 10-5. Park-and-Ride Facilities
to impact strategy development and implementation. The following non-exhaustive list demonstrates the
variety of transportation activities in which TMAs can be involved:
• Advocacy on transit, roadway, bicycle, pedestrian, land use, and air quality issues;
• Transit pass subsidy or voucher programs;
• Shuttles or vanpools for employees, customers, or both;
• Ridematching services and support for carpools and vanpools;
• Parking management programs;
• Guaranteed or emergency ride home programs;
• Telecommuting/teleconferencing center(s) operation;
• Employee transportation coordinator training;
• Promotional programs and incentives for alternative travel modes; and
• Educational programs.
Taking advantage of future rail transit and HOV system options, while partnering with transportation/transit
authorities and other transportation agencies, will strengthen the influence of TMAs attempting to improve
mobility and accessibility within and around major employment and activity centers.
Two TMAs currently operate within the DFW Metropolitan Area. The Central Dallas Association operates a
TMA in the Dallas CBD and Downtown Fort Worth, Inc. functions as the TMA for the Fort Worth CBD.
North Central Texas Council of Governments 130

Mobility 2030 – 2009 Amendment 10. Travel Demand Management
Emerging TMAs include the Richardson-North Central Expressway TMA and the East Side Farmers Branch
TMA. These organizations will impact transportation strategy implementation in their respective areas.
Studies are underway to assess the feasibility of future TMAs within the Metropolitan Planning Area.
Candidate TMA locations are recommended through technical, feasibility, and Major Investment Studies.
Considerations used to identify these locations include employment densities in future years, as well as the
location and magnitude of traffic congestion. As MISs are initiated, candidate sites should be included in
corridor-level evaluations. The environmental process will be the forum for further evaluation and
refinement of candidate locations. Existing and candidate TMA service areas are listed in Exhibit 10-6.
Exhibit 10-6. Inventory of Existing and Candidate Transportation Management Associations
County Location Source Status/Comments Dallas Downtown Dallas Feasibility Study Currently operating
[Central Dallas Association] Tarrant Downtown Fort Worth Feasibility Study Currently operating
[Downtown Fort Worth, Inc.] Dallas East Side Farmers Branch Regional Analysis Planning stage Dallas Richardson/North Central Expressway Local Initiative Planning stage Collin Legacy Park (Plano) Regional Analysis Candidate location Dallas Beltline Road Northwest Corridor MIS Candidate location Dallas I.H. 635/Valwood Parkway Northwest Corridor MIS Candidate location Dallas I.H. 635/Stemmons Northwest Corridor MIS Candidate Location Dallas I.H. 35E/Walnut Hill Northwest Corridor MIS Candidate location Dallas S.H. 114/S.H. 161 Northwest Corridor MIS Candidate location Dallas S.H. 114/North Irving Transit Center Northwest Corridor MIS Candidate location Dallas S.H. 183 Northwest Corridor MIS Candidate location Dallas Walnut Hill Area Loop 12 MIS Candidate location Dallas S.H. 190/Plano Parkway Corridor Regional Analysis Candidate location Dallas Stemmons Corridor
(north of Loop 12) Northwest Corridor MIS Candidate location
Dallas S.H. 114 Corridor (north of S.H. 183) S.H. 114/S.H. 121 MIS Candidate location Dallas Stemmons Corridor
(north of the Dallas CBD) Stemmons Business Corridor TMA Feasibility Study
Candidate location
Dallas Dallas North Tollway (vicinity of I.H. 635)
Regional Analysis Candidate location
Dallas Dallas North Tollway (vicinity of S.H. 121)
Regional Analysis Candidate location
Dallas I.H. 635 and U.S. 75 interchange Regional Analysis Candidate location Dallas Garland Employment District Regional Analysis Candidate location Tarrant Grapevine area
(north of DFW Airport) S.H. 114/S.H. 121 MIS Candidate location
Tarrant S.H. 360 Corridor (north of I.H. 30) Regional Analysis Candidate location
The estimated cost of providing start-up funds for these TMAs is expected to be approximately $1.2 million
per year (2006 dollars) at full program implementation. Since TMAs play such a strong supporting role in
ETR programs, the effects of this program are assumed to be captured in the ETR Program described
earlier in this chapter.
North Central Texas Council of Governments 131

Mobility 2030 – 2009 Amendment 10. Travel Demand Management
Policy Guidance TMAs obtaining start-up funds from NCTCOG (available for up to two years) must provide a written
business plan prior to accessing funds. This business plan should explain operating and funding plans for
at least the first two years of operation. In addition, it should describe planned TMA activities and programs,
the expected duration of these programs, and potential regional and local benefits created by their
implementation. Regular performance reporting is required; therefore, the business plan should identify
performance criteria by which program success will be measured.
After the first two years, only primary and secondary transportation services are eligible for funding by
NCTCOG. Primary services reduce drive-alone or peak period travel by either providing TDM services
directly or by promoting the use of alternative travel modes. Secondary transportation services include the
provision of information regarding TDM Program options and advocacy of alternative travel modes.
The current NCTCOG task force structure (Travel Demand Management/Congestion Management Process
Task Force) will assist in the implementation and guidance of TMA development and operation. Direction,
advice, insight, and partnership assistance can be provided to groups interested in creating a TMA. The
task force will also monitor the progress of TMAs in order to assess how well TDM programs are being
implemented.
FINAL COMMENTS The choices travelers make regarding their mode and time of travel impacts the levels of mobility,
accessibility, and air quality. By reducing the number of people driving alone (demand), the capacity of the
transportation system (supply) is more efficiently utilized. Thus, the goals of mobility, accessibility, and air
quality are positively affected. Therefore, the importance of TDM strategies cannot be understated. Mobility
2030 recommends a set of low-cost, quick-implementation options that complement the various
transportation system recommendations.
Changes in technology, the workplace, business travel, and personal travel, will certainly affect the
effectiveness of TDM strategies. Consequently, refinements of TDM strategies are inevitable. Future
versions of the plan will include revised strategies in addition to new and innovative strategies.
Because Major Investment Studies analyze detailed travel characteristics and work closely with local
governments and the public, they provide an opportunity to study the feasibility and implementation of TDM
programs in a transportation corridor. Major Investment Studies are not only a source of new TDM
strategies, but are a forum that can be used to refine recommendations presented in Mobility 2030. TDM
projects and programs should, at the very least, be recommended in addition to major infrastructure and
other improvements in an MIS corridor. These strategies can complement the standard capacity
improvements and infrastructure by supporting alternate means of travel. No MIS should be approved
North Central Texas Council of Governments 132

Mobility 2030 – 2009 Amendment 10. Travel Demand Management
without the proper consideration of TDM (and TSM) projects in a study corridor. Appropriate implementation
agencies should seek applicable funding sources for the recommended projects and programs.
ENVIRONMENTAL JUSTICE
Environmental justice is taken into account in TDM strategies. Various park-and-ride facilities are located in
and around protected class population areas. Park-and-rides are essential facilities that can offer the public
alternatives to driving alone by making it a meeting point for vanpooling, carpooling, or taking transit when
available. There are a total of 49 existing, 18 planned, and 32 candidate park-and-ride facilities. Exhibit
10-7 through Exhibit 10-9 illustrate how many park-and-rides are located in areas which have an above
regional average of protected population classes.
Vanpool services are available in environmental justice protected class areas. Currently, the T and DART
operate the regional vanpool program. Vanpools originate and have a destination throughout the Dallas-
Fort Worth region. Exhibit 10-10 and Exhibit 10-11 illustrate how many vanpools have originations and
destinations located in the Metropolitan Transportation Planning Areas which have an above regional
average of protected population classes.
Exhibit 10-7. Inventory of Existing Park-and-Ride Facilities
in Protected Population Areas Protected
Population Classes Dallas Tarrant Collin Denton Poverty 15 9 3 Disabled 16 4 2 Black 8 6 Hispanic 3 5 American Indian 2 4 1 Asian 2 3 1 65 and Over 8 3 1 14 and Under 4 4 Female Household 9 2
Exhibit 10-8. Inventory of Planned Park-and-Ride Facilities
in Projected Population Areas
Protected Population Classes Dallas Tarrant Collin Denton Johnson
Poverty 5 1 5 Disabled 5 1 1 1 Black Hispanic 5 American Indian 2 1 1 Asian 1 65 and Over 2 1 14 and Under 6 3 1 Female Household 1
North Central Texas Council of Governments 133

Mobility 2030 – 2009 Amendment 10. Travel Demand Management
Exhibit 10-9. Inventory of Candidate Park-and-Ride Facilities
in Protected Population Areas
Protected Population Classes Dallas Tarrant Collin Ellis
Poverty 8 Disabled 2 9 1 Black 1 3 Hispanic 1 American Indian 2 5 Asian 6 1 65 and Over 1 6 1 14 and Under 1 2 1 Female Household 3 3
Exhibit 10-10. Inventory of the Region’s Vanpools Originating in Protected Population Areas
Protected Population Classes Dallas Tarrant Collin Denton Ellis Johnson Rockwall
Poverty 10 20 1 1 2 5 Disabled 14 27 5 1 3 10 1 Black 10 18 1 1 Hispanic 2 13 1 2 2 American Indian 5 23 3 4 3 4 Asian 4 16 4 3 1 65 and Over 14 25 1 3 3 13 14 and Under 20 35 12 8 4 6 Female Household 15 24 3 1 6
Exhibit 10-11. Inventory of the Region’s Vanpools with a
Destination in Protected Population Areas
Protected Population Classes Dallas Tarrant Collin Denton
Poverty 28 11 2 Disabled 12 38 Black 8 11 1 Hispanic 14 1 American Indian 8 9 2 Asian 13 9 65 and Over 8 1 14 and Under 5 22 6 1 Female Household 1 2 6
RECOMMENDATIONS The primary goal of the TDM Program is to promote strategies that reduce the demand for drive-alone travel
on roadways by offering alternatives to single occupancy vehicle driving. Program results should improve
mobility, accessibility, and air quality within the region. TDM programs should adhere to the program
descriptions listed in Exhibit 10-12.
North Central Texas Council of Governments 134

Mobility 2030 – 2009 Amendment 10. Travel Demand Management
Exhibit 10-12. TIP Reference Table – Travel Demand Management
Reference Description of Projects, Programs, and Policies TDM2100 Employer Trip Reduction Program. TDM3101 Voluntary program should target the region’s large employers (100+ employees). TDM3102 Program focus should be within and outside transit service areas, and within
nonattainment area. TDM3103 Comprehensive programs should include carpool/vanpool support, transit incentives,
telecommuting, etc. TDM3104 Performance reporting is required. TDM2200 Vanpool Subsidy Program. TDM3201 Program should target long HBW trips. TDM3202 Vanpools must have either their origin or destination inside nonattainment area. TDM3203 Fare structure should be established so that public subsidy does not exceed
50 percent of total operating cost. TDM3204 Vans should be fuel-efficient or low-emitting vehicles when possible. TDM3205 Vanpool programs should not compete with one another. TDM3206 Performance reporting is required. TDM2300 Park-and-ride facilities. TDM3301 Projects should seek to maximize local government involvement as sponsor. TDM3302 Projects should seek to include public/private partnerships in park-and-ride development
and operation. TDM3303 Facilities should be located and designed to serve HOV lanes, bus and rail transit,
vanpools, carpools, and other forms of ridesharing. TDM3304 Facilities should be located to serve long commute trips into the nonattainment area. TDM2400 Transportation Management Associations. TDM3401 Primary transportation services are the reduction of drive-alone or peak period travel by 1)
providing TDM services, and 2) promoting alternative travel modes. TDM3402 Secondary transportation services include information provision and advocacy services. TDM3403 A written business plan (delivered and approved prior to accessing funds) must be
submitted to the Metropolitan Planning Organization. The business plan will detail the purpose of the program, funding plan, program oversight, and coordination of strategies with other transportation/transit authorities and TMAs, and outline of performance reporting.
TDM3404 Coordination with other local and/or regional TDM interest groups. TDM3405 Performance reporting is required. TDM3000 TDM projects as part of a comprehensive transportation infrastructure improvement in an
MIS corridor.
North Central Texas Council of Governments 135

This page intentionally left blank.
136