Embed Size (px)
Citation preview
City of El Paso de Robles
Travel Demand Forecasting Model:
Final
Prepared by:Prepared for:
160 W. Santa Clara StreetSuite 675San José, CA 95113
August 5, 2009
Final
Paso Robles Travel Demand Forecasting Model
Prepared for:
City of El Paso de Robles
Prepared by:
Fehr & Peers
August 5, 2009
SJ07-1014
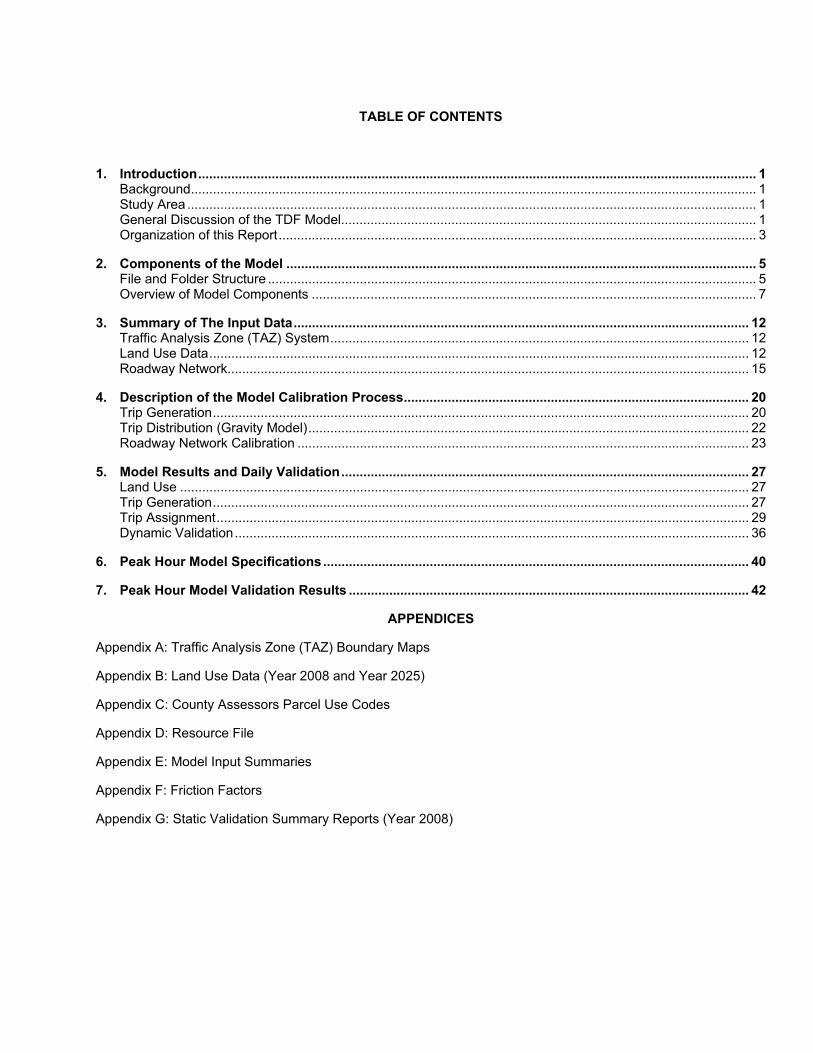
TABLE OF CONTENTS
1. Introduction........................................................................................................................................................ 1Background.......................................................................................................................................................... 1Study Area ........................................................................................................................................................... 1General Discussion of the TDF Model................................................................................................................. 1Organization of this Report.................................................................................................................................. 3
2. Components of the Model ................................................................................................................................ 5File and Folder Structure ..................................................................................................................................... 5Overview of Model Components ......................................................................................................................... 7
3. Summary of The Input Data............................................................................................................................ 12Traffic Analysis Zone (TAZ) System.................................................................................................................. 12Land Use Data................................................................................................................................................... 12Roadway Network.............................................................................................................................................. 15
4. Description of the Model Calibration Process.............................................................................................. 20Trip Generation.................................................................................................................................................. 20Trip Distribution (Gravity Model)........................................................................................................................ 22Roadway Network Calibration ........................................................................................................................... 23
5. Model Results and Daily Validation............................................................................................................... 27Land Use ........................................................................................................................................................... 27Trip Generation.................................................................................................................................................. 27Trip Assignment................................................................................................................................................. 29Dynamic Validation............................................................................................................................................ 36
6. Peak Hour Model Specifications.................................................................................................................... 40
7. Peak Hour Model Validation Results ............................................................................................................. 42
APPENDICES
Appendix A: Traffic Analysis Zone (TAZ) Boundary Maps
Appendix B: Land Use Data (Year 2008 and Year 2025)
Appendix C: County Assessors Parcel Use Codes
Appendix D: Resource File
Appendix E: Model Input Summaries
Appendix F: Friction Factors
Appendix G: Static Validation Summary Reports (Year 2008)
LIST OF FIGURES
Figure 1 Model Area ........................................................................................................................................... 4
Figure 2 – Model User Interface ................................................................................................................................ 5
Figure 3 – File and Folder Structure .......................................................................................................................... 6
Figure 4 – Components of the City of Paso Robles Travel Demand Model .............................................................. 8
Figure 6 Base Year (2008) Roadway Functional Classification ....................................................................... 24
Figure 7 Base Year (2008) Roadway Total Through Lanes ............................................................................. 25
Figure 8 Base Year (2008) Roadway Free-Flow Speed .................................................................................. 26
Figure 9 Daily Validation Locations .................................................................................................................. 30
Figure 10 Daily and Peak Hour Screenline Locations ........................................................................................ 31
Figure 11 Daily Model Validation by Location .................................................................................................... 33
Figure 12 Daily Model Validation Scatter Plots .................................................................................................. 34
Figure 13 AM Peak Hour Validation Locations ................................................................................................... 45
Figure 14 AM Peak Hour Model Validation by Location ..................................................................................... 46
Figure 15 AM Peak Hour Model Validation Scatter Plots ................................................................................... 47
Figure 16 PM Peak Hour Model Validation by Location ..................................................................................... 48
Figure 17 PM Peak Hour Model Validation Scatter Plots ................................................................................... 49
Figure A-1 Traffic Analysis Zones (TAZ) – Key Map ............................................................................................. 2
Figure A-2 Traffic Analysis Zones (TAZ) – Inset 1 ................................................................................................. 3
Figure B-1A Residential (DU) Change (2025-2008) ............................................................................................ 2
Figure B-1B Commercial (KSF) Change (2025-2008) ......................................................................................... 3
Figure B-2A Industrial (KSF) Change (2025-2008) .............................................................................................. 4
LIST OF TABLES
TABLE 1 EXTERNAL STATIONS ............................................................................................................................ 12
TABLE 2 LAND USE CATEGORIES ....................................................................................................................... 13
TABLE 3 LAND USE TYPE RELATIONSHIP TO ASSESSORS’ PARCEL LAND USE CODES ........................... 14
TABLE 4 LINK ATTRIBUTES .................................................................................................................................. 17
TABLE 5 TYPICAL ROADWAY SPEEDS AND CAPACITIES ................................................................................ 18
TABLE 6 NODE ATTRIBUTES ................................................................................................................................ 19
TABLE 7 PERCENT OF VEHICLE TRIPS BY TRIP PURPOSE ............................................................................. 21
TABLE 8 TRIP GENERATION PRODUCTION AND ATTRACTION SUMMARY FOR PASO ROBLES/ATASCADERO ......................................................................................................................................... 22
TABLE 9 BASE YEAR LAND USE COMPARISON ................................................................................................ 27
TABLE 10 TRIP PRODUCTION TO ATTRACTION RATIOS BY PURPOSE ......................................................... 28
TABLE 11 RESULTS OF DAILY MODEL VALIDATION ......................................................................................... 35
TABLE 12 RESULTS OF DAILY MODEL VALIDATION BY FUNCTIONAL CLASS .............................................. 35
TABLE 13 RESULTS OF DAILY MODEL VALIDATION BY VOLUME RANGE ..................................................... 36
TABLE 14 RESULTS OF DYNAMIC VALIDATION LAND USE TESTS ................................................................. 38
TABLE 15 RESULTS OF DYNAMIC VALIDATION NETWORK TESTS ................................................................. 39
TABLE 16 PEAK HOUR FACTOR COMPARISON ................................................................................................. 41
TABLE 17 RESULTS OF PEAK HOUR MODEL VALIDATION .............................................................................. 42
TABLE 18 RESULTS OF DAILY MODEL VALIDATION BY FUNCTIONAL CLASS .............................................. 43
TABLE 19 RESULTS OF PEAK HOUR MODEL VALIDATION BY VOLUME RANGE .......................................... 43
City of Paso Robles Model Development Report – FinalJuly 2009
1
1. INTRODUCTION
BACKGROUND
The City of Paso Robles chose to update its travel demand forecasting (TDF) model to support long-range transportation planning efforts and to provide a mechanism for evaluating the potential effects of future land development and transportation improvement projects. The Paso Robles model was created as a sub-area model within the San Luis Obispo Council of Governments (SLOCOG) regional travel demand model. The SLOCOG model was originally created to aid jurisdictions within San Luis Obispo County in creating their own local travel demand models. The Paso Robles model was last updated to 2004 base year conditions. This model update refines the Paso Robles area within the SLOCOG model to reflect 2008 base year land uses and make it a viable planning tool for the local land use and roadway network.
The purpose of this study was to develop a citywide TDF model, update the key model inputs such as land use, road network and trip generation parameters, and validate the model to current (2008) conditions. The Paso Robles TDF model will be used to update the City’s Circulation Element and to generate traffic volume forecasts and other travel demand data for various planning and engineering studies.
Although variations in traffic in Paso Robles occur due to the school year traffic, as well as weekend traffic entering the area from the Central Valley, the model was calibrated and validated to average, mid-week traffic conditions. The land use data, roadway network, and counts reflect April 2008 conditions.
This document describes the model development process, including the sources of data used to develop key model inputs and check them for reasonableness, and presents model validation results, which measure the model’s accuracy.
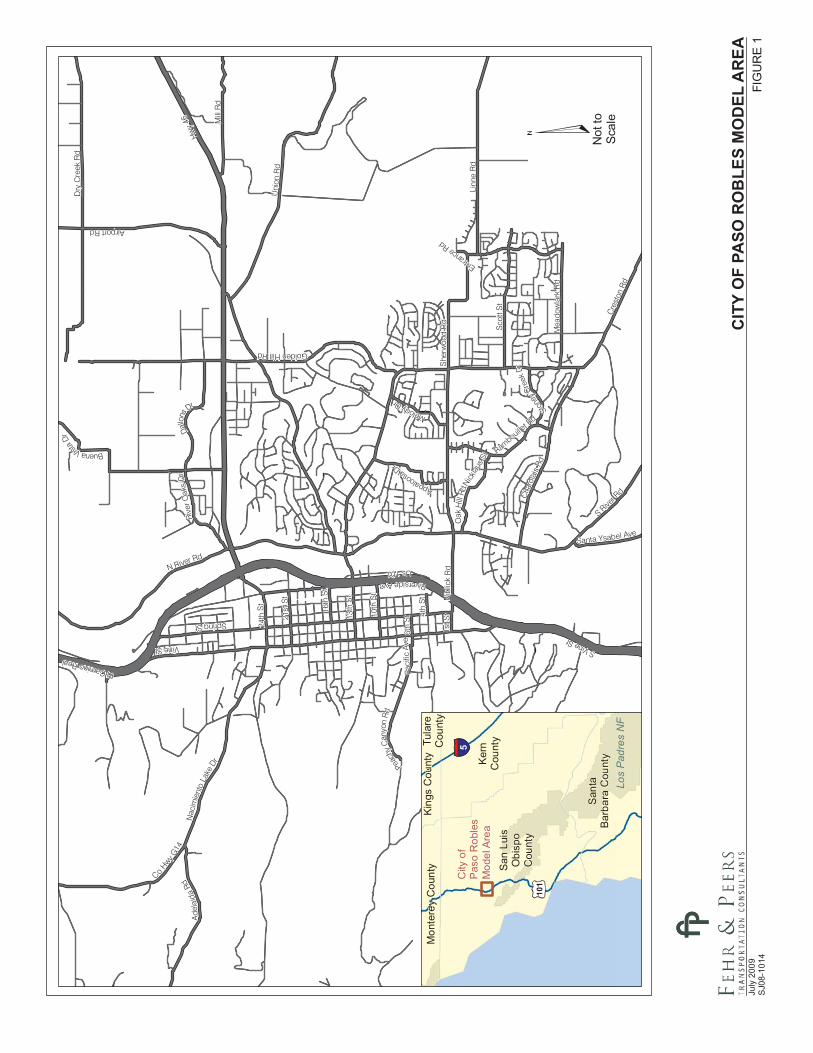
STUDY AREA
Figure 1 shows the study area for the City of Paso Robles travel demand forecasting model. The full, SLOCOG model area encompasses San Luis Obispo County; however, changes to the model were focused in the City of Paso Robles. Areas outside the City were included to allow the City to evaluate the interactions that occur with other areas of San Luis Obispo County. Figure 1 also includes the roadway network, which is described in detail in Chapter 3.
GENERAL DISCUSSION OF THE TDF MODEL
This section summarizes the answers to commonly asked questions related to TDF models and City of Paso Robles’s need for a TDF model.
What is a TDF Model?
A TDF model is a computer program that simulates traffic levels and patterns for a specific geographic area. The program consists of input files that summarize the area’s land uses, street network, travel characteristics, and other key factors. Using this data, the model performs a series of calculations to determine the amount of trips generated, where each trip begins and ends, and the route taken by the trip. The model’s output includes projections of traffic volumes on major roads.
City of Paso Robles Model Development Report – FinalJuly 2009
2
Why Do We Need a TDF Model?
The Paso Robles TDF model is a valuable tool for the preparation of long-range transportation planning studies. The traffic model can be used to estimate the average daily and peak hour traffic volumes on the major roads in response to future growth assumptions. Using these traffic projections, transportation improvements to accommodate traffic growth can be identified.
How Do We Know if the TDF Model is Accurate?
To be deemed accurate for projecting future traffic volumes, a model must first be calibrated to a year for which accurate and well-documented land use data and traffic volumes for the model area are available. A model is considered to be accurately calibrated when it replicates the actual traffic counts on the major roads within certain ranges of error established in the “Travel Forecasting Guidelines,” Caltrans, 1992 and it produces reasonable and stable responses to changes in various inputs. The City of Paso Robles TDF model has been calibrated to 2008 (base year) conditions using actual traffic counts and land use data compiled by City staff. Although 2008 data was used to calibrate the model, the base year within the database is labeled “2004” because the refined model is located within the SLOCOG model, which was calibrated to base year 2004.
The ability of a traffic model to replicate traffic counts is known as model validation. For the daily model validation, 55 roadway segments within the City, two (2) segments of the US 101 mainline, 19 ramps onto US 101 and 6 screen lines were included in the validation process. Traffic counts at these locations were compared with the base year daily, AM peak hour, and PM peak hour model projections to determine the model’s accuracy.
Is the City of Paso Robles TDF Model Consistent with Standard Practices?
The City of Paso Robles TDF model is consistent in form and function with the standard traffic forecasting models used in the transportation planning profession. The model includes a land use/trip generation module, a gravity-based trip distribution model, mixed-flow OD factor matrix for vehicle occupancy, and a capacity-restrained equilibrium traffic assignment process. The traffic model utilizes Version 4.8 (Build 470) of the TransCAD Transportation GIS software, which is consistent with many of the models used by local jurisdictions in California and throughout the nation.
How Can the TDF Model be Used?
The TDF model can be used for many purposes related to planning and design of the City’s transportation system. The following is a partial listing of some of the potential uses of the model.
� To update the General Plan
� To update the Street Master Plan
� To update the city-wide traffic impact fee program
� To evaluate the traffic impacts of area-wide land use plan alternatives
� To evaluate the shift in traffic resulting from a roadway improvement
� To evaluate the traffic impacts of land development proposals
� To determine trip distribution patterns of land development proposals

City of Paso Robles Model Development Report – FinalJuly 2009
3
� To support the development of transportation sections of environmental documents prepared for CEQA compliance
� To support the preparation of project development reports for Caltrans
ORGANIZATION OF THIS REPORT
This report is organized into the following eight sections:
� Chapter 1 – Introduction
� Chapter 2 – Components of the Model
� Chapter 3 – Summary of the Input Data
� Chapter 4 – Description of the Model Calibration Process
� Chapter 5 – Model Results and Daily Validation
� Chapter 6 – Peak Hour Model Specifications
� Chapter 7 – Peak Hour Model Validation Results
� Chapter 8 – Future Year Models
A technical appendix is also attached, which contains model development information and operation analysis that is referenced in this report.
Hw
y 46
Nib
lick
Rd
Golden Hill Rd
She
rwo o
d R
d
Airport Rd
Entrance Rd
Linn
e R
d
Na c
imie
nto
Lake
Dr
Dry
Cre
ek R
d
Cha
rola
is Rd
24th
St
Uni
on R
d
Co Hwy
G14
Cre
ston
Rd
Us 101
El Camino Real
Rambouille
t RdSpring St
16th
St
Ad
elai
da
Rd
Nic
klau
s St
13th
St
1st S
t
Sco
tt S
t
21st
St
Riverside Ave
6th
St
S Vine St
Stone
y Cre
ek D
r
Appaloosa Dr
Riv
er O
aks
Dr
Paci
fic A
ve
4th
St
Mill
Rd
Santa Ysabel Ave
Buena Vista
Dr
Oak
Hill
Rd
Dallo
ns
Dr
Mea
dow
lark
Rd
Melody Dr
S Rive
r Rd
Vine St
10th
St
Peach
y C
anyo
n R
d
N River Rd
CIT
Y O
F PA
SO R
OB
LES
MO
DEL
AR
EAFI
GU
RE
1Ju
ly 2
009
SJ0
8-10
14
Not
toSc
ale
LEG
END
Roa
dway
Los
Pad
res
NF
Mon
tere
y C
ount
yTu
lare
Cou
nty
Kin
gs C
ount
y Ker
nC
ount
yS
an L
uis
Obi
spo
Cou
nty
San
taB
arba
ra C
ount
y
101
5C
ity o
fP
aso
Rob
les
Mod
el A
rea
City of Paso Robles Model Development Report – FinalJuly 2009
5
2. COMPONENTS OF THE MODEL
The Paso Robles travel demand forecasting model utilizes the TransCAD 4.8 Build 470 modeling software. Following is a description of the file and folder structure, followed by a detailed description of the model components. The model structure is the same as the SLOCOG TDF model.
FILE AND FOLDER STRUCTURE
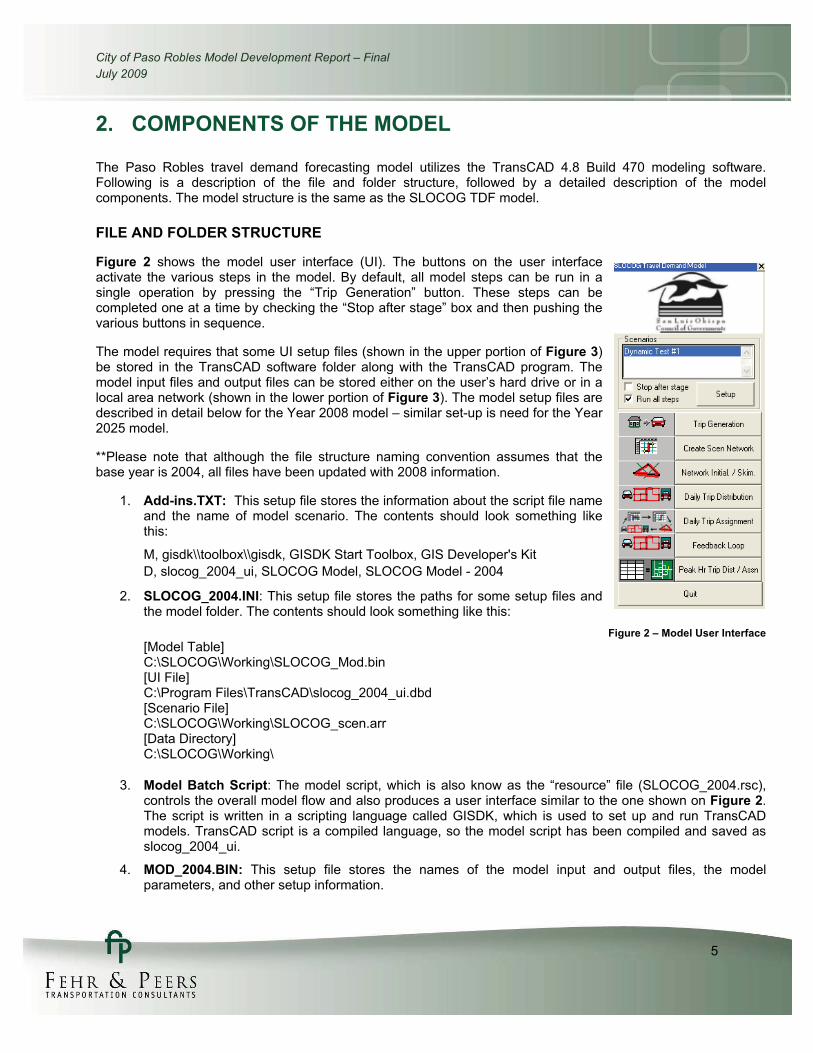
Figure 2 shows the model user interface (UI). The buttons on the user interface activate the various steps in the model. By default, all model steps can be run in a single operation by pressing the “Trip Generation” button. These steps can be completed one at a time by checking the “Stop after stage” box and then pushing the various buttons in sequence.
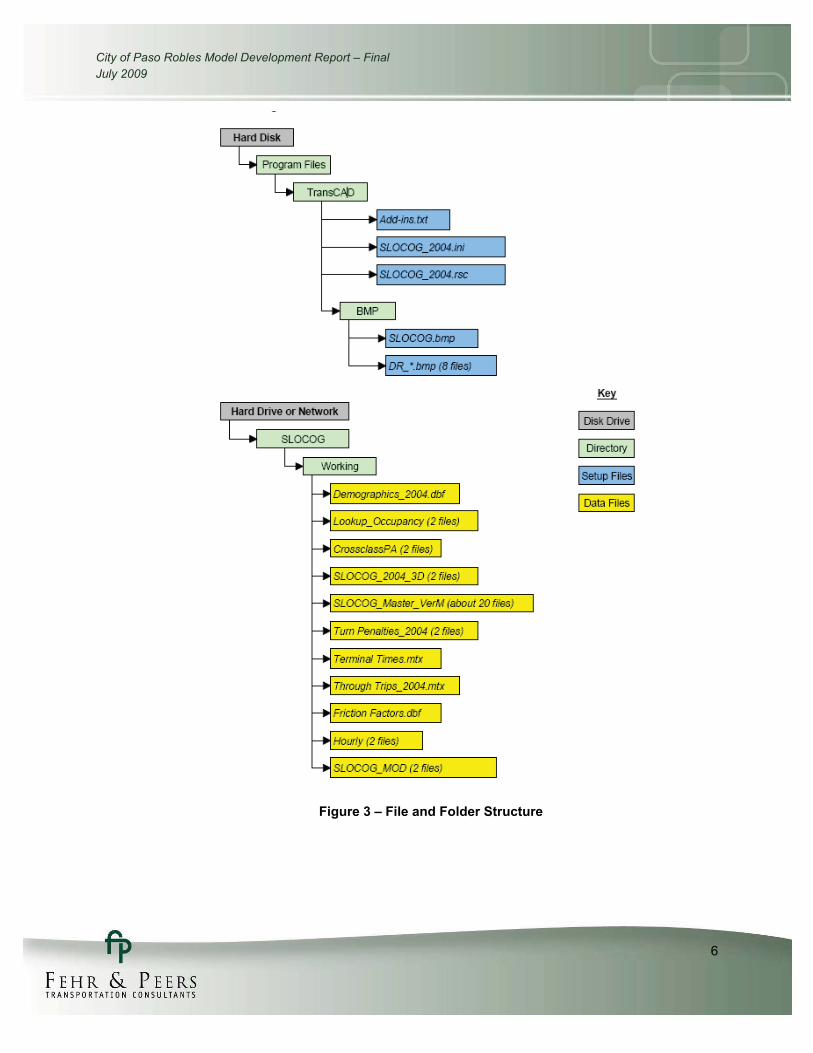
The model requires that some UI setup files (shown in the upper portion of Figure 3)be stored in the TransCAD software folder along with the TransCAD program. The model input files and output files can be stored either on the user’s hard drive or in a local area network (shown in the lower portion of Figure 3). The model setup files are described in detail below for the Year 2008 model – similar set-up is need for the Year 2025 model.
**Please note that although the file structure naming convention assumes that the base year is 2004, all files have been updated with 2008 information.
1. Add-ins.TXT: This setup file stores the information about the script file name and the name of model scenario. The contents should look something like this:
M, gisdk\\toolbox\\gisdk, GISDK Start Toolbox, GIS Developer's Kit D, slocog_2004_ui, SLOCOG Model, SLOCOG Model - 2004
2. SLOCOG_2004.INI: This setup file stores the paths for some setup files and the model folder. The contents should look something like this:
Figure 2 – Model User Interface[Model Table] C:\SLOCOG\Working\SLOCOG_Mod.bin [UI File] C:\Program Files\TransCAD\slocog_2004_ui.dbd [Scenario File] C:\SLOCOG\Working\SLOCOG_scen.arr [Data Directory] C:\SLOCOG\Working\
3. Model Batch Script: The model script, which is also know as the “resource” file (SLOCOG_2004.rsc), controls the overall model flow and also produces a user interface similar to the one shown on Figure 2.The script is written in a scripting language called GISDK, which is used to set up and run TransCAD models. TransCAD script is a compiled language, so the model script has been compiled and saved as slocog_2004_ui.
4. MOD_2004.BIN: This setup file stores the names of the model input and output files, the model parameters, and other setup information.
City of Paso Robles Model Development Report – FinalJuly 2009
6
Figure 3 – File and Folder Structure
City of Paso Robles Model Development Report – FinalJuly 2009
7
OVERVIEW OF MODEL COMPONENTS
The model consists of three kinds of components:
� Input data – The input data are files that represent different aspects of the City’s road system, land use, and travel characteristics.
� Model steps – The model steps are the mathematical calculations that the model completes in determining traffic flows. These steps are performed by model batch script. Some of these steps are applicable to most traffic models, while others are unique to the SLOCOG model.
� Model outputs – The model outputs are data files produced by the model, and some are inputs to other steps in the model.
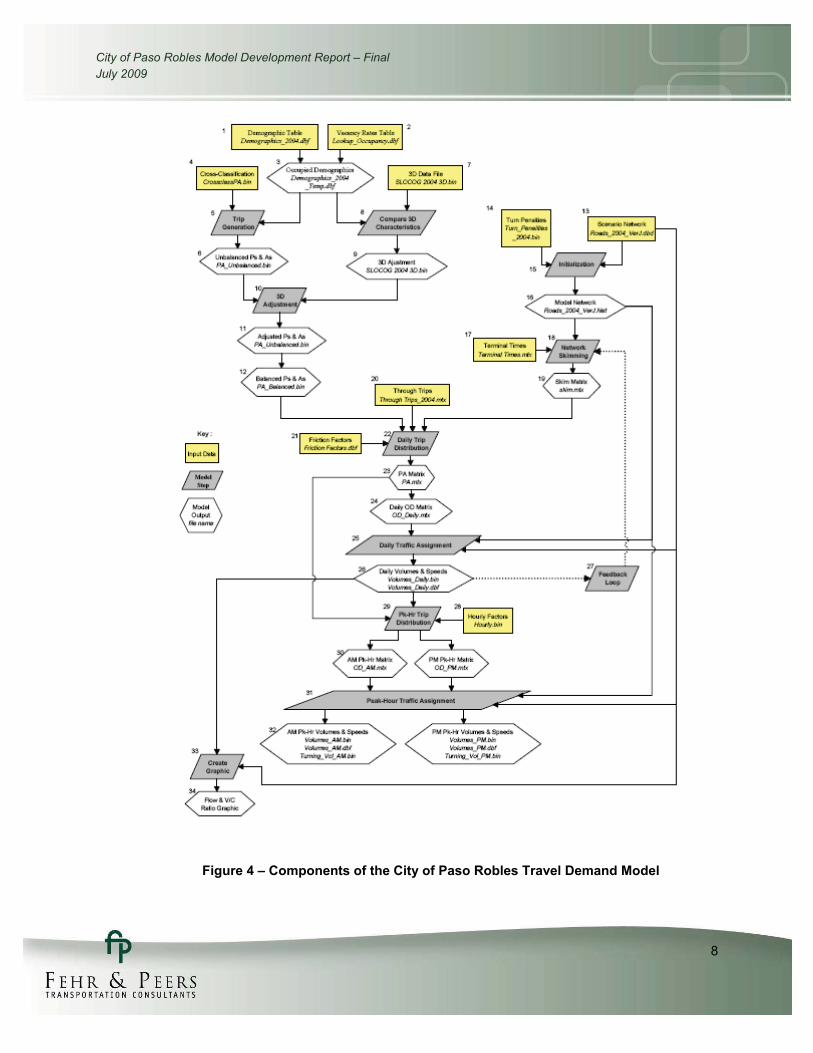
Figure 4 shows the relationship between input and output files. The individual components are described below for each step of the TDF model (trip generation, trip distribution, vehicle occupancy, and trip assignment).
Trip Generation
1. Land Use Table (DEMOGRAPHICS_2004.DBF): This input file stores the land use characteristics of the traffic analysis zones (TAZs) and the external station weights.
The land use data includes such items as the number of single- and multi-family dwelling units (DUs), and the square footage of commercial, office, industrial, and other non-residential land uses.
External station weights (or factors) show the relative amount of traffic to and from each external station. These factors are used to distribute the internal-to-external and external-to-internal trip productions and attractions to the areas external to the traffic model.
2. Occupancy Rates (Lookup_Occupancy.DBF): This contains the place-level occupancy rates for single- and multi-family housing based on the 2000 U.S. Census.
3. Revised Land Use Table (Demographics_2004_temp.DBF): The dwelling units from the land use table are adjusted downwards based on their occupancy rates and stored in this file. The advantage of this approach is that it allows for differences in occupancy rates to be transparent and easily accessible for revision rather than embedded in differences in trip generation rates.
4. Trip Generation Rates (CROSSCLASSPA.BIN): This input file stores the trip generation rates by trip purpose. For example, home-based work and home-based other trips generated per single-family DU have separate trip generation rates.
5. Trip Generation Step: This step multiplies the land use table by the trip generation rates to produce an initial estimate of trip ends. The model then balances the trip production and attraction estimates based on the script file. The model will hold to either productions or attractions, and then factor the other estimate up or down until it equals the selected control. For most trip purposes, the model’s default is to adjust attractions to balance to productions.
6. Unbalanced Trip Ends (PA_Unbalanced.BIN): This output file stores the vehicle trip productions and attractions by trip purpose before the trip-end balancing procedure.
7. 3D Data Storage File (SLOCOG_2004_3D.BIN): This data stores information about the elasticities of trip generation to the Density, Diversity and Design characteristics of each TAZ. It also stores a base case for comparative purposes.
City of Paso Robles Model Development Report – FinalJuly 2009
8
Figure 4 – Components of the City of Paso Robles Travel Demand Model
City of Paso Robles Model Development Report – FinalJuly 2009
9
8. Compare 3D Characteristics Step: This step is a part of trip generation that compares the 3D characteristics of the land use for the scenario in the land use table to those of the base case in the 3D storage file and calculates the appropriate 3D adjustment factors
9. 3D Data Storage File (SLOCOG_2004_3D.BIN): The adjustments produced in the last filed shown in the 3D Data Storage File (7).
10. 3D Adjustment Step: This step is a part of trip generation that applies the 3D adjustment factors to the unbalanced trip ends.
11. Adjusted Trip Ends (PA_Unbalanced.BIN): This file stores the adjusted trip ends by the 3D factors before the trip-end balancing procedure.
12. Balanced Trip Ends (PA_Balanced.BIN): This output file stores the model estimate of vehicle trips for each trip purpose that begin or end in each TAZ.
Create Scenario Network
13. Master Network (Roads_Master_VerA.DBD): This input file is a master highway network that contains highway networks for all scenarios (existing roadways and future roadway improvements). This is a family of files showing the length, location, free-flow speed, capacity, and other characteristics of the roadways in the study area.
14. Create Scenario Network Step: This step creates a scenario-specific highway network file from the master highway network file.
15. Scenario Network (Roads_2004.DBD): This output file is a scenario-specific network generated in the Master Network step. This is a family of files showing the length, location, free-flow speed, capacity, and other characteristics for the specific model year.
Network Initialization
16. Turn Penalty Table (Turn_Penalties_2007.BIN): This input file stores the turning prohibition or delay (in minutes) for specific turning movements in the model network.
17. Network Initialization Step: In this step, the model takes the highway network data and stores it into a format used by TransCAD.
18. Virtual Network (Roads_2004.NET): This output file is a special TransCAD data structure that stores the important highway network data and the turn penalty information. The contents in this file cannot be viewed visually.
Network Skimming
19. Terminal Times Matrix (Terminal_Times.MTX): This file stores the average travel times associates with the start and end of each trip, such as time spent looking for a parking place and parking. The file is in the form of TAZ-to-TAZ matrix, so each cell contains the sum of the terminal times at the origin TAZ and destination TAZ. External trip ends do not have terminal times.
20. Network Skimming Step: This step measures travel times for all possible routes between each pair of TAZs, based on the information contained in the highway network, and determines the shortest route. Then it adds the terminal times.
21. Skim Matrix (Skim.MTX): This output file stores the shortest travel time between each pair of TAZs, including the terminal times. The data is stored in the form of a TAZ-to-TAZ matrix, with each cell showing the shortest travel time in minutes between each pair of zones.
City of Paso Robles Model Development Report – FinalJuly 2009
10
Daily Trip Distribution
22. Through Trips (Through_Trips_2007.MTX): This input file contains the number of through trips, in the form of an origin-destination (OD) matrix for external TAZs.
23. Friction Factors (Friction_Factors.DBF): This input file contains factors determining the relative attractiveness (by trip purpose) of each destination zone based on the travel time between TAZs and the number of potential origins and destinations in each TAZ.
24. Daily Trip Distribution Step: This step uses four input files to determine how trips are distributed among productions and attractions. It then converts them into the origin-destination pairs for the 24-hour period.
25. Production-Attraction Matrix (PA.MTX): This output file contains the trips from the trip generation plus the through trips. This is an intermediate product before determining the directionality of trips.
26. Total Daily OD Matrix (OD_Daily.MTX): This output file stores the daily number of trips between each origin-destination pair for the 24-hour period.
Daily Traffic Assignment
27. Daily Traffic Assignment Step: The model uses an iterative assignment process whereby the quickest route is determined for each of the trips in the daily OD matrix, taking into account congestion caused by other trips.
28. Daily Volumes (Volumes_Daily.DBF): This output file stores the daily model volumes and other outputs on each link. TransCAD typically produces these outputs as *.bin files, but the SLOCOG model also produces *.dbf files with the same information since these types of files are easier to use when linking the model outputs to other software packages.
Feedback Loop
29. Feedback Loop Step: In this step, the model feeds the congested travel time back into the network initialization step and repeats steps 20 through 28. One feedback loop iteration is done by default (i.e., the feedback loop is turned off).
Peak Hour Trip Distribution
30. Hourly Factors (Hourly.BIN): This input file factors the daily OD matrix into the AM and PM Peak Hour OD matrices.
31. Peak Hour Trip Distribution Step: The model uses an iterative assignment process that determines the quickest route for each trip in the AM and PM peak hour OD matrices, taking into account congestion caused by other trips.
32. AM and PM Peak-Hour OD Matrices (OD_AM.MTX, OD_PM.MTX): These output files store the number of trips between each OD pair for the AM and PM peak hours.
Peak Hour Traffic Assignment
33. Peak Hour Traffic Assignment Step: The model uses an iterative assignment process that determines the quickest route for each trip in the AM and PM peak hour OD matrices, taking into account congestion caused by other trips.
34. AM and PM Peak Hour Volumes (Volumes_AM.BIN, Volumes_PM.BIN, Turning_Vol_AM.BIN, Turning_Vol_PM.BIN): Volumes_AM.BIN and Volumes_PM.BIN store the AM and PM peak hour model

City of Paso Robles Model Development Report – FinalJuly 2009
11
volumes and other outputs on each link. The SLOCOG model produces these files in *.dbf format. The model also automatically outputs the turning volumes for study intersections. The user selects the intersection by assigning each of them a unique number in the ‘study intersection’ field of the node layer of the network file.
Create Graphic
35. Create Graphic Step: This step automatically produces a model network map showing the traffic volume as a bandwidth and congestion as a color code.
36. Flow and V/C Ratio Graphic (VC_Ratios.MAP): This graphic is useful to produce because it shows daily traffic volumes as a bandwidth and the volume/capacity ratio as a color code. This graphic can be saved as an image file such as JPEG or BMP for use with other software packages, such as embedding it in a report done in Microsoft Word.
City of Paso Robles Model Development Report – FinalJuly 2009
12
3. SUMMARY OF THE INPUT DATA
TRAFFIC ANALYSIS ZONE (TAZ) SYSTEM
Travel demand models divide the study area into traffic analysis zones (TAZs), which the model uses to connect land uses to the roadway network. The TAZs represent physical areas containing land uses that produce or attract vehicle trip ends. A 2008 parcel-level map was obtained from the City of Paso Robles. TAZ boundaries were sketched based on political boundaries (i.e., city limit) and loading characteristics of the roadway network that include geographic boundaries such as railroad tracks and creeks.
After reviewing the existing TAZ layer used in the SLOCOG model, along with the roadway network and recent aerial photographs, Fehr & Peers refined and subdivided existing TAZ boundaries for Paso Robles area. Large TAZs in Paso Robles were split to add detail and to better replicate loading of vehicle trips to the roadway network, especially in areas where future land use changes are expected. The City of Paso Robles was divided into 232 TAZs (2,100 to 3,246). Detailed maps showing the TAZ numbers in the Paso Robles portions of the model area are included in Appendix A.
TAZs in other areas of the SLOCOG model were not changed. The resulting model’s TAZ system includes 1,389 zones including areas outside of Area 5 (Paso Robles).
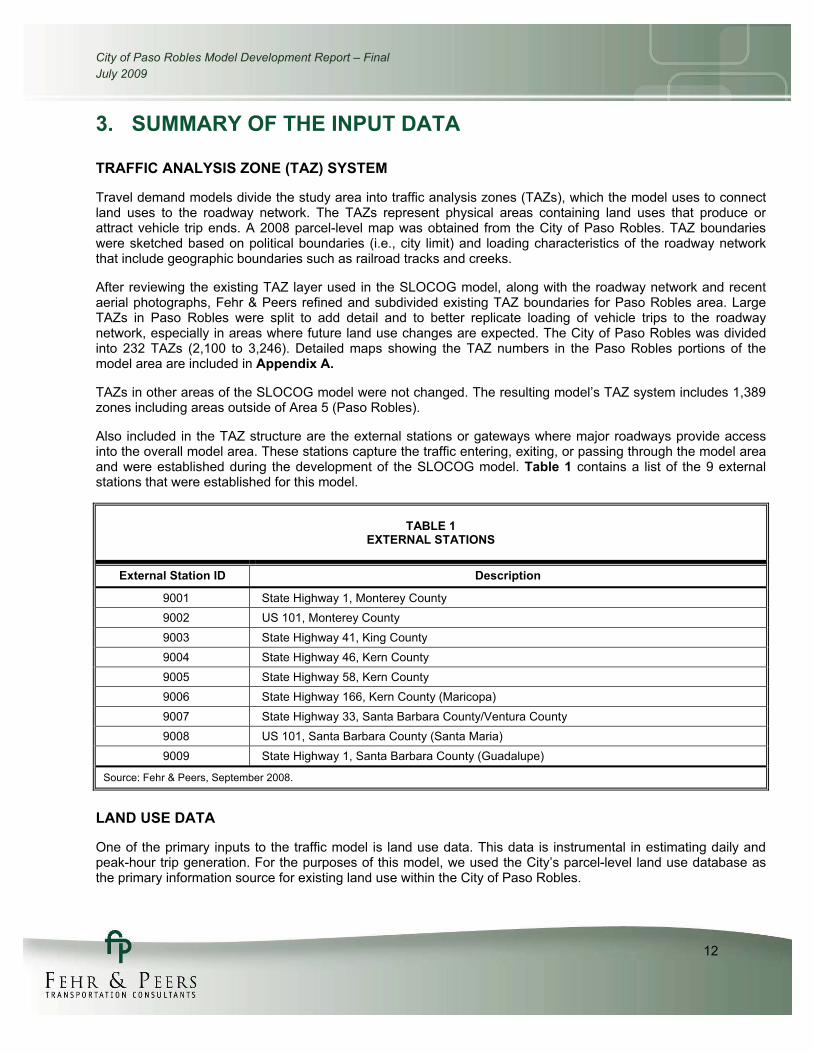
Also included in the TAZ structure are the external stations or gateways where major roadways provide access into the overall model area. These stations capture the traffic entering, exiting, or passing through the model area and were established during the development of the SLOCOG model. Table 1 contains a list of the 9 external stations that were established for this model.
TABLE 1 EXTERNAL STATIONS
External Station ID Description
9001 State Highway 1, Monterey County 9002 US 101, Monterey County 9003 State Highway 41, King County 9004 State Highway 46, Kern County 9005 State Highway 58, Kern County 9006 State Highway 166, Kern County (Maricopa) 9007 State Highway 33, Santa Barbara County/Ventura County 9008 US 101, Santa Barbara County (Santa Maria) 9009 State Highway 1, Santa Barbara County (Guadalupe)
Source: Fehr & Peers, September 2008.
LAND USE DATA
One of the primary inputs to the traffic model is land use data. This data is instrumental in estimating daily and peak-hour trip generation. For the purposes of this model, we used the City’s parcel-level land use database as the primary information source for existing land use within the City of Paso Robles.
City of Paso Robles Model Development Report – FinalJuly 2009
13
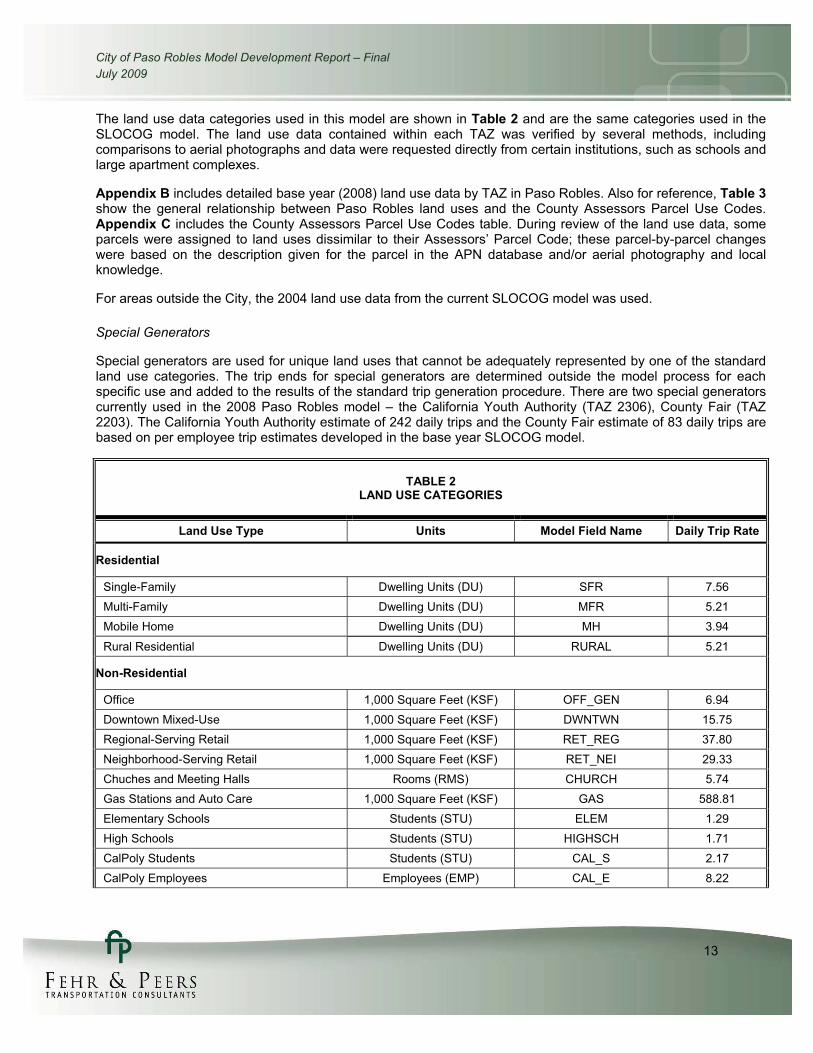
The land use data categories used in this model are shown in Table 2 and are the same categories used in the SLOCOG model. The land use data contained within each TAZ was verified by several methods, including comparisons to aerial photographs and data were requested directly from certain institutions, such as schools and large apartment complexes.
Appendix B includes detailed base year (2008) land use data by TAZ in Paso Robles. Also for reference, Table 3show the general relationship between Paso Robles land uses and the County Assessors Parcel Use Codes. Appendix C includes the County Assessors Parcel Use Codes table. During review of the land use data, some parcels were assigned to land uses dissimilar to their Assessors’ Parcel Code; these parcel-by-parcel changes were based on the description given for the parcel in the APN database and/or aerial photography and local knowledge.
For areas outside the City, the 2004 land use data from the current SLOCOG model was used.
Special Generators
Special generators are used for unique land uses that cannot be adequately represented by one of the standard land use categories. The trip ends for special generators are determined outside the model process for each specific use and added to the results of the standard trip generation procedure. There are two special generators currently used in the 2008 Paso Robles model – the California Youth Authority (TAZ 2306), County Fair (TAZ 2203). The California Youth Authority estimate of 242 daily trips and the County Fair estimate of 83 daily trips are based on per employee trip estimates developed in the base year SLOCOG model.
TABLE 2 LAND USE CATEGORIES
Land Use Type Units Model Field Name Daily Trip Rate
Residential
Single-Family Dwelling Units (DU) SFR 7.56 Multi-Family Dwelling Units (DU) MFR 5.21 Mobile Home Dwelling Units (DU) MH 3.94
Rural Residential Dwelling Units (DU) RURAL 5.21
Non-Residential
Office 1,000 Square Feet (KSF) OFF_GEN 6.94 Downtown Mixed-Use 1,000 Square Feet (KSF) DWNTWN 15.75 Regional-Serving Retail 1,000 Square Feet (KSF) RET_REG 37.80 Neighborhood-Serving Retail 1,000 Square Feet (KSF) RET_NEI 29.33 Chuches and Meeting Halls Rooms (RMS) CHURCH 5.74 Gas Stations and Auto Care 1,000 Square Feet (KSF) GAS 588.81 Elementary Schools Students (STU) ELEM 1.29 High Schools Students (STU) HIGHSCH 1.71 CalPoly Students Students (STU) CAL_S 2.17 CalPoly Employees Employees (EMP) CAL_E 8.22
City of Paso Robles Model Development Report – FinalJuly 2009
14
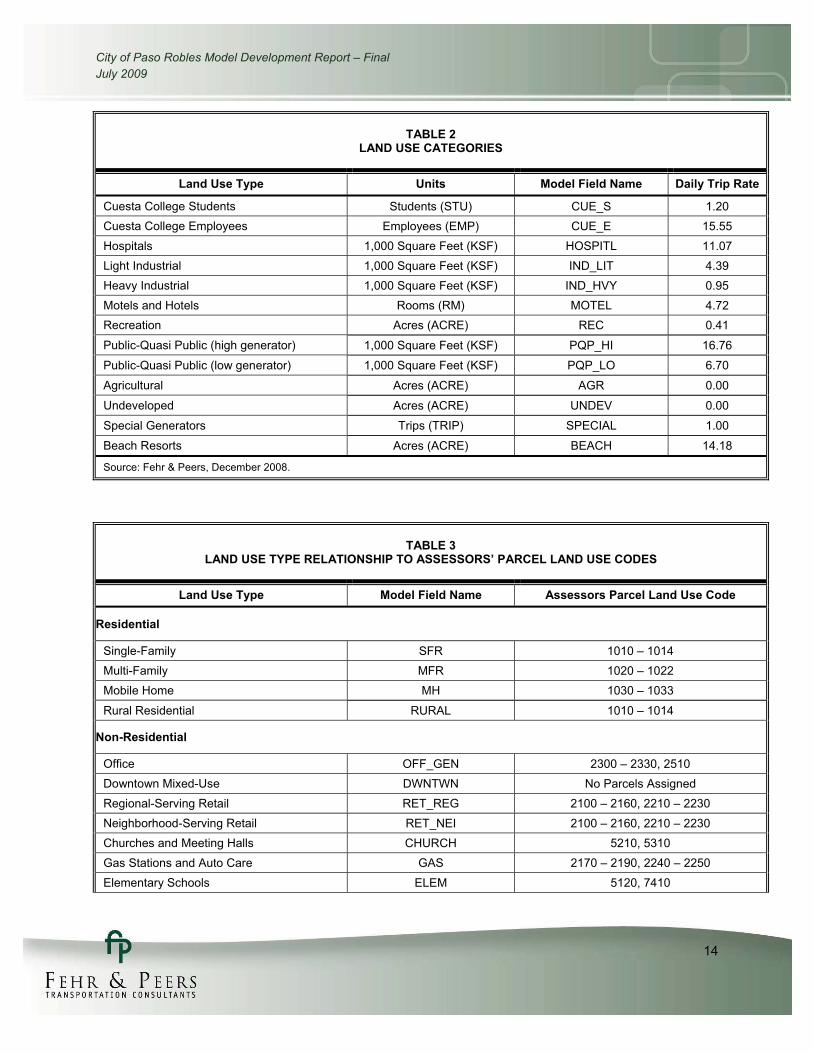
TABLE 2 LAND USE CATEGORIES
Land Use Type Units Model Field Name Daily Trip Rate
Cuesta College Students Students (STU) CUE_S 1.20 Cuesta College Employees Employees (EMP) CUE_E 15.55 Hospitals 1,000 Square Feet (KSF) HOSPITL 11.07 Light Industrial 1,000 Square Feet (KSF) IND_LIT 4.39 Heavy Industrial 1,000 Square Feet (KSF) IND_HVY 0.95 Motels and Hotels Rooms (RM) MOTEL 4.72 Recreation Acres (ACRE) REC 0.41
Public-Quasi Public (high generator) 1,000 Square Feet (KSF) PQP_HI 16.76
Public-Quasi Public (low generator) 1,000 Square Feet (KSF) PQP_LO 6.70
Agricultural Acres (ACRE) AGR 0.00
Undeveloped Acres (ACRE) UNDEV 0.00
Special Generators Trips (TRIP) SPECIAL 1.00
Beach Resorts Acres (ACRE) BEACH 14.18
Source: Fehr & Peers, December 2008.
TABLE 3 LAND USE TYPE RELATIONSHIP TO ASSESSORS’ PARCEL LAND USE CODES
Land Use Type Model Field Name Assessors Parcel Land Use Code
Residential
Single-Family SFR 1010 – 1014 Multi-Family MFR 1020 – 1022 Mobile Home MH 1030 – 1033
Rural Residential RURAL 1010 – 1014
Non-Residential
Office OFF_GEN 2300 – 2330, 2510 Downtown Mixed-Use DWNTWN No Parcels Assigned Regional-Serving Retail RET_REG 2100 – 2160, 2210 – 2230 Neighborhood-Serving Retail RET_NEI 2100 – 2160, 2210 – 2230 Churches and Meeting Halls CHURCH 5210, 5310 Gas Stations and Auto Care GAS 2170 – 2190, 2240 – 2250 Elementary Schools ELEM 5120, 7410
City of Paso Robles Model Development Report – FinalJuly 2009
15
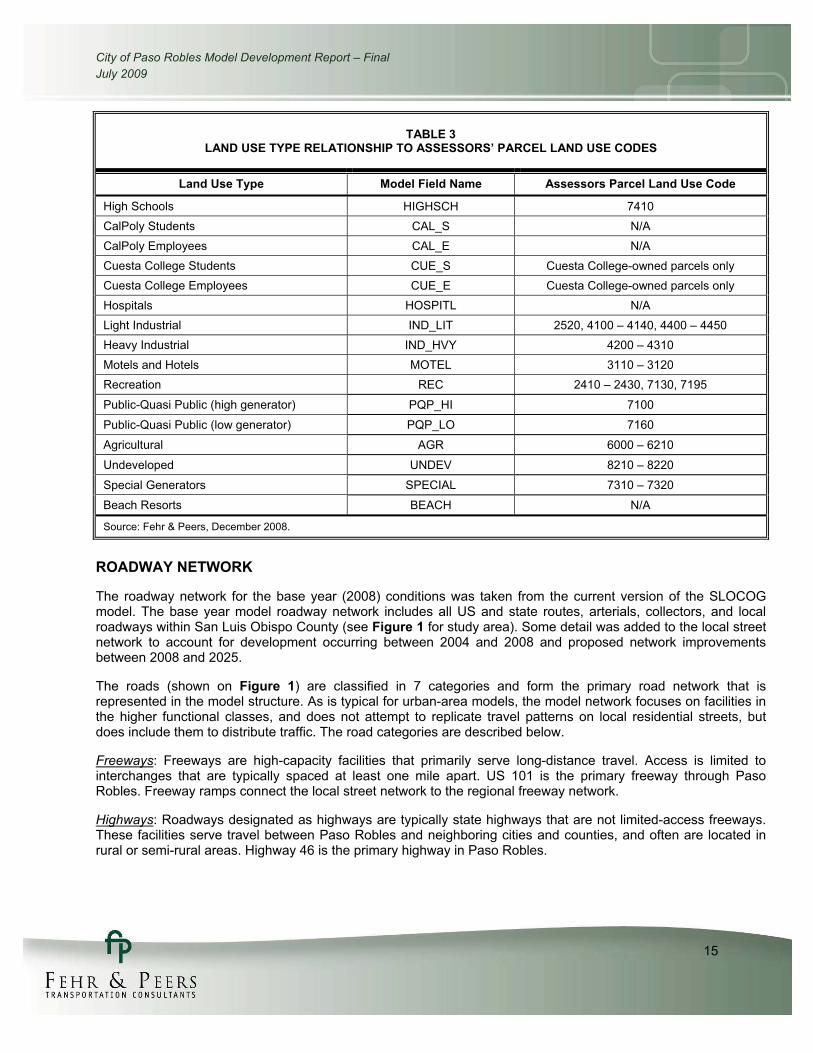
TABLE 3 LAND USE TYPE RELATIONSHIP TO ASSESSORS’ PARCEL LAND USE CODES
Land Use Type Model Field Name Assessors Parcel Land Use Code
High Schools HIGHSCH 7410 CalPoly Students CAL_S N/A CalPoly Employees CAL_E N/A Cuesta College Students CUE_S Cuesta College-owned parcels only Cuesta College Employees CUE_E Cuesta College-owned parcels only Hospitals HOSPITL N/A Light Industrial IND_LIT 2520, 4100 – 4140, 4400 – 4450 Heavy Industrial IND_HVY 4200 – 4310 Motels and Hotels MOTEL 3110 – 3120 Recreation REC 2410 – 2430, 7130, 7195
Public-Quasi Public (high generator) PQP_HI 7100
Public-Quasi Public (low generator) PQP_LO 7160
Agricultural AGR 6000 – 6210
Undeveloped UNDEV 8210 – 8220
Special Generators SPECIAL 7310 – 7320
Beach Resorts BEACH N/A
Source: Fehr & Peers, December 2008.
ROADWAY NETWORK
The roadway network for the base year (2008) conditions was taken from the current version of the SLOCOG model. The base year model roadway network includes all US and state routes, arterials, collectors, and local roadways within San Luis Obispo County (see Figure 1 for study area). Some detail was added to the local street network to account for development occurring between 2004 and 2008 and proposed network improvements between 2008 and 2025.
The roads (shown on Figure 1) are classified in 7 categories and form the primary road network that is represented in the model structure. As is typical for urban-area models, the model network focuses on facilities in the higher functional classes, and does not attempt to replicate travel patterns on local residential streets, but does include them to distribute traffic. The road categories are described below.
Freeways: Freeways are high-capacity facilities that primarily serve long-distance travel. Access is limited to interchanges that are typically spaced at least one mile apart. US 101 is the primary freeway through Paso Robles. Freeway ramps connect the local street network to the regional freeway network.
Highways: Roadways designated as highways are typically state highways that are not limited-access freeways. These facilities serve travel between Paso Robles and neighboring cities and counties, and often are located in rural or semi-rural areas. Highway 46 is the primary highway in Paso Robles.

City of Paso Robles Model Development Report – FinalJuly 2009
16
Arterials: Roadway segments classified as arterials are major roads that provide connections between developed areas of the City or from developed areas to the freeway system. Arterials in Paso Robles typically have one to two lanes in each direction, with travel speeds of 35 to 45 miles per hour (mph).
Collectors: Collectors are facilities that connect local streets to the arterial and highway system, and may also provide direct access to some local land uses. Collectors typically have one lane in each direction and speeds of around 30 mph.
Local Streets: Local streets are facilities that typically serve residential areas and connect collector and arterial streets. Some local streets may also provide direct access to commercial and industrial areas. Local streets typically have one lane in each direction and speeds of 25 mph.
As part of the model development process, modifications were made to the SLOCOG network to reflect the existing roadway system and to improve the model’s forecasting capabilities. These modifications include:
� roadway classifications were corrected to reflect the City’s current Circulation Element;
� roadway speeds were adjusted based on field observations conducted in July 2008;
� roadway links coded as couplets were recoded as single links to make intersection turning movement forecasting easier for end users;
� roadway improvements constructed between 2004 and 2008 were added to the appropriate links;
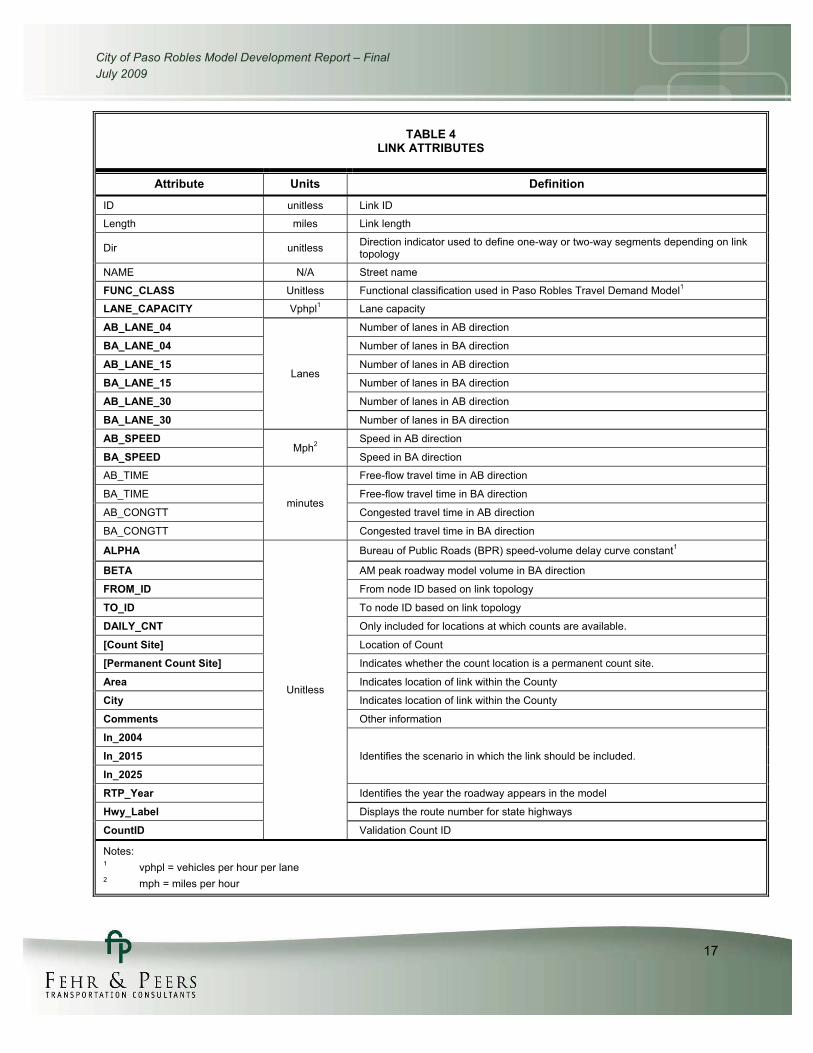
Each roadway segment in the model has a set of data or link attributes attached to it. Table 4 provides a complete list of the link attributes and their definitions. Field visits were conducted to verify lanes and speed limits.
Traffic count data was collected in April of 2008. Data was collected for 55 roadway segments throughout the study area. The roadway segments counts were collected over a seven-day period. The primary use of the count data is to validate the base year model and provide a baseline for travel demand forecast adjustments. The City of Paso Robles TDF model refined the SLOCOG “master roadway network” that includes all input roadway network data for each scenario within one input roadway model network.
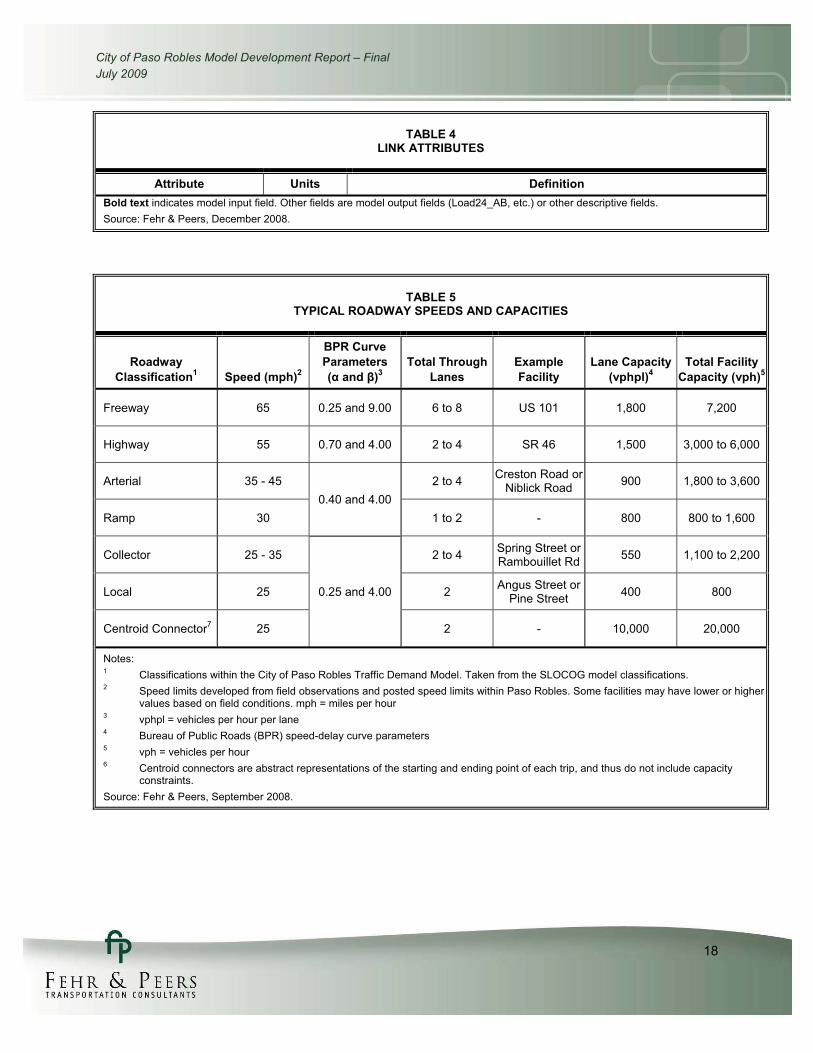
Table 5 shows typical free-flow speed and capacities for each roadway functional classification included in the model. The speeds and capacities represent a typical facility, but may be adjusted to better represent field conditions or as part of the model validation process. The speeds and capacities may vary to account for factors such as the surrounding level of development and are typically reduced as roads pass through urban areas, due to the presence of stop signs, narrow travel lanes, pedestrians, parked vehicles, and other urban features.
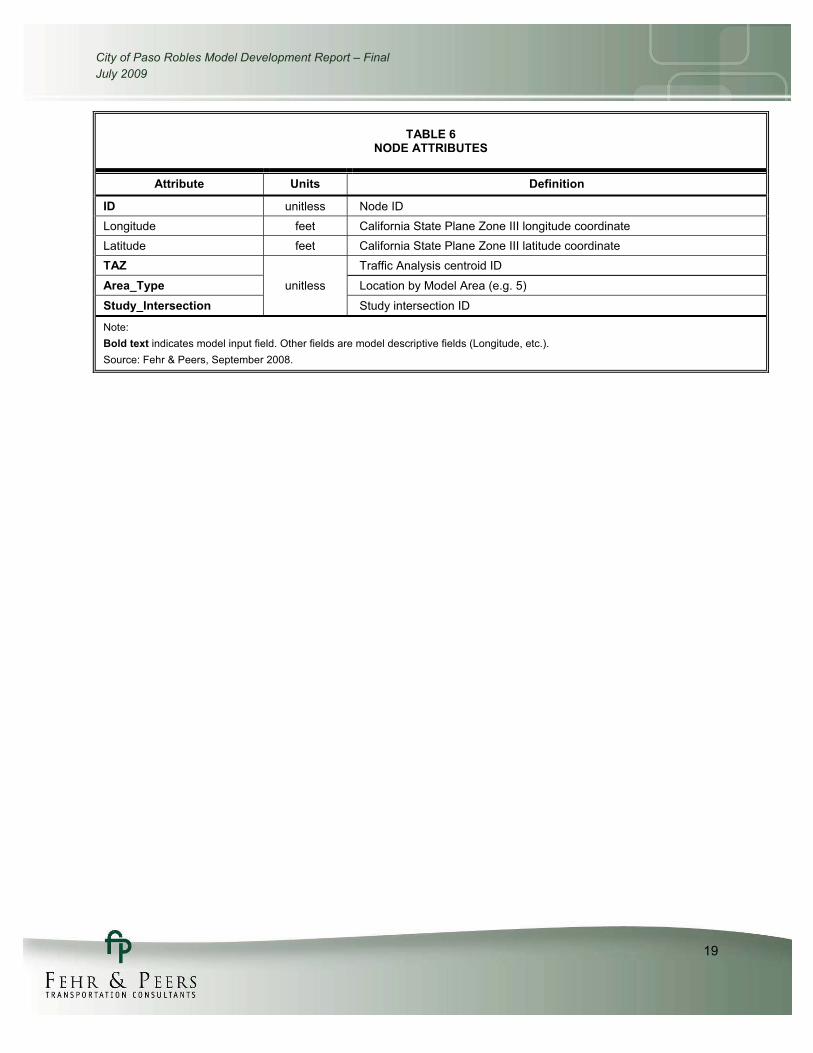
Links in the model are connected by nodes, and the crossing of two links at a node represents an intersection. Centroids are another form of node and represent the physical location of each traffic analysis zone (TAZ). TAZs contain the land use information within the study area. Table 6 shows the node attributes and their definitions.
City of Paso Robles Model Development Report – FinalJuly 2009
17
TABLE 4 LINK ATTRIBUTES
Attribute Units Definition
ID unitless Link ID
Length miles Link length
Dir unitless Direction indicator used to define one-way or two-way segments depending on link topology
NAME N/A Street name
FUNC_CLASS Unitless Functional classification used in Paso Robles Travel Demand Model1
LANE_CAPACITY Vphpl1 Lane capacity
AB_LANE_04
Lanes
Number of lanes in AB direction
BA_LANE_04 Number of lanes in BA direction
AB_LANE_15 Number of lanes in AB direction
BA_LANE_15 Number of lanes in BA direction
AB_LANE_30 Number of lanes in AB direction
BA_LANE_30 Number of lanes in BA direction
AB_SPEED Mph2 Speed in AB direction
BA_SPEED Speed in BA direction
AB_TIME
minutes
Free-flow travel time in AB direction
BA_TIME Free-flow travel time in BA direction
AB_CONGTT Congested travel time in AB direction
BA_CONGTT Congested travel time in BA direction
ALPHA
Unitless
Bureau of Public Roads (BPR) speed-volume delay curve constant1
BETA AM peak roadway model volume in BA direction
FROM_ID From node ID based on link topology
TO_ID To node ID based on link topology
DAILY_CNT Only included for locations at which counts are available.
[Count Site] Location of Count
[Permanent Count Site] Indicates whether the count location is a permanent count site.
Area Indicates location of link within the County
City Indicates location of link within the County
Comments Other information
In_2004
Identifies the scenario in which the link should be included. In_2015
In_2025
RTP_Year Identifies the year the roadway appears in the model
Hwy_Label Displays the route number for state highways
CountID Validation Count ID
Notes:1 vphpl = vehicles per hour per lane 2 mph = miles per hour
City of Paso Robles Model Development Report – FinalJuly 2009
18
TABLE 4 LINK ATTRIBUTES
Attribute Units Definition Bold text indicates model input field. Other fields are model output fields (Load24_AB, etc.) or other descriptive fields. Source: Fehr & Peers, December 2008.
TABLE 5 TYPICAL ROADWAY SPEEDS AND CAPACITIES
Roadway Classification1 Speed (mph)2
BPR Curve Parameters (� and �)3
Total Through Lanes
Example Facility
Lane Capacity (vphpl)4
Total Facility Capacity (vph)5
Freeway 65 0.25 and 9.00 6 to 8 US 101 1,800 7,200
Highway 55 0.70 and 4.00 2 to 4 SR 46 1,500 3,000 to 6,000
Arterial 35 - 45 0.40 and 4.00
2 to 4 Creston Road or Niblick Road 900 1,800 to 3,600
Ramp 30 1 to 2 - 800 800 to 1,600
Collector 25 - 35
0.25 and 4.00
2 to 4 Spring Street or Rambouillet Rd 550 1,100 to 2,200
Local 25 2 Angus Street or Pine Street 400 800
Centroid Connector7 25 2 - 10,000 20,000
Notes:1 Classifications within the City of Paso Robles Traffic Demand Model. Taken from the SLOCOG model classifications. 2 Speed limits developed from field observations and posted speed limits within Paso Robles. Some facilities may have lower or higher
values based on field conditions. mph = miles per hour 3 vphpl = vehicles per hour per lane 4 Bureau of Public Roads (BPR) speed-delay curve parameters 5 vph = vehicles per hour 6 Centroid connectors are abstract representations of the starting and ending point of each trip, and thus do not include capacity
constraints.Source: Fehr & Peers, September 2008.
City of Paso Robles Model Development Report – FinalJuly 2009
19
TABLE 6 NODE ATTRIBUTES
Attribute Units Definition
ID unitless Node ID Longitude feet California State Plane Zone III longitude coordinate Latitude feet California State Plane Zone III latitude coordinate TAZ
unitless
Traffic Analysis centroid ID
Area_Type Location by Model Area (e.g. 5)
Study_Intersection Study intersection ID
Note: Bold text indicates model input field. Other fields are model descriptive fields (Longitude, etc.). Source: Fehr & Peers, September 2008.
City of Paso Robles Model Development Report – FinalJuly 2009
20
4. DESCRIPTION OF THE MODEL CALIBRATION PROCESS
Model calibration is the process by which parameters are set based on a comparison of travel estimates computed by the model with actual data from the area being modeled. This section provides a general description of the calibration steps and the adjustments made during the process to achieve accuracy levels that are within Caltrans’ guidelines. For detailed information regarding the specified modeling steps, refer to the TransCAD model control file that is included in Appendix E.
TRIP GENERATION
The trip generation rates shown in Table 2 relate the number of vehicle trips going to and from a site. Each trip has two ends, a “production” and an “attraction” end. By convention, all trips with one end at a residence are defined as being “produced” by the residence and “attracted” to the other use (job, school, shop, etc.), and are called “home-based” trips. Trips that do not have one end at a residence are called “non-home-based” trips.
There are eight (8) trip purposes used in the Paso Robles TDF model:
1. Home-Based Work (HBW): trips between a residence and a workplace.
2. Home-Based Other (HBO): trips between a residence and any other destination.
3. Non-Home-Based (NHB): trips that do not begin or end at a residence, such as traveling from a workplace to a restaurant, or from a retail store to a bank.
4. Home-Based School (SCHOOL) Trips: trips between a residence and an elementary school, junior high school, high school, or university.
5. Cal Poly University (CALPOLY) Trips: Trips between a residence and Cal Poly San Luis Obispo.
6. Cuesta College (CUESTA) Trips: trips between a residence and Cuesta College.
7. Regional (REGIONAL) Trips: Certain types of land uses, such as hospitals, airports, and large discount stores, attract trips from a wide area. Trips to regional attractors fall into this trip purpose category, which uses a different set of friction factors than trips to local attractors (typically HBO trips). The Paso Robles TDF model regional attractors include California Polytechnic State University and Cuesta College.
8. Magnet (MAGNET) Trips: These are trips to attractions that draw a high percentage of users from outside the county. For example, the state beaches and Hearst Castle get a much higher percentage visitors from outside the model area than most other land uses in the county.
Trip generation rates are initially defined for total trips and later split by trip purpose, for both productions and attractions.
The most widely used source for vehicle trip generation rates in the transportation planning field is the TripGeneration manual published by the Institute of Transportation Engineers (ITE) in 2003, which includes national trip survey data. The Paso Robles model trip generation rates were initially based on those development for the SLOCOG model, which were based on Trip Generation and the San Diego Association of Government’s Trip Generators (2004). The rates were calibrated to account for local conditions based on residential counts, production-to-attraction balancing, and to account for the difference between ITE and model land use definitions.
City of Paso Robles Model Development Report – FinalJuly 2009
21
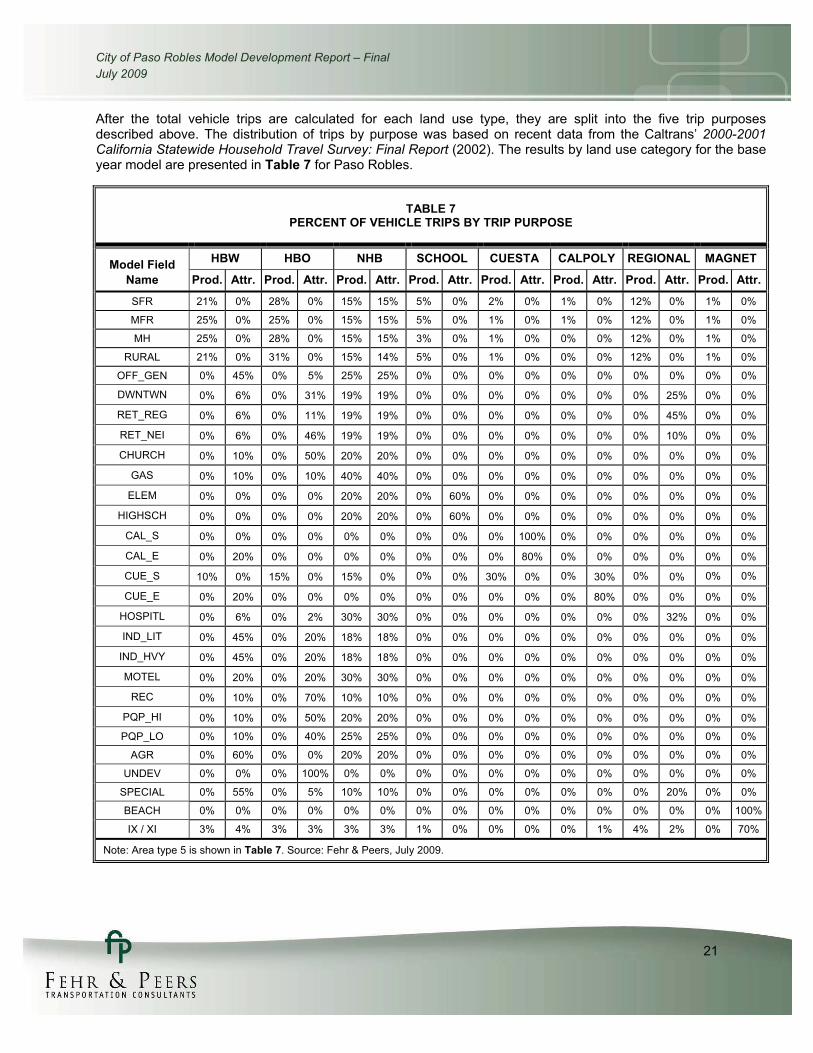
After the total vehicle trips are calculated for each land use type, they are split into the five trip purposes described above. The distribution of trips by purpose was based on recent data from the Caltrans’ 2000-2001California Statewide Household Travel Survey: Final Report (2002). The results by land use category for the base year model are presented in Table 7 for Paso Robles.
TABLE 7 PERCENT OF VEHICLE TRIPS BY TRIP PURPOSE
Model Field Name
HBW HBO NHB SCHOOL CUESTA CALPOLY REGIONAL MAGNET
Prod. Attr. Prod. Attr. Prod. Attr. Prod. Attr. Prod. Attr. Prod. Attr. Prod. Attr. Prod. Attr.
SFR 21% 0% 28% 0% 15% 15% 5% 0% 2% 0% 1% 0% 12% 0% 1% 0%
MFR 25% 0% 25% 0% 15% 15% 5% 0% 1% 0% 1% 0% 12% 0% 1% 0%
MH 25% 0% 28% 0% 15% 15% 3% 0% 1% 0% 0% 0% 12% 0% 1% 0%
RURAL 21% 0% 31% 0% 15% 14% 5% 0% 1% 0% 0% 0% 12% 0% 1% 0%
OFF_GEN 0% 45% 0% 5% 25% 25% 0% 0% 0% 0% 0% 0% 0% 0% 0% 0%
DWNTWN 0% 6% 0% 31% 19% 19% 0% 0% 0% 0% 0% 0% 0% 25% 0% 0%
RET_REG 0% 6% 0% 11% 19% 19% 0% 0% 0% 0% 0% 0% 0% 45% 0% 0%
RET_NEI 0% 6% 0% 46% 19% 19% 0% 0% 0% 0% 0% 0% 0% 10% 0% 0%
CHURCH 0% 10% 0% 50% 20% 20% 0% 0% 0% 0% 0% 0% 0% 0% 0% 0%
GAS 0% 10% 0% 10% 40% 40% 0% 0% 0% 0% 0% 0% 0% 0% 0% 0%
ELEM 0% 0% 0% 0% 20% 20% 0% 60% 0% 0% 0% 0% 0% 0% 0% 0%
HIGHSCH 0% 0% 0% 0% 20% 20% 0% 60% 0% 0% 0% 0% 0% 0% 0% 0%
CAL_S 0% 0% 0% 0% 0% 0% 0% 0% 0% 100% 0% 0% 0% 0% 0% 0%
CAL_E 0% 20% 0% 0% 0% 0% 0% 0% 0% 80% 0% 0% 0% 0% 0% 0%
CUE_S 10% 0% 15% 0% 15% 0% 0% 0% 30% 0% 0% 30% 0% 0% 0% 0%
CUE_E 0% 20% 0% 0% 0% 0% 0% 0% 0% 0% 0% 80% 0% 0% 0% 0%
HOSPITL 0% 6% 0% 2% 30% 30% 0% 0% 0% 0% 0% 0% 0% 32% 0% 0%
IND_LIT 0% 45% 0% 20% 18% 18% 0% 0% 0% 0% 0% 0% 0% 0% 0% 0%
IND_HVY 0% 45% 0% 20% 18% 18% 0% 0% 0% 0% 0% 0% 0% 0% 0% 0%
MOTEL 0% 20% 0% 20% 30% 30% 0% 0% 0% 0% 0% 0% 0% 0% 0% 0%
REC 0% 10% 0% 70% 10% 10% 0% 0% 0% 0% 0% 0% 0% 0% 0% 0%
PQP_HI 0% 10% 0% 50% 20% 20% 0% 0% 0% 0% 0% 0% 0% 0% 0% 0%
PQP_LO 0% 10% 0% 40% 25% 25% 0% 0% 0% 0% 0% 0% 0% 0% 0% 0%
AGR 0% 60% 0% 0% 20% 20% 0% 0% 0% 0% 0% 0% 0% 0% 0% 0%
UNDEV 0% 0% 0% 100% 0% 0% 0% 0% 0% 0% 0% 0% 0% 0% 0% 0%
SPECIAL 0% 55% 0% 5% 10% 10% 0% 0% 0% 0% 0% 0% 0% 20% 0% 0%
BEACH 0% 0% 0% 0% 0% 0% 0% 0% 0% 0% 0% 0% 0% 0% 0% 100%
IX / XI 3% 4% 3% 3% 3% 3% 1% 0% 0% 0% 0% 1% 4% 2% 0% 70%
Note: Area type 5 is shown in Table 7. Source: Fehr & Peers, July 2009.
City of Paso Robles Model Development Report – FinalJuly 2009
22
For example, based on Table 7 a neighborhood consisting of 10 single-family dwelling units would generate 76 daily vehicle trips. Splitting these trips into the various purposes based on Table 8 would results in 16 trips would travel between home and work, 21 trips between home and anything other than work or school (i.e. shopping, bank, visiting friends), 4 trips between home and school, and the remaining 35 trips are between any non-home locations (e.g., going from work to shop).
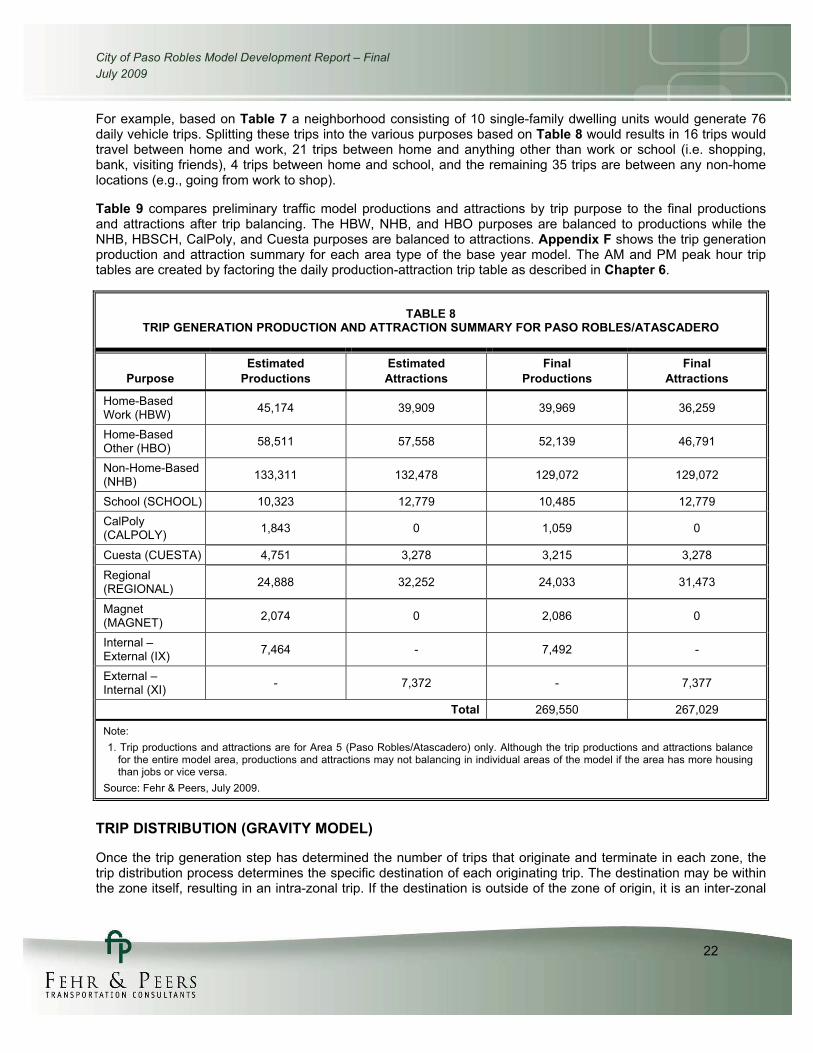
Table 9 compares preliminary traffic model productions and attractions by trip purpose to the final productions and attractions after trip balancing. The HBW, NHB, and HBO purposes are balanced to productions while the NHB, HBSCH, CalPoly, and Cuesta purposes are balanced to attractions. Appendix F shows the trip generation production and attraction summary for each area type of the base year model. The AM and PM peak hour trip tables are created by factoring the daily production-attraction trip table as described in Chapter 6.
TABLE 8 TRIP GENERATION PRODUCTION AND ATTRACTION SUMMARY FOR PASO ROBLES/ATASCADERO
Purpose Estimated
Productions Estimated Attractions
Final Productions
Final Attractions
Home-Based Work (HBW) 45,174 39,909 39,969 36,259
Home-Based Other (HBO) 58,511 57,558 52,139 46,791
Non-Home-Based (NHB) 133,311 132,478 129,072 129,072
School (SCHOOL) 10,323 12,779 10,485 12,779 CalPoly (CALPOLY) 1,843 0 1,059 0
Cuesta (CUESTA) 4,751 3,278 3,215 3,278
Regional (REGIONAL) 24,888 32,252 24,033 31,473
Magnet (MAGNET) 2,074 0 2,086 0
Internal –External (IX) 7,464 - 7,492 -
External – Internal (XI) - 7,372 - 7,377
Total 269,550 267,029
Note: 1. Trip productions and attractions are for Area 5 (Paso Robles/Atascadero) only. Although the trip productions and attractions balance
for the entire model area, productions and attractions may not balancing in individual areas of the model if the area has more housing than jobs or vice versa.
Source: Fehr & Peers, July 2009.
TRIP DISTRIBUTION (GRAVITY MODEL)
Once the trip generation step has determined the number of trips that originate and terminate in each zone, the trip distribution process determines the specific destination of each originating trip. The destination may be within the zone itself, resulting in an intra-zonal trip. If the destination is outside of the zone of origin, it is an inter-zonal
City of Paso Robles Model Development Report – FinalJuly 2009
23
trip. Internal-internal (II) trips originate and terminate within the model area. Trips that originate within but terminate outside of the model area are internal-external (IX), and trips that originate outside and terminate inside of the model area are external-internal (XI). Trips passing completely through the model area are external-external (XX).
The trip distribution model uses the gravity equation to distribute trips to all zones. This equation estimates an accessibility index for each zone based on the number of attractions in each zone and a friction factor, which is a function of travel time between zones. Each attraction zone is given its pro-rata share of productions based on its share of the accessibility index. This process applies to the II, IX, and XI trips. The XX trips are added to the trip table prior to final assignment.
Friction Factors
Friction factors, also known as travel time factors, determine the relative attractiveness of each destination zone based on the travel time between TAZs and the number of potential origins and destinations in each TAZ. These factors are used in the trip distribution stage of the model. Friction factors reported in national modeling reference documents such as National Cooperative Highway Research Program (NCHRP) 365, with adjustments for the unique conditions within San Luis Obispo County, were used in the model. See Appendix G for friction factor curves.
Trips between the Paso Robles Area and External Areas
One of the important inputs to a travel model is an estimate of the amount of travel between the study area and neighboring areas outside the model. These trips are typically called internal-external, or I-X/X-I, trips.
Information from the Year 2000 Census for work location by area of residence was used to estimate the percent of work trips between San Luis Obispo County and neighboring counties. This was originally developed for the SLOCOG model area. For non-work trip purposes, information from the Caltrans 2000-2001 California Statewide Household Travel Survey: Final Report (2002) was used to estimate the percent of HBO and NHB trips that travel between San Luis Obispo County and other areas.
After the number of I-X/X-I trips is estimated, those trips are distributed to the stations around the perimeter of the model area using external station weights. These external station weights are based on City, County, and Caltrans traffic count data and information provided by SLOCOG staff.
Through Trips
Through trips (also called external-external, or XX trips) are those that pass through the study area without stopping inside the study area. The major flows of through traffic in the Paso Robles area use US 101, with lower volumes of through traffic using State Routes 46 (east and west). The size of these flows was estimated based on Caltrans traffic counts.
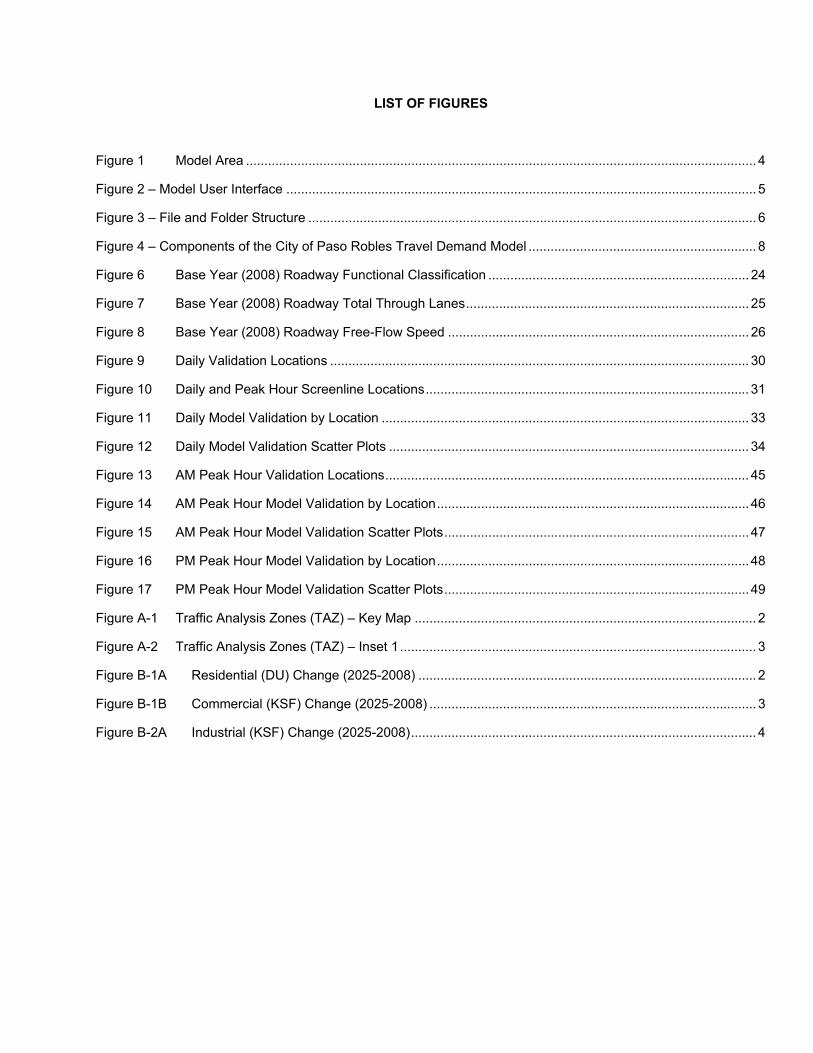
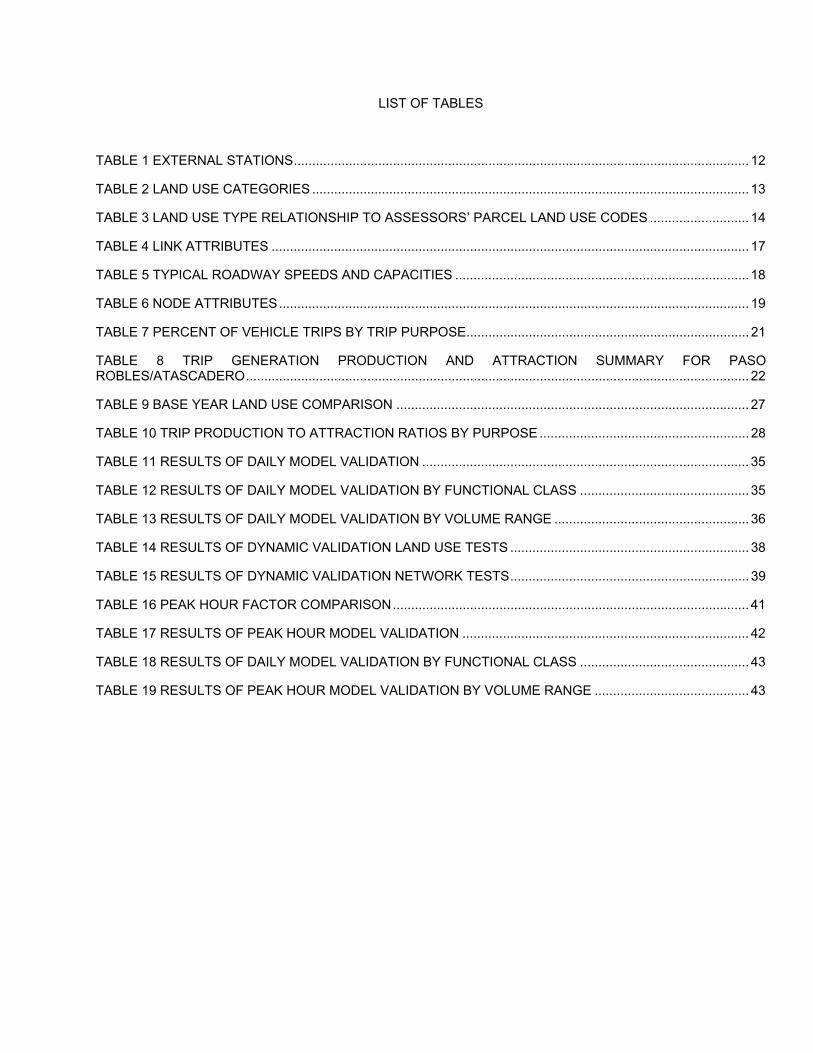
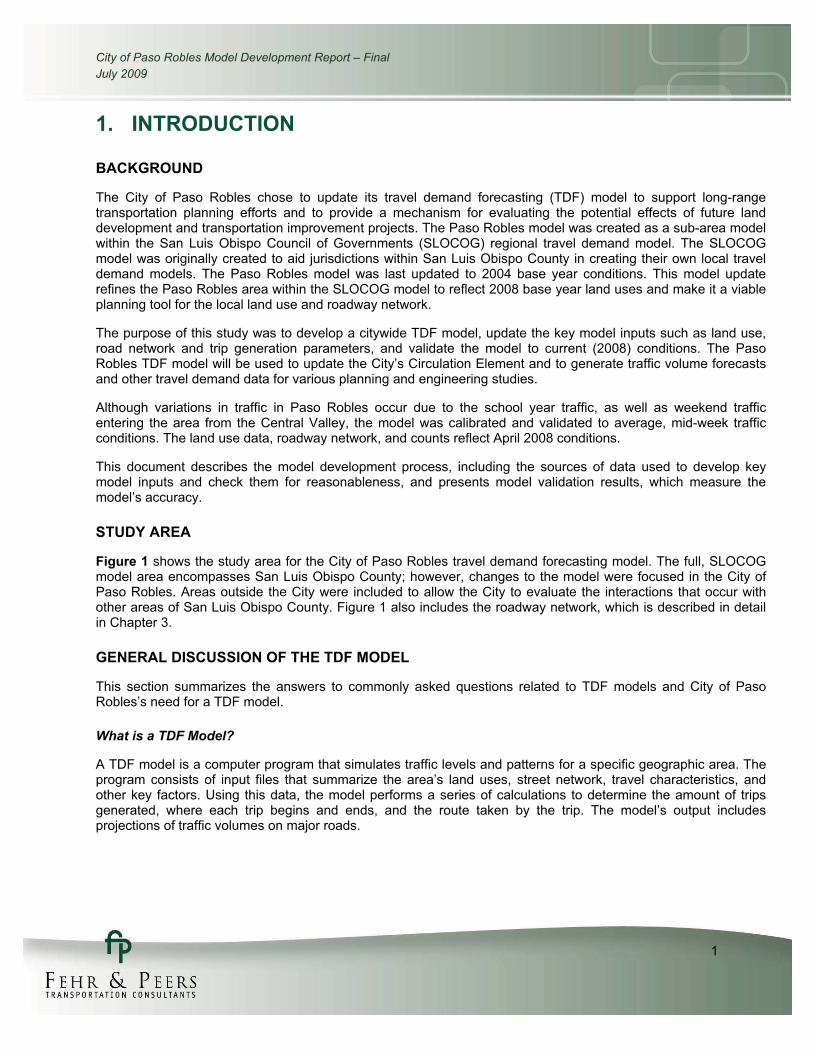
ROADWAY NETWORK CALIBRATION
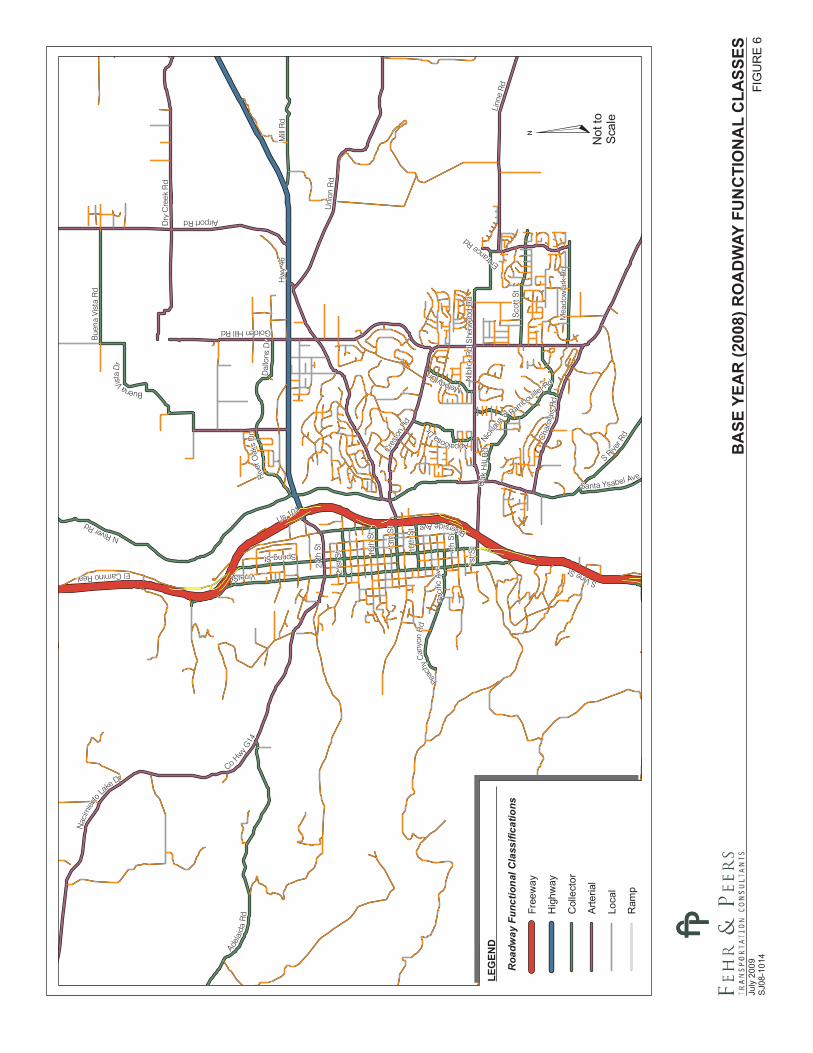
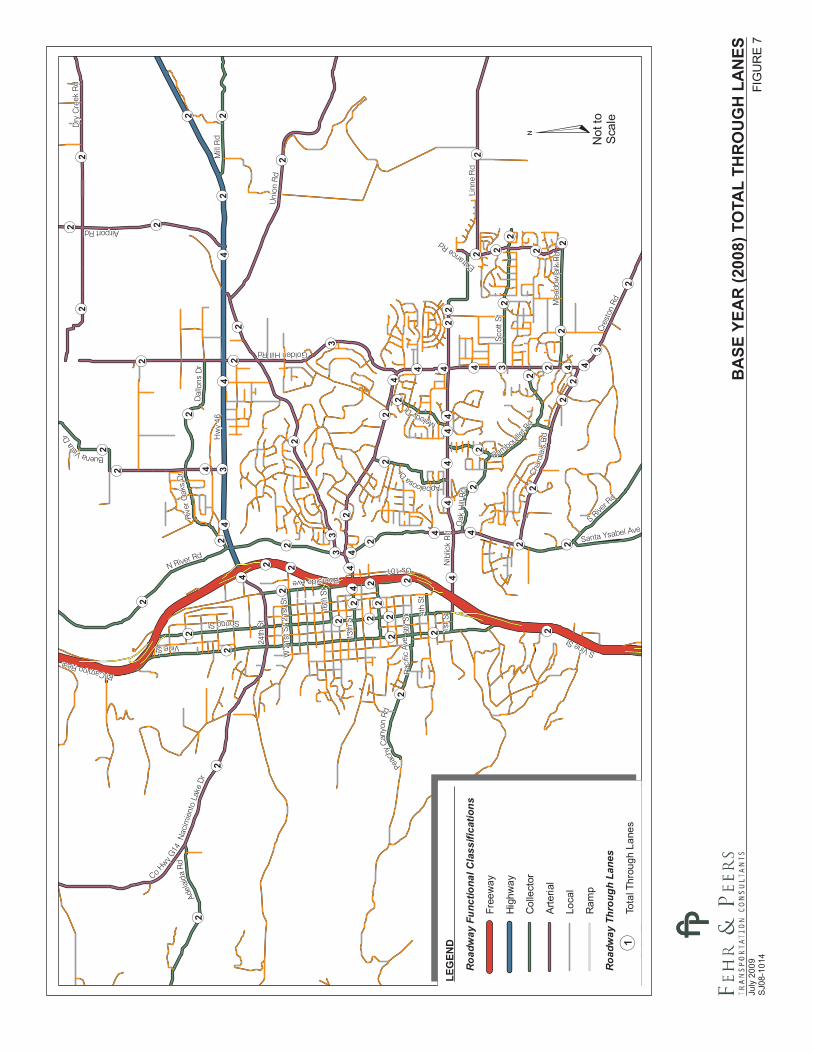
Calibration of the roadway network included modification of the centroid connectors to more accurately represent the location at which traffic accessed the local roads, adjusting speeds within ± 5 mph of the posted speed limit to adjust the attractiveness of the route, and refining the turn penalties. Figures 6 through 8 show the calibrated functional classification, two-way lane total, and free-flow speed, respectively, for roads included in the base year network. Turn penalties are used to prohibit or add delay to certain turning movements in addition to the link cost. For the Paso Robles travel demand model, only prohibitions of traffic getting off a freeway ramp and then back on or locations with prohibitions due to medians are specifically coded.
BA
SEYE
AR
(200
8)R
OA
DW
AYFU
NC
TIO
NA
LC
LASS
ESFI
GU
RE
6Ju
ly20
09S
J08-
1014
¤
Riv
er O
aks
Dr
13th
St
Oak
Hil l
Rd
Vine St
10th
St
Sco
tt S
t
Spring St 16th
St
Melody Dr
Me a
dow
lark
Rd
Rambouillet Rd
S
River R
d
Adela
ida
Rd
Nicklau
s St
1st S
t
21st
St
Riverside Ave
S Vine St
Appaloosa
Dr
Bue
na Vi
sta
Rd
Paci
fic A
ve
4th
St
Mill
Rd
Dal
lons
Dr
Santa Ysabel Ave
Peac
hy C
anyo
n R
d
Buena Vista
Dr
N River Rd
Golden Hill Rd
Airport Rd
Dry
Cre
ek R
d
Uni
on R
d
24th
St
Nib
lick
Rd
Entrance Rd
Linn
e R
d
Cha
rola
is R
d
Cre
ston
Rd
Nac
imie
nto
Lake
DrCo
Hwy G
14
She
rwoo
d R
d
Us 101
El Camino Real
Hw
y 46
LEG
END
Roa
dway
Func
tiona
lCla
ssifi
catio
ns
Free
way
Hig
hway
Col
lect
or
Arte
rial
Loca
l
Ram
p
Not
toSc
ale
¬ «2 ¬ «2
Entrance Rd
Golden Hill Rd
Ni b
lick
Rd
Airport Rd
Uni
on R
d
Co Hwy
G14
Nac
imie
nto
Lake
Dr
Linn
e R
d
Cre
ston
Rd
Dry
Cre
ek R
d
24th
St
Cha
rola
is R
d
¬ «4
¬ «2
¬ «4
¬ «2
¬ «2
¬ «2
¬ «2
¬ «2
¬ «2
¬ «2
¬ «2
¬ «2
¬ «2
¬ «2
¬ «2
¬ «2
¬ «2
¬ «2
¬ «2
¬ «2
¬ «2
¬ «2
¬ «2
¬ «2
¬ «2
¬ «2
¬ «2
¬ «2
¬ «2
¬ «2
¬ «2
¬ «2 ¬ «2 ¬ «2
¬ «2
¬ «2¬ «2
¬ «2¬ «4
¬ «4¬ «4
¬ «3
¬ «3
¬ «4
¬ «2
¬ «2
¬ «2
¬ «4
¬ «4
¬ «4
¬ «2
¬ «3
¬ «4
¬ «2
¬ «2
¬ «2
¬ «2
¬ «2
¬ «4
¬ «2
¬ «4
¬ «4¬ «2
¬ «2
¬ «2
¬ «2
¬ «3
¬ «2
¬ «4¬ «4
¬ «4
¬ «2
¬ «4
¬ «4
¬ «2
¬ «2
¬ «2
¬ «2
¬ «2
¬ «3¬ «4¬ «4
¬ «2
¬ «4
¬ «3¬ «2
Hw
y 46
El Camino Real
Us 101
16th
St
W 21
st S
t
Adel
aida
Rd
Paci
fic A
ve
13th
St
Melody Dr
4th
St
Appaloosa Dr
Mill
Rd
1st S
t
Santa Ysabel Ave
Spring St
Buena Vista
Dr
S Rive
r Rd
Riv
er O
aks
Dr
Vine St
21st
St
Riverside Ave
6th
St
Oak
Hil l
Rd
Da l
l ons
Dr
Sco
tt S
t
S Vine St
Rambouillet R
d
Mea
dow
lar k
Rd
Peach
y C
anyo
n R
d
N River Rd
BA
SEYE
AR
(200
8)TO
TAL
THR
OU
GH
LAN
ESFI
GU
RE
7Ju
ly20
09S
J08-
1014
¤N
otto
Scal
e
LEG
END
Road
way
Func
tiona
lCla
ssifi
catio
ns
Free
way
Hig
hway
Col
lect
or
Arte
rial
Loca
l
Ram
p
Road
way
Thro
ugh
Lane
s
Tota
lThr
ough
Lane
s¬ «1

¬ «40
¬ «40
¬ «35
¬ «40
¬ «25
¬ «45
¬ «35
¬ «35¬ «35¬ «25
¬ «40 ¬ «50
¬ «35
¬ «35
¬ «40
¬ «40
¬ «45
¬ «55
¬ «35
¬ «35¬ «35 ¬ «40
¬ «25
¬ «35
¬ «40
¬ «50
¬ «35
¬ «45
¬ «45
¬ «25
¬ «35
¬ «55
¬ «40
¬ «35
¬ «35
¬ «35
¬ «35
¬ «45
¬ «40
¬ «25
¬ «40
¬ «35
¬ «40Us 101
El Camino Real
¬ «30
¬ «25
¬ «25
¬ «20
¬ «25
¬ «25
¬ «25
¬ «40
¬ «30
¬ «35
¬ «45
¬ «35
¬ «25
¬ «45
¬ «35
¬ «30
¬ «45
¬ «25
¬ «25
¬ «25
¬ «25¬ «30
¬ «35
¬ «25
¬ «40
¬ «25
¬ «30
¬ «25
¬ «25
¬ «40
¬ «30
¬ «25
¬ «35
¬ «20
¬ «30
¬ «30
¬ «30
¬ «25
¬ «60¬ «60
Cha
rola
is R
d
24th
St
She
rwoo
d R
d
Golden Hill Rd
Entrance Rd
Cre
ston
Rd
Dry
Cre
ek R
d
Uni
o n R
d
Linn
e R
d
Nacim
ient
o La
ke D
r
Co Hwy
G14
Ni b
lick
Rd
Airport Rd
6th
St16
th S
t
Sco
tt S
t
Rambouillet Rd
13th
St
Adel
aida
Rd
4th
St
S Rive
r Rd
Mill
Rd
Oak
Hil l
Rd
Santa Ysabel Ave
Riverside AveBuena Vist
a D
r
Mea
dow
lar k
Rd
S Vine St
Riv
er O
aks
Dr
W 21
st S
t
1st S
t
Dal
lon s
Dr
Melody Dr
Vine St
Appaloosa Dr
Spring St
10th
St
21st
St
Peach
y C
anyo
n R
d
N River Rd
Paci
fic A
ve
Hw
y 46
¬ «50
¬ «45¬ «45
¬ «45¬ «50
BA
SEYE
AR
(200
8)FR
EEFL
OW
SPEE
DFI
GU
RE
8Ju
ly20
09S
J08-
1014
¤N
otto
Scal
e
LEG
END
Road
way
Func
tiona
lCla
ssifi
catio
ns
Free
way
Hig
hway
Col
lect
or
Arte
rial
Loca
l
Ram
p
Road
way
Free
Flow
Spee
d
Free
Flow
Spee
d¬ «1
City of Paso Robles Model Development Report – FinalJuly 2009
27
5. MODEL RESULTS AND DAILY VALIDATION
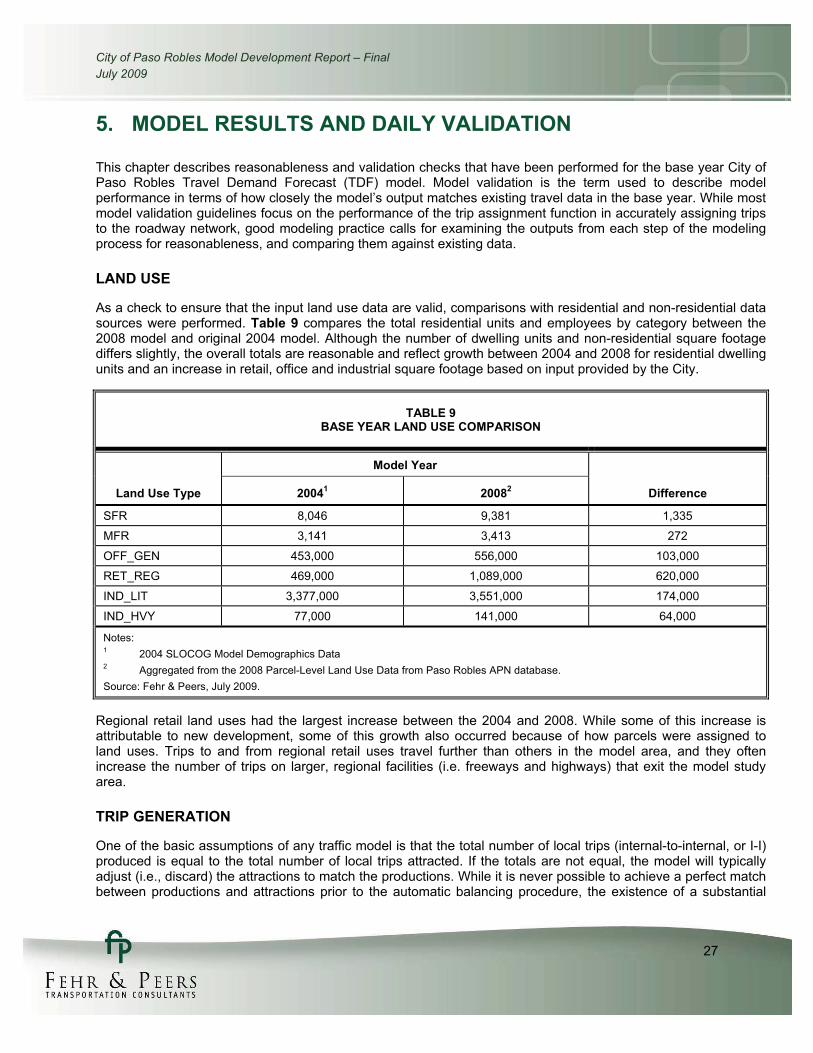
This chapter describes reasonableness and validation checks that have been performed for the base year City of Paso Robles Travel Demand Forecast (TDF) model. Model validation is the term used to describe model performance in terms of how closely the model’s output matches existing travel data in the base year. While most model validation guidelines focus on the performance of the trip assignment function in accurately assigning trips to the roadway network, good modeling practice calls for examining the outputs from each step of the modeling process for reasonableness, and comparing them against existing data.
LAND USE
As a check to ensure that the input land use data are valid, comparisons with residential and non-residential data sources were performed. Table 9 compares the total residential units and employees by category between the 2008 model and original 2004 model. Although the number of dwelling units and non-residential square footage differs slightly, the overall totals are reasonable and reflect growth between 2004 and 2008 for residential dwelling units and an increase in retail, office and industrial square footage based on input provided by the City.
TABLE 9 BASE YEAR LAND USE COMPARISON
Land Use Type
Model Year
Difference 20041 20082
SFR 8,046 9,381 1,335
MFR 3,141 3,413 272
OFF_GEN 453,000 556,000 103,000
RET_REG 469,000 1,089,000 620,000
IND_LIT 3,377,000 3,551,000 174,000
IND_HVY 77,000 141,000 64,000
Notes:1 2004 SLOCOG Model Demographics Data 2 Aggregated from the 2008 Parcel-Level Land Use Data from Paso Robles APN database. Source: Fehr & Peers, July 2009.
Regional retail land uses had the largest increase between the 2004 and 2008. While some of this increase is attributable to new development, some of this growth also occurred because of how parcels were assigned to land uses. Trips to and from regional retail uses travel further than others in the model area, and they often increase the number of trips on larger, regional facilities (i.e. freeways and highways) that exit the model study area.
TRIP GENERATION
One of the basic assumptions of any traffic model is that the total number of local trips (internal-to-internal, or I-I) produced is equal to the total number of local trips attracted. If the totals are not equal, the model will typically adjust (i.e., discard) the attractions to match the productions. While it is never possible to achieve a perfect match between productions and attractions prior to the automatic balancing procedure, the existence of a substantial
City of Paso Robles Model Development Report – FinalJuly 2009
28
mismatch in one or more trip purposes indicates that either land use inputs or trip generation rates may be in error.
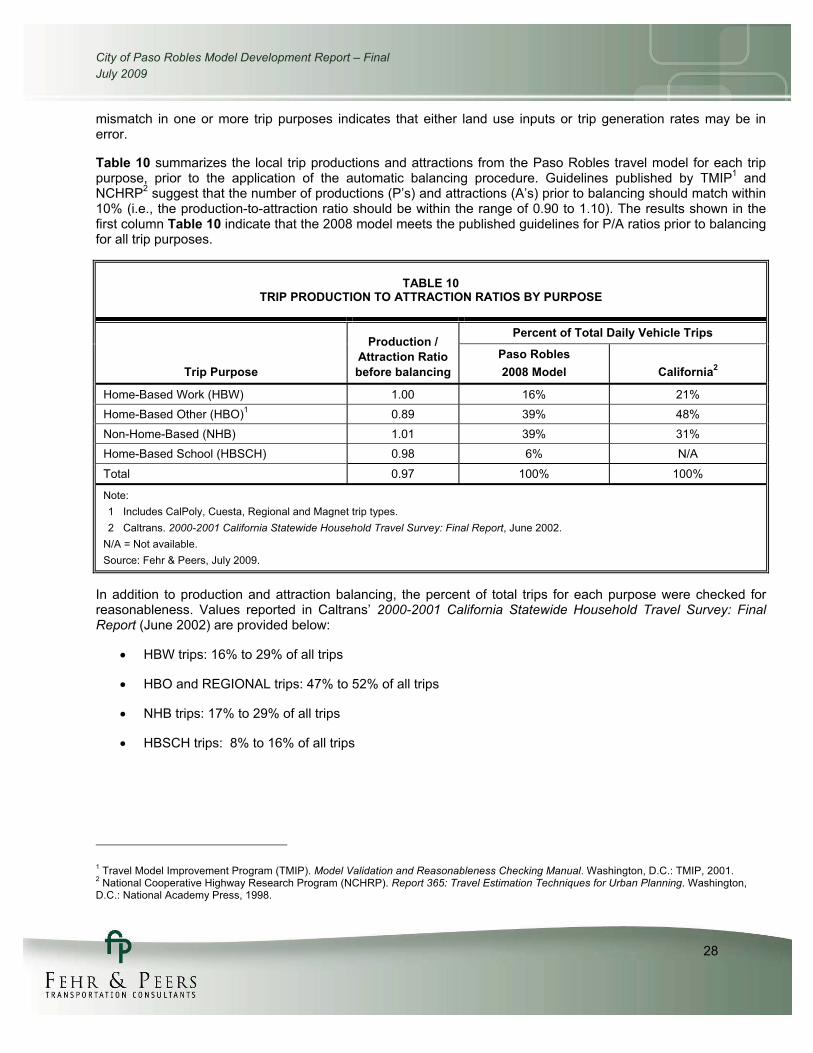
Table 10 summarizes the local trip productions and attractions from the Paso Robles travel model for each trip purpose, prior to the application of the automatic balancing procedure. Guidelines published by TMIP1 and NCHRP2 suggest that the number of productions (P’s) and attractions (A’s) prior to balancing should match within 10% (i.e., the production-to-attraction ratio should be within the range of 0.90 to 1.10). The results shown in the first column Table 10 indicate that the 2008 model meets the published guidelines for P/A ratios prior to balancing for all trip purposes.
TABLE 10 TRIP PRODUCTION TO ATTRACTION RATIOS BY PURPOSE
Trip Purpose
Production / Attraction Ratio before balancing
Percent of Total Daily Vehicle Trips
Paso Robles 2008 Model California2
Home-Based Work (HBW) 1.00 16% 21% Home-Based Other (HBO)1 0.89 39% 48% Non-Home-Based (NHB) 1.01 39% 31% Home-Based School (HBSCH) 0.98 6% N/A
Total 0.97 100% 100%
Note: 1 Includes CalPoly, Cuesta, Regional and Magnet trip types. 2 Caltrans. 2000-2001 California Statewide Household Travel Survey: Final Report, June 2002.
N/A = Not available. Source: Fehr & Peers, July 2009.
In addition to production and attraction balancing, the percent of total trips for each purpose were checked for reasonableness. Values reported in Caltrans’ 2000-2001 California Statewide Household Travel Survey: Final Report (June 2002) are provided below:
� HBW trips: 16% to 29% of all trips
� HBO and REGIONAL trips: 47% to 52% of all trips
� NHB trips: 17% to 29% of all trips
� HBSCH trips: 8% to 16% of all trips
1 Travel Model Improvement Program (TMIP). Model Validation and Reasonableness Checking Manual. Washington, D.C.: TMIP, 2001. 2 National Cooperative Highway Research Program (NCHRP). Report 365: Travel Estimation Techniques for Urban Planning. Washington, D.C.: National Academy Press, 1998.

City of Paso Robles Model Development Report – FinalJuly 2009
29
TRIP ASSIGNMENT
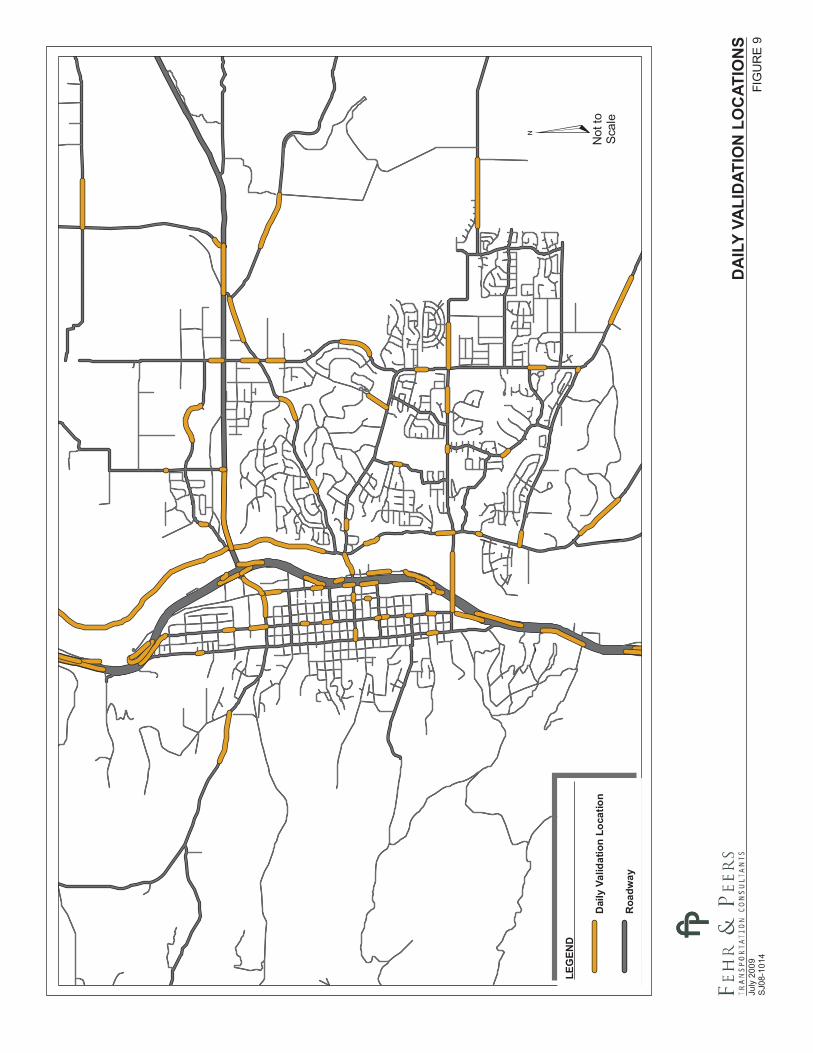
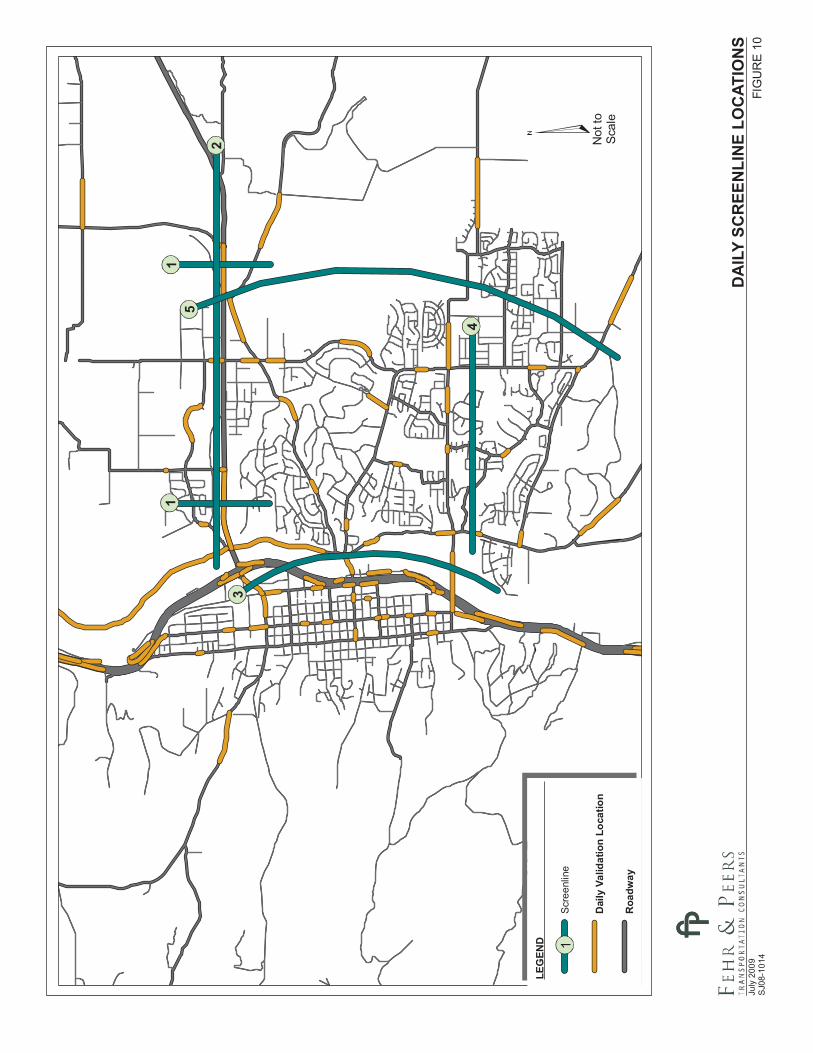
The most critical static measurement of the accuracy of any traffic model is the degree to which it can approximate actual traffic counts in the base year. Caltrans has established certain trip assignment guidelines for models to be deemed acceptable for forecasting future year traffic. This section describes the model performance in comparison to the standards discussed in Travel Forecasting Guidelines (Caltrans, November 1992). The validity of the Paso Robles model was tested for both daily and peak hour conditions (see other memorandum for peak hour validation results). Model volumes were compared to existing daily traffic counts at 55 individual count sites shown on Figure 9, and at 6 screenlines shown on Figure 10. The remainder of this section contains a summary of the validation results, while Appendix H contains a detailed report of all validation comparisons.
Link volume results from the model runs were examined and checked for reasonableness. Links were identified where model results varied substantially from the observed counts, and the characteristics of those links were reviewed with City staff to ensure that the link attributes accurately reflected local operating conditions. In some cases, link characteristics such as speeds were modified based on local input. Appendix I shows the daily link volumes resulting from the 2007 Paso Robles travel demand model.
Comparison Techniques
Traffic model accuracy is usually tested using four comparison techniques.
� The volume-to-count ratio is computed by dividing the volume assigned by the model and the actual traffic count for individual roadways (or intersections) area-wide.
� The maximum deviation is the difference between the model volume and the actual count divided by the actual count.
� The percent root mean square error (RMSE) is the square root of the model volume minus the actual count squared divided by the number of counts. It is a measure similar to standard deviation in that it assesses the accuracy of the entire model.
� The coefficient of determination (R2) is the proportion of variability between the actual traffic counts and the estimated traffic volumes from the model.
� The correlation coefficient estimates the correlation between the actual traffic counts and the estimated traffic volumes from the model.
In addition to these tests, the model’s stability was tested to verify that reasonable output responses occurred based on varying input variables.
DA
ILY
VALI
DAT
ION
LOC
ATIO
NS
FIG
UR
E9
July
2009
SJ0
8-10
14
¤N
otto
Scal
e
LEG
END
Dai
lyVa
lidat
ion
Loca
tion
Roa
dway
11
4
32
5
DA
ILY
SCR
EEN
LIN
E LO
CAT
ION
SFI
GU
RE
10Ju
ly 2
009
SJ0
8-10
14
Not
toSc
ale
LEG
END
Scre
enlin
e
Dai
ly V
alid
atio
n Lo
catio
n
Roa
dway
1

City of Paso Robles Model Development Report – FinalJuly 2009
32
Validation Guidelines
For a model to be considered accurate and appropriate for use in traffic forecasting, it must replicate actual conditions to within a certain level of accuracy. Since it would be impossible for any model to precisely replicate all counts, validation guidelines have been established by Caltrans and other agencies. Key validation standards for daily travel models based on the Caltrans guidelines are summarized below.
� The two-way sum of the volumes on all roadway links for which counts are available should be within 10 percent of the counts.
� At least 75 percent of the roadway links for which counts are available should be within the maximum desirable deviation, which ranges from approximately 15 to 68 percent depending on total volume (the larger the volume, the less deviation is permitted).
� The correlation coefficient between the actual ground counts and the estimated traffic volumes should be greater than 88 percent.
� All of the roadway screenlines should be within the maximum desirable deviation, which ranges from approximately 17 to 64 percent depending on total volume.
Although not stated in the Caltrans standards, an additional Fehr & Peers validation guideline was applied to the 2007 Paso Robles traffic model:
� The Root Mean Square Error (RMSE) should not exceed 30 percent. This measure of effectiveness (MOE) is most important for screenlines, but is also used to describe the certainty of functional classification and volume ranges too.
Static Validation Results
Scripts and spreadsheets were created to compute the validation results for roadway links in the Paso Robles TDF model. The results for daily conditions are summarized in Table 11 below, while the detailed spreadsheets are presented in Appendix H. The model deviation by geographic location is shown on Figure 11. Figure 12shows a scatter plot of count and model volumes compared to Caltrans’ allowable error. The model performs well, exceeding all guidelines for overall model accuracy.
In addition to model-wide statistics, the results are aggregated by functional class and count volume range, as shown below in Table 12.
As previously discussed, the RMSE is presented to provide understanding of the functional classification and volume ranges. Again, the model exceeds the guidelines except for the lower functional classes. Because the traffic volumes carried by facilities with the same functional class can vary substantially, it is standard practice at Fehr & Peers to calculate model validation statistics by traffic volume range. This ensures that the model performs well on mid- and high-volume facilities, which are the primary focus of most travel forecasting efforts. These results are shown in Table 13.
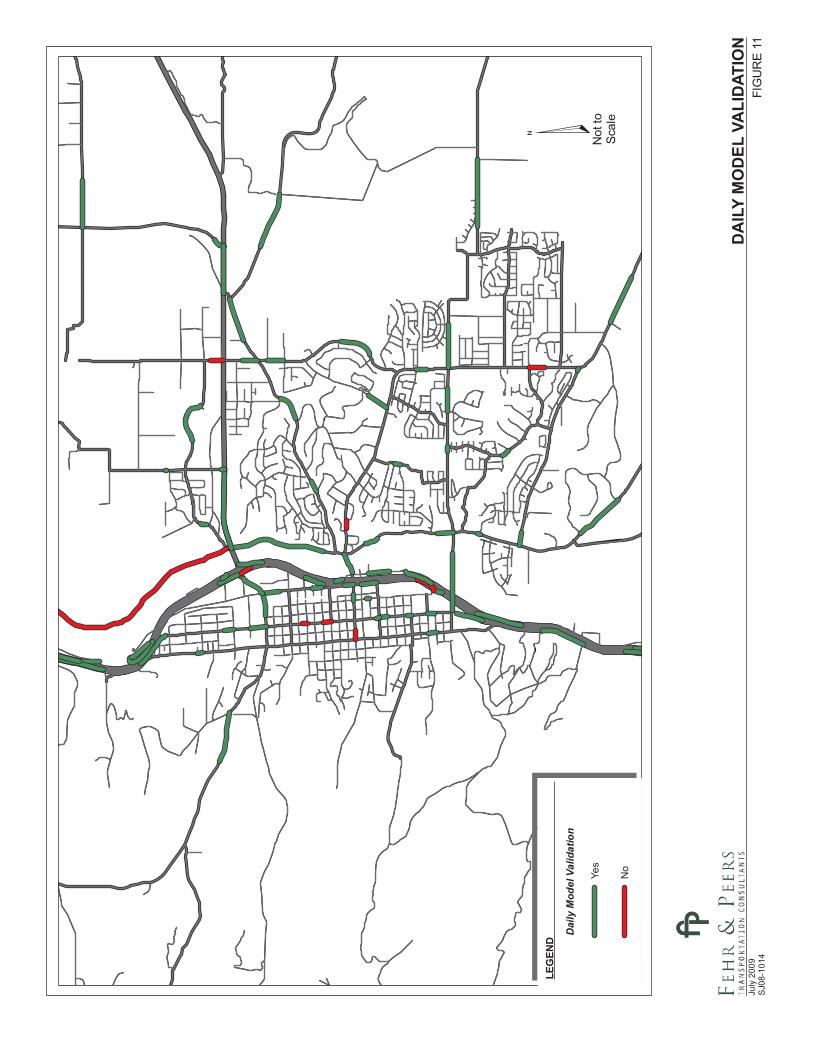
DA
ILY
MO
DEL
VALI
DAT
ION
FIG
UR
E11
July
2009
SJ0
8-10
14
¤N
otto
Scal
e
LEG
END
Dai
lyM
odel
Valid
atio
n
Yes
No
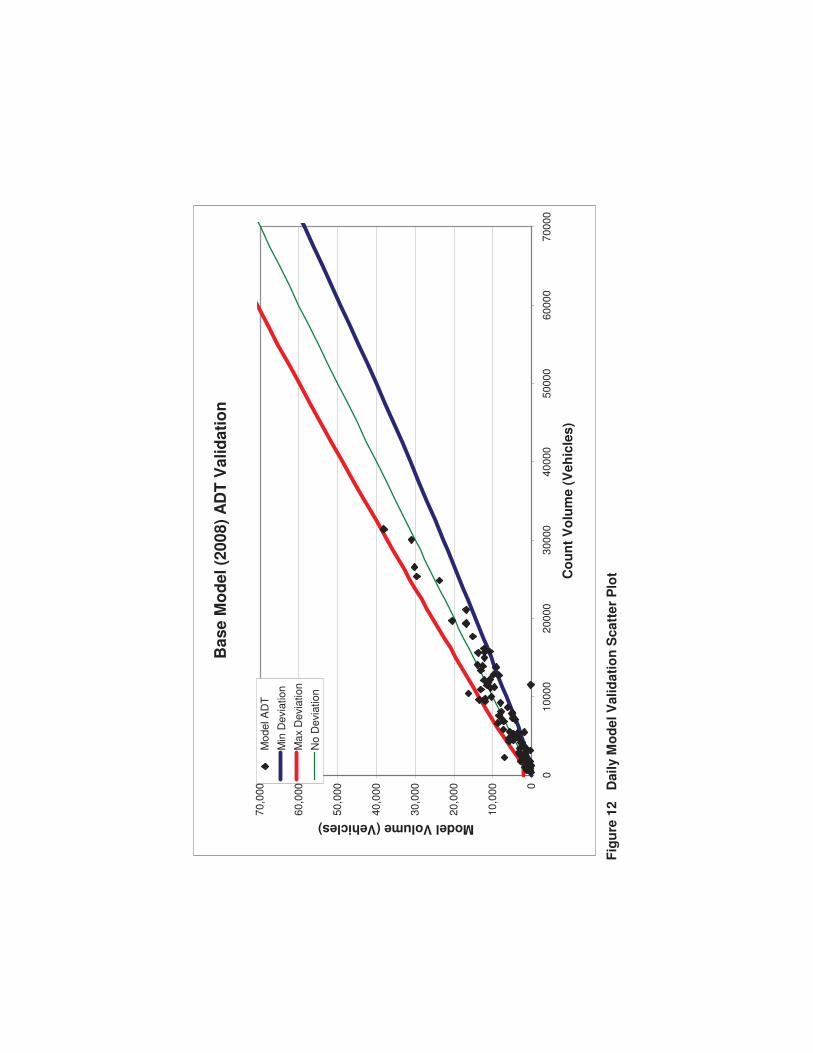
Fig
ure
12
Dai
ly M
od
el V
alid
atio
n S
catt
er P
lot
Bas
e M
od
el (
2008
) A
DT
Val
idat
ion
0
10,0
00
20,0
00
30,0
00
40,0
00
50,0
00
60,0
00
70,0
00
010
000
2000
030
000
4000
050
000
6000
070
000
Co
un
t V
olu
me
(Veh
icle
s)
Model Volume (Vehicles)
Mod
el A
DT
Min
Dev
iatio
n
Max
Dev
iatio
n
No
Dev
iatio
n
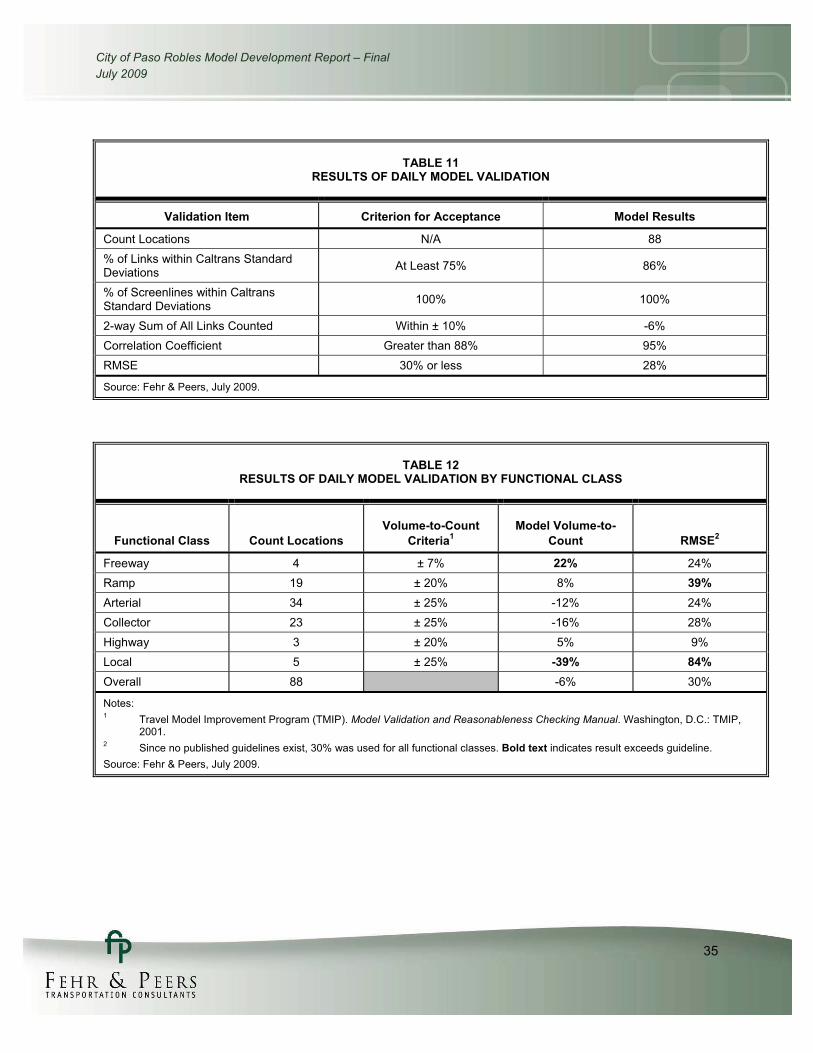
City of Paso Robles Model Development Report – FinalJuly 2009
35
TABLE 11 RESULTS OF DAILY MODEL VALIDATION
Validation Item Criterion for Acceptance Model Results
Count Locations N/A 88 % of Links within Caltrans Standard Deviations At Least 75% 86%
% of Screenlines within Caltrans Standard Deviations 100% 100%
2-way Sum of All Links Counted Within ± 10% -6% Correlation Coefficient Greater than 88% 95% RMSE 30% or less 28%
Source: Fehr & Peers, July 2009.
TABLE 12 RESULTS OF DAILY MODEL VALIDATION BY FUNCTIONAL CLASS
Functional Class Count Locations Volume-to-Count
Criteria1 Model Volume-to-
Count RMSE2
Freeway 4 ± 7% 22% 24% Ramp 19 ± 20% 8% 39% Arterial 34 ± 25% -12% 24% Collector 23 ± 25% -16% 28% Highway 3 ± 20% 5% 9% Local 5 ± 25% -39% 84% Overall 88 -6% 30%
Notes:1 Travel Model Improvement Program (TMIP). Model Validation and Reasonableness Checking Manual. Washington, D.C.: TMIP,
2001. 2 Since no published guidelines exist, 30% was used for all functional classes. Bold text indicates result exceeds guideline. Source: Fehr & Peers, July 2009.
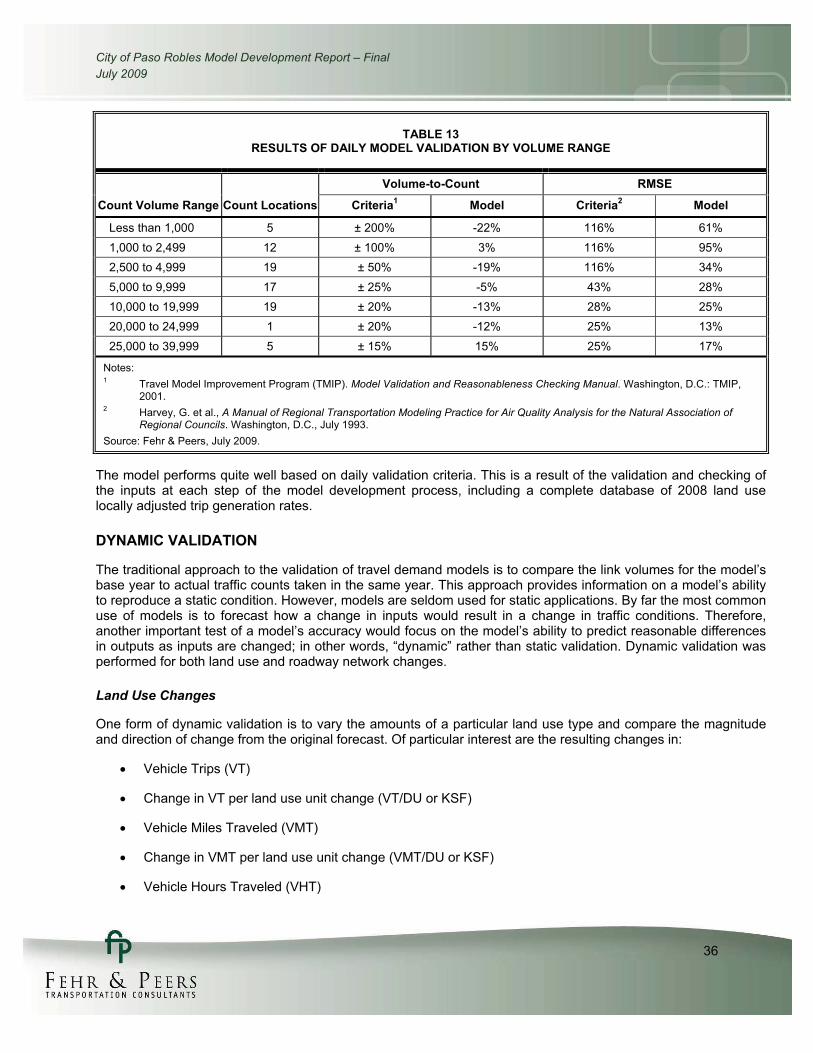
City of Paso Robles Model Development Report – FinalJuly 2009
36
TABLE 13 RESULTS OF DAILY MODEL VALIDATION BY VOLUME RANGE
Count Volume Range Count Locations
Volume-to-Count RMSE
Criteria1 Model Criteria2 Model
Less than 1,000 5 ± 200% -22% 116% 61% 1,000 to 2,499 12 ± 100% 3% 116% 95% 2,500 to 4,999 19 ± 50% -19% 116% 34% 5,000 to 9,999 17 ± 25% -5% 43% 28% 10,000 to 19,999 19 ± 20% -13% 28% 25% 20,000 to 24,999 1 ± 20% -12% 25% 13% 25,000 to 39,999 5 ± 15% 15% 25% 17%
Notes:1 Travel Model Improvement Program (TMIP). Model Validation and Reasonableness Checking Manual. Washington, D.C.: TMIP,
2001. 2 Harvey, G. et al., A Manual of Regional Transportation Modeling Practice for Air Quality Analysis for the Natural Association of
Regional Councils. Washington, D.C., July 1993. Source: Fehr & Peers, July 2009.
The model performs quite well based on daily validation criteria. This is a result of the validation and checking of the inputs at each step of the model development process, including a complete database of 2008 land use locally adjusted trip generation rates.
DYNAMIC VALIDATION
The traditional approach to the validation of travel demand models is to compare the link volumes for the model’s base year to actual traffic counts taken in the same year. This approach provides information on a model’s ability to reproduce a static condition. However, models are seldom used for static applications. By far the most common use of models is to forecast how a change in inputs would result in a change in traffic conditions. Therefore, another important test of a model’s accuracy would focus on the model’s ability to predict reasonable differences in outputs as inputs are changed; in other words, “dynamic” rather than static validation. Dynamic validation was performed for both land use and roadway network changes.
Land Use Changes
One form of dynamic validation is to vary the amounts of a particular land use type and compare the magnitude and direction of change from the original forecast. Of particular interest are the resulting changes in:
� Vehicle Trips (VT)
� Change in VT per land use unit change (VT/DU or KSF)
� Vehicle Miles Traveled (VMT)
� Change in VMT per land use unit change (VMT/DU or KSF)
� Vehicle Hours Traveled (VHT)
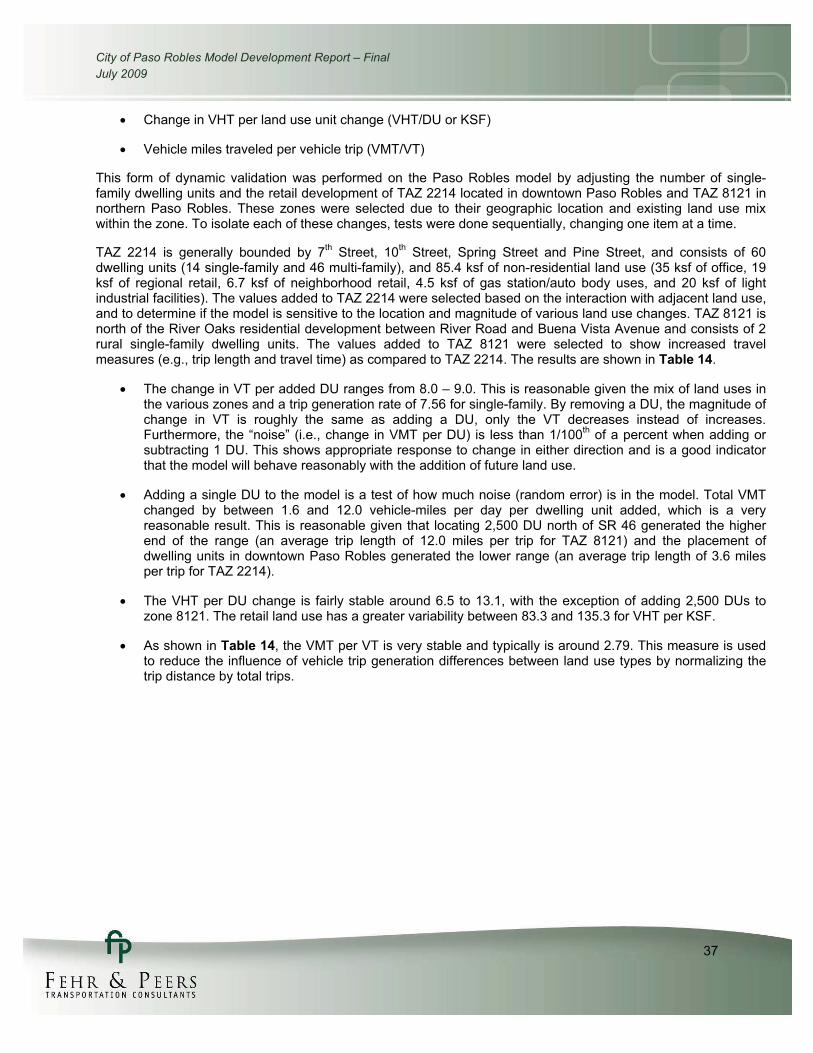
City of Paso Robles Model Development Report – FinalJuly 2009
37
� Change in VHT per land use unit change (VHT/DU or KSF)
� Vehicle miles traveled per vehicle trip (VMT/VT)
This form of dynamic validation was performed on the Paso Robles model by adjusting the number of single-family dwelling units and the retail development of TAZ 2214 located in downtown Paso Robles and TAZ 8121 in northern Paso Robles. These zones were selected due to their geographic location and existing land use mix within the zone. To isolate each of these changes, tests were done sequentially, changing one item at a time.
TAZ 2214 is generally bounded by 7th Street, 10th Street, Spring Street and Pine Street, and consists of 60 dwelling units (14 single-family and 46 multi-family), and 85.4 ksf of non-residential land use (35 ksf of office, 19 ksf of regional retail, 6.7 ksf of neighborhood retail, 4.5 ksf of gas station/auto body uses, and 20 ksf of light industrial facilities). The values added to TAZ 2214 were selected based on the interaction with adjacent land use, and to determine if the model is sensitive to the location and magnitude of various land use changes. TAZ 8121 is north of the River Oaks residential development between River Road and Buena Vista Avenue and consists of 2 rural single-family dwelling units. The values added to TAZ 8121 were selected to show increased travel measures (e.g., trip length and travel time) as compared to TAZ 2214. The results are shown in Table 14.
� The change in VT per added DU ranges from 8.0 – 9.0. This is reasonable given the mix of land uses in the various zones and a trip generation rate of 7.56 for single-family. By removing a DU, the magnitude of change in VT is roughly the same as adding a DU, only the VT decreases instead of increases. Furthermore, the “noise” (i.e., change in VMT per DU) is less than 1/100th of a percent when adding or subtracting 1 DU. This shows appropriate response to change in either direction and is a good indicator that the model will behave reasonably with the addition of future land use.
� Adding a single DU to the model is a test of how much noise (random error) is in the model. Total VMT changed by between 1.6 and 12.0 vehicle-miles per day per dwelling unit added, which is a very reasonable result. This is reasonable given that locating 2,500 DU north of SR 46 generated the higher end of the range (an average trip length of 12.0 miles per trip for TAZ 8121) and the placement of dwelling units in downtown Paso Robles generated the lower range (an average trip length of 3.6 miles per trip for TAZ 2214).
� The VHT per DU change is fairly stable around 6.5 to 13.1, with the exception of adding 2,500 DUs to zone 8121. The retail land use has a greater variability between 83.3 and 135.3 for VHT per KSF.
� As shown in Table 14, the VMT per VT is very stable and typically is around 2.79. This measure is used to reduce the influence of vehicle trip generation differences between land use types by normalizing the trip distance by total trips.
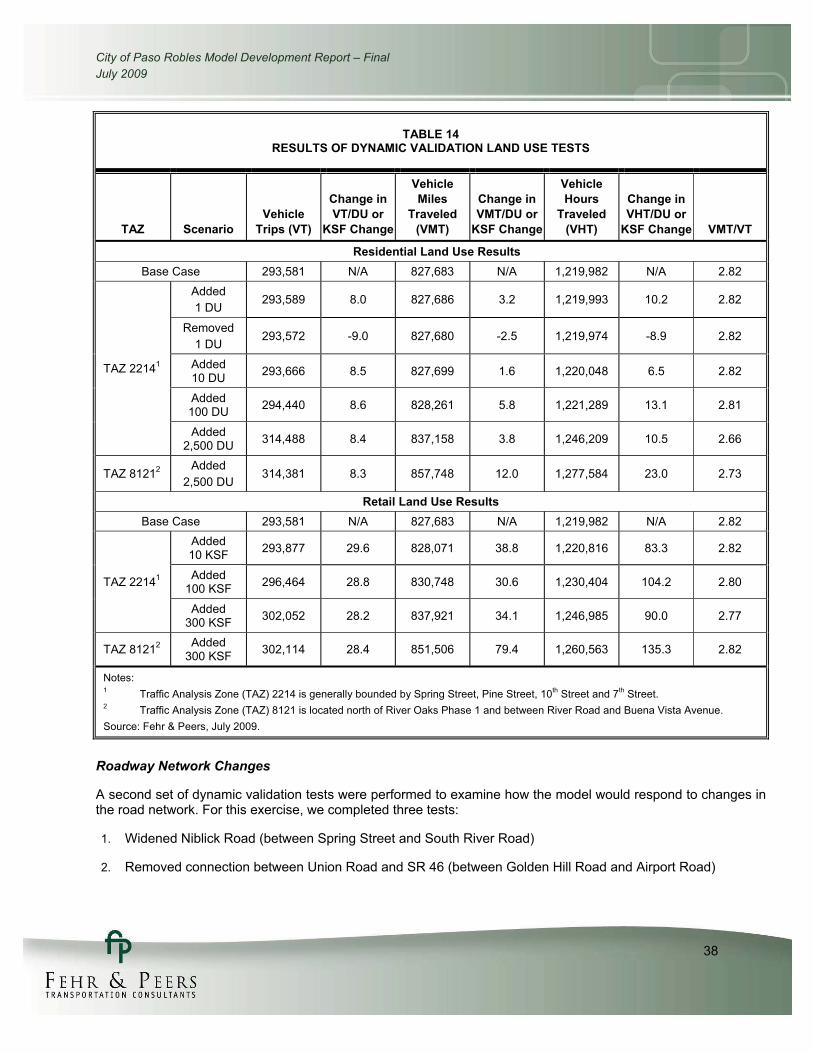
City of Paso Robles Model Development Report – FinalJuly 2009
38
TABLE 14 RESULTS OF DYNAMIC VALIDATION LAND USE TESTS
TAZ Scenario Vehicle
Trips (VT)
Change in VT/DU or
KSF Change
Vehicle Miles
Traveled (VMT)
Change in VMT/DU or
KSF Change
Vehicle Hours
Traveled (VHT)
Change in VHT/DU or
KSF Change VMT/VT
Residential Land Use Results Base Case 293,581 N/A 827,683 N/A 1,219,982 N/A 2.82
TAZ 22141
Added 1 DU
293,589 8.0 827,686 3.2 1,219,993 10.2 2.82
Removed 1 DU
293,572 -9.0 827,680 -2.5 1,219,974 -8.9 2.82
Added 10 DU 293,666 8.5 827,699 1.6 1,220,048 6.5 2.82
Added 100 DU 294,440 8.6 828,261 5.8 1,221,289 13.1 2.81
Added 2,500 DU 314,488 8.4 837,158 3.8 1,246,209 10.5 2.66
TAZ 81212 Added 2,500 DU
314,381 8.3 857,748 12.0 1,277,584 23.0 2.73
Retail Land Use ResultsBase Case 293,581 N/A 827,683 N/A 1,219,982 N/A 2.82
TAZ 22141
Added 10 KSF 293,877 29.6 828,071 38.8 1,220,816 83.3 2.82
Added 100 KSF 296,464 28.8 830,748 30.6 1,230,404 104.2 2.80
Added 300 KSF 302,052 28.2 837,921 34.1 1,246,985 90.0 2.77
TAZ 81212 Added 300 KSF 302,114 28.4 851,506 79.4 1,260,563 135.3 2.82
Notes:1 Traffic Analysis Zone (TAZ) 2214 is generally bounded by Spring Street, Pine Street, 10th Street and 7th Street. 2 Traffic Analysis Zone (TAZ) 8121 is located north of River Oaks Phase 1 and between River Road and Buena Vista Avenue. Source: Fehr & Peers, July 2009.
Roadway Network Changes
A second set of dynamic validation tests were performed to examine how the model would respond to changes in the road network. For this exercise, we completed three tests:
1. Widened Niblick Road (between Spring Street and South River Road)
2. Removed connection between Union Road and SR 46 (between Golden Hill Road and Airport Road)
City of Paso Robles Model Development Report – FinalJuly 2009
39
3. Added the 16th Street Southbound On-Ramp to US 101
To isolate each of these changes, only one of the tests was done at a time. The description and results of each test are discussed in Table 15.
TABLE 15 RESULTS OF DYNAMIC VALIDATION NETWORK TESTS
Dynamic Test Expected Change Actual Change
Widen Niblick Road � Volume on modified links will increase and volume on parallel links will decrease.
� Niblick Road was widened from 4 to 6 lanes between Spring Street and River Road. Increasing capacity on Niblick Road decreased volume by reasonable levels on Creston Road.
Remove the Union Road intersection with SR 46 � Volume on other links
connecting to SR 46 will increase and volume on Union Road will decrease.
� Deleted the connection between Union Road and SR 46 between Golden Hill Road and Airport Road. The model appropriately shifted trips to Golden Hill Road between Union Road and SR 46. Some traffic shifted from city streets and remained on US 101 to SR 46 – eastbound trips on SR 46, west of Golden Hill Road, increased with an anticipated decrease in traffic on Union Road.
Add 16th Street/17th Street Southbound On-Ramp to US 101
� Volume on connecting links will increase and volume on adjacent ramps will decrease.
� Added 16th Street Southbound On-ramp to US 101. The model appropriately shifted trips from the two adjacent southbound on-ramps at 24th Street and Spring Street to the new ramp. There were complementary increases in traffic on Creston Road and 13th Street.
Source: Fehr & Peers, July 2009.
City of Paso Robles Model Development Report – FinalJuly 2009
40
6. PEAK HOUR MODEL SPECIFICATIONS
In addition to the daily model validation described in the earlier chapters of this report, we developed model components to forecast traffic during the morning (AM) and evening (PM) peak hours. For purposes of model development and testing, the typical peak hours were determined based on traffic count data. This review showed that the morning peak hour generally occurs from 7:30 to 8:30 AM, and the evening peak hour occurs between 4:30 and 5:30 PM. Estimates of peak hour trips were obtained by applying a factor to the daily productions and attractions for each trip purpose. The peak hour factors were calibrated to reflect trip-making relationships between the AM and PM peak hours to the daily model. In addition, recent national and regional data from reference documents National Cooperative Highway Research Program (NCHRP) Report 3653 was consulted to ensure that the peak hour factors used in the Paso Robles travel demand model were within reasonable ranges.
Table 16 presents the AM and PM peak hour factors published by NCHRP4, SLOCOG model5 and the Paso Robles model. The differences in peak hour factors between the data references and the Paso Robles model are primarily due to local travel characteristics in the Paso Robles area compared to nationally (NCHRP Report 365 data).
3 National Cooperative Highway Research Program (NCHRP). Report 365: Travel Estimation Techniques for Urban Planning. Washington,D.C.: National Academy Press, 1998. 4 NCHRP, 1998. 5 SLOCOG, 2004.
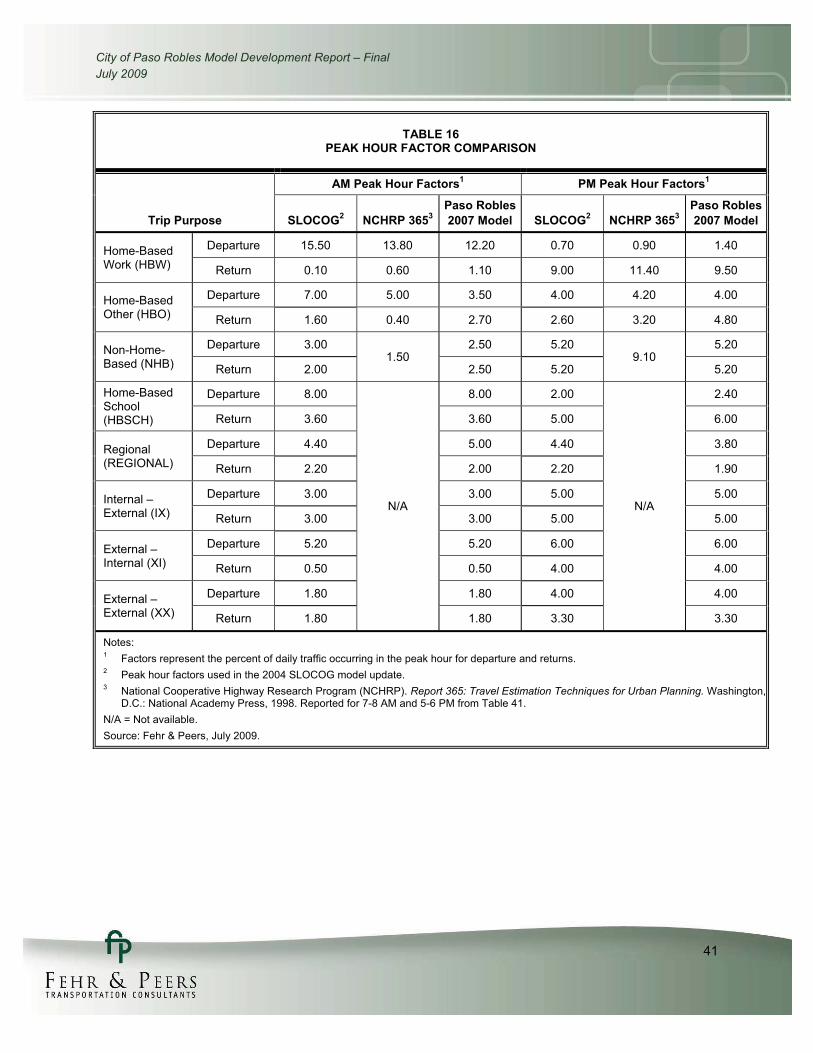
City of Paso Robles Model Development Report – FinalJuly 2009
41
TABLE 16 PEAK HOUR FACTOR COMPARISON
Trip Purpose
AM Peak Hour Factors1 PM Peak Hour Factors1
SLOCOG2 NCHRP 3653Paso Robles 2007 Model SLOCOG2 NCHRP 3653
Paso Robles 2007 Model
Home-Based Work (HBW)
Departure 15.50 13.80 12.20 0.70 0.90 1.40
Return 0.10 0.60 1.10 9.00 11.40 9.50
Home-Based Other (HBO)
Departure 7.00 5.00 3.50 4.00 4.20 4.00
Return 1.60 0.40 2.70 2.60 3.20 4.80
Non-Home-Based (NHB)
Departure 3.00 1.50
2.50 5.20 9.10
5.20
Return 2.00 2.50 5.20 5.20
Home-Based School (HBSCH)
Departure 8.00
N/A
8.00 2.00
N/A
2.40
Return 3.60 3.60 5.00 6.00
Regional (REGIONAL)
Departure 4.40 5.00 4.40 3.80
Return 2.20 2.00 2.20 1.90
Internal – External (IX)
Departure 3.00 3.00 5.00 5.00
Return 3.00 3.00 5.00 5.00
External – Internal (XI)
Departure 5.20 5.20 6.00 6.00
Return 0.50 0.50 4.00 4.00
External – External (XX)
Departure 1.80 1.80 4.00 4.00
Return 1.80 1.80 3.30 3.30
Notes:1 Factors represent the percent of daily traffic occurring in the peak hour for departure and returns. 2 Peak hour factors used in the 2004 SLOCOG model update. 3 National Cooperative Highway Research Program (NCHRP). Report 365: Travel Estimation Techniques for Urban Planning. Washington,
D.C.: National Academy Press, 1998. Reported for 7-8 AM and 5-6 PM from Table 41. N/A = Not available. Source: Fehr & Peers, July 2009.
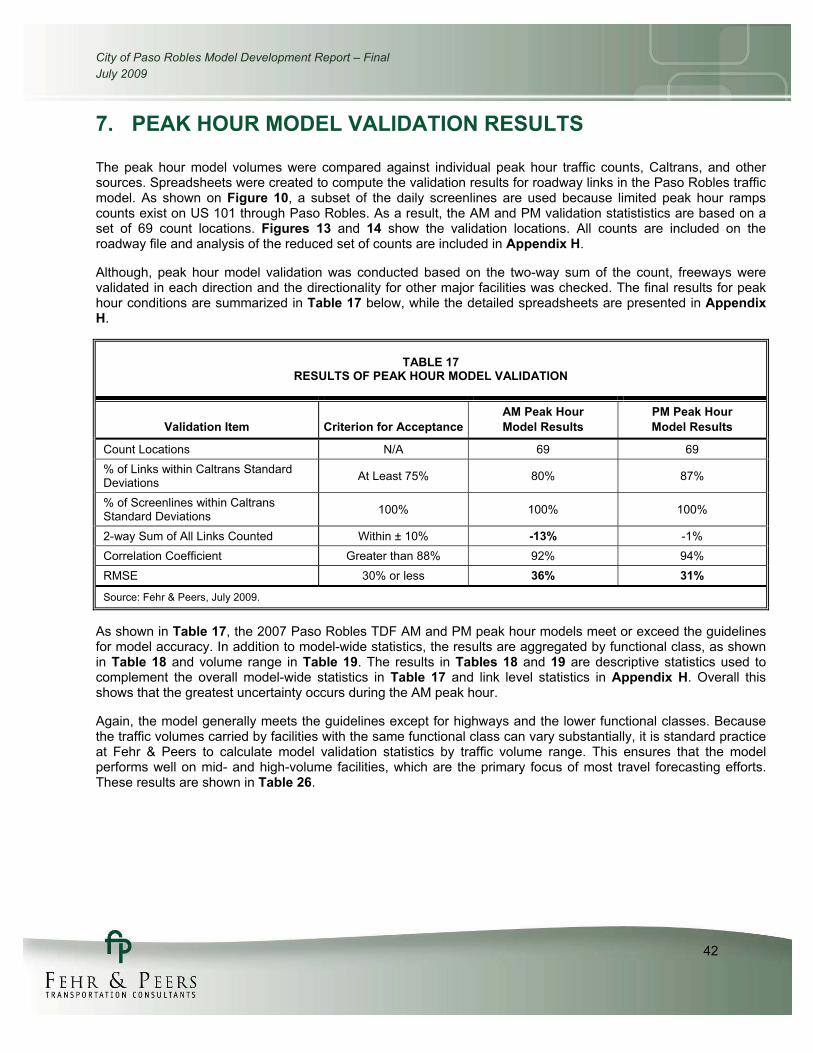
City of Paso Robles Model Development Report – FinalJuly 2009
42
7. PEAK HOUR MODEL VALIDATION RESULTS
The peak hour model volumes were compared against individual peak hour traffic counts, Caltrans, and other sources. Spreadsheets were created to compute the validation results for roadway links in the Paso Robles traffic model. As shown on Figure 10, a subset of the daily screenlines are used because limited peak hour ramps counts exist on US 101 through Paso Robles. As a result, the AM and PM validation statististics are based on a set of 69 count locations. Figures 13 and 14 show the validation locations. All counts are included on the roadway file and analysis of the reduced set of counts are included in Appendix H.
Although, peak hour model validation was conducted based on the two-way sum of the count, freeways were validated in each direction and the directionality for other major facilities was checked. The final results for peak hour conditions are summarized in Table 17 below, while the detailed spreadsheets are presented in Appendix H.
TABLE 17 RESULTS OF PEAK HOUR MODEL VALIDATION
Validation Item Criterion for AcceptanceAM Peak Hour Model Results
PM Peak Hour Model Results
Count Locations N/A 69 69 % of Links within Caltrans Standard Deviations At Least 75% 80% 87%
% of Screenlines within Caltrans Standard Deviations 100% 100% 100%
2-way Sum of All Links Counted Within ± 10% -13% -1%Correlation Coefficient Greater than 88% 92% 94% RMSE 30% or less 36% 31%
Source: Fehr & Peers, July 2009.
As shown in Table 17, the 2007 Paso Robles TDF AM and PM peak hour models meet or exceed the guidelines for model accuracy. In addition to model-wide statistics, the results are aggregated by functional class, as shown in Table 18 and volume range in Table 19. The results in Tables 18 and 19 are descriptive statistics used to complement the overall model-wide statistics in Table 17 and link level statistics in Appendix H. Overall this shows that the greatest uncertainty occurs during the AM peak hour.
Again, the model generally meets the guidelines except for highways and the lower functional classes. Because the traffic volumes carried by facilities with the same functional class can vary substantially, it is standard practice at Fehr & Peers to calculate model validation statistics by traffic volume range. This ensures that the model performs well on mid- and high-volume facilities, which are the primary focus of most travel forecasting efforts. These results are shown in Table 26.
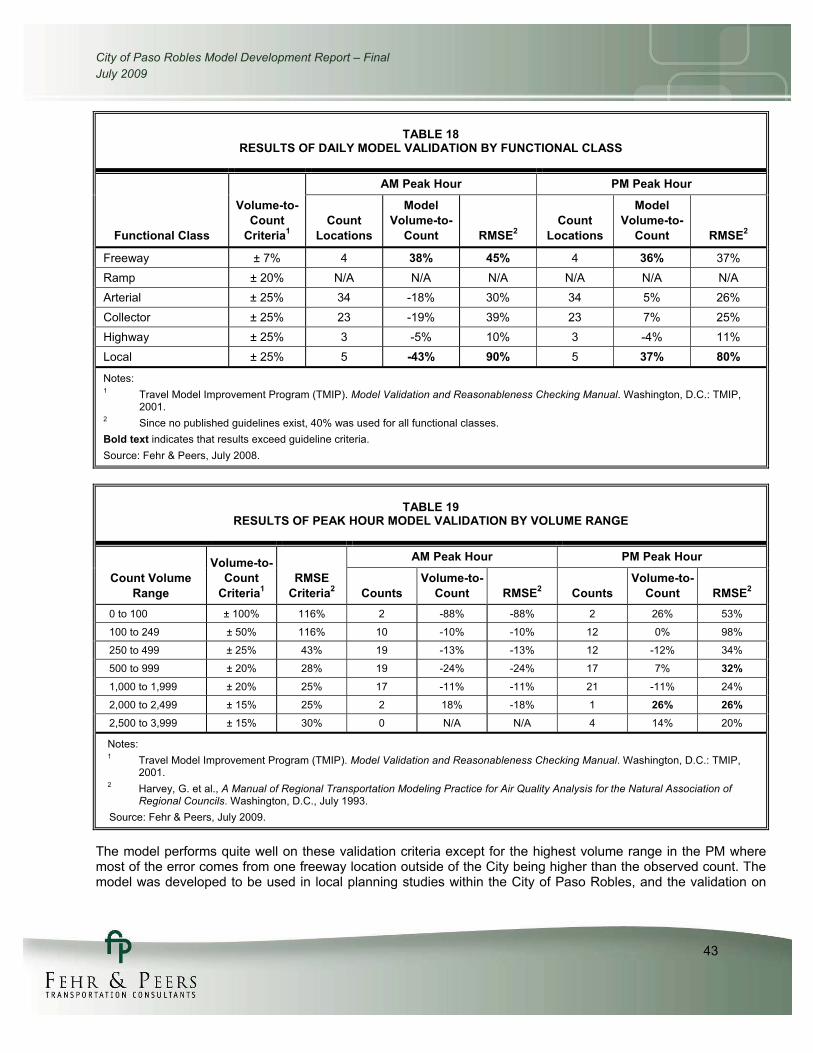
City of Paso Robles Model Development Report – FinalJuly 2009
43
TABLE 18 RESULTS OF DAILY MODEL VALIDATION BY FUNCTIONAL CLASS
Functional Class
Volume-to-Count
Criteria1
AM Peak Hour PM Peak Hour
Count Locations
Model Volume-to-
Count RMSE2 Count
Locations
Model Volume-to-
Count RMSE2
Freeway ± 7% 4 38% 45% 4 36% 37% Ramp ± 20% N/A N/A N/A N/A N/A N/A Arterial ± 25% 34 -18% 30% 34 5% 26% Collector ± 25% 23 -19% 39% 23 7% 25% Highway ± 25% 3 -5% 10% 3 -4% 11% Local ± 25% 5 -43% 90% 5 37% 80%
Notes:1 Travel Model Improvement Program (TMIP). Model Validation and Reasonableness Checking Manual. Washington, D.C.: TMIP,
2001. 2 Since no published guidelines exist, 40% was used for all functional classes. Bold text indicates that results exceed guideline criteria. Source: Fehr & Peers, July 2008.
TABLE 19 RESULTS OF PEAK HOUR MODEL VALIDATION BY VOLUME RANGE
Count Volume Range
Volume-to-Count
Criteria1 RMSE
Criteria2
AM Peak Hour PM Peak Hour
Counts Volume-to-
Count RMSE2 Counts Volume-to-
Count RMSE2 0 to 100 ± 100% 116% 2 -88% -88% 2 26% 53%
100 to 249 ± 50% 116% 10 -10% -10% 12 0% 98%
250 to 499 ± 25% 43% 19 -13% -13% 12 -12% 34%
500 to 999 ± 20% 28% 19 -24% -24% 17 7% 32% 1,000 to 1,999 ± 20% 25% 17 -11% -11% 21 -11% 24%
2,000 to 2,499 ± 15% 25% 2 18% -18% 1 26% 26% 2,500 to 3,999 ± 15% 30% 0 N/A N/A 4 14% 20%
Notes:1 Travel Model Improvement Program (TMIP). Model Validation and Reasonableness Checking Manual. Washington, D.C.: TMIP,
2001. 2 Harvey, G. et al., A Manual of Regional Transportation Modeling Practice for Air Quality Analysis for the Natural Association of
Regional Councils. Washington, D.C., July 1993. Source: Fehr & Peers, July 2009.
The model performs quite well on these validation criteria except for the highest volume range in the PM where most of the error comes from one freeway location outside of the City being higher than the observed count. The model was developed to be used in local planning studies within the City of Paso Robles, and the validation on

City of Paso Robles Model Development Report – FinalJuly 2009
44
major local roadways was within acceptable range. Therefore, the final model validation is expected to be appropriate for the purposes for which it was developed. The good results of the validation are due to the checking of the inputs at each step of the model development process, including a well-calibrated and validated daily model, and a complete set of count data.
The AM peak hour model deviation by geographic location is shown on Figure 15, while Figure 16 shows a scatter plot of count and model volumes compared to Caltrans’ allowable error. Figures 17 and 18 show similar comparisons for the PM peak hour model. As these figures show, the error is distributed geographically and by count volume and demonstrates the model is performing well overall.
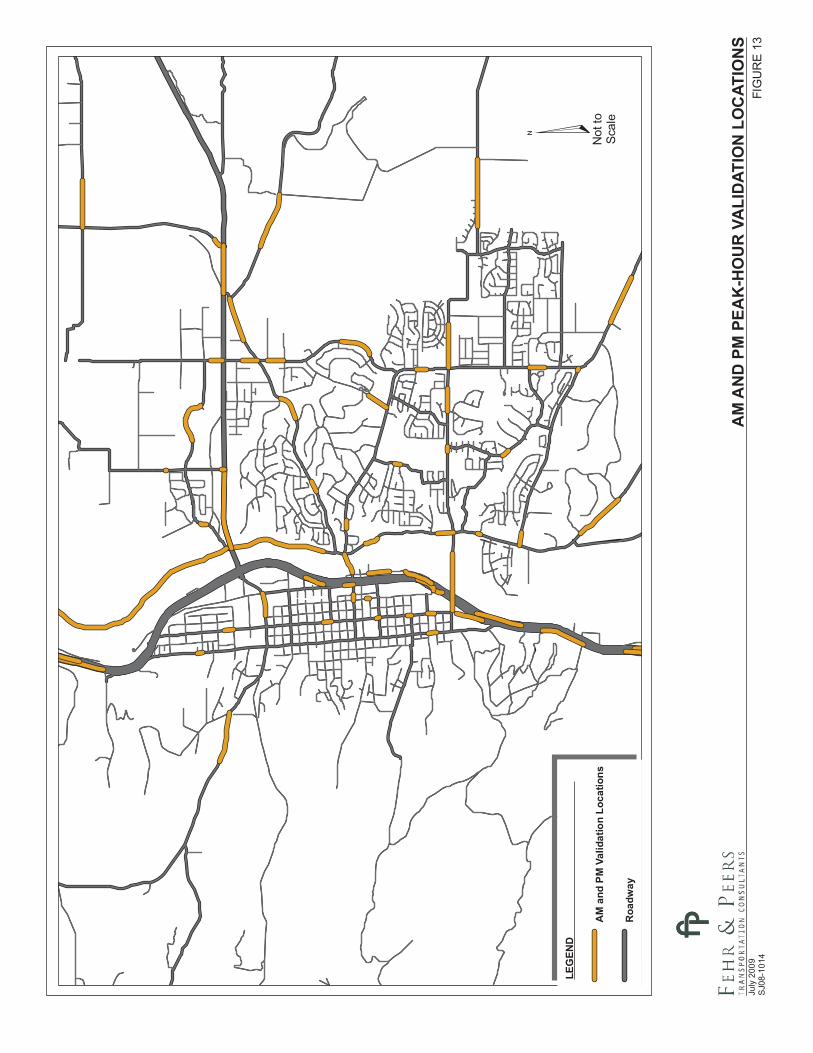
AM
AN
DPM
PEA
K-H
OU
RVA
LID
ATIO
NLO
CAT
ION
SFI
GU
RE
13Ju
ly20
09S
J08-
1014
¤N
otto
Scal
e
LEG
END
AM
and
PMVa
lidat
ion
Loca
tions
Roa
dway
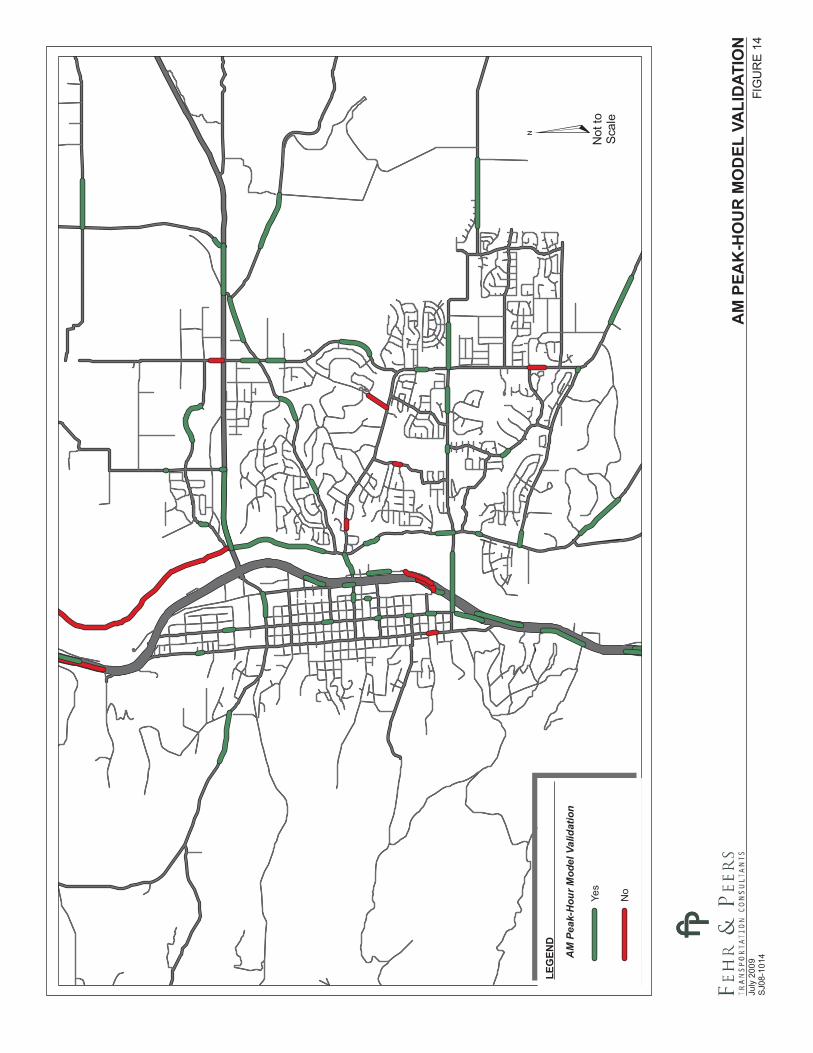
AM
PEA
K-H
OU
RM
OD
ELVA
LID
ATIO
NFI
GU
RE
14Ju
ly20
09S
J08-
1014
¤N
otto
Scal
e
LEG
END
AM
Peak
-Hou
rMod
elVa
lidat
ion
Yes
No

Figure 15 AM Peak Hour Model Validation Scatter Plots
Base Model (2008) AM Peak Hour Validation
0
500
1000
1500
2000
2500
3000
3500
4000
4500
5000
0 500 1000 1500 2000 2500 3000 3500 4000 4500 5000
Count Volume (Vehicles)
Mo
del
Vo
lum
e (V
ehic
les)
Model AM Peak
Min Deviation
Max Deviation
No Deviation
Base Model (2008) AM Peak Hour Validation
0
100
200
300
400
500
600
700
0 100 200 300 400 500 600 700
Count Volume (Vehicles)
Mo
del
Vo
lum
e (V
ehic
les)
Model AM Peak
Min Deviation
Max Deviation
No Deviation
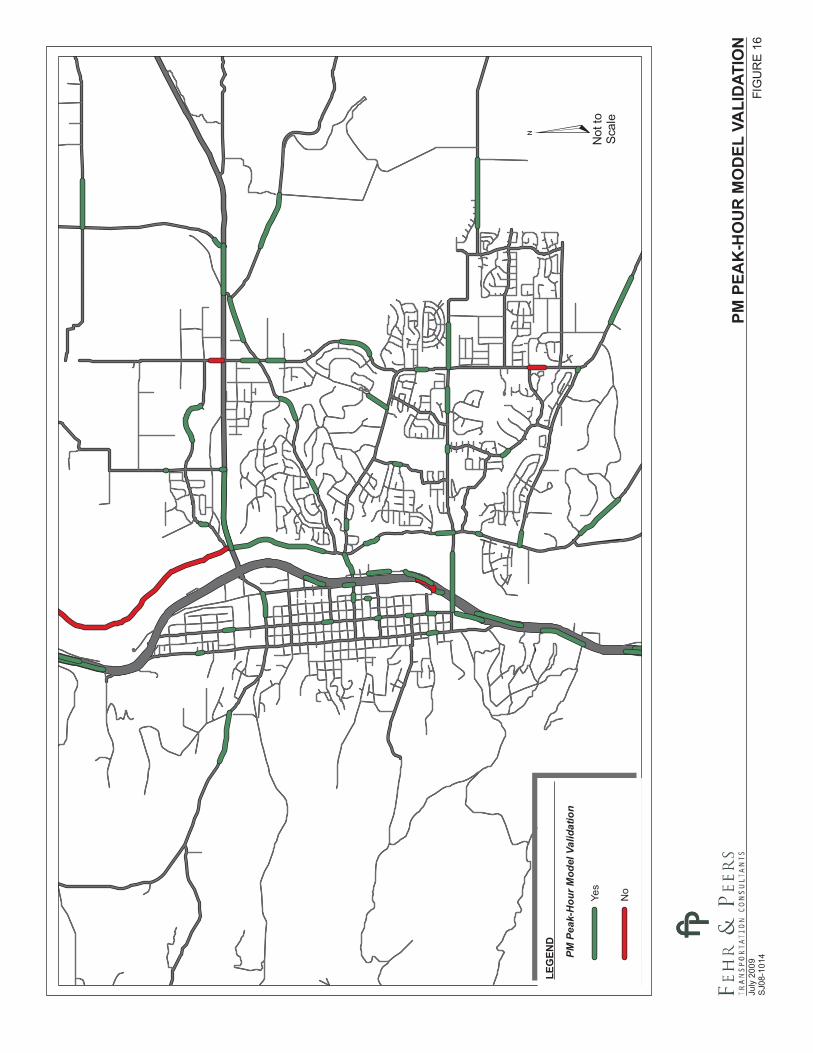
PMPE
AK
-HO
UR
MO
DEL
VALI
DAT
ION
FIG
UR
E16
July
2009
SJ0
8-10
14
¤N
otto
Scal
e
LEG
END
PMPe
ak-H
ourM
odel
Valid
atio
n
Yes
No
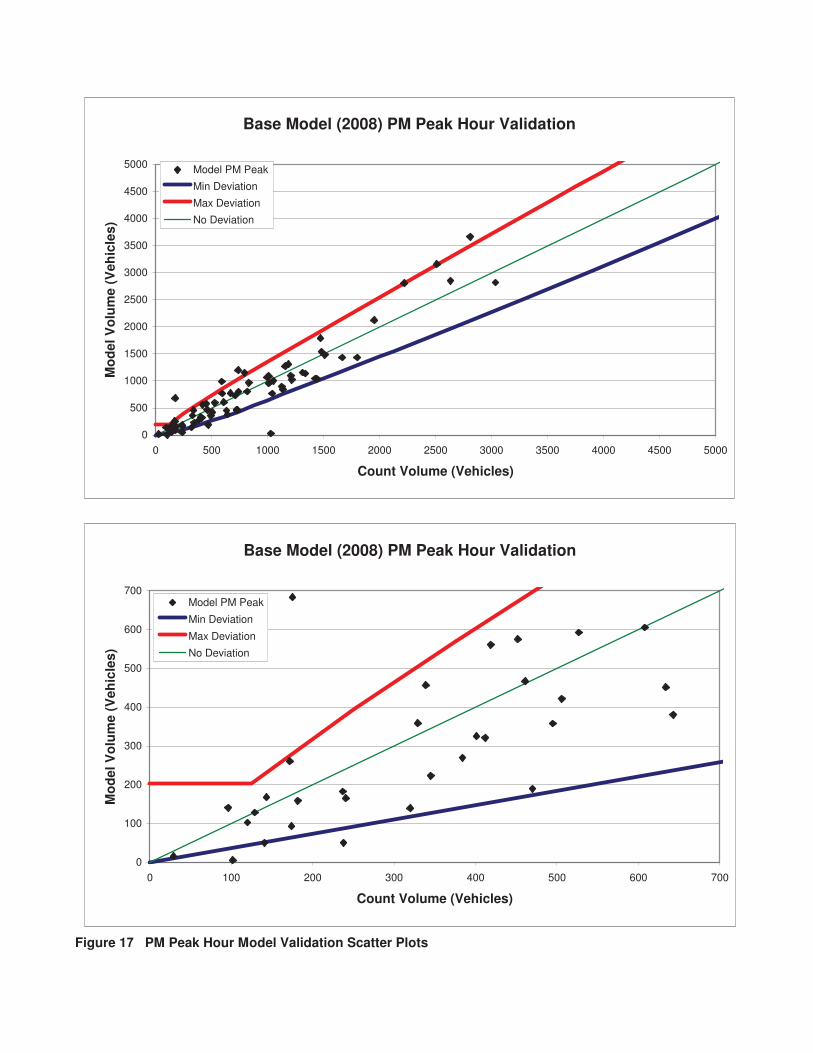
Figure 17 PM Peak Hour Model Validation Scatter Plots
Base Model (2008) PM Peak Hour Validation
0
500
1000
1500
2000
2500
3000
3500
4000
4500
5000
0 500 1000 1500 2000 2500 3000 3500 4000 4500 5000
Count Volume (Vehicles)
Mo
del
Vo
lum
e (V
ehic
les)
Model PM Peak
Min Deviation
Max Deviation
No Deviation
Base Model (2008) PM Peak Hour Validation
0
100
200
300
400
500
600
700
0 100 200 300 400 500 600 700
Count Volume (Vehicles)
Mo
del
Vo
lum
e (V
ehic
les)
Model PM Peak
Min Deviation
Max Deviation
No Deviation
APPENDIX A: TRAFFIC ANALYSIS ZONE (TAZ) BOUNDARY MAPS
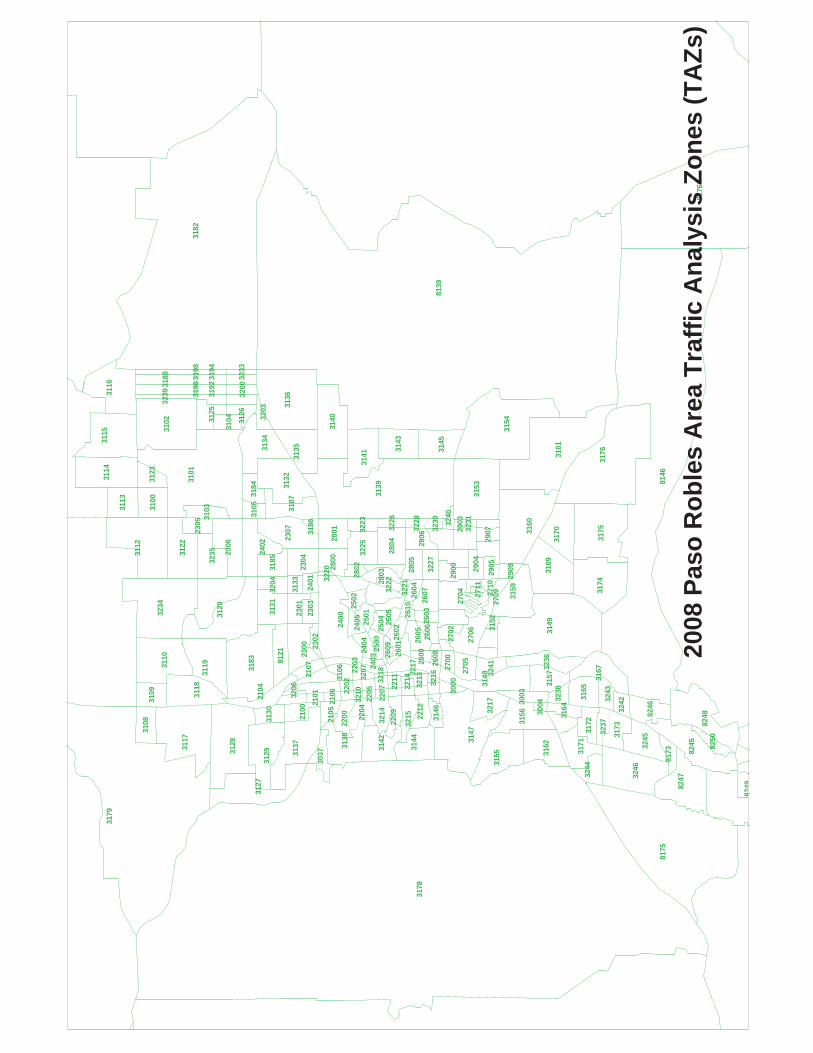
3222
3221
3227
323132
40
3230
3228
3226
3225
3223
2401 32
20
2609
2608
2610
2711
2710
3241 32
36
3238
3243
3242
3246
8173
3244
3237
3217
3216
220922
04
2214
3210
3207
3218
3106
3206
2101
3204
3203
3233
3200
3198
3196
3194
3192
3125
3239
3188
3186
3185
3105
3235 24
02
3119
317331
72
3126
3123
3134
3136
3135
3141
3140
3139
3143
3145
3153
3154
3161
3160
3176
3170
3169
3174
3175
3159
3167
3149
3152
3164
3171
3165
3157
3162
3156
3155
3147
3146
3144
3142
3138
3037
3127
3130
3129
3133
3128
3137
3131
3118
3120
3122
3116
3182
3115
3114
3113
3112
3183
3234
3110
3109
3117
3108
3179
3178
2504 25
05
260726
04
2501
2500 26
02
2603
2702
2704
2904
290028
05
280328
0225
0224
0524
04
2202 32
13
2211
2203 2403
2601
2605
2606
2706
2709
8250
8248
2905
2909
290729
03
2806
2804
3103
3184
3107
2801
2800
2400
2302
2107
2106
2205
2207
2600
2217 27
00
2705
3148
8146
8246
8245
8247
8249
8176
8139
3132
3104
3102
3100
3101
2305
2306
2307
2303
2304
2301
2300
8121
2104
2100
2105
2200
3214
3215 22
12
3000
3003
3004
3245
8175
2008
Pas
o R
ob
les
Are
a T
raff
ic A
nal
ysis
Zo
nes
(TA
Zs)
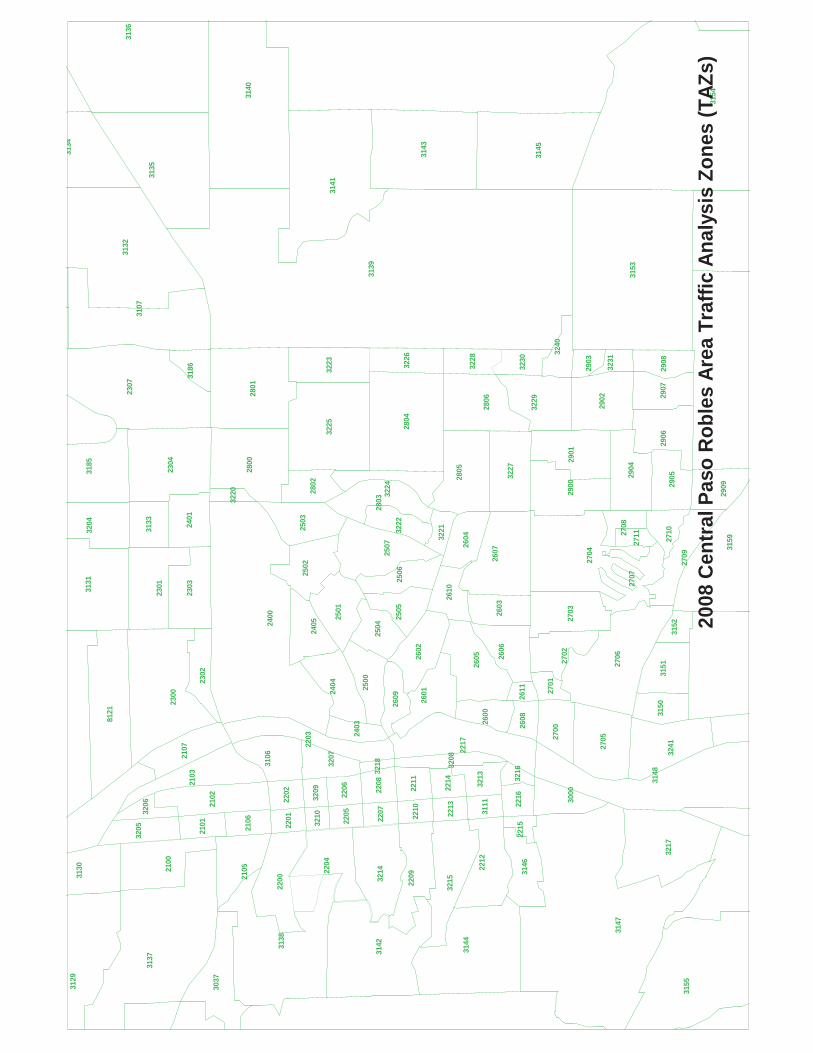
3222
3221
3227
3231
3240
3230
3229
3228
3226
3225
3224
3223
2401
3220
2609
2608
2611
2610
2711 2710
2707
3241
3217
3216
220922
04
2214
2213
3210
3209
3208
3207
321831
06
3206
2101
3204
3186
3185
3134
3136
3135
3141
3140
3139
3143
3145
3153
3154
3159
3150
3152
3151
3155
3147
3146
3144
314231
38
3037
3130
3129
3133
3137
3131
2504
2505
2607
2604
2506
2507
2501
2500
2602
2603
2702
2703
2704
2708
2902
2904
2900
2805
2803
2802
2503
2502
2405
2404
2202 22
06 3213
2208
2211
2203 24
03
2601
2605 26
06
2701
2706
2709
2905
2909
2906
2907
2908
2903
2901
2806
2804
3107
2801
2800
2400
2302
2107
2103
2102
2106
2201 22
05
2207
2210 31
11 2216
2600
2217
2700
2705
3148
3132
2307
2303
2304
2301
2300
8121
3205
2100
2105
2200 32
14
3215
2212
2215
3000
2008
Cen
tral
Pas
o R
oble
s A
rea
Traf
fic A
naly
sis
Zone
s (T
AZs
)

APPENDIX B: LAND USE DATA
(YEAR 2008 AND YEAR 2025)
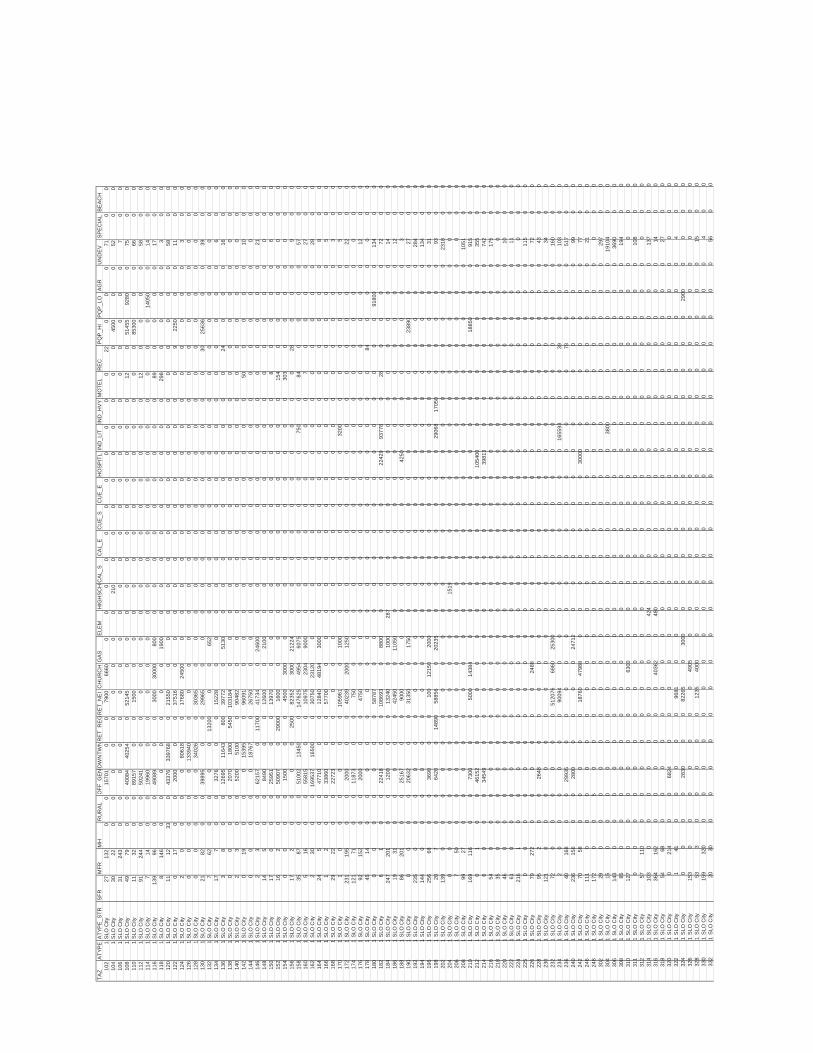
TA
ZA
TY
PE
AT
YP
E_S
TR
SF
RM
FR
MH
RU
RA
LO
FF
_GE
ND
WN
TW
NR
ET
_RE
GR
ET
_NE
IC
HU
RC
HG
AS
ELE
MH
IGH
SC
HC
AL_
SC
AL_
EC
UE
_SC
UE
_EH
OS
PIT
LIN
D_L
ITIN
D_H
VY
MO
TE
LR
EC
PQ
P_H
IP
QP
_LO
AG
RU
ND
EV
SP
EC
IAL
BE
AC
H10
21
SLO
City
2713
20
015
701
00
7900
6660
00
00
00
00
00
022
00
071
00
104
1S
LO C
ity30
220
00
00
00
00
210
00
00
00
00
045
000
052
00
106
1S
LO C
ity31
243
00
00
00
00
00
00
00
00
00
00
00
70
010
81
SLO
City
4979
00
4008
440
254
052
145
00
00
00
00
00
012
051
455
9280
075
00
110
1S
LO C
ity11
320
089
157
00
1500
00
00
00
00
00
00
085
300
00
660
011
21
SLO
City
9124
40
050
241
00
00
00
00
00
00
00
120
00
058
00
114
1S
LO C
ity7
140
019
960
00
00
00
00
00
00
00
00
014
050
014
00
116
1S
LO C
ity13
996
00
4908
90
030
0030
000
800
00
00
00
00
089
00
00
170
011
81
SLO
City
814
60
00
00
00
1900
00
00
00
00
029
80
00
03
00
120
1S
LO C
ity11
1233
043
376
3397
680
2155
00
00
00
00
00
00
00
00
058
00
122
1S
LO C
ity0
170
020
000
037
516
00
00
00
00
00
00
922
500
011
00
124
1S
LO C
ity2
00
00
8061
80
1768
024
500
00
00
00
00
00
00
00
03
00
126
1S
LO C
ity0
00
00
1339
400
00
00
00
00
00
00
00
00
00
00
128
1S
LO C
ity0
00
00
3402
60
3036
50
00
00
00
00
00
00
00
00
00
130
1S
LO C
ity21
820
039
895
00
2996
50
00
00
00
00
00
030
2563
60
039
00
132
1S
LO C
ity7
620
00
013
200
00
652
00
00
00
00
00
00
00
00
013
41
SLO
City
177
00
3276
00
1522
80
00
00
00
00
00
00
00
06
00
136
1S
LO C
ity3
80
012
695
1164
380
039
772
051
300
00
00
00
00
024
00
016
00
138
1S
LO C
ity0
00
020
7018
0054
5010
3184
00
00
00
00
00
00
00
00
00
014
01
SLO
City
23
00
5200
5100
090
482
00
00
00
00
00
00
00
00
00
014
21
SLO
City
019
00
015
395
096
091
00
00
00
00
00
050
00
00
100
014
41
SLO
City
00
00
018
767
026
750
00
00
00
00
00
00
00
00
00
014
61
SLO
City
23
00
6215
70
1170
041
734
024
600
00
00
00
00
00
00
00
210
014
81
SLO
City
145
00
8490
00
1260
00
2100
00
00
00
00
00
00
00
00
015
01
SLO
City
170
00
2595
10
013
970
00
00
00
00
00
08
00
00
60
015
21
SLO
City
162
00
5090
70
2900
016
000
00
00
00
00
00
154
00
00
00
015
41
SLO
City
00
00
1500
00
4500
3000
00
00
00
00
00
303
00
00
00
015
61
SLO
City
172
00
00
2500
8235
230
0021
224
00
00
00
00
00
280
00
90
015
81
SLO
City
3587
00
5100
213
450
014
7625
4954
6075
00
00
00
075
00
840
00
057
00
160
1S
LO C
ity5
160
055
815
00
1097
523
0490
000
00
00
00
00
70
00
027
00
162
1S
LO C
ity2
300
016
9537
1650
00
3075
023
120
00
00
00
00
00
00
00
028
00
164
1S
LO C
ity24
50
047
710
00
1284
048
194
3000
00
00
00
00
00
00
00
80
016
61
SLO
City
12
00
3386
00
057
700
00
00
00
00
00
00
00
00
50
016
81
SLO
City
2922
00
2272
30
00
00
00
00
00
00
00
00
00
30
017
01
SLO
City
10
00
00
010
5961
010
000
00
00
00
3200
00
00
00
50
017
21
SLO
City
231
195
00
2000
00
4023
920
0012
500
00
00
00
00
00
00
022
00
174
1S
LO C
ity12
171
00
1187
30
075
00
00
00
00
00
00
00
00
00
00
176
1S
LO C
ity92
152
00
2000
00
4750
00
00
00
00
00
00
00
00
120
017
81
SLO
City
4514
00
00
00
00
00
00
00
00
00
840
00
00
018
01
SLO
City
00
00
00
058
787
00
00
00
00
00
00
00
9180
00
134
00
182
1S
LO C
ity6
10
022
418
00
1086
930
8800
00
00
00
2242
993
778
028
00
00
720
018
41
SLO
City
247
201
00
1200
00
1324
00
1000
287
00
00
00
00
00
00
014
00
186
1S
LO C
ity19
310
00
00
4245
00
1105
00
00
00
00
00
00
00
012
00
188
1S
LO C
ity86
201
00
2516
70
090
000
00
00
00
042
500
00
00
00
30
019
01
SLO
City
00
00
2063
20
031
350
017
500
00
00
00
00
00
2389
00
027
00
192
1S
LO C
ity23
50
00
00
00
00
00
00
00
00
00
00
00
284
00
194
1S
LO C
ity14
40
00
00
00
00
00
00
00
00
00
00
00
134
00
196
1S
LO C
ity25
668
00
3690
00
100
1215
020
000
00
00
00
00
00
00
031
00
198
1S
LO C
ity20
70
064
200
1489
058
856
020
235
00
00
00
029
068
1705
00
00
00
930
020
21
SLO
City
139
00
00
00
00
00
00
00
00
00
00
00
023
180
020
41
SLO
City
00
00
00
00
00
015
190
00
00
00
00
00
00
00
206
1S
LO C
ity7
500
00
00
00
00
00
00
00
00
00
00
00
00
208
1S
LO C
ity99
270
00
00
00
00
00
00
00
00
00
00
010
510
021
01
SLO
City
169
116
00
7300
00
5000
1438
40
00
00
00
00
00
018
850
00
915
00
212
1S
LO C
ity0
10
046
152
00
00
00
00
00
010
5400
00
00
00
035
50
021
41
SLO
City
60
00
3454
90
00
00
00
00
00
3981
30
00
00
00
742
00
216
1S
LO C
ity54
00
00
00
00
00
00
00
00
00
00
00
017
50
021
81
SLO
City
350
00
00
00
00
00
00
00
00
00
00
00
00
022
01
SLO
City
460
00
00
00
00
00
00
00
00
00
00
00
100
022
21
SLO
City
610
00
00
00
00
00
00
00
00
00
00
00
110
022
41
SLO
City
216
10
00
00
00
00
00
00
00
00
00
00
00
00
225
1S
LO C
ity0
00
00
00
00
00
00
00
00
00
00
00
011
50
022
61
SLO
City
7927
20
00
00
024
880
00
00
00
00
00
00
00
720
022
81
SLO
City
952
00
2648
00
00
00
00
00
00
00
00
00
043
00
230
1S
LO C
ity12
10
00
00
00
00
00
00
00
00
00
00
00
340
023
21
SLO
City
720
00
00
051
2076
6860
2530
00
00
00
00
00
00
00
016
00
023
41
SLO
City
20
00
00
090
094
00
00
00
00
016
5593
00
390
00
103
00
236
1S
LO C
ity40
168
00
2993
50
00
00
00
00
00
00
00
780
00
517
00
240
1S
LO C
ity23
615
60
028
000
00
024
712
00
00
00
00
00
00
00
990
024
21
SLO
City
7058
00
00
018
760
4798
80
00
00
00
3000
00
00
00
00
770
024
61
SLO
City
111
00
00
00
00
00
00
00
00
00
00
00
021
00
248
1S
LO C
ity17
20
05
00
00
00
00
00
00
00
00
00
00
00
030
21
SLO
City
290
00
00
00
00
00
00
00
00
00
00
00
297
00
304
1S
LO C
ity15
00
00
00
00
00
00
00
00
3800
00
00
00
1910
40
030
61
SLO
City
143
00
00
00
00
00
00
00
00
00
00
00
036
900
030
81
SLO
City
850
00
00
00
00
00
00
00
00
00
00
00
194
00
310
1S
LO C
ity12
70
00
00
00
6300
00
00
00
00
00
00
00
00
00
311
1S
LO C
ity0
00
00
00
00
00
00
00
00
00
00
00
010
80
031
21
SLO
City
5711
00
00
00
00
00
00
00
00
00
00
00
00
00
314
1S
LO C
ity10
30
00
00
00
00
424
00
00
00
00
00
00
013
70
031
61
SLO
City
364
162
00
00
00
4036
20
480
00
00
00
00
00
00
014
00
318
1S
LO C
ity54
680
00
00
00
00
00
00
00
00
00
00
027
00
320
1S
LO C
ity0
214
00
6824
00
00
00
00
00
00
00
00
00
00
00
322
1S
LO C
ity1
410
00
00
9681
00
00
00
00
00
00
00
00
40
032
41
SLO
City
00
00
2830
00
8226
50
3000
00
00
00
00
00
00
2 900
00
00
326
1S
LO C
ity15
30
00
00
00
4905
00
00
00
00
00
00
00
00
00
328
1S
LO C
ity53
30
00
00
1235
4000
00
00
00
00
00
00
00
015
00
330
1S
LO C
ity15
932
00
00
00
00
00
00
00
00
00
00
00
04
00
332
1S
LO C
ity20
300
00
00
00
00
00
00
00
00
00
00
056
00
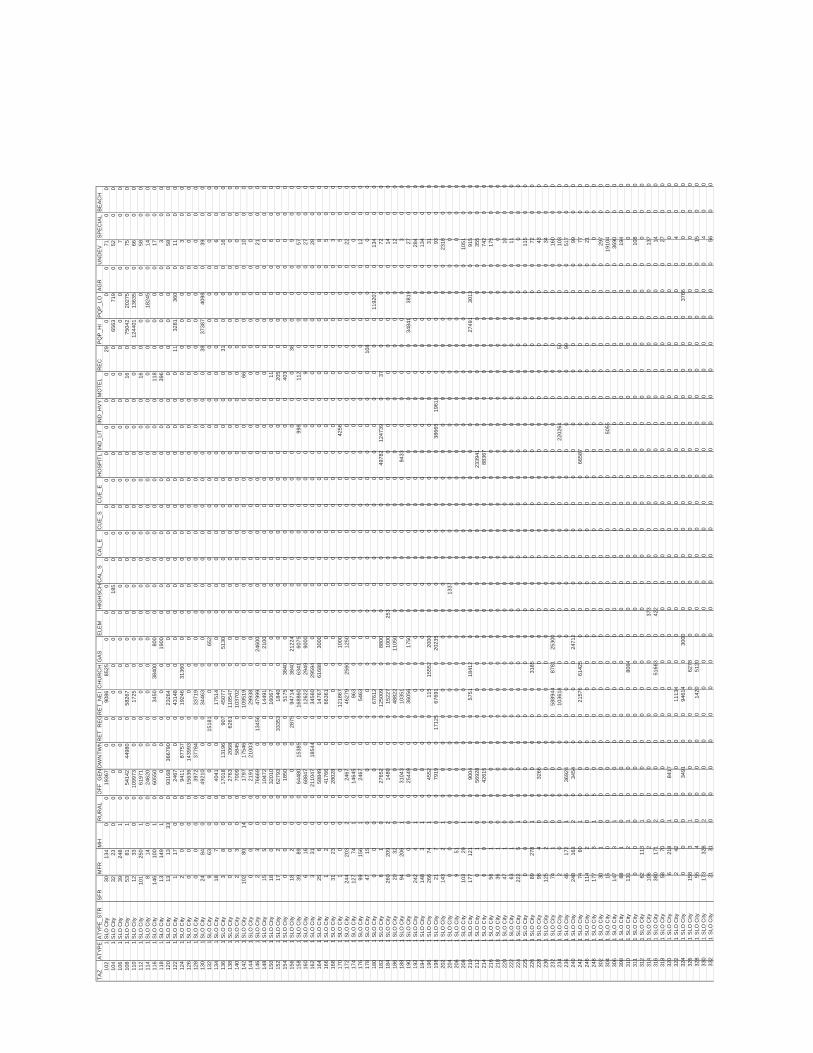
TA
ZA
TY
PE
AT
YP
E_S
TR
SF
RM
FR
MH
RU
RA
LO
FF
_GE
ND
WN
TW
NR
ET
_RE
GR
ET
_NE
IC
HU
RC
HG
AS
ELE
MH
IGH
SC
HC
AL_
SC
AL_
EC
UE
_SC
UE
_EH
OS
PIT
LIN
D_L
ITIN
D_H
VY
MO
TE
LR
EC
PQ
P_H
IP
QP
_LO
AG
RU
ND
EV
SP
EC
IAL
BE
AC
H10
21
SLO
City
3013
40
019
367
00
9086
8525
00
00
00
00
00
029
00
071
00
104
1S
LO C
ity32
230
00
00
00
00
185
00
00
00
00
065
6371
90
520
010
61
SLO
City
3924
81
00
00
00
00
00
00
00
00
00
00
07
00
108
1S
LO C
ity53
811
054
142
4498
00
5826
70
00
00
00
00
00
160
7504
220
275
075
00
110
1S
LO C
ity12
330
010
9973
00
1725
00
00
00
00
00
00
012
4401
1363
50
660
011
21
SLO
City
101
250
10
6197
10
00
00
00
00
00
00
016
00
00
580
011
41
SLO
City
814
00
2462
00
00
00
00
00
00
00
00
00
1824
50
140
011
61
SLO
City
146
100
10
6055
00
034
5038
400
800
00
00
00
00
011
80
00
017
00
118
1S
LO C
ity13
149
10
00
00
019
000
00
00
00
00
396
00
00
30
012
01
SLO
City
1313
330
9316
836
6790
023
264
00
00
00
00
00
00
00
00
580
012
21
SLO
City
117
00
2467
00
4314
80
00
00
00
00
00
011
3281
360
011
00
124
1S
LO C
ity2
00
094
1187
757
019
246
3136
00
00
00
00
00
00
00
00
30
012
61
SLO
City
00
00
1563
614
3993
00
00
00
00
00
00
00
00
00
00
012
81
SLO
City
00
00
3972
3778
40
3371
90
00
00
00
00
00
00
00
00
00
130
1S
LO C
ity24
840
049
210
00
3446
30
00
00
00
00
00
038
3738
740
980
390
013
21
SLO
City
963
00
00
1518
10
065
20
00
00
00
00
00
00
00
00
134
1S
LO C
ity18
70
040
410
017
514
00
00
00
00
00
00
00
00
60
013
61
SLO
City
38
00
1701
813
196
907
4507
70
5130
00
00
00
00
00
310
00
160
013
81
SLO
City
00
00
2763
2068
6261
1185
470
00
00
00
00
00
00
00
00
00
140
1S
LO C
ity2
30
070
0958
450
1037
020
00
00
00
00
00
00
00
00
00
142
1S
LO C
ity10
280
140
1797
1754
60
1095
190
00
00
00
00
00
660
00
010
00
144
1S
LO C
ity0
00
021
9121
003
029
938
00
00
00
00
00
00
00
00
00
014
61
SLO
City
23
00
7666
90
1345
647
999
024
600
00
00
00
00
00
00
00
210
014
81
SLO
City
155
00
1047
20
014
491
021
000
00
00
00
00
00
00
00
00
150
1S
LO C
ity18
00
032
010
00
1606
70
00
00
00
00
00
110
00
06
00
152
1S
LO C
ity17
20
062
793
033
353
1840
00
00
00
00
00
020
50
00
00
00
154
1S
LO C
ity0
00
018
500
051
7538
400
00
00
00
00
040
30
00
00
00
156
1S
LO C
ity18
20
00
028
7594
714
3840
2122
40
00
00
00
00
036
00
09
00
158
1S
LO C
ity39
890
064
480
1538
50
1688
6063
4160
750
00
00
00
998
011
20
00
057
00
160
1S
LO C
ity6
160
068
847
00
1262
229
4990
000
00
00
00
00
90
00
027
00
162
1S
LO C
ity3
310
021
1047
1854
40
3456
029
594
00
00
00
00
00
00
00
028
00
164
1S
LO C
ity25
60
058
849
00
1476
761
688
3000
00
00
00
00
00
00
00
80
016
61
SLO
City
12
00
4176
60
066
361
00
00
00
00
00
00
00
00
50
016
81
SLO
City
3123
00
2802
80
00
00
00
00
00
00
00
00
00
30
017
01
SLO
City
10
00
00
012
1867
010
000
00
00
00
4256
00
00
00
50
017
21
SLO
City
244
203
20
2467
00
4627
925
6012
500
00
00
00
00
00
00
022
00
174
1S
LO C
ity12
774
10
1464
50
086
30
00
00
00
00
00
00
00
00
00
176
1S
LO C
ity99
156
10
2467
00
5463
00
00
00
00
00
00
00
00
120
017
81
SLO
City
4715
00
00
00
00
00
00
00
00
00
108
00
00
00
180
1S
LO C
ity0
00
00
00
6761
20
00
00
00
00
00
00
011
9207
013
40
018
21
SLO
City
61
00
2765
20
012
5009
088
000
00
00
049
782
1247
390
370
00
072
00
184
1S
LO C
ity26
020
92
014
800
015
227
010
0025
30
00
00
00
00
00
00
140
018
61
SLO
City
2032
00
00
048
822
011
050
00
00
00
00
00
00
00
120
018
81
SLO
City
9420
61
031
043
00
1035
10
00
00
00
094
330
00
00
00
30
019
01
SLO
City
00
00
2544
90
036
056
017
500
00
00
00
00
00
3484
138
190
270
019
21
SLO
City
242
41
00
00
00
00
00
00
00
00
00
00
028
40
019
41
SLO
City
148
31
00
00
00
00
00
00
00
00
00
00
013
40
019
61
SLO
City
266
741
045
520
011
515
552
2000
00
00
00
00
00
00
00
310
019
81
SLO
City
217
00
7919
017
125
6769
10
2023
50
00
00
00
3866
519
618
00
00
093
00
202
1S
LO C
ity14
32
10
00
00
00
00
00
00
00
00
00
00
2318
00
204
1S
LO C
ity0
00
00
00
00
00
1337
00
00
00
00
00
00
00
020
61
SLO
City
951
00
00
00
00
00
00
00
00
00
00
00
00
020
81
SLO
City
103
291
00
00
00
00
00
00
00
00
00
00
010
510
021
01
SLO
City
177
121
10
9004
00
5751
1841
20
00
00
00
00
00
027
491
3013
091
50
021
21
SLO
City
01
00
5692
80
00
00
00
00
00
2339
410
00
00
00
355
00
214
1S
LO C
ity6
00
042
615
00
00
00
00
00
088
367
00
00
00
074
20
021
61
SLO
City
561
00
00
00
00
00
00
00
00
00
00
00
175
00
218
1S
LO C
ity36
10
00
00
00
00
00
00
00
00
00
00
00
00
220
1S
LO C
ity47
10
00
00
00
00
00
00
00
00
00
00
010
00
222
1S
LO C
ity63
10
00
00
00
00
00
00
00
00
00
00
011
00
224
1S
LO C
ity22
25
10
00
00
00
00
00
00
00
00
00
00
00
022
51
SLO
City
00
00
00
00
00
00
00
00
00
00
00
00
115
00
226
1S
LO C
ity89
278
10
00
00
3185
00
00
00
00
00
00
00
072
00
228
1S
LO C
ity98
40
032
660
00
00
00
00
00
00
00
00
00
430
023
01
SLO
City
125
20
00
00
00
00
00
00
00
00
00
00
034
00
232
1S
LO C
ity74
10
00
00
5889
4487
8125
300
00
00
00
00
00
00
00
160
00
234
1S
LO C
ity2
00
00
00
1036
180
00
00
00
00
2202
640
050
00
010
30
023
61
SLO
City
4617
21
036
924
00
00
00
00
00
00
00
099
00
051
70
024
01
SLO
City
248
163
20
3454
00
00
2471
20
00
00
00
00
00
00
099
00
242
1S
LO C
ity74
601
00
00
2157
661
425
00
00
00
066
587
00
00
00
077
00
246
1S
LO C
ity11
42
00
00
00
00
00
00
00
00
00
00
00
210
024
81
SLO
City
177
31
50
00
00
00
00
00
00
00
00
00
00
00
302
1S
LO C
ity30
10
00
00
00
00
00
00
00
00
00
00
029
70
030
41
SLO
City
150
00
00
00
00
00
00
00
050
550
00
00
019
104
00
306
1S
LO C
ity14
73
10
00
00
00
00
00
00
00
00
00
00
3690
00
308
1S
LO C
ity88
10
00
00
00
00
00
00
00
00
00
00
019
40
031
01
SLO
City
131
21
00
00
080
640
00
00
00
00
00
00
00
00
031
11
SLO
City
00
00
00
00
00
00
00
00
00
00
00
00
108
00
312
1S
LO C
ity62
113
10
00
00
00
00
00
00
00
00
00
00
00
031
41
SLO
City
106
20
00
00
00
037
30
00
00
00
00
00
00
137
00
316
1S
LO C
ity38
017
12
00
00
051
663
042
20
00
00
00
00
00
00
140
031
81
SLO
City
5870
00
00
00
00
00
00
00
00
00
00
00
270
032
01
SLO
City
621
81
084
170
00
00
00
00
00
00
00
00
00
00
032
21
SLO
City
242
00
00
011
134
00
00
00
00
00
00
00
00
40
032
41
SLO
City
00
00
3491
00
9461
40
3000
00
00
00
00
00
00
3 766
00
00
326
1S
LO C
ity15
83
10
00
00
6278
00
00
00
00
00
00
00
00
00
328
1S
LO C
ity55
40
00
00
1420
5120
00
00
00
00
00
00
00
015
00
330
1S
LO C
ity17
332
82
00
00
00
00
00
00
00
00
00
00
04
00
332
1S
LO C
ity21
310
00
00
00
00
00
00
00
00
00
00
056
00
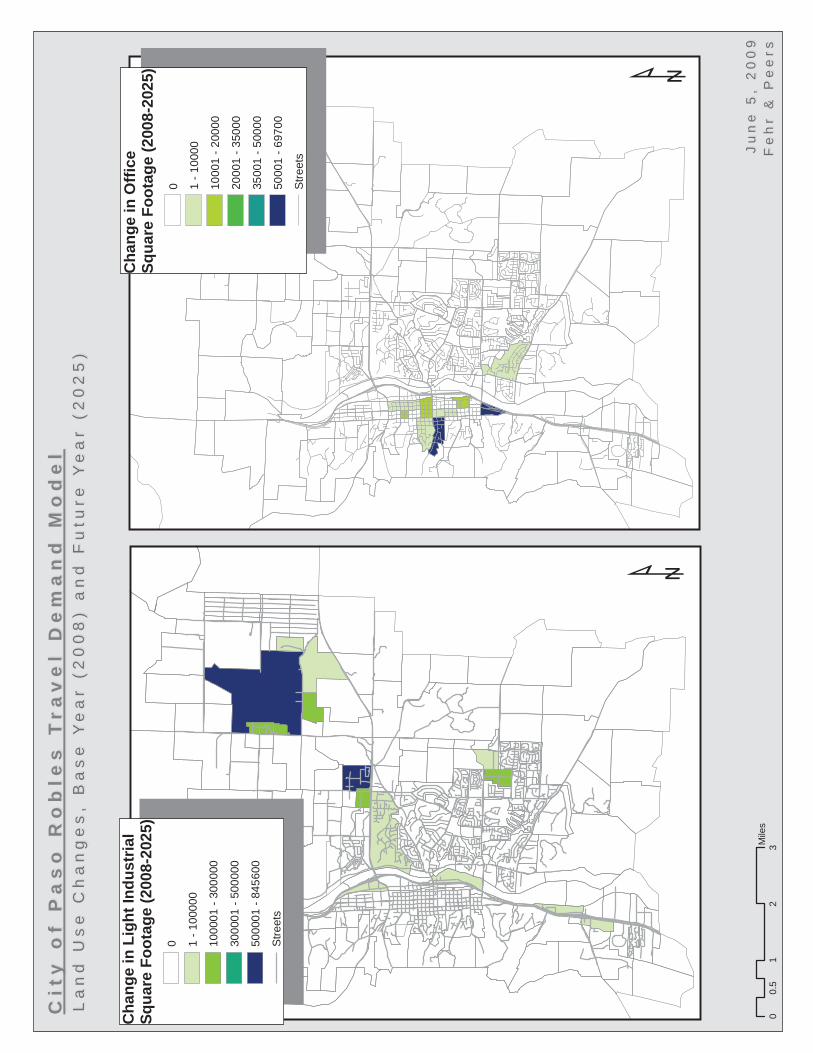
Ch
ang
e in
Lig
ht
Ind
ust
rial
Sq
uar
e F
oo
tag
e (2
008-
2025
)
0 1 -
1000
00
1000
01 -
300
000
3000
01 -
500
000
5000
01 -
845
600
Str
eets
Ch
ang
e in
Off
ice
Sq
uar
e F
oo
tag
e (2
008-
2025
)
0 1 -
1000
0
1000
1 -
2000
0
2000
1 -
3500
0
3500
1 -
5000
0
5000
1 -
6970
0
Str
eets
Cit
y o
f P
as
o R
ob
les
Tr
av
el
De
ma
nd
Mo
de
lC
ity
of
Pa
so
Ro
ble
s T
ra
ve
l D
em
an
d M
od
el
La
nd
Us
e C
ha
ng
es
, B
as
e Y
ea
r (2
00
8)
an
d F
utu
re Y
ea
r (
20
25
)L
an
d U
se
Ch
an
ge
s,
Ba
se
Ye
ar
(20
08
) a
nd
Fu
ture
Ye
ar
(2
02
5)
Ju
ne
5,
20
09
Ju
ne
5,
20
09
Fe
hr
& P
ee
rsF
eh
r &
Pe
ers
��
01
23
0.5
Mile
s
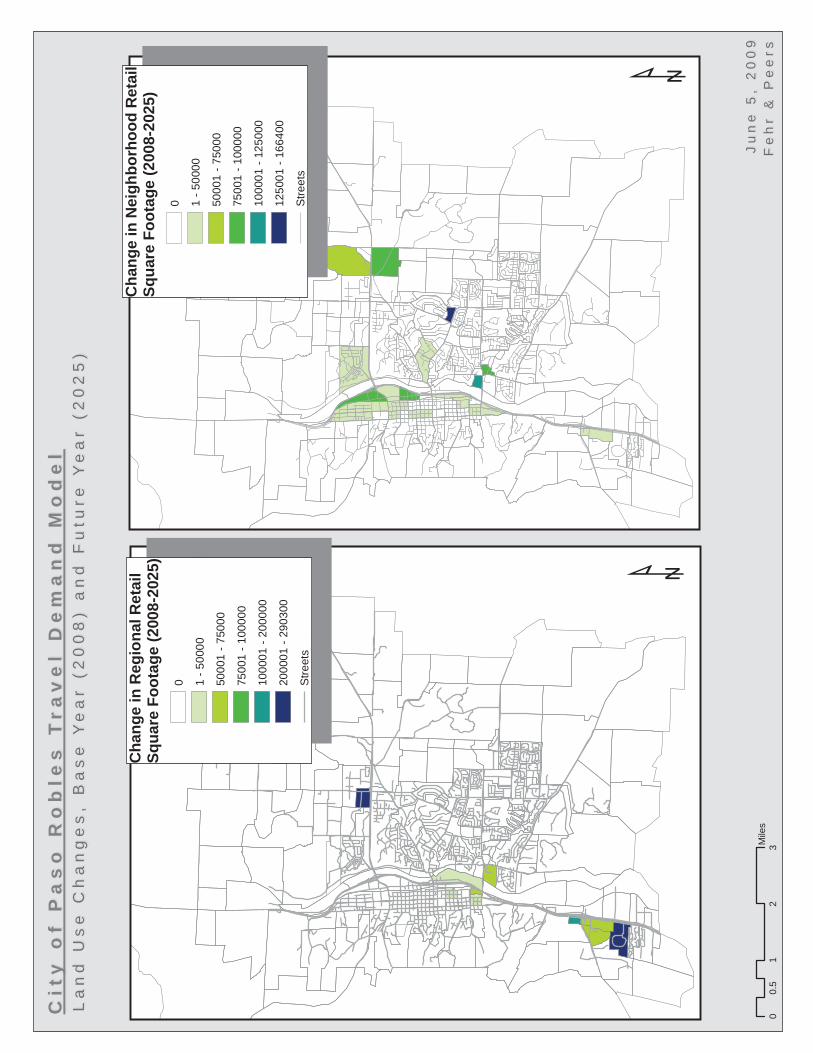
Ch
ang
e in
Reg
ion
al R
etai
lS
qu
are
Fo
ota
ge
(200
8-20
25)
0 1 -
5000
0
5000
1 -
7500
0
7500
1 -
1000
00
1000
01 -
200
000
2000
01 -
290
300
Str
eets
Ch
ang
e in
Nei
gh
bo
rho
od
Ret
ail
Sq
uar
e F
oo
tag
e (2
008-
2025
)
0 1 -
5000
0
5000
1 -
750
00
7500
1 -
100
000
1000
01
- 12
5000
1250
01
- 16
6400
Str
eets
Cit
y o
f P
as
o R
ob
les
Tr
av
el
De
ma
nd
Mo
de
lC
ity
of
Pa
so
Ro
ble
s T
ra
ve
l D
em
an
d M
od
el
La
nd
Us
e C
ha
ng
es
, B
as
e Y
ea
r (2
00
8)
an
d F
utu
re Y
ea
r (
20
25
)L
an
d U
se
Ch
an
ge
s,
Ba
se
Ye
ar
(20
08
) a
nd
Fu
ture
Ye
ar
(2
02
5)
Ju
ne
5,
20
09
Ju
ne
5,
20
09
Fe
hr
& P
ee
rsF
eh
r &
Pe
ers
��
01
23
0.5
Mile
s
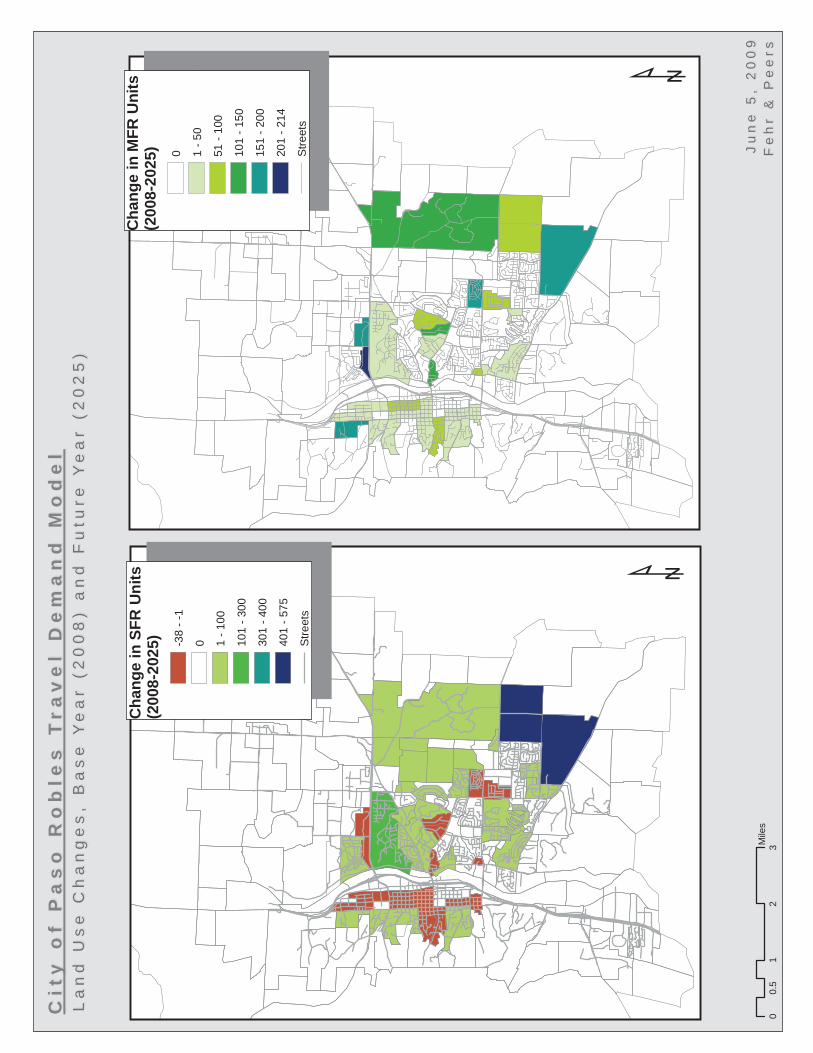
Ch
ang
e in
SF
R U
nit
s (2
008-
2025
) -38
- -1
0 1 -
100
101
- 30
0
301
- 40
0
401
- 57
5
Str
eets
Ch
ang
e in
MF
R U
nit
s (2
008-
2025
) 0 1 -
50
51 -
100
101
- 15
0
151
- 20
0
201
- 21
4
Str
eets
Cit
y o
f P
as
o R
ob
les
Tr
av
el
De
ma
nd
Mo
de
lC
ity
of
Pa
so
Ro
ble
s T
ra
ve
l D
em
an
d M
od
el
La
nd
Us
e C
ha
ng
es
, B
as
e Y
ea
r (2
00
8)
an
d F
utu
re Y
ea
r (
20
25
)L
an
d U
se
Ch
an
ge
s,
Ba
se
Ye
ar
(20
08
) a
nd
Fu
ture
Ye
ar
(2
02
5)
Ju
ne
5,
20
09
Ju
ne
5,
20
09
Fe
hr
& P
ee
rsF
eh
r &
Pe
ers
��
01
23
0.5
Mile
s

APPENDIX C: COUNTY ASSESSORS PARCEL USE CODES
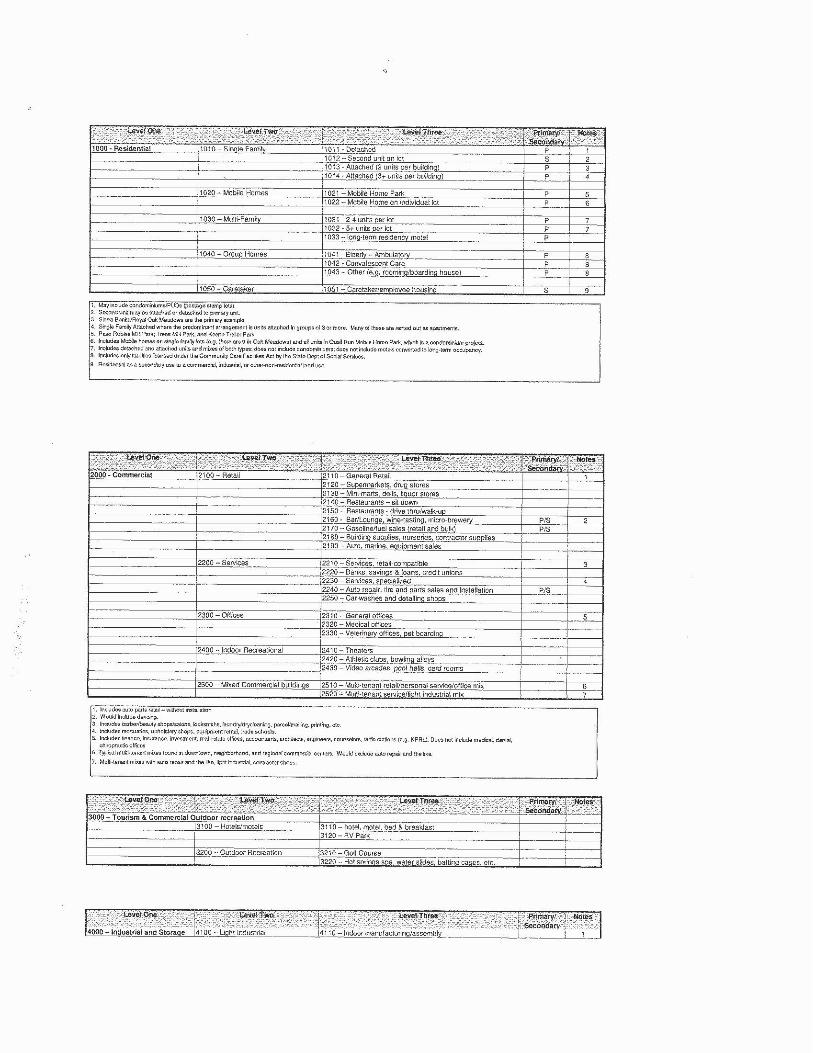
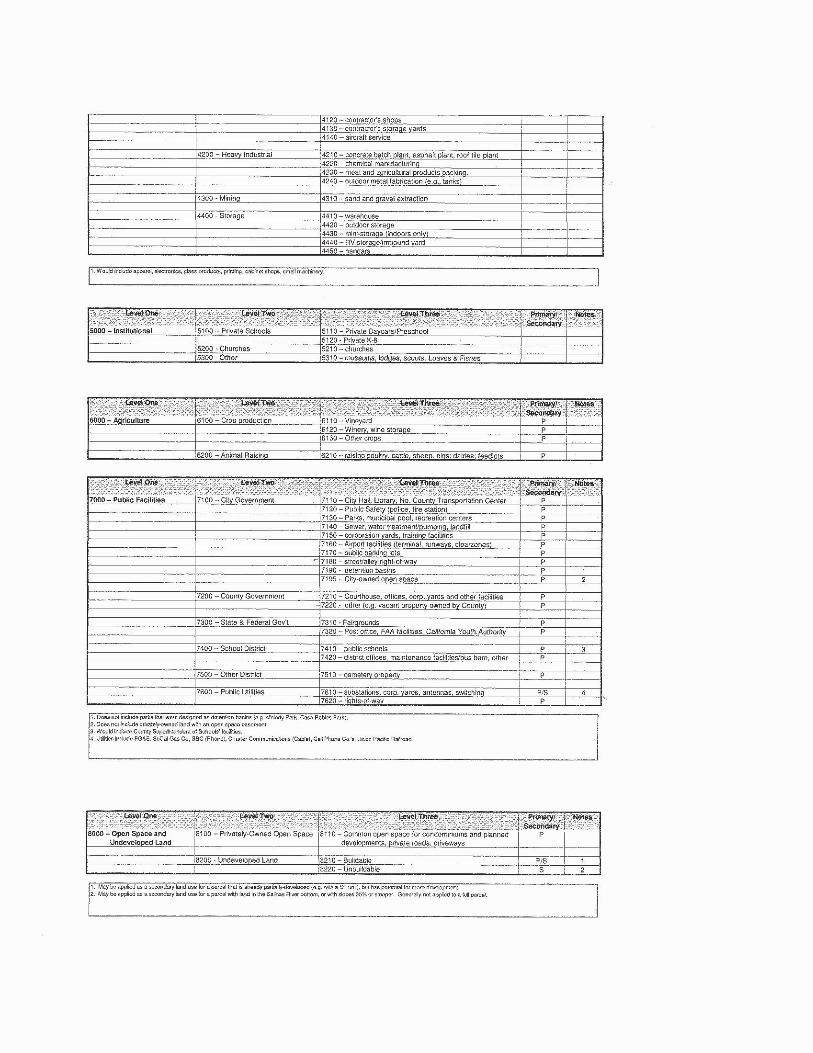
APPENDIX D: RESOURCE FILE
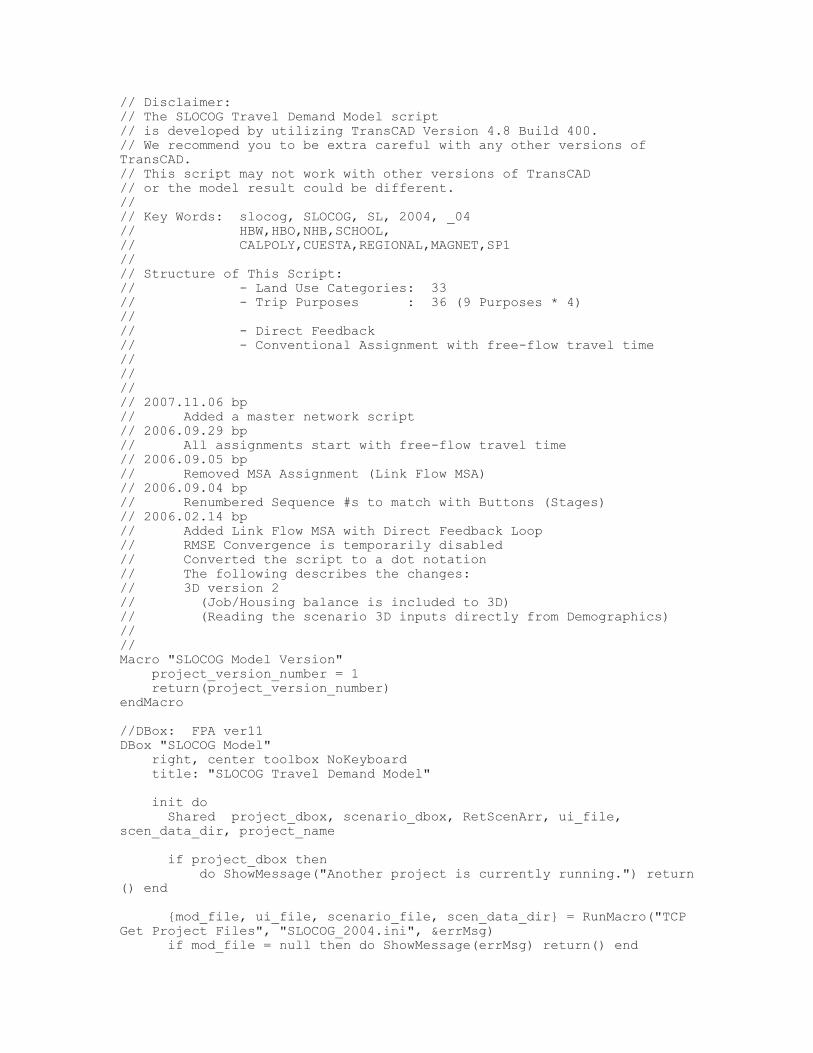
// Disclaimer:// The SLOCOG Travel Demand Model script// is developed by utilizing TransCAD Version 4.8 Build 400.// We recommend you to be extra careful with any other versions of TransCAD.// This script may not work with other versions of TransCAD// or the model result could be different.//// Key Words: slocog, SLOCOG, SL, 2004, _04// HBW,HBO,NHB,SCHOOL,// CALPOLY,CUESTA,REGIONAL,MAGNET,SP1//// Structure of This Script:// - Land Use Categories: 33// - Trip Purposes : 36 (9 Purposes * 4)//// - Direct Feedback// - Conventional Assignment with free-flow travel time//////// 2007.11.06 bp// Added a master network script// 2006.09.29 bp// All assignments start with free-flow travel time// 2006.09.05 bp// Removed MSA Assignment (Link Flow MSA)// 2006.09.04 bp// Renumbered Sequence #s to match with Buttons (Stages)// 2006.02.14 bp// Added Link Flow MSA with Direct Feedback Loop// RMSE Convergence is temporarily disabled// Converted the script to a dot notation// The following describes the changes:// 3D version 2// (Job/Housing balance is included to 3D)// (Reading the scenario 3D inputs directly from Demographics)////Macro "SLOCOG Model Version" project_version_number = 1 return(project_version_number)endMacro
//DBox: FPA ver11DBox "SLOCOG Model" right, center toolbox NoKeyboard title: "SLOCOG Travel Demand Model"
init do Shared project_dbox, scenario_dbox, RetScenArr, ui_file, scen_data_dir, project_name
if project_dbox then do ShowMessage("Another project is currently running.") return() end
{mod_file, ui_file, scenario_file, scen_data_dir} = RunMacro("TCP Get Project Files", "SLOCOG_2004.ini", &errMsg) if mod_file = null then do ShowMessage(errMsg) return() end
project_name = "SLOCOG Model" {MacroInfo, Args, Opts, VarInfo} = RunMacro("TCP Read Planning Model", mod_file, scen_data_dir) {StepMacro, StepTitle, StepFlag} = MacroInfo StageName = Args[1] stages = StageName.length single_stage = 1
RunMacro("TCP Run All Steps", &do_all_steps, &StepFlag) if !RunMacro("TCP Update Scenarios in Project Dbox", scenario_file, &ScenArr, &ScenSel, &ScenNames, stages, 0, Args) then return() enditem
update do if project_dbox = -99 then runmacro("closing") else RunMacro("TCP Update Scenarios in Project Dbox", scenario_file, &ScenArr, &ScenSel, &ScenNames, stages, 1, Args) endItem
close do Runmacro("closing") endItem
button 0,0 icons: "bmp\\pasorobles.bmp", "bmp\\pasorobles.bmp"
frame 0.5, 6, 34.5, 7.4 prompt: "Scenarios" Scroll List 1.5, 7.0, 32.0, 3.5 multiple list: ScenNames variable: ScenSel do RunMacro("TCP Save Scenario File", ScenArr, ScenSel, scenario_file) endItem
checkbox "stops" 2, 10.8, 15 variable: single_stage prompt: "Stop after stage" checkbox "all steps" Same, 12.0, 10 variable: do_all_steps prompt: "Run all steps" do RunMacro("TCP Run All Steps", &do_all_steps, &StepFlag) endItem button 20, 11.0, 13, 2.0 prompt: "Setup" do RunDbox("TCP Scenario dBox", scenario_file, scen_data_dir, project_name, Args) enditem
button 1, 14 icons: "bmp\\dr_tgen.bmp", "bmp\\dr_tgen.bmp" do cur_stage = 1 Runmacro("set steps") enditem button "slocog1" After, Same, 20, 2 disabled prompt:StageName[1] docur_stage = 1 Runmacro("run stages") enditem
button 1, After icons: "bmp\\dr_skim.bmp", "bmp\\dr_skim.bmp" do cur_stage = 2 Runmacro("set steps") enditem button "slocog2" After, Same, 20, 2 disabled prompt:StageName[2] docur_stage = 2 Runmacro("run stages") enditem
button 1, After icons: "bmp\\dr_dist.bmp", "bmp\\dr_dist.bmp" do cur_stage = 3 Runmacro("set steps") enditem button "slocog3" After, Same, 20, 2 disabled prompt:StageName[3] docur_stage = 3 Runmacro("run stages") enditem
button 1, After icons: "bmp\\dr_assn.bmp", "bmp\\dr_assn.bmp" do cur_stage = 4 Runmacro("set steps") enditem button "slocog4" After, Same, 20, 2 disabled prompt:StageName[4] docur_stage = 4 Runmacro("run stages") enditem
button 1, After icons: "bmp\\dr_feed.bmp", "bmp\\dr_feed.bmp" do cur_stage = 5 Runmacro("set steps") enditem button "slocog5" After, Same, 20, 2 disabled prompt:StageName[5] docur_stage = 5 Runmacro("run stages") enditem
button 1, After icons: "bmp\\dr_assn.bmp", "bmp\\dr_assn.bmp" do cur_stage = 6 Runmacro("set steps") enditem button "slocog6" After, Same, 20, 2 disabled prompt:StageName[6] docur_stage = 6 Runmacro("run stages") enditem
button 1, After icons: "bmp\\dr_map.bmp", "bmp\\dr_map.bmp" do cur_stage = 7 Runmacro("set steps") enditem button "slocog7" After, Same, 20, 2 disabled prompt:StageName[7] docur_stage = 7 Runmacro("run stages") enditem
button 1, after, 34, 2 prompt: "Quit" do Runmacro("closing") enditem
macro "set steps" do SetAlternateInterface() RunMacro("TCP Set Steps", StepTitle[cur_stage], &StepFlag[cur_stage])
do_all_steps = null RunMacro("TCP Run All Steps", &do_all_steps, &StepFlag) enditem
macro "run stages" do RunMacro("TCP Run Stages", cur_stage, single_stage, StepMacro, StepFlag, ScenArr, ScenSel, LocalArgs) endItem
macro "closing" do if RunMacro("TCP Close Project Dbox") = 1 then return() endItemEndDbox
//====== Trip Generation ======//
// Occupancy Rate LookupMacro "FPA ver31SL Occupancy Rate Lookup" (Args)
// Input Files demographic_table = Args.[Demographic Table]// demographic_dcb = Args.[Demographic DCB] occupancy_lookup = Args.[Occupancy Lookup] // Output Files occupied_demographic_tab = Args.[Occupied Demographic Table]// occupied_demographic_dcb = Args.[Occupied Demographic DCB]
// Keep The Original Demographics File as it is CopyFile(demographic_table, occupied_demographic_tab)
// // Duplicate the Demographics files including DCB file// CopyFile(demographic_dcb, occupied_demographic_dcb)
// Define View Names ftype_demo = RunMacro("G30 table type", occupied_demographic_tab) pth_demo = SplitPath(occupied_demographic_tab) vw_demo = OpenTable(pth_demo[3], ftype_demo, {occupied_demographic_tab})
// Define View Names ftype_occu_rate = RunMacro("G30 table type", occupancy_lookup) pth_occu_rate = SplitPath(occupancy_lookup) vw_occu_rate = OpenTable(pth_occu_rate[3], ftype_occu_rate, {occupancy_lookup})
// Define Fields in Demographics sfr = GetDataVector(vw_demo + "|", "SFR", ) mfr = GetDataVector(vw_demo + "|", "MFR", ) mh = GetDataVector(vw_demo + "|", "MH", )
// Define Fields in Occupancy Rates occu_sfd = GetDataVector(vw_occu_rate + "|", "SFD_OCC", ) occu_mfd = GetDataVector(vw_occu_rate + "|", "MFD_OCC", )
// Calculation (These are really Occupancy Rates, not Vacancy Rates) sfr = sfr * occu_sfd mfr = mfr * occu_mfd // mfd uses its own occupancy rate mh = mh * occu_sfd
SetDataVector(vw_demo + "|", "SFR", sfr,) SetDataVector(vw_demo + "|", "MFR", mfr,) SetDataVector(vw_demo + "|", "MH", mh,)
CloseView(vw_demo) CloseView(vw_occu_rate)
return(1) quit: return(0)endMacro
// Trip GenerationMacro "FPA ver32SL Trip Generation w 3D" (Args)
// Input Files occupied_demographic_tab = Args.[Occupied Demographic Table] cross_class_pa_table = Args.[Cross Class PA Table] d3_table = Args.[3D Table] // Output Files unbalanced_pa = Args.[Unbalanced PA] balanced_pa = Args.[Balanced PA]
// Define View Names vw_demo = RunMacro("TCU Get File Name", occupied_demographic_tab) vw_rate = RunMacro("TCU Get File Name", cross_class_pa_table) vw_pa_u = RunMacro("TCU Get File Name", unbalanced_pa) vw_pa_b = RunMacro("TCU Get File Name", balanced_pa)
// Pre-step 1: Prepare a long array fieldopt1 = {{"Unit Field1", vw_demo +".SFR"}, {"Unit Field2", vw_demo +".MFR"}, {"Unit Field3", vw_demo +".MH"}, {"Unit Field4", vw_demo +".RURAL"}, {"Unit Field5", vw_demo +".OFF_GEN"}, {"Unit Field6", vw_demo +".DWNTWN"}, {"Unit Field7", vw_demo +".RET_REG"}, {"Unit Field8", vw_demo +".RET_NEI"}, {"Unit Field9", vw_demo +".Church"}, {"Unit Field10", vw_demo +".GAS"}, {"Unit Field11", vw_demo +".ELEM"}, {"Unit Field12", vw_demo +".HIGHSCH"}, {"Unit Field13", vw_demo +".CAL_S"}, {"Unit Field14", vw_demo +".CAL_E"}, {"Unit Field15", vw_demo +".CUE_S"}, {"Unit Field16", vw_demo +".CUE_E"}, {"Unit Field17", vw_demo +".HOSPITL"}, {"Unit Field18", vw_demo +".IND_LIT"}, {"Unit Field19", vw_demo +".IND_HVY"}, {"Unit Field20", vw_demo +".MOTEL"}, {"Unit Field21", vw_demo +".REC"}, {"Unit Field22", vw_demo +".PQP_HI"}, {"Unit Field23", vw_demo +".PQP_LO"}, {"Unit Field24", vw_demo +".AGR"}, {"Unit Field25", vw_demo +".UNDEV"}, {"Unit Field26", vw_demo +".SPECIAL"}, {"Unit Field27", vw_demo +".Beach"}, {"Unit Field28", vw_demo +".LU_SPARE06"}, {"Unit Field29", vw_demo +".LU_SPARE05"}, {"Unit Field30", vw_demo +".LU_SPARE04"}, {"Unit Field31", vw_demo +".LU_SPARE03"}, {"Unit Field32", vw_demo +".LU_SPARE02"}, {"Unit Field33", vw_demo +".LU_Spare01"}, {"Purpose Field1", vw_rate +".R_HBW_P"}, {"Purpose Field2", vw_rate +".R_HBO_P"}, {"Purpose Field3", vw_rate +".R_NHB_P"}, {"Purpose Field4", vw_rate +".R_SCHOOL_P"}, {"Purpose Field5", vw_rate +".R_CALPOLY_P"}, {"Purpose Field6", vw_rate +".R_CUESTA_P"}, {"Purpose Field7", vw_rate +".R_REGIONAL_P"}, {"Purpose Field8", vw_rate +".R_MAGNET_P"}, {"Purpose Field9", vw_rate +".R_SP1_P"}, {"Purpose Field10", vw_rate +".R_HBW_A"}, {"Purpose Field11", vw_rate +".R_HBO_A"}, {"Purpose Field12", vw_rate +".R_NHB_A"}, {"Purpose Field13", vw_rate +".R_SCHOOL_A"}, {"Purpose Field14", vw_rate +".R_CALPOLY_A"}, {"Purpose Field15", vw_rate +".R_CUESTA_A"}, {"Purpose Field16", vw_rate +".R_REGIONAL_A"}, {"Purpose Field17", vw_rate +".R_MAGNET_A"}, {"Purpose Field18", vw_rate +".R_SP1_A"}, {"Purpose Field19", vw_rate +".R_HBW_IX_P"}, {"Purpose Field20", vw_rate +".R_HBO_IX_P"}, {"Purpose Field21", vw_rate +".R_NHB_IX_P"}, {"Purpose Field22", vw_rate +".R_SCHOOL_IX_P"}, {"Purpose Field23", vw_rate +".R_CALPOLY_IX_P"}, {"Purpose Field24", vw_rate +".R_CUESTA_IX_P"}, {"Purpose Field25", vw_rate +".R_REGIONAL_IX_P"}, {"Purpose Field26", vw_rate +".R_MAGNET_IX_P"},
{"Purpose Field27", vw_rate +".R_SP1_IX_P"}, {"Purpose Field28", vw_rate +".R_HBW_XI_A"}, {"Purpose Field29", vw_rate +".R_HBO_XI_A"}, {"Purpose Field30", vw_rate +".R_NHB_XI_A"}, {"Purpose Field31", vw_rate +".R_SCHOOL_XI_A"}, {"Purpose Field32", vw_rate +".R_CALPOLY_XI_A"}, {"Purpose Field33", vw_rate +".R_CUESTA_XI_A"}, {"Purpose Field34", vw_rate +".R_REGIONAL_XI_A"}, {"Purpose Field35", vw_rate +".R_MAGNET_XI_A"}, {"Purpose Field36", vw_rate +".R_SP1_XI_A"}}
fieldopt2 = {{"Unit Class Type11", "True"}, {"Unit Class Field11", vw_demo +".ATYPE"}, {"Unit Class Type12", "False"}, {"Unit Class Value12", 1}, {"Unit Class Type21", "True"}, {"Unit Class Field21", vw_demo +".ATYPE"}, {"Unit Class Type22", "False"}, {"Unit Class Value22", 2}, {"Unit Class Type31", "True"}, {"Unit Class Field31", vw_demo +".ATYPE"}, {"Unit Class Type32", "False"}, {"Unit Class Value32", 3}, {"Unit Class Type41", "True"}, {"Unit Class Field41", vw_demo +".ATYPE"}, {"Unit Class Type42", "False"}, {"Unit Class Value42", 4}, {"Unit Class Type51", "True"}, {"Unit Class Field51", vw_demo +".ATYPE"}, {"Unit Class Type52", "False"}, {"Unit Class Value52", 5}, {"Unit Class Type61", "True"}, {"Unit Class Field61", vw_demo +".ATYPE"}, {"Unit Class Type62", "False"}, {"Unit Class Value62", 6}, {"Unit Class Type71", "True"}, {"Unit Class Field71", vw_demo +".ATYPE"}, {"Unit Class Type72", "False"}, {"Unit Class Value72", 7}, {"Unit Class Type81", "True"}, {"Unit Class Field81", vw_demo +".ATYPE"}, {"Unit Class Type82", "False"}, {"Unit Class Value82", 8}, {"Unit Class Type91", "True"}, {"Unit Class Field91", vw_demo +".ATYPE"}, {"Unit Class Type92", "False"}, {"Unit Class Value92", 9}, {"Unit Class Type101", "True"}, {"Unit Class Field101", vw_demo +".ATYPE"}, {"Unit Class Type102", "False"}, {"Unit Class Value102", 10}, {"Unit Class Type111", "True"}, {"Unit Class Field111", vw_demo +".ATYPE"}, {"Unit Class Type112", "False"}, {"Unit Class Value112", 11}, {"Unit Class Type121", "True"}, {"Unit Class Field121", vw_demo +".ATYPE"}, {"Unit Class Type122", "False"}, {"Unit Class Value122", 12}, {"Unit Class Type131", "True"},
{"Unit Class Field131", vw_demo +".ATYPE"}, {"Unit Class Type132", "False"}, {"Unit Class Value132", 13}, {"Unit Class Type141", "True"}, {"Unit Class Field141", vw_demo +".ATYPE"}, {"Unit Class Type142", "False"}, {"Unit Class Value142", 14}, {"Unit Class Type151", "True"}, {"Unit Class Field151", vw_demo +".ATYPE"}, {"Unit Class Type152", "False"}, {"Unit Class Value152", 15}, {"Unit Class Type161", "True"}, {"Unit Class Field161", vw_demo +".ATYPE"}, {"Unit Class Type162", "False"}, {"Unit Class Value162", 16}, {"Unit Class Type171", "True"}, {"Unit Class Field171", vw_demo +".ATYPE"}, {"Unit Class Type172", "False"}, {"Unit Class Value172", 17}, {"Unit Class Type181", "True"}, {"Unit Class Field181", vw_demo +".ATYPE"}, {"Unit Class Type182", "False"}, {"Unit Class Value182", 18}}
fieldopt3 = {{"Unit Class Type191", "True"}, {"Unit Class Field191", vw_demo +".ATYPE"}, {"Unit Class Type192", "False"}, {"Unit Class Value192", 19}, {"Unit Class Type201", "True"}, {"Unit Class Field201", vw_demo +".ATYPE"}, {"Unit Class Type202", "False"}, {"Unit Class Value202", 20}, {"Unit Class Type211", "True"}, {"Unit Class Field211", vw_demo +".ATYPE"}, {"Unit Class Type212", "False"}, {"Unit Class Value212", 21}, {"Unit Class Type221", "True"}, {"Unit Class Field221", vw_demo +".ATYPE"}, {"Unit Class Type222", "False"}, {"Unit Class Value222", 22}, {"Unit Class Type231", "True"}, {"Unit Class Field231", vw_demo +".ATYPE"}, {"Unit Class Type232", "False"}, {"Unit Class Value232", 23}, {"Unit Class Type241", "True"}, {"Unit Class Field241", vw_demo +".ATYPE"}, {"Unit Class Type242", "False"}, {"Unit Class Value242", 24}, {"Unit Class Type251", "True"}, {"Unit Class Field251", vw_demo +".ATYPE"}, {"Unit Class Type252", "False"}, {"Unit Class Value252", 25}, {"Unit Class Type261", "True"}, {"Unit Class Field261", vw_demo +".ATYPE"}, {"Unit Class Type262", "False"}, {"Unit Class Value262", 26}, {"Unit Class Type271", "True"}, {"Unit Class Field271", vw_demo +".ATYPE"}, {"Unit Class Type272", "False"}, {"Unit Class Value272", 27},
{"Unit Class Type281", "True"}, {"Unit Class Field281", vw_demo +".ATYPE"}, {"Unit Class Type282", "False"}, {"Unit Class Value282", 28}, {"Unit Class Type291", "True"}, {"Unit Class Field291", vw_demo +".ATYPE"}, {"Unit Class Type292", "False"}, {"Unit Class Value292", 29}, {"Unit Class Type301", "True"}, {"Unit Class Field301", vw_demo +".ATYPE"}, {"Unit Class Type302", "False"}, {"Unit Class Value302", 30}, {"Unit Class Type311", "True"}, {"Unit Class Field311", vw_demo +".ATYPE"}, {"Unit Class Type312", "False"}, {"Unit Class Value312", 31}, {"Unit Class Type321", "True"}, {"Unit Class Field321", vw_demo +".ATYPE"}, {"Unit Class Type322", "False"}, {"Unit Class Value322", 32}, {"Unit Class Type331", "True"}, {"Unit Class Field331", vw_demo +".ATYPE"}, {"Unit Class Type332", "False"}, {"Unit Class Value332", 33}}
// Crosclas Opts = null Opts.Input.[Trip Rate Set] = {cross_class_pa_table, vw_rate} Opts.Input.[Zone View Set] = {occupied_demographic_tab, vw_demo} Opts.Input.[Output Field 1] = "HBW_P" Opts.Input.[Output Field 2] = "HBO_P" Opts.Input.[Output Field 3] = "NHB_P" Opts.Input.[Output Field 4] = "SCHOOL_P" Opts.Input.[Output Field 5] = "CALPOLY_P" Opts.Input.[Output Field 6] = "CUESTA_P" Opts.Input.[Output Field 7] = "REGIONAL_P" Opts.Input.[Output Field 8] = "MAGNET_P" Opts.Input.[Output Field 9] = "SP1_P" Opts.Input.[Output Field 10] = "HBW_A" Opts.Input.[Output Field 11] = "HBO_A" Opts.Input.[Output Field 12] = "NHB_A" Opts.Input.[Output Field 13] = "SCHOOL_A" Opts.Input.[Output Field 14] = "CALPOLY_A" Opts.Input.[Output Field 15] = "CUESTA_A" Opts.Input.[Output Field 16] = "REGIONAL_A" Opts.Input.[Output Field 17] = "MAGNET_A" Opts.Input.[Output Field 18] = "SP1_A" Opts.Input.[Output Field 19] = "HBW_IX_P" Opts.Input.[Output Field 20] = "HBO_IX_P" Opts.Input.[Output Field 21] = "NHB_IX_P" Opts.Input.[Output Field 22] = "SCHOOL_IX_P" Opts.Input.[Output Field 23] = "CALPOLY_IX_P" Opts.Input.[Output Field 24] = "CUESTA_IX_P" Opts.Input.[Output Field 25] = "REGIONAL_IX_P" Opts.Input.[Output Field 26] = "MAGNET_IX_P" Opts.Input.[Output Field 27] = "SP1_IX_P" Opts.Input.[Output Field 28] = "HBW_XI_A" Opts.Input.[Output Field 29] = "HBO_XI_A" Opts.Input.[Output Field 30] = "NHB_XI_A" Opts.Input.[Output Field 31] = "SCHOOL_XI_A"
Opts.Input.[Output Field 32] = "CALPOLY_XI_A" Opts.Input.[Output Field 33] = "CUESTA_XI_A" Opts.Input.[Output Field 34] = "REGIONAL_XI_A" Opts.Input.[Output Field 35] = "MAGNET_XI_A" Opts.Input.[Output Field 36] = "SP1_XI_A" Opts.Global.[Number Classifications] = 2 Opts.Global.[Number Purposes] = 36 Opts.Global.[Number Units] = 33 Opts.Global.[Urban Pop Option] = "No" Opts.Field = fieldopt1 + fieldopt2 + fieldopt3 Opts.Output.[Output Table] = unbalanced_pa
ret_value = RunMacro("TCB Run Procedure", 101, "Crosclas", Opts) if !ret_value then goto quit
// Fill HBW_P Opts = null Opts.Input.[Dataview Set] = {unbalanced_pa, vw_pa_u} Opts.Global.Fields = {"HBW_P"} Opts.Global.Method = "Formula" Opts.Global.Parameter = "IF HBW_P = null THEN 0 ELSE HBW_P" ret_value = RunMacro("TCB Run Operation", 102, "Fill Dataview", Opts) if !ret_value then goto quit
// Fill HBO_P Opts = null Opts.Input.[Dataview Set] = {unbalanced_pa, vw_pa_u} Opts.Global.Fields = {"HBO_P"} Opts.Global.Method = "Formula" Opts.Global.Parameter = "IF HBO_P = null THEN 0 ELSE HBO_P" ret_value = RunMacro("TCB Run Operation", 103, "Fill Dataview", Opts) if !ret_value then goto quit
// Fill NHB_P Opts = null Opts.Input.[Dataview Set] = {unbalanced_pa, vw_pa_u} Opts.Global.Fields = {"NHB_P"} Opts.Global.Method = "Formula" Opts.Global.Parameter = "IF NHB_P = null THEN 0 ELSE NHB_P" ret_value = RunMacro("TCB Run Operation", 104, "Fill Dataview", Opts) if !ret_value then goto quit
// Fill SCHOOL_P Opts = null Opts.Input.[Dataview Set] = {unbalanced_pa, vw_pa_u} Opts.Global.Fields = {"SCHOOL_P"} Opts.Global.Method = "Formula" Opts.Global.Parameter = "IF SCHOOL_P = null THEN 0 ELSE SCHOOL_P" ret_value = RunMacro("TCB Run Operation", 105, "Fill Dataview", Opts) if !ret_value then goto quit
// Fill CALPOLY_P Opts = null Opts.Input.[Dataview Set] = {unbalanced_pa, vw_pa_u} Opts.Global.Fields = {"CALPOLY_P"}
Opts.Global.Method = "Formula" Opts.Global.Parameter = "IF CALPOLY_P = null THEN 0 ELSE CALPOLY_P" ret_value = RunMacro("TCB Run Operation", 106, "Fill Dataview", Opts) if !ret_value then goto quit
// Fill CUESTA_P Opts = null Opts.Input.[Dataview Set] = {unbalanced_pa, vw_pa_u} Opts.Global.Fields = {"CUESTA_P"} Opts.Global.Method = "Formula" Opts.Global.Parameter = "IF CUESTA_P = null THEN 0 ELSE CUESTA_P" ret_value = RunMacro("TCB Run Operation", 107, "Fill Dataview", Opts) if !ret_value then goto quit
// Fill REGIONAL_P Opts = null Opts.Input.[Dataview Set] = {unbalanced_pa, vw_pa_u} Opts.Global.Fields = {"REGIONAL_P"} Opts.Global.Method = "Formula" Opts.Global.Parameter = "IF REGIONAL_P = null THEN 0 ELSE REGIONAL_P" ret_value = RunMacro("TCB Run Operation", 108, "Fill Dataview", Opts) if !ret_value then goto quit
// Fill MAGNET_P Opts = null Opts.Input.[Dataview Set] = {unbalanced_pa, vw_pa_u} Opts.Global.Fields = {"MAGNET_P"} Opts.Global.Method = "Formula" Opts.Global.Parameter = "IF MAGNET_P = null THEN 0 ELSE MAGNET_P" ret_value = RunMacro("TCB Run Operation", 109, "Fill Dataview", Opts) if !ret_value then goto quit
// Fill SP1_P Opts = null Opts.Input.[Dataview Set] = {unbalanced_pa, vw_pa_u} Opts.Global.Fields = {"SP1_P"} Opts.Global.Method = "Formula" Opts.Global.Parameter = "IF SP1_P = null THEN 0 ELSE SP1_P" ret_value = RunMacro("TCB Run Operation", 110, "Fill Dataview", Opts) if !ret_value then goto quit
// Fill HBW_A Opts = null Opts.Input.[Dataview Set] = {unbalanced_pa, vw_pa_u} Opts.Global.Fields = {"HBW_A"} Opts.Global.Method = "Formula" Opts.Global.Parameter = "IF HBW_A = null THEN 0 ELSE HBW_A" ret_value = RunMacro("TCB Run Operation", 111, "Fill Dataview", Opts) if !ret_value then goto quit
// Fill HBO_A Opts = null Opts.Input.[Dataview Set] = {unbalanced_pa, vw_pa_u} Opts.Global.Fields = {"HBO_A"} Opts.Global.Method = "Formula" Opts.Global.Parameter = "IF HBO_A = null THEN 0 ELSE HBO_A" ret_value = RunMacro("TCB Run Operation", 112, "Fill Dataview", Opts) if !ret_value then goto quit
// Fill NHB_A Opts = null Opts.Input.[Dataview Set] = {unbalanced_pa, vw_pa_u} Opts.Global.Fields = {"NHB_A"} Opts.Global.Method = "Formula" Opts.Global.Parameter = "IF NHB_A = null THEN 0 ELSE NHB_A" ret_value = RunMacro("TCB Run Operation", 113, "Fill Dataview", Opts) if !ret_value then goto quit
// Fill SCHOOL_A Opts = null Opts.Input.[Dataview Set] = {unbalanced_pa, vw_pa_u} Opts.Global.Fields = {"SCHOOL_A"} Opts.Global.Method = "Formula" Opts.Global.Parameter = "IF SCHOOL_A = null THEN 0 ELSE SCHOOL_A" ret_value = RunMacro("TCB Run Operation", 114, "Fill Dataview", Opts) if !ret_value then goto quit
// Fill CALPOLY_A Opts = null Opts.Input.[Dataview Set] = {unbalanced_pa, vw_pa_u} Opts.Global.Fields = {"CALPOLY_A"} Opts.Global.Method = "Formula" Opts.Global.Parameter = "IF CALPOLY_A = null THEN 0 ELSE CALPOLY_A" ret_value = RunMacro("TCB Run Operation", 115, "Fill Dataview", Opts) if !ret_value then goto quit
// Fill CUESTA_A Opts = null Opts.Input.[Dataview Set] = {unbalanced_pa, vw_pa_u} Opts.Global.Fields = {"CUESTA_A"} Opts.Global.Method = "Formula" Opts.Global.Parameter = "IF CUESTA_A = null THEN 0 ELSE CUESTA_A" ret_value = RunMacro("TCB Run Operation", 116, "Fill Dataview", Opts) if !ret_value then goto quit
// Fill REGIONAL_A Opts = null Opts.Input.[Dataview Set] = {unbalanced_pa, vw_pa_u} Opts.Global.Fields = {"REGIONAL_A"} Opts.Global.Method = "Formula" Opts.Global.Parameter = "IF REGIONAL_A = null THEN 0 ELSE REGIONAL_A"
ret_value = RunMacro("TCB Run Operation", 117, "Fill Dataview", Opts) if !ret_value then goto quit
// Fill MAGNET_A Opts = null Opts.Input.[Dataview Set] = {unbalanced_pa, vw_pa_u} Opts.Global.Fields = {"MAGNET_A"} Opts.Global.Method = "Formula" Opts.Global.Parameter = "IF MAGNET_A = null THEN 0 ELSE MAGNET_A" ret_value = RunMacro("TCB Run Operation", 118, "Fill Dataview", Opts) if !ret_value then goto quit
// Fill SP1_A Opts = null Opts.Input.[Dataview Set] = {unbalanced_pa, vw_pa_u} Opts.Global.Fields = {"SP1_A"} Opts.Global.Method = "Formula" Opts.Global.Parameter = "IF SP1_A = null THEN 0 ELSE SP1_A" ret_value = RunMacro("TCB Run Operation", 119, "Fill Dataview", Opts) if !ret_value then goto quit
// Fill HBW_IX_P Opts = null Opts.Input.[Dataview Set] = {unbalanced_pa, vw_pa_u} Opts.Global.Fields = {"HBW_IX_P"} Opts.Global.Method = "Formula" Opts.Global.Parameter = "IF HBW_IX_P = null THEN 0 ELSE HBW_IX_P" ret_value = RunMacro("TCB Run Operation", 120, "Fill Dataview", Opts) if !ret_value then goto quit
// Fill HBO_IX_P Opts = null Opts.Input.[Dataview Set] = {unbalanced_pa, vw_pa_u} Opts.Global.Fields = {"HBO_IX_P"} Opts.Global.Method = "Formula" Opts.Global.Parameter = "IF HBO_IX_P = null THEN 0 ELSE HBO_IX_P" ret_value = RunMacro("TCB Run Operation", 121, "Fill Dataview", Opts) if !ret_value then goto quit
// Fill NHB_IX_P Opts = null Opts.Input.[Dataview Set] = {unbalanced_pa, vw_pa_u} Opts.Global.Fields = {"NHB_IX_P"} Opts.Global.Method = "Formula" Opts.Global.Parameter = "IF NHB_IX_P = null THEN 0 ELSE NHB_IX_P" ret_value = RunMacro("TCB Run Operation", 122, "Fill Dataview", Opts) if !ret_value then goto quit
// Fill SCHOOL_IX_P Opts = null
Opts.Input.[Dataview Set] = {unbalanced_pa, vw_pa_u} Opts.Global.Fields = {"SCHOOL_IX_P"} Opts.Global.Method = "Formula" Opts.Global.Parameter = "IF SCHOOL_IX_P = null THEN 0 ELSE SCHOOL_IX_P" ret_value = RunMacro("TCB Run Operation", 123, "Fill Dataview", Opts) if !ret_value then goto quit
// Fill CALPOLY_IX_P Opts = null Opts.Input.[Dataview Set] = {unbalanced_pa, vw_pa_u} Opts.Global.Fields = {"CALPOLY_IX_P"} Opts.Global.Method = "Formula" Opts.Global.Parameter = "IF CALPOLY_IX_P = null THEN 0 ELSE CALPOLY_IX_P" ret_value = RunMacro("TCB Run Operation", 124, "Fill Dataview", Opts) if !ret_value then goto quit
// Fill CUESTA_IX_P Opts = null Opts.Input.[Dataview Set] = {unbalanced_pa, vw_pa_u} Opts.Global.Fields = {"CUESTA_IX_P"} Opts.Global.Method = "Formula" Opts.Global.Parameter = "IF CUESTA_IX_P = null THEN 0 ELSE CUESTA_IX_P" ret_value = RunMacro("TCB Run Operation", 125, "Fill Dataview", Opts) if !ret_value then goto quit
// Fill REGIONAL_IX_P Opts = null Opts.Input.[Dataview Set] = {unbalanced_pa, vw_pa_u} Opts.Global.Fields = {"REGIONAL_IX_P"} Opts.Global.Method = "Formula" Opts.Global.Parameter = "IF REGIONAL_IX_P = null THEN 0 ELSE REGIONAL_IX_P" ret_value = RunMacro("TCB Run Operation", 126, "Fill Dataview", Opts) if !ret_value then goto quit
// Fill MAGNET_IX_P Opts = null Opts.Input.[Dataview Set] = {unbalanced_pa, vw_pa_u} Opts.Global.Fields = {"MAGNET_IX_P"} Opts.Global.Method = "Formula" Opts.Global.Parameter = "IF MAGNET_IX_P = null THEN 0 ELSE MAGNET_IX_P" ret_value = RunMacro("TCB Run Operation", 127, "Fill Dataview", Opts) if !ret_value then goto quit
// Fill SP1_IX_P Opts = null Opts.Input.[Dataview Set] = {unbalanced_pa, vw_pa_u} Opts.Global.Fields = {"SP1_IX_P"} Opts.Global.Method = "Formula" Opts.Global.Parameter = "IF SP1_IX_P = null THEN 0 ELSE SP1_IX_P"
ret_value = RunMacro("TCB Run Operation", 128, "Fill Dataview", Opts) if !ret_value then goto quit
// Fill HBW_XI_A Opts = null Opts.Input.[Dataview Set] = {unbalanced_pa, vw_pa_u} Opts.Global.Fields = {"HBW_XI_A"} Opts.Global.Method = "Formula" Opts.Global.Parameter = "IF HBW_XI_A = null THEN 0 ELSE HBW_XI_A" ret_value = RunMacro("TCB Run Operation", 129, "Fill Dataview", Opts) if !ret_value then goto quit
// Fill HBO_XI_A Opts = null Opts.Input.[Dataview Set] = {unbalanced_pa, vw_pa_u} Opts.Global.Fields = {"HBO_XI_A"} Opts.Global.Method = "Formula" Opts.Global.Parameter = "IF HBO_XI_A = null THEN 0 ELSE HBO_XI_A" ret_value = RunMacro("TCB Run Operation", 130, "Fill Dataview", Opts) if !ret_value then goto quit
// Fill NHB_XI_A Opts = null Opts.Input.[Dataview Set] = {unbalanced_pa, vw_pa_u} Opts.Global.Fields = {"NHB_XI_A"} Opts.Global.Method = "Formula" Opts.Global.Parameter = "IF NHB_XI_A = null THEN 0 ELSE NHB_XI_A" ret_value = RunMacro("TCB Run Operation", 131, "Fill Dataview", Opts) if !ret_value then goto quit
// Fill SCHOOL_XI_A Opts = null Opts.Input.[Dataview Set] = {unbalanced_pa, vw_pa_u} Opts.Global.Fields = {"SCHOOL_XI_A"} Opts.Global.Method = "Formula" Opts.Global.Parameter = "IF SCHOOL_XI_A = null THEN 0 ELSE SCHOOL_XI_A" ret_value = RunMacro("TCB Run Operation", 132, "Fill Dataview", Opts) if !ret_value then goto quit
// Fill CALPOLY_XI_A Opts = null Opts.Input.[Dataview Set] = {unbalanced_pa, vw_pa_u} Opts.Global.Fields = {"CALPOLY_XI_A"} Opts.Global.Method = "Formula" Opts.Global.Parameter = "IF CALPOLY_XI_A = null THEN 0 ELSE CALPOLY_XI_A" ret_value = RunMacro("TCB Run Operation", 133, "Fill Dataview", Opts) if !ret_value then goto quit
// Fill CUESTA_XI_A
Opts = null Opts.Input.[Dataview Set] = {unbalanced_pa, vw_pa_u} Opts.Global.Fields = {"CUESTA_XI_A"} Opts.Global.Method = "Formula" Opts.Global.Parameter = "IF CUESTA_XI_A = null THEN 0 ELSE CUESTA_XI_A" ret_value = RunMacro("TCB Run Operation", 134, "Fill Dataview", Opts) if !ret_value then goto quit
// Fill REGIONAL_XI_A Opts = null Opts.Input.[Dataview Set] = {unbalanced_pa, vw_pa_u} Opts.Global.Fields = {"REGIONAL_XI_A"} Opts.Global.Method = "Formula" Opts.Global.Parameter = "IF REGIONAL_XI_A = null THEN 0 ELSE REGIONAL_XI_A" ret_value = RunMacro("TCB Run Operation", 135, "Fill Dataview", Opts) if !ret_value then goto quit
// Fill MAGNET_XI_A Opts = null Opts.Input.[Dataview Set] = {unbalanced_pa, vw_pa_u} Opts.Global.Fields = {"MAGNET_XI_A"} Opts.Global.Method = "Formula" Opts.Global.Parameter = "IF MAGNET_XI_A = null THEN 0 ELSE MAGNET_XI_A" ret_value = RunMacro("TCB Run Operation", 136, "Fill Dataview", Opts) if !ret_value then goto quit
// Fill SP1_XI_A Opts = null Opts.Input.[Dataview Set] = {unbalanced_pa, vw_pa_u} Opts.Global.Fields = {"SP1_XI_A"} Opts.Global.Method = "Formula" Opts.Global.Parameter = "IF SP1_XI_A = null THEN 0 ELSE SP1_XI_A" ret_value = RunMacro("TCB Run Operation", 137, "Fill Dataview", Opts) if !ret_value then goto quit
// Join (Occupied Demographics, Unbalanced PA) ftype_demo = RunMacro("G30 table type", occupied_demographic_tab) pth_demo = SplitPath(occupied_demographic_tab) vw_demo = OpenTable(pth_demo[3], ftype_demo, {occupied_demographic_tab})
ftype_pa_u = RunMacro("G30 table type", unbalanced_pa) pth_pa_u = SplitPath(unbalanced_pa) vw_pa_u = OpenTable(pth_pa_u[3], ftype_pa_u, {unbalanced_pa})
join_view_du = JoinViews(vw_demo + "+" + vw_pa_u, vw_demo + ".TAZ", vw_pa_u + ".ID",)
// Fill IX_P Opts = null Opts.Input.[Dataview Set] = {{occupied_demographic_tab, unbalanced_pa, "TAZ", "ID"}, join_view_du}
Opts.Global.Fields = {"IX_P"} Opts.Global.Method = "Formula" Opts.Global.Parameter = "HBW_IX_P+ HBO_IX_P+ NHB_IX_P+ SCHOOL_IX_P+ CALPOLY_IX_P+ CUESTA_IX_P+ REGIONAL_IX_P+ MAGNET_IX_P+ SP1_IX_P" ret_value = RunMacro("TCB Run Operation", 138, "Fill Dataview", Opts) if !ret_value then goto quit
// Fill XI_A Opts = null Opts.Input.[Dataview Set] = {{occupied_demographic_tab, unbalanced_pa, "TAZ", "ID"}, join_view_du} Opts.Global.Fields = {"XI_A"} Opts.Global.Method = "Formula" Opts.Global.Parameter = "HBW_XI_A+ HBO_XI_A+ NHB_XI_A+ SCHOOL_XI_A+ CALPOLY_XI_A+ CUESTA_XI_A+ REGIONAL_XI_A+ MAGNET_XI_A+ SP1_XI_A" ret_value = RunMacro("TCB Run Operation", 139, "Fill Dataview", Opts) if !ret_value then goto quit
//---------------------- Beginning of 3D Adjustment ---------------------- // 3D Version 2b
// Define View Names ftype_d3 = RunMacro("G30 table type", d3_table) pth_d3 = SplitPath(d3_table) vw_d3 = OpenTable(pth_d3[3], ftype_d3, {d3_table})
// Define View Names ftype_demo = RunMacro("G30 table type", occupied_demographic_tab) pth_demo = SplitPath(occupied_demographic_tab) vw_demo = OpenTable(pth_demo[3], ftype_demo, {occupied_demographic_tab})
// Define Fields in Demographics scen2_res_den = GetDataVector(vw_demo + "|", "Density_R", ) scen2_emp_den = GetDataVector(vw_demo + "|", "Density_E", ) scen2_job_mix = GetDataVector(vw_demo + "|", "Job_Mix", ) scen2_job_hhs = GetDataVector(vw_demo + "|", "Job_per_HH", ) scen2_ped_des = GetDataVector(vw_demo + "|", "Ped_Design", )
// Define Fields in 3D Table base_res_den = GetDataVector(vw_d3 + "|", "BC_Res_Den", ) base_emp_den = GetDataVector(vw_d3 + "|", "BC_Emp_Den", ) base_job_mix = GetDataVector(vw_d3 + "|", "BC_Job_Mix", ) base_job_hhs = GetDataVector(vw_d3 + "|", "BC_Job_HH", ) base_ped_des = GetDataVector(vw_d3 + "|", "BC_Ped_Des", )
diff_res_den = GetDataVector(vw_d3 + "|", "Diff_Res_Den", ) diff_emp_den = GetDataVector(vw_d3 + "|", "Diff_Emp_Den", ) diff_job_mix = GetDataVector(vw_d3 + "|", "Diff_Job_Mix", ) diff_job_hhs = GetDataVector(vw_d3 + "|", "Diff_Job_HH", ) diff_ped_des = GetDataVector(vw_d3 + "|", "Diff_Ped_Des", )
elas_hbw_res_den = GetDataVector(vw_d3 + "|", "Elas_HBW_Res_Den", ) elas_hbw_emp_den = GetDataVector(vw_d3 + "|", "Elas_HBW_Emp_Den", )
elas_hbw_job_mix = GetDataVector(vw_d3 + "|", "Elas_HBW_Job_Mix", ) elas_hbw_job_hhs = GetDataVector(vw_d3 + "|", "Elas_HBW_Job_HH", ) elas_hbw_ped_des = GetDataVector(vw_d3 + "|", "Elas_HBW_Ped_Des", )
elas_hbo_res_den = GetDataVector(vw_d3 + "|", "Elas_HBO_Res_Den", ) elas_hbo_emp_den = GetDataVector(vw_d3 + "|", "Elas_HBO_Emp_Den", ) elas_hbo_job_mix = GetDataVector(vw_d3 + "|", "Elas_HBO_Job_Mix", ) elas_hbo_job_hhs = GetDataVector(vw_d3 + "|", "Elas_HBO_Job_HH", ) elas_hbo_ped_des = GetDataVector(vw_d3 + "|", "Elas_HBO_Ped_Des", )
elas_nhb_res_den = GetDataVector(vw_d3 + "|", "Elas_NHB_Res_Den", ) elas_nhb_emp_den = GetDataVector(vw_d3 + "|", "Elas_NHB_Emp_Den", ) elas_nhb_job_mix = GetDataVector(vw_d3 + "|", "Elas_NHB_Job_Mix", ) elas_nhb_job_hhs = GetDataVector(vw_d3 + "|", "Elas_NHB_Job_HH", ) elas_nhb_ped_des = GetDataVector(vw_d3 + "|", "Elas_NHB_Ped_Des", )
adj_hbw_res_den = GetDataVector(vw_d3 + "|", "Adj_HBW_Res_Den", ) adj_hbw_emp_den = GetDataVector(vw_d3 + "|", "Adj_HBW_Emp_Den", ) adj_hbw_job_mix = GetDataVector(vw_d3 + "|", "Adj_HBW_Job_Mix", ) adj_hbw_job_hhs = GetDataVector(vw_d3 + "|", "Adj_HBW_Job_HH", ) adj_hbw_ped_des = GetDataVector(vw_d3 + "|", "Adj_HBW_Ped_Des", )
adj_hbo_res_den = GetDataVector(vw_d3 + "|", "Adj_HBO_Res_Den", ) adj_hbo_emp_den = GetDataVector(vw_d3 + "|", "Adj_HBO_Emp_Den", ) adj_hbo_job_mix = GetDataVector(vw_d3 + "|", "Adj_HBO_Job_Mix", ) adj_hbo_job_hhs = GetDataVector(vw_d3 + "|", "Adj_HBO_Job_HH", ) adj_hbo_ped_des = GetDataVector(vw_d3 + "|", "Adj_HBO_Ped_Des", )
adj_nhb_res_den = GetDataVector(vw_d3 + "|", "Adj_NHB_Res_Den", ) adj_nhb_emp_den = GetDataVector(vw_d3 + "|", "Adj_NHB_Emp_Den", ) adj_nhb_job_mix = GetDataVector(vw_d3 + "|", "Adj_NHB_Job_Mix", ) adj_nhb_job_hhs = GetDataVector(vw_d3 + "|", "Adj_NHB_Job_HH", ) adj_nhb_ped_des = GetDataVector(vw_d3 + "|", "Adj_NHB_Ped_Des", )
hbw_tmp = GetDataVector(vw_d3 + "|", "HBW_tmp", ) hbo_tmp = GetDataVector(vw_d3 + "|", "HBO_tmp", ) nhb_tmp = GetDataVector(vw_d3 + "|", "NHB_tmp", )
hbw = GetDataVector(vw_d3 + "|", "HBW", ) hbo = GetDataVector(vw_d3 + "|", "HBO", ) nhb = GetDataVector(vw_d3 + "|", "NHB", )
// Calculation base_res_den = (if base_res_den < 0.01 then 0.01 else base_res_den ) base_emp_den = (if base_emp_den < 0.01 then 0.01 else base_emp_den ) base_job_mix = (if base_job_mix < 0.01 then 0.01 else base_job_mix ) base_job_hhs = (if base_job_hhs < 0.01 then 0.01 else base_job_hhs ) base_ped_des = (if base_ped_des < 0.01 then 0.01 else base_ped_des )
// Demographics file takes care of too low values// scen2_res_den = (if scen2_res_den < 0.01 then 0.01 else scen2_res_den)// scen2_emp_den = (if scen2_emp_den < 0.01 then 0.01 else scen2_emp_den)// scen2_job_mix = (if scen2_job_mix < 0.01 then 0.01 else scen2
_job_mix)// scen2_job_hhs = (if scen2_job_hhs < 0.01 then 0.01 else scen2_job_hhs)// scen2_ped_des = (if scen2_ped_des < 0.01 then 0.01 else scen2_ped_des)
diff_res_den = (scen2_res_den / base_res_den) - 1 diff_emp_den = (scen2_emp_den / base_emp_den) - 1 diff_job_mix = (scen2_job_mix / base_job_mix) - 1 diff_job_hhs = (scen2_job_hhs / base_job_hhs) - 1 diff_ped_des = (scen2_ped_des / base_ped_des) - 1
adj_hbw_res_den = elas_hbw_res_den * diff_res_den adj_hbw_emp_den = elas_hbw_emp_den * diff_emp_den adj_hbw_job_mix = elas_hbw_job_mix * diff_job_mix adj_hbw_job_hhs = elas_hbw_job_hhs * diff_job_hhs adj_hbw_ped_des = elas_hbw_ped_des * diff_ped_des
adj_hbo_res_den = elas_hbo_res_den * diff_res_den adj_hbo_emp_den = elas_hbo_emp_den * diff_emp_den adj_hbo_job_mix = elas_hbo_job_mix * diff_job_mix adj_hbo_job_hhs = elas_hbo_job_hhs * diff_job_hhs adj_hbo_ped_des = elas_hbo_ped_des * diff_ped_des
adj_nhb_res_den = elas_nhb_res_den * diff_res_den adj_nhb_emp_den = elas_nhb_emp_den * diff_emp_den adj_nhb_job_mix = elas_nhb_job_mix * diff_job_mix adj_nhb_job_hhs = elas_nhb_job_hhs * diff_job_hhs adj_nhb_ped_des = elas_nhb_ped_des * diff_ped_des
hbw_tmp = (1 + adj_hbw_res_den)*(1 + adj_hbw_emp_den)*(1 + adj_hbw_job_mix)*(1 + adj_hbw_job_hhs)*(1 + adj_hbw_ped_des) hbo_tmp = (1 + adj_hbo_res_den)*(1 + adj_hbo_emp_den)*(1 + adj_hbo_job_mix)*(1 + adj_hbo_job_hhs)*(1 + adj_hbo_ped_des) nhb_tmp = (1 + adj_nhb_res_den)*(1 + adj_nhb_emp_den)*(1 + adj_nhb_job_mix)*(1 + adj_nhb_job_hhs)*(1 + adj_nhb_ped_des)
hbw = hbw_tmp hbo = hbo_tmp nhb = nhb_tmp
hbw = (if hbw < 0.75 then 0.75 else hbw) hbw = (if hbw > 1.25 then 1.25 else hbw)
hbo = (if hbo < 0.75 then 0.75 else hbo) hbo = (if hbo > 1.25 then 1.25 else hbo)
nhb = (if nhb < 0.75 then 0.75 else nhb) nhb = (if nhb > 1.25 then 1.25 else nhb)
SetDataVector(vw_d3 + "|", "Diff_Res_Den", diff_res_den,) SetDataVector(vw_d3 + "|", "Diff_Emp_Den", diff_emp_den,) SetDataVector(vw_d3 + "|", "Diff_Job_Mix", diff_job_mix,) SetDataVector(vw_d3 + "|", "Diff_Job_HH", diff_job_hhs,) SetDataVector(vw_d3 + "|", "Diff_Ped_Des", diff_ped_des,)
SetDataVector(vw_d3 + "|", "Adj_HBW_Res_Den", adj_hbw_res_den,) SetDataVector(vw_d3 + "|", "Adj_HBW_Emp_Den", adj_hbw_emp_den,) SetDataVector(vw_d3 + "|", "Adj_HBW_Job_Mix", adj_hbw_job_mix,) SetDataVector(vw_d3 + "|", "Adj_HBW_Job_HH", adj_hbw_job_hhs,)
SetDataVector(vw_d3 + "|", "Adj_HBW_Ped_Des", adj_hbw_ped_des,)
SetDataVector(vw_d3 + "|", "Adj_HBO_Res_Den", adj_hbo_res_den,) SetDataVector(vw_d3 + "|", "Adj_HBO_Emp_Den", adj_hbo_emp_den,) SetDataVector(vw_d3 + "|", "Adj_HBO_Job_Mix", adj_hbo_job_mix,) SetDataVector(vw_d3 + "|", "Adj_HBO_Job_HH", adj_hbo_job_hhs,) SetDataVector(vw_d3 + "|", "Adj_HBO_Ped_Des", adj_hbo_ped_des,)
SetDataVector(vw_d3 + "|", "Adj_NHB_Res_Den", adj_nhb_res_den,) SetDataVector(vw_d3 + "|", "Adj_NHB_Emp_Den", adj_nhb_emp_den,) SetDataVector(vw_d3 + "|", "Adj_NHB_Job_Mix", adj_nhb_job_mix,) SetDataVector(vw_d3 + "|", "Adj_NHB_Job_HH", adj_nhb_job_hhs,) SetDataVector(vw_d3 + "|", "Adj_NHB_Ped_Des", adj_nhb_ped_des,)
SetDataVector(vw_d3 + "|", "HBW_tmp", hbw_tmp,) SetDataVector(vw_d3 + "|", "HBO_tmp", hbo_tmp,) SetDataVector(vw_d3 + "|", "NHB_tmp", nhb_tmp,)
SetDataVector(vw_d3 + "|", "HBW", hbw,) SetDataVector(vw_d3 + "|", "HBO", hbo,) SetDataVector(vw_d3 + "|", "NHB", nhb,)
// Join (Unbalanced PA, SLOCOG 2004 3D) ftype_pa_u = RunMacro("G30 table type", unbalanced_pa) pth_pa_u = SplitPath(unbalanced_pa) vw_pa_u = OpenTable(pth_pa_u[3], ftype_pa_u, {unbalanced_pa})
ftype_d3 = RunMacro("G30 table type", d3_table) pth_d3 = SplitPath(d3_table) vw_d3 = OpenTable(pth_d3[3], ftype_d3, {d3_table})
join_view_u3 = JoinViews(vw_demo + "+" + vw_pa_u, vw_demo + ".TAZ", vw_pa_u + ".ID",)
// Adjust Unbalanced_PA.BIN with 3D adjustment factors // Fill HBW_P Opts = null Opts.Input.[Dataview Set] = {{unbalanced_pa, d3_table, "ID", "TAZ"},join_view_u3} Opts.Global.Fields = {"HBW_P"} Opts.Global.Method = "Formula" Opts.Global.Parameter = "HBW_P * HBW" ret_value = RunMacro("TCB Run Operation", 140, "Fill Dataview", Opts) if !ret_value then goto quit
// Fill HBO_P Opts = null Opts.Input.[Dataview Set] = {{unbalanced_pa, d3_table, "ID", "TAZ"},join_view_u3} Opts.Global.Fields = {"HBO_P"} Opts.Global.Method = "Formula" Opts.Global.Parameter = "HBO_P * HBO" ret_value = RunMacro("TCB Run Operation", 141, "Fill Dataview", Opts) if !ret_value then goto quit
// Fill NHB_P Opts = null Opts.Input.[Dataview Set] = {{unbalanced_pa, d3_table, "ID", "TAZ"},
join_view_u3} Opts.Global.Fields = {"NHB_P"} Opts.Global.Method = "Formula" Opts.Global.Parameter = "NHB_P * NHB" ret_value = RunMacro("TCB Run Operation", 142, "Fill Dataview", Opts) if !ret_value then goto quit
//---------------------- End of 3D Adjustment ----------------------
// Join (Occupied Demographics, Unbalanced PA) ftype_demo = RunMacro("G30 table type", occupied_demographic_tab) pth_demo = SplitPath(occupied_demographic_tab) vw_demo = OpenTable(pth_demo[3], ftype_demo, {occupied_demographic_tab})
ftype_pa_u = RunMacro("G30 table type", unbalanced_pa) pth_pa_u = SplitPath(unbalanced_pa) vw_pa_u = OpenTable(pth_pa_u[3], ftype_pa_u, {unbalanced_pa})
join_view_du = JoinViews(vw_demo + "+" + vw_pa_u, vw_demo + ".TAZ", vw_pa_u + ".ID",)
// Balance Opts = null Opts.Input.[Data Set] = {{occupied_demographic_tab, unbalanced_pa, "TAZ", "ID"}, join_view_du} Opts.Input.[Data View] = {{occupied_demographic_tab, unbalanced_pa, "TAZ", "ID"}, join_view_du} Opts.Input.[V1 Holding Sets] = {, , , , , , , , , , } Opts.Input.[V2 Holding Sets] = {, , , , , , , , , , } Opts.Field.[Vector 1] = {join_view_du + ".HBW_P",join_view_du + ".HBO_P", join_view_du + ".NHB_P",join_view_du + ".SCHOOL_P", join_view_du + ".CALPOLY_P",join_view_du + ".CUESTA_P", join_view_du + ".REGIONAL_P", join_view_du + ".MAGNET_P", join_view_du + ".SP1_P", join_view_du + ".IX_P",join_view_du + ".XI_P"} Opts.Field.[Vector 2] = {join_view_du + ".HBW_A",join_view_du + ".HBO_A", join_view_du + ".NHB_A",join_view_du + ".SCHOOL_A", join_view_du + ".CALPOLY_A",join_view_du + ".CUESTA_A", join_view_du + ".REGIONAL_A", join_view_du + ".MAGNET_A", join_view_du + ".SP1_A", join_view_du + ".IX_A",join_view_du + ".XI_A"} Opts.Global.Pairs = 11 Opts.Global.[Holding Method] = {1, 1, 2, 2, 2, 2, 1, 1, 1, 1, 2} Opts.Global.[Percent Weight] = {50, 50, 50, 50, 50, 50, 50, 50, 50, 50, 50} Opts.Global.[Sum Weight] = {100, 100, 100, 100, 100, 100, 100, 100, 100, 100, 100}
Opts.Global.[V1 Options] = {1, 1, 1, 1, 1, 1, 1, 1, 1, 1, 1} Opts.Global.[V2 Options] = {1, 1, 1, 1, 1, 1, 1, 1, 1, 1, 1} Opts.Global.[Store Type] = 1 Opts.Output.[Output Table] = balanced_pa ret_value = RunMacro("TCB Run Procedure", 143, "Balance", Opts) if !ret_value then goto quit
// Transfer NHB_A to NHB_P Opts = null Opts.Input.[Dataview Set] = {balanced_pa, vw_pa_b} Opts.Global.Fields = {"NHB_P"} Opts.Global.Method = "Formula" Opts.Global.Parameter = "NHB_A" ret_value = RunMacro("TCB Run Operation", 144, "Fill Dataview", Opts) if !ret_value then goto quit
return(1) quit: return(0)endMacro
//====== Master Network ======//
Macro "FPA ver20 Master Network" (Args)feedback_iteration = 1 // This will ensure to reset the feedback # to 1
// Input Files master_hwy = Args.[Master Highway DB] master_link = Args.[Master Link Setting] master_node = Args.[Master Node Setting]
// Output Files highway_db = Args.[Highway DB] link_setting = Args.[Link Setting] node_setting = Args.[Node Setting]
map = RunMacro("G30 new map", master_hwy, "False") layers = RunMacro("TCU get database line and node layers") node_lyr = layers[1] link_lyr = layers[2]
SetLayer(link_lyr) qry = "Select * where RTP_YEAR <= 2004 and (AB_LANE_04 > 0 or BA_LANE_04 > 0)" // For Year 2004 Network n = SelectByQuery("set", "Several", qry,)
flds = {link_lyr + ".NAME", link_lyr + ".FUNC_CLASS", link_lyr + ".LANE_CAPACITY", link_lyr + ".AB_LANE_04", link_lyr + ".BA_LANE_04", link_lyr + ".AB_SPEED", link_lyr + ".BA_SPEED", link_lyr + ".AB_TIME", link_lyr + ".BA_TIME", link_lyr + ".AB_CONG_TT", link_lyr + ".BA_CONG_TT", link_lyr + ".ALPHA",
link_lyr + ".BETA", link_lyr + ".FROM_ID", link_lyr + ".TO_ID", link_lyr + ".DAILY_CNT", link_lyr + ".RTP_Year", link_lyr + ".Comments"}
outflds = {"NAME", "FUNC_CLASS", "LANE_CAPACITY", "AB_LANE", "BA_LANE", "AB_SPEED", "BA_SPEED", "AB_TIME", "BA_TIME", "AB_CONG_TT", "BA_CONG_TT", "ALPHA", "BETA", "FROM_ID", "TO_ID", "DAILY_CNT", "RTP_Year", "Comments"}
nodeflds = {node_lyr + ".TAZ", node_lyr + ".Study_Intersection"}
Opts = null Opts.[Layer Name] = link_lyr Opts.[File Type] = "FFB" Opts.[Field Spec] = flds Opts.[Field Name] = outflds Opts.[Node Field Spec] = nodeflds Opts.[Node Name] = node_lyr
ExportGeography(link_lyr + "|set", highway_db, Opts)
RunMacro("Close All")
return(1) quit: return(0)endMacro
//====== Initialization ======//
Macro "FPA ver60SL Network Initialization" (Args)Shared feedback_iteration
// Input Files highway_db = Args.[Highway DB] turn_penalty = Args.[Turn Penalty] daily_flow_table = Args.[Daily Flow Table] // from 2nd iteration // Output Files highway_net = Args.[Highway Net]
map = RunMacro("G30 new map",highway_db, "False")
layers = RunMacro("TCU get database line and node layers") node_lyr = layers[1] link_lyr = layers[2]
// Fill AB_TIME & BA_TIME if feedback_iteration = 1 then do
// At 1st iteration, fill with free flow travel times Opts = null Opts.Input.[Dataview Set] = {highway_db + "|" + link_lyr, link_lyr} Opts.Global.Fields = {"AB_TIME"} Opts.Global.Method = "Formula" Opts.Global.Parameter = "Length/AB_SPEED*60" ret_value = RunMacro("TCB Run Operation", 201, "Fill Dataview", Opts) if !ret_value then goto quit
Opts = null Opts.Input.[Dataview Set] = {highway_db + "|" + link_lyr, link_lyr} Opts.Global.Fields = {"BA_TIME"} Opts.Global.Method = "Formula" Opts.Global.Parameter = "Length/BA_SPEED*60" ret_value = RunMacro("TCB Run Operation", 202, "Fill Dataview", Opts) if !ret_value then goto quit end
else do
// if feedback_iteration >= 2, fill with congested travel times Opts = null Opts.Input.[Dataview Set] = {{highway_db + "|" + link_lyr, daily_flow_table, "ID", "ID1"}, link_lyr + "+Volumes_Daily"} Opts.Global.Fields = {link_lyr + ".AB_Cong_TT"} Opts.Global.Method = "Formula" Opts.Global.Parameter = "Volumes_Daily.AB_Time" ret_value = RunMacro("TCB Run Operation", 203, "Fill Dataview", Opts) if !ret_value then goto quit
Opts = null Opts.Input.[Dataview Set] = {{highway_db + "|" + link_lyr, daily_flow_table, "ID", "ID1"}, link_lyr + "+Volumes_Daily"} Opts.Global.Fields = {link_lyr + ".BA_Cong_TT"} Opts.Global.Method = "Formula" Opts.Global.Parameter = "Volumes_Daily.BA_Time" ret_value = RunMacro("TCB Run Operation", 204, "Fill Dataview", Opts) if !ret_value then goto quit
end // for if feedback_iteration >= 2

// Create Capacity Fields Opts = null Opts.Input.[View Set] = {highway_db + "|" + link_lyr, link_lyr} Opts.Global.[Field Name] = "AB_HOURLY_CAPACITY" Opts.Global.[Formula Text] = "LANE_CAPACITY * AB_LANE" Opts.Global.[Field Type] = "Integer" ret_value = RunMacro("TCB Run Operation", 205, "Formula Field", Opts) if !ret_value then goto quit
Opts = null Opts.Input.[View Set] = {highway_db + "|" + link_lyr, link_lyr} Opts.Global.[Field Name] = "BA_HOURLY_CAPACITY" Opts.Global.[Formula Text] = "LANE_CAPACITY * BA_LANE" Opts.Global.[Field Type] = "Integer" ret_value = RunMacro("TCB Run Operation", 206, "Formula Field", Opts) if !ret_value then goto quit
Opts = null Opts.Input.[View Set] = {highway_db + "|" + link_lyr, link_lyr} Opts.Global.[Field Name] = "AB_DAILY_CAPACITY" Opts.Global.[Formula Text] = "LANE_CAPACITY * AB_LANE * 12.5" Opts.Global.[Field Type] = "Integer" ret_value = RunMacro("TCB Run Operation", 207, "Formula Field", Opts) if !ret_value then goto quit
Opts = null Opts.Input.[View Set] = {highway_db + "|" + link_lyr, link_lyr} Opts.Global.[Field Name] = "BA_DAILY_CAPACITY" Opts.Global.[Formula Text] = "LANE_CAPACITY * BA_LANE * 12.5" Opts.Global.[Field Type] = "Integer" ret_value = RunMacro("TCB Run Operation", 208, "Formula Field", Opts) if !ret_value then goto quit
SetLayer(link_lyr) Opts = {{"Turn Penalties", "Yes"}} netflds = {{"Length", link_lyr+".Length"}, {"*_Time", link_lyr+".AB_Time", link_lyr + ".BA_Time"}, {"*_Cong_TT", link_lyr+".AB_Cong_TT", link_lyr + ".BA_Cong_TT"},
{"*_Hourly_Capacity", link_lyr+".AB_Hourly_Capacity", link_lyr+".BA_Hourly_Capacity"}, {"*_Daily_Capacity", link_lyr+".AB_Daily_Capacity", link_lyr+".BA_Daily_Capacity"},
{"ALPHA", link_lyr+".Alpha"}, {"BETA", link_lyr+".Beta"}}
net = CreateNetwork(, highway_net,, netflds,, Opts) ActiveNetwork = net RunMacro("G30 setup tc defaults")
ftype = RunMacro("G30 table type", turn_penalty) tpen = OpenTable("Specific", ftype, {turn_penalty}) Flds = GetFields(tpen, "All") TpOpts = {{"Global Penalties", {{"Left", 0}, {"Right", 0}, {"Straight", 0}, {"Uturn", 1}}},
{"Specific Penalties", {tpen, Flds[1][1], Flds[1][2], ,Flds[1][3]}}} LoadNetworkMovementTable(net, TpOpts) f_type = RunMacro("G30 table type", turn_penalty) f_name = RunMacro("TCU Get File Name", turn_penalty)
SetLayer(node_lyr) setname = "Centroids" qry = "Select * where TAZ <> null" n = SelectByQuery(setname, "Several", qry,) SetCursor("Hourglass") idxSet = node_lyr + "|" + setname Opts = {{"Use Centroids", "True"},
{"Centroids Set", idxSet}, {"Use Turn Penalties", "True"}} ChangeNetworkSettings(net, Opts)
SetNetworkInformationItem(net, "Global Turn Penalties", {0, 0, 0, 1}) SetNetworkInformationItem(net, "Default Turn Penalties", {, "None"}) SetNetworkInformationItem(net, "Specific Turn Penalties", {turn_penalty, f_name})
return(1) quit: return(0)endMacro
//====== Network Skimming ======//
// Compute Highway Skim MatrixMacro "FPA ver60 Network Skimming" (Args)Shared feedback_iteration
// Input Files highway_db = Args.[Highway DB] highway_net = Args.[Highway Net] terminal_times_matrix = Args.[Terminal Times Matrix] // Output Files skim_matrix = Args.[Skim Matrix]
RunMacro("TCB Add DB Layers", highway_db,,) Lyrs = RunMacro("TCB get DB line and node layers", highway_db) node_lyr = Lyrs[1] link_lyr = Lyrs[2] db_nodelyr = highway_db + "|" + node_lyr db_linklyr = highway_db + "|" + link_lyr
if feedback_iteration = 1 then do skim_field = "*_Time" CoreLabel = "Shortest Path - *_Time" end else do skim_field = "*_Cong_TT" CoreLabel = "Shortest Path - *_Cong_TT" end // for if feedback_iteration = 1
// TCSPMAT (Create Initial Skim Matrix)
Opts = null Opts.Input.Network = highway_net Opts.Input.[Origin Set] = {db_nodelyr, node_lyr, "Centroids", "Select * where TAZ <> null"} Opts.Input.[Destination Set] = {db_nodelyr, node_lyr, "Centroids"} Opts.Input.[Via Set] = {db_nodelyr, node_lyr} Opts.Field.Minimize = skim_field Opts.Field.Nodes = node_lyr+".ID" Opts.Output.[Output Matrix].Label = "Shortest Path" Opts.Output.[Output Matrix].Compression = 1 Opts.Output.[Output Matrix].[File Name] = skim_matrix
ret_value = RunMacro("TCB Run Procedure", 209, "TCSPMAT", Opts) if !ret_value then goto quit
// Intrazonal Opts = null Opts.Input.[Matrix Currency] = {skim_matrix, CoreLabel, "RCIndex", "RCIndex"} Opts.Global.Factor = 0.5 Opts.Global.Neighbors = 1 Opts.Global.Operation = 1 // default value Opts.Global.[Treat Missing] = 1 // default value
ret_value = RunMacro("TCB Run Procedure", 210, "Intrazonal", Opts) if !ret_value then goto quit
// Add Terminal Times Opts = null Opts.Input.[Matrix Currency] = {skim_matrix, CoreLabel, "RCIndex", "RCIndex"} Opts.Input.[Core Currencies] = {{skim_matrix, CoreLabel, "RCIndex", "RCIndex"}, {terminal_times_matrix, "Minutes", "RCIndex", "RCIndex"}} Opts.Global.Method = 7 Opts.Global.[Cell Range] = 2 Opts.Global.[Matrix K] = {1, 1} Opts.Global.[Force Missing] = "Yes"
ret_value = RunMacro("TCB Run Operation", 211, "Fill Matrices", Opts) if !ret_value then goto quit
return(1) quit: return(0)endMacro
//====== Trip Distribution ======//
// Trip DistributionMacro "FPA ver40SL Daily Trip Distribution" (Args)
// Input Files balanced_pa = Args.[Balanced PA] skim_matrix = Args.[Skim Matrix] friction_factors = Args.[Friction Factors]
through_trip_matrix = Args.[Through Trip Matrix] // Output Files pa_matrix = Args.[PA Matrix]
// Parameters gravity_model_iterations = r2i(Args.[Gravity Model Iterations])
// Define View/File Names vw_pa_b = RunMacro("TCU Get File Name", balanced_pa) ffct_vw = RunMacro("TCU Get File Name", friction_factors)
// Gravity Opts = null Opts.Input.[PA View Set] = {balanced_pa, vw_pa_b} Opts.Input.[FF Matrix Currencies] = {{skim_matrix, CoreLabel, "RCIndex", "RCIndex"}, {skim_matrix, CoreLabel, "RCIndex", "RCIndex"}, {skim_matrix, CoreLabel, "RCIndex", "RCIndex"}, {skim_matrix, CoreLabel, "RCIndex", "RCIndex"}, {skim_matrix, CoreLabel, "RCIndex", "RCIndex"}, {skim_matrix, CoreLabel, "RCIndex", "RCIndex"}, {skim_matrix, CoreLabel, "RCIndex", "RCIndex"}, {skim_matrix, CoreLabel, "RCIndex", "RCIndex"}, {skim_matrix, CoreLabel, "RCIndex", "RCIndex"}, {skim_matrix, CoreLabel, "RCIndex", "RCIndex"}, {skim_matrix, CoreLabel, "RCIndex", "RCIndex"}} Opts.Input.[Imp Matrix Currencies] = {{skim_matrix, CoreLabel, "RCIndex", "RCIndex"}, {skim_matrix, CoreLabel, "RCIndex", "RCIndex"}, {skim_matrix, CoreLabel, "RCIndex", "RCIndex"}, {skim_matrix, CoreLabel, "RCIndex", "RCIndex"}, {skim_matrix, CoreLabel, "RCIndex", "RCIndex"}, {skim_matrix, CoreLabel, "RCIndex", "RCIndex"}, {skim_matrix, CoreLabel, "RCIndex", "RCIndex"}, {skim_matrix, CoreLabel, "RCIndex", "RCIndex"}, {skim_matrix, CoreLabel, "RCIndex", "RCIndex"}, {skim_matrix, CoreLabel, "RCIndex", "RCIndex"}, {skim_matrix, CoreLabel, "RCIndex", "RCIndex"}} Opts.Input.[FF Tables] = {{friction_factors}, {friction_factors},
{friction_factors}, {friction_factors}, {friction_factors}, {friction_factors}, {friction_factors}, {friction_factors}, {friction_factors}, {friction_factors}, {friction_factors}} Opts.Input.[KF Matrix Currencies] = {{skim_matrix, CoreLabel, "RCIndex", "RCIndex"}, {skim_matrix, CoreLabel, "RCIndex", "RCIndex"}, {skim_matrix, CoreLabel, "RCIndex", "RCIndex"}, {skim_matrix, CoreLabel, "RCIndex", "RCIndex"}, {skim_matrix, CoreLabel, "RCIndex", "RCIndex"}, {skim_matrix, CoreLabel, "RCIndex", "RCIndex"}, {skim_matrix, CoreLabel, "RCIndex", "RCIndex"}, {skim_matrix, CoreLabel, "RCIndex", "RCIndex"}, {skim_matrix, CoreLabel, "RCIndex", "RCIndex"}, {skim_matrix, CoreLabel, "RCIndex", "RCIndex"}, {skim_matrix, CoreLabel, "RCIndex", "RCIndex"}} Opts.Field.[Prod Fields] = {vw_pa_b+".HBW_P",vw_pa_b+".HBO_P", vw_pa_b+".NHB_P",vw_pa_b+".SCHOOL_P", vw_pa_b+".CALPOLY_P",vw_pa_b+".CUESTA_P", vw_pa_b+".REGIONAL_P", vw_pa_b+".MAGNET_P", vw_pa_b+".SP1_P", vw_pa_b+".IX_P",vw_pa_b+".XI_P"} Opts.Field.[Attr Fields] = {vw_pa_b+".HBW_A",vw_pa_b+".HBO_A", vw_pa_b+".NHB_A",vw_pa_b+".SCHOOL_A", vw_pa_b+".CALPOLY_A",vw_pa_b+".CUESTA_A", vw_pa_b+".REGIONAL_A", vw_pa_b+".MAGNET_A", vw_pa_b+".SP1_A", vw_pa_b+".IX_A",vw_pa_b+".XI_A"} Opts.Field.[FF Table Fields] = {ffct_vw+".HBW",ffct_vw+".HBO", ffct_vw+".NHB",ffct_vw+".SCHOOL", ffct_vw+".CALPOLY",ffct_vw+".CUESTA", ffct_vw+".REGIONAL",
ffct_vw+".MAGNET", ffct_vw+".SP1", ffct_vw+".IX",ffct_vw+".XI"} Opts.Field.[FF Table Times] = {ffct_vw+".TIME",ffct_vw+".TIME", ffct_vw+".TIME",ffct_vw+".TIME", ffct_vw+".TIME",ffct_vw+".TIME", ffct_vw+".TIME",ffct_vw+".TIME", ffct_vw+".TIME", ffct_vw+".TIME",ffct_vw+".TIME"} Opts.Global.[Purpose Names] = {"HBW", "HBO", "NHB", "SCHOOL", "CALPOLY", "CUESTA", "REGIONAL", "MAGNET", "SP1", "IX", "XI"} Opts.Global.Iterations ={gravity_model_iterations, gravity_model_iterations,
gravity_model_iterations, gravity_model_iterations,
gravity_model_iterations, gravity_model_iterations,
gravity_model_iterations, gravity_model_iterations,
gravity_model_iterations,
gravity_model_iterations, gravity_model_iterations} Opts.Global.Convergence = {0.01, 0.01, 0.01, 0.01, 0.01, 0.01, 0.01, 0.01, 0.01, 0.01, 0.01} Opts.Global.[Constraint Type] = {"Double", "Double", "Double", "Double", "Double", "Double", "Double", "Double", "Double", "Double", "Double"} Opts.Global.[Fric Factor Type] = {"Table", "Table", "Table", "Table", "Table", "Table", "Table", "Table", "Table", "Table", "Table"} Opts.Global.[A List] = {1, 1, 1, 1, 1, 1, 1, 1, 1, 1, 1} Opts.Global.[B List] = {0.3, 0.3, 0.3, 0.3, 0.3,0.3, 0.3, 0.3, 0.3, 0.3, 0.3} Opts.Global.[C List] = {0.01, 0.01, 0.01, 0.01, 0.01, 0.01, 0.01, 0.01, 0.01, 0.01, 0.01} Opts.Flag.[Use K Factors] = {0, 0, 0, 0, 0, 0, 0, 0, 0, 0, 0} Opts.Output.[Output Matrix].Label = "PA" Opts.Output.[Output Matrix].Compression = 1 Opts.Output.[Output Matrix].[File Name] = pa_matrix
ret_value = RunMacro("TCB Run Procedure", 301, "Gravity", Opts) if !ret_value then goto quit
// Add Matrix Core
Opts = null Opts.Input.[Input Matrix] = pa_matrix Opts.Input.[New Core] = "EE"
ret_value = RunMacro("TCB Run Operation", 302, "Add Matrix Core", Opts) if !ret_value then goto quit
// Merge EE Matrix Opts = null Opts.Input.[Target Currency] = {pa_matrix, "EE", "Row ID's", "Col ID's"} Opts.Input.[Source Currencies] = {{through_trip_matrix, "FLOW", "FROM", "TO"}} Opts.Global.[Missing Option].[Force Missing] = "No"
ret_value = RunMacro("TCB Run Operation", 303, "Merge Matrices", Opts) if !ret_value then goto quit
return(1) quit: return(0)endMacro
// Daily PA to ODMacro "FPA ver40SL Daily PA to OD" (Args)
// Input Files pa_matrix = Args.[PA Matrix] // Output Files daily_od_matrix = Args.[Daily OD Matrix]
// PA2OD Opts = null Opts.Input.[PA Matrix Currency] = {pa_matrix, "HBW", "Row ID's", "Col ID's"} Opts.Field.[Matrix Cores] = {1, 2, 3, 4, 5, 6, 7, 8, 9, 10, 11, 12} Opts.Field.[Adjust Fields] = {, , , , , , , , , , , } Opts.Field.[Peak Hour Field] = {, , , , , , , , , , , } Opts.Global.[Method Type] = "PA to OD" Opts.Global.[Cache Size] = 500000 Opts.Global.[Average Occupancies] = {1.5, 1.5, 1.5, 1.5, 1.5, 1.5, 1.5, 1.5, 1.5, 1.5, 1.5, 1.5} Opts.Global.[Adjust Occupancies] = {"No", "No", "No", "No", "No", "No", "No", "No", "No", "No", "No", "No"} Opts.Global.[Peak Hour Factor] = {0, 0, 0, 0, 0, 0, 0, 0, 0, 0, 0, 0} Opts.Flag.[Separate Matrices] = "No" Opts.Flag.[Convert to Vehicles] = {"No", "No", "No", "No", "No", "No", "No", "No", "No", "No", "No", "No"} Opts.Flag.[Include PHF] = {"No", "No", "No", "No",
"No", "No", "No", "No", "No", "No", "No", "No"} Opts.Flag.[Adjust Peak Hour] = {"No", "No", "No", "No", "No", "No", "No", "No", "No", "No", "No", "No"} Opts.Output.[Output Matrix].Label = "OD_Daily" Opts.Output.[Output Matrix].Compression = 1 Opts.Output.[Output Matrix].[File Name] = daily_od_matrix
ret_value = RunMacro("TCB Run Procedure", 304, "PA2OD", Opts) if !ret_value then goto quit
// QuickSum Daily Trips Opts = null Opts.Input.[Input Currency] = {daily_od_matrix, "HBW (0-24)", "Rows", "Cols"}
ret_value = RunMacro("TCB Run Operation", 305, "Matrix QuickSum", Opts) if !ret_value then goto quit
return(1) quit: return(0)endMacro
//====== Assignment ======//
// Traffic Assignment (Daily)Macro "FPA ver31 Daily Road Assign" (Args)Shared feedback_iterationShared rmse
// Input Files highway_db = Args.[Highway DB] highway_net = Args.[Highway Net] daily_od_matrix = Args.[Daily OD Matrix]
// Output Files daily_flow_table = Args.[Daily Flow Table] daily_dbf = Args.[Daily Flow DBF]
// Parameters assignment_convergence = Args.[Assignment Convergence] assignment_iterations = r2i(Args.[Assignment Iterations])
map = RunMacro("G30 new map",highway_db, "False") layers = RunMacro("TCU get database line and node layers") node_lyr = layers[1] link_lyr = layers[2]
Opts = null Opts.Input.Database = highway_db Opts.Input.Network = highway_net Opts.Input.[OD Matrix Currency] = {daily_od_matrix, "QuickSum", "Rows", "Cols"} Opts.Field.[FF Time] = "*_Time"
Opts.Field.Capacity = "*_Daily_Capacity" Opts.Field.Alpha = "ALPHA" Opts.Field.Beta = "BETA" Opts.Field.Preload = "None" Opts.Global.[Load Method] = 5 Opts.Global.Convergence = assignment_convergence Opts.Global.Iterations = assignment_iterations Opts.Flag.[Do Critical] = 0 Opts.Output.[Flow Table] = daily_flow_table
ret_value = RunMacro("TCB Run Procedure", 401, "Assignment", Opts, &Ret) if !ret_value then goto quit
ftype_24flow = RunMacro("G30 table type", daily_flow_table) pth_dlytab = SplitPath(daily_flow_table) dailytab = OpenTable(pth_dlytab[3],ftype_24flow,{daily_flow_table}) ab = GetDataVector(dailytab + "|", "AB_FLOW", ) ba = GetDataVector(dailytab + "|", "BA_FLOW", ) tot = GetDataVector(dailytab + "|", "TOT_FLOW", ) ab = Round(ab, 0) ba = Round(ba, 0) tot = Round(tot, 0) SetDataVector(dailytab + "|", "AB_FLOW", ab,) SetDataVector(dailytab + "|", "BA_FLOW", ba,) SetDataVector(dailytab + "|", "TOT_FLOW", tot,) CloseView(dailytab)
ftype_24flow = RunMacro("G30 table type", daily_flow_table) pth_dlytab = SplitPath(daily_flow_table) dailytab = OpenTable(pth_dlytab[3],ftype_24flow,{daily_flow_table})
strct = GetTableStructure(dailytab) for i = 1 to strct.length do
strct[i] = strct[i] + {strct[i][1]} end new_struct = strct + { {"FROM_ID", "integer", 10, , "False",,,,,,, }, {"TO_ID", "integer", 10, , "False",,,,,,, } } ModifyTable(dailytab, new_struct)
// Join (Link Layer, Daily Flow Table) join_view_ld = JoinViews(link_lyr + "+" + dailytab, link_lyr + ".ID", dailytab + ".ID1",)
Opts = null Opts.Input.[Dataview Set] = {{highway_db + "|" + link_lyr, daily_flow_table, "ID", "ID1"}, join_view_ld} Opts.Global.Fields = {dailytab + ".FROM_ID"} Opts.Global.Method = "Formula" Opts.Global.Parameter = link_lyr + ".FROM_ID"
ret_value = RunMacro("TCB Run Operation", 402, "Fill Dataview", Opts) if !ret_value then goto quit
Opts = null Opts.Input.[Dataview Set] = {{highway_db + "|" + link_lyr, daily_flow_table, "ID", "ID1"}, join_view_ld} Opts.Global.Fields = {dailytab + ".TO_ID"} Opts.Global.Method = "Formula" Opts.Global.Parameter = link_lyr + ".TO_ID"
ret_value = RunMacro("TCB Run Operation", 403, "Fill Dataview", Opts) if !ret_value then goto quit
ftype_24flow = RunMacro("G30 table type", daily_flow_table) pth_dlytab = SplitPath(daily_flow_table) dailytab = OpenTable("Volumes_Daily",ftype_24flow,{daily_flow_table}) ExportView(dailytab + "|","dBASE",daily_dbf,,) CloseView(dailytab)
return(1) quit: return(0)endMacro
Macro "FPA ver50 Feedback Loop" (Args)Shared feedback_iterationShared rmse
// Parameters max_iter = Args.[Max Feedback Iteration]
//feedback_iteration = 2 // This sets the feedback # to 2 before the feedback loop (FOR statement)
FOR feedback_iteration = 2 to max_iter do
RunMacro("Close All") RunMacro("FPA ver60SL Network Initialization", Args) // Update Network with Congested Travel Time
RunMacro("Close All") RunMacro("FPA ver60 Network Skimming", Args) // Use Congested Travel Times for Skimming
RunMacro("Close All") RunMacro("FPA ver40SL Daily Trip Distribution", Args)
RunMacro("Close All") RunMacro("FPA ver40SL Daily PA to OD", Args)
RunMacro("Close All") RunMacro("FPA ver31 Daily Road Assign", Args) // Use Free-flow travel time for assignment
// // Check Convergence// if feedback_iteration > 1 then do
// if rmse < 200 then goto endloop// end//end // FOR feedback_iteration = 2 to max_iter do
feedback_iteration = null
endloop: return(1) quit: return(0)endMacro
// AM Peak PA to OD// Key Words Between AM and PM PA to OD// AM PM// am pm// 7-8 16-17// 7 16 // 601 603// 602 604Macro "FPA ver40SL AM Peak PA to OD" (Args)
// Input Files pa_matrix = Args.[PA Matrix] hourly_lookup_table = Args.[Hourly Lookup Table] // Output Files am_peak_hour_od_matrix = Args.[AM Peak Hour OD Matrix]
// Define File Name hour_vw = RunMacro("TCU Get File Name", hourly_lookup_table)
// PA2OD Opts = null Opts.Input.[PA Matrix Currency] = {pa_matrix, "HBW", "Row ID's", "Col ID's"} Opts.Input.[Lookup Set] = {hourly_lookup_table, hour_vw} Opts.Field.[Matrix Cores] = {1, 2, 3, 4, 5, 6, 7, 8, 9, 10, 11, 12} Opts.Field.[Adjust Fields] = {, , , , , , , , , , , } Opts.Field.[Peak Hour Field] = {, , , , , , , , , , , } Opts.Field.[Hourly AB Field] = {hour_vw+".DEP_HBW", hour_vw+".DEP_HBO", hour_vw+".DEP_NHB", hour_vw+".DEP_SCHOOL", hour_vw+".DEP_CALPOLY", hour_vw+".DEP_CUESTA", hour_vw+".DEP_REGIONAL", hour_vw+".DEP_MAGNET", hour_vw+".DEP_SP1", hour_vw+".DEP_IX",hour_vw+".DEP_XI", hour_vw+".DEP_XX"} Opts.Field.[Hourly BA Field] = {hour_vw+".RET_HBW", hour_vw+".RET_HBO", hour_vw+".RET_NHB", hour_vw+".RET_SCHOOL", hour_vw+".RET_CALPOLY",
hour_vw+".RET_CUESTA", hour_vw+".RET_REGIONAL", hour_vw+".RET_MAGNET", hour_vw+".RET_SP1", hour_vw+".RET_IX",hour_vw+".RET_XI", hour_vw+".RET_XX"} Opts.Global.[Method Type] = "PA to OD" Opts.Global.[Start Hour] = 7 Opts.Global.[End Hour] = 7 Opts.Global.[Cache Size] = 500000 Opts.Global.[Average Occupancies] = {1.5, 1.5, 1.5, 1.5, 1.5, 1.5, 1.5, 1.5, 1.5, 1.5, 1.5, 1.5} Opts.Global.[Adjust Occupancies] = {"No", "No", "No", "No", "No", "No", "No", "No", "No", "No", "No", "No"} Opts.Global.[Peak Hour Factor] = {0, 0, 0, 0, 0, 0, 0, 0, 0, 0, 0, 0} Opts.Flag.[Separate Matrices] = "Yes" Opts.Flag.[Convert to Vehicles] = {"No", "No", "No", "No", "No", "No", "No", "No", "No", "No", "No", "No"} Opts.Flag.[Include PHF] = {"No", "No", "No", "No", "No", "No", "No", "No", "No", "No", "No", "No"} Opts.Flag.[Adjust Peak Hour] = {"No", "No", "No", "No", "No", "No", "No", "No", "No", "No", "No", "No"} Opts.Output.[Output Matrix].Label = "OD_AM" Opts.Output.[Output Matrix].Compression = 1 Opts.Output.[Output Matrix].[File Name] = am_peak_hour_od_matrix
ret_value = RunMacro("TCB Run Procedure", 601, "PA2OD", Opts) if !ret_value then goto quit
// QuickSum AM Peak Trips Opts = null Opts.Input.[Input Currency] = {am_peak_hour_od_matrix, "HBW (7-8)", "Rows", "Cols"}
ret_value = RunMacro("TCB Run Operation", 602, "Matrix QuickSum", Opts) if !ret_value then goto quit
return(1) quit: return(0)endMacro
// PM Peak PA to OD// Key Words Between AM and PM PA to OD// AM PM// am pm
// 7-8 16-17// 7 16// 601 603// 602 604Macro "FPA ver40SL PM Peak PA to OD" (Args)
// Input Files pa_matrix = Args.[PA Matrix] hourly_lookup_table = Args.[Hourly Lookup Table] // Output Files pm_peak_hour_od_matrix = Args.[PM Peak Hour OD Matrix]
// Define File Name hour_vw = RunMacro("TCU Get File Name", hourly_lookup_table)
// PA2OD Opts = null Opts.Input.[PA Matrix Currency] = {pa_matrix, "HBW", "Row ID's", "Col ID's"} Opts.Input.[Lookup Set] = {hourly_lookup_table, hour_vw} Opts.Field.[Matrix Cores] = {1, 2, 3, 4, 5, 6, 7, 8, 9, 10, 11, 12} Opts.Field.[Adjust Fields] = {, , , , , , , , , , , } Opts.Field.[Peak Hour Field] = {, , , , , , , , , , , } Opts.Field.[Hourly AB Field] = {hour_vw+".DEP_HBW", hour_vw+".DEP_HBO", hour_vw+".DEP_NHB", hour_vw+".DEP_SCHOOL", hour_vw+".DEP_CALPOLY", hour_vw+".DEP_CUESTA", hour_vw+".DEP_REGIONAL", hour_vw+".DEP_MAGNET", hour_vw+".DEP_SP1", hour_vw+".DEP_IX",hour_vw+".DEP_XI", hour_vw+".DEP_XX"} Opts.Field.[Hourly BA Field] = {hour_vw+".RET_HBW", hour_vw+".RET_HBO", hour_vw+".RET_NHB", hour_vw+".RET_SCHOOL", hour_vw+".RET_CALPOLY", hour_vw+".RET_CUESTA", hour_vw+".RET_REGIONAL", hour_vw+".RET_MAGNET", hour_vw+".RET_SP1", hour_vw+".RET_IX",hour_vw+".RET_XI", hour_vw+".RET_XX"} Opts.Global.[Method Type] = "PA to OD" Opts.Global.[Start Hour] = 16 Opts.Global.[End Hour] = 16 Opts.Global.[Cache Size] = 500000 Opts.Global.[Average Occupancies] = {1.5, 1.5, 1.5, 1.5, 1.5, 1.5, 1.5, 1.5, 1.5, 1.5, 1.5, 1.5} Opts.Global.[Adjust Occupancies] = {"No", "No", "No", "No", "No", "No", "No", "No", "No", "No",
"No", "No"} Opts.Global.[Peak Hour Factor] = {0, 0, 0, 0, 0, 0, 0, 0, 0, 0, 0, 0} Opts.Flag.[Separate Matrices] = "Yes" Opts.Flag.[Convert to Vehicles] = {"No", "No", "No", "No", "No", "No", "No", "No", "No", "No", "No", "No"} Opts.Flag.[Include PHF] = {"No", "No", "No", "No", "No", "No", "No", "No", "No", "No", "No", "No"} Opts.Flag.[Adjust Peak Hour] = {"No", "No", "No", "No", "No", "No", "No", "No", "No", "No", "No", "No"} Opts.Output.[Output Matrix].Label = "OD_PM" Opts.Output.[Output Matrix].Compression = 1 Opts.Output.[Output Matrix].[File Name] = pm_peak_hour_od_matrix
ret_value = RunMacro("TCB Run Procedure", 603, "PA2OD", Opts) if !ret_value then goto quit
// QuickSum PM Peak Trips Opts = null Opts.Input.[Input Currency] = {pm_peak_hour_od_matrix, "HBW (16-17)", "Rows", "Cols"}
ret_value = RunMacro("TCB Run Operation", 604, "Matrix QuickSum", Opts) if !ret_value then goto quit
return(1) quit: return(0)endMacro
// Traffic Assignment (AM Peak)// Key Words Between AM and PM Assignments// AM PM// am pm// _la _lp // 605 608// 606 609// 607 610Macro "FPA ver31 AM Peak Hr Road Assign" (Args)Shared feedback_iteration
// Input Files highway_db = Args.[Highway DB] highway_net = Args.[Highway Net] am_peak_hour_od_matrix = Args.[AM Peak Hour OD Matrix]
// Output Files am_peak_flow_table = Args.[AM Peak Flow Table] amturn_tab = Args.[AM Turning Movement] am_dbf = Args.[AM Peak Flow DBF] amturn_dbf = Args.[AM Turning Movement DBF]
// Parameters assignment_convergence = Args.[Assignment Convergence] assignment_iterations = r2i(Args.[Assignment Iterations])
map = RunMacro("G30 new map",highway_db, "False") layers = RunMacro("TCU get database line and node layers") node_lyr = layers[1] link_lyr = layers[2]
qry = "Select * where Study_Intersection <> null" idxSet = highway_db + "|" + node_lyr
Opts = null Opts.Input.Database = highway_db Opts.Input.Network = highway_net Opts.Input.[OD Matrix Currency] = {am_peak_hour_od_matrix, "QuickSum", "Rows", "Cols"} Opts.Input.[Turning Movement Node Set] = {idxSet, node_lyr, "Study Intersection", qry} Opts.Field.[FF Time] = "*_Time" Opts.Field.Capacity = "*_Hourly_Capacity" Opts.Field.Alpha = "ALPHA" Opts.Field.Beta = "BETA" Opts.Field.Preload = "None" Opts.Global.[Load Method] = 5 Opts.Global.[Movement Set Name] = "Study Intersection" Opts.Global.Convergence = assignment_convergence Opts.Global.Iterations = assignment_iterations Opts.Flag.[Do Critical] = 0 Opts.Flag.[Do Turn Movement] = 1 Opts.Output.[Flow Table] = am_peak_flow_table Opts.Output.[Movement Table] = amturn_tab
ret_value = RunMacro("TCB Run Procedure", 605, "Assignment", Opts, &Ret) if !ret_value then goto quit
ftype_amflow = RunMacro("G30 table type", am_peak_flow_table) pth_amtab = SplitPath(am_peak_flow_table) amtab = OpenTable(pth_amtab[3],ftype_amflow,{am_peak_flow_table}) ab = GetDataVector(amtab + "|", "AB_FLOW", ) ba = GetDataVector(amtab + "|", "BA_FLOW", ) tot = GetDataVector(amtab + "|", "TOT_FLOW", ) ab = Round(ab, 0) ba = Round(ba, 0) tot = Round(tot, 0) SetDataVector(amtab + "|", "AB_FLOW", ab,) SetDataVector(amtab + "|", "BA_FLOW", ba,) SetDataVector(amtab + "|", "TOT_FLOW", tot,) CloseView(amtab)
ftype_amflow = RunMacro("G30 table type", am_peak_flow_table) pth_amtab = SplitPath(am_peak_flow_table) amtab = OpenTable(pth_amtab[3],ftype_amflow,{am_peak_flow_table})
strct = GetTableStructure(amtab) for i = 1 to strct.length do strct[i] = strct[i] + {strct[i][1]} end new_struct = strct + {
{"FROM_ID", "integer", 10, , "False",,,,,,, }, {"TO_ID", "integer", 10, , "False",,,,,,, } } ModifyTable(amtab, new_struct)
// Join (Link Layer, AM Flow Table) join_view_la = JoinViews(link_lyr + "+" + amtab, link_lyr + ".ID", amtab + ".ID1",)
Opts = null Opts.Input.[Dataview Set] = {{highway_db + "|" + link_lyr, am_peak_flow_table, "ID", "ID1"}, join_view_la} Opts.Global.Fields = {amtab + ".FROM_ID"} Opts.Global.Method = "Formula" Opts.Global.Parameter = link_lyr + ".FROM_ID"
ret_value = RunMacro("TCB Run Operation", 606, "Fill Dataview", Opts) if !ret_value then goto quit
Opts = null Opts.Input.[Dataview Set] = {{highway_db + "|" + link_lyr, am_peak_flow_table, "ID", "ID1"}, join_view_la} Opts.Global.Fields = {amtab + ".TO_ID"} Opts.Global.Method = "Formula" Opts.Global.Parameter = link_lyr + ".TO_ID"
ret_value = RunMacro("TCB Run Operation", 607, "Fill Dataview", Opts) if !ret_value then goto quit
ftype_amflow = RunMacro("G30 table type", am_peak_flow_table) pth_amtab = SplitPath(am_peak_flow_table) amtab = OpenTable(pth_amtab[3],ftype_amflow,{am_peak_flow_table}) ExportView(amtab + "|","dBASE",am_dbf,,) CloseView(amtab)
ftype_amturnflow = RunMacro("G30 table type", amturn_tab) pth_amturntab = SplitPath(amturn_tab) am_turn_tab = OpenTable(pth_amturntab[3],ftype_amturnflow,{amturn_tab}) vol = GetDataVector(am_turn_tab + "|", "VOLUME", ) vol = Round(vol, 0) SetDataVector(am_turn_tab + "|", "VOLUME", vol,) ExportView(am_turn_tab + "|","dBASE",amturn_dbf,,) CloseView(am_turn_tab)
return(1) quit: return(0)endMacro
// Traffic Assignment (PM Peak)
// Key Words Between AM and PM Assignments// AM PM// am pm// _la _lp // 605 608// 606 609// 607 610Macro "FPA ver31 PM Peak Hr Road Assign" (Args)Shared feedback_iteration
// Input Files highway_db = Args.[Highway DB] highway_net = Args.[Highway Net] pm_peak_hour_od_matrix = Args.[PM Peak Hour OD Matrix]
// Output Files pm_peak_flow_table = Args.[PM Peak Flow Table] pmturn_tab = Args.[PM Turning Movement] pm_dbf = Args.[PM Peak Flow DBF] pmturn_dbf = Args.[PM Turning Movement DBF]
// Parameters assignment_convergence = Args.[Assignment Convergence] assignment_iterations = r2i(Args.[Assignment Iterations])
map = RunMacro("G30 new map",highway_db, "False") layers = RunMacro("TCU get database line and node layers") node_lyr = layers[1] link_lyr = layers[2]
qry = "Select * where Study_Intersection <> null" idxSet = highway_db + "|" + node_lyr
Opts = null Opts.Input.Database = highway_db Opts.Input.Network = highway_net Opts.Input.[OD Matrix Currency] = {pm_peak_hour_od_matrix, "QuickSum", "Rows", "Cols"} Opts.Input.[Turning Movement Node Set] = {idxSet, node_lyr, "Study Intersection", qry} Opts.Field.[FF Time] = "*_Time" Opts.Field.Capacity = "*_Hourly_Capacity" Opts.Field.Alpha = "ALPHA" Opts.Field.Beta = "BETA" Opts.Field.Preload = "None" Opts.Global.[Load Method] = 5 Opts.Global.[Movement Set Name] = "Study Intersection" Opts.Global.Convergence = assignment_convergence Opts.Global.Iterations = assignment_iterations Opts.Flag.[Do Critical] = 0 Opts.Flag.[Do Turn Movement] = 1 Opts.Output.[Flow Table] = pm_peak_flow_table Opts.Output.[Movement Table] = pmturn_tab
ret_value = RunMacro("TCB Run Procedure", 608, "Assignment", Opts, &Ret) if !ret_value then goto quit
ftype_pmflow = RunMacro("G30 table type", pm_peak_flow_table) pth_pmtab = SplitPath(pm_peak_flow_table)
pmtab = OpenTable(pth_pmtab[3],ftype_pmflow,{pm_peak_flow_table}) ab = GetDataVector(pmtab + "|", "AB_FLOW", ) ba = GetDataVector(pmtab + "|", "BA_FLOW", ) tot = GetDataVector(pmtab + "|", "TOT_FLOW", ) ab = Round(ab, 0) ba = Round(ba, 0) tot = Round(tot, 0) SetDataVector(pmtab + "|", "AB_FLOW", ab,) SetDataVector(pmtab + "|", "BA_FLOW", ba,) SetDataVector(pmtab + "|", "TOT_FLOW", tot,) CloseView(pmtab)
ftype_pmflow = RunMacro("G30 table type", pm_peak_flow_table) pth_pmtab = SplitPath(pm_peak_flow_table) pmtab = OpenTable(pth_pmtab[3],ftype_pmflow,{pm_peak_flow_table})
strct = GetTableStructure(pmtab) for i = 1 to strct.length do strct[i] = strct[i] + {strct[i][1]} end new_struct = strct + { {"FROM_ID", "integer", 10, , "False",,,,,,, }, {"TO_ID", "integer", 10, , "False",,,,,,, } } ModifyTable(pmtab, new_struct)
// Join (Link Layer, PM Flow Table) join_view_lp = JoinViews(link_lyr + "+" + pmtab, link_lyr + ".ID", pmtab + ".ID1",)
Opts = null Opts.Input.[Dataview Set] = {{highway_db + "|" + link_lyr, pm_peak_flow_table, "ID", "ID1"}, join_view_lp} Opts.Global.Fields = {pmtab + ".FROM_ID"} Opts.Global.Method = "Formula" Opts.Global.Parameter = link_lyr + ".FROM_ID"
ret_value = RunMacro("TCB Run Operation", 609, "Fill Dataview", Opts) if !ret_value then goto quit
Opts = null Opts.Input.[Dataview Set] = {{highway_db + "|" + link_lyr, pm_peak_flow_table, "ID", "ID1"}, join_view_lp} Opts.Global.Fields = {pmtab + ".TO_ID"} Opts.Global.Method = "Formula" Opts.Global.Parameter = link_lyr + ".TO_ID"
ret_value = RunMacro("TCB Run Operation", 610, "Fill Dataview", Opts) if !ret_value then goto quit
ftype_pmflow = RunMacro("G30 table type", pm_peak_flow_table) pth_pmtab = SplitPath(pm_peak_flow_table)
pmtab = OpenTable(pth_pmtab[3],ftype_pmflow,{pm_peak_flow_table}) ExportView(pmtab + "|","dBASE",pm_dbf,,) CloseView(pmtab)
ftype_pmturnflow = RunMacro("G30 table type", pmturn_tab) pth_pmturntab = SplitPath(pmturn_tab) pm_turn_tab = OpenTable(pth_pmturntab[3],ftype_pmturnflow,{pmturn_tab}) vol = GetDataVector(pm_turn_tab + "|", "VOLUME", ) vol = Round(vol, 0) SetDataVector(pm_turn_tab + "|", "VOLUME", vol,) ExportView(pm_turn_tab + "|","dBASE",pmturn_dbf,,) CloseView(pm_turn_tab)
return(1) quit: return(0)endMacro
Macro "FPA ver12 Map VC Ratios" (Args)
shared d_map_options shared d_linestyles,d_fillstyles,d_colors
// Input Files highway_db = Args.[Highway DB] daily_flow_table = Args.[Daily Flow Table] taz_db = Args.[TAZ boundary]
labelopts = {} labelopts.Visibility = "True" labelopts.Priority = "-ID" labelopts.Font = "Arial|Bold|10" labelopts.Color = ColorRGB(65500,0,0) labelopts.Uniqueness = "Off" labelopts.[Set Priority] = 5 labelopts.Format = "*.##" labelopts.Rotation = "Off"
ftype_24flow = RunMacro("G30 table type", daily_flow_table) dailytab = OpenTable("Volumes_Daily",ftype_24flow,{daily_flow_table})
ret = runmacro ("create a map","Link Volumes and V/C Ratios",highway_db,"Off")
map2 = ret.map curr_layer = ret.[Link Layer] SetLayer(curr_layer)
joined = JoinViews(curr_layer+"+"+dailytab, "["+curr_layer+"].ID", "["+dailytab+"].ID1",) {flds,fldx} = GetFields(joined,"Numeric")
pos = ArrayPosition(flds,{"TOT_Flow"},) if pos > 0 then do scale_theme_name = CreateContinuousTheme("Link Volumes", {fldx[pos]}, {{"Minimum Value",0},{"Minimum Size",0}}) SetThemeOptions(scale_theme_name, {{"title", "Link Volumes"}})
ShowTheme(, scale_theme_name) end pos = ArrayPosition(flds,{"Max_voc"},) if pos > 0 then do theme_value_arr = { {0, "True",0.60,"False"}, {0.60,"True",0.89,"False"}, {0.89,"True",1.09,"False"}, {1.09,"True",1.29,"False"}, {1.29,"True",1000,"False"} }
opts.Statistics = "True" opts.Values = theme_value_arr
color_name = CreateTheme("V/C Ratios", fldx[pos], "Manual", 5, opts) if color_name <> null then do SetThemeOptions(color_name, {{"title", "V/C Ratios"}}) RunMacro("G30 Palette Manager", color_name, 0, input_clrs)
SetLineColor( color_name+"|2", d_colors[62]) SetLineColor( color_name+"|3", d_colors[60]) SetLineColor( color_name+"|4", d_colors[44]) SetLineColor( color_name+"|5", d_colors[7]) SetLineColor( color_name+"|6", d_colors[5])
ShowTheme(, color_name) end end
RunMacro("FPA create legend", "Theme")
return(1) quit: return(0)endMacro
Macro "Close All" maps = GetMaps() if maps <> null then do for i = 1 to maps[1].length do SetMapSaveFlag(maps[1][i],"False") end end RunMacro("G30 File Close All")endMacro
Macro "add annotation" (mapname,anno_txt) shared d_linestyles,d_fillstyles,d_colors
SetMap(mapname) scp = GetMapScope(mapname) corners = GetScopeCorners(scp) c = Coord((r2i(corners[2].Lon+corners[3].Lon)/2),corners[3].Lat)
window_spec = "Map|" + mapname
s_anno = AddAnnotation(window_spec, "Text", { {"Location", {c, "S"}}, {"Alignment","S"}, {"Anchor Point", c}, {"Font", "Arial|bold|14"}, {"Color", ColorRGB(0,0,0)}, {"Text", anno_txt} })
opts = {} opts.Text = anno_txt opts.Angle = 0 opts.Color = ColorRGB(0,0,0) opts.Font = "Arial|bold|14" opts.Alignment = "S" opts.[Anchor Point] = c opts.Location = {c,"S"} opts.Framed = "True" opts.[Frame Type] = "Rectangle" opts.[Frame Border Width] = 0 opts.[Frame Border Color] = ColorRGB(0,0,0) opts.[Frame Border Style] = d_linestyles[1] opts.[Frame Fill Style] = d_fillstyles[2] opts.[Frame Fill Color] = ColorRGB(65535,65535,65535)
SetAnnotation(window_spec,s_anno,opts)endMacro
Macro "create a map" (map_desc,layer_db,point_layer_display) shared d_map_options
layers = GetDBLayers(layer_db) db_info = GetDBInfo(layer_db)
map = CreateMap(map_desc, d_map_options+ {{"scope", db_info[1]}}) //+{{"Scale Change Macro","Move Annotation"}}+{{"Activate Macro","Move Annotation"}}) SetWindow("Map|" + map) SetMap(map)
for i = 1 to layers.length do newlayer = AddLayer(map,layers[i], layer_db,layers[i]) RunMacro("G30 new layer default settings", newlayer) if IsLayer(layers[i],{"Point"}) then do if point_layer_display = "Off" then SetLayerVisibility(layers[i], "Off") else SetDisplayStatus(layers[i]+"|", "Invisible")
node_layer = layers[i] end else link_layer = layers[i] end
scp = GetLayerScope(layers[1]) SetMapScope(map,scp)
runmacro("add annotation",map,map_desc) RunMacro("G30 update map toolbar")
ret = {} ret.map = map ret.[Node Layer] = node_layer ret.[Link Layer] = link_layer
return(ret)endMacro
Macro "FPA create legend" (typ,layer_name_arr)
shared d_leg_settings, d_thmleg_settings, d_colors, d_fillstyles
opt_names = {"Layers Label", "Background Color", "Background Style", "Border Color", "Border Width", "Border Style", "Layers label flag"} tmp = GetMapLayers(map_name, "All") lyrs = tmp[1]
leg_settings = CopyArray(d_leg_settings) leg_settings[3][1] = 1
thmleg_settings = CopyArray(d_thmleg_settings) thmleg_settings[3][1] = 1
m = GetMap() if m = null then Return()
on notfound do if typ = "Theme" then CreateLegend(m, thmleg_settings, {{"click macro","G30 edit the legend"}, {"Background Style", d_fillstyles[2]}, {"Background Color", d_colors[3]} }) else CreateLegend(m, leg_settings, {{"click macro","G30 edit the legend"}, {"Background Style", d_fillstyles[2]}, {"Background Color", d_colors[3]} })
list = null tmp = GetLegendOptions(m, {"Layers label"}) leg_opts = GetLegendOptions(m, opt_names) leg_settings = GetLegendSettings(m)
layers_label = tmp[1] if leg_opts[6] = "True" then list = list + {layers_label} else list = list + {""} for i = 1 to lyrs.length do list = list + {lyrs[i]} end
if layer_name_arr <> null then for kk = 1 to layer_name_arr.length do
for jj = 1 to list.length do if Upper(layer_name_arr[kk]) = "MAP LAYERS" then do leg_opts[6] = "False" // no layer label opts = null for i = 1 to opt_names.length do opts = opts + {{opt_names[i], leg_opts[i]}} end SetLegendOptions(m, opts) jj = list.length end else if Upper(list[jj]) = Upper( layer_name_arr[kk]) then do SetLegendDisplayStatus(list[jj] + "|", "False") jj = list.length end end end
Return() end
leg_settings = GetLegendSettings(m)
if typ = "Set" then leg_settings[2][4] = 1 if typ = "Theme" then leg_settings[2][5] = 1 leg_settings[1] = "Automatic" leg_settings[3][1] = 1 SetLegendSettings(,leg_settings)
endMacro
APPENDIX E: MODEL INPUT SUMMARIES
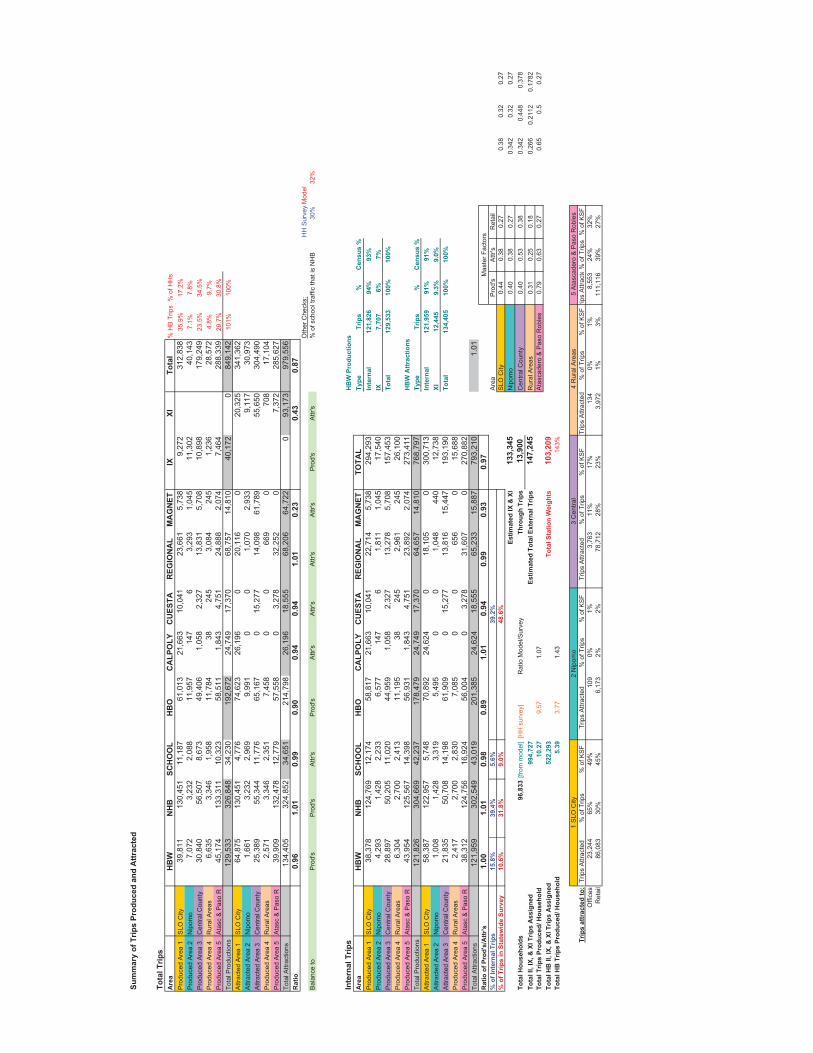
Sum
mar
y of
Trip
s Pr
oduc
ed a
nd A
ttrac
ted
Tota
l Trip
sA
rea
HB
WN
HB
SCH
OO
LH
BO
CA
LPO
LYC
UES
TAR
EGIO
NA
LM
AG
NET
IXXI
Tota
l%
HB
Trip
s%
of H
Hs
Pro
duce
d A
rea
1S
LO C
ity39
,811
130,
451
11,1
8761
,013
21,6
6310
,041
23,6
615,
738
9,27
231
2,83
835
.9%
17.2
%P
rodu
ced
Are
a 2
Nip
omo
7,07
23,
232
2,08
811
,957
147
63,
293
1,04
511
,302
40,1
437.
1%7.
8%P
rodu
ced
Are
a 3
Cen
tral C
ount
y30
,840
56,5
078,
673
49,4
061,
058
2,32
713
,831
5,70
810
,898
179,
249
23.5
%34
.5%
Pro
duce
d A
rea
4R
ural
Are
as6,
635
3,34
61,
958
11,7
8438
245
3,08
424
51,
236
28,5
724.
8%9.
7%P
rodu
ced
Are
a 5
Ata
sc &
Pas
o R
45,1
7413
3,31
110
,323
58,5
111,
843
4,75
124
,888
2,07
47,
464
288,
339
29.7
%30
.8%
Tota
l Pro
duct
ions
129,
533
326,
848
34,2
3019
2,67
224
,749
17,3
7068
,757
14,8
1040
,172
084
9,14
210
1%10
0%A
ttrac
ted
Are
a 1
SLO
City
64,8
7513
0,45
14,
776
74,6
2326
,196
020
,116
020
,325
341,
362
Attr
acte
d A
rea
2N
ipom
o1,
661
3,23
22,
969
9,99
10
01,
070
2,93
39,
117
30,9
73A
ttrac
ted
Are
a 3
Cen
tral C
ount
y25
,389
55,3
4411
,776
65,1
670
15,2
7714
,098
61,7
8955
,650
304,
490
Pro
duce
d A
rea
4R
ural
Are
as2,
571
3,34
62,
351
7,45
80
066
90
708
17,1
04P
rodu
ced
Are
a 5
Ata
sc &
Pas
o R
39,9
0913
2,47
812
,779
57,5
580
3,27
832
,252
07,
372
285,
627
Tota
l Attr
actio
ns13
4,40
532
4,85
234
,651
214,
798
26,1
9618
,555
68,2
0664
,722
093
,173
979,
556
Rat
io0.
961.
010.
990.
900.
940.
941.
010.
230.
430.
87O
ther
Che
cks:
HH
Sur
vey
Mod
elB
alan
ce to
Pro
d's
Pro
d's
Attr
'sP
rod'
sA
ttr's
Attr
'sA
ttr's
Attr
'sP
rod'
sA
ttr's
% o
f sch
ool t
raffi
c th
at is
NH
B30
%32
%
Inte
rnal
Trip
sH
BW
Pro
duct
ions
Are
aH
BW
NH
BSC
HO
OL
HB
OC
ALP
OLY
CU
ESTA
REG
ION
AL
MA
GN
ETTO
TAL
Type
Trip
s%
Cen
sus
%P
rodu
ced
Are
a 1
SLO
City
38,3
7812
4,76
912
,174
58,8
1721
,663
10,0
4122
,714
5,73
829
4,29
3In
tern
al12
1,82
694
%93
%P
rodu
ced
Are
a 2
Nip
omo
4,29
31,
428
2,23
36,
577
147
61,
811
1,04
517
,540
IX7,
707
6%7%
Pro
duce
d A
rea
3C
entra
l Cou
nty
28,8
9750
,205
11,0
2044
,959
1,05
82,
327
13,2
785,
708
157,
453
Tota
l12
9,53
310
0%10
0%P
rodu
ced
Are
a 4
Rur
al A
reas
6,30
42,
700
2,41
311
,195
3824
52,
961
245
26,1
00P
rodu
ced
Are
a 5
Ata
sc &
Pas
o R
43,9
5412
5,56
714
,398
56,9
311,
843
4,75
123
,892
2,07
427
3,41
1H
BW
Attr
actio
nsTo
tal P
rodu
ctio
ns12
1,82
630
4,66
942
,237
178,
479
24,7
4917
,370
64,6
5714
,810
768,
797
Type
Trip
s%
Cen
sus
%A
ttrac
ted
Are
a 1
SLO
City
58,3
8712
2,95
75,
748
70,8
9224
,624
018
,105
030
0,71
3In
tern
al12
1,95
991
%91
%A
ttrac
ted
Are
a 2
Nip
omo
1,00
81,
428
3,31
95,
495
00
1,04
844
012
,738
XI12
,445
9.3%
9.0%
Attr
acte
d A
rea
3C
entra
l Cou
nty
21,8
3550
,708
14,1
9861
,909
015
,277
13,8
1615
,447
193,
190
Tota
l13
4,40
510
0%10
0%P
rodu
ced
Are
a 4
Rur
al A
reas
2,41
72,
700
2,83
07,
085
00
656
015
,688
Pro
duce
d A
rea
5A
tasc
& P
aso
R38
,312
124,
756
16,9
2456
,004
03,
278
31,6
070
270,
882
Tota
l Attr
actio
ns12
1,95
930
2,54
943
,019
201,
385
24,6
2418
,555
65,2
3315
,887
793,
210
1.01
Rat
io o
f Pro
d's/
Attr
's1.
001.
010.
980.
891.
010.
940.
990.
930.
97%
of I
nter
nal T
rips
15.8
%39
.4%
5.6%
Are
a P
rod'
sA
ttr's
Ret
ail
% o
f Trip
s in
Sta
tew
ide
Surv
ey10
.6%
31.8
%9.
0%S
LO C
ity0.
440.
380.
270.
380.
320.
27Es
timat
ed IX
& X
I13
3,34
5N
ipom
o0.
400.
380.
270.
342
0.32
0.27
Tota
l Hou
seho
lds
96,8
33[fr
om m
odel
][H
H s
urve
y]R
atio
Mod
el/S
urve
yTh
roug
h Tr
ips
13,9
00
C
entra
l Cou
nty
0.40
0.53
0.38
0.34
20.
448
0.37
8To
tal I
I, IX
, & X
I Trip
s A
ssig
ned
994,
727
Estim
ated
Tot
al E
xter
nal T
rips
147,
245
Rur
al A
reas
0.31
0.25
0.18
0.26
60.
2112
0.17
82To
tal T
rips
Prod
uced
/ Hou
seho
ld10
.27
9.57
1.07
Ata
scad
ero
& P
aso
Rob
les
0.79
0.63
0.27
0.65
0.5
0.27
Tota
l HB
II, I
X, &
XI T
rips
Ass
igne
d52
2,29
3To
tal S
tatio
n W
eigh
ts10
3,20
9To
tal H
B T
rips
Prod
uced
/ Hou
seho
ld5.
393.
771.
4314
3%
Trip
s at
trac
ted
to:
Trip
s A
ttrac
ted
% o
f Trip
s%
of K
SF
Trip
s A
ttrac
ted
% o
f Trip
s%
of K
SF
Trip
s A
ttrac
ted
% o
f Trip
s%
of K
SF
Trip
s A
ttrac
ted
% o
f Trip
s%
of K
SF
rips
Attr
acte
% o
f Trip
s%
of K
SF
Offi
ces
23,2
4465
%49
%10
90%
1%3,
763
11%
17%
134
0%1%
8,55
324
%32
%R
etai
l86
,083
30%
45%
6,17
32%
2%78
,712
28%
23%
3,97
21%
3%11
1,11
639
%27
%
1 S
LO C
ity2
Nip
omo
3 C
entra
l 4
Rur
al A
reas
Mas
ter F
acto
rs
5 A
tasc
ader
o &
Pas
o R
oble
s
39.2
%48
.6%
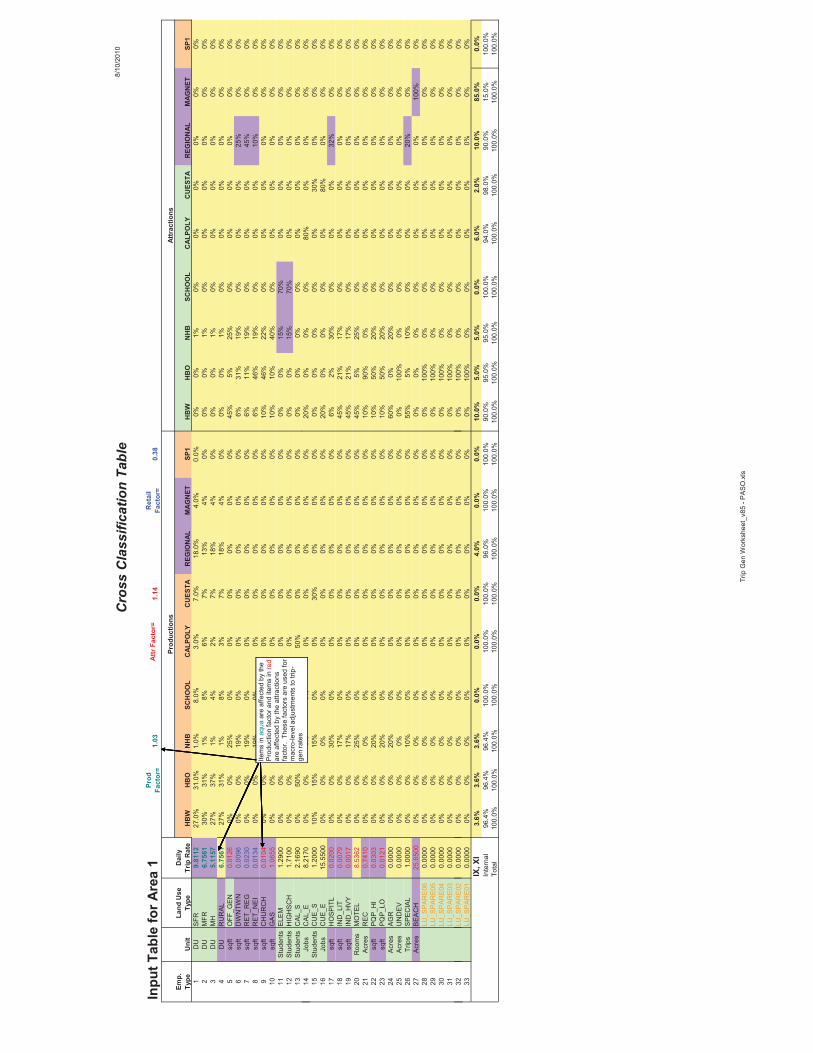
Cro
ss C
lass
ifica
tion
Tabl
e8/
10/2
010
Inpu
t Tab
le fo
r Are
a 1
Prod
Fa
ctor
=1.
03At
tr F
acto
r=1.
14R
etai
l Fa
ctor
=0.
38
Emp.
Type
Uni
tLa
nd U
seTy
peD
aily
Trip
Rat
eH
BW
HB
ON
HB
SCH
OO
LC
ALPO
LYC
UES
TAR
EGIO
NAL
MAG
NET
SP1
HB
WH
BO
NH
BSC
HO
OL
CAL
POLY
CU
ESTA
REG
ION
ALM
AGN
ETSP
11
DU
SFR
9.81
1227
.0%
31.0
%1.
0%8.
0%3.
0%7.
0%18
.0%
4.0%
0.0%
0%0%
1%0%
0%0%
0%0%
0%2
DU
MFR
6.75
6130
%31
%1%
8%6%
7%13
%4%
0%0%
0%1%
0%0%
0%0%
0%0%
3D
UM
H5.
1157
27%
37%
1%4%
2%7%
18%
4%0%
0%0%
1%0%
0%0%
0%0%
0%4
DU
RU
RA
L6.
7561
27%
31%
1%8%
3%7%
18%
4%0%
0%0%
1%0%
0%0%
0%0%
0%5
sqft
OFF
_GEN
0.01
260%
0%25
%0%
0%0%
0%0%
0%45
%5%
25%
0%0%
0%0%
0%0%
6sq
ftD
WN
TWN
0.00
960%
0%19
%0%
0%0%
0%0%
0%6%
31%
19%
0%0%
0%25
%0%
0%7
sqft
RE
T_R
EG
0.02
300%
0%19
%0%
0%0%
0%0%
0%6%
11%
19%
0%0%
0%45
%0%
0%8
sqft
RE
T_N
EI
0.01
340%
0%19
%0%
0%0%
0%0%
0%6%
46%
19%
0%0%
0%10
%0%
0%9
sqft
CH
UR
CH
0.01
040%
0%22
%0%
0%0%
0%0%
0%10
%46
%22
%0%
0%0%
0%0%
0%10
sqft
GA
S1.
0655
0%0%
40%
0%0%
0%0%
0%0%
10%
10%
40%
0%0%
0%0%
0%0%
11S
tude
nts
ELE
M1.
2900
0%0%
15%
0%0%
0%0%
0%0%
0%0%
15%
70%
0%0%
0%0%
0%12
Stu
dent
sH
IGH
SC
H1.
7100
0%0%
15%
0%0%
0%0%
0%0%
0%0%
15%
70%
0%0%
0%0%
0%13
Stu
dent
sC
AL_
S2.
1690
0%50
%0%
0%50
%0%
0%0%
0%0%
0%0%
0%0%
0%0%
0%0%
14J
bC
AL
E8
210
0%0%
0%0%
0%0%
0%0%
0%20
%0%
0%0%
80%
0%0%
0%0%
Prod
uctio
nsAt
trac
tions
Item
s in
aqu
aar
e af
fect
ed b
y th
e P
rodu
ctio
n fa
ctor
and
item
s in
red
are
affe
cted
by
the
attra
ctio
ns
fact
or.
Thes
e fa
ctor
s ar
e us
ed fo
r m
acro
-leve
l adj
ustm
ents
to tr
ip-
gen
rate
s14
Jobs
CA
L_E
8.21
700%
0%0%
0%0%
0%0%
0%0%
20%
0%0%
0%80
%0%
0%0%
0%15
Stu
dent
sC
UE
_S1.
2000
10%
15%
15%
0%0%
30%
0%0%
0%0%
0%0%
0%0%
30%
0%0%
0%16
Jobs
CU
E_E
15.5
500
0%0%
0%0%
0%0%
0%0%
0%20
%0%
0%0%
0%80
%0%
0%0%
17sq
ftH
OS
PIT
L0.
0200
0%0%
30%
0%0%
0%0%
0%0%
6%2%
30%
0%0%
0%32
%0%
0%18
sqft
IND
_LIT
0.00
790%
0%17
%0%
0%0%
0%0%
0%45
%21
%17
%0%
0%0%
0%0%
0%19
sqft
IND
_HV
Y0.
0017
0%0%
17%
0%0%
0%0%
0%0%
45%
21%
17%
0%0%
0%0%
0%0%
20R
oom
sM
OTE
L8.
5362
0%0%
25%
0%0%
0%0%
0%0%
45%
5%25
%0%
0%0%
0%0%
0%21
Acr
esR
EC
0.74
100%
0%0%
0%0%
0%0%
0%0%
10%
90%
0%0%
0%0%
0%0%
0%22
sqft
PQ
P_H
I0.
0303
0%0%
20%
0%0%
0%0%
0%0%
10%
50%
20%
0%0%
0%0%
0%0%
23sq
ftP
QP
_LO
0.01
210%
0%20
%0%
0%0%
0%0%
0%10
%50
%20
%0%
0%0%
0%0%
0%24
Acr
esA
GR
0.00
000%
0%20
%0%
0%0%
0%0%
0%60
%0%
20%
0%0%
0%0%
0%0%
25A
cres
UN
DE
V0.
0000
0%0%
0%0%
0%0%
0%0%
0%0%
100%
0%0%
0%0%
0%0%
0%26
Trip
sS
PE
CIA
L1.
0000
0%0%
10%
0%0%
0%0%
0%0%
55%
5%10
%0%
0%0%
20%
0%0%
27A
cres
BE
AC
H25
.650
00%
0%0%
0%0%
0%0%
0%0%
0%0%
0%0%
0%0%
0%10
0%0%
28LU
_SP
AR
E06
0.00
000%
0%0%
0%0%
0%0%
0%0%
0%10
0%0%
0%0%
0%0%
0%0%
29LU
_SP
AR
E05
0.00
000%
0%0%
0%0%
0%0%
0%0%
0%10
0%0%
0%0%
0%0%
0%0%
30LU
_SP
AR
E04
0.00
000%
0%0%
0%0%
0%0%
0%0%
0%10
0%0%
0%0%
0%0%
0%0%
31LU
_SP
AR
E03
0.00
000%
0%0%
0%0%
0%0%
0%0%
0%10
0%0%
0%0%
0%0%
0%0%
32LU
_SP
AR
E02
0.00
000%
0%0%
0%0%
0%0%
0%0%
0%10
0%0%
0%0%
0%0%
0%0%
Item
s in
aqu
aar
e af
fect
ed b
y th
e P
rodu
ctio
n fa
ctor
and
item
s in
red
are
affe
cted
by
the
attra
ctio
ns
fact
or.
Thes
e fa
ctor
s ar
e us
ed fo
r m
acro
-leve
l adj
ustm
ents
to tr
ip-
gen
rate
s
_33
LU_S
PA
RE
010.
0000
0%0%
0%0%
0%0%
0%0%
0%0%
100%
0%0%
0%0%
0%0%
0%IX
, XI
3.6%
3.6%
3.6%
0.0%
0.0%
0.0%
4.0%
0.0%
0.0%
10.0
%5.
0%5.
0%0.
0%6.
0%2.
0%10
.0%
85.0
%0.
0%In
tern
al96
.4%
96.4
%96
.4%
100.
0%10
0.0%
100.
0%96
.0%
100.
0%10
0.0%
90.0
%95
.0%
95.0
%10
0.0%
94.0
%98
.0%
90.0
%15
.0%
100.
0%To
tal
100.
0%10
0.0%
100.
0%10
0.0%
100.
0%10
0.0%
100.
0%10
0.0%
100.
0%10
0.0%
100.
0%10
0.0%
100.
0%10
0.0%
100.
0%10
0.0%
100.
0%10
0.0%
Item
s in
aqu
aar
e af
fect
ed b
y th
e P
rodu
ctio
n fa
ctor
and
item
s in
red
are
affe
cted
by
the
attra
ctio
ns
fact
or.
Thes
e fa
ctor
s ar
e us
ed fo
r m
acro
-leve
l adj
ustm
ents
to tr
ip-
gen
rate
s
Trip
Gen
Wor
kshe
et_v
85 -
PA
SO
.xls
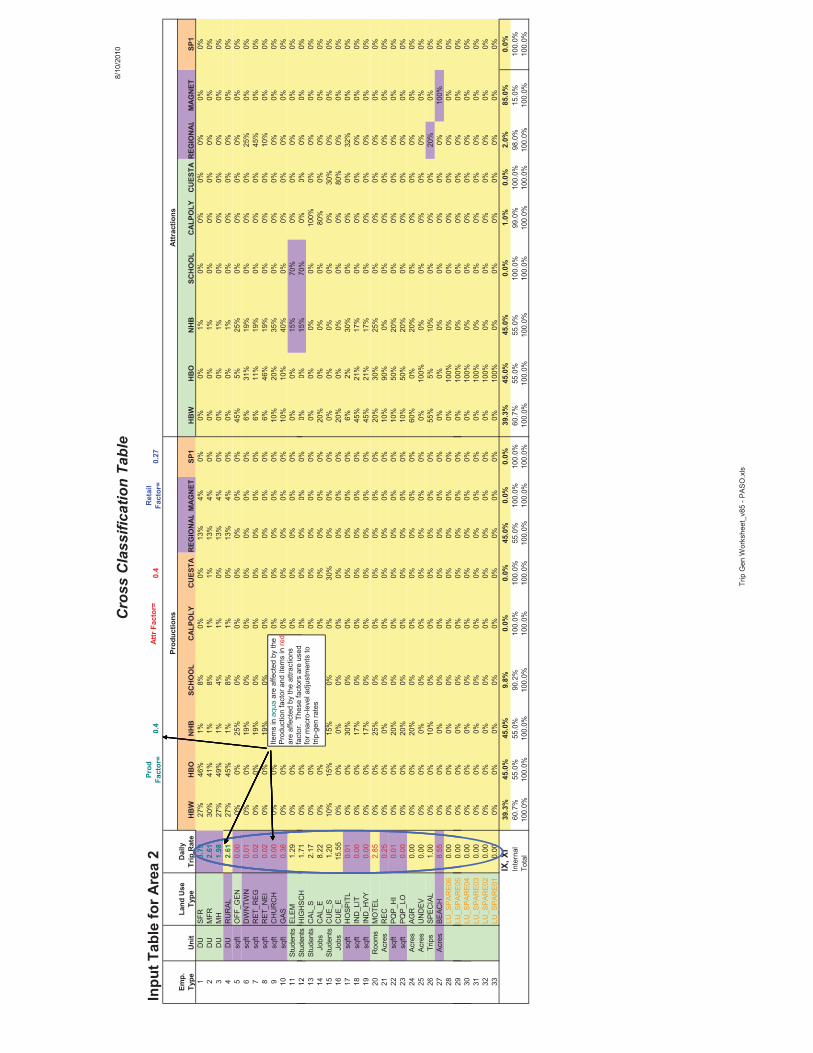
Cro
ss C
lass
ifica
tion
Tabl
e8/
10/2
010
Inpu
t Tab
le fo
r Are
a 2
Prod
Fa
ctor
=0.
4At
tr F
acto
r=0.
4R
etai
l Fa
ctor
=0.
27
Emp.
Type
Uni
tLa
nd U
seTy
peD
aily
Trip
Rat
eH
BW
HB
ON
HB
SCH
OO
LC
ALPO
LYC
UES
TAR
EGIO
NA L
MAG
NET
SP1
HB
WH
BO
NH
BSC
HO
OL
CAL
POLY
CU
ESTA
REG
ION
ALM
AGN
ETSP
11
DU
SFR
3.79
27%
46%
1%8%
0%0%
13%
4%0%
0%0%
1%0%
0%0%
0%0%
0%2
DU
MFR
2.61
30%
41%
1%8%
1%1%
13%
4%0%
0%0%
1%0%
0%0%
0%0%
0%3
DU
MH
1.98
27%
49%
1%4%
1%0%
13%
4%0%
0%0%
1%0%
0%0%
0%0%
0%4
DU
RU
RAL
2.61
27%
45%
1%8%
1%0%
13%
4%0%
0%0%
1%0%
0%0%
0%0%
0%5
sqft
OFF
_GEN
0.00
0%0%
25%
0%0%
0%0%
0%0%
45%
5%25
%0%
0%0%
0%0%
0%6
sqft
DW
NTW
N0.
010%
0%19
%0%
0%0%
0%0%
0%6%
31%
19%
0%0%
0%25
%0%
0%7
sqft
RET
_REG
0.02
0%0%
19%
0%0%
0%0%
0%0%
6%11
%19
%0%
0%0%
45%
0%0%
8sq
ftR
ET_N
EI0.
020%
0%19
%0%
0%0%
0%0%
0%6%
46%
19%
0%0%
0%10
%0%
0%9
sqft
CH
UR
CH
0.00
0%0%
35%
0%0%
0%0%
0%0%
10%
20%
35%
0%0%
0%0%
0%0%
10sq
ftG
AS0.
360%
0%40
%0%
0%0%
0%0%
0%10
%10
%40
%0%
0%0%
0%0%
0%11
Stud
ents
ELEM
1.29
0%0%
15%
0%0%
0%0%
0%0%
0%0%
15%
70%
0%0%
0%0%
0%12
Stud
ents
HIG
HSC
H1.
710%
0%15
%0%
0%0%
0%0%
0%0%
0%15
%70
%0%
0%0%
0%0%
Prod
uctio
nsAt
trac
tions
Item
s in
aqu
aar
e af
fect
ed b
y th
e Pr
oduc
tion
fact
or a
nd it
ems
in re
dar
e af
fect
ed b
y th
e at
tract
ions
fa
ctor
. Th
ese
fact
ors
are
used
fo
rmac
role
vela
djus
tmen
tsto
12St
uden
tsH
IGH
SCH
1.71
0%0%
15%
0%0%
0%0%
0%0%
0%0%
15%
70%
0%0%
0%0%
0%13
Stud
ents
CAL
_S2.
170%
0%0%
0%0%
0%0%
0%0%
0%0%
0%0%
100%
0%0%
0%0%
14Jo
bsC
AL_E
8.22
0%0%
0%0%
0%0%
0%0%
0%20
%0%
0%0%
80%
0%0%
0%0%
15St
uden
tsC
UE_
S1.
2010
%15
%15
%0%
0%30
%0%
0%0%
0%0%
0%0%
0%30
%0%
0%0%
16Jo
bsC
UE_
E15
.55
0%0%
0%0%
0%0%
0%0%
0%20
%0%
0%0%
0%80
%0%
0%0%
17sq
ftH
OSP
ITL
0.01
0%0%
30%
0%0%
0%0%
0%0%
6%2%
30%
0%0%
0%32
%0%
0%18
sqft
IND
_LIT
0.00
0%0%
17%
0%0%
0%0%
0%0%
45%
21%
17%
0%0%
0%0%
0%0%
19sq
ftIN
D_H
VY0.
000%
0%17
%0%
0%0%
0%0%
0%45
%21
%17
%0%
0%0%
0%0%
0%20
Roo
ms
MO
TEL
2.85
0%0%
25%
0%0%
0%0%
0%0%
20%
30%
25%
0%0%
0%0%
0%0%
21Ac
res
REC
0.25
0%0%
0%0%
0%0%
0%0%
0%10
%90
%0%
0%0%
0%0%
0%0%
22sq
ftPQ
P_H
I0.
010%
0%20
%0%
0%0%
0%0%
0%10
%50
%20
%0%
0%0%
0%0%
0%23
sqft
PQP_
LO0.
000%
0%20
%0%
0%0%
0%0%
0%10
%50
%20
%0%
0%0%
0%0%
0%24
Acre
sAG
R0.
000%
0%20
%0%
0%0%
0%0%
0%60
%0%
20%
0%0%
0%0%
0%0%
25Ac
res
UN
DEV
0.00
0%0%
0%0%
0%0%
0%0%
0%0%
100%
0%0%
0%0%
0%0%
0%26
Trip
sSP
ECIA
L1.
000%
0%10
%0%
0%0%
0%0%
0%55
%5%
10%
0%0%
0%20
%0%
0%27
Acre
sBE
ACH
8.55
0%0%
0%0%
0%0%
0%0%
0%0%
0%0%
0%0%
0%0%
100%
0%28
LU_S
PAR
E06
0.00
0%0%
0%0%
0%0%
0%0%
0%0%
100%
0%0%
0%0%
0%0%
0%29
LU_S
PAR
E05
0.00
0%0%
0%0%
0%0%
0%0%
0%0%
100%
0%0%
0%0%
0%0%
0%
Item
s in
aqu
aar
e af
fect
ed b
y th
e Pr
oduc
tion
fact
or a
nd it
ems
in re
dar
e af
fect
ed b
y th
e at
tract
ions
fa
ctor
. Th
ese
fact
ors
are
used
fo
r mac
ro-le
vel a
djus
tmen
ts to
tri
p-ge
n ra
tes
_30
LU_S
PAR
E04
0.00
0%0%
0%0%
0%0%
0%0%
0%0%
100%
0%0%
0%0%
0%0%
0%31
LU_S
PAR
E03
0.00
0%0%
0%0%
0%0%
0%0%
0%0%
100%
0%0%
0%0%
0%0%
0%32
LU_S
PAR
E02
0.00
0%0%
0%0%
0%0%
0%0%
0%0%
100%
0%0%
0%0%
0%0%
0%33
LU_S
PAR
E01
0.00
0%0%
0%0%
0%0%
0%0%
0%0%
100%
0%0%
0%0%
0%0%
0%IX
, XI
39.3
%45
.0%
45.0
%9.
8%0.
0%0.
0%45
.0%
0.0%
0.0%
39.3
%45
.0%
45.0
%0.
0%1.
0%0.
0%2.
0%85
.0%
0.0%
Inte
rnal
60.7
%55
.0%
55.0
%90
.2%
100.
0%10
0.0%
55.0
%10
0.0%
100.
0%60
.7%
55.0
%55
.0%
100.
0%99
.0%
100.
0%98
.0%
15.0
%10
0.0%
Tota
l10
0.0%
100.
0%10
0.0%
100.
0%10
0.0%
100.
0%10
0.0%
100.
0%10
0.0%
100.
0%10
0.0%
100.
0%10
0.0%
100.
0%10
0.0%
100.
0%10
0.0%
100.
0%
Item
s in
aqu
aar
e af
fect
ed b
y th
e Pr
oduc
tion
fact
or a
nd it
ems
in re
dar
e af
fect
ed b
y th
e at
tract
ions
fa
ctor
. Th
ese
fact
ors
are
used
fo
r mac
ro-le
vel a
djus
tmen
ts to
tri
p-ge
n ra
tes
Trip
Gen
Wor
kshe
et_v
85 -
PASO
.xls
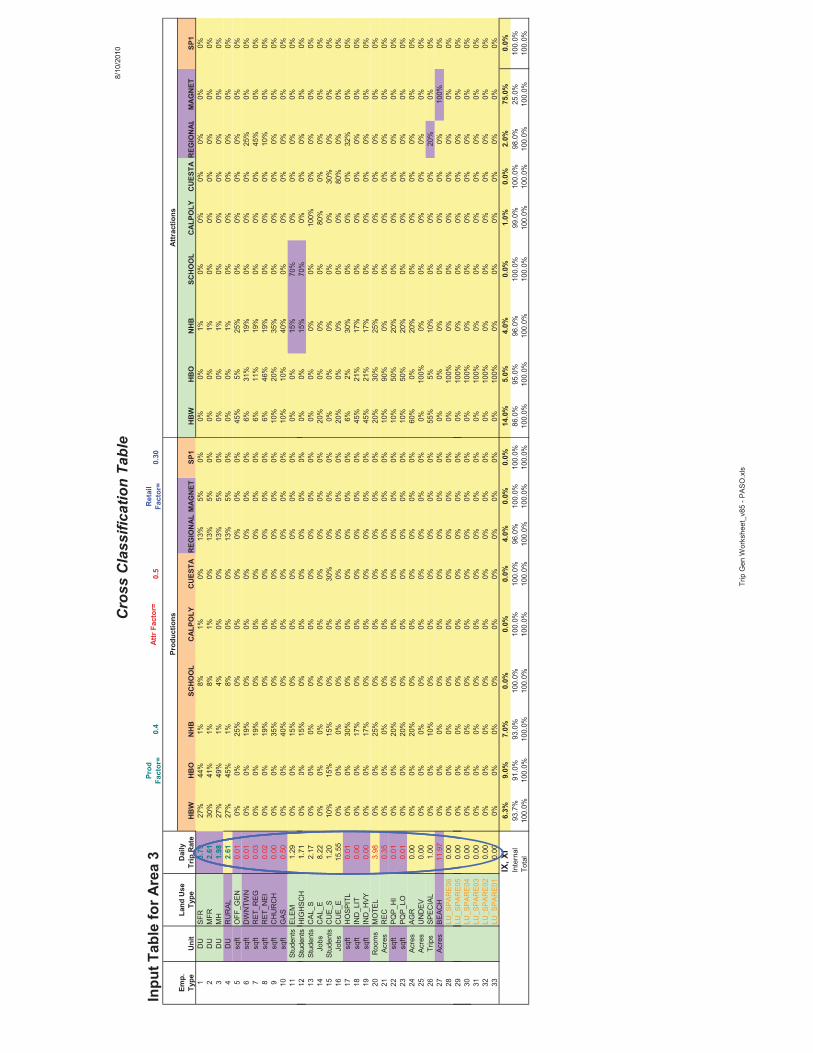
Cro
ss C
lass
ifica
tion
Tabl
e8/
10/2
010
Inpu
t Tab
le fo
r Are
a 3
Prod
Fa
ctor
=0.
4At
tr F
acto
r=0.
5R
etai
l Fa
ctor
=0.
30
Emp.
Type
Uni
tLa
nd U
seTy
peD
aily
Trip
Rat
eH
BW
HB
ON
HB
SCH
OO
LC
ALPO
LYC
UES
TAR
EGIO
NA L
MAG
NET
SP1
HB
WH
BO
NH
BSC
HO
OL
CAL
POLY
CU
ESTA
REG
ION
ALM
AGN
ETSP
11
DU
SFR
3.79
27%
44%
1%8%
1%0%
13%
5%0%
0%0%
1%0%
0%0%
0%0%
0%2
DU
MFR
2.61
30%
41%
1%8%
1%0%
13%
5%0%
0%0%
1%0%
0%0%
0%0%
0%3
DU
MH
1.98
27%
49%
1%4%
0%0%
13%
5%0%
0%0%
1%0%
0%0%
0%0%
0%4
DU
RU
RAL
2.61
27%
45%
1%8%
0%0%
13%
5%0%
0%0%
1%0%
0%0%
0%0%
0%5
sqft
OFF
_GEN
0.01
0%0%
25%
0%0%
0%0%
0%0%
45%
5%25
%0%
0%0%
0%0%
0%6
sqft
DW
NTW
N0.
010%
0%19
%0%
0%0%
0%0%
0%6%
31%
19%
0%0%
0%25
%0%
0%7
sqft
RET
_REG
0.03
0%0%
19%
0%0%
0%0%
0%0%
6%11
%19
%0%
0%0%
45%
0%0%
8sq
ftR
ET_N
EI0.
020%
0%19
%0%
0%0%
0%0%
0%6%
46%
19%
0%0%
0%10
%0%
0%9
sqft
CH
UR
CH
0.00
0%0%
35%
0%0%
0%0%
0%0%
10%
20%
35%
0%0%
0%0%
0%0%
10sq
ftG
AS0.
500%
0%40
%0%
0%0%
0%0%
0%10
%10
%40
%0%
0%0%
0%0%
0%11
Stud
ents
ELEM
1.29
0%0%
15%
0%0%
0%0%
0%0%
0%0%
15%
70%
0%0%
0%0%
0%12
Stud
ents
HIG
HSC
H1.
710%
0%15
%0%
0%0%
0%0%
0%0%
0%15
%70
%0%
0%0%
0%0%
Prod
uctio
nsAt
trac
tions
12St
uden
tsH
IGH
SCH
1.71
0%0%
15%
0%0%
0%0%
0%0%
0%0%
15%
70%
0%0%
0%0%
0%13
Stud
ents
CAL
_S2.
170%
0%0%
0%0%
0%0%
0%0%
0%0%
0%0%
100%
0%0%
0%0%
14Jo
bsC
AL_E
8.22
0%0%
0%0%
0%0%
0%0%
0%20
%0%
0%0%
80%
0%0%
0%0%
15St
uden
tsC
UE_
S1.
2010
%15
%15
%0%
0%30
%0%
0%0%
0%0%
0%0%
0%30
%0%
0%0%
16Jo
bsC
UE_
E15
.55
0%0%
0%0%
0%0%
0%0%
0%20
%0%
0%0%
0%80
%0%
0%0%
17sq
ftH
OSP
ITL
0.01
0%0%
30%
0%0%
0%0%
0%0%
6%2%
30%
0%0%
0%32
%0%
0%18
sqft
IND
_LIT
0.00
0%0%
17%
0%0%
0%0%
0%0%
45%
21%
17%
0%0%
0%0%
0%0%
19sq
ftIN
D_H
VY0.
000%
0%17
%0%
0%0%
0%0%
0%45
%21
%17
%0%
0%0%
0%0%
0%20
Roo
ms
MO
TEL
3.98
0%0%
25%
0%0%
0%0%
0%0%
20%
30%
25%
0%0%
0%0%
0%0%
21Ac
res
REC
0.35
0%0%
0%0%
0%0%
0%0%
0%10
%90
%0%
0%0%
0%0%
0%0%
22sq
ftPQ
P_H
I0.
010%
0%20
%0%
0%0%
0%0%
0%10
%50
%20
%0%
0%0%
0%0%
0%23
sqft
PQP_
LO0.
010%
0%20
%0%
0%0%
0%0%
0%10
%50
%20
%0%
0%0%
0%0%
0%24
Acre
sAG
R0.
000%
0%20
%0%
0%0%
0%0%
0%60
%0%
20%
0%0%
0%0%
0%0%
25Ac
res
UN
DEV
0.00
0%0%
0%0%
0%0%
0%0%
0%0%
100%
0%0%
0%0%
0%0%
0%26
Trip
sSP
ECIA
L1.
000%
0%10
%0%
0%0%
0%0%
0%55
%5%
10%
0%0%
0%20
%0%
0%27
Acre
sBE
ACH
11.9
70%
0%0%
0%0%
0%0%
0%0%
0%0%
0%0%
0%0%
0%10
0%0%
28LU
_SPA
RE0
60.
000%
0%0%
0%0%
0%0%
0%0%
0%10
0%0%
0%0%
0%0%
0%0%
29LU
_SPA
RE0
50.
000%
0%0%
0%0%
0%0%
0%0%
0%10
0%0%
0%0%
0%0%
0%0%
_30
LU_S
PAR
E04
0.00
0%0%
0%0%
0%0%
0%0%
0%0%
100%
0%0%
0%0%
0%0%
0%31
LU_S
PAR
E03
0.00
0%0%
0%0%
0%0%
0%0%
0%0%
100%
0%0%
0%0%
0%0%
0%32
LU_S
PAR
E02
0.00
0%0%
0%0%
0%0%
0%0%
0%0%
100%
0%0%
0%0%
0%0%
0%33
LU_S
PAR
E01
0.00
0%0%
0%0%
0%0%
0%0%
0%0%
100%
0%0%
0%0%
0%0%
0%IX
, XI
6.3%
9.0%
7.0%
0.0%
0.0%
0.0%
4.0%
0.0%
0.0%
14.0
%5.
0%4.
0%0.
0%1.
0%0.
0%2.
0%75
.0%
0.0%
Inte
rnal
93.7
%91
.0%
93.0
%10
0.0%
100.
0%10
0.0%
96.0
%10
0.0%
100.
0%86
.0%
95.0
%96
.0%
100.
0%99
.0%
100.
0%98
.0%
25.0
%10
0.0%
Tota
l10
0.0%
100.
0%10
0.0%
100.
0%10
0.0%
100.
0%10
0.0%
100.
0%10
0.0%
100.
0%10
0.0%
100.
0%10
0.0%
100.
0%10
0.0%
100.
0%10
0.0%
100.
0%
Trip
Gen
Wor
kshe
et_v
85 -
PASO
.xls
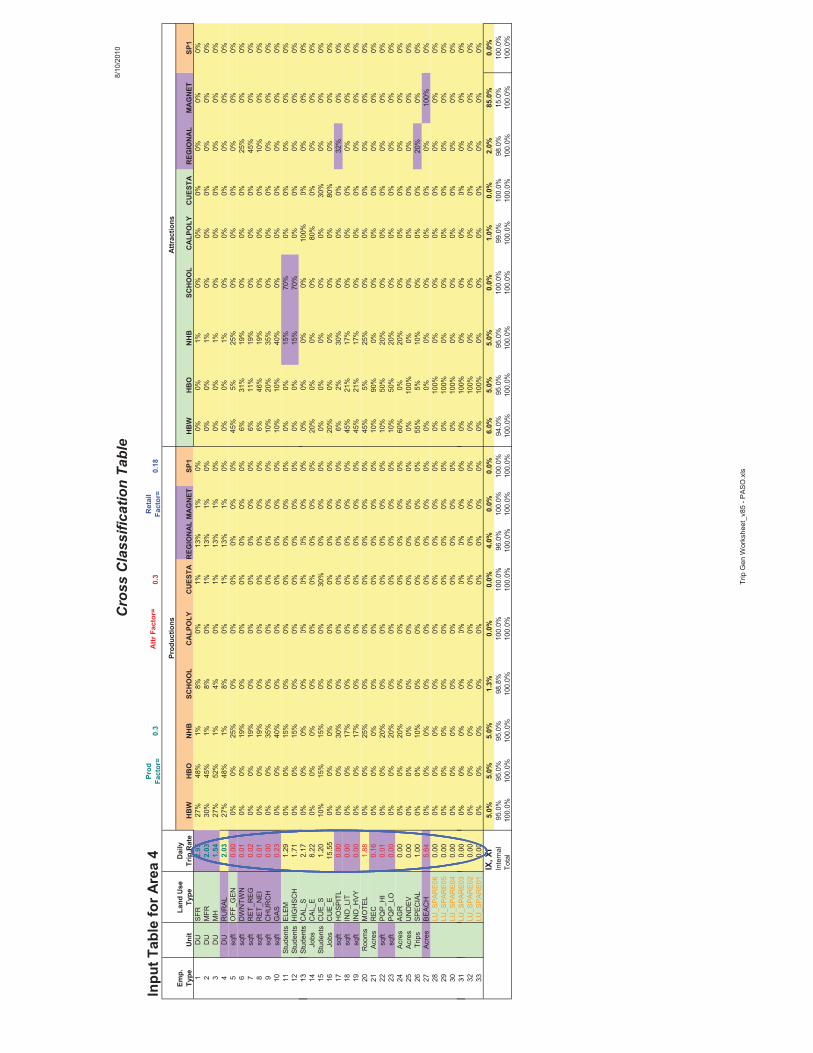
Cro
ss C
lass
ifica
tion
Tabl
e8/
10/2
010
Inpu
t Tab
le fo
r Are
a 4
Prod
Fact
or=
0.3
Attr
Fac
tor=
0.3
Ret
ail
Fact
or=
0.18
Emp.
Type
Uni
tLa
nd U
seTy
peD
aily
Trip
Rat
eH
BW
HB
ON
HB
SCH
OO
LC
ALP
OLY
CU
ESTA
REG
ION
AL
MA
GN
ETSP
1H
BW
HB
ON
HB
SCH
OO
LC
ALP
OLY
CU
ESTA
REG
ION
AL
MA
GN
ETSP
11
DU
SFR
2.95
27%
48%
1%8%
0%1%
13%
1%0%
0%0%
1%0%
0%0%
0%0%
0%2
DU
MFR
2.03
30%
45%
1%8%
0%1%
13%
1%0%
0%0%
1%0%
0%0%
0%0%
0%3
DU
MH
1.54
27%
52%
1%4%
0%1%
13%
1%0%
0%0%
1%0%
0%0%
0%0%
0%4
DU
RU
RA
L2.
0327
%48
%1%
8%0%
1%13
%1%
0%0%
0%1%
0%0%
0%0%
0%0%
5sq
ftO
FF_G
EN0.
000%
0%25
%0%
0%0%
0%0%
0%45
%5%
25%
0%0%
0%0%
0%0%
6sq
ftD
WN
TWN
0.01
0%0%
19%
0%0%
0%0%
0%0%
6%31
%19
%0%
0%0%
25%
0%0%
7sq
ftR
ET_R
EG0.
020%
0%19
%0%
0%0%
0%0%
0%6%
11%
19%
0%0%
0%45
%0%
0%8
sqft
RET
_NEI
0.01
0%0%
19%
0%0%
0%0%
0%0%
6%46
%19
%0%
0%0%
10%
0%0%
9sq
ftC
HU
RC
H0.
000%
0%35
%0%
0%0%
0%0%
0%10
%20
%35
%0%
0%0%
0%0%
0%10
sqft
GA
S0.
230%
0%40
%0%
0%0%
0%0%
0%10
%10
%40
%0%
0%0%
0%0%
0%11
Stud
ents
ELEM
1.29
0%0%
15%
0%0%
0%0%
0%0%
0%0%
15%
70%
0%0%
0%0%
0%12
Stud
ents
HIG
HSC
H1.
710%
0%15
%0%
0%0%
0%0%
0%0%
0%15
%70
%0%
0%0%
0%0%
13St
uden
tsC
AL
S2
170%
0%0%
0%0%
0%0%
0%0%
0%0%
0%0%
100%
0%0%
0%0%
Prod
uctio
nsA
ttrac
tions
13St
uden
tsC
AL_
S2.
170%
0%0%
0%0%
0%0%
0%0%
0%0%
0%0%
100%
0%0%
0%0%
14Jo
bsC
AL_
E8.
220%
0%0%
0%0%
0%0%
0%0%
20%
0%0%
0%80
%0%
0%0%
0%15
Stud
ents
CU
E_S
1.20
10%
15%
15%
0%0%
30%
0%0%
0%0%
0%0%
0%0%
30%
0%0%
0%16
Jobs
CU
E_E
15.5
50%
0%0%
0%0%
0%0%
0%0%
20%
0%0%
0%0%
80%
0%0%
0%17
sqft
HO
SP
ITL
0.00
0%0%
30%
0%0%
0%0%
0%0%
6%2%
30%
0%0%
0%32
%0%
0%18
sqft
IND
_LIT
0.00
0%0%
17%
0%0%
0%0%
0%0%
45%
21%
17%
0%0%
0%0%
0%0%
19sq
ftIN
D_H
VY
0.00
0%0%
17%
0%0%
0%0%
0%0%
45%
21%
17%
0%0%
0%0%
0%0%
20R
oom
sM
OTE
L1.
880%
0%25
%0%
0%0%
0%0%
0%45
%5%
25%
0%0%
0%0%
0%0%
21A
cres
REC
0.16
0%0%
0%0%
0%0%
0%0%
0%10
%90
%0%
0%0%
0%0%
0%0%
22sq
ftP
QP
_HI
0.01
0%0%
20%
0%0%
0%0%
0%0%
10%
50%
20%
0%0%
0%0%
0%0%
23sq
ftPQ
P_LO
0.00
0%0%
20%
0%0%
0%0%
0%0%
10%
50%
20%
0%0%
0%0%
0%0%
24Ac
res
AG
R0.
000%
0%20
%0%
0%0%
0%0%
0%60
%0%
20%
0%0%
0%0%
0%0%
25Ac
res
UN
DEV
0.00
0%0%
0%0%
0%0%
0%0%
0%0%
100%
0%0%
0%0%
0%0%
0%26
Trip
sSP
ECIA
L1.
000%
0%10
%0%
0%0%
0%0%
0%55
%5%
10%
0%0%
0%20
%0%
0%27
Acr
esB
EA
CH
5.64
0%0%
0%0%
0%0%
0%0%
0%0%
0%0%
0%0%
0%0%
100%
0%28
LU_S
PA
RE
060.
000%
0%0%
0%0%
0%0%
0%0%
0%10
0%0%
0%0%
0%0%
0%0%
29LU
_SP
AR
E05
0.00
0%0%
0%0%
0%0%
0%0%
0%0%
100%
0%0%
0%0%
0%0%
0%30
LU_S
PA
RE
040.
000%
0%0%
0%0%
0%0%
0%0%
0%10
0%0%
0%0%
0%0%
0%0%
31LU
SPAR
E03
000
0%0%
0%0%
0%0%
0%0%
0%0%
100%
0%0%
0%0%
0%0%
0%31
LU_S
PA
RE
030.
000%
0%0%
0%0%
0%0%
0%0%
0%10
0%0%
0%0%
0%0%
0%0%
32LU
_SP
AR
E02
0.00
0%0%
0%0%
0%0%
0%0%
0%0%
100%
0%0%
0%0%
0%0%
0%33
LU_S
PA
RE
010.
000%
0%0%
0%0%
0%0%
0%0%
0%10
0%0%
0%0%
0%0%
0%0%
IX, X
I5.
0%5.
0%5.
0%1.
3%0.
0%0.
0%4.
0%0.
0%0.
0%6.
0%5.
0%5.
0%0.
0%1.
0%0.
0%2.
0%85
.0%
0.0%
Inte
rnal
95.0
%95
.0%
95.0
%98
.8%
100.
0%10
0.0%
96.0
%10
0.0%
100.
0%94
.0%
95.0
%95
.0%
100.
0%99
.0%
100.
0%98
.0%
15.0
%10
0.0%
Tota
l10
0.0%
100.
0%10
0.0%
100.
0%10
0.0%
100.
0%10
0.0%
100.
0%10
0.0%
100.
0%10
0.0%
100.
0%10
0.0%
100.
0%10
0.0%
100.
0%10
0.0%
100.
0%
Trip
Gen
Wor
kshe
et_v
85 -
PASO
.xls

Cro
ss C
lass
ifica
tion
Tabl
e8/
10/2
010
Inpu
t Tab
le fo
r Are
a 5
Prod
Fact
or=
0.8
Attr
Fac
tor=
0.6
Ret
ail
Fact
or=
0.27
Emp.
Type
Uni
tLa
nd U
seTy
peD
aily
Trip
Rat
eH
BW
HB
ON
HB
SCH
OO
LC
ALP
OLY
CU
ESTA
REG
ION
AL
MA
GN
ETSP
1H
BW
HB
ON
HB
SCH
OO
LC
ALP
OLY
CU
ESTA
REG
ION
AL
MA
GN
ETSP
11
DU
SFR
7.56
21%
28%
15%
5%1%
2%12
%1%
0%0%
0%15
%0%
0%0%
0%0%
0%2
DU
MFR
5.21
25%
25%
15%
5%1%
1%12
%1%
0%0%
0%15
%0%
0%0%
0%0%
0%3
DU
MH
3.94
25%
28%
15%
3%0%
1%12
%1%
0%0%
0%15
%0%
0%0%
0%0%
0%4
DU
RU
RA
L5.
2121
%31
%15
%5%
0%1%
12%
1%0%
0%0%
14%
0%0%
0%0%
0%0%
5sq
ftO
FF_G
EN0.
010%
0%25
%0%
0%0%
0%0%
0%45
%5%
25%
0%0%
0%0%
0%0%
6sq
ftD
WN
TWN
0.02
0%0%
19%
0%0%
0%0%
0%0%
6%31
%19
%0%
0%0%
25%
0%0%
7sq
ftR
ET_R
EG0.
040%
0%19
%0%
0%0%
0%0%
0%6%
11%
19%
0%0%
0%45
%0%
0%8
sqft
RET
_NEI
0.03
0%0%
19%
0%0%
0%0%
0%0%
6%46
%19
%0%
0%0%
10%
0%0%
9sq
ftC
HU
RC
H0.
010%
0%20
%0%
0%0%
0%0%
0%10
%50
%20
%0%
0%0%
0%0%
0%10
sqft
GA
S0.
590%
0%40
%0%
0%0%
0%0%
0%10
%10
%40
%0%
0%0%
0%0%
0%11
Stud
ents
ELEM
1.29
0%0%
20%
0%0%
0%0%
0%0%
0%0%
20%
60%
0%0%
0%0%
0%12
Stud
ents
HIG
HSC
H1.
710%
0%20
%0%
0%0%
0%0%
0%0%
0%20
%60
%0%
0%0%
0%0%
13St
uden
tsC
AL
S2
170%
0%0%
0%0%
0%0%
0%0%
0%0%
0%0%
100%
0%0%
0%0%
Prod
uctio
nsA
ttrac
tions
13St
uden
tsC
AL_
S2.
170%
0%0%
0%0%
0%0%
0%0%
0%0%
0%0%
100%
0%0%
0%0%
14Jo
bsC
AL_
E8.
220%
0%0%
0%0%
0%0%
0%0%
20%
0%0%
0%80
%0%
0%0%
0%15
Stud
ents
CU
E_S
1.20
10%
15%
15%
0%0%
30%
0%0%
0%0%
0%0%
0%0%
30%
0%0%
0%16
Jobs
CU
E_E
15.5
50%
0%0%
0%0%
0%0%
0%0%
20%
0%0%
0%0%
80%
0%0%
0%17
sqft
HO
SP
ITL
0.01
0%0%
30%
0%0%
0%0%
0%0%
6%2%
30%
0%0%
0%32
%0%
0%18
sqft
IND
_LIT
0.00
0%0%
18%
0%0%
0%0%
0%0%
45%
20%
18%
0%0%
0%0%
0%0%
19sq
ftIN
D_H
VY
0.00
0%0%
18%
0%0%
0%0%
0%0%
45%
20%
18%
0%0%
0%0%
0%0%
20R
oom
sM
OTE
L4.
720%
0%30
%0%
0%0%
0%0%
0%20
%20
%30
%0%
0%0%
0%0%
0%21
Acr
esR
EC0.
410%
0%10
%0%
0%0%
0%0%
0%10
%70
%10
%0%
0%0%
0%0%
0%22
sqft
PQ
P_H
I0.
020%
0%20
%0%
0%0%
0%0%
0%10
%50
%20
%0%
0%0%
0%0%
0%23
sqft
PQP_
LO0.
010%
0%25
%0%
0%0%
0%0%
0%10
%40
%25
%0%
0%0%
0%0%
0%24
Acre
sA
GR
0.00
0%0%
20%
0%0%
0%0%
0%0%
60%
0%20
%0%
0%0%
0%0%
0%25
Acre
sU
ND
EV0.
000%
0%0%
0%0%
0%0%
0%0%
0%10
0%0%
0%0%
0%0%
0%0%
26Tr
ips
SPEC
IAL
1.00
0%0%
10%
0%0%
0%0%
0%0%
55%
5%10
%0%
0%0%
20%
0%0%
27A
cres
BE
AC
H14
.18
0%0%
0%0%
0%0%
0%0%
0%0%
0%0%
0%0%
0%0%
100%
0%28
LU_S
PA
RE
060.
000%
0%0%
0%0%
0%0%
0%0%
0%10
0%0%
0%0%
0%0%
0%0%
29LU
_SP
AR
E05
0.00
0%0%
0%0%
0%0%
0%0%
0%0%
100%
0%0%
0%0%
0%0%
0%30
LU_S
PA
RE
040.
000%
0%0%
0%0%
0%0%
0%0%
0%10
0%0%
0%0%
0%0%
0%0%
31LU
SPAR
E03
000
0%0%
0%0%
0%0%
0%0%
0%0%
100%
0%0%
0%0%
0%0%
0%31
LU_S
PA
RE
030.
000%
0%0%
0%0%
0%0%
0%0%
0%10
0%0%
0%0%
0%0%
0%0%
32LU
_SP
AR
E02
0.00
0%0%
0%0%
0%0%
0%0%
0%0%
100%
0%0%
0%0%
0%0%
0%33
LU_S
PA
RE
010.
000%
0%0%
0%0%
0%0%
0%0%
0%10
0%0%
0%0%
0%0%
0%0%
IX, X
I2.
7%2.
7%2.
7%0.
7%0.
0%0.
0%4.
0%0.
0%0.
0%4.
0%2.
7%2.
7%0.
0%1.
0%0.
0%2.
0%70
.0%
0.0%
Inte
rnal
97.3
%97
.3%
97.3
%99
.3%
100.
0%10
0.0%
96.0
%10
0.0%
100.
0%96
.0%
97.3
%97
.3%
100.
0%99
.0%
100.
0%98
.0%
30.0
%10
0.0%
Tota
l10
0.0%
100.
0%10
0.0%
100.
0%10
0.0%
100.
0%10
0.0%
100.
0%10
0.0%
100.
0%10
0.0%
100.
0%10
0.0%
100.
0%10
0.0%
100.
0%10
0.0%
100.
0%
Trip
Gen
Wor
kshe
et_v
85 -
PASO
.xls
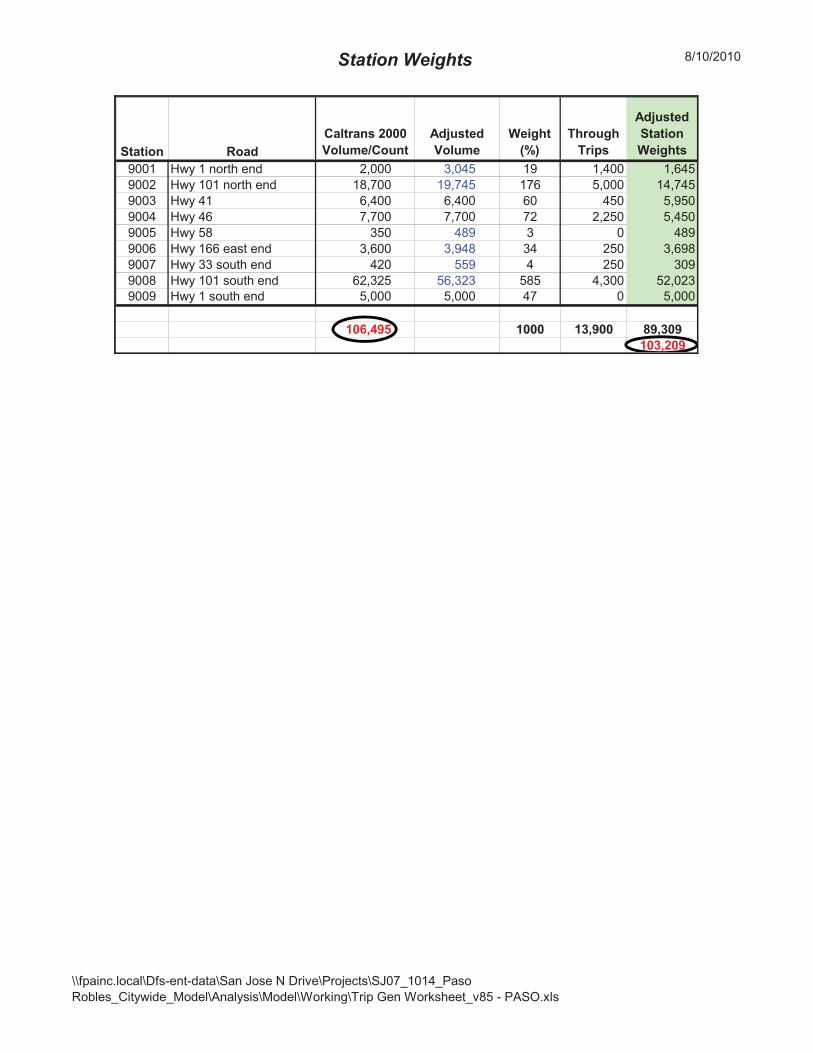
Station Weights 8/10/2010
Station RoadCaltrans 2000Volume/Count
Adjusted Volume
Weight(%)
ThroughTrips
AdjustedStationWeights
9001 Hwy 1 north end 2,000 3,045 19 1,400 1,6459002 Hwy 101 north end 18,700 19,745 176 5,000 14,7459003 Hwy 41 6,400 6,400 60 450 5,9509004 Hwy 46 7,700 7,700 72 2,250 5,4509005 Hwy 58 350 489 3 0 4899006 Hwy 166 east end 3,600 3,948 34 250 3,6989007 Hwy 33 south end 420 559 4 250 3099008 Hwy 101 south end 62,325 56,323 585 4,300 52,0239009 Hwy 1 south end 5,000 5,000 47 0 5,000
106,495 1000 13,900 89,309103,209
\\fpainc.local\Dfs-ent-data\San Jose N Drive\Projects\SJ07_1014_Paso Robles_Citywide_Model\Analysis\Model\Working\Trip Gen Worksheet_v85 - PASO.xls
APPENDIX F: FRICTION FACTORS
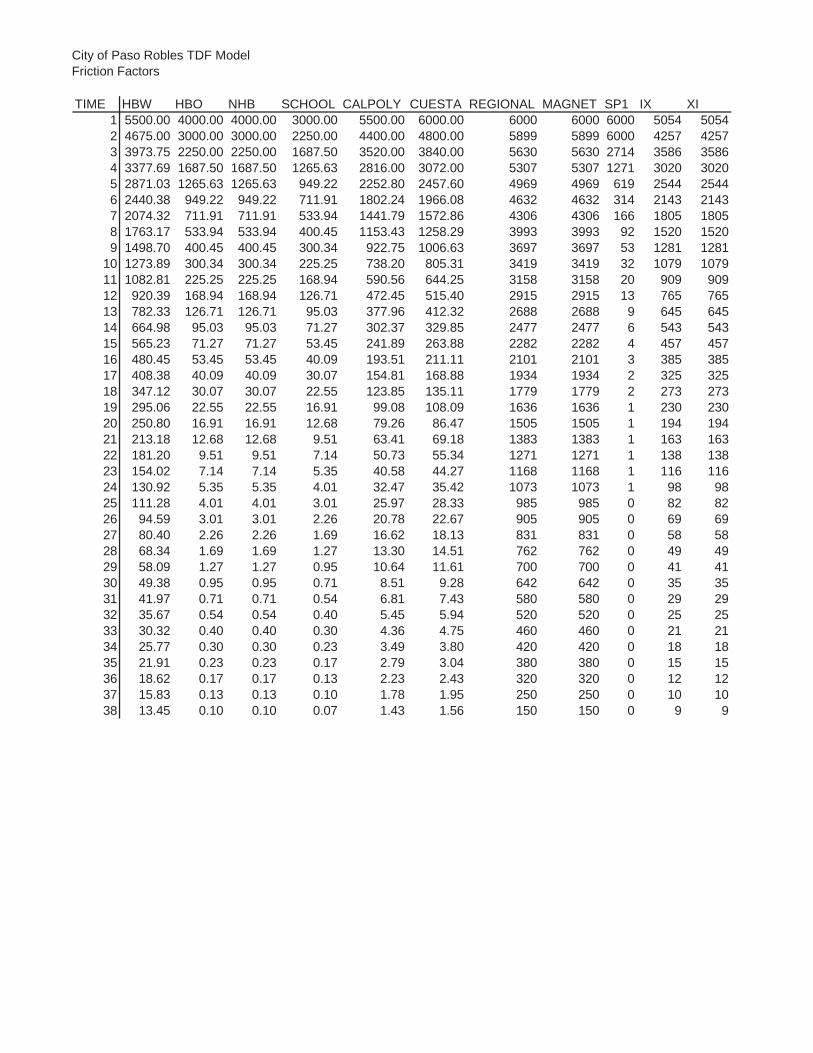
City of Paso Robles TDF ModelFriction Factors
TIME HBW HBO NHB SCHOOL CALPOLY CUESTA REGIONAL MAGNET SP1 IX XI1 5500.00 4000.00 4000.00 3000.00 5500.00 6000.00 6000 6000 6000 5054 50542 4675.00 3000.00 3000.00 2250.00 4400.00 4800.00 5899 5899 6000 4257 42573 3973.75 2250.00 2250.00 1687.50 3520.00 3840.00 5630 5630 2714 3586 35864 3377.69 1687.50 1687.50 1265.63 2816.00 3072.00 5307 5307 1271 3020 30205 2871.03 1265.63 1265.63 949.22 2252.80 2457.60 4969 4969 619 2544 25446 2440.38 949.22 949.22 711.91 1802.24 1966.08 4632 4632 314 2143 21437 2074.32 711.91 711.91 533.94 1441.79 1572.86 4306 4306 166 1805 18058 1763.17 533.94 533.94 400.45 1153.43 1258.29 3993 3993 92 1520 15209 1498.70 400.45 400.45 300.34 922.75 1006.63 3697 3697 53 1281 1281
10 1273.89 300.34 300.34 225.25 738.20 805.31 3419 3419 32 1079 107911 1082.81 225.25 225.25 168.94 590.56 644.25 3158 3158 20 909 90912 920.39 168.94 168.94 126.71 472.45 515.40 2915 2915 13 765 76513 782.33 126.71 126.71 95.03 377.96 412.32 2688 2688 9 645 64514 664.98 95.03 95.03 71.27 302.37 329.85 2477 2477 6 543 54315 565.23 71.27 71.27 53.45 241.89 263.88 2282 2282 4 457 45716 480.45 53.45 53.45 40.09 193.51 211.11 2101 2101 3 385 38517 408.38 40.09 40.09 30.07 154.81 168.88 1934 1934 2 325 32518 347.12 30.07 30.07 22.55 123.85 135.11 1779 1779 2 273 27319 295.06 22.55 22.55 16.91 99.08 108.09 1636 1636 1 230 23020 250.80 16.91 16.91 12.68 79.26 86.47 1505 1505 1 194 19421 213.18 12.68 12.68 9.51 63.41 69.18 1383 1383 1 163 16322 181.20 9.51 9.51 7.14 50.73 55.34 1271 1271 1 138 13823 154.02 7.14 7.14 5.35 40.58 44.27 1168 1168 1 116 11624 130.92 5.35 5.35 4.01 32.47 35.42 1073 1073 1 98 9825 111.28 4.01 4.01 3.01 25.97 28.33 985 985 0 82 8226 94.59 3.01 3.01 2.26 20.78 22.67 905 905 0 69 6927 80.40 2.26 2.26 1.69 16.62 18.13 831 831 0 58 5828 68.34 1.69 1.69 1.27 13.30 14.51 762 762 0 49 4929 58.09 1.27 1.27 0.95 10.64 11.61 700 700 0 41 4130 49.38 0.95 0.95 0.71 8.51 9.28 642 642 0 35 3531 41.97 0.71 0.71 0.54 6.81 7.43 580 580 0 29 2932 35.67 0.54 0.54 0.40 5.45 5.94 520 520 0 25 2533 30.32 0.40 0.40 0.30 4.36 4.75 460 460 0 21 2134 25.77 0.30 0.30 0.23 3.49 3.80 420 420 0 18 1835 21.91 0.23 0.23 0.17 2.79 3.04 380 380 0 15 1536 18.62 0.17 0.17 0.13 2.23 2.43 320 320 0 12 1237 15.83 0.13 0.13 0.10 1.78 1.95 250 250 0 10 1038 13.45 0.10 0.10 0.07 1.43 1.56 150 150 0 9 9

APPENDIX G: STATIC VALIDATION SUMMARY REPORTS (YEAR 2008)
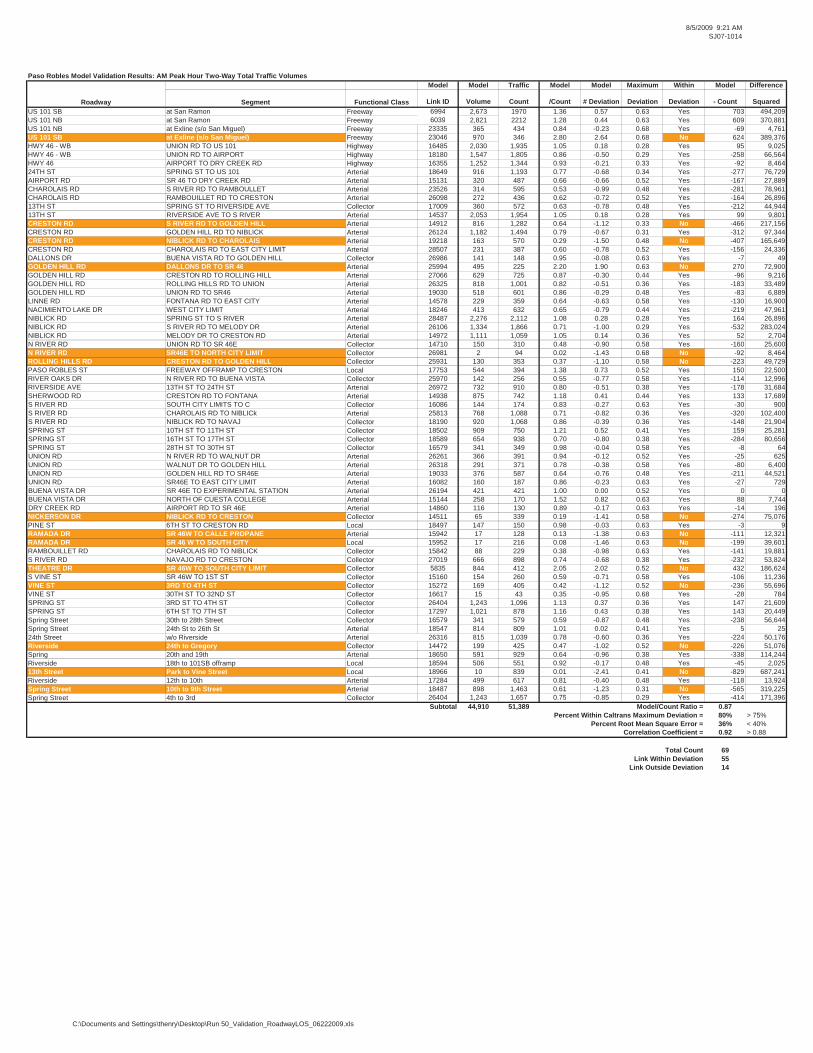
8/5/2009 9:21 AMSJ07-1014
Paso Robles Model Validation Results: AM Peak Hour Two-Way Total Traffic VolumesModel Model Traffic Model Model Maximum Within Model Difference
Roadway Segment Functional Class Link ID Volume Count /Count # Deviation Deviation Deviation - Count SquaredUS 101 SB at San Ramon Freeway 6994 2,673 1970 1.36 0.57 0.63 Yes 703 494,209US 101 NB at San Ramon Freeway 6039 2,821 2212 1.28 0.44 0.63 Yes 609 370,881US 101 NB at Exline (s/o San Miguel) Freeway 23335 365 434 0.84 -0.23 0.68 Yes -69 4,761US 101 SB at Exline (s/o San Miguel) Freeway 23046 970 346 2.80 2.64 0.68 No 624 389,376HWY 46 - WB UNION RD TO US 101 Highway 16485 2,030 1,935 1.05 0.18 0.28 Yes 95 9,025HWY 46 - WB UNION RD TO AIRPORT Highway 18180 1,547 1,805 0.86 -0.50 0.29 Yes -258 66,564HWY 46 AIRPORT TO DRY CREEK RD Highway 16355 1,252 1,344 0.93 -0.21 0.33 Yes -92 8,46424TH ST SPRING ST TO US 101 Arterial 18649 916 1,193 0.77 -0.68 0.34 Yes -277 76,729AIRPORT RD SR 46 TO DRY CREEK RD Arterial 15131 320 487 0.66 -0.66 0.52 Yes -167 27,889CHAROLAIS RD S RIVER RD TO RAMBOULLET Arterial 23526 314 595 0.53 -0.99 0.48 Yes -281 78,961CHAROLAIS RD RAMBOUILLET RD TO CRESTON Arterial 26098 272 436 0.62 -0.72 0.52 Yes -164 26,89613TH ST SPRING ST TO RIVERSIDE AVE Collector 17009 360 572 0.63 -0.78 0.48 Yes -212 44,94413TH ST RIVERSIDE AVE TO S RIVER Arterial 14537 2,053 1,954 1.05 0.18 0.28 Yes 99 9,801CRESTON RD S RIVER RD TO GOLDEN HILL Arterial 14912 816 1,282 0.64 -1.12 0.33 No -466 217,156CRESTON RD GOLDEN HILL RD TO NIBLICK Arterial 26124 1,182 1,494 0.79 -0.67 0.31 Yes -312 97,344CRESTON RD NIBLICK RD TO CHAROLAIS Arterial 19218 163 570 0.29 -1.50 0.48 No -407 165,649CRESTON RD CHAROLAIS RD TO EAST CITY LIMIT Arterial 28507 231 387 0.60 -0.78 0.52 Yes -156 24,336DALLONS DR BUENA VISTA RD TO GOLDEN HILL Collector 26986 141 148 0.95 -0.08 0.63 Yes -7 49GOLDEN HILL RD DALLONS DR TO SR 46 Arterial 25994 495 225 2.20 1.90 0.63 No 270 72,900GOLDEN HILL RD CRESTON RD TO ROLLING HILL Arterial 27066 629 725 0.87 -0.30 0.44 Yes -96 9,216GOLDEN HILL RD ROLLING HILLS RD TO UNION Arterial 26325 818 1,001 0.82 -0.51 0.36 Yes -183 33,489GOLDEN HILL RD UNION RD TO SR46 Arterial 19030 518 601 0.86 -0.29 0.48 Yes -83 6,889LINNE RD FONTANA RD TO EAST CITY Arterial 14578 229 359 0.64 -0.63 0.58 Yes -130 16,900NACIMIENTO LAKE DR WEST CITY LIMIT Arterial 18246 413 632 0.65 -0.79 0.44 Yes -219 47,961NIBLICK RD SPRING ST TO S RIVER Arterial 28487 2,276 2,112 1.08 0.28 0.28 Yes 164 26,896NIBLICK RD S RIVER RD TO MELODY DR Arterial 26106 1,334 1,866 0.71 -1.00 0.29 Yes -532 283,024NIBLICK RD MELODY DR TO CRESTON RD Arterial 14972 1,111 1,059 1.05 0.14 0.36 Yes 52 2,704N RIVER RD UNION RD TO SR 46E Collector 14710 150 310 0.48 -0.90 0.58 Yes -160 25,600N RIVER RD SR46E TO NORTH CITY LIMIT Collector 26981 2 94 0.02 -1.43 0.68 No -92 8,464ROLLING HILLS RD CRESTON RD TO GOLDEN HILL Collector 25931 130 353 0.37 -1.10 0.58 No -223 49,729PASO ROBLES ST FREEWAY OFFRAMP TO CRESTON Local 17753 544 394 1.38 0.73 0.52 Yes 150 22,500RIVER OAKS DR N RIVER RD TO BUENA VISTA Collector 25970 142 256 0.55 -0.77 0.58 Yes -114 12,996RIVERSIDE AVE 13TH ST TO 24TH ST Arterial 26972 732 910 0.80 -0.51 0.38 Yes -178 31,684SHERWOOD RD CRESTON RD TO FONTANA Arterial 14938 875 742 1.18 0.41 0.44 Yes 133 17,689S RIVER RD SOUTH CITY LIMITS TO C Collector 16086 144 174 0.83 -0.27 0.63 Yes -30 900S RIVER RD CHAROLAIS RD TO NIBLICk Arterial 25813 768 1,088 0.71 -0.82 0.36 Yes -320 102,400S RIVER RD NIBLICK RD TO NAVAJ Collector 18190 920 1,068 0.86 -0.39 0.36 Yes -148 21,904SPRING ST 10TH ST TO 11TH ST Collector 18502 909 750 1.21 0.52 0.41 Yes 159 25,281SPRING ST 16TH ST TO 17TH ST Collector 18589 654 938 0.70 -0.80 0.38 Yes -284 80,656SPRING ST 28TH ST TO 30TH ST Collector 16579 341 349 0.98 -0.04 0.58 Yes -8 64UNION RD N RIVER RD TO WALNUT DR Arterial 26261 366 391 0.94 -0.12 0.52 Yes -25 625UNION RD WALNUT DR TO GOLDEN HILL Arterial 26318 291 371 0.78 -0.38 0.58 Yes -80 6,400UNION RD GOLDEN HILL RD TO SR46E Arterial 19033 376 587 0.64 -0.76 0.48 Yes -211 44,521UNION RD SR46E TO EAST CITY LIMIT Arterial 16082 160 187 0.86 -0.23 0.63 Yes -27 729BUENA VISTA DR SR 46E TO EXPERIMENTAL STATION Arterial 26194 421 421 1.00 0.00 0.52 Yes 0 0BUENA VISTA DR NORTH OF CUESTA COLLEGE Arterial 15144 258 170 1.52 0.82 0.63 Yes 88 7,744DRY CREEK RD AIRPORT RD TO SR 46E Arterial 14860 116 130 0.89 -0.17 0.63 Yes -14 196NICKERSON DR NIBLICK RD TO CRESTON Collector 14511 65 339 0.19 -1.41 0.58 No -274 75,076PINE ST 6TH ST TO CRESTON RD Local 18497 147 150 0.98 -0.03 0.63 Yes -3 9RAMADA DR SR 46W TO CALLE PROPANE Arterial 15942 17 128 0.13 -1.38 0.63 No -111 12,321RAMADA DR SR 46 W TO SOUTH CITY Local 15952 17 216 0.08 -1.46 0.63 No -199 39,601RAMBOUILLET RD CHAROLAIS RD TO NIBLICK Collector 15842 88 229 0.38 -0.98 0.63 Yes -141 19,881S RIVER RD NAVAJO RD TO CRESTON Collector 27019 666 898 0.74 -0.68 0.38 Yes -232 53,824THEATRE DR SR 46W TO SOUTH CITY LIMIT Collector 5835 844 412 2.05 2.02 0.52 No 432 186,624S VINE ST SR 46W TO 1ST ST Collector 15160 154 260 0.59 -0.71 0.58 Yes -106 11,236VINE ST 3RD TO 4TH ST Collector 15272 169 405 0.42 -1.12 0.52 No -236 55,696VINE ST 30TH ST TO 32ND ST Collector 16617 15 43 0.35 -0.95 0.68 Yes -28 784SPRING ST 3RD ST TO 4TH ST Collector 26404 1,243 1,096 1.13 0.37 0.36 Yes 147 21,609SPRING ST 6TH ST TO 7TH ST Collector 17297 1,021 878 1.16 0.43 0.38 Yes 143 20,449Spring Street 30th to 28th Street Collector 16579 341 579 0.59 -0.87 0.48 Yes -238 56,644Spring Street 24th St to 26th St Arterial 18547 814 809 1.01 0.02 0.41 Yes 5 2524th Street w/o Riverside Arterial 26316 815 1,039 0.78 -0.60 0.36 Yes -224 50,176Riverside 24th to Gregory Collector 14472 199 425 0.47 -1.02 0.52 No -226 51,076Spring 20th and 19th Arterial 18650 591 929 0.64 -0.96 0.38 Yes -338 114,244Riverside 18th to 101SB offramp Local 18594 506 551 0.92 -0.17 0.48 Yes -45 2,02513th Street Park to Vine Street Local 18966 10 839 0.01 -2.41 0.41 No -829 687,241Riverside 12th to 10th Arterial 17284 499 617 0.81 -0.40 0.48 Yes -118 13,924Spring Street 10th to 9th Street Arterial 18487 898 1,463 0.61 -1.23 0.31 No -565 319,225Spring Street 4th to 3rd Collector 26404 1,243 1,657 0.75 -0.85 0.29 Yes -414 171,396
Subtotal 44,910 51,389 Model/Count Ratio = 0.87Percent Within Caltrans Maximum Deviation = 80% > 75%
Percent Root Mean Square Error = 36% < 40%Correlation Coefficient = 0.92 > 0.88
Total Count 69Link Within Deviation 55
Link Outside Deviation 14
C:\Documents and Settings\thenry\Desktop\Run 50_Validation_RoadwayLOS_06222009.xls
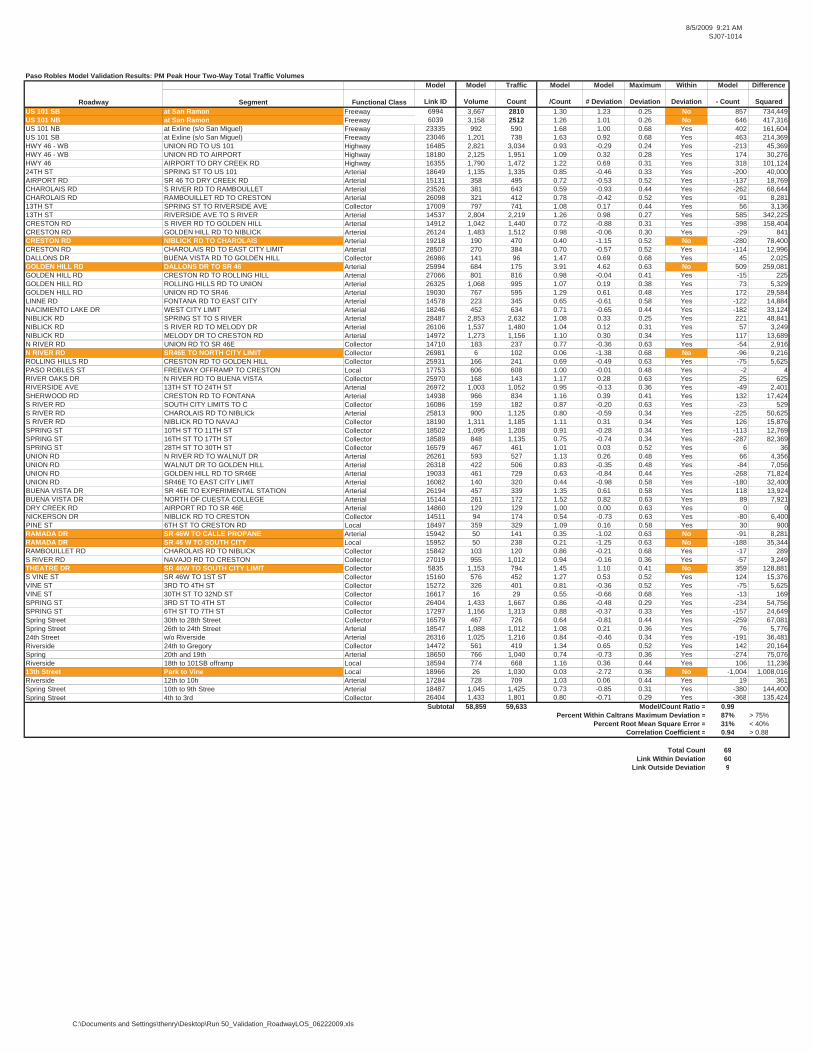
8/5/2009 9:21 AMSJ07-1014
Paso Robles Model Validation Results: PM Peak Hour Two-Way Total Traffic VolumesModel Model Traffic Model Model Maximum Within Model Difference
Roadway Segment Functional Class Link ID Volume Count /Count # Deviation Deviation Deviation - Count SquaredUS 101 SB at San Ramon Freeway 6994 3,667 2810 1.30 1.23 0.25 No 857 734,449US 101 NB at San Ramon Freeway 6039 3,158 2512 1.26 1.01 0.26 No 646 417,316US 101 NB at Exline (s/o San Miguel) Freeway 23335 992 590 1.68 1.00 0.68 Yes 402 161,604US 101 SB at Exline (s/o San Miguel) Freeway 23046 1,201 738 1.63 0.92 0.68 Yes 463 214,369HWY 46 - WB UNION RD TO US 101 Highway 16485 2,821 3,034 0.93 -0.29 0.24 Yes -213 45,369HWY 46 - WB UNION RD TO AIRPORT Highway 18180 2,125 1,951 1.09 0.32 0.28 Yes 174 30,276HWY 46 AIRPORT TO DRY CREEK RD Highway 16355 1,790 1,472 1.22 0.69 0.31 Yes 318 101,12424TH ST SPRING ST TO US 101 Arterial 18649 1,135 1,335 0.85 -0.46 0.33 Yes -200 40,000AIRPORT RD SR 46 TO DRY CREEK RD Arterial 15131 358 495 0.72 -0.53 0.52 Yes -137 18,769CHAROLAIS RD S RIVER RD TO RAMBOULLET Arterial 23526 381 643 0.59 -0.93 0.44 Yes -262 68,644CHAROLAIS RD RAMBOUILLET RD TO CRESTON Arterial 26098 321 412 0.78 -0.42 0.52 Yes -91 8,28113TH ST SPRING ST TO RIVERSIDE AVE Collector 17009 797 741 1.08 0.17 0.44 Yes 56 3,13613TH ST RIVERSIDE AVE TO S RIVER Arterial 14537 2,804 2,219 1.26 0.98 0.27 Yes 585 342,225CRESTON RD S RIVER RD TO GOLDEN HILL Arterial 14912 1,042 1,440 0.72 -0.88 0.31 Yes -398 158,404CRESTON RD GOLDEN HILL RD TO NIBLICK Arterial 26124 1,483 1,512 0.98 -0.06 0.30 Yes -29 841CRESTON RD NIBLICK RD TO CHAROLAIS Arterial 19218 190 470 0.40 -1.15 0.52 No -280 78,400CRESTON RD CHAROLAIS RD TO EAST CITY LIMIT Arterial 28507 270 384 0.70 -0.57 0.52 Yes -114 12,996DALLONS DR BUENA VISTA RD TO GOLDEN HILL Collector 26986 141 96 1.47 0.69 0.68 Yes 45 2,025GOLDEN HILL RD DALLONS DR TO SR 46 Arterial 25994 684 175 3.91 4.62 0.63 No 509 259,081GOLDEN HILL RD CRESTON RD TO ROLLING HILL Arterial 27066 801 816 0.98 -0.04 0.41 Yes -15 225GOLDEN HILL RD ROLLING HILLS RD TO UNION Arterial 26325 1,068 995 1.07 0.19 0.38 Yes 73 5,329GOLDEN HILL RD UNION RD TO SR46 Arterial 19030 767 595 1.29 0.61 0.48 Yes 172 29,584LINNE RD FONTANA RD TO EAST CITY Arterial 14578 223 345 0.65 -0.61 0.58 Yes -122 14,884NACIMIENTO LAKE DR WEST CITY LIMIT Arterial 18246 452 634 0.71 -0.65 0.44 Yes -182 33,124NIBLICK RD SPRING ST TO S RIVER Arterial 28487 2,853 2,632 1.08 0.33 0.25 Yes 221 48,841NIBLICK RD S RIVER RD TO MELODY DR Arterial 26106 1,537 1,480 1.04 0.12 0.31 Yes 57 3,249NIBLICK RD MELODY DR TO CRESTON RD Arterial 14972 1,273 1,156 1.10 0.30 0.34 Yes 117 13,689N RIVER RD UNION RD TO SR 46E Collector 14710 183 237 0.77 -0.36 0.63 Yes -54 2,916N RIVER RD SR46E TO NORTH CITY LIMIT Collector 26981 6 102 0.06 -1.38 0.68 No -96 9,216ROLLING HILLS RD CRESTON RD TO GOLDEN HILL Collector 25931 166 241 0.69 -0.49 0.63 Yes -75 5,625PASO ROBLES ST FREEWAY OFFRAMP TO CRESTON Local 17753 606 608 1.00 -0.01 0.48 Yes -2 4RIVER OAKS DR N RIVER RD TO BUENA VISTA Collector 25970 168 143 1.17 0.28 0.63 Yes 25 625RIVERSIDE AVE 13TH ST TO 24TH ST Arterial 26972 1,003 1,052 0.95 -0.13 0.36 Yes -49 2,401SHERWOOD RD CRESTON RD TO FONTANA Arterial 14938 966 834 1.16 0.39 0.41 Yes 132 17,424S RIVER RD SOUTH CITY LIMITS TO C Collector 16086 159 182 0.87 -0.20 0.63 Yes -23 529S RIVER RD CHAROLAIS RD TO NIBLICk Arterial 25813 900 1,125 0.80 -0.59 0.34 Yes -225 50,625S RIVER RD NIBLICK RD TO NAVAJ Collector 18190 1,311 1,185 1.11 0.31 0.34 Yes 126 15,876SPRING ST 10TH ST TO 11TH ST Collector 18502 1,095 1,208 0.91 -0.28 0.34 Yes -113 12,769SPRING ST 16TH ST TO 17TH ST Collector 18589 848 1,135 0.75 -0.74 0.34 Yes -287 82,369SPRING ST 28TH ST TO 30TH ST Collector 16579 467 461 1.01 0.03 0.52 Yes 6 36UNION RD N RIVER RD TO WALNUT DR Arterial 26261 593 527 1.13 0.26 0.48 Yes 66 4,356UNION RD WALNUT DR TO GOLDEN HILL Arterial 26318 422 506 0.83 -0.35 0.48 Yes -84 7,056UNION RD GOLDEN HILL RD TO SR46E Arterial 19033 461 729 0.63 -0.84 0.44 Yes -268 71,824UNION RD SR46E TO EAST CITY LIMIT Arterial 16082 140 320 0.44 -0.98 0.58 Yes -180 32,400BUENA VISTA DR SR 46E TO EXPERIMENTAL STATION Arterial 26194 457 339 1.35 0.61 0.58 Yes 118 13,924BUENA VISTA DR NORTH OF CUESTA COLLEGE Arterial 15144 261 172 1.52 0.82 0.63 Yes 89 7,921DRY CREEK RD AIRPORT RD TO SR 46E Arterial 14860 129 129 1.00 0.00 0.63 Yes 0 0NICKERSON DR NIBLICK RD TO CRESTON Collector 14511 94 174 0.54 -0.73 0.63 Yes -80 6,400PINE ST 6TH ST TO CRESTON RD Local 18497 359 329 1.09 0.16 0.58 Yes 30 900RAMADA DR SR 46W TO CALLE PROPANE Arterial 15942 50 141 0.35 -1.02 0.63 No -91 8,281RAMADA DR SR 46 W TO SOUTH CITY Local 15952 50 238 0.21 -1.25 0.63 No -188 35,344RAMBOUILLET RD CHAROLAIS RD TO NIBLICK Collector 15842 103 120 0.86 -0.21 0.68 Yes -17 289S RIVER RD NAVAJO RD TO CRESTON Collector 27019 955 1,012 0.94 -0.16 0.36 Yes -57 3,249THEATRE DR SR 46W TO SOUTH CITY LIMIT Collector 5835 1,153 794 1.45 1.10 0.41 No 359 128,881S VINE ST SR 46W TO 1ST ST Collector 15160 576 452 1.27 0.53 0.52 Yes 124 15,376VINE ST 3RD TO 4TH ST Collector 15272 326 401 0.81 -0.36 0.52 Yes -75 5,625VINE ST 30TH ST TO 32ND ST Collector 16617 16 29 0.55 -0.66 0.68 Yes -13 169SPRING ST 3RD ST TO 4TH ST Collector 26404 1,433 1,667 0.86 -0.48 0.29 Yes -234 54,756SPRING ST 6TH ST TO 7TH ST Collector 17297 1,156 1,313 0.88 -0.37 0.33 Yes -157 24,649Spring Street 30th to 28th Street Collector 16579 467 726 0.64 -0.81 0.44 Yes -259 67,081Spring Street 26th to 24th Street Arterial 18547 1,088 1,012 1.08 0.21 0.36 Yes 76 5,77624th Street w/o Riverside Arterial 26316 1,025 1,216 0.84 -0.46 0.34 Yes -191 36,481Riverside 24th to Gregory Collector 14472 561 419 1.34 0.65 0.52 Yes 142 20,164Spring 20th and 19th Arterial 18650 766 1,040 0.74 -0.73 0.36 Yes -274 75,076Riverside 18th to 101SB offramp Local 18594 774 668 1.16 0.36 0.44 Yes 106 11,23613th Street Park to Vine Local 18966 26 1,030 0.03 -2.72 0.36 No -1,004 1,008,016Riverside 12th to 10h Arterial 17284 728 709 1.03 0.06 0.44 Yes 19 361Spring Street 10th to 9th Stree Arterial 18487 1,045 1,425 0.73 -0.85 0.31 Yes -380 144,400Spring Street 4th to 3rd Collector 26404 1,433 1,801 0.80 -0.71 0.29 Yes -368 135,424
Subtotal 58,859 59,633 Model/Count Ratio = 0.99Percent Within Caltrans Maximum Deviation = 87% > 75%
Percent Root Mean Square Error = 31% < 40%Correlation Coefficient = 0.94 > 0.88
Total Count 69Link Within Deviation 60
Link Outside Deviation 9
C:\Documents and Settings\thenry\Desktop\Run 50_Validation_RoadwayLOS_06222009.xls
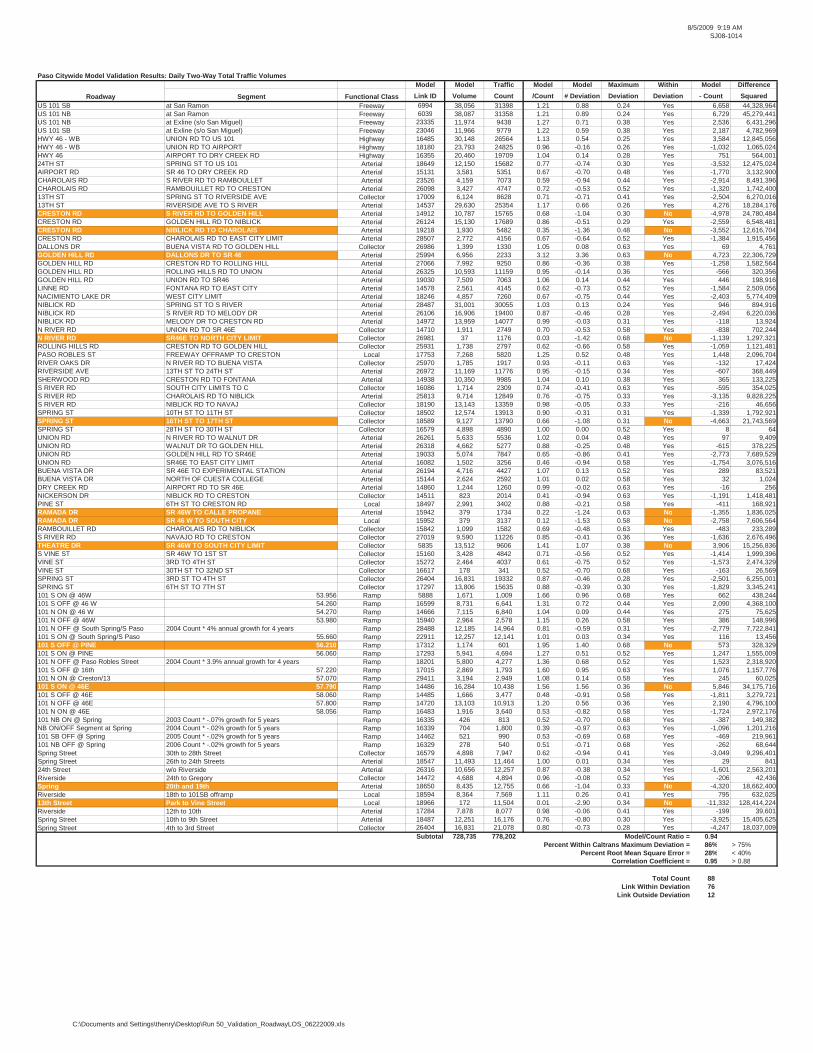
8/5/2009 9:19 AMSJ08-1014
Paso Citywide Model Validation Results: Daily Two-Way Total Traffic VolumesModel Model Traffic Model Model Maximum Within Model Difference
Roadway Segment Functional Class Link ID Volume Count /Count # Deviation Deviation Deviation - Count SquaredUS 101 SB at San Ramon Freeway 6994 38,056 31398 1.21 0.88 0.24 Yes 6,658 44,328,964US 101 NB at San Ramon Freeway 6039 38,087 31358 1.21 0.89 0.24 Yes 6,729 45,279,441US 101 NB at Exline (s/o San Miguel) Freeway 23335 11,974 9438 1.27 0.71 0.38 Yes 2,536 6,431,296US 101 SB at Exline (s/o San Miguel) Freeway 23046 11,966 9779 1.22 0.59 0.38 Yes 2,187 4,782,969HWY 46 - WB UNION RD TO US 101 Highway 16485 30,148 26564 1.13 0.54 0.25 Yes 3,584 12,845,056HWY 46 - WB UNION RD TO AIRPORT Highway 18180 23,793 24825 0.96 -0.16 0.26 Yes -1,032 1,065,024HWY 46 AIRPORT TO DRY CREEK RD Highway 16355 20,460 19709 1.04 0.14 0.28 Yes 751 564,00124TH ST SPRING ST TO US 101 Arterial 18649 12,150 15682 0.77 -0.74 0.30 Yes -3,532 12,475,024AIRPORT RD SR 46 TO DRY CREEK RD Arterial 15131 3,581 5351 0.67 -0.70 0.48 Yes -1,770 3,132,900CHAROLAIS RD S RIVER RD TO RAMBOULLET Arterial 23526 4,159 7073 0.59 -0.94 0.44 Yes -2,914 8,491,396CHAROLAIS RD RAMBOUILLET RD TO CRESTON Arterial 26098 3,427 4747 0.72 -0.53 0.52 Yes -1,320 1,742,40013TH ST SPRING ST TO RIVERSIDE AVE Collector 17009 6,124 8628 0.71 -0.71 0.41 Yes -2,504 6,270,01613TH ST RIVERSIDE AVE TO S RIVER Arterial 14537 29,630 25354 1.17 0.66 0.26 Yes 4,276 18,284,176CRESTON RD S RIVER RD TO GOLDEN HILL Arterial 14912 10,787 15765 0.68 -1.04 0.30 No -4,978 24,780,484CRESTON RD GOLDEN HILL RD TO NIBLICK Arterial 26124 15,130 17689 0.86 -0.51 0.29 Yes -2,559 6,548,481CRESTON RD NIBLICK RD TO CHAROLAIS Arterial 19218 1,930 5482 0.35 -1.36 0.48 No -3,552 12,616,704CRESTON RD CHAROLAIS RD TO EAST CITY LIMIT Arterial 28507 2,772 4156 0.67 -0.64 0.52 Yes -1,384 1,915,456DALLONS DR BUENA VISTA RD TO GOLDEN HILL Collector 26986 1,399 1330 1.05 0.08 0.63 Yes 69 4,761GOLDEN HILL RD DALLONS DR TO SR 46 Arterial 25994 6,956 2233 3.12 3.36 0.63 No 4,723 22,306,729GOLDEN HILL RD CRESTON RD TO ROLLING HILL Arterial 27066 7,992 9250 0.86 -0.36 0.38 Yes -1,258 1,582,564GOLDEN HILL RD ROLLING HILLS RD TO UNION Arterial 26325 10,593 11159 0.95 -0.14 0.36 Yes -566 320,356GOLDEN HILL RD UNION RD TO SR46 Arterial 19030 7,509 7063 1.06 0.14 0.44 Yes 446 198,916LINNE RD FONTANA RD TO EAST CITY Arterial 14578 2,561 4145 0.62 -0.73 0.52 Yes -1,584 2,509,056NACIMIENTO LAKE DR WEST CITY LIMIT Arterial 18246 4,857 7260 0.67 -0.75 0.44 Yes -2,403 5,774,409NIBLICK RD SPRING ST TO S RIVER Arterial 28487 31,001 30055 1.03 0.13 0.24 Yes 946 894,916NIBLICK RD S RIVER RD TO MELODY DR Arterial 26106 16,906 19400 0.87 -0.46 0.28 Yes -2,494 6,220,036NIBLICK RD MELODY DR TO CRESTON RD Arterial 14972 13,959 14077 0.99 -0.03 0.31 Yes -118 13,924N RIVER RD UNION RD TO SR 46E Collector 14710 1,911 2749 0.70 -0.53 0.58 Yes -838 702,244N RIVER RD SR46E TO NORTH CITY LIMIT Collector 26981 37 1176 0.03 -1.42 0.68 No -1,139 1,297,321ROLLING HILLS RD CRESTON RD TO GOLDEN HILL Collector 25931 1,738 2797 0.62 -0.66 0.58 Yes -1,059 1,121,481PASO ROBLES ST FREEWAY OFFRAMP TO CRESTON Local 17753 7,268 5820 1.25 0.52 0.48 Yes 1,448 2,096,704RIVER OAKS DR N RIVER RD TO BUENA VISTA Collector 25970 1,785 1917 0.93 -0.11 0.63 Yes -132 17,424RIVERSIDE AVE 13TH ST TO 24TH ST Arterial 26972 11,169 11776 0.95 -0.15 0.34 Yes -607 368,449SHERWOOD RD CRESTON RD TO FONTANA Arterial 14938 10,350 9985 1.04 0.10 0.38 Yes 365 133,225S RIVER RD SOUTH CITY LIMITS TO C Collector 16086 1,714 2309 0.74 -0.41 0.63 Yes -595 354,025S RIVER RD CHAROLAIS RD TO NIBLICk Arterial 25813 9,714 12849 0.76 -0.75 0.33 Yes -3,135 9,828,225S RIVER RD NIBLICK RD TO NAVAJ Collector 18190 13,143 13359 0.98 -0.05 0.33 Yes -216 46,656SPRING ST 10TH ST TO 11TH ST Collector 18502 12,574 13913 0.90 -0.31 0.31 Yes -1,339 1,792,921SPRING ST 16TH ST TO 17TH ST Collector 18589 9,127 13790 0.66 -1.08 0.31 No -4,663 21,743,569SPRING ST 28TH ST TO 30TH ST Collector 16579 4,898 4890 1.00 0.00 0.52 Yes 8 64UNION RD N RIVER RD TO WALNUT DR Arterial 26261 5,633 5536 1.02 0.04 0.48 Yes 97 9,409UNION RD WALNUT DR TO GOLDEN HILL Arterial 26318 4,662 5277 0.88 -0.25 0.48 Yes -615 378,225UNION RD GOLDEN HILL RD TO SR46E Arterial 19033 5,074 7847 0.65 -0.86 0.41 Yes -2,773 7,689,529UNION RD SR46E TO EAST CITY LIMIT Arterial 16082 1,502 3256 0.46 -0.94 0.58 Yes -1,754 3,076,516BUENA VISTA DR SR 46E TO EXPERIMENTAL STATION Arterial 26194 4,716 4427 1.07 0.13 0.52 Yes 289 83,521BUENA VISTA DR NORTH OF CUESTA COLLEGE Arterial 15144 2,624 2592 1.01 0.02 0.58 Yes 32 1,024DRY CREEK RD AIRPORT RD TO SR 46E Arterial 14860 1,244 1260 0.99 -0.02 0.63 Yes -16 256NICKERSON DR NIBLICK RD TO CRESTON Collector 14511 823 2014 0.41 -0.94 0.63 Yes -1,191 1,418,481PINE ST 6TH ST TO CRESTON RD Local 18497 2,991 3402 0.88 -0.21 0.58 Yes -411 168,921RAMADA DR SR 46W TO CALLE PROPANE Arterial 15942 379 1734 0.22 -1.24 0.63 No -1,355 1,836,025RAMADA DR SR 46 W TO SOUTH CITY Local 15952 379 3137 0.12 -1.53 0.58 No -2,758 7,606,564RAMBOUILLET RD CHAROLAIS RD TO NIBLICK Collector 15842 1,099 1582 0.69 -0.48 0.63 Yes -483 233,289S RIVER RD NAVAJO RD TO CRESTON Collector 27019 9,590 11226 0.85 -0.41 0.36 Yes -1,636 2,676,496THEATRE DR SR 46W TO SOUTH CITY LIMIT Collector 5835 13,512 9606 1.41 1.07 0.38 No 3,906 15,256,836S VINE ST SR 46W TO 1ST ST Collector 15160 3,428 4842 0.71 -0.56 0.52 Yes -1,414 1,999,396VINE ST 3RD TO 4TH ST Collector 15272 2,464 4037 0.61 -0.75 0.52 Yes -1,573 2,474,329VINE ST 30TH ST TO 32ND ST Collector 16617 178 341 0.52 -0.70 0.68 Yes -163 26,569SPRING ST 3RD ST TO 4TH ST Collector 26404 16,831 19332 0.87 -0.46 0.28 Yes -2,501 6,255,001SPRING ST 6TH ST TO 7TH ST Collector 17297 13,806 15635 0.88 -0.39 0.30 Yes -1,829 3,345,241101 S ON @ 46W 53.956 Ramp 5888 1,671 1,009 1.66 0.96 0.68 Yes 662 438,244101 S OFF @ 46 W 54.260 Ramp 16599 8,731 6,641 1.31 0.72 0.44 Yes 2,090 4,368,100101 N ON @ 46 W 54.270 Ramp 14666 7,115 6,840 1.04 0.09 0.44 Yes 275 75,625101 N OFF @ 46W 53.980 Ramp 15940 2,964 2,578 1.15 0.26 0.58 Yes 386 148,996101 N OFF @ South Spring/S Paso 2004 Count * 4% annual growth for 4 years Ramp 28488 12,185 14,964 0.81 -0.59 0.31 Yes -2,779 7,722,841101 S ON @ South Spring/S Paso 55.660 Ramp 22911 12,257 12,141 1.01 0.03 0.34 Yes 116 13,456101 S OFF @ PINE 56.210 Ramp 17312 1,174 601 1.95 1.40 0.68 No 573 328,329101 S ON @ PINE 56.060 Ramp 17293 5,941 4,694 1.27 0.51 0.52 Yes 1,247 1,555,009101 N OFF @ Paso Robles Street 2004 Count * 3.9% annual growth for 4 years Ramp 18201 5,800 4,277 1.36 0.68 0.52 Yes 1,523 2,318,920101 S OFF @ 16th 57.220 Ramp 17015 2,869 1,793 1.60 0.95 0.63 Yes 1,076 1,157,776101 N ON @ Creston/13 57.070 Ramp 29411 3,194 2,949 1.08 0.14 0.58 Yes 245 60,025101 S ON @ 46E 57.790 Ramp 14486 16,284 10,438 1.56 1.56 0.36 No 5,846 34,175,716101 S OFF @ 46E 58.060 Ramp 14485 1,666 3,477 0.48 -0.91 0.58 Yes -1,811 3,279,721101 N OFF @ 46E 57.800 Ramp 14720 13,103 10,913 1.20 0.56 0.36 Yes 2,190 4,796,100101 N ON @ 46E 58.056 Ramp 16483 1,916 3,640 0.53 -0.82 0.58 Yes -1,724 2,972,176101 NB ON @ Spring 2003 Count * -.07% growth for 5 years Ramp 16335 426 813 0.52 -0.70 0.68 Yes -387 149,382NB ON/OFF Segment at Spring 2004 Count * -.02% growth for 5 years Ramp 16339 704 1,800 0.39 -0.97 0.63 Yes -1,096 1,201,216101 SB OFF @ Spring 2005 Count * -.02% growth for 5 years Ramp 14462 521 990 0.53 -0.69 0.68 Yes -469 219,961101 NB OFF @ Spring 2006 Count * -.02% growth for 5 years Ramp 16329 278 540 0.51 -0.71 0.68 Yes -262 68,644Spring Street 30th to 28th Street Collector 16579 4,898 7,947 0.62 -0.94 0.41 Yes -3,049 9,296,401Spring Street 26th to 24th Streets Arterial 18547 11,493 11,464 1.00 0.01 0.34 Yes 29 84124th Street w/o Riverside Arterial 26316 10,656 12,257 0.87 -0.38 0.34 Yes -1,601 2,563,201Riverside 24th to Gregory Collector 14472 4,688 4,894 0.96 -0.08 0.52 Yes -206 42,436Spring 20th and 19th Arterial 18650 8,435 12,755 0.66 -1.04 0.33 No -4,320 18,662,400Riverside 18th to 101SB offramp Local 18594 8,364 7,569 1.11 0.26 0.41 Yes 795 632,02513th Street Park to Vine Street Local 18966 172 11,504 0.01 -2.90 0.34 No -11,332 128,414,224Riverside 12th to 10th Arterial 17284 7,878 8,077 0.98 -0.06 0.41 Yes -199 39,601Spring Street 10th to 9th Street Arterial 18487 12,251 16,176 0.76 -0.80 0.30 Yes -3,925 15,405,625Spring Street 4th to 3rd Street Collector 26404 16,831 21,078 0.80 -0.73 0.28 Yes -4,247 18,037,009
Subtotal 728,735 778,202 Model/Count Ratio = 0.94Percent Within Caltrans Maximum Deviation = 86% > 75%
Percent Root Mean Square Error = 28% < 40%Correlation Coefficient = 0.95 > 0.88
Total Count 88Link Within Deviation 76
Link Outside Deviation 12
C:\Documents and Settings\thenry\Desktop\Run 50_Validation_RoadwayLOS_06222009.xls