Embed Size (px)
Citation preview

TRAFFIC IMPACT STUDY
For
City Creek Thornton, Colorado
September 2016
Prepared for:
Jansen Strawn Consulting Engineers 45 West 2nd Avenue
Denver, Colorado 80223
Prepared by:
8703 Yates Drive, Suite 210 Westminster, Colorado 80031
(303) 458-9798
Project Manager/Engineer: Mike Rocha, TSOS, TOPS
Engineer in Responsible Charge:
Fred Lantz, PE
16-07565
9/13/2016

City Creek - Traffic Impact Study September 2016
SM ROCHA, LLC - Traffic and Transportation Consultants Page 1
I. Introduction
Traffic Impact Study Conformance Statement We (SM ROCHA, LLC) acknowledge that the City of Thornton’s review of this study is only for general conformance with submittal requirements, current design criteria, and standard engineering principles and practices. We are also aware of the provisions of Section 18 of the City Code of the City of Thornton. Project Overview This traffic impact study addresses the capacity, geometric, and control requirements associated with the mixed-use development entitled City Creek. This proposed mixed-use development is envisioned to include a variety of residential, self-storage, office, light industrial, and school land uses. The development site is located on both sides of 152nd Avenue in Adams County, Colorado (to be annexed into the City of Thornton). The development site if further bound to the west by Washington Street, E-470 on the north, Big Dry Creek on the east, and the future 148th Avenue on the south. It is acknowledged that the development must go through procedures of rezoning, subdivision and site development permitting before land uses assumed in this study can become formalized and begin to operate. It is only during the later procedures that true traffic impacts from the development site can be analyzed. Briefly described, rezoning entails the change of uses allowed on a property, subdivision breaks down larger parcels of land to developable sizes, and site development permit is the review of real site construction. As actual uses within the development become defined over time, traffic characteristics and influencing factors considered in this study are subject to change and will need to be updated. This study is intended to serve as an overall guide that can be used for any order of site development that occurs. The combination of development land use areas presented herein are assumed and analyzed to estimate projected traffic levels through Year 2036. Study Area Boundaries The study area to be examined in this analysis encompasses the Washington Street intersections with 144th Avenue, 152nd Avenue. Also included in the study area is the intersection of 152nd Avenue and York Street, and proposed site access. Stated intersections are collectively referred to as “studied intersections”. These studied intersections were selected because of their key proximity to the development site. It is acknowledged that other intersections are adjacent to the overall development site and could be considered within studied intersections. However, it would be impracticable to analyze other intersections to any degree of certainty since no specific land uses, density or phasing is yet established for the overall development. Figure 1 shows location of the site and study intersections.

152n
d Ave
nue
Deve
lopm
ent
Site
York Street
Washington StreetWashington Street
Septe
mber
2016
CITY
CRE
EKTr
affic
Impa
ct St
udy
SM R
OCHA
, LLC
Traf
fic a
nd T
rans
porta
tion
Cons
ultan
tsSe
ptemb
er 20
16
CITY
CRE
EKTr
affic
Impa
ct St
udy
SM R
OCHA
, LLC
Traf
fic a
nd T
rans
porta
tion
Cons
ultan
tsPa
ge 2
Figu
re 1
SITE
LOC
ATIO
N
Not to S
cale

City Creek - Traffic Impact Study September 2016
SM ROCHA, LLC - Traffic and Transportation Consultants Page 3
Development Site Description Land for the development is currently used for agricultural purposes. Surrounding land uses are predominantly residential and include a mix of commercial or retail uses. City Creek is a mixed-use development assumed to entail a light industrial and office park environment with supporting school and residential uses. The light industrial, office park and school (K through 8 for an estimated 950 students) area is anticipated on the north side of 152nd Avenue. The residential portion of development occurring on the south side of 152nd Avenue is assumed to include approximately 300 single-family detached homes, 340 single-family attached homes, and 385 multi-family homes. Also located on the south side of 152nd Avenue is approximately six acres of land to be used for future self-storage and fire station development. Primary development access is assumed at the following locations:
Four full movement accesses on Washington Street (one of which is the creation of 148th Avenue).
Three full movement accesses on 152nd Avenue. As earlier discussed, no specific plans or time-line for development is known at this time. For purpose of this study, it is assumed that development build out would be completed by end of Year 2018. It is, however, likely that only a small percentage of development would occur by Year 2018 due to current uncertainty of specific land uses. It is acknowledged that the exact use of assumed intersections, including intersection geometry and applicable operation mitigation, is to be finalized upon specific site development. As such, more specific traffic analyses or studies will be necessary as phases, individual parcels, subdivisions, or developments are proposed with actual land uses, densities, or site plans. This will help determine when transportation improvements identified within this overall study are needed, or if additional improvements are needed to mitigate the proposed development’s impact. Additionally, the more specific traffic analyses or studies, if required, can assist a proposal to address concerns that were not able to be evaluated in this overall study. A conceptual land use plan, as prepared Jansen Strawn Consulting Engineers, is shown on Figure 2 and is provided for illustrative purposes. The City’s current land use map, including current projects and existing zoning, is included for reference in Appendix A. City required information regarding trip generation rates, short and long-term traffic analysis, level of service results, site traffic distribution and assignment, and all associated tables or figures are provided in later sections of this traffic study.

Septe
mber
2016
CITY
CRE
EKTr
affic
Impa
ct St
udy
SM R
OCHA
, LLC
Traf
fic a
nd T
rans
porta
tion
Cons
ultan
tsPa
ge 4
Figu
re 2
SITE
PLA
N
Not to S
cale

City Creek - Traffic Impact Study September 2016
SM ROCHA, LLC - Traffic and Transportation Consultants Page 5
Existing and Committed Surface Transportation Network Within the study area, Washington Street and 152nd Avenue are the primary roadways that accommodate traffic to and from the assumed development. Secondary roadway includes the future 148th Avenue. A brief description of each roadway is provided below:
Washington Street is a north/south arterial roadway having a variety of through lane and turn lane configurations north of 144th Avenue. A posted speed of 55 MPH is provided. The City of Thornton Transportation Plan projects a long-term roadway volume is nearly 27,000 vehicles per day (vpd), with a forecasted buildout traffic volume of 67,000 vpd. North of 152nd Avenue, Washington Street has approximately 21,000 vpd projected for long-term roadway volume, and 58,000 vpd for a forecasted buildout traffic volume. The north portion of Washington Street has a posted speed of 45 MPH. 152nd Avenue is an east/west arterial roadway with one through lane in each direction, and a mix of left-turn and right-turn lane configurations. The City Transportation Plan projects that future roadway volumes are to be over 17,000 vpd. Forecasted buildout traffic volumes are described at 60,000 vpd. The posted speed limit in the vicinity of the site is 55 MPH. 148th Avenue is a future east/west roadway. This portion of 148th Avenue is expected to have limited east/west connectivity due to existing constraints of Interstate 25 to the west and Big Dry Creek floodplain to the east. As such, 148th Avenue is assumed to be designed as a collector roadway with two thorough lanes and shared center left turn lane. The posted speed of 148th Avenue is assumed to range between 30 MPH and 35 MPH.
The Washington Street intersection with 144th Avenue is signalized. All other study intersections operate under a stop-controlled condition. A stop-controlled intersection is defined as a roadway intersection where vehicle rights-of-way are controlled by one or more “STOP” signs. Comparison of the existing roadway cross-section of Washington Street and 152nd Avenue to the City Transportation Plan vision concludes that each roadway is not built to its ultimate width for accommodation of future regional transportation demands. Each roadway is envisioned to become a six-lane (three through lanes in each direction) roadway in the long-term future with an ultimate right-of-way of 150 feet. No specific regional improvements for 152nd Avenue or Washington Street are known to be committed at this time. However, improvements to Washington Street and 152nd Avenue for completion of ultimate roadway cross-sections are anticipated as adjacent development of this site occurs.

City Creek - Traffic Impact Study September 2016
SM ROCHA, LLC - Traffic and Transportation Consultants Page 6
II. Existing Traffic Conditions
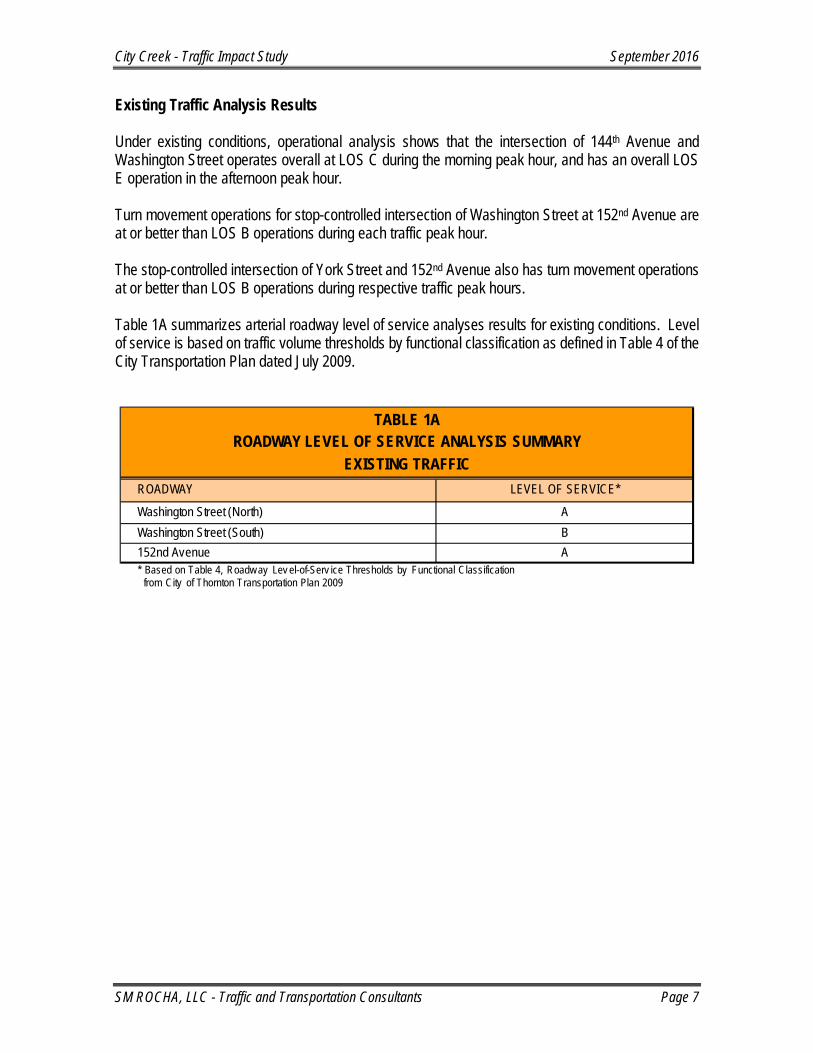
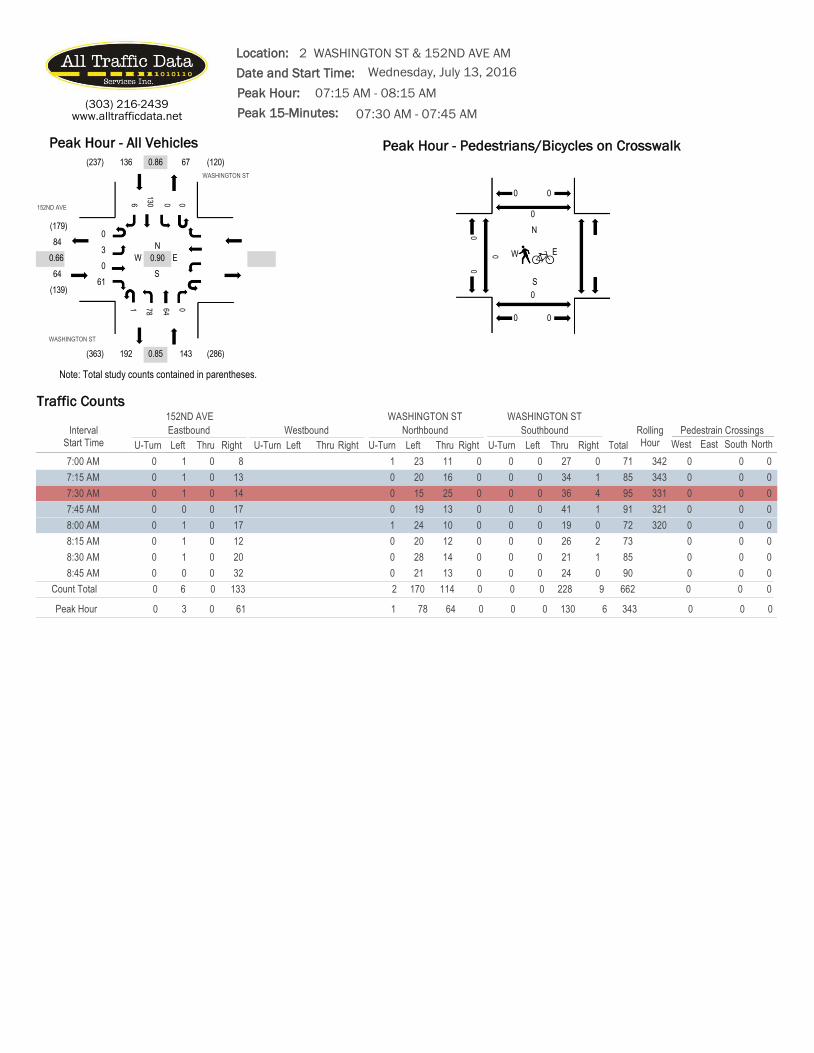
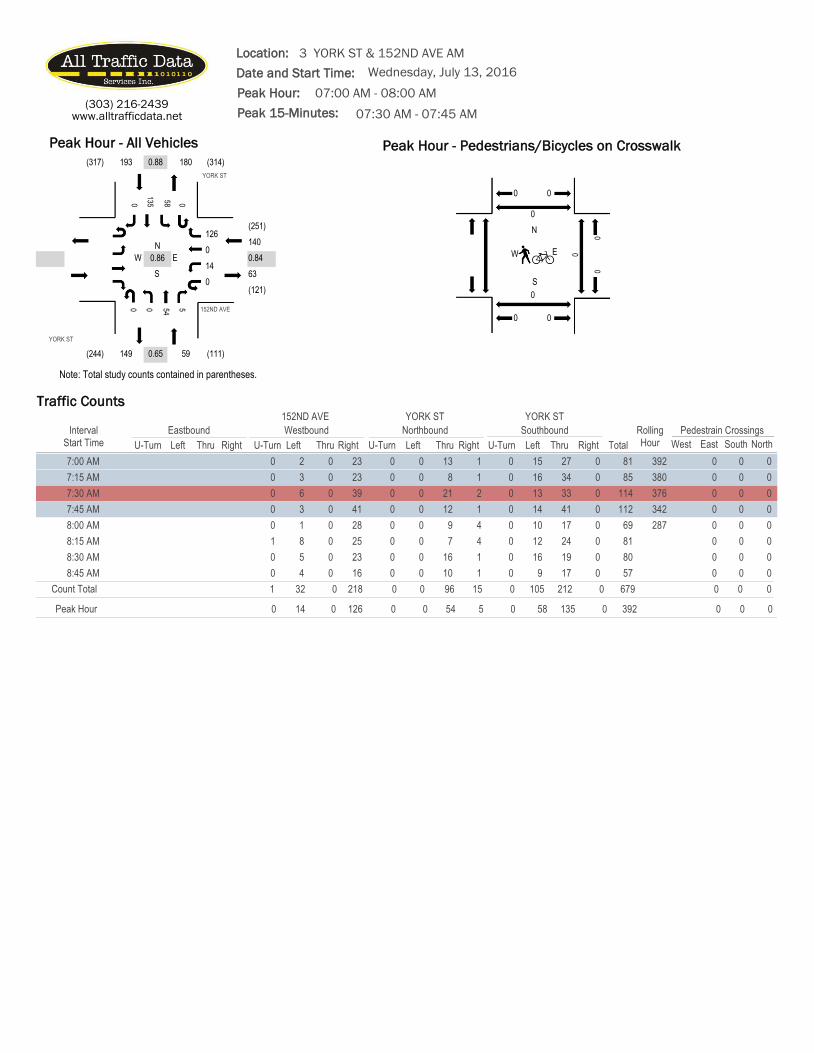
Weekday morning (AM) and afternoon (PM) peak hour traffic counts were collected at the Washington Street intersections with 144th Avenue and 152nd Avenue, and at the York Street intersection with 152nd Avenue. 24-hour volume counts were also collected on Washington Street and 152nd Avenue. These counts are summarized on Figure 3. Traffic count data is included for reference in Appendix A. The Signalized and Unsignalized Intersection Analysis techniques, as published in the Highway Capacity Manual (HCM) by the Transportation Research Board and as incorporated into the SYNCHRO computer program, were used to analyze study intersections for existing traffic conditions. These nationally accepted techniques allow for the determination of intersection level of service (LOS) based on the congestion and delay of each traffic movement. Level of service is a method of measurement used by transportation professionals to quantify a driver’s perception of travel conditions that include travel time, number of stops, and total amount of stopped delay experienced on a roadway network. The HCM categorizes level of service into a range from “A” which indicates little, if any, vehicle delay, to “F” which indicates a level of operation considered unacceptable to most drivers. These levels of service grades with brief descriptions of the operating condition, for unsignalized and signalized intersections, are included for reference in Appendix B and have been used throughout this study. Existing signal timing parameters for Washington Street and 144th Avenue were obtained from City Staff and used throughout this study to the best extent possible in order remain consistent with existing signal coordination plans. The level of service analyses results for existing conditions are summarized in Table 1. Intersection capacity worksheets are provided for reference in Appendix C.
TABLE 1
INTERSECTION CAPACITY ANALYSIS SUMMARYEXISTING TRAFFIC
INTERSECTION LEVEL OF SERVICE
LANE GROUPS AM PEAK HOUR PM PEAK HOUR
144th Avenue / Washington Street (Signalized) C (32.5) E (55.4)
Washington Street / 152nd Avenue (Stop-Controlled)Eastbound Left A BNorthbound Left A A
York Street / 152nd Avenue (Stop-Controlled)Westbound Left A BNorthbound Left A A
Key : Signalized Intersection: Lev el of Serv ice (Control Delay in sec/v eh)Stop-Controlled Intersection: Lev el of Serv ice
City Creek - Traffic Impact Study September 2016
SM ROCHA, LLC - Traffic and Transportation Consultants Page 7
Existing Traffic Analysis Results Under existing conditions, operational analysis shows that the intersection of 144th Avenue and Washington Street operates overall at LOS C during the morning peak hour, and has an overall LOS E operation in the afternoon peak hour. Turn movement operations for stop-controlled intersection of Washington Street at 152nd Avenue are at or better than LOS B operations during each traffic peak hour. The stop-controlled intersection of York Street and 152nd Avenue also has turn movement operations at or better than LOS B operations during respective traffic peak hours. Table 1A summarizes arterial roadway level of service analyses results for existing conditions. Level of service is based on traffic volume thresholds by functional classification as defined in Table 4 of the City Transportation Plan dated July 2009.
TABLE 1A
ROADWAY LEVEL OF SERVICE ANALYSIS SUMMARY
EXISTING TRAFFIC
ROADWAY LEVEL OF SERVICE*
Washington Street (North)
Washington Street (South) B
152nd Avenue A* Based on Table 4, Roadw ay Lev el-of-Serv ice Thresholds by Functional Classification from City of Thornton Transportation Plan 2009
A
152n
d Av
enue
Washington Street
York Street
144t
h Av
enue
17
/ 4
4
58
0 / 4
21
51
/ 3
4
102 / 177
82 / 245
13 / 75
80 / 131
110 / 196
8 / 38
63
/ 2
57
18
1 / 6
86
59
/ 3
48
79 / 378
64 / 185
19 / 38
130 / 106
3 / 1
5
61
/ 2
54
13
5 / 1
31
58
/ 2
04
14 / 13
126 / 99
54
/ 1
76
13
/ 2
4
.
..
(2
,9
11
)
(4
,9
85
)
(6
,6
39
)
Septe
mber
2016
CITY
CRE
EKTr
affic
Impa
ct St
udy
SM R
OCHA
, LLC
Traf
fic a
nd T
rans
porta
tion
Cons
ultan
tsPa
ge 8
Figu
re 3
EXIS
TING
TRA
FFIC
Volum
es &
Inter
secti
on G
eome
tryAM
/ PM
Peak
Hou
r(A
DT) :
Ave
rage
Dail
y Tra
ffic
Stud
y Inte
rsecti
onVo
lumes
Stud
y Inte
rsecti
onLa
ne G
eome
try
LEGE
ND
Deve
lopme
nt Si
te
Not to S
cale

City Creek - Traffic Impact Study September 2016
SM ROCHA, LLC - Traffic and Transportation Consultants Page 9
III. Future Traffic Conditions without Proposed Development
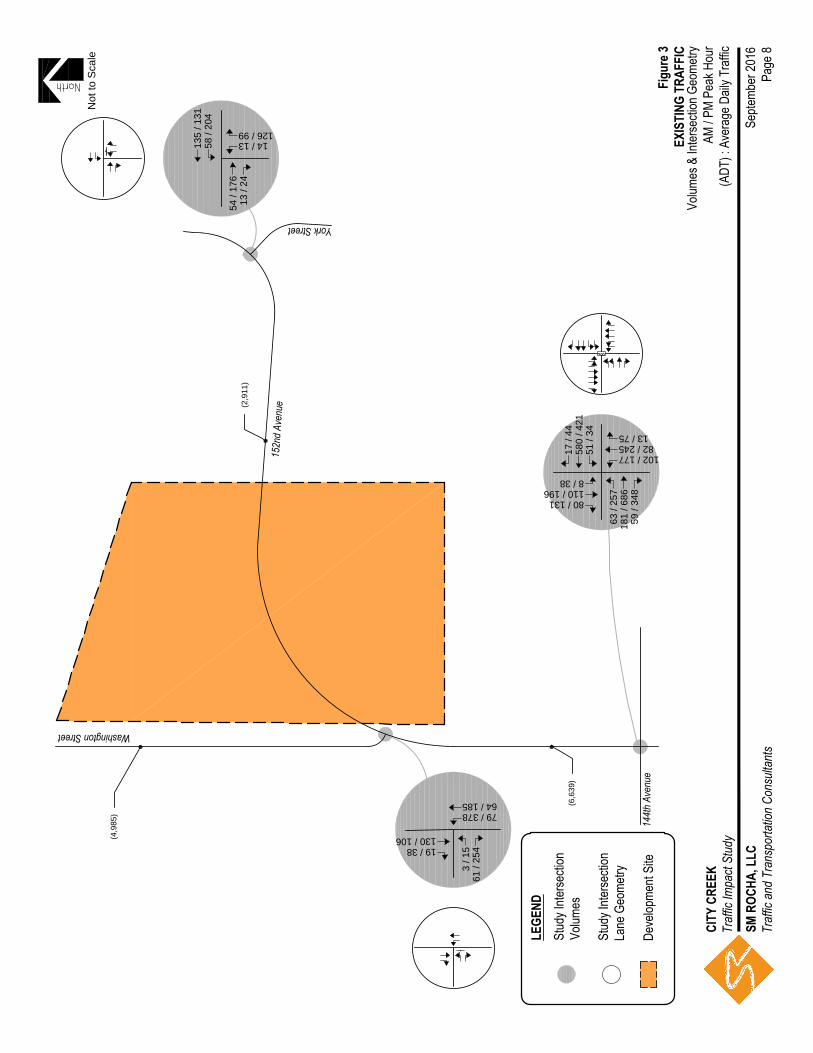
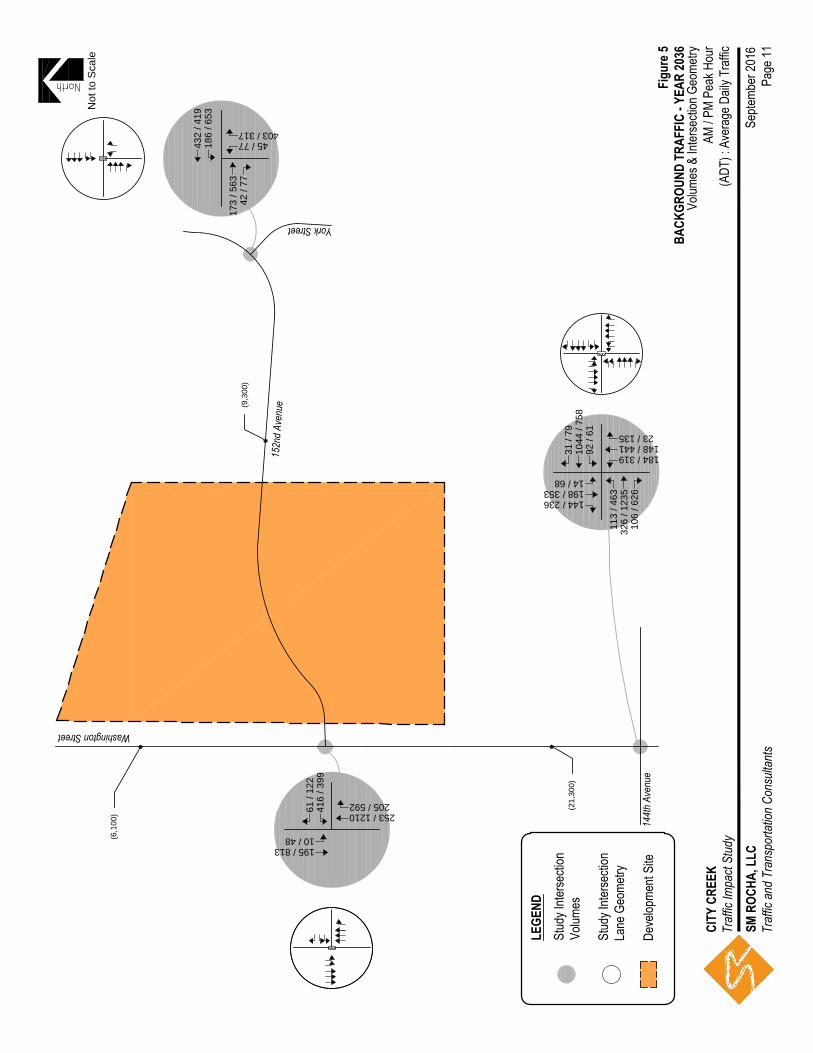
Background traffic is the traffic projected to be on area roadways without consideration of the proposed development. Background traffic includes traffic generated by development of parcels in the area. To account for projected increases in background traffic for Years 2018 and 2036, a compounded annual growth rate was derived by comparison of existing ADT volumes to ADT volumes represented in Figure 17 (2035 Traffic Volume Forecasts) of the Thornton Thoroughfare Plan. The resultant compounded growth rate ranged between three and six percent and was applied to existing peak hour traffic volumes. Pursuant to the non-committed area roadway improvements discussion provided in Section I, Year 2018 (short-term) background traffic conditions assume no roadway improvements to accommodate regional transportation demands. This assumption provides for a conservative analysis. Year 2036 background traffic condition assumes Washington Street and 152nd Avenue being built out to the ultimate six-lane roadway section as envisioned by the City Transportation Plan. Also assumed in the long-term background traffic condition is the reconfiguration and signalization of Washington Street at 152nd Avenue, and the signalization of York Street at 152nd Avenue. Projected background traffic volumes and intersection geometry for Years 2018 and 2036 are shown on Figure 4 and Figure 5, respectively.
152n
d Av
enue
Washington Street
York Street
144t
h Av
enue
18
/ 4
7
61
5 / 4
46
54
/ 3
6
108 / 188
87 / 260
14 / 80
85 / 138
117 / 208
9 / 40
68
/ 2
72
19
2 / 7
27
63
/ 3
69
88 / 423
72 / 207
21 / 43
146 / 115
4 / 1
7
68
/ 2
84
15
1 / 1
47
65
/ 2
28
16 / 14
141 / 111
60
/ 1
97
14
/ 2
7
.
..
(3
,3
00
)
(5
,6
00
)
(7
,3
00
)
Septe
mber
2016
CITY
CRE
EKTr
affic
Impa
ct St
udy
SM R
OCHA
, LLC
Traf
fic a
nd T
rans
porta
tion
Cons
ultan
tsPa
ge 10
Figu
re 4
BACK
GROU
ND T
RAFF
IC -
YEAR
2018
Volum
es &
Inter
secti
on G
eome
tryAM
/ PM
Peak
Hou
r(A
DT) :
Ave
rage
Dail
y Tra
ffic
Stud
y Inte
rsecti
onVo
lumes
Stud
y Inte
rsecti
onLa
ne G
eome
try
LEGE
ND
Deve
lopme
nt Si
te
Not to S
cale
152n
d Av
enue
Washington Street
York Street
144t
h Av
enue
31
/ 7
9
10
44
/ 7
58
92
/ 6
1
184 / 319
148 / 441
23 / 135
144 / 236
198 / 353
14 / 68
11
3 / 4
63
32
6 / 1
23
5
10
6 / 6
26
43
2 / 4
19
18
6 / 6
53
45 / 77
403 / 317
17
3 / 5
63
42
/ 7
7
61
/ 1
22
41
6 / 3
99
253 / 1210
205 / 592
195 / 813
10 / 48
(9
,3
00
)
(6
,1
00
)
(2
1,3
00
)
Septe
mber
2016
CITY
CRE
EKTr
affic
Impa
ct St
udy
SM R
OCHA
, LLC
Traf
fic a
nd T
rans
porta
tion
Cons
ultan
tsPa
ge 11
Figu
re 5
BACK
GROU
ND T
RAFF
IC -
YEAR
2036
Volum
es &
Inter
secti
on G
eome
tryAM
/ PM
Peak
Hou
r(A
DT) :
Ave
rage
Dail
y Tra
ffic
Stud
y Inte
rsecti
onVo
lumes
Stud
y Inte
rsecti
onLa
ne G
eome
try
LEGE
ND
Deve
lopme
nt Si
te
Not to S
cale

City Creek - Traffic Impact Study September 2016
SM ROCHA, LLC - Traffic and Transportation Consultants Page 12
As with existing traffic conditions, the operations of study intersections were analyzed under background conditions, without the proposed development, using the SYNCHRO computer program. Background traffic level of service analyses results for Year 2018 are listed in Table 2. Year 2036 operational results are summarized in Table 3. Definitions of levels of service are given in Appendix B. Intersection capacity worksheets are provided in Appendix C.
TABLE 2INTERSECTION CAPACITY ANALYSIS SUMMARY
BACKGROUND TRAFFIC - YEAR 2018INTERSECTION LEVEL OF SERVICE
LANE GROUPS AM PEAK HOUR PM PEAK HOUR
144th Avenue / Washington Street (Signalized) C (32.3) E (59.5)
Washington Street / 152nd Avenue (Stop-Controlled)Eastbound Left A BNorthbound Left A A
York Street / 152nd Avenue (Stop-Controlled)Westbound Left A BNorthbound Left A A
Key : Signalized Intersection: Lev el of Serv ice (Control Delay in sec/v eh)Stop-Controlled Intersection: Lev el of Serv ice
Background Traffic Analysis Results – Year 2018 Similar to existing traffic conditions, Year 2018 background traffic analysis indicates that the intersection of 144th Avenue and Washington Street has a peak hour operation of LOS C during the morning and LOS D in the afternoon. Studied unsignalized turn movements at the 152nd Avenue intersections of Washington Street and York Street are shown to have LOS B or better operation during peak traffic hours. Table 2A summarizes arterial roadway level of service analyses results for Year 2018 background traffic conditions.
TABLE 2A
ROADWAY LEVEL OF SERVICE ANALYSIS SUMMARY
BACKGROUND TRAFFIC - YEAR 2018
ROADWAY LEVEL OF SERVICE*
Washington Street (North)
Washington Street (South) B
152nd Avenue A* Based on Table 4, Roadw ay Lev el-of-Serv ice Thresholds by Functional Classification from City of Thornton Transportation Plan 2009
A

City Creek - Traffic Impact Study September 2016
SM ROCHA, LLC - Traffic and Transportation Consultants Page 13
TABLE 3
INTERSECTION CAPACITY ANALYSIS SUMMARYBACKGROUND TRAFFIC - YEAR 2036
INTERSECTION LEVEL OF SERVICE
LANE GROUPS AM PEAK HOUR PM PEAK HOUR
144th Avenue / Washington Street (Signalized) C (34.7) D (35.9)
Washington Street / 152nd Avenue (Signalized) C (27.4) B (17.9)
York Street / 152nd Avenue (Signalized) B (10.7) B (17.9)
Key : Signalized Intersection: Lev el of Serv ice (Control Delay in sec/v eh)
Background Traffic Analysis Results – Year 2036 By Year 2036 and without the proposed development, the 144th Avenue signalized intersection with Washington Street is projected to have an overall operation of LOS C during the morning, and overall LOS D operation in the afternoon traffic peak hour. The long-term intersection operations of 152nd Avenue at Washington Street and York Street are projected to be at or better than LOS C during peak traffic hours. Table 3A summarizes anticipated arterial roadway level of service analyses results for Year 2036 background traffic conditions.
TABLE 3A
ROADWAY LEVEL OF SERVICE ANALYSIS SUMMARY
BACKGROUND TRAFFIC - YEAR 2036
ROADWAY LEVEL OF SERVICE*
Washington Street (North)
Washington Street (South) A
152nd Avenue A* Based on Table 4, Roadw ay Lev el-of-Serv ice Thresholds by Functional Classification from City of Thornton Transportation Plan 2009
A

City Creek - Traffic Impact Study September 2016
SM ROCHA, LLC - Traffic and Transportation Consultants Page 14
IV. Proposed Project Traffic
Vehicle Trip Generation Standard traffic generation characteristics compiled by the Institute of Transportation Engineers (ITE) in their report entitled Trip Generation, 9th Edition, were applied to assumed land uses in order to estimate average daily traffic (ADT), AM Peak Hour, and PM Peak Hour vehicle trips. A vehicle trip is defined as a one-way vehicle movement from a point of origin to a point of destination. ITE land use codes used for estimating traffic generation were selected because of their best fit to assumed land use descriptions. The application of best fitted ITE land use code and average trip generation rates provides for a conservative estimate of development traffic likely to be generated. Trip generation rates used in this study are presented in Table 4.
TABLE 4
TRIP GENERATION RATESTRIP GENERATION RATES
ITE 24 AM PEAK HOUR PM PEAK HOUR
CODE LAND USE UNIT HOUR ENTER EXIT TOTAL ENTER EXIT TOTAL
210Single-Family Residential
DU 9.52 0.19 0.56 0.75 0.63 0.37 1.00
220 Apartment DU 6.65 0.10 0.41 0.51 0.40 0.22 0.62
230Townhouse / Condominium
DU 5.81 0.07 0.37 0.44 0.35 0.17 0.52
534 Private School (K-8) STU 6.00 0.50 0.41 0.90 0.28 0.32 0.60
770 Business Park AC 149.79 16.03 2.83 18.86 3.37 13.47 16.84
151 Mini-Warehouse AC 35.43 1.16 1.42 2.58 1.79 1.79 3.57
Key : DU = Dw elling Units STU = Students AC = AcresNote: All data and calculations abov e are subject to being rounded to nearest v alue. 24 hour rate for ITE Code 534 dev eloped from PM Peak Hour relationship
Table 5 illustrates projected average daily traffic (ADT), AM Peak Hour, and PM Peak Hour traffic volumes likely generated by the assumed development upon build out.

City Creek - Traffic Impact Study September 2016
SM ROCHA, LLC - Traffic and Transportation Consultants Page 15
TABLE 5TRIP GENERATION SUMMARY
TOTAL TRIPS GENERATED
ITE 24 AM PEAK HOUR PM PEAK HOUR
CODE LAND USE SIZE HOUR ENTER EXIT TOTAL ENTER EXIT TOTAL
210Single-Family Residential
300 DU 2,856 56 169 225 189 111 300
220 Apartment 385 DU 2,560 39 157 196 155 84 239
230Townhouse / Condominium
340 DU 1,975 25 124 150 118 58 177
534 Private School (K-8) 950 STU 5,700 470 385 855 268 302 570
770 Business Park 78 AC 11,684 1,250 221 1,471 263 1,051 1,314
151 Mini-Warehouse 3 AC 106 3 4 8 5 5 11
Total: 24,882 1,845 1,060 2,905 999 1,611 2,610
Note: All data and calculations abov e are subject to being rounded to nearest v alue.
As Table 5 illustrates, the development upon build out and full occupancy of respective land uses has the potential to generate approximately 24,882 daily trips with 2,905 of those occurring during the morning peak hour and 2,610 during the afternoon peak hour before application of applicable trip reductions. Adjustments to Vehicle Trip Generation Rates A development of this type is likely to attract trips from within area land uses as well as pass-by or diverted trips from the adjacent roadway system. However, no trip reduction was taken in this study in effort to represent a conservative analysis. Vehicle Trip Distribution and Assignment The overall directional distribution of site-generated traffic was determined based on directional distribution of existing intersection count data, the location of development site within the City, allowed intersection turn movements, available roadway network, surrounding existing or proposed land uses, and discussions with City Staff. Overall trip distribution patterns for the assumed development are shown on Figure 6. Traffic assignment is how site-generated and distributed vehicle trips are expected to be loaded onto the available roadway network. Applying trip distribution patterns to site-generated traffic provides the overall site-generated trip assignments shown on Figure 6.

152n
d Av
enue
Washington Street
York Street
144t
h Av
enue
22
8 / 1
23
299 / 159
154 / 278
155 / 278
119 / 211
29
8 / 1
58
27
6 / 1
50
185 / 98
15
9 / 2
42
10
5 / 1
60
31
2 / 6
6
14
8 / 1
81
1 / 1
3 / 4
1 / 1
55 / 263
55 / 263
31
2 / 6
6
20
9 / 1
39
2 / 4
6
8
/
3
8
7
0
/
4
0
9
0
/
5
1
9
4
/
5
4
3
5
9
/
9
5
2
4
/
9
3
1
1
8
/
6
6
5
8
/
2
6
7
1
8
/
6
9
7
7
/
6
0
5
8
/
4
6
9
6
/
7
6
46
/ 2
7
67
/ 3
7
759 / 187
24 / 92
1 / 1
14
7 / 3
17
521 / 184
808 / 203
167 / 469
77
/ 6
0
77
/ 6
0
467 / 134
94 / 54
91 / 407
94 / 54
428 / 766
19 / 14
Acce
ss A
6
9
/
3
9
4
0
8
/
2
0
3
2
4
/
9
3
2
2
5
/
3
7
8
1
2
/
4
6
Access B
Access C
Access D
Acce
ss E
Acce
ss F
13
8 / 7
8
90
/ 5
1
805 / 214
18 / 69
290 / 692
77 / 60
45
/ 2
10
66
/ 3
15
91 / 52
376 / 79
24 / 92
250 / 52
(20%)
(10%)
(15%
)
(20%)
(2
0%
)(1
5%
)
24 / 93
148t
h Av
enue
Septe
mber
2016
CITY
CRE
EKTr
affic
Impa
ct St
udy
SM R
OCHA
, LLC
Traf
fic a
nd T
rans
porta
tion
Cons
ultan
tsPa
ge 16
Figu
re 6
SITE
DEV
ELOP
MENT
DIS
TRIB
UTIO
N(%
) : O
vera
llSI
TE-G
ENER
ATED
AM / P
M Pe
ak H
our
Stud
y Inte
rsecti
onVo
lumes
LEGE
ND
Deve
lopme
nt Si
te
Not to S
cale

City Creek - Traffic Impact Study September 2016
SM ROCHA, LLC - Traffic and Transportation Consultants Page 17
V. Future Traffic Forecasts with Proposed Development
Site-generated traffic was added to background traffic projections for Years 2018 and 2036 to develop total traffic projections. It is assumed, for analysis purposes, that development build out construction would not be phased and be completed by end of Year 2018. However, there is no defined completion date for this development. No regional roadway improvements to accommodate regional transportation demands, beyond that described in background conditions, were assumed for analysis in total traffic conditions. Roadway improvements associated with site development are expected to be limited to site access and frontage as required by the City. Site development roadway improvements assumed for Year 2018 and Year 2036 analysis (and under an assumed development build out condition) include the provision of exclusive right and left turn lanes on Washington Street and 152nd Avenue at each proposed site access. Traffic signal installation is also assumed on Washington Street and 152nd Avenue at assumed intersections of Access C, Access D and Access F because of projected volume of left turning vehicles and minor roadway volumes at intersections. It is understood that further discussion and coordination with City Staff is needed to determine the appropriateness and location of assumed traffic signalization. Projected Year 2018 total traffic volumes and intersection geometry are shown on Figure 7. Figure 8 shows projected total traffic volumes and intersection geometry for Year 2036.

152n
d Av
enue
Washington Street
York Street
144t
h Av
enue
24
6 / 1
70
61
5 / 4
46
54
/ 3
6
108 / 188
386 / 419
14 / 80
239 / 417
272 / 586
128 / 251
36
6 / 4
30
19
2 / 7
27
63
/ 3
69
42
7 / 2
97
65
/ 2
28
201 / 112
141 / 111
21
9 / 4
39
11
9 / 1
89
.
..
.
31
2 / 6
6
31
5 / 3
42
1 / 1
3 / 4
0 / 0
1 / 1
55 / 263
0 / 0
55 / 263
31
2 / 6
6
28
5 / 3
63
2 / 4
46
/ 2
7
67
/ 3
7
919 / 564
24 / 92
77
/ 6
0
77
/ 6
0
576 / 600
94 / 54
163 / 708
94 / 54
45
/ 2
10
66
/ 3
15
200 / 512
376 / 79
96 / 393
250 / 52
642 / 1165
19 / 14
.
.
(9
,3
00
)
(1
1,7
50
)
(1
9,0
00
)
148t
h Av
enue
Acce
ss AAcce
ss B
Access C
Access D
Acce
ss E
Acce
ss F
6
8
/
3
8
7
0
/
4
0
9
0
/
5
1
9
4
/
5
4
4
3
5
/
3
1
9
2
4
/
9
3
1
1
8
/
6
6
2
2
5
/
4
2
8
1
8
/
6
9
7
7
/
6
0
5
8
/
4
6
9
6
/
7
6
6
9
/
3
9
4
8
4
/
4
2
7
2
4
/
9
3
3
9
2
/
5
3
9
1
2
/
4
6
.
965 / 564
18 / 69
13
8 / 7
8
90
/ 5
1
504 / 1091
77 / 60
22 / 44
293 / 432
609 / 607
880 / 410
28
/ 1
10
23
5 / 7
53
Volum
es &
Inter
secti
on G
eome
tryAM
/ PM
Peak
Hou
r(A
DT) :
Ave
rage
Dail
y Tra
ffic
TOTA
L TR
AFFI
C - Y
EAR
2018
Septe
mber
2016
CITY
CRE
EKTr
affic
Impa
ct St
udy
SM R
OCHA
, LLC
Traf
fic a
nd T
rans
porta
tion
Cons
ultan
tsPa
ge 18
Figu
re 7
Stud
y Inte
rsecti
onVo
lumes
Stud
y Inte
rsecti
onLa
ne G
eome
try
LEGE
ND
Deve
lopme
nt Si
te
Not to S
cale

152n
d Av
enue
Washington Street
York Street
144t
h Av
enue
25
9 / 2
02
10
44
/ 7
58
92
/ 6
1
184 / 319
447 / 200
23 / 135
298 / 514
353 / 631
133 / 279
41
1 / 6
21
32
6 / 1
23
5
10
6 / 6
26
70
8/ 5
69
18
6 / 6
53
230 / 175
403 / 317
33
2 / 8
05
14
7 / 2
37
.
..
.
31
2 / 6
6
62
5 / 6
77
1 / 1
3 / 4
0 / 0
1 / 1
55 / 263
0 / 0
55 / 263
31
2 / 6
6
42
4 / 7
79
2 / 4
46
/ 2
7
67
/ 3
7
1217 / 1989
24 / 92
77
/ 6
0
77
/ 6
0
781 / 1466
94 / 54
296 / 1268
94 / 54
45
/ 2
10
66
/ 3
15
405 / 1384
376 / 79
229 / 953
250 / 52
1039 / 1978
19 / 14
.
(1
5,3
00
)
(1
2,2
50
)
(3
3,0
00
)
148t
h Av
enue
Acce
ss AAcce
ss B
Access C
Access D
Acce
ss E
Acce
ss F
6
8
/
3
8
7
0
/
4
0
9
0
/
5
1
9
4
/
5
4
5
7
4
/
7
3
5
2
4
/
9
3
1
1
8
/
6
6
5
3
5
/
7
6
3
1
8
/
6
9
7
7
/
6
0
5
8
/
4
6
9
6
/
7
6
6
9
/
3
9
6
2
3
/
8
4
3
2
4
/
9
3
7
0
2
/
8
7
4
1
2
/
4
6
.
1263 / 2016
18 / 69
13
8 / 7
8
90
/ 5
1
901 / 1904
77 / 60
774 / 1394
1013 / 795
62
/ 1
23
56
3 / 7
16
362 / 1282
34 / 141
Septe
mber
2016
CITY
CRE
EKTr
affic
Impa
ct St
udy
SM R
OCHA
, LLC
Traf
fic a
nd T
rans
porta
tion
Cons
ultan
tsPa
ge 19
Figu
re 8
TOTA
L TR
AFFI
C - Y
EAR
2036
Volum
es &
Inter
secti
on G
eome
tryAM
/ PM
Peak
Hou
r(A
DT) :
Ave
rage
Dail
y Tra
ffic
Stud
y Inte
rsecti
onVo
lumes
Stud
y Inte
rsecti
onLa
ne G
eome
try
LEGE
ND
Deve
lopme
nt Si
te
Not to S
cale
City Creek - Traffic Impact Study September 2016
SM ROCHA, LLC - Traffic and Transportation Consultants Page 20
VI. Project Impacts The analyzes and procedures described in this study were performed in accordance with the Highway Capacity Manual (HCM) and are based upon the worst case conditions that occur during a typical weekday upon build out of site development and analyzed land use. Therefore, study intersections are likely to operate with traffic conditions better than those described within this study, which represent the peak hours of weekday operation only. Peak Hour Intersection Levels of Service Operations of study intersections were analyzed under projected total traffic conditions using the SYNCHRO computer program. Total traffic level of service analysis results for Years 2018 and 2036 are summarized in Table 6 and Table 7. A summary of projected queue lengths for each analysis year are provided for reference in Appendix C. Definitions of levels of service are given in Appendix B, with intersection capacity worksheets provided in Appendix C.

City Creek - Traffic Impact Study September 2016
SM ROCHA, LLC - Traffic and Transportation Consultants Page 21
TABLE 6INTERSECTION CAPACITY ANALYSIS SUMMARY
TOTAL TRAFFIC - YEAR 2018INTERSECTION LEVEL OF SERVICE
LANE GROUPS AM PEAK HOUR PM PEAK HOUR
144th Avenue / Washington Street (Signalized) C (32.5) C (32.5)
Washington Street / 152nd Avenue (Stop-Controlled)Eastbound Left F FEastbound Right B FNorthbound Left B B
York Street / 152nd Avenue (Stop-Controlled)Westbound Left A BNorthbound Left E FNorthbound Right B B
Washington Street / 148th Avenue (Stop-Controlled)Westbound Left F EWestbound Right B BSouthbound Left B A
Washington Street / Access A (Stop-Controlled)Westbound Left F EWestbound Right C BSouthbound Left B A
Access B / 152nd Avenue (Stop-Controlled)Westbound Left A ANorthbound Right B A
Access C / 152nd Avenue (Signalized) B (14.5) B (12.2)
Access D / 152nd Avenue (Signalized) A (6.4) B (13.4)
Access E / Washington Street (Stop-Controlled)Westbound Left D EWestbound Right B BSouthbound Left A A
Access F / Washington Street (Signalized) A (7.7) B (15.4)
Key: Signalized Intersection: Level of Service (Control Delay in sec/veh)Stop-Controlled Intersection: Level of Service
TABLE 6AROADWAY LEVEL OF SERVICE ANALYSIS SUMMARY
TOTAL TRAFFIC - YEAR 2018
ROADWAY LEVEL OF SERVICE*
Washington Street (North)
Washington Street (South) A
152nd Avenue A* Based on Table 4, Roadway Level-of-Service Thresholds by Functional Classification from City of Thornton Transportation Plan 2009
D

City Creek - Traffic Impact Study September 2016
SM ROCHA, LLC - Traffic and Transportation Consultants Page 22
TABLE 7
INTERSECTION CAPACITY ANALYSIS SUMMARYTOTAL TRAFFIC - YEAR 2036
INTERSECTION LEVEL OF SERVICE
LANE GROUPS AM PEAK HOUR PM PEAK HOUR
144th Avenue / Washington Street (Signalized) D (36.5) D (40.6)
Washington Street / 152nd Avenue (Signalized) B (18.6) C (21.5)
York Street / 152nd Avenue (Signalized) B (12.0) C (20.6)
Washington Street / 148th Avenue (Stop-Controlled)Westbound Left F FWestbound Right B CSouthbound Left B C
Washington Street / Access A (Stop-Controlled)Westbound Left F FWestbound Right B CSouthbound Left B D
Access B / 152nd Avenue (Stop-Controlled)Westbound Left A BNorthbound Right B B
Access C / 152nd Avenue (Signalized) B (17.1) B (16.0)
Access D / 152nd Avenue (Signalized) A (6.5) B (14.4)
Access E / Washington Street (Stop-Controlled)Westbound Left D EWestbound Right A ASouthbound Left A B
Access F / Washington Street (Signalized) A (5.1) B (11.0)
Key: Signalized Intersection: Level of Service (Control Delay in sec/veh)Stop-Controlled Intersection: Level of Service
TABLE 7AROADWAY LEVEL OF SERVICE ANALYSIS SUMMARY
TOTAL TRAFFIC - YEAR 2036
ROADWAY LEVEL OF SERVICE*
Washington Street (North)
Washington Street (South) A
152nd Avenue A* Based on Table 4, Roadway Level-of-Service Thresholds by Functional Classification from City of Thornton Transportation Plan 2009
A
City Creek - Traffic Impact Study September 2016
SM ROCHA, LLC - Traffic and Transportation Consultants Page 23
Total Traffic Analysis Results For Year 2018, operational analysis shows that the intersection of 144th Avenue and Washington Street operates overall at LOS C during both traffic peak traffic hour. Operational analysis of studied stop-controlled intersections along Washington Street and 152nd Avenue also shows peak hour turn movement operations ranging from LOS A to LOS F. The majority of vehicular delay shown in analysis pertains to left turn movements onto Washington Street or 152nd Avenue. The LOS E and LOS F operation experienced is attributed to the volume of through traffic on Washington Street or 152nd Avenue, the high posted speed on the arterial roadways, and the stop-controlled nature of each intersection. It is to be noted that it is not uncommon for unsignalized movements to or from an arterial roadway, in urban areas, to operate with noticeable delays during peak traffic hours. It is, however, likely that turn movements will operate better than the results obtained with this HCM Two Way Stop Control (TWSC) level of service analysis would indicate, as the HCM1 analysis may not accurately account for the effect of vehicle platooning and gaps caused by upstream signals. The existing or proposed upstream signal control on Washington Street or 152nd Avenue will tend to create additional gaps in the traffic stream for turning movements at each studied intersection. The assumed signalized intersections of Access C, Access D and Access F are projected to have overall LOS B or better operations during both traffic peak hours in Year 2018. Table 7 illustrates how, by Year 2036, total traffic analysis results show that the Washington Street and 144th Avenue intersection has similar overall LOS D operational result as previously concluded in long-term background analysis. This is with all conservative assumptions presented in this traffic study. Assumed signalized 152nd Avenue intersections at Washington Street, York Street, Access C and Access D have projected overall LOS C or better operations during respective traffic peak hours. All other studied stop-controlled intersection movements are expected to operate at or better than LOS C during peak traffic periods. Most left turn movements from stop-controlled studied intersections onto Washington Street or 152nd Avenue continue to experience a projected LOS E or LOS F operations. The LOS E or LOS F operation experienced is attributed to the future volume of through traffic on the arterial roadways and the stop-controlled nature of the intersection. Again, it is not uncommon for unsignalized movements to or from an arterial roadway, in urban areas, to operate with noticeable delays during peak traffic hours. It is, however, likely that turn movements will operate better than the results presented in this study since the upstream signal control on the arterial roadways will tend to create additional gaps in the traffic stream for turning movements at studied stop-controlled intersections. It is not recommended that development access onto Washington Street or 152nd Avenue be restricted from that assumed in this study. Restricted site access is likely to interfere with the development's overall ability to equally distribute traffic within the site and out to the available roadways, thus impacting existing and future traffic patterns in the surrounding area, including emergency response time, and potentially causing the adjacent roadway network to be used in a manner not intended resulting in cut-through traffic or congested intersection conditions.
1 The Highway Capacity Manual 2010, Transportation Research Board, Section 19-17.

City Creek - Traffic Impact Study September 2016
SM ROCHA, LLC - Traffic and Transportation Consultants Page 24
VII. Conclusion
This traffic impact study addressed the capacity, geometric, and control requirements associated with development entitled City Creek. This proposed mixed-use development is envisioned to include a variety of residential, self-storage, office, light industrial, and school land uses. The development site is located on both sides of 152nd Avenue in Adams County, Colorado (to be annexed into the City of Thornton). The development site if further bound to the west by Washington Street, E-470 on the north, Big Dry Creek on the east, and the future 148th Avenue on the south. There is no defined completion date for the overall development. It is very likely that a development of this type and location within the City of Thornton will take some to build out. It is acknowledged that the development must go through procedures of rezoning, subdivision and site development permitting before land uses assumed in this study can become formalized and begin to operate. It is only during the later procedures that true traffic impacts from the development site can be analyzed. Briefly described, rezoning entails the change of uses allowed on a property, subdivision breaks down larger parcels of land to developable sizes, and site development permit is the review of real site construction. As actual uses within the development become defined over time, traffic characteristics and influencing factors considered in this study are subject to change and will need to be updated. This study is intended to serve as an overall guide that can be used for any order of site development that occurs. The combination of development land use areas presented herein are assumed and analyzed to estimate projected traffic levels through Year 2036. The study area to be examined in this analysis encompasses the Washington Street intersections with 144th Avenue, 152nd Avenue. Also included in the study area is the intersection of 152nd Avenue and York Street, and proposed site access. Analysis was conducted for critical AM Peak Hour and PM Peak Hour traffic operations for existing traffic conditions, Year 2018 and Year 2036 background traffic conditions, and Year 2018 and Year 2036 total traffic conditions. Analysis of existing traffic conditions indicate that the intersection of 144th Avenue and Washington Street operates overall at LOS C during the morning peak hour, and has an overall LOS E operation in the afternoon peak hour. Turn movement operations for stop-controlled intersection of Washington Street at 152nd Avenue are at or better than LOS B operations during each traffic peak hour. The stop-controlled intersection of York Street and 152nd Avenue also has turn movement operations at or better than LOS B operations during each respective traffic peak hour. Background traffic analyses for study years 2018 and 2036, without proposed development, indicate that the 144th Avenue signalized intersection with Washington Street is projected to have an overall operation of LOS C during the morning, and overall LOS D operation in the afternoon traffic peak hour. The long-term intersection operations of 152nd Avenue at Washington Street and York Street are projected to be at or better than LOS C during peak traffic hours.

City Creek - Traffic Impact Study September 2016
SM ROCHA, LLC - Traffic and Transportation Consultants Page 25
Analysis of future traffic conditions indicate that the addition of site-generated traffic is expected to create impact to traffic operations for the existing and surrounding roadway system that can be mitigated by traffic signal implementation or various roadway improvements as described within this study. With all conservative assumptions defined in this analysis, existing and assumed study intersections are projected to operate at future levels of service comparable to background peak hour traffic conditions. Year 2018 total traffic operational analysis shows that the intersection of 144th Avenue and Washington Street operates overall at LOS C during both traffic peak traffic hour. Operational analysis of studied stop-controlled intersections along Washington Street and 152nd Avenue also shows peak hour turn movement operations ranging from LOS A to LOS F. The majority of vehicular delay shown in analysis pertains to left turn movements onto Washington Street or 152nd Avenue. The LOS E and LOS F operation experienced is attributed to the volume of through traffic on Washington Street or 152nd Avenue, the high posted speed on the arterial roadways, and the stop-controlled nature of each intersection. It is to be noted that it is not uncommon for unsignalized movements to or from an arterial roadway, in urban areas, to operate with noticeable delays during peak traffic hours. It is, however, likely that turn movements will operate better than the results obtained with this HCM Two Way Stop Control (TWSC) level of service analysis would indicate, as the HCM analysis may not accurately account for the effect of vehicle platooning and gaps caused by upstream signals. The existing or proposed upstream signal control on Washington Street or 152nd Avenue will tend to create additional gaps in the traffic stream for turning movements at each studied intersection. The assumed signalized intersections of Access C, Access D and Access F are projected to have overall LOS B or better operations during both traffic peak hours in Year 2018. By Year 2036, total traffic analysis results show that the Washington Street and 144th Avenue intersection has similar overall LOS D operational result as previously concluded in long-term background analysis. This is with all conservative assumptions presented in this traffic study. Assumed signalized 152nd Avenue intersections at Washington Street, York Street, Access C and Access D have projected overall LOS C or better operations during respective traffic peak hours. All other studied stop-controlled intersection movements are expected to operate at or better than LOS C during peak traffic periods. Most left turn movements from stop-controlled studied intersections onto Washington Street or 152nd Avenue continue to experience a projected LOS E or LOS F operations. The LOS E or LOS F operation experienced is attributed to the future volume of through traffic on the arterial roadways and the stop-controlled nature of the intersection. Again, it is not uncommon for unsignalized movements to or from an arterial roadway, in urban areas, to operate with noticeable delays during peak traffic hours. It is, however, likely that turn movements will operate better than the results presented in this study since the upstream signal control on the arterial roadways will tend to create additional gaps in the traffic stream for turning movements at studied stop-controlled intersections.

APPENDIX A
Traffic Count Data

§̈¦67
£¤58
£¤58
§̈¦67
¬ «2
¬ «2
§̈¦072
¥§¦52
¥§¦52
¥§¦52
¬«074E
¬«7
¬«7
£¤63
92nd AVE
104th AVEYO
SEMI
TE ST
I-25
144th AVE
ZUNI
ST WASH
INGT
ON ST
120th AVE
136th AVE
HURO
N ST
HWY 36
128th AVE
160th AVE
88th AVE
100th AVE
84th AVE
I-76
COLO
RADO
BLVD
168th AVE
E-470
QUEB
EC ST
HOLL
Y ST
FEDE
RAL B
LVD
YORK
ST
112th AVE
E-470
152nd AVEI-2
5
S:\Ar
cGIS\
Stand
ardMa
ps\C
urren
tLand
use8
x10.m
xd
[6/17/2014
The C
ity of
Thorn
ton G
IS ha
s mad
e eve
ry rea
sona
bleeff
ort to
repre
sent
geog
raphic
data
as ac
curat
ely as
poss
ible,
and a
ssum
es no
liabil
ity as
socia
ted w
ith th
eus
e or m
isuse
of its
prod
ucts.
Infor
matio
n con
taine
dhe
rein i
s for
repres
entat
ional
purpo
ses o
nly an
d is n
otint
ende
d to b
e sub
stitut
ed fo
r acc
urate
boun
dary
locati
ons,
legal
or pro
fessio
nal o
pinion
s.
GIS D
ATA D
ISCLA
IMER
Cur
rent
Lan
d U
seC
urre
nt L
and
Use
9500
Civic
Cen
ter D
rive.
Thor
nton
, Colo
rado
8022
9. (3
03) 5
38-7
295
City
of
Thor
nton
City
of
Thor
nton
1 in = 1.2 mi
PublicParks and RecreationCommercialInstitutionalLakeResidential EstateSingle Family DetachedSingle Family AttachedManufactured Home ParkMulti-FamilyAgricultureTransportationVacantCity BoundaryMajor Streets

§̈¦67
£¤58
£¤58
§̈¦67¬ «2
§̈¦072
¥§¦52
¥§¦52
¥§¦52
£¤63
¬«074E
¬«7
¬«7
¬ «2
120th AVE
HWY 36
YOSE
MITE
ST
ZUNI
ST
128th AVE
YORK
ST
84th AVE
88th AVE
168th AVE
I-25
FEDE
RAL B
LVD
160th AVE
E-470
I-76
104th AVE
COLO
RADO
BLVD
E-470
144th AVE
100th AVE
HOLL
Y ST
152nd AVE
QUEB
EC ST
I-25
HURO
N ST
136th AVE
92nd AVE
112th AVE
WASH
INGT
ON ST
HeritageTodd Creek
(1290)
Morrison(432)
Mayfield(276)
Holly HillsEstates
(316)LewisPointe(373)
Tsuzuki(Timberleaf)
(190) (266)
Talon View(296)
Glen Eagle Estates (63)
AmberCreek(341)
Brantner Village (84)
QuebecHighlands
Amd 1(219)
Quebec HighlandsAmd 2 (122)
Cherrywood Park #1Townhomes (183)
Quivas Condos (52)
Riverdale Park #5(252)
CundallFarms(363)
Glen Eagle Estates,Phase 3 (38)
Heritage Todd CreekOutparcels (13)
Todd CreekVillage Center
Larkridge Flg 2North Creek Farms Commercial
Parterre
Parterre(1960)(2184)
Thorncreek Village (270)
Westwood(156)
Horizon PinnacleShopping Center
TalonPointe(362)
BullCrossing
MerrittRanch(291)
Larkridge Flg 1
QuebecHighlands
Amd 327JHighSchool
DenverPremiumOutlets
WillowBend(539)
Villages North F5 A3 (26)Villages North F5 A2 (38)
HighPointe Park
The Oaksat Eastlake
(140)
North EndStation(3500)
Aspen Reserve /Crestview Park (135)
Lambertson LakesSundance Condos (176)
Cherrylane (141)
Wyndemere Flg 6Commercial Center
Sage Valley (72)MillerInventory Lot
Country HillsOffice Campus
Villages at Thorncreek (283)
River Valley Village (127)
Thornton Valley (240)
BrammingHomesite
Welby Station(557)(263)
HomesteadHills (337)
Villages at Thorncreek (283)
Larkridge F2 Apts (338)
144th / GrantMultifamily (465)
City View Heights
Welby Station(557)(263)
BrammingFarm (128)
144th / WashingtonSummit
Washington Center F1 A7
Family DollarPanorama
Point (6)
Catalina-NewportClubhouse and Garage
Parkside (2)
150th and York(110)
Presidential Ridge (120)
The Grove
Arby's
Eastcreek Farm(264)
HighPointe Park
Settler'sChase
(165)
Stargate
Fallbrook Farm Area A (110)
Hunters GlenSelf Storage
Cottonwood LakesMedical Campus
Broadstoneat Thornton
Fabrizio Commercial
Homewood Suites
Qwest ThorntonCentral Storage
Hunter DouglasBusiness Park
SteinMart
Colorado Mini StorageLots 2 & 3
104th and Colorado Multifamily (203)
Eastlake Station
BonaventureSenior Living (156)
Thornton Valley Grocery/Gas
River Valley Village (252)
Country Hills O.C.Self Storage
Creekside(258)
Thorncreek Commons
Kneader's
FallbrookFarm (208)Thorncreek Church
88th & Pecos Maverik
Eastlake Assisted Living
Chuze Fitness
Skylake Ranch TLC
Grange Creek F9 Maverik
Hilton Garden Inn
RTD Park-n-Ride
Godfather's Pizza
View Point
The Grove Lot 10 Shops
SpringvaleAutomotive
Fallbrook FarmFallbrook Farm
Mike Shaw SubaruInventory Lot
Two Deuces (228)
Washington Center Multifamily (336)
Front RangeCrossings
Front Range Crossings-Wilcox
TopgolfViewhouse
Kum & Go
Lord of Life
CarriageHouse (38)
Larkridge Flg 2 Car Wash
Original Thorntonat 88th Station
S:\Ar
cGIS\
Stand
ardMa
ps\C
urren
t_Proj
_201
6081
5_8x
10.m
xd
[
The C
ity of
Thorn
ton G
IS ha
s mad
e eve
ry rea
sona
bleeff
ort to
repre
sent
geog
raphic
data
as ac
curat
ely as
poss
ible,
and a
ssum
es no
liabil
ity as
socia
ted w
ith th
eus
e or m
isuse
of its
prod
ucts.
Infor
matio
n con
taine
dhe
rein i
s for
repres
entat
ional
purpo
ses o
nly an
d is n
otint
ende
d to b
e sub
stitut
ed fo
r acc
urate
boun
dary
locati
ons,
legal
or pro
fessio
nal o
pinion
s.
GIS D
ATA D
ISCLA
IMER
Cur
rent
Dev
elop
men
t Pr
ojec
tsC
urre
nt D
evel
opm
ent
Proj
ects
Aug
ust
15,
2016
Aug
ust
15,
2016
Cit
y of
Tho
rnto
nC
ity
of T
horn
ton
9500
Civi
c Cen
ter D
rive.
Thor
nton
, Colo
rado
8022
9. (
303)
538-
7295
14
50
12
27J
1
Numbers in parentheses are unit counts.Multi-Family are in blue.Single Family are in red.
City BoundarySchool District BdyResidential - ProposedResidential - ApprovedResidential - ActiveCommercial - ProposedCommercial - Approved
Commercial - ActiveInstitutional - ProposedInstitutional - ApprovedInstitutional - ActiveMixed - ProposedMixed - Approved
1 in = 6,500 ft

Cit
y of
Tho
rnto
nC
ity
of T
horn
ton
9500
Civic
Cent
er D
rive.
Thor
nton
, Colo
rado
8022
9. (3
03) 5
38-7
295
[
ZON
ING
ZON
ING
Cur
rent
as
of 5
/24/
2016
Cur
rent
as
of 5
/24/
2016
The C
ity of
Thorn
ton G
IS ha
s mad
e eve
ry rea
sona
bleeff
ort to
repre
sent
geog
raphic
data
as ac
curat
ely as
poss
ible,
and a
ssum
es no
liabil
ity as
socia
ted w
ith th
eus
e or m
isuse
of its
prod
ucts.
Infor
matio
n con
taine
dhe
rein i
s for
repres
entat
ional
purpo
ses o
nly an
d is n
otint
ende
d to b
e sub
stitut
ed fo
r acc
urate
boun
dary
locati
ons,
legal
or pro
fessio
nal o
pinion
s.
GIS D
ATA
DISC
LAIM
ER
S:\Ar
cGIS\
Stan
dardM
aps\Z
oning
8x10
.mxd
6/7/20161 in = 6,550 ft
§̈¦67
£¤58
£¤58
§̈¦67
¬ «2
§̈¦072
¥§¦52
¥§¦52
¥§¦52
£¤63
¬«074E
¬«7
¬«7
¬ «2
120th AVE
HWY 36
YOSE
MITE
ST
ZUNI
ST
128th AVE
YORK
ST
84th AVE
88th AVE
168th AVE
I-25
FEDE
RAL B
LVD
160th AVE
E-470
I-76
104th AVE
COLO
RADO
BLVD
E-470
144th AVE
100th AVE
HOLL
Y ST
152nd AVE
QUEB
EC ST
I-25
HURO
N ST
136th AVE
92nd AVE
112th AVE
WASH
INGT
ON ST
ASFD
RE
PDPD
NS
RC
SFASFDCR
PD
CR
SFA
A
MF
SFAMF
PDCR NS NS
CRPD
MF
SFA
CRI
SFANS
POS
PD
BPCR
MFNS
MFARC MFRCCR MF
SFAMF AAA
CR
MFMF
BPMF
CR
MF
BPMF
SFA SFDMF
MF
CRMF
PD
SFA
SFDPD MFCR
MF RCCR
NS SFAMF
PD
CR
PD
SFDSFA
A
SFDMF
CR SFAMF PD
PD
RE
A
NSMF
SFD
PD
SFD
PD
SFD
A
ASFD
SFA
NS
PD
MH
SFA
SFDMH
MFSFA
NSCC
MH
I
SFABPPD
CR
MC
MH
A
RCBP
PD
PD
CR POS
PD
SFA
A
PD
CR
RC
CR
CC
CRCR
CC
CR
PD
NS
CRCR
A
A
CR
BP
BP
RC
BP
SFD
SFD
SFD
CR
SFD
PD
CR
CRSFD
PDPD
RC
PD
NS
RCSFD NS
SFD
CRRC
RC
NSMF
NS
SFDSFA
SFDSFD
NSSFD
CR
A
A
SFA
SFD
PD
RCCC
BPCR
RC
NS
NS MF
CR
SFA
SFDSFD
POS
SFA
NS
PD
PD
SFD
SFD
SFD
MF
POS
POS
MF
CRPD
PD
PD
PD
MF
PD
MF
MF
SFA
POS
PD
SFANS
SFA
SFD
PD
SFD
PD
POSSFA
PD
BPBP
PD
RE
PD
PD
CC
PD
SFA
PD
ABP
SFD
POS
SFD
POS
SFD
POS
POS
SFA
SFA
PD
SFDCR
PD
PD
NS
I
D
CC
PD
MF
PD
BP
RC
SFD
CRMF
MF
MFSFA
POS
SFDPOS
CR
POS
SFA
POS
SFDSFD
CR
POS
SFD
POS CR
RE
PD DR
POS
DR
PD
SFA
CR
CRCR
CR
CR
POS
POSPOS
POS
POS
POS
POS
POS POS
POSPOS
POS
POS
POS
POS POSPOS
SFDPOS
POS POS
SFAPOS
RE
POS
POS
A
POS
POS
PDPOS
POS
POS
POS
POS
POS
POS
SFD
POS
POS
POS
POS
POSPOS
POS
CR
POS
POS
POS
POS
POS
POS
POS
POSPOS
POSPD
POS
POSPOS
NS
POS
POSPOS
POSPOS
POS
POS
POS
POS
POS
POS
RCRCPOS
POS
POSPOS
POS
POS
POS
POS
POS
POSPOS
POSPOS
POS
POSPOS
PD
PD PDPDPD
BP
BP
POS
BP
POS
POS
POS
SFD
MF
PD
CR
APD
POS
PD
MFCR
SFD
PD
DR DR
POS
POS
A
POS
POS
POS
PD
PD
A
POS
SFA
SFD
PD
CR
PD
POS SFD
DR
BP
PDDR
PD
SFD
SFA
POS
POS
PD
MF
CR
POS
POS
POS
POS
CR
NS
PD
SFA
SFA
PD
D
RESB
A C
RESC
POS
PD
PD
Eastlake Zoning
DistrictPD
SFD
POS
PD
SFD
NS
PDSFD
SFA
BP
DBP
D
RESB
A C
RESC
POSEastlake
Zoning DistrictPD
Eastlake Zoning DistrictsES - ServicesER - ResidentialEO - OfficeETD - Transit OrientedEB - BusinessOther City Zoning DistrictsZoning BoundaryCity Boundary
LegendCity BoundaryZoning BoundaryAgricultureParks/Open SpaceResidential EstateSingle Family DetachedSingle Family AttachedMulti FamilyManufactured HomePlanned DevelopmentNeighborhood ServicesCommunity RetailRegional CommercialCity CenterBusiness ParkIndustrialMineral ConservationEastlake ZoningDevelopment Reserve

WASHINGTON ST WASHINGTON ST144TH AVE144TH AVE
(303) 216-2439www.alltrafficdata.net
Location: 1 WASHINGTON ST & 144TH AVE AM
Wednesday, July 13, 2016Date and Start Time:
Peak Hour - All Vehicles
Traffic Counts
Note: Total study counts contained in parentheses.
Peak Hour - Pedestrians/Bicycles on Crosswalk
Peak Hour: 07:15 AM - 08:15 AM
Peak 15-Minutes: 07:45 AM - 08:00 AM
198 163
648
201
197220
303
762
0.96
N
S
EW
0.89
0.97
0.87
0.90
(336)(396)
(1,290)
(397)
(1,553)
(590)
(400)(390)
80 17
17
580
51
59
181
63
0
0
110102
82 130
144TH AVE
144TH AVE
WASHINGTON ST
WASHINGTON ST
0
0
0
1
N
S
EW
00
00
0 0
01
Left Thru Right Total
EastboundIntervalStart Time
RollingHour West East South North
Pedestrain Crossings
U-Turn
Westbound Northbound Southbound
Left Thru RightU-Turn Left Thru RightU-Turn Left Thru RightU-Turn
7:00 AM 0 21 18 0 2 170 15 36 0 6 146 306 0 5 0 01,34414 5 1 25
7:15 AM 0 32 26 0 4 280 17 41 0 6 160 347 0 0 0 01,34612 2 3 16
7:30 AM 0 22 26 1 0 290 10 40 0 18 151 341 0 0 0 01,33117 3 2 22
7:45 AM 0 26 15 0 3 290 19 47 0 19 144 350 0 0 0 01,32815 6 3 24
8:00 AM 0 22 15 0 0 240 17 53 0 8 125 308 1 0 0 01,33215 6 5 18
8:15 AM 0 28 19 0 6 130 20 41 0 8 143 332 1 3 0 011 8 4 31
8:30 AM 0 23 29 0 1 150 9 39 0 10 153 338 0 1 0 018 9 7 25
8:45 AM 0 26 22 0 6 210 15 48 0 16 134 354 0 0 0 021 4 5 36
Count Total 1973043123 2,67617622117020001,1569103451220 002 9
Peak Hour 0 63 181 0 51 580 0 102 82 1 7 110 1,34659 17 13 80 1 0 0 0
WASHINGTON ST WASHINGTON ST 152ND AVE
(303) 216-2439www.alltrafficdata.net
Location: 2 WASHINGTON ST & 152ND AVE AM
Wednesday, July 13, 2016Date and Start Time:
Peak Hour - All Vehicles
Traffic Counts
Note: Total study counts contained in parentheses.
Peak Hour - Pedestrians/Bicycles on Crosswalk
Peak Hour: 07:15 AM - 08:15 AM
Peak 15-Minutes: 07:30 AM - 07:45 AM
136 67
143192
64
84
0.90
N
S
EW
0.86
0.85
0.66
(120)(237)
(179)
(139)
(286)(363)
6 00
61
0
3
0
13078 64 01
152ND AVE
WASHINGTON ST
WASHINGTON ST
0
0
0
N
S
EW
00
0 0
00
Left Thru Right Total
EastboundIntervalStart Time
RollingHour West East South North
Pedestrain Crossings
U-Turn
Westbound Northbound Southbound
Left Thru RightU-Turn Left Thru RightU-Turn Left Thru RightU-Turn
7:00 AM 1 23 11 0 0 270 1 0 71 0 0 03428 0 0
7:15 AM 0 20 16 0 0 340 1 0 85 0 0 034313 0 1
7:30 AM 0 15 25 0 0 360 1 0 95 0 0 033114 0 4
7:45 AM 0 19 13 0 0 410 0 0 91 0 0 032117 0 1
8:00 AM 1 24 10 0 0 190 1 0 72 0 0 032017 0 0
8:15 AM 0 20 12 0 0 260 1 0 73 0 0 012 0 2
8:30 AM 0 28 14 0 0 210 1 0 85 0 0 020 0 1
8:45 AM 0 21 13 0 0 240 0 0 90 0 0 032 0 0
Count Total 90133 662228001141702060 000
Peak Hour 0 3 0 1 78 64 0 0 130 34361 0 6 0 0 0
YORK ST YORK ST152ND AVE
(303) 216-2439www.alltrafficdata.net
Location: 3 YORK ST & 152ND AVE AM
Wednesday, July 13, 2016Date and Start Time:
Peak Hour - All Vehicles
Traffic Counts
Note: Total study counts contained in parentheses.
Peak Hour - Pedestrians/Bicycles on Crosswalk
Peak Hour: 07:00 AM - 08:00 AM
Peak 15-Minutes: 07:30 AM - 07:45 AM
193 180
140
63
59149
0.86
N
S
EW
0.88
0.84
0.65
(314)(317)
(251)
(121)
(111)(244)
0 058
126
0
14
0
1350 54 50
152ND AVE
YORK ST
YORK ST
0
0
0
N
S
EW
00
00
0 0
Left Thru Right Total
EastboundIntervalStart Time
RollingHour West East South North
Pedestrain Crossings
U-Turn
Westbound Northbound Southbound
Left Thru RightU-Turn Left Thru RightU-Turn Left Thru RightU-Turn
7:00 AM 0 0 13 0 15 270 2 0 81 0 0 039223 1 0
7:15 AM 0 0 8 0 16 340 3 0 85 0 0 038023 1 0
7:30 AM 0 0 21 0 13 330 6 0 114 0 0 037639 2 0
7:45 AM 0 0 12 0 14 410 3 0 112 0 0 034241 1 0
8:00 AM 0 0 9 0 10 170 1 0 69 0 0 028728 4 0
8:15 AM 0 0 7 0 12 241 8 0 81 0 0 025 4 0
8:30 AM 0 0 16 0 16 190 5 0 80 0 0 023 1 0
8:45 AM 0 0 10 0 9 170 4 0 57 0 0 016 1 0
Count Total 015218 679212105096000321 000
Peak Hour 0 14 0 0 0 54 0 58 135 392126 5 0 0 0 0

WASHINGTON ST WASHINGTON ST144TH AVE144TH AVE
(303) 216-2439www.alltrafficdata.net
Location: 1 WASHINGTON ST & 144TH AVE PM
Wednesday, July 13, 2016Date and Start Time:
Peak Hour - All Vehicles
Traffic Counts
Note: Total study counts contained in parentheses.
Peak Hour - Pedestrians/Bicycles on Crosswalk
Peak Hour: 04:45 PM - 05:45 PM
Peak 15-Minutes: 05:00 PM - 05:15 PM
365 546
499
799
497578
1,291
729
0.89
N
S
EW
0.91
0.83
0.74
0.86
(847)(741)
(932)
(1,525)
(1,405)
(2,286)
(865)(1,047)
131 038
44
421
34
348
686
257
0
0
196177
245
750
144TH AVE
144TH AVE
WASHINGTON ST
WASHINGTON ST
3
1
0
0
N
S
EW
10
00
1 2
00
Left Thru Right Total
EastboundIntervalStart Time
RollingHour West East South North
Pedestrain Crossings
U-Turn
Westbound Northbound Southbound
Left Thru RightU-Turn Left Thru RightU-Turn Left Thru RightU-Turn
4:00 PM 0 38 33 1 15 380 27 139 0 8 94 506 0 0 0 12,19262 7 16 28
4:15 PM 0 32 33 0 17 580 33 141 0 9 89 532 0 0 0 02,43179 4 7 30
4:30 PM 0 53 37 0 13 390 35 154 0 8 100 568 0 0 0 02,57859 7 21 42
4:45 PM 0 34 41 0 7 430 69 164 0 5 90 586 0 1 0 12,65266 15 22 30
5:00 PM 0 60 98 0 9 580 109 158 0 7 85 745 0 0 0 02,632108 4 12 37
5:15 PM 0 41 61 0 11 530 40 189 0 10 119 679 0 0 0 192 14 21 28
5:30 PM 0 42 45 0 11 420 39 175 0 12 127 642 0 0 0 082 11 20 36
5:45 PM 0 48 41 0 24 390 31 170 0 5 90 566 0 0 0 065 12 9 32
Count Total 26312874613 4,824370107138934807946401,2903830 300 1
Peak Hour 0 257 686 0 34 421 0 177 245 0 38 196 2,652348 44 75 131 0 1 0 2

WASHINGTON ST WASHINGTON ST 152ND AVE
(303) 216-2439www.alltrafficdata.net
Location: 2 WASHINGTON ST & 152ND AVE PM
Wednesday, July 13, 2016Date and Start Time:
Peak Hour - All Vehicles
Traffic Counts
Note: Total study counts contained in parentheses.
Peak Hour - Pedestrians/Bicycles on Crosswalk
Peak Hour: 04:45 PM - 05:45 PM
Peak 15-Minutes: 05:00 PM - 05:15 PM
134 200
563360
269
406
0.74
N
S
EW
0.84
0.65
0.91
(329)(237)
(597)
(508)
(863)(682)
28 00
254
0
15
0
106378
185
00
152ND AVE
WASHINGTON ST
WASHINGTON ST
0
0
0
N
S
EW
00
0 0
00
Left Thru Right Total
EastboundIntervalStart Time
RollingHour West East South North
Pedestrain Crossings
U-Turn
Westbound Northbound Southbound
Left Thru RightU-Turn Left Thru RightU-Turn Left Thru RightU-Turn
4:00 PM 0 39 25 0 0 200 1 0 139 0 0 068853 0 1
4:15 PM 0 40 30 0 0 190 2 0 162 0 0 087469 0 2
4:30 PM 0 50 36 0 0 230 2 0 172 0 0 093956 0 5
4:45 PM 0 91 37 0 0 200 1 0 215 0 0 096663 0 3
5:00 PM 0 148 70 0 0 240 2 0 325 0 0 092072 0 9
5:15 PM 0 80 43 0 0 310 4 0 227 0 0 057 0 12
5:30 PM 0 59 35 0 0 310 8 0 199 0 0 062 0 4
5:45 PM 0 50 30 0 0 290 3 0 169 0 0 053 0 4
Count Total 400485 1,6081970030655700230 000
Peak Hour 0 15 0 0 378 185 0 0 106 966254 0 28 0 0 0

YORK ST YORK ST152ND AVE
(303) 216-2439www.alltrafficdata.net
Location: 3 YORK ST & 152ND AVE PM
Wednesday, July 13, 2016Date and Start Time:
Peak Hour - All Vehicles
Traffic Counts
Note: Total study counts contained in parentheses.
Peak Hour - Pedestrians/Bicycles on Crosswalk
Peak Hour: 05:00 PM - 06:00 PM
Peak 15-Minutes: 05:15 PM - 05:30 PM
335 275
112
226
198144
0.86
N
S
EW
0.78
0.90
0.75
(473)(547)
(204)
(378)
(332)(232)
0 0
204
99
0
13
0
1310 176
220
152ND AVE
YORK ST
YORK ST
0
0
6
N
S
EW
00
33
0 0
Left Thru Right Total
EastboundIntervalStart Time
RollingHour West East South North
Pedestrain Crossings
U-Turn
Westbound Northbound Southbound
Left Thru RightU-Turn Left Thru RightU-Turn Left Thru RightU-Turn
4:00 PM 0 0 20 0 36 140 4 0 91 0 0 043814 3 0
4:15 PM 0 0 29 0 29 220 2 0 112 0 0 051225 5 0
4:30 PM 0 0 39 0 38 220 3 0 124 0 0 058818 4 0
4:45 PM 0 0 30 0 33 180 3 0 111 0 0 062023 4 0
5:00 PM 0 0 62 0 40 300 3 0 165 0 0 064526 4 0
5:15 PM 0 0 44 0 65 430 3 0 188 0 0 028 5 0
5:30 PM 0 0 40 0 53 310 3 0 156 0 0 023 6 0
5:45 PM 0 0 30 0 46 270 4 0 136 0 0 022 7 0
Count Total 038179 1,0832073400294000250 000
Peak Hour 0 13 0 0 0 176 0 204 131 64599 22 0 0 0 0

Pa
ge
1
Da
te S
tart
: 1
4-J
ul-1
61
52
ND
AV
E W
/O Y
OR
K S
TS
tatio
n I
D:
6D
ate
En
d:
14
-Ju
l-1
6
All
Tra
ffic
Data
Serv
ices,
Inc
ww
w.a
lltr
aff
icd
ata
.net
S
tart
11-J
ul-16
Tue
Wed
Thu
Fri
Sat
Sun
Week
Ave
rage
Tim
eE
BW
BE
BW
BE
BW
BE
BW
BE
BW
BE
BW
BE
BW
BE
BW
B1
2:0
0 A
M*
**
**
*8
0*
**
**
*8
00
1:0
0*
**
**
*4
4*
**
**
*4
40
2:0
0*
**
**
*3
4*
**
**
*3
40
3:0
0*
**
**
*3
6*
**
**
*3
60
4:0
0*
**
**
*4
7*
**
**
*4
70
5:0
0*
**
**
*7
53
**
**
**
753
06:0
0*
**
**
*46
125
**
**
**
46
125
07:0
0*
**
**
*67
147
**
**
**
67
147
08:0
0*
**
**
*52
97
**
**
**
52
97
09:0
0*
**
**
*60
78
**
**
**
60
78
10:0
0*
**
**
*48
95
**
**
**
48
95
11:0
0*
**
**
*74
82
**
**
**
74
82
12:0
0 P
M*
**
**
*81
86
**
**
**
81
86
01:0
0*
**
**
*90
84
**
**
**
90
84
02:0
0*
**
**
*113
76
**
**
**
113
76
03:0
0*
**
**
*106
68
**
**
**
106
68
04:0
0*
**
**
*131
89
**
**
**
131
89
05:0
0*
**
**
*198
145
**
**
**
198
145
06:0
0*
**
**
*95
86
**
**
**
95
86
07:0
0*
**
**
*83
50
**
**
**
83
50
08:0
0*
**
**
*68
43
**
**
**
68
43
09:0
0*
**
**
*63
18
**
**
**
63
18
10:0
0*
**
**
*33
7*
**
**
*33
71
1:0
0*
**
**
*20
4*
**
**
*20
4Lane
00
00
00
1457
1454
00
00
00
1457
1454
Day
00
02911
00
02911
AM
Peak
--
--
--
11:0
007:0
0-
--
--
-11:0
007:0
0V
ol.
--
--
--
74
147
--
--
--
74
147
PM
Peak
--
--
--
17:0
017:0
0-
--
--
-17:0
017:0
0V
ol.
--
--
--
198
145
--
--
--
198
145
Com
b.
Tota
l0
00
2911
00
02911
AD
TA
DT
2,9
11
AA
DT
2,9
11

Page 1
Site Code: 4Station ID: 4
WASHINGTON ST S/O 152ND
All Traffic Data Services, Inc9660 W 44th Ave
Wheat Ridge,CO 80033www.alltrafficdata.net
Start 14-Jul-16 Time Thu NB SB Total
12:00 AM 3 14 1701:00 1 0 102:00 4 6 1003:00 2 0 204:00 20 2 2205:00 25 7 3206:00 71 41 11207:00 139 172 31108:00 164 173 33709:00 167 102 26910:00 183 174 357
11:00 231 238 46912:00 PM 237 249 486
01:00 234 260 49402:00 205 269 47403:00 206 262 46804:00 323 319 642
05:00 540 361 90106:00 217 296 51307:00 140 206 34608:00 70 136 20609:00 34 63 9710:00 13 32 4511:00 10 18 28Total 3239 3400 6639
Percent 48.8% 51.2% AM Peak - 11:00 11:00 - - - - - - 11:00
Vol. - 231 238 - - - - - - 469PM Peak - 17:00 17:00 - - - - - - 17:00
Vol. - 540 361 - - - - - - 901Grand
Total 3239 3400 6639
Percent 48.8% 51.2%
ADT ADT 6,639 AADT 6,639

Pa
ge
1
Da
te S
tart
: 1
4-J
ul-1
6W
AS
HIN
GT
ON
ST
N/O
15
2N
D A
VE
Sta
tio
n I
D:
5D
ate
En
d:
14
-Ju
l-1
6
All
Tra
ffic
Data
Serv
ices,
Inc
ww
w.a
lltr
aff
icd
ata
.net
S
tart
11-J
ul-16
Tue
Wed
Thu
Fri
Sat
Sun
Week
Ave
rage
Tim
eN
BS
BN
BS
BN
BS
BN
BS
BN
BS
BN
BS
BN
BS
BN
BS
B1
2:0
0 A
M*
**
**
*3
11
**
**
**
311
01:0
0*
**
**
*1
0*
**
**
*1
00
2:0
0*
**
**
*3
5*
**
**
*3
50
3:0
0*
**
**
*2
0*
**
**
*2
00
4:0
0*
**
**
*16
2*
**
**
*16
20
5:0
0*
**
**
*20
6*
**
**
*20
60
6:0
0*
**
**
*55
34
**
**
**
55
34
07:0
0*
**
**
*83
57
**
**
**
83
57
08:0
0*
**
**
*104
88
**
**
**
104
88
09:0
0*
**
**
*130
83
**
**
**
130
83
10:0
0*
**
**
*143
142
**
**
**
143
142
11:0
0*
**
**
*179
194
**
**
**
179
194
12:0
0 P
M*
**
**
*184
203
**
**
**
184
203
01:0
0*
**
**
*181
212
**
**
**
181
212
02:0
0*
**
**
*159
219
**
**
**
159
219
03:0
0*
**
**
*159
213
**
**
**
159
213
04:0
0*
**
**
*229
250
**
**
**
229
250
05:0
0*
**
**
*366
261
**
**
**
366
261
06:0
0*
**
**
*168
241
**
**
**
168
241
07:0
0*
**
**
*109
167
**
**
**
109
167
08:0
0*
**
**
*54
110
**
**
**
54
110
09:0
0*
**
**
*27
51
**
**
**
27
51
10:0
0*
**
**
*11
27
**
**
**
11
27
11:0
0*
**
**
*8
15
**
**
**
815
Lane
00
00
00
2394
2591
00
00
00
2394
2591
Day
00
04985
00
04985
AM
Peak
--
--
--
11:0
011:0
0-
--
--
-11:0
011:0
0V
ol.
--
--
--
179
194
--
--
--
179
194
PM
Peak
--
--
--
17:0
017:0
0-
--
--
-17:0
017:0
0V
ol.
--
--
--
366
261
--
--
--
366
261
Com
b.
Tota
l0
00
4985
00
04985
AD
TA
DT
4,9
85
AA
DT
4,9
85

APPENDIX B
Level of Service Definitions

The following information can be found in the Highway Capacity Manual, Transportation Research Board, 2010: Chapter 18 – Signalized Intersections and Chapter 19 – Two-Way Stop Controlled Intersections.
Automobile Level of Service (LOS) for Signalized Intersections
Levels of service are defined to represent reasonable ranges in control delay. LOS A Describes operations with a control delay of 10s/veh or less and a volume-to-capacity ratio no greater than 1.0. This level is typically assigned when the volume-to-capacity ratio is low and either progression is exceptionally favorable or the cycle length is very short. If it is due to favorable progression, most vehicles arrive during the green indication and travel through the intersection without stopping. LOS B Describes operations with control delay between 10 and 20 s/veh and a volume-to-capacity ratio no greater than 1.0. This level is typically assigned when the volume-to-capacity ratio is low and either progression is highly favorable or the cycle length is short. More vehicles stop than with LOS A. LOS C Describes operations with control delay between 20 and 35 s/veh and a volume-to-capacity ratio no greater than 1.0. This level is typically assigned when progression is favorable or the cycle length is moderate. Individual cycle failures (i.e., one or more queued vehicles are not able to depart as a result of insufficient capacity during the cycle) may begin to appear at this level. The number of vehicles stopping is .significant, although many vehicles still pass through the intersection without stopping. LOS D Describes operations with control delay between 35 and 55 s/veh and a volume-to-capacity ratio no greater than 1.0.This level is typically assigned when the volume-to-capacity ratio is high and either progression is ineffective or the cycle length is long. Many vehicles stop and individual cycle failures are noticeable. LOS E Describes operations with control delay between 55 and 80 s/veh and a volume-to-capacity ratio no greater than 1.0. This level is typically assigned when the volume-to-capacity ratio is high, progression is unfavorable, and the cycle length is long. Individual cycle failures are frequent. LOS F Describes operations with control delay exceeding 80 s/veh or a volume-to-capacity ratio greater than 1.0. This level is typically assigned when the volume-to-capacity ratio is very high, progression is very poor, and the cycle length is long. Most cycles fail to clear the queue.
Level of Service (LOS) for Unsignalized TWSC Intersections
Level of Service Average Control Delay (s/veh) A 0 - 10 B > 10 - 15 C > 15 - 25 D > 25 - 35 E > 35 - 50 F > 50

APPENDIX C
Capacity Worksheets

Timings Existing Traffic Volumes1: Washington Street/Washington St & 144th Avenue AM Peak Hour
September 2016 Synchro ReportSM ROCHA, LLC
Lane Group EBL EBT EBR WBL WBT WBR NBL NBT NBR SBL SBT SBRLane ConfigurationsTraffic Volume (vph) 63 181 59 51 580 17 102 82 13 8 110 80Future Volume (vph) 63 181 59 51 580 17 102 82 13 8 110 80Satd. Flow (prot) 3433 3539 1583 3433 3539 1583 3433 3539 1583 3433 3539 1583Flt Permitted 0.950 0.950 0.950 0.950Satd. Flow (perm) 3433 3539 1583 3433 3539 1583 3433 3539 1583 3433 3539 1583Satd. Flow (RTOR) 153 153 147 147Lane Group Flow (vph) 68 197 64 55 630 18 111 89 14 9 120 87Turn Type Prot NA Perm Prot NA Perm Prot NA Perm Prot NA PermProtected Phases 7 4 3 8 5 2 1 6Permitted Phases 4 8 2 6Detector Phase 7 4 4 3 8 8 5 2 2 1 6 6Switch PhaseMinimum Initial (s) 5.0 10.0 10.0 5.0 10.0 10.0 5.0 5.0 5.0 5.0 5.0 5.0Minimum Split (s) 10.5 39.0 39.0 10.5 29.0 29.0 10.5 34.0 34.0 10.5 31.0 31.0Total Split (s) 10.6 39.0 39.0 10.6 39.0 39.0 10.6 39.8 39.8 10.6 39.8 39.8Total Split (%) 10.6% 39.0% 39.0% 10.6% 39.0% 39.0% 10.6% 39.8% 39.8% 10.6% 39.8% 39.8%Yellow Time (s) 4.0 4.5 4.5 4.0 4.5 4.5 4.0 5.0 5.0 4.0 5.0 5.0All-Red Time (s) 1.5 1.0 1.0 1.5 1.0 1.0 1.5 1.0 1.0 1.5 1.0 1.0Lost Time Adjust (s) 0.0 0.0 0.0 0.0 0.0 0.0 0.0 0.0 0.0 0.0 0.0 0.0Total Lost Time (s) 5.5 5.5 5.5 5.5 5.5 5.5 5.5 6.0 6.0 5.5 6.0 6.0Lead/Lag Lead Lag Lag Lead Lag Lag Lead Lag Lag Lead Lag LagLead-Lag Optimize? Yes Yes Yes Yes Yes Yes Yes Yes Yes Yes Yes YesRecall Mode None None None None None None None C-Max C-Max None C-Max C-MaxAct Effct Green (s) 5.1 23.9 23.9 5.1 23.9 23.9 8.2 53.7 53.7 5.8 42.4 42.4Actuated g/C Ratio 0.05 0.24 0.24 0.05 0.24 0.24 0.08 0.54 0.54 0.06 0.42 0.42v/c Ratio 0.39 0.23 0.13 0.31 0.74 0.04 0.39 0.05 0.02 0.05 0.08 0.12Control Delay 52.7 30.3 0.5 50.8 40.6 0.1 47.5 14.7 0.0 44.8 20.1 0.9Queue Delay 0.0 0.0 0.0 0.0 0.0 0.0 0.0 0.0 0.0 0.0 0.0 0.0Total Delay 52.7 30.3 0.5 50.8 40.6 0.1 47.5 14.7 0.0 44.8 20.1 0.9LOS D C A D D A D B A D C AApproach Delay 29.1 40.4 30.7 13.4Approach LOS C D C BQueue Length 50th (ft) 22 53 0 18 196 0 35 13 0 3 24 0Queue Length 95th (ft) 44 77 0 37 238 0 62 36 0 11 47 6Internal Link Dist (ft) 632 550 415 4110Turn Bay Length (ft) 203 351 150 150 211 211 170 204Base Capacity (vph) 175 1185 632 175 1185 632 282 1901 918 199 1499 755Starvation Cap Reductn 0 0 0 0 0 0 0 0 0 0 0 0Spillback Cap Reductn 0 0 0 0 0 0 0 0 0 0 0 0Storage Cap Reductn 0 0 0 0 0 0 0 0 0 0 0 0Reduced v/c Ratio 0.39 0.17 0.10 0.31 0.53 0.03 0.39 0.05 0.02 0.05 0.08 0.12
Intersection SummaryCycle Length: 100Actuated Cycle Length: 100Offset: 45 (45%), Referenced to phase 2:NBT and 6:SBT, Start of GreenNatural Cycle: 95Control Type: Actuated-Coordinated
Appendix C - Capacity Worksheets - Page 1
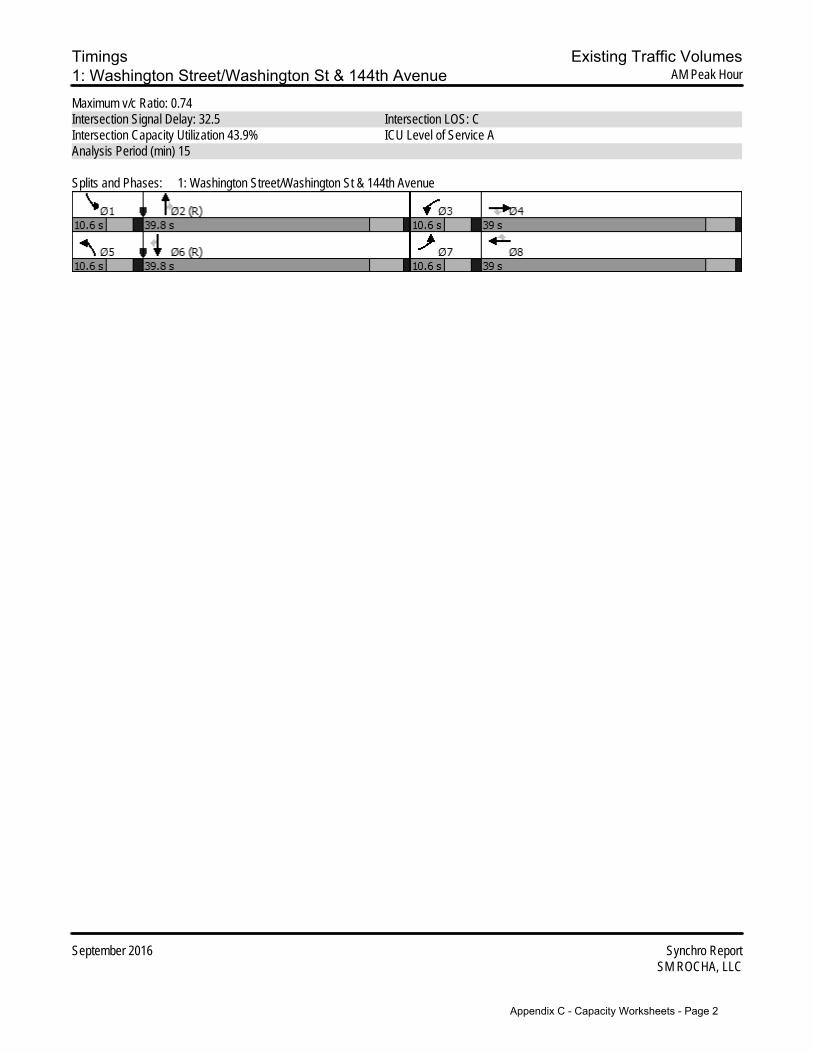
Timings Existing Traffic Volumes1: Washington Street/Washington St & 144th Avenue AM Peak Hour
September 2016 Synchro ReportSM ROCHA, LLC
Maximum v/c Ratio: 0.74Intersection Signal Delay: 32.5 Intersection LOS: CIntersection Capacity Utilization 43.9% ICU Level of Service AAnalysis Period (min) 15
Splits and Phases: 1: Washington Street/Washington St & 144th Avenue
Appendix C - Capacity Worksheets - Page 2

HCM Unsignalized Intersection Capacity Analysis Existing Traffic Volumes2: Washington St/E. 152nd Ave AM Peak Hour
September 2016 Synchro ReportSM ROCHA, LLC
Movement EBL EBR NBL NBT SBT SBRLane ConfigurationsTraffic Volume (veh/h) 3 61 79 64 130 19Future Volume (Veh/h) 3 61 79 64 130 19Sign Control Stop Free FreeGrade 0% 0% 0%Peak Hour Factor 0.92 0.92 0.92 0.92 0.92 0.92Hourly flow rate (vph) 3 66 86 70 141 21PedestriansLane Width (ft)Walking Speed (ft/s)Percent BlockageRight turn flare (veh) 9Median type Raised RaisedMedian storage veh) 1 1Upstream signal (ft)pX, platoon unblockedvC, conflicting volume 383 141 162vC1, stage 1 conf vol 141vC2, stage 2 conf vol 242vCu, unblocked vol 383 141 162tC, single (s) 6.4 6.2 4.1tC, 2 stage (s) 5.4tF (s) 3.5 3.3 2.2p0 queue free % 100 93 94cM capacity (veh/h) 630 907 1417
Direction, Lane # EB 1 NB 1 NB 2 SB 1 SB 2Volume Total 69 86 70 141 21Volume Left 3 86 0 0 0Volume Right 66 0 0 0 21cSH 948 1417 1700 1700 1700Volume to Capacity 0.07 0.06 0.04 0.08 0.01Queue Length 95th (ft) 6 5 0 0 0Control Delay (s) 9.3 7.7 0.0 0.0 0.0Lane LOS A AApproach Delay (s) 9.3 4.2 0.0Approach LOS A
Intersection SummaryAverage Delay 3.4Intersection Capacity Utilization 24.6% ICU Level of Service AAnalysis Period (min) 15
Appendix C - Capacity Worksheets - Page 3

HCM Unsignalized Intersection Capacity Analysis Existing Traffic Volumes3: E. 152nd Ave & York Street AM Peak Hour
September 2016 Synchro ReportSM ROCHA, LLC
Movement WBL WBR NBT NBR SBL SBTLane ConfigurationsTraffic Volume (veh/h) 14 126 54 13 58 135Future Volume (Veh/h) 14 126 54 13 58 135Sign Control Stop Free FreeGrade 0% 0% 0%Peak Hour Factor 0.92 0.92 0.92 0.92 0.92 0.92Hourly flow rate (vph) 15 137 59 14 63 147PedestriansLane Width (ft)Walking Speed (ft/s)Percent BlockageRight turn flare (veh) 11Median type None NoneMedian storage veh)Upstream signal (ft)pX, platoon unblockedvC, conflicting volume 332 59 73vC1, stage 1 conf volvC2, stage 2 conf volvCu, unblocked vol 332 59 73tC, single (s) 6.4 6.2 4.1tC, 2 stage (s)tF (s) 3.5 3.3 2.2p0 queue free % 98 86 96cM capacity (veh/h) 636 1007 1527
Direction, Lane # WB 1 NB 1 NB 2 SB 1 SB 2Volume Total 152 59 14 63 147Volume Left 15 0 0 63 0Volume Right 137 0 14 0 0cSH 1117 1700 1700 1527 1700Volume to Capacity 0.14 0.03 0.01 0.04 0.09Queue Length 95th (ft) 12 0 0 3 0Control Delay (s) 9.3 0.0 0.0 7.5 0.0Lane LOS A AApproach Delay (s) 9.3 0.0 2.2Approach LOS A
Intersection SummaryAverage Delay 4.3Intersection Capacity Utilization 19.9% ICU Level of Service AAnalysis Period (min) 15
Appendix C - Capacity Worksheets - Page 4

Timings Existing Traffic Volumes1: Washington Street/Washington St & 144th Avenue PM Peak Hour
September 2016 Synchro ReportSM ROCHA, LLC
Lane Group EBL EBT EBR WBL WBT WBR NBL NBT NBR SBL SBT SBRLane ConfigurationsTraffic Volume (vph) 257 686 348 34 421 44 177 245 75 38 196 131Future Volume (vph) 257 686 348 34 421 44 177 245 75 38 196 131Satd. Flow (prot) 3433 3539 1583 3433 3539 1583 3433 3539 1583 3433 3539 1583Flt Permitted 0.950 0.950 0.950 0.950Satd. Flow (perm) 3433 3539 1583 3433 3539 1583 3433 3539 1583 3433 3539 1583Satd. Flow (RTOR) 378 153 147 147Lane Group Flow (vph) 279 746 378 37 458 48 192 266 82 41 213 142Turn Type Prot NA Perm Prot NA Perm Prot NA Perm Prot NA PermProtected Phases 7 4 3 8 5 2 1 6Permitted Phases 4 8 2 6Detector Phase 7 4 4 3 8 8 5 2 2 1 6 6Switch PhaseMinimum Initial (s) 5.0 10.0 10.0 5.0 10.0 10.0 5.0 5.0 5.0 5.0 5.0 5.0Minimum Split (s) 10.5 39.0 39.0 10.5 29.0 29.0 10.5 34.0 34.0 10.5 31.0 31.0Total Split (s) 10.6 39.0 39.0 10.6 39.0 39.0 10.6 39.8 39.8 10.6 39.8 39.8Total Split (%) 10.6% 39.0% 39.0% 10.6% 39.0% 39.0% 10.6% 39.8% 39.8% 10.6% 39.8% 39.8%Yellow Time (s) 4.0 4.5 4.5 4.0 4.5 4.5 4.0 5.0 5.0 4.0 5.0 5.0All-Red Time (s) 1.5 1.0 1.0 1.5 1.0 1.0 1.5 1.0 1.0 1.5 1.0 1.0Lost Time Adjust (s) 0.0 0.0 0.0 0.0 0.0 0.0 0.0 0.0 0.0 0.0 0.0 0.0Total Lost Time (s) 5.5 5.5 5.5 5.5 5.5 5.5 5.5 6.0 6.0 5.5 6.0 6.0Lead/Lag Lead Lag Lag Lead Lag Lag Lead Lag Lag Lead Lag LagLead-Lag Optimize? Yes Yes Yes Yes Yes Yes Yes Yes Yes Yes Yes YesRecall Mode None None None None None None None C-Max C-Max None C-Max C-MaxAct Effct Green (s) 5.1 29.3 29.3 5.1 25.0 25.0 9.2 46.0 46.0 5.9 38.1 38.1Actuated g/C Ratio 0.05 0.29 0.29 0.05 0.25 0.25 0.09 0.46 0.46 0.06 0.38 0.38v/c Ratio 1.59 0.72 0.52 0.21 0.52 0.09 0.61 0.16 0.10 0.20 0.16 0.20Control Delay 325.4 35.8 5.4 48.6 33.3 0.4 54.8 19.5 0.5 47.4 22.1 4.6Queue Delay 0.0 0.0 0.0 0.0 0.0 0.0 0.0 0.0 0.0 0.0 0.0 0.0Total Delay 325.4 35.8 5.4 48.6 33.3 0.4 54.8 19.5 0.5 47.4 22.1 4.6LOS F D A D C A D B A D C AApproach Delay 85.2 31.4 29.2 18.4Approach LOS F C C BQueue Length 50th (ft) ~131 223 0 11 124 0 61 60 0 12 50 0Queue Length 95th (ft) #214 272 62 28 160 0 #143 94 3 30 77 39Internal Link Dist (ft) 632 550 415 4110Turn Bay Length (ft) 203 351 150 150 211 211 170 204Base Capacity (vph) 175 1185 781 175 1185 632 317 1626 807 203 1349 694Starvation Cap Reductn 0 0 0 0 0 0 0 0 0 0 0 0Spillback Cap Reductn 0 0 0 0 0 0 0 0 0 0 0 0Storage Cap Reductn 0 0 0 0 0 0 0 0 0 0 0 0Reduced v/c Ratio 1.59 0.63 0.48 0.21 0.39 0.08 0.61 0.16 0.10 0.20 0.16 0.20
Intersection SummaryCycle Length: 100Actuated Cycle Length: 100Offset: 93 (93%), Referenced to phase 2:NBT and 6:SBT, Start of GreenNatural Cycle: 95Control Type: Actuated-Coordinated
Appendix C - Capacity Worksheets - Page 5

Timings Existing Traffic Volumes1: Washington Street/Washington St & 144th Avenue PM Peak Hour
September 2016 Synchro ReportSM ROCHA, LLC
Maximum v/c Ratio: 1.59Intersection Signal Delay: 55.4 Intersection LOS: EIntersection Capacity Utilization 52.8% ICU Level of Service AAnalysis Period (min) 15~ Volume exceeds capacity, queue is theoretically infinite. Queue shown is maximum after two cycles.# 95th percentile volume exceeds capacity, queue may be longer. Queue shown is maximum after two cycles.
Splits and Phases: 1: Washington Street/Washington St & 144th Avenue
Appendix C - Capacity Worksheets - Page 6

HCM Unsignalized Intersection Capacity Analysis Existing Traffic Volumes2: Washington St/E. 152nd Ave & Washintgon Street PM Peak Hour
September 2016 Synchro ReportSM ROCHA, LLC
Movement EBL EBR NBL NBT SBT SBRLane ConfigurationsTraffic Volume (veh/h) 15 254 378 185 106 38Future Volume (Veh/h) 15 254 378 185 106 38Sign Control Stop Free FreeGrade 0% 0% 0%Peak Hour Factor 0.92 0.92 0.92 0.92 0.92 0.92Hourly flow rate (vph) 16 276 411 201 115 41PedestriansLane Width (ft)Walking Speed (ft/s)Percent BlockageRight turn flare (veh) 9Median type Raised RaisedMedian storage veh) 1 1Upstream signal (ft)pX, platoon unblockedvC, conflicting volume 1138 115 156vC1, stage 1 conf vol 115vC2, stage 2 conf vol 1023vCu, unblocked vol 1138 115 156tC, single (s) 6.4 6.2 4.1tC, 2 stage (s) 5.4tF (s) 3.5 3.3 2.2p0 queue free % 93 71 71cM capacity (veh/h) 217 937 1424
Direction, Lane # EB 1 NB 1 NB 2 SB 1 SB 2Volume Total 292 411 201 115 41Volume Left 16 411 0 0 0Volume Right 276 0 0 0 41cSH 992 1424 1700 1700 1700Volume to Capacity 0.29 0.29 0.12 0.07 0.02Queue Length 95th (ft) 31 30 0 0 0Control Delay (s) 11.1 8.6 0.0 0.0 0.0Lane LOS B AApproach Delay (s) 11.1 5.7 0.0Approach LOS B
Intersection SummaryAverage Delay 6.4Intersection Capacity Utilization 37.6% ICU Level of Service AAnalysis Period (min) 15
Appendix C - Capacity Worksheets - Page 7
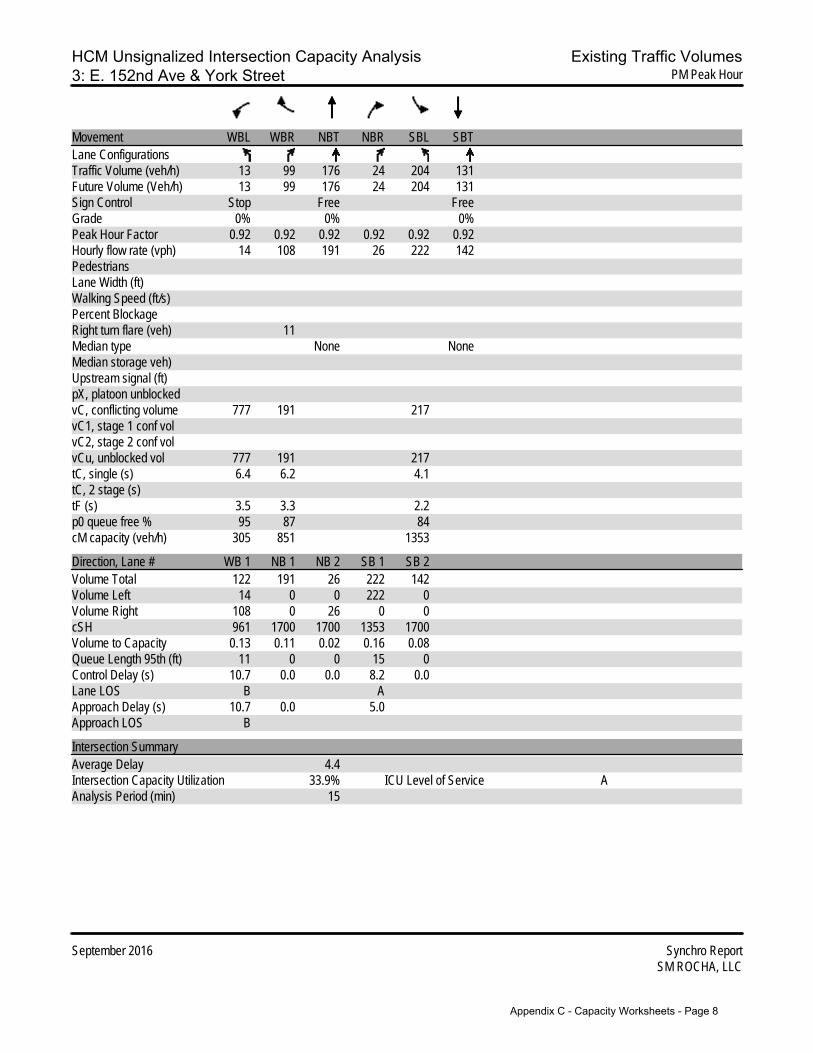
HCM Unsignalized Intersection Capacity Analysis Existing Traffic Volumes3: E. 152nd Ave & York Street PM Peak Hour
September 2016 Synchro ReportSM ROCHA, LLC
Movement WBL WBR NBT NBR SBL SBTLane ConfigurationsTraffic Volume (veh/h) 13 99 176 24 204 131Future Volume (Veh/h) 13 99 176 24 204 131Sign Control Stop Free FreeGrade 0% 0% 0%Peak Hour Factor 0.92 0.92 0.92 0.92 0.92 0.92Hourly flow rate (vph) 14 108 191 26 222 142PedestriansLane Width (ft)Walking Speed (ft/s)Percent BlockageRight turn flare (veh) 11Median type None NoneMedian storage veh)Upstream signal (ft)pX, platoon unblockedvC, conflicting volume 777 191 217vC1, stage 1 conf volvC2, stage 2 conf volvCu, unblocked vol 777 191 217tC, single (s) 6.4 6.2 4.1tC, 2 stage (s)tF (s) 3.5 3.3 2.2p0 queue free % 95 87 84cM capacity (veh/h) 305 851 1353
Direction, Lane # WB 1 NB 1 NB 2 SB 1 SB 2Volume Total 122 191 26 222 142Volume Left 14 0 0 222 0Volume Right 108 0 26 0 0cSH 961 1700 1700 1353 1700Volume to Capacity 0.13 0.11 0.02 0.16 0.08Queue Length 95th (ft) 11 0 0 15 0Control Delay (s) 10.7 0.0 0.0 8.2 0.0Lane LOS B AApproach Delay (s) 10.7 0.0 5.0Approach LOS B
Intersection SummaryAverage Delay 4.4Intersection Capacity Utilization 33.9% ICU Level of Service AAnalysis Period (min) 15
Appendix C - Capacity Worksheets - Page 8

Timings Background Traffic Volumes1: Washington Street & 144th Avenue Year 2018 AM Peak Hour
September 2016 Synchro ReportSM ROCHA, LLC
Lane Group EBL EBT EBR WBL WBT WBR NBL NBT NBR SBL SBT SBRLane ConfigurationsTraffic Volume (vph) 68 192 63 54 615 18 108 87 14 9 117 85Future Volume (vph) 68 192 63 54 615 18 108 87 14 9 117 85Satd. Flow (prot) 3433 3539 1583 3433 3539 1583 3433 3539 1583 3433 3539 1583Flt Permitted 0.950 0.950 0.950 0.950Satd. Flow (perm) 3433 3539 1583 3433 3539 1583 3433 3539 1583 3433 3539 1583Satd. Flow (RTOR) 153 153 147 147Lane Group Flow (vph) 74 209 68 59 668 20 117 95 15 10 127 92Turn Type Prot NA Perm Prot NA Perm Prot NA Perm Prot NA PermProtected Phases 7 4 3 8 5 2 1 6Permitted Phases 4 8 2 6Total Split (s) 10.6 39.0 39.0 10.6 39.0 39.0 10.6 39.8 39.8 10.6 39.8 39.8Total Lost Time (s) 5.5 5.5 5.5 5.5 5.5 5.5 5.5 6.0 6.0 5.5 6.0 6.0Act Effct Green (s) 5.1 25.1 25.1 5.1 25.1 25.1 8.2 52.5 52.5 5.8 41.2 41.2Actuated g/C Ratio 0.05 0.25 0.25 0.05 0.25 0.25 0.08 0.52 0.52 0.06 0.41 0.41v/c Ratio 0.42 0.24 0.13 0.34 0.75 0.04 0.42 0.05 0.02 0.05 0.09 0.12Control Delay 53.7 29.5 0.5 51.3 39.9 0.2 48.2 15.3 0.0 44.8 20.7 1.3Queue Delay 0.0 0.0 0.0 0.0 0.0 0.0 0.0 0.0 0.0 0.0 0.0 0.0Total Delay 53.7 29.5 0.5 51.3 39.9 0.2 48.2 15.3 0.0 44.8 20.7 1.3LOS D C A D D A D B A D C AApproach Delay 29.0 39.8 31.3 14.0Approach LOS C D C BQueue Length 50th (ft) 24 55 0 19 207 0 37 14 0 3 26 0Queue Length 95th (ft) 47 80 0 40 250 0 66 38 0 11 50 9Internal Link Dist (ft) 632 550 415 4110Turn Bay Length (ft) 203 351 150 150 211 211 170 204Base Capacity (vph) 175 1185 632 175 1185 632 281 1858 901 199 1458 738Starvation Cap Reductn 0 0 0 0 0 0 0 0 0 0 0 0Spillback Cap Reductn 0 0 0 0 0 0 0 0 0 0 0 0Storage Cap Reductn 0 0 0 0 0 0 0 0 0 0 0 0Reduced v/c Ratio 0.42 0.18 0.11 0.34 0.56 0.03 0.42 0.05 0.02 0.05 0.09 0.12
Intersection SummaryCycle Length: 100Actuated Cycle Length: 100Offset: 45 (45%), Referenced to phase 2:NBT and 6:SBT, Start of GreenControl Type: Actuated-CoordinatedMaximum v/c Ratio: 0.75Intersection Signal Delay: 32.3 Intersection LOS: CIntersection Capacity Utilization 45.1% ICU Level of Service AAnalysis Period (min) 15
Splits and Phases: 1: Washington Street & 144th Avenue
Appendix C - Capacity Worksheets - Page 9

HCM Unsignalized Intersection Capacity Analysis Background Traffic Volumes2: Washington Street & 152nd Ave Year 2018 AM Peak Hour
September 2016 Synchro ReportSM ROCHA, LLC
Movement EBL EBR NBL NBT SBT SBRLane ConfigurationsTraffic Volume (veh/h) 4 68 88 72 146 21Future Volume (Veh/h) 4 68 88 72 146 21Sign Control Stop Free FreeGrade 0% 0% 0%Peak Hour Factor 0.92 0.92 0.92 0.92 0.92 0.92Hourly flow rate (vph) 4 74 96 78 159 23PedestriansLane Width (ft)Walking Speed (ft/s)Percent BlockageRight turn flare (veh) 9Median type Raised RaisedMedian storage veh) 1 1Upstream signal (ft)pX, platoon unblockedvC, conflicting volume 429 159 182vC1, stage 1 conf vol 159vC2, stage 2 conf vol 270vCu, unblocked vol 429 159 182tC, single (s) 6.4 6.2 4.1tC, 2 stage (s) 5.4tF (s) 3.5 3.3 2.2p0 queue free % 99 92 93cM capacity (veh/h) 601 886 1393
Direction, Lane # EB 1 NB 1 NB 2 SB 1 SB 2Volume Total 78 96 78 159 23Volume Left 4 96 0 0 0Volume Right 74 0 0 0 23cSH 934 1393 1700 1700 1700Volume to Capacity 0.08 0.07 0.05 0.09 0.01Queue Length 95th (ft) 7 6 0 0 0Control Delay (s) 9.5 7.8 0.0 0.0 0.0Lane LOS A AApproach Delay (s) 9.5 4.3 0.0Approach LOS A
Intersection SummaryAverage Delay 3.4Intersection Capacity Utilization 27.3% ICU Level of Service AAnalysis Period (min) 15
Appendix C - Capacity Worksheets - Page 10
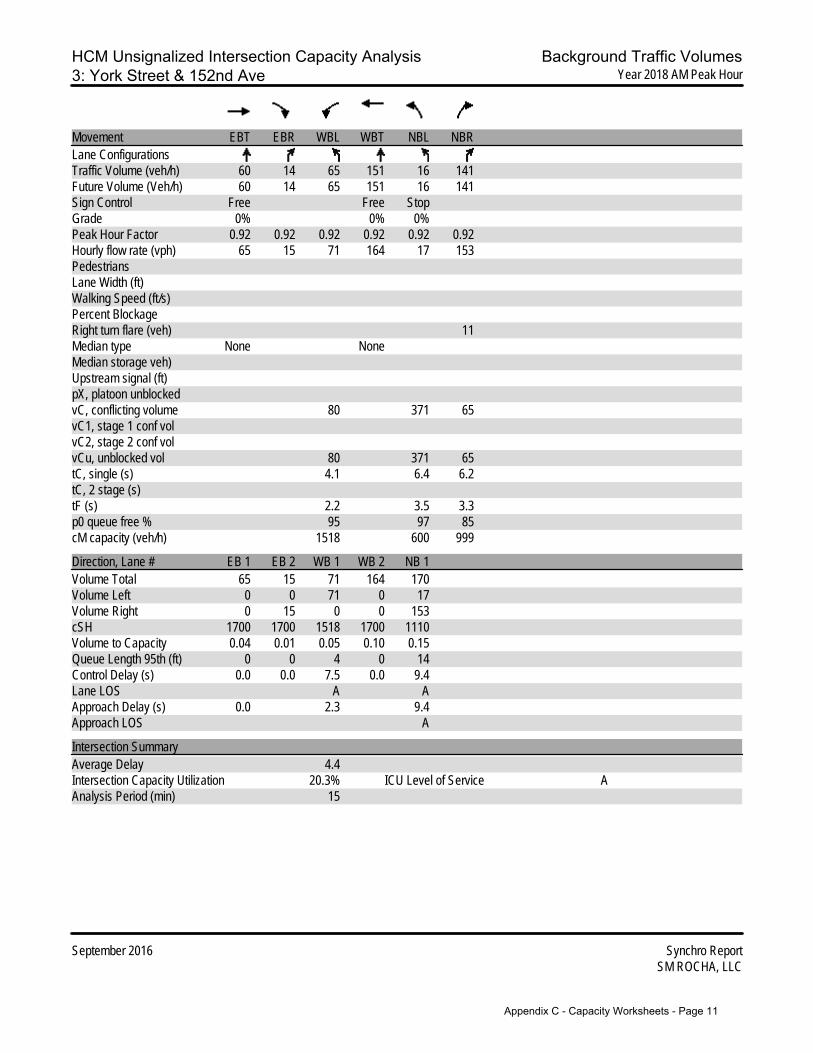
HCM Unsignalized Intersection Capacity Analysis Background Traffic Volumes3: York Street & 152nd Ave Year 2018 AM Peak Hour
September 2016 Synchro ReportSM ROCHA, LLC
Movement EBT EBR WBL WBT NBL NBRLane ConfigurationsTraffic Volume (veh/h) 60 14 65 151 16 141Future Volume (Veh/h) 60 14 65 151 16 141Sign Control Free Free StopGrade 0% 0% 0%Peak Hour Factor 0.92 0.92 0.92 0.92 0.92 0.92Hourly flow rate (vph) 65 15 71 164 17 153PedestriansLane Width (ft)Walking Speed (ft/s)Percent BlockageRight turn flare (veh) 11Median type None NoneMedian storage veh)Upstream signal (ft)pX, platoon unblockedvC, conflicting volume 80 371 65vC1, stage 1 conf volvC2, stage 2 conf volvCu, unblocked vol 80 371 65tC, single (s) 4.1 6.4 6.2tC, 2 stage (s)tF (s) 2.2 3.5 3.3p0 queue free % 95 97 85cM capacity (veh/h) 1518 600 999
Direction, Lane # EB 1 EB 2 WB 1 WB 2 NB 1Volume Total 65 15 71 164 170Volume Left 0 0 71 0 17Volume Right 0 15 0 0 153cSH 1700 1700 1518 1700 1110Volume to Capacity 0.04 0.01 0.05 0.10 0.15Queue Length 95th (ft) 0 0 4 0 14Control Delay (s) 0.0 0.0 7.5 0.0 9.4Lane LOS A AApproach Delay (s) 0.0 2.3 9.4Approach LOS A
Intersection SummaryAverage Delay 4.4Intersection Capacity Utilization 20.3% ICU Level of Service AAnalysis Period (min) 15
Appendix C - Capacity Worksheets - Page 11
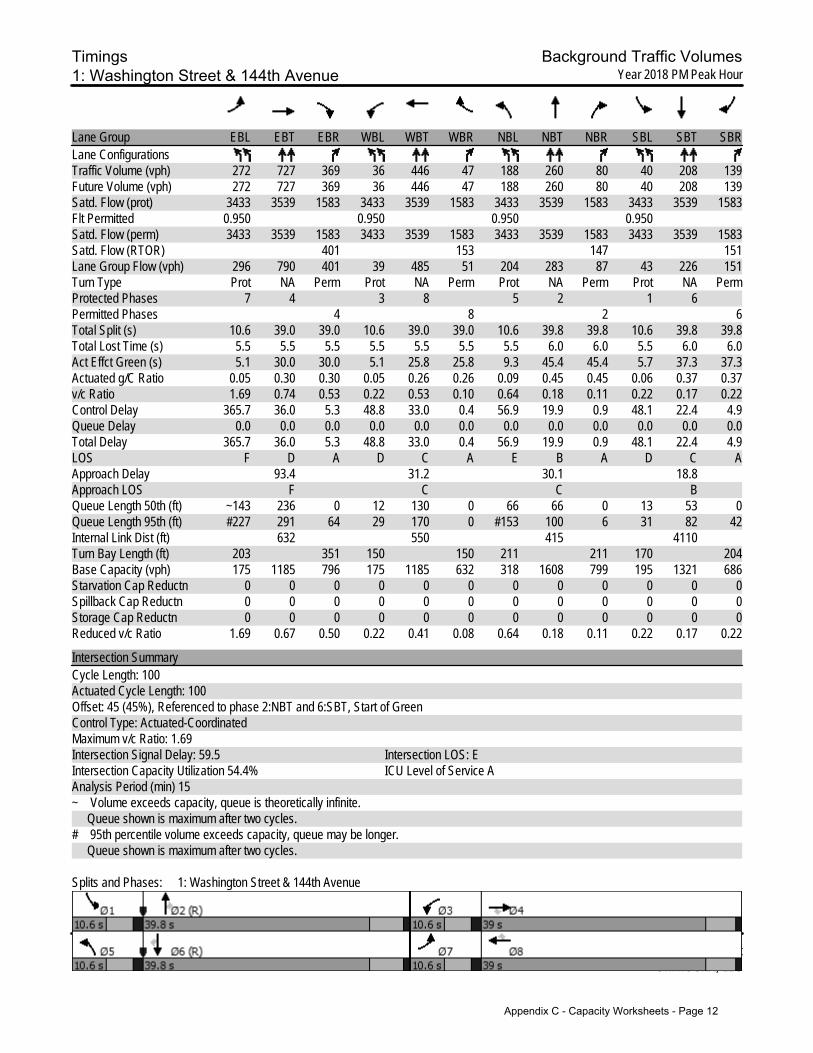
Timings Background Traffic Volumes1: Washington Street & 144th Avenue Year 2018 PM Peak Hour
September 2016 Synchro ReportSM ROCHA, LLC
Lane Group EBL EBT EBR WBL WBT WBR NBL NBT NBR SBL SBT SBRLane ConfigurationsTraffic Volume (vph) 272 727 369 36 446 47 188 260 80 40 208 139Future Volume (vph) 272 727 369 36 446 47 188 260 80 40 208 139Satd. Flow (prot) 3433 3539 1583 3433 3539 1583 3433 3539 1583 3433 3539 1583Flt Permitted 0.950 0.950 0.950 0.950Satd. Flow (perm) 3433 3539 1583 3433 3539 1583 3433 3539 1583 3433 3539 1583Satd. Flow (RTOR) 401 153 147 151Lane Group Flow (vph) 296 790 401 39 485 51 204 283 87 43 226 151Turn Type Prot NA Perm Prot NA Perm Prot NA Perm Prot NA PermProtected Phases 7 4 3 8 5 2 1 6Permitted Phases 4 8 2 6Total Split (s) 10.6 39.0 39.0 10.6 39.0 39.0 10.6 39.8 39.8 10.6 39.8 39.8Total Lost Time (s) 5.5 5.5 5.5 5.5 5.5 5.5 5.5 6.0 6.0 5.5 6.0 6.0Act Effct Green (s) 5.1 30.0 30.0 5.1 25.8 25.8 9.3 45.4 45.4 5.7 37.3 37.3Actuated g/C Ratio 0.05 0.30 0.30 0.05 0.26 0.26 0.09 0.45 0.45 0.06 0.37 0.37v/c Ratio 1.69 0.74 0.53 0.22 0.53 0.10 0.64 0.18 0.11 0.22 0.17 0.22Control Delay 365.7 36.0 5.3 48.8 33.0 0.4 56.9 19.9 0.9 48.1 22.4 4.9Queue Delay 0.0 0.0 0.0 0.0 0.0 0.0 0.0 0.0 0.0 0.0 0.0 0.0Total Delay 365.7 36.0 5.3 48.8 33.0 0.4 56.9 19.9 0.9 48.1 22.4 4.9LOS F D A D C A E B A D C AApproach Delay 93.4 31.2 30.1 18.8Approach LOS F C C BQueue Length 50th (ft) ~143 236 0 12 130 0 66 66 0 13 53 0Queue Length 95th (ft) #227 291 64 29 170 0 #153 100 6 31 82 42Internal Link Dist (ft) 632 550 415 4110Turn Bay Length (ft) 203 351 150 150 211 211 170 204Base Capacity (vph) 175 1185 796 175 1185 632 318 1608 799 195 1321 686Starvation Cap Reductn 0 0 0 0 0 0 0 0 0 0 0 0Spillback Cap Reductn 0 0 0 0 0 0 0 0 0 0 0 0Storage Cap Reductn 0 0 0 0 0 0 0 0 0 0 0 0Reduced v/c Ratio 1.69 0.67 0.50 0.22 0.41 0.08 0.64 0.18 0.11 0.22 0.17 0.22
Intersection SummaryCycle Length: 100Actuated Cycle Length: 100Offset: 45 (45%), Referenced to phase 2:NBT and 6:SBT, Start of GreenControl Type: Actuated-CoordinatedMaximum v/c Ratio: 1.69Intersection Signal Delay: 59.5 Intersection LOS: EIntersection Capacity Utilization 54.4% ICU Level of Service AAnalysis Period (min) 15~ Volume exceeds capacity, queue is theoretically infinite. Queue shown is maximum after two cycles.# 95th percentile volume exceeds capacity, queue may be longer. Queue shown is maximum after two cycles.
Splits and Phases: 1: Washington Street & 144th Avenue
Appendix C - Capacity Worksheets - Page 12

HCM Unsignalized Intersection Capacity Analysis Background Traffic Volumes2: Washington Street & 152nd Ave Year 2018 PM Peak Hour
September 2016 Synchro ReportSM ROCHA, LLC
Movement EBL EBR NBL NBT SBT SBRLane ConfigurationsTraffic Volume (veh/h) 17 284 423 207 115 43Future Volume (Veh/h) 17 284 423 207 115 43Sign Control Stop Free FreeGrade 0% 0% 0%Peak Hour Factor 0.92 0.92 0.92 0.92 0.92 0.92Hourly flow rate (vph) 18 309 460 225 125 47PedestriansLane Width (ft)Walking Speed (ft/s)Percent BlockageRight turn flare (veh) 9Median type Raised RaisedMedian storage veh) 1 1Upstream signal (ft)pX, platoon unblockedvC, conflicting volume 1270 125 172vC1, stage 1 conf vol 125vC2, stage 2 conf vol 1145vCu, unblocked vol 1270 125 172tC, single (s) 6.4 6.2 4.1tC, 2 stage (s) 5.4tF (s) 3.5 3.3 2.2p0 queue free % 90 67 67cM capacity (veh/h) 180 926 1405
Direction, Lane # EB 1 NB 1 NB 2 SB 1 SB 2Volume Total 327 460 225 125 47Volume Left 18 460 0 0 0Volume Right 309 0 0 0 47cSH 979 1405 1700 1700 1700Volume to Capacity 0.33 0.33 0.13 0.07 0.03Queue Length 95th (ft) 37 36 0 0 0Control Delay (s) 11.7 8.8 0.0 0.0 0.0Lane LOS B AApproach Delay (s) 11.7 5.9 0.0Approach LOS B
Intersection SummaryAverage Delay 6.7Intersection Capacity Utilization 42.7% ICU Level of Service AAnalysis Period (min) 15
Appendix C - Capacity Worksheets - Page 13

HCM Unsignalized Intersection Capacity Analysis Background Traffic Volumes3: York Street & 152nd Ave Year 2018 PM Peak Hour
September 2016 Synchro ReportSM ROCHA, LLC
Movement EBT EBR WBL WBT NBL NBRLane ConfigurationsTraffic Volume (veh/h) 197 27 228 147 14 111Future Volume (Veh/h) 197 27 228 147 14 111Sign Control Free Free StopGrade 0% 0% 0%Peak Hour Factor 0.92 0.92 0.92 0.92 0.92 0.92Hourly flow rate (vph) 214 29 248 160 15 121PedestriansLane Width (ft)Walking Speed (ft/s)Percent BlockageRight turn flare (veh) 11Median type None NoneMedian storage veh)Upstream signal (ft)pX, platoon unblockedvC, conflicting volume 243 870 214vC1, stage 1 conf volvC2, stage 2 conf volvCu, unblocked vol 243 870 214tC, single (s) 4.1 6.4 6.2tC, 2 stage (s)tF (s) 2.2 3.5 3.3p0 queue free % 81 94 85cM capacity (veh/h) 1323 262 826
Direction, Lane # EB 1 EB 2 WB 1 WB 2 NB 1Volume Total 214 29 248 160 136Volume Left 0 0 248 0 15Volume Right 0 29 0 0 121cSH 1700 1700 1323 1700 928Volume to Capacity 0.13 0.02 0.19 0.09 0.15Queue Length 95th (ft) 0 0 17 0 13Control Delay (s) 0.0 0.0 8.3 0.0 11.2Lane LOS A BApproach Delay (s) 0.0 5.1 11.2Approach LOS B
Intersection SummaryAverage Delay 4.6Intersection Capacity Utilization 36.3% ICU Level of Service AAnalysis Period (min) 15
Appendix C - Capacity Worksheets - Page 14

Timings Background Traffic Volumes1: Washington Street & 144th Avenue Year 2036 AM Peak Hour
September 2016 Synchro ReportSM ROCHA, LLC
Lane Group EBL EBT EBR WBL WBT WBR NBL NBT NBR SBL SBT SBRLane ConfigurationsTraffic Volume (vph) 113 326 103 92 1044 31 184 148 23 14 198 144Future Volume (vph) 113 326 103 92 1044 31 184 148 23 14 198 144Satd. Flow (prot) 3433 5085 1583 3433 5085 1583 3433 5085 1583 3433 5085 1583Flt Permitted 0.950 0.950 0.950 0.950Satd. Flow (perm) 3433 5085 1583 3433 5085 1583 3433 5085 1583 3433 5085 1583Satd. Flow (RTOR) 177 177 123 173Lane Group Flow (vph) 123 354 112 100 1135 34 200 161 25 15 215 157Turn Type Prot NA Perm Prot NA Perm Prot NA Perm Prot NA PermProtected Phases 7 4 3 8 5 2 1 6Permitted Phases 4 8 2 6Total Split (s) 16.0 48.0 48.0 15.0 47.0 47.0 21.0 45.0 45.0 12.0 36.0 36.0Total Lost Time (s) 5.5 5.5 5.5 5.5 5.5 5.5 5.5 6.0 6.0 5.5 6.0 6.0Act Effct Green (s) 9.2 35.9 35.9 8.5 35.1 35.1 12.3 53.9 53.9 6.0 40.9 40.9Actuated g/C Ratio 0.08 0.30 0.30 0.07 0.29 0.29 0.10 0.45 0.45 0.05 0.34 0.34v/c Ratio 0.47 0.23 0.19 0.41 0.76 0.06 0.57 0.07 0.03 0.09 0.12 0.24Control Delay 58.7 31.3 1.1 58.4 42.0 0.2 57.6 21.9 0.1 88.1 11.3 3.0Queue Delay 0.0 0.0 0.0 0.0 0.0 0.0 0.0 0.0 0.0 0.0 0.0 0.0Total Delay 58.7 31.3 1.1 58.4 42.0 0.2 57.6 21.9 0.1 88.1 11.3 3.0LOS E C A E D A E C A F B AApproach Delay 31.3 42.2 39.0 10.9Approach LOS C D D BQueue Length 50th (ft) 47 75 0 38 292 0 77 23 0 6 12 0Queue Length 95th (ft) 79 94 5 67 320 0 113 49 0 m17 54 78Internal Link Dist (ft) 632 550 415 4110Turn Bay Length (ft) 203 351 150 150 211 211 170 204Base Capacity (vph) 300 1800 674 271 1758 663 443 2283 778 185 1732 653Starvation Cap Reductn 0 0 0 0 0 0 0 0 0 0 0 0Spillback Cap Reductn 0 0 0 0 0 0 0 0 0 0 0 0Storage Cap Reductn 0 0 0 0 0 0 0 0 0 0 0 0Reduced v/c Ratio 0.41 0.20 0.17 0.37 0.65 0.05 0.45 0.07 0.03 0.08 0.12 0.24
Intersection SummaryCycle Length: 120Actuated Cycle Length: 120Offset: 0 (0%), Referenced to phase 2:NBT and 6:SBT, Start of GreenControl Type: Actuated-CoordinatedMaximum v/c Ratio: 0.76Intersection Signal Delay: 34.7 Intersection LOS: CIntersection Capacity Utilization 52.5% ICU Level of Service AAnalysis Period (min) 15m Volume for 95th percentile queue is metered by upstream signal.
Splits and Phases: 1: Washington Street & 144th Avenue
Appendix C - Capacity Worksheets - Page 15

Timings Background Traffic Volumes2: 152nd Ave & Washington Street Year 2036 AM Peak Hour
September 2016 Synchro ReportSM ROCHA, LLC
Lane Group WBL WBR NBT NBR SBL SBTLane ConfigurationsTraffic Volume (vph) 416 61 253 205 10 195Future Volume (vph) 416 61 253 205 10 195Satd. Flow (prot) 3090 1425 4577 1425 3090 4577Flt Permitted 0.950 0.950Satd. Flow (perm) 3090 1425 4577 1425 3090 4577Satd. Flow (RTOR) 66 223Lane Group Flow (vph) 452 66 275 223 11 212Turn Type Perm Perm NA Perm Prot NAProtected Phases 2 1 6Permitted Phases 8 8 2Total Split (s) 52.0 52.0 53.0 53.0 15.0 68.0Total Lost Time (s) 5.5 5.5 5.5 5.5 5.5 5.5Act Effct Green (s) 23.4 23.4 47.5 47.5 32.6 85.6Actuated g/C Ratio 0.20 0.20 0.40 0.40 0.27 0.71v/c Ratio 0.75 0.20 0.15 0.32 0.01 0.06Control Delay 53.3 10.1 21.8 7.2 35.2 5.8Queue Delay 0.0 0.0 0.0 0.0 0.0 0.0Total Delay 53.3 10.1 21.8 7.2 35.2 5.8LOS D B C A D AApproach Delay 47.8 15.2 7.2Approach LOS D B AQueue Length 50th (ft) 172 0 46 0 3 16Queue Length 95th (ft) 214 36 66 64 11 29Internal Link Dist (ft) 5433 4110 2753Turn Bay Length (ft) 200Base Capacity (vph) 1197 592 1811 698 839 3264Starvation Cap Reductn 0 0 0 0 0 0Spillback Cap Reductn 0 0 0 0 0 0Storage Cap Reductn 0 0 0 0 0 0Reduced v/c Ratio 0.38 0.11 0.15 0.32 0.01 0.06
Intersection SummaryCycle Length: 120Actuated Cycle Length: 120Offset: 0 (0%), Referenced to phase 2:NBT and 6:SBT, Start of GreenControl Type: Actuated-CoordinatedMaximum v/c Ratio: 0.75Intersection Signal Delay: 27.4 Intersection LOS: CIntersection Capacity Utilization 27.8% ICU Level of Service AAnalysis Period (min) 15
Splits and Phases: 2: 152nd Ave & Washington Street
Appendix C - Capacity Worksheets - Page 16

Timings Background Traffic Volumes3: York Street & 152nd Ave Year 2036 AM Peak Hour
September 2016 Synchro ReportSM ROCHA, LLC
Lane Group EBT EBR WBL WBT NBL NBRLane ConfigurationsTraffic Volume (vph) 173 42 186 432 45 403Future Volume (vph) 173 42 186 432 45 403Satd. Flow (prot) 5085 1583 3433 5085 3433 1583Flt Permitted 0.950 0.950Satd. Flow (perm) 5085 1583 3433 5085 3433 1583Satd. Flow (RTOR) 46 438Lane Group Flow (vph) 188 46 202 470 49 438Turn Type NA Perm Prot NA Prot PermProtected Phases 2 1 6 8Permitted Phases 2 8Total Split (s) 29.0 29.0 25.0 54.0 66.0 66.0Total Lost Time (s) 4.5 4.5 4.5 4.5 4.5 4.5Act Effct Green (s) 24.6 24.6 20.5 49.6 8.1 8.1Actuated g/C Ratio 0.37 0.37 0.31 0.74 0.12 0.12v/c Ratio 0.10 0.08 0.19 0.12 0.12 0.76Control Delay 14.7 5.9 18.3 2.8 26.0 12.6Queue Delay 0.0 0.0 0.0 0.0 0.0 0.0Total Delay 14.7 5.9 18.3 2.8 26.0 12.6LOS B A B A C BApproach Delay 13.0 7.5 13.9Approach LOS B A BQueue Length 50th (ft) 17 0 29 12 9 0Queue Length 95th (ft) 35 20 60 32 22 74Internal Link Dist (ft) 5433 2537 1753Turn Bay Length (ft) 200 200Base Capacity (vph) 1872 611 1057 3782 3172 1496Starvation Cap Reductn 0 0 0 0 0 0Spillback Cap Reductn 0 0 0 0 0 0Storage Cap Reductn 0 0 0 0 0 0Reduced v/c Ratio 0.10 0.08 0.19 0.12 0.02 0.29
Intersection SummaryCycle Length: 120Actuated Cycle Length: 66.7Control Type: Actuated-UncoordinatedMaximum v/c Ratio: 0.76Intersection Signal Delay: 10.7 Intersection LOS: BIntersection Capacity Utilization 36.6% ICU Level of Service AAnalysis Period (min) 15
Splits and Phases: 3: York Street & 152nd Ave
Appendix C - Capacity Worksheets - Page 17

Timings Background Traffic Volumes1: Washington Street & 144th Avenue Year 2036 AM Peak Hour
September 2016 Synchro ReportSM ROCHA, LLC
Lane Group EBL EBT EBR WBL WBT WBR NBL NBT NBR SBL SBT SBRLane ConfigurationsTraffic Volume (vph) 463 1235 626 61 758 79 319 441 135 68 353 236Future Volume (vph) 463 1235 626 61 758 79 319 441 135 68 353 236Satd. Flow (prot) 3433 5085 1583 3433 5085 1583 3433 5085 1583 3433 5085 1583Flt Permitted 0.950 0.950 0.950 0.950Satd. Flow (perm) 3433 5085 1583 3433 5085 1583 3433 5085 1583 3433 5085 1583Satd. Flow (RTOR) 383 227 173 257Lane Group Flow (vph) 503 1342 680 66 824 86 347 479 147 74 384 257Turn Type Prot NA Perm Prot NA Perm Prot NA Perm Prot NA PermProtected Phases 7 4 3 8 5 2 1 6Permitted Phases 4 8 2 6Total Split (s) 31.0 54.0 54.0 10.6 33.6 33.6 23.0 44.0 44.0 11.4 32.4 32.4Total Lost Time (s) 5.5 5.5 5.5 5.5 5.5 5.5 5.5 6.0 6.0 5.5 6.0 6.0Act Effct Green (s) 22.2 46.7 46.7 5.1 27.5 27.5 16.1 44.0 44.0 6.1 31.7 31.7Actuated g/C Ratio 0.18 0.39 0.39 0.04 0.23 0.23 0.13 0.37 0.37 0.05 0.26 0.26v/c Ratio 0.79 0.68 0.80 0.46 0.71 0.16 0.75 0.26 0.21 0.42 0.29 0.42Control Delay 56.3 32.3 21.5 66.4 46.1 0.6 60.8 28.8 3.4 67.1 37.2 10.8Queue Delay 0.0 0.0 0.0 0.0 0.0 0.0 0.0 0.0 0.0 0.0 0.0 0.0Total Delay 56.3 32.3 21.5 66.4 46.1 0.6 60.8 28.8 3.4 67.1 37.2 10.8LOS E C C E D A E C A E D BApproach Delay 34.2 43.5 36.4 30.8Approach LOS C D D CQueue Length 50th (ft) 192 304 209 26 208 0 133 102 0 30 78 14Queue Length 95th (ft) 246 356 386 50 263 0 185 133 31 m54 108 64Internal Link Dist (ft) 632 550 415 4110Turn Bay Length (ft) 203 351 150 150 211 211 170 204Base Capacity (vph) 729 2055 868 145 1227 554 500 1862 689 175 1343 607Starvation Cap Reductn 0 0 0 0 0 0 0 0 0 0 0 0Spillback Cap Reductn 0 0 0 0 0 0 0 0 0 0 0 0Storage Cap Reductn 0 0 0 0 0 0 0 0 0 0 0 0Reduced v/c Ratio 0.69 0.65 0.78 0.46 0.67 0.16 0.69 0.26 0.21 0.42 0.29 0.42
Intersection SummaryCycle Length: 120Actuated Cycle Length: 120Offset: 0 (0%), Referenced to phase 2:NBT and 6:SBT, Start of GreenControl Type: Actuated-CoordinatedMaximum v/c Ratio: 0.80Intersection Signal Delay: 35.9 Intersection LOS: DIntersection Capacity Utilization 63.9% ICU Level of Service BAnalysis Period (min) 15m Volume for 95th percentile queue is metered by upstream signal.
Splits and Phases: 1: Washington Street & 144th Avenue
Appendix C - Capacity Worksheets - Page 18
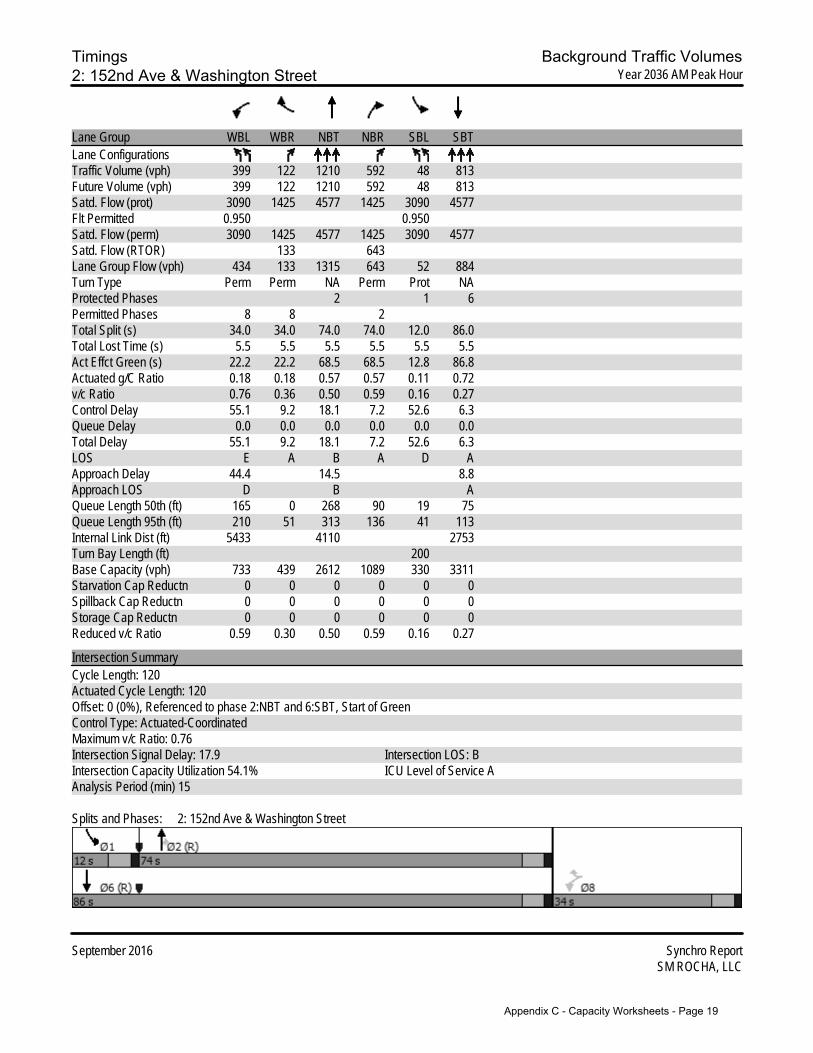
Timings Background Traffic Volumes2: 152nd Ave & Washington Street Year 2036 AM Peak Hour
September 2016 Synchro ReportSM ROCHA, LLC
Lane Group WBL WBR NBT NBR SBL SBTLane ConfigurationsTraffic Volume (vph) 399 122 1210 592 48 813Future Volume (vph) 399 122 1210 592 48 813Satd. Flow (prot) 3090 1425 4577 1425 3090 4577Flt Permitted 0.950 0.950Satd. Flow (perm) 3090 1425 4577 1425 3090 4577Satd. Flow (RTOR) 133 643Lane Group Flow (vph) 434 133 1315 643 52 884Turn Type Perm Perm NA Perm Prot NAProtected Phases 2 1 6Permitted Phases 8 8 2Total Split (s) 34.0 34.0 74.0 74.0 12.0 86.0Total Lost Time (s) 5.5 5.5 5.5 5.5 5.5 5.5Act Effct Green (s) 22.2 22.2 68.5 68.5 12.8 86.8Actuated g/C Ratio 0.18 0.18 0.57 0.57 0.11 0.72v/c Ratio 0.76 0.36 0.50 0.59 0.16 0.27Control Delay 55.1 9.2 18.1 7.2 52.6 6.3Queue Delay 0.0 0.0 0.0 0.0 0.0 0.0Total Delay 55.1 9.2 18.1 7.2 52.6 6.3LOS E A B A D AApproach Delay 44.4 14.5 8.8Approach LOS D B AQueue Length 50th (ft) 165 0 268 90 19 75Queue Length 95th (ft) 210 51 313 136 41 113Internal Link Dist (ft) 5433 4110 2753Turn Bay Length (ft) 200Base Capacity (vph) 733 439 2612 1089 330 3311Starvation Cap Reductn 0 0 0 0 0 0Spillback Cap Reductn 0 0 0 0 0 0Storage Cap Reductn 0 0 0 0 0 0Reduced v/c Ratio 0.59 0.30 0.50 0.59 0.16 0.27
Intersection SummaryCycle Length: 120Actuated Cycle Length: 120Offset: 0 (0%), Referenced to phase 2:NBT and 6:SBT, Start of GreenControl Type: Actuated-CoordinatedMaximum v/c Ratio: 0.76Intersection Signal Delay: 17.9 Intersection LOS: BIntersection Capacity Utilization 54.1% ICU Level of Service AAnalysis Period (min) 15
Splits and Phases: 2: 152nd Ave & Washington Street
Appendix C - Capacity Worksheets - Page 19

Timings Background Traffic Volumes3: York Street & 152nd Ave Year 2036 AM Peak Hour
September 2016 Synchro ReportSM ROCHA, LLC
Lane Group EBT EBR WBL WBT NBL NBRLane ConfigurationsTraffic Volume (vph) 563 77 653 419 77 317Future Volume (vph) 563 77 653 419 77 317Satd. Flow (prot) 5085 1583 3433 5085 3433 1583Flt Permitted 0.950 0.950Satd. Flow (perm) 5085 1583 3433 5085 3433 1583Satd. Flow (RTOR) 84 345Lane Group Flow (vph) 612 84 710 455 84 345Turn Type NA Perm Prot NA Prot PermProtected Phases 2 1 6 8Permitted Phases 2 8Total Split (s) 34.0 34.0 48.0 82.0 38.0 38.0Total Lost Time (s) 4.5 4.5 4.5 4.5 4.5 4.5Act Effct Green (s) 29.5 29.5 43.6 77.6 9.1 9.1Actuated g/C Ratio 0.31 0.31 0.46 0.81 0.10 0.10v/c Ratio 0.39 0.15 0.45 0.11 0.26 0.75Control Delay 27.3 6.8 19.5 2.2 41.6 15.3Queue Delay 0.0 0.0 0.0 0.0 0.0 0.0Total Delay 27.3 6.8 19.5 2.2 41.6 15.3LOS C A B A D BApproach Delay 24.9 12.8 20.5Approach LOS C B CQueue Length 50th (ft) 104 0 143 13 24 0Queue Length 95th (ft) 153 35 221 32 46 82Internal Link Dist (ft) 5433 2537 1753Turn Bay Length (ft) 200 200Base Capacity (vph) 1569 546 1562 4123 1203 779Starvation Cap Reductn 0 0 0 0 0 0Spillback Cap Reductn 0 0 0 0 0 0Storage Cap Reductn 0 0 0 0 0 0Reduced v/c Ratio 0.39 0.15 0.45 0.11 0.07 0.44
Intersection SummaryCycle Length: 120Actuated Cycle Length: 95.7Control Type: Actuated-UncoordinatedMaximum v/c Ratio: 0.75Intersection Signal Delay: 17.9 Intersection LOS: BIntersection Capacity Utilization 44.9% ICU Level of Service AAnalysis Period (min) 15
Splits and Phases: 3: York Street & 152nd Ave
Appendix C - Capacity Worksheets - Page 20

Timings Total Traffic Volumes1: Washington Street & 144th Avenue Year 2018 AM Peak Hour
September 2016 Synchro ReportSM ROCHA, LLC
Lane Group EBL EBT EBR WBL WBT WBR NBL NBT NBR SBL SBT SBRLane ConfigurationsTraffic Volume (vph) 366 192 63 54 615 246 108 387 14 128 272 239Future Volume (vph) 366 192 63 54 615 246 108 387 14 128 272 239Satd. Flow (prot) 3433 3539 1583 3433 3539 1583 3433 3539 1583 3433 3539 1583Flt Permitted 0.950 0.950 0.950 0.950Satd. Flow (perm) 3433 3539 1583 3433 3539 1583 3433 3539 1583 3433 3539 1583Satd. Flow (RTOR) 153 253 207 260Lane Group Flow (vph) 398 209 68 59 668 267 117 421 15 139 296 260Turn Type Prot NA Perm Prot NA Perm Prot NA Perm Prot NA PermProtected Phases 7 4 3 8 5 2 1 6Permitted Phases 4 8 2 6Total Split (s) 22.0 41.4 41.4 10.6 30.0 30.0 12.8 35.0 35.0 13.0 35.2 35.2Total Lost Time (s) 5.5 5.5 5.5 5.5 5.5 5.5 5.5 6.0 6.0 5.5 6.0 6.0Act Effct Green (s) 15.4 35.6 35.6 5.1 23.2 23.2 7.2 31.4 31.4 7.5 31.7 31.7Actuated g/C Ratio 0.15 0.36 0.36 0.05 0.23 0.23 0.07 0.31 0.31 0.08 0.32 0.32v/c Ratio 0.76 0.17 0.10 0.34 0.81 0.48 0.47 0.38 0.02 0.54 0.26 0.38Control Delay 50.2 22.5 0.3 51.3 45.0 8.0 51.2 28.7 0.1 52.8 27.1 5.3Queue Delay 0.0 0.0 0.0 0.0 0.0 0.0 0.0 0.0 0.0 0.0 0.0 0.0Total Delay 50.2 22.5 0.3 51.3 45.0 8.0 51.2 28.7 0.1 52.8 27.1 5.3LOS D C A D D A D C A D C AApproach Delay 36.6 35.4 32.7 24.1Approach LOS D D C CQueue Length 50th (ft) 124 47 0 19 208 7 37 113 0 44 76 0Queue Length 95th (ft) 176 74 0 40 275 70 66 158 0 76 112 57Internal Link Dist (ft) 632 550 415 1006Turn Bay Length (ft) 203 351 150 150 211 211 170 204Base Capacity (vph) 566 1279 670 175 867 578 253 1111 639 262 1121 679Starvation Cap Reductn 0 0 0 0 0 0 0 0 0 0 0 0Spillback Cap Reductn 0 0 0 0 0 0 0 0 0 0 0 0Storage Cap Reductn 0 0 0 0 0 0 0 0 0 0 0 0Reduced v/c Ratio 0.70 0.16 0.10 0.34 0.77 0.46 0.46 0.38 0.02 0.53 0.26 0.38
Intersection SummaryCycle Length: 100Actuated Cycle Length: 100Offset: 45 (45%), Referenced to phase 2:NBT and 6:SBT, Start of GreenControl Type: Actuated-CoordinatedMaximum v/c Ratio: 0.81Intersection Signal Delay: 32.5 Intersection LOS: CIntersection Capacity Utilization 61.1% ICU Level of Service BAnalysis Period (min) 15
Splits and Phases: 1: Washington Street & 144th Avenue
Appendix C - Capacity Worksheets - Page 21

HCM Unsignalized Intersection Capacity Analysis Total Traffic Volumes2: Washington Street & 152nd Avenue Year 2018 AM Peak Hour
September 2016 Synchro ReportSM ROCHA, LLC
Movement EBL EBR NBL NBT SBT SBRLane ConfigurationsTraffic Volume (veh/h) 28 235 609 880 293 22Future Volume (Veh/h) 28 235 609 880 293 22Sign Control Stop Free FreeGrade 0% 0% 0%Peak Hour Factor 0.92 0.92 0.92 0.92 0.92 0.92Hourly flow rate (vph) 30 255 662 957 318 24PedestriansLane Width (ft)Walking Speed (ft/s)Percent BlockageRight turn flare (veh)Median type None NoneMedian storage veh)Upstream signal (ft)pX, platoon unblockedvC, conflicting volume 2120 159 342vC1, stage 1 conf volvC2, stage 2 conf volvCu, unblocked vol 2120 159 342tC, single (s) 6.8 6.9 4.1tC, 2 stage (s)tF (s) 3.5 3.3 2.2p0 queue free % 0 70 45cM capacity (veh/h) 20 858 1214
Direction, Lane # EB 1 EB 2 NB 1 NB 2 NB 3 SB 1 SB 2 SB 3Volume Total 30 255 662 478 478 159 159 24Volume Left 30 0 662 0 0 0 0 0Volume Right 0 255 0 0 0 0 0 24cSH 20 858 1214 1700 1700 1700 1700 1700Volume to Capacity 1.53 0.30 0.55 0.28 0.28 0.09 0.09 0.01Queue Length 95th (ft) 102 31 86 0 0 0 0 0Control Delay (s) 682.3 11.0 11.5 0.0 0.0 0.0 0.0 0.0Lane LOS F B BApproach Delay (s) 81.6 4.7 0.0Approach LOS F
Intersection SummaryAverage Delay 13.7Intersection Capacity Utilization 59.8% ICU Level of Service BAnalysis Period (min) 15
Appendix C - Capacity Worksheets - Page 22

HCM Unsignalized Intersection Capacity Analysis Total Traffic Volumes3: York Street & 152nd Avenue Year 2018 AM Peak Hour
September 2016 Synchro ReportSM ROCHA, LLC
Movement EBT EBR WBL WBT NBL NBRLane ConfigurationsTraffic Volume (veh/h) 219 119 65 427 201 141Future Volume (Veh/h) 219 119 65 427 201 141Sign Control Free Free StopGrade 0% 0% 0%Peak Hour Factor 0.92 0.92 0.92 0.92 0.92 0.92Hourly flow rate (vph) 238 129 71 464 218 153PedestriansLane Width (ft)Walking Speed (ft/s)Percent BlockageRight turn flare (veh)Median type None NoneMedian storage veh)Upstream signal (ft) 1170pX, platoon unblocked 0.99 0.99 0.99vC, conflicting volume 367 844 238vC1, stage 1 conf volvC2, stage 2 conf volvCu, unblocked vol 359 839 229tC, single (s) 4.1 6.4 6.2tC, 2 stage (s)tF (s) 2.2 3.5 3.3p0 queue free % 94 30 81cM capacity (veh/h) 1191 313 804
Direction, Lane # EB 1 EB 2 WB 1 WB 2 NB 1 NB 2Volume Total 238 129 71 464 218 153Volume Left 0 0 71 0 218 0Volume Right 0 129 0 0 0 153cSH 1700 1700 1191 1700 313 804Volume to Capacity 0.14 0.08 0.06 0.27 0.70 0.19Queue Length 95th (ft) 0 0 5 0 122 17Control Delay (s) 0.0 0.0 8.2 0.0 39.0 10.5Lane LOS A E BApproach Delay (s) 0.0 1.1 27.3Approach LOS D
Intersection SummaryAverage Delay 8.4Intersection Capacity Utilization 40.3% ICU Level of Service AAnalysis Period (min) 15
Appendix C - Capacity Worksheets - Page 23

HCM Unsignalized Intersection Capacity Analysis Total Traffic Volumes4: 148th Avenue & Washington Street Year 2018 AM Peak Hour
September 2016 Synchro ReportSM ROCHA, LLC
Movement WBL WBR NBT NBR SBL SBTLane ConfigurationsTraffic Volume (veh/h) 67 46 919 24 19 642Future Volume (Veh/h) 67 46 919 24 19 642Sign Control Stop Free FreeGrade 0% 0% 0%Peak Hour Factor 0.92 0.92 0.92 0.92 0.92 0.92Hourly flow rate (vph) 73 50 999 26 21 698PedestriansLane Width (ft)Walking Speed (ft/s)Percent BlockageRight turn flare (veh)Median type None NoneMedian storage veh)Upstream signal (ft) 1086pX, platoon unblocked 0.93 0.93 0.93vC, conflicting volume 1390 500 1025vC1, stage 1 conf volvC2, stage 2 conf volvCu, unblocked vol 1260 298 866tC, single (s) 6.8 6.9 4.1tC, 2 stage (s)tF (s) 3.5 3.3 2.2p0 queue free % 50 92 97cM capacity (veh/h) 146 646 716
Direction, Lane # WB 1 WB 2 NB 1 NB 2 NB 3 SB 1 SB 2 SB 3Volume Total 73 50 500 500 26 21 349 349Volume Left 73 0 0 0 0 21 0 0Volume Right 0 50 0 0 26 0 0 0cSH 146 646 1700 1700 1700 716 1700 1700Volume to Capacity 0.50 0.08 0.29 0.29 0.02 0.03 0.21 0.21Queue Length 95th (ft) 60 6 0 0 0 2 0 0Control Delay (s) 52.2 11.0 0.0 0.0 0.0 10.2 0.0 0.0Lane LOS F B BApproach Delay (s) 35.5 0.0 0.3Approach LOS E
Intersection SummaryAverage Delay 2.5Intersection Capacity Utilization 35.8% ICU Level of Service AAnalysis Period (min) 15
Appendix C - Capacity Worksheets - Page 24

HCM Unsignalized Intersection Capacity Analysis Total Traffic Volumes5: Washington Street & Access A Year 2018 AM Peak Hour
September 2016 Synchro ReportSM ROCHA, LLC
Movement WBL WBR NBT NBR SBL SBTLane ConfigurationsTraffic Volume (veh/h) 90 138 965 18 77 504Future Volume (Veh/h) 90 138 965 18 77 504Sign Control Stop Free FreeGrade 0% 0% 0%Peak Hour Factor 0.92 0.92 0.92 0.92 0.92 0.92Hourly flow rate (vph) 98 150 1049 20 84 548PedestriansLane Width (ft)Walking Speed (ft/s)Percent BlockageRight turn flare (veh)Median type None NoneMedian storage veh)Upstream signal (ft)pX, platoon unblockedvC, conflicting volume 1491 524 1069vC1, stage 1 conf volvC2, stage 2 conf volvCu, unblocked vol 1491 524 1069tC, single (s) 6.8 6.9 4.1tC, 2 stage (s)tF (s) 3.5 3.3 2.2p0 queue free % 2 70 87cM capacity (veh/h) 100 498 648
Direction, Lane # WB 1 WB 2 NB 1 NB 2 NB 3 SB 1 SB 2 SB 3Volume Total 98 150 524 524 20 84 274 274Volume Left 98 0 0 0 0 84 0 0Volume Right 0 150 0 0 20 0 0 0cSH 100 498 1700 1700 1700 648 1700 1700Volume to Capacity 0.98 0.30 0.31 0.31 0.01 0.13 0.16 0.16Queue Length 95th (ft) 149 31 0 0 0 11 0 0Control Delay (s) 164.4 15.3 0.0 0.0 0.0 11.4 0.0 0.0Lane LOS F C BApproach Delay (s) 74.2 0.0 1.5Approach LOS F
Intersection SummaryAverage Delay 9.9Intersection Capacity Utilization 45.9% ICU Level of Service AAnalysis Period (min) 15
Appendix C - Capacity Worksheets - Page 25

HCM Unsignalized Intersection Capacity Analysis Total Traffic Volumes6: Access B & 152nd Avenue Year 2018 AM Peak Hour
September 2016 Synchro ReportSM ROCHA, LLC
Movement EBT EBR WBL WBT NBL NBRLane ConfigurationsTraffic Volume (veh/h) 484 24 12 392 0 69Future Volume (Veh/h) 484 24 12 392 0 69Sign Control Free Free StopGrade 0% 0% 0%Peak Hour Factor 0.92 0.92 0.92 0.92 0.92 0.92Hourly flow rate (vph) 526 26 13 426 0 75PedestriansLane Width (ft)Walking Speed (ft/s)Percent BlockageRight turn flare (veh)Median type None NoneMedian storage veh)Upstream signal (ft) 856pX, platoon unblocked 1.00vC, conflicting volume 552 765 263vC1, stage 1 conf volvC2, stage 2 conf volvCu, unblocked vol 552 765 263tC, single (s) 4.1 6.8 6.9tC, 2 stage (s)tF (s) 2.2 3.5 3.3p0 queue free % 99 100 90cM capacity (veh/h) 1014 335 735
Direction, Lane # EB 1 EB 2 EB 3 WB 1 WB 2 WB 3 NB 1Volume Total 263 263 26 13 213 213 75Volume Left 0 0 0 13 0 0 0Volume Right 0 0 26 0 0 0 75cSH 1700 1700 1700 1014 1700 1700 735Volume to Capacity 0.15 0.15 0.02 0.01 0.13 0.13 0.10Queue Length 95th (ft) 0 0 0 1 0 0 8Control Delay (s) 0.0 0.0 0.0 8.6 0.0 0.0 10.4Lane LOS A BApproach Delay (s) 0.0 0.3 10.4Approach LOS B
Intersection SummaryAverage Delay 0.8Intersection Capacity Utilization 24.3% ICU Level of Service AAnalysis Period (min) 15
Appendix C - Capacity Worksheets - Page 26

Timings Total Traffic Volumes7: Access C & 152nd Avenue Year 2018 AM Peak Hour
September 2016 Synchro ReportSM ROCHA, LLC
Lane Group EBL EBT EBR WBL WBT WBR NBL NBT NBR SBL SBT SBRLane ConfigurationsTraffic Volume (vph) 94 435 24 18 225 118 90 70 68 77 58 96Future Volume (vph) 94 435 24 18 225 118 90 70 68 77 58 96Satd. Flow (prot) 1770 3539 1583 1770 3539 1583 1770 1863 1583 1770 1863 1583Flt Permitted 0.576 0.481 0.674 0.708Satd. Flow (perm) 1073 3539 1583 896 3539 1583 1255 1863 1583 1319 1863 1583Satd. Flow (RTOR) 115 128 115 115Lane Group Flow (vph) 102 473 26 20 245 128 98 76 74 84 63 104Turn Type pm+pt NA Perm pm+pt NA Perm pm+pt NA Perm pm+pt NA PermProtected Phases 5 2 1 6 3 8 7 4Permitted Phases 2 2 6 6 8 8 4 4Total Split (s) 17.0 41.0 41.0 14.0 38.0 38.0 17.0 29.0 29.0 16.0 28.0 28.0Total Lost Time (s) 4.5 4.5 4.5 4.5 4.5 4.5 4.5 4.5 4.5 4.5 4.5 4.5Act Effct Green (s) 45.1 37.7 37.7 42.3 36.2 36.2 15.6 8.5 8.5 14.8 8.1 8.1Actuated g/C Ratio 0.62 0.52 0.52 0.58 0.49 0.49 0.21 0.12 0.12 0.20 0.11 0.11v/c Ratio 0.14 0.26 0.03 0.03 0.14 0.15 0.30 0.35 0.26 0.26 0.31 0.38Control Delay 7.8 12.9 0.1 7.7 13.5 3.8 23.8 37.1 4.9 23.3 36.7 10.4Queue Delay 0.0 0.0 0.0 0.0 0.0 0.0 0.0 0.0 0.0 0.0 0.0 0.0Total Delay 7.8 12.9 0.1 7.7 13.5 3.8 23.8 37.1 4.9 23.3 36.7 10.4LOS A B A A B A C D A C D BApproach Delay 11.5 10.0 22.2 21.3Approach LOS B B C CQueue Length 50th (ft) 18 68 0 3 34 0 36 34 0 31 29 0Queue Length 95th (ft) 45 117 0 13 67 32 73 77 16 64 66 38Internal Link Dist (ft) 776 1086 549 401Turn Bay Length (ft) 150 150 150 150 150 150 150 150Base Capacity (vph) 831 1821 870 680 1752 848 427 643 621 404 617 601Starvation Cap Reductn 0 0 0 0 0 0 0 0 0 0 0 0Spillback Cap Reductn 0 0 0 0 0 0 0 0 0 0 0 0Storage Cap Reductn 0 0 0 0 0 0 0 0 0 0 0 0Reduced v/c Ratio 0.12 0.26 0.03 0.03 0.14 0.15 0.23 0.12 0.12 0.21 0.10 0.17
Intersection SummaryCycle Length: 100Actuated Cycle Length: 73.2Control Type: Actuated-UncoordinatedMaximum v/c Ratio: 0.38Intersection Signal Delay: 14.5 Intersection LOS: BIntersection Capacity Utilization 39.1% ICU Level of Service AAnalysis Period (min) 15
Splits and Phases: 7: Access C & 152nd Avenue
Appendix C - Capacity Worksheets - Page 27

Timings Total Traffic Volumes8: Access D & 152nd Avenue Year 2018 AM Peak Hour
September 2016 Synchro ReportSM ROCHA, LLC
Lane Group EBL EBT EBR WBL WBT WBR NBL NBT NBR SBL SBT SBRLane ConfigurationsTraffic Volume (vph) 312 285 2 1 315 312 3 0 1 55 0 55Future Volume (vph) 312 285 2 1 315 312 3 0 1 55 0 55Satd. Flow (prot) 1770 3539 1583 1770 3539 1583 1770 1583 0 1770 1583 0Flt Permitted 0.502 0.563 0.727Satd. Flow (perm) 935 3539 1583 1049 3539 1583 1863 1583 0 1354 1583 0Satd. Flow (RTOR) 115 339 591 648Lane Group Flow (vph) 339 310 2 1 342 339 3 1 0 60 60 0Turn Type pm+pt NA Perm pm+pt NA Perm pm+pt NA pm+pt NAProtected Phases 5 2 1 6 3 8 7 4Permitted Phases 2 2 6 6 8 4Total Split (s) 30.0 55.0 55.0 11.0 36.0 36.0 11.0 22.0 12.0 23.0Total Lost Time (s) 4.5 4.5 4.5 4.5 4.5 4.5 4.5 4.5 4.5 4.5Act Effct Green (s) 59.7 50.9 50.9 52.4 46.8 46.8 6.7 5.5 8.2 6.9Actuated g/C Ratio 0.78 0.67 0.67 0.68 0.61 0.61 0.09 0.07 0.11 0.09v/c Ratio 0.41 0.13 0.00 0.00 0.16 0.31 0.02 0.00 0.33 0.08Control Delay 4.5 5.9 0.0 4.0 8.6 2.3 30.3 0.0 36.3 0.2Queue Delay 0.0 0.0 0.0 0.0 0.0 0.0 0.0 0.0 0.0 0.0Total Delay 4.5 5.9 0.0 4.0 8.6 2.3 30.3 0.0 36.3 0.2LOS A A A A A A C A D AApproach Delay 5.1 5.4 22.8 18.3Approach LOS A A C BQueue Length 50th (ft) 31 25 0 0 33 0 1 0 27 0Queue Length 95th (ft) 94 56 0 2 82 44 9 0 61 0Internal Link Dist (ft) 1086 1090 385 355Turn Bay Length (ft) 150 150 150 150 150 150Base Capacity (vph) 1026 2356 1092 793 2165 1099 175 820 196 876Starvation Cap Reductn 0 0 0 0 0 0 0 0 0 0Spillback Cap Reductn 0 0 0 0 0 0 0 0 0 0Storage Cap Reductn 0 0 0 0 0 0 0 0 0 0Reduced v/c Ratio 0.33 0.13 0.00 0.00 0.16 0.31 0.02 0.00 0.31 0.07
Intersection SummaryCycle Length: 100Actuated Cycle Length: 76.5Control Type: Actuated-UncoordinatedMaximum v/c Ratio: 0.41Intersection Signal Delay: 6.4 Intersection LOS: AIntersection Capacity Utilization 52.0% ICU Level of Service AAnalysis Period (min) 15
Splits and Phases: 8: Access D & 152nd Avenue
Appendix C - Capacity Worksheets - Page 28

HCM Unsignalized Intersection Capacity Analysis Total Traffic Volumes9: Access E & Washington Street Year 2018 AM Peak Hour
September 2016 Synchro ReportSM ROCHA, LLC
Movement WBL WBR NBT NBR SBL SBTLane ConfigurationsTraffic Volume (veh/h) 77 77 576 94 94 163Future Volume (Veh/h) 77 77 576 94 94 163Sign Control Stop Free FreeGrade 0% 0% 0%Peak Hour Factor 0.92 0.92 0.92 0.92 0.92 0.92Hourly flow rate (vph) 84 84 626 102 102 177PedestriansLane Width (ft)Walking Speed (ft/s)Percent BlockageRight turn flare (veh)Median type None NoneMedian storage veh)Upstream signal (ft) 1097pX, platoon unblockedvC, conflicting volume 918 313 728vC1, stage 1 conf volvC2, stage 2 conf volvCu, unblocked vol 918 313 728tC, single (s) 6.8 6.9 4.1tC, 2 stage (s)tF (s) 3.5 3.3 2.2p0 queue free % 65 88 88cM capacity (veh/h) 239 683 871
Direction, Lane # WB 1 WB 2 NB 1 NB 2 NB 3 SB 1 SB 2 SB 3Volume Total 84 84 313 313 102 102 88 88Volume Left 84 0 0 0 0 102 0 0Volume Right 0 84 0 0 102 0 0 0cSH 239 683 1700 1700 1700 871 1700 1700Volume to Capacity 0.35 0.12 0.18 0.18 0.06 0.12 0.05 0.05Queue Length 95th (ft) 38 10 0 0 0 10 0 0Control Delay (s) 28.0 11.0 0.0 0.0 0.0 9.7 0.0 0.0Lane LOS D B AApproach Delay (s) 19.5 0.0 3.5Approach LOS C
Intersection SummaryAverage Delay 3.6Intersection Capacity Utilization 35.4% ICU Level of Service AAnalysis Period (min) 15
Appendix C - Capacity Worksheets - Page 29

Timings Total Traffic Volumes10: Washington Street & Access F Year 2018 AM Peak Hour
September 2016 Synchro ReportSM ROCHA, LLC
Lane Group WBL WBR NBT NBR SBL SBTLane ConfigurationsTraffic Volume (vph) 66 45 200 376 250 96Future Volume (vph) 66 45 200 376 250 96Satd. Flow (prot) 1770 1583 3539 1583 1770 3539Flt Permitted 0.950 0.549Satd. Flow (perm) 1770 1583 3539 1583 1023 3539Satd. Flow (RTOR) 49 409Lane Group Flow (vph) 72 49 217 409 272 104Turn Type Perm Perm NA Perm pm+pt NAProtected Phases 2 1 6Permitted Phases 8 8 2 6Total Split (s) 25.0 25.0 49.0 49.0 26.0 75.0Total Lost Time (s) 4.5 4.5 4.5 4.5 5.5 4.5Act Effct Green (s) 8.9 8.9 44.7 44.7 69.8 71.9Actuated g/C Ratio 0.10 0.10 0.52 0.52 0.81 0.83v/c Ratio 0.40 0.24 0.12 0.40 0.27 0.04Control Delay 43.7 14.0 12.0 2.7 3.2 2.1Queue Delay 0.0 0.0 0.0 0.0 0.0 0.0Total Delay 43.7 14.0 12.0 2.7 3.2 2.1LOS D B B A A AApproach Delay 31.6 5.9 2.9Approach LOS C A AQueue Length 50th (ft) 38 0 32 0 29 4Queue Length 95th (ft) 79 32 55 46 58 11Internal Link Dist (ft) 874 1017 357Turn Bay Length (ft) 150 150Base Capacity (vph) 422 414 1831 1016 1005 2944Starvation Cap Reductn 0 0 0 0 0 0Spillback Cap Reductn 0 0 0 0 0 0Storage Cap Reductn 0 0 0 0 0 0Reduced v/c Ratio 0.17 0.12 0.12 0.40 0.27 0.04
Intersection SummaryCycle Length: 100Actuated Cycle Length: 86.4Control Type: Actuated-UncoordinatedMaximum v/c Ratio: 0.40Intersection Signal Delay: 7.7 Intersection LOS: AIntersection Capacity Utilization 44.6% ICU Level of Service AAnalysis Period (min) 15
Splits and Phases: 10: Washington Street & Access F
Appendix C - Capacity Worksheets - Page 30
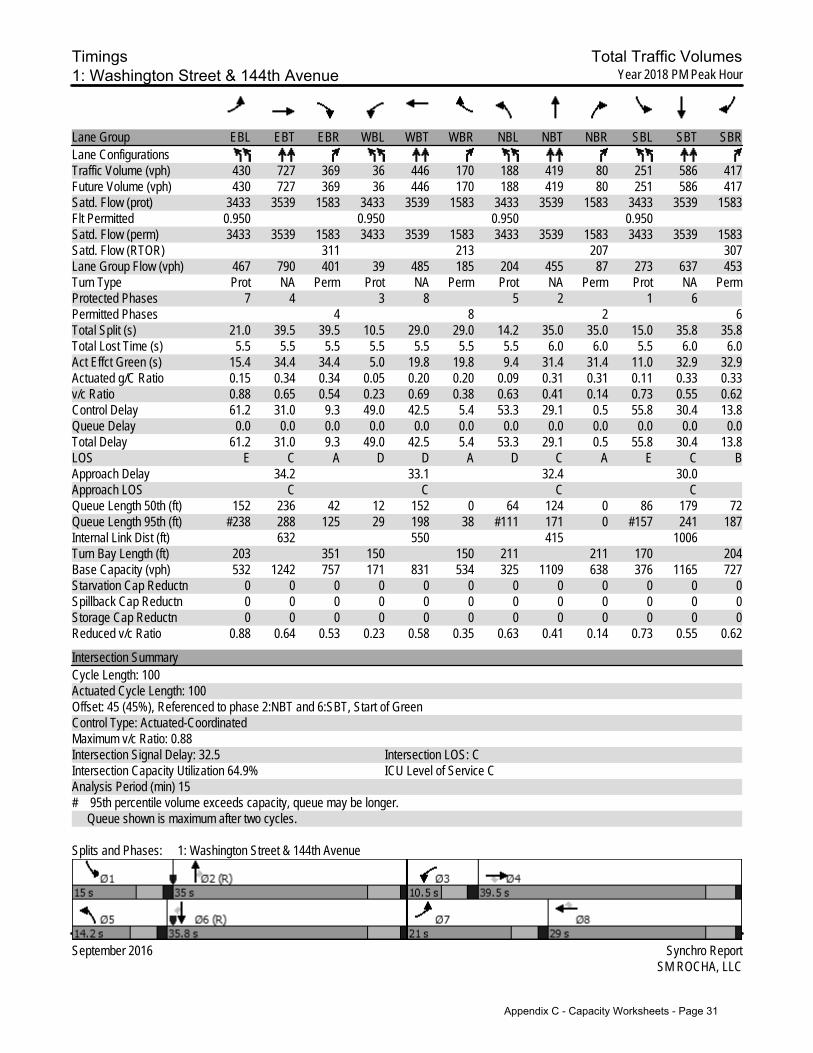
Timings Total Traffic Volumes1: Washington Street & 144th Avenue Year 2018 PM Peak Hour
September 2016 Synchro ReportSM ROCHA, LLC
Lane Group EBL EBT EBR WBL WBT WBR NBL NBT NBR SBL SBT SBRLane ConfigurationsTraffic Volume (vph) 430 727 369 36 446 170 188 419 80 251 586 417Future Volume (vph) 430 727 369 36 446 170 188 419 80 251 586 417Satd. Flow (prot) 3433 3539 1583 3433 3539 1583 3433 3539 1583 3433 3539 1583Flt Permitted 0.950 0.950 0.950 0.950Satd. Flow (perm) 3433 3539 1583 3433 3539 1583 3433 3539 1583 3433 3539 1583Satd. Flow (RTOR) 311 213 207 307Lane Group Flow (vph) 467 790 401 39 485 185 204 455 87 273 637 453Turn Type Prot NA Perm Prot NA Perm Prot NA Perm Prot NA PermProtected Phases 7 4 3 8 5 2 1 6Permitted Phases 4 8 2 6Total Split (s) 21.0 39.5 39.5 10.5 29.0 29.0 14.2 35.0 35.0 15.0 35.8 35.8Total Lost Time (s) 5.5 5.5 5.5 5.5 5.5 5.5 5.5 6.0 6.0 5.5 6.0 6.0Act Effct Green (s) 15.4 34.4 34.4 5.0 19.8 19.8 9.4 31.4 31.4 11.0 32.9 32.9Actuated g/C Ratio 0.15 0.34 0.34 0.05 0.20 0.20 0.09 0.31 0.31 0.11 0.33 0.33v/c Ratio 0.88 0.65 0.54 0.23 0.69 0.38 0.63 0.41 0.14 0.73 0.55 0.62Control Delay 61.2 31.0 9.3 49.0 42.5 5.4 53.3 29.1 0.5 55.8 30.4 13.8Queue Delay 0.0 0.0 0.0 0.0 0.0 0.0 0.0 0.0 0.0 0.0 0.0 0.0Total Delay 61.2 31.0 9.3 49.0 42.5 5.4 53.3 29.1 0.5 55.8 30.4 13.8LOS E C A D D A D C A E C BApproach Delay 34.2 33.1 32.4 30.0Approach LOS C C C CQueue Length 50th (ft) 152 236 42 12 152 0 64 124 0 86 179 72Queue Length 95th (ft) #238 288 125 29 198 38 #111 171 0 #157 241 187Internal Link Dist (ft) 632 550 415 1006Turn Bay Length (ft) 203 351 150 150 211 211 170 204Base Capacity (vph) 532 1242 757 171 831 534 325 1109 638 376 1165 727Starvation Cap Reductn 0 0 0 0 0 0 0 0 0 0 0 0Spillback Cap Reductn 0 0 0 0 0 0 0 0 0 0 0 0Storage Cap Reductn 0 0 0 0 0 0 0 0 0 0 0 0Reduced v/c Ratio 0.88 0.64 0.53 0.23 0.58 0.35 0.63 0.41 0.14 0.73 0.55 0.62
Intersection SummaryCycle Length: 100Actuated Cycle Length: 100Offset: 45 (45%), Referenced to phase 2:NBT and 6:SBT, Start of GreenControl Type: Actuated-CoordinatedMaximum v/c Ratio: 0.88Intersection Signal Delay: 32.5 Intersection LOS: CIntersection Capacity Utilization 64.9% ICU Level of Service CAnalysis Period (min) 15# 95th percentile volume exceeds capacity, queue may be longer. Queue shown is maximum after two cycles.
Splits and Phases: 1: Washington Street & 144th Avenue
Appendix C - Capacity Worksheets - Page 31

HCM Unsignalized Intersection Capacity Analysis Total Traffic Volumes2: Washington Street & 152nd Avenue Year 2018 PM Peak Hour
September 2016 Synchro ReportSM ROCHA, LLC
Movement EBL EBR NBL NBT SBT SBRLane ConfigurationsTraffic Volume (veh/h) 110 753 607 410 432 44Future Volume (Veh/h) 110 753 607 410 432 44Sign Control Stop Free FreeGrade 0% 0% 0%Peak Hour Factor 0.92 0.92 0.92 0.92 0.92 0.92Hourly flow rate (vph) 120 818 660 446 470 48PedestriansLane Width (ft)Walking Speed (ft/s)Percent BlockageRight turn flare (veh)Median type None NoneMedian storage veh)Upstream signal (ft)pX, platoon unblockedvC, conflicting volume 2013 235 518vC1, stage 1 conf volvC2, stage 2 conf volvCu, unblocked vol 2013 235 518tC, single (s) 6.8 6.9 4.1tC, 2 stage (s)tF (s) 3.5 3.3 2.2p0 queue free % 0 0 37cM capacity (veh/h) 19 767 1044
Direction, Lane # EB 1 EB 2 NB 1 NB 2 NB 3 SB 1 SB 2 SB 3Volume Total 120 818 660 223 223 235 235 48Volume Left 120 0 660 0 0 0 0 0Volume Right 0 818 0 0 0 0 0 48cSH 19 767 1044 1700 1700 1700 1700 1700Volume to Capacity 6.39 1.07 0.63 0.13 0.13 0.14 0.14 0.03Queue Length 95th (ft) Err 525 117 0 0 0 0 0Control Delay (s) Err 74.6 14.2 0.0 0.0 0.0 0.0 0.0Lane LOS F F BApproach Delay (s) 1344.2 8.5 0.0Approach LOS F
Intersection SummaryAverage Delay 495.8Intersection Capacity Utilization 71.7% ICU Level of Service CAnalysis Period (min) 15
Appendix C - Capacity Worksheets - Page 32

HCM Unsignalized Intersection Capacity Analysis Total Traffic Volumes3: York Street & 152nd Avenue Year 2018 PM Peak Hour
September 2016 Synchro ReportSM ROCHA, LLC
Movement EBT EBR WBL WBT NBL NBRLane ConfigurationsTraffic Volume (veh/h) 439 189 228 297 112 111Future Volume (Veh/h) 439 189 228 297 112 111Sign Control Free Free StopGrade 0% 0% 0%Peak Hour Factor 0.92 0.92 0.92 0.92 0.92 0.92Hourly flow rate (vph) 477 205 248 323 122 121PedestriansLane Width (ft)Walking Speed (ft/s)Percent BlockageRight turn flare (veh)Median type None NoneMedian storage veh)Upstream signal (ft) 1170pX, platoon unblocked 0.87 0.87 0.87vC, conflicting volume 682 1296 477vC1, stage 1 conf volvC2, stage 2 conf volvCu, unblocked vol 558 1265 322tC, single (s) 4.1 6.4 6.2tC, 2 stage (s)tF (s) 2.2 3.5 3.3p0 queue free % 72 0 81cM capacity (veh/h) 879 116 624
Direction, Lane # EB 1 EB 2 WB 1 WB 2 NB 1 NB 2Volume Total 477 205 248 323 122 121Volume Left 0 0 248 0 122 0Volume Right 0 205 0 0 0 121cSH 1700 1700 879 1700 116 624Volume to Capacity 0.28 0.12 0.28 0.19 1.05 0.19Queue Length 95th (ft) 0 0 29 0 178 18Control Delay (s) 0.0 0.0 10.7 0.0 167.8 12.1Lane LOS B F BApproach Delay (s) 0.0 4.6 90.3Approach LOS F
Intersection SummaryAverage Delay 16.4Intersection Capacity Utilization 51.9% ICU Level of Service AAnalysis Period (min) 15
Appendix C - Capacity Worksheets - Page 33

HCM Unsignalized Intersection Capacity Analysis Total Traffic Volumes4: 148th Avenue & Washington Street Year 2018 PM Peak Hour
September 2016 Synchro ReportSM ROCHA, LLC
Movement WBL WBR NBT NBR SBL SBTLane ConfigurationsTraffic Volume (veh/h) 37 27 564 92 14 1165Future Volume (Veh/h) 37 27 564 92 14 1165Sign Control Stop Free FreeGrade 0% 0% 0%Peak Hour Factor 0.92 0.92 0.92 0.92 0.92 0.92Hourly flow rate (vph) 40 29 613 100 15 1266PedestriansLane Width (ft)Walking Speed (ft/s)Percent BlockageRight turn flare (veh)Median type None NoneMedian storage veh)Upstream signal (ft) 1086pX, platoon unblockedvC, conflicting volume 1276 306 713vC1, stage 1 conf volvC2, stage 2 conf volvCu, unblocked vol 1276 306 713tC, single (s) 6.8 6.9 4.1tC, 2 stage (s)tF (s) 3.5 3.3 2.2p0 queue free % 74 96 98cM capacity (veh/h) 156 689 883
Direction, Lane # WB 1 WB 2 NB 1 NB 2 NB 3 SB 1 SB 2 SB 3Volume Total 40 29 306 306 100 15 633 633Volume Left 40 0 0 0 0 15 0 0Volume Right 0 29 0 0 100 0 0 0cSH 156 689 1700 1700 1700 883 1700 1700Volume to Capacity 0.26 0.04 0.18 0.18 0.06 0.02 0.37 0.37Queue Length 95th (ft) 24 3 0 0 0 1 0 0Control Delay (s) 35.9 10.5 0.0 0.0 0.0 9.1 0.0 0.0Lane LOS E B AApproach Delay (s) 25.2 0.0 0.1Approach LOS D
Intersection SummaryAverage Delay 0.9Intersection Capacity Utilization 42.2% ICU Level of Service AAnalysis Period (min) 15
Appendix C - Capacity Worksheets - Page 34

HCM Unsignalized Intersection Capacity Analysis Total Traffic Volumes5: Washington Street & Access A Year 2018 PM Peak Hour
September 2016 Synchro ReportSM ROCHA, LLC
Movement WBL WBR NBT NBR SBL SBTLane ConfigurationsTraffic Volume (veh/h) 51 78 564 69 60 1091Future Volume (Veh/h) 51 78 564 69 60 1091Sign Control Stop Free FreeGrade 0% 0% 0%Peak Hour Factor 0.92 0.92 0.92 0.92 0.92 0.92Hourly flow rate (vph) 55 85 613 75 65 1186PedestriansLane Width (ft)Walking Speed (ft/s)Percent BlockageRight turn flare (veh)Median type None NoneMedian storage veh)Upstream signal (ft)pX, platoon unblockedvC, conflicting volume 1336 306 688vC1, stage 1 conf volvC2, stage 2 conf volvCu, unblocked vol 1336 306 688tC, single (s) 6.8 6.9 4.1tC, 2 stage (s)tF (s) 3.5 3.3 2.2p0 queue free % 59 88 93cM capacity (veh/h) 134 689 902
Direction, Lane # WB 1 WB 2 NB 1 NB 2 NB 3 SB 1 SB 2 SB 3Volume Total 55 85 306 306 75 65 593 593Volume Left 55 0 0 0 0 65 0 0Volume Right 0 85 0 0 75 0 0 0cSH 134 689 1700 1700 1700 902 1700 1700Volume to Capacity 0.41 0.12 0.18 0.18 0.04 0.07 0.35 0.35Queue Length 95th (ft) 44 10 0 0 0 6 0 0Control Delay (s) 49.3 11.0 0.0 0.0 0.0 9.3 0.0 0.0Lane LOS E B AApproach Delay (s) 26.0 0.0 0.5Approach LOS D
Intersection SummaryAverage Delay 2.0Intersection Capacity Utilization 40.2% ICU Level of Service AAnalysis Period (min) 15
Appendix C - Capacity Worksheets - Page 35

HCM Unsignalized Intersection Capacity Analysis Total Traffic Volumes6: Access B & 152nd Avenue Year 2018 PM Peak Hour
September 2016 Synchro ReportSM ROCHA, LLC
Movement EBT EBR WBL WBT NBL NBRLane ConfigurationsTraffic Volume (veh/h) 427 93 46 539 0 39Future Volume (Veh/h) 427 93 46 539 0 39Sign Control Free Free StopGrade 0% 0% 0%Peak Hour Factor 0.92 0.92 0.92 0.92 0.92 0.92Hourly flow rate (vph) 464 101 50 586 0 42PedestriansLane Width (ft)Walking Speed (ft/s)Percent BlockageRight turn flare (veh)Median type None NoneMedian storage veh)Upstream signal (ft) 856pX, platoon unblocked 0.95vC, conflicting volume 565 857 232vC1, stage 1 conf volvC2, stage 2 conf volvCu, unblocked vol 565 743 232tC, single (s) 4.1 6.8 6.9tC, 2 stage (s)tF (s) 2.2 3.5 3.3p0 queue free % 95 100 95cM capacity (veh/h) 1003 316 770
Direction, Lane # EB 1 EB 2 EB 3 WB 1 WB 2 WB 3 NB 1Volume Total 232 232 101 50 293 293 42Volume Left 0 0 0 50 0 0 0Volume Right 0 0 101 0 0 0 42cSH 1700 1700 1700 1003 1700 1700 770Volume to Capacity 0.14 0.14 0.06 0.05 0.17 0.17 0.05Queue Length 95th (ft) 0 0 0 4 0 0 4Control Delay (s) 0.0 0.0 0.0 8.8 0.0 0.0 9.9Lane LOS A AApproach Delay (s) 0.0 0.7 9.9Approach LOS A
Intersection SummaryAverage Delay 0.7Intersection Capacity Utilization 21.8% ICU Level of Service AAnalysis Period (min) 15
Appendix C - Capacity Worksheets - Page 36

Timings Total Traffic Volumes7: Access C & 152nd Avenue Year 2018 PM Peak Hour
September 2016 Synchro ReportSM ROCHA, LLC
Lane Group EBL EBT EBR WBL WBT WBR NBL NBT NBR SBL SBT SBRLane ConfigurationsTraffic Volume (vph) 54 319 93 69 428 66 51 40 38 60 46 76Future Volume (vph) 54 319 93 69 428 66 51 40 38 60 46 76Satd. Flow (prot) 1770 3539 1583 1770 3539 1583 1770 1863 1583 1770 1863 1583Flt Permitted 0.469 0.541 0.724 0.580Satd. Flow (perm) 874 3539 1583 1008 3539 1583 1349 1863 1583 1080 1863 1583Satd. Flow (RTOR) 115 115 115 115Lane Group Flow (vph) 59 347 101 75 465 72 55 43 41 65 50 83Turn Type pm+pt NA Perm pm+pt NA Perm pm+pt NA Perm pm+pt NA PermProtected Phases 5 2 1 6 3 8 7 4Permitted Phases 2 2 6 6 8 8 4 4Total Split (s) 16.0 41.0 41.0 16.0 41.0 41.0 16.0 27.0 27.0 16.0 27.0 27.0Total Lost Time (s) 4.5 4.5 4.5 4.5 4.5 4.5 4.5 4.5 4.5 4.5 4.5 4.5Act Effct Green (s) 44.2 37.6 37.6 44.7 37.8 37.8 13.1 7.3 7.3 14.7 9.9 9.9Actuated g/C Ratio 0.61 0.52 0.52 0.62 0.52 0.52 0.18 0.10 0.10 0.20 0.14 0.14v/c Ratio 0.10 0.19 0.12 0.11 0.25 0.08 0.19 0.23 0.16 0.22 0.20 0.26Control Delay 6.7 12.0 2.7 6.8 12.2 1.2 23.6 35.9 1.3 24.0 33.5 5.6Queue Delay 0.0 0.0 0.0 0.0 0.0 0.0 0.0 0.0 0.0 0.0 0.0 0.0Total Delay 6.7 12.0 2.7 6.8 12.2 1.2 23.6 35.9 1.3 24.0 33.5 5.6LOS A B A A B A C D A C C AApproach Delay 9.6 10.3 20.8 18.7Approach LOS A B C BQueue Length 50th (ft) 10 47 0 12 65 0 20 19 0 24 22 0Queue Length 95th (ft) 26 83 22 31 110 9 48 51 0 54 56 23Internal Link Dist (ft) 776 1086 549 401Turn Bay Length (ft) 150 150 150 150 150 150 150 150Base Capacity (vph) 735 1837 877 805 1848 881 397 596 584 380 596 584Starvation Cap Reductn 0 0 0 0 0 0 0 0 0 0 0 0Spillback Cap Reductn 0 0 0 0 0 0 0 0 0 0 0 0Storage Cap Reductn 0 0 0 0 0 0 0 0 0 0 0 0Reduced v/c Ratio 0.08 0.19 0.12 0.09 0.25 0.08 0.14 0.07 0.07 0.17 0.08 0.14
Intersection SummaryCycle Length: 100Actuated Cycle Length: 72.4Control Type: Actuated-UncoordinatedMaximum v/c Ratio: 0.26Intersection Signal Delay: 12.2 Intersection LOS: BIntersection Capacity Utilization 37.2% ICU Level of Service AAnalysis Period (min) 15
Splits and Phases: 7: Access C & 152nd Avenue
Appendix C - Capacity Worksheets - Page 37
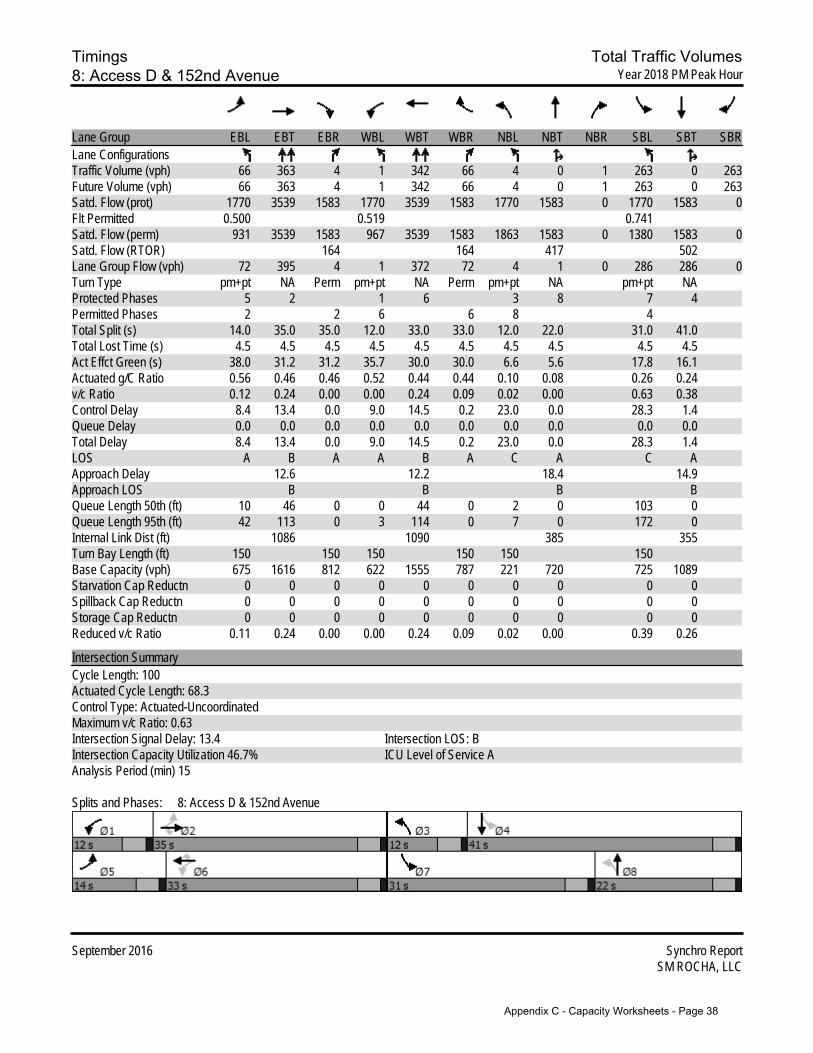
Timings Total Traffic Volumes8: Access D & 152nd Avenue Year 2018 PM Peak Hour
September 2016 Synchro ReportSM ROCHA, LLC
Lane Group EBL EBT EBR WBL WBT WBR NBL NBT NBR SBL SBT SBRLane ConfigurationsTraffic Volume (vph) 66 363 4 1 342 66 4 0 1 263 0 263Future Volume (vph) 66 363 4 1 342 66 4 0 1 263 0 263Satd. Flow (prot) 1770 3539 1583 1770 3539 1583 1770 1583 0 1770 1583 0Flt Permitted 0.500 0.519 0.741Satd. Flow (perm) 931 3539 1583 967 3539 1583 1863 1583 0 1380 1583 0Satd. Flow (RTOR) 164 164 417 502Lane Group Flow (vph) 72 395 4 1 372 72 4 1 0 286 286 0Turn Type pm+pt NA Perm pm+pt NA Perm pm+pt NA pm+pt NAProtected Phases 5 2 1 6 3 8 7 4Permitted Phases 2 2 6 6 8 4Total Split (s) 14.0 35.0 35.0 12.0 33.0 33.0 12.0 22.0 31.0 41.0Total Lost Time (s) 4.5 4.5 4.5 4.5 4.5 4.5 4.5 4.5 4.5 4.5Act Effct Green (s) 38.0 31.2 31.2 35.7 30.0 30.0 6.6 5.6 17.8 16.1Actuated g/C Ratio 0.56 0.46 0.46 0.52 0.44 0.44 0.10 0.08 0.26 0.24v/c Ratio 0.12 0.24 0.00 0.00 0.24 0.09 0.02 0.00 0.63 0.38Control Delay 8.4 13.4 0.0 9.0 14.5 0.2 23.0 0.0 28.3 1.4Queue Delay 0.0 0.0 0.0 0.0 0.0 0.0 0.0 0.0 0.0 0.0Total Delay 8.4 13.4 0.0 9.0 14.5 0.2 23.0 0.0 28.3 1.4LOS A B A A B A C A C AApproach Delay 12.6 12.2 18.4 14.9Approach LOS B B B BQueue Length 50th (ft) 10 46 0 0 44 0 2 0 103 0Queue Length 95th (ft) 42 113 0 3 114 0 7 0 172 0Internal Link Dist (ft) 1086 1090 385 355Turn Bay Length (ft) 150 150 150 150 150 150Base Capacity (vph) 675 1616 812 622 1555 787 221 720 725 1089Starvation Cap Reductn 0 0 0 0 0 0 0 0 0 0Spillback Cap Reductn 0 0 0 0 0 0 0 0 0 0Storage Cap Reductn 0 0 0 0 0 0 0 0 0 0Reduced v/c Ratio 0.11 0.24 0.00 0.00 0.24 0.09 0.02 0.00 0.39 0.26
Intersection SummaryCycle Length: 100Actuated Cycle Length: 68.3Control Type: Actuated-UncoordinatedMaximum v/c Ratio: 0.63Intersection Signal Delay: 13.4 Intersection LOS: BIntersection Capacity Utilization 46.7% ICU Level of Service AAnalysis Period (min) 15
Splits and Phases: 8: Access D & 152nd Avenue
Appendix C - Capacity Worksheets - Page 38

HCM Unsignalized Intersection Capacity Analysis Total Traffic Volumes9: Access E & Washington Street Year 2018 PM Peak Hour
September 2016 Synchro ReportSM ROCHA, LLC
Movement WBL WBR NBT NBR SBL SBTLane ConfigurationsTraffic Volume (veh/h) 60 60 600 54 54 708Future Volume (Veh/h) 60 60 600 54 54 708Sign Control Stop Free FreeGrade 0% 0% 0%Peak Hour Factor 0.92 0.92 0.92 0.92 0.92 0.92Hourly flow rate (vph) 65 65 652 59 59 770PedestriansLane Width (ft)Walking Speed (ft/s)Percent BlockageRight turn flare (veh)Median type None NoneMedian storage veh)Upstream signal (ft) 1097pX, platoon unblockedvC, conflicting volume 1155 326 711vC1, stage 1 conf volvC2, stage 2 conf volvCu, unblocked vol 1155 326 711tC, single (s) 6.8 6.9 4.1tC, 2 stage (s)tF (s) 3.5 3.3 2.2p0 queue free % 63 90 93cM capacity (veh/h) 177 670 884
Direction, Lane # WB 1 WB 2 NB 1 NB 2 NB 3 SB 1 SB 2 SB 3Volume Total 65 65 326 326 59 59 385 385Volume Left 65 0 0 0 0 59 0 0Volume Right 0 65 0 0 59 0 0 0cSH 177 670 1700 1700 1700 884 1700 1700Volume to Capacity 0.37 0.10 0.19 0.19 0.03 0.07 0.23 0.23Queue Length 95th (ft) 39 8 0 0 0 5 0 0Control Delay (s) 36.6 11.0 0.0 0.0 0.0 9.4 0.0 0.0Lane LOS E B AApproach Delay (s) 23.8 0.0 0.7Approach LOS C
Intersection SummaryAverage Delay 2.2Intersection Capacity Utilization 33.3% ICU Level of Service AAnalysis Period (min) 15
Appendix C - Capacity Worksheets - Page 39

Timings Total Traffic Volumes10: Washington Street & Access F Year 2018 PM Peak Hour
September 2016 Synchro ReportSM ROCHA, LLC
Lane Group WBL WBR NBT NBR SBL SBTLane ConfigurationsTraffic Volume (vph) 315 210 512 79 52 393Future Volume (vph) 315 210 512 79 52 393Satd. Flow (prot) 1770 1583 3539 1583 1770 3539Flt Permitted 0.950 0.348Satd. Flow (perm) 1770 1583 3539 1583 648 3539Satd. Flow (RTOR) 228 86Lane Group Flow (vph) 342 228 557 86 57 427Turn Type Perm Perm NA Perm pm+pt NAProtected Phases 2 1 6Permitted Phases 8 8 2 6Total Split (s) 47.0 47.0 38.0 38.0 15.0 53.0Total Lost Time (s) 4.5 4.5 4.5 4.5 5.5 4.5Act Effct Green (s) 20.1 20.1 36.6 36.6 47.8 48.8Actuated g/C Ratio 0.26 0.26 0.47 0.47 0.61 0.63v/c Ratio 0.75 0.40 0.33 0.11 0.12 0.19Control Delay 37.2 5.4 14.8 4.2 8.1 7.3Queue Delay 0.0 0.0 0.0 0.0 0.0 0.0Total Delay 37.2 5.4 14.8 4.2 8.1 7.3LOS D A B A A AApproach Delay 24.5 13.4 7.4Approach LOS C B AQueue Length 50th (ft) 152 0 84 0 10 40Queue Length 95th (ft) 238 47 152 27 30 81Internal Link Dist (ft) 874 1017 357Turn Bay Length (ft) 150 150Base Capacity (vph) 970 971 1664 790 534 2215Starvation Cap Reductn 0 0 0 0 0 0Spillback Cap Reductn 0 0 0 0 0 0Storage Cap Reductn 0 0 0 0 0 0Reduced v/c Ratio 0.35 0.23 0.33 0.11 0.11 0.19
Intersection SummaryCycle Length: 100Actuated Cycle Length: 77.9Control Type: Actuated-UncoordinatedMaximum v/c Ratio: 0.75Intersection Signal Delay: 15.4 Intersection LOS: BIntersection Capacity Utilization 47.9% ICU Level of Service AAnalysis Period (min) 15
Splits and Phases: 10: Washington Street & Access F
Appendix C - Capacity Worksheets - Page 40

Timings Total Traffic Volumes1: 144th Avenue & Washington Street Year 2036 AM Peak Hour
September 2016 Synchro ReportSM ROCHA, LLC
Lane Group EBL EBT EBR WBL WBT WBR NBL NBT NBR SBL SBT SBRLane ConfigurationsTraffic Volume (vph) 411 326 106 92 1044 259 184 447 23 133 353 298Future Volume (vph) 411 326 106 92 1044 259 184 447 23 133 353 298Satd. Flow (prot) 3433 5085 1583 3433 5085 1583 3433 5085 1583 3433 5085 1583Flt Permitted 0.950 0.950 0.950 0.950Satd. Flow (perm) 3433 5085 1583 3433 5085 1583 3433 5085 1583 3433 5085 1583Satd. Flow (RTOR) 127 200 173 324Lane Group Flow (vph) 447 354 115 100 1135 282 200 486 25 145 384 324Turn Type Prot NA Perm Prot NA Perm Prot NA Perm Prot NA PermProtected Phases 7 4 3 8 5 2 1 6Permitted Phases 4 8 2 6Total Split (s) 29.0 56.0 56.0 13.0 40.0 40.0 18.0 35.7 35.7 15.3 33.0 33.0Total Lost Time (s) 5.5 5.5 5.5 5.5 5.5 5.5 5.5 6.0 6.0 5.5 6.0 6.0Act Effct Green (s) 20.3 46.7 46.7 7.3 33.8 33.8 11.4 34.1 34.1 9.3 32.0 32.0Actuated g/C Ratio 0.17 0.39 0.39 0.06 0.28 0.28 0.10 0.28 0.28 0.08 0.27 0.27v/c Ratio 0.77 0.18 0.17 0.48 0.79 0.48 0.61 0.34 0.04 0.55 0.28 0.49Control Delay 56.9 23.7 3.5 62.5 44.5 13.4 60.5 35.9 0.1 71.0 24.7 5.3Queue Delay 0.0 0.0 0.0 0.0 0.0 0.0 0.0 0.0 0.0 0.0 0.0 0.0Total Delay 56.9 23.7 3.5 62.5 44.5 13.4 60.5 35.9 0.1 71.0 24.7 5.3LOS E C A E D B E D A E C AApproach Delay 37.4 39.9 41.6 25.2Approach LOS D D D CQueue Length 50th (ft) 171 61 0 39 287 46 77 115 0 50 83 55Queue Length 95th (ft) 222 84 29 68 351 128 117 150 0 82 116 72Internal Link Dist (ft) 632 550 415 2102Turn Bay Length (ft) 203 351 150 150 211 211 170 204Base Capacity (vph) 672 2139 739 214 1487 604 357 1446 573 283 1357 660Starvation Cap Reductn 0 0 0 0 0 0 0 0 0 0 0 0Spillback Cap Reductn 0 0 0 0 0 0 0 0 0 0 0 0Storage Cap Reductn 0 0 0 0 0 0 0 0 0 0 0 0Reduced v/c Ratio 0.67 0.17 0.16 0.47 0.76 0.47 0.56 0.34 0.04 0.51 0.28 0.49
Intersection SummaryCycle Length: 120Actuated Cycle Length: 120Offset: 0 (0%), Referenced to phase 2:NBT and 6:SBT, Start of GreenControl Type: Actuated-CoordinatedMaximum v/c Ratio: 0.79Intersection Signal Delay: 36.5 Intersection LOS: DIntersection Capacity Utilization 63.4% ICU Level of Service BAnalysis Period (min) 15
Splits and Phases: 1: 144th Avenue & Washington Street
Appendix C - Capacity Worksheets - Page 41

Timings Total Traffic Volumes2: Washington Street & 152nd Ave Year 2036 AM Peak Hour
September 2016 Synchro ReportSM ROCHA, LLC
Lane Group WBL WBR NBT NBR SBL SBTLane ConfigurationsTraffic Volume (vph) 563 62 774 1013 34 362Future Volume (vph) 563 62 774 1013 34 362Satd. Flow (prot) 3090 1425 4577 1425 3090 4577Flt Permitted 0.950 0.950Satd. Flow (perm) 3090 1425 4577 1425 3090 4577Satd. Flow (RTOR) 67 1047Lane Group Flow (vph) 612 67 841 1101 37 393Turn Type Perm Perm NA Free Prot NAProtected Phases 2 1 6Permitted Phases 8 8 FreeTotal Split (s) 55.0 55.0 51.0 14.0 65.0Total Lost Time (s) 4.5 4.5 4.5 4.5 4.5Act Effct Green (s) 30.2 30.2 69.3 120.0 6.9 80.8Actuated g/C Ratio 0.25 0.25 0.58 1.00 0.06 0.67v/c Ratio 0.79 0.16 0.32 0.77 0.21 0.13Control Delay 49.2 8.1 11.8 10.3 58.7 6.7Queue Delay 0.0 0.0 0.0 0.0 0.0 0.0Total Delay 49.2 8.1 11.8 10.3 58.7 6.7LOS D A B B E AApproach Delay 45.1 10.9 11.2Approach LOS D B BQueue Length 50th (ft) 229 0 115 560 14 31Queue Length 95th (ft) 271 33 154 770 32 52Internal Link Dist (ft) 590 827 974Turn Bay Length (ft) 200Base Capacity (vph) 1300 638 2644 1425 244 3080Starvation Cap Reductn 0 0 0 0 0 0Spillback Cap Reductn 0 0 0 0 0 0Storage Cap Reductn 0 0 0 0 0 0Reduced v/c Ratio 0.47 0.11 0.32 0.77 0.15 0.13
Intersection SummaryCycle Length: 120Actuated Cycle Length: 120Offset: 0 (0%), Referenced to phase 2:NBT and 6:SBT, Start of GreenControl Type: Actuated-CoordinatedMaximum v/c Ratio: 0.79Intersection Signal Delay: 18.6 Intersection LOS: BIntersection Capacity Utilization 42.0% ICU Level of Service AAnalysis Period (min) 15
Splits and Phases: 2: Washington Street & 152nd Ave
Appendix C - Capacity Worksheets - Page 42

Timings Total Traffic Volumes3: York Street & 152nd Avenue Year 2036 AM Peak Hour
September 2016 Synchro ReportSM ROCHA, LLC
Lane Group EBT EBR WBL WBT NBL NBRLane ConfigurationsTraffic Volume (vph) 332 147 186 708 230 403Future Volume (vph) 332 147 186 708 230 403Satd. Flow (prot) 5085 1583 3433 5085 3433 1583Flt Permitted 0.950 0.950Satd. Flow (perm) 5085 1583 3433 5085 3433 1583Satd. Flow (RTOR) 160 438Lane Group Flow (vph) 361 160 202 770 250 438Turn Type NA Perm Prot NA Perm PermProtected Phases 2 1 6Permitted Phases 2 8 8Total Split (s) 35.0 35.0 24.0 59.0 61.0 61.0Total Lost Time (s) 4.5 4.5 4.5 4.5 4.5 4.5Act Effct Green (s) 40.5 40.5 9.6 54.6 11.4 11.4Actuated g/C Ratio 0.54 0.54 0.13 0.73 0.15 0.15v/c Ratio 0.13 0.17 0.46 0.21 0.48 0.72Control Delay 9.4 2.5 34.1 3.7 32.1 10.5Queue Delay 0.0 0.0 0.0 0.0 0.0 0.0Total Delay 9.4 2.5 34.1 3.7 32.1 10.5LOS A A C A C BApproach Delay 7.3 10.0 18.4Approach LOS A A BQueue Length 50th (ft) 27 0 44 31 55 0Queue Length 95th (ft) 51 29 78 58 88 76Internal Link Dist (ft) 2106 2537 1753Turn Bay Length (ft) 200 200Base Capacity (vph) 2747 928 894 3702 2591 1302Starvation Cap Reductn 0 0 0 0 0 0Spillback Cap Reductn 0 0 0 0 0 0Storage Cap Reductn 0 0 0 0 0 0Reduced v/c Ratio 0.13 0.17 0.23 0.21 0.10 0.34
Intersection SummaryCycle Length: 120Actuated Cycle Length: 75Control Type: Actuated-UncoordinatedMaximum v/c Ratio: 0.72Intersection Signal Delay: 12.0 Intersection LOS: BIntersection Capacity Utilization 38.9% ICU Level of Service AAnalysis Period (min) 15
Splits and Phases: 3: York Street & 152nd Avenue
Appendix C - Capacity Worksheets - Page 43

HCM Unsignalized Intersection Capacity Analysis Total Traffic Volumes4: Washington Street & 148th Avenue Year 2036 AM Peak Hour
September 2016 Synchro ReportSM ROCHA, LLC
Movement WBL WBR NBT NBR SBL SBTLane ConfigurationsTraffic Volume (veh/h) 67 46 1217 24 19 1039Future Volume (Veh/h) 67 46 1217 24 19 1039Sign Control Stop Free FreeGrade 0% 0% 0%Peak Hour Factor 0.92 0.92 0.92 0.92 0.92 0.92Hourly flow rate (vph) 73 50 1323 26 21 1129PedestriansLane Width (ft)Walking Speed (ft/s)Percent BlockageRight turn flare (veh)Median type None NoneMedian storage veh)Upstream signal (ft)pX, platoon unblockedvC, conflicting volume 1741 441 1349vC1, stage 1 conf volvC2, stage 2 conf volvCu, unblocked vol 1741 441 1349tC, single (s) 6.8 6.9 4.1tC, 2 stage (s)tF (s) 3.5 3.3 2.2p0 queue free % 2 91 96cM capacity (veh/h) 75 564 506
Direction, Lane # WB 1 WB 2 NB 1 NB 2 NB 3 NB 4 SB 1 SB 2 SB 3 SB 4Volume Total 73 50 441 441 441 26 21 376 376 376Volume Left 73 0 0 0 0 0 21 0 0 0Volume Right 0 50 0 0 0 26 0 0 0 0cSH 75 564 1700 1700 1700 1700 506 1700 1700 1700Volume to Capacity 0.98 0.09 0.26 0.26 0.26 0.02 0.04 0.22 0.22 0.22Queue Length 95th (ft) 128 7 0 0 0 0 3 0 0 0Control Delay (s) 194.1 12.0 0.0 0.0 0.0 0.0 12.4 0.0 0.0 0.0Lane LOS F B BApproach Delay (s) 120.1 0.0 0.2Approach LOS F
Intersection SummaryAverage Delay 5.7Intersection Capacity Utilization 33.9% ICU Level of Service AAnalysis Period (min) 15
Appendix C - Capacity Worksheets - Page 44

HCM Unsignalized Intersection Capacity Analysis Total Traffic Volumes5: Access A & Washington Street Year 2036 AM Peak Hour
September 2016 Synchro ReportSM ROCHA, LLC
Movement WBL WBR NBT NBR SBL SBTLane ConfigurationsTraffic Volume (veh/h) 90 138 1263 18 77 901Future Volume (Veh/h) 90 138 1263 18 77 901Sign Control Stop Free FreeGrade 0% 0% 0%Peak Hour Factor 0.92 0.92 0.92 0.92 0.92 0.92Hourly flow rate (vph) 98 150 1373 20 84 979PedestriansLane Width (ft)Walking Speed (ft/s)Percent BlockageRight turn flare (veh)Median type None NoneMedian storage veh)Upstream signal (ft) 907pX, platoon unblockedvC, conflicting volume 1867 458 1393vC1, stage 1 conf volvC2, stage 2 conf volvCu, unblocked vol 1867 458 1393tC, single (s) 6.8 6.9 4.1tC, 2 stage (s)tF (s) 3.5 3.3 2.2p0 queue free % 0 73 83cM capacity (veh/h) 53 550 487
Direction, Lane # WB 1 WB 2 NB 1 NB 2 NB 3 NB 4 SB 1 SB 2 SB 3 SB 4Volume Total 98 150 458 458 458 20 84 326 326 326Volume Left 98 0 0 0 0 0 84 0 0 0Volume Right 0 150 0 0 0 20 0 0 0 0cSH 53 550 1700 1700 1700 1700 487 1700 1700 1700Volume to Capacity 1.85 0.27 0.27 0.27 0.27 0.01 0.17 0.19 0.19 0.19Queue Length 95th (ft) 237 28 0 0 0 0 15 0 0 0Control Delay (s) 568.6 14.0 0.0 0.0 0.0 0.0 13.9 0.0 0.0 0.0Lane LOS F B BApproach Delay (s) 233.2 0.0 1.1Approach LOS F
Intersection SummaryAverage Delay 21.8Intersection Capacity Utilization 43.7% ICU Level of Service AAnalysis Period (min) 15
Appendix C - Capacity Worksheets - Page 45
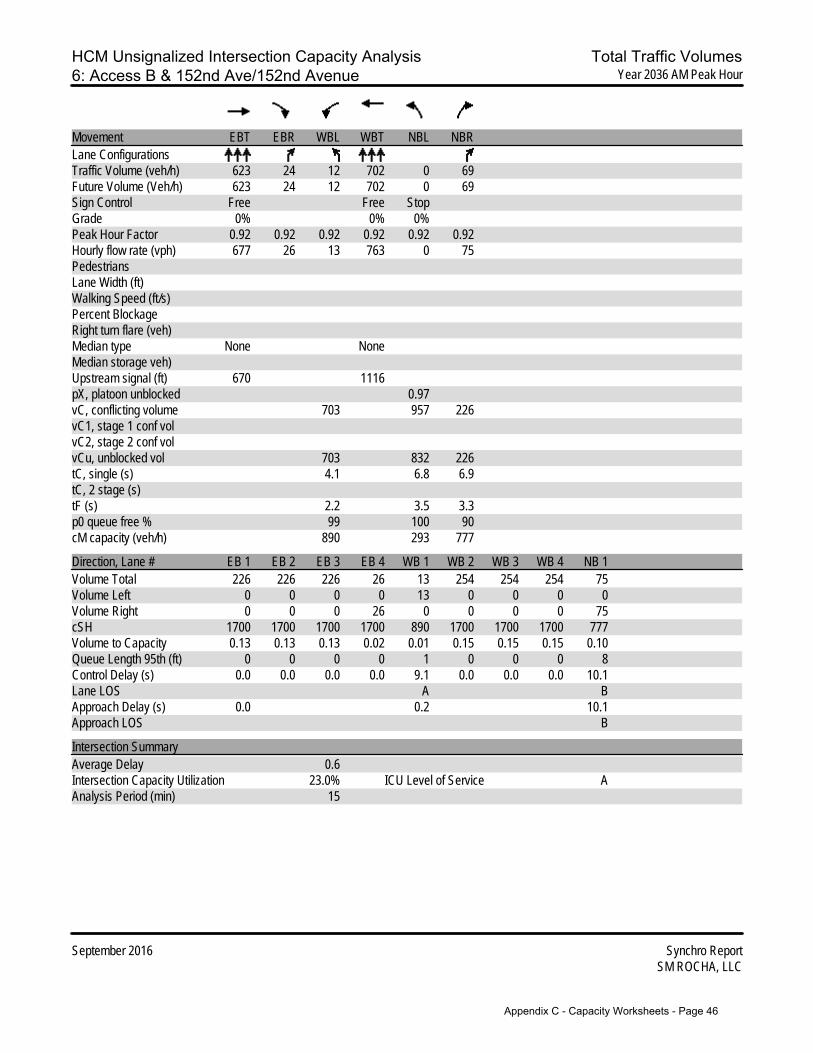
HCM Unsignalized Intersection Capacity Analysis Total Traffic Volumes6: Access B & 152nd Ave/152nd Avenue Year 2036 AM Peak Hour
September 2016 Synchro ReportSM ROCHA, LLC
Movement EBT EBR WBL WBT NBL NBRLane ConfigurationsTraffic Volume (veh/h) 623 24 12 702 0 69Future Volume (Veh/h) 623 24 12 702 0 69Sign Control Free Free StopGrade 0% 0% 0%Peak Hour Factor 0.92 0.92 0.92 0.92 0.92 0.92Hourly flow rate (vph) 677 26 13 763 0 75PedestriansLane Width (ft)Walking Speed (ft/s)Percent BlockageRight turn flare (veh)Median type None NoneMedian storage veh)Upstream signal (ft) 670 1116pX, platoon unblocked 0.97vC, conflicting volume 703 957 226vC1, stage 1 conf volvC2, stage 2 conf volvCu, unblocked vol 703 832 226tC, single (s) 4.1 6.8 6.9tC, 2 stage (s)tF (s) 2.2 3.5 3.3p0 queue free % 99 100 90cM capacity (veh/h) 890 293 777
Direction, Lane # EB 1 EB 2 EB 3 EB 4 WB 1 WB 2 WB 3 WB 4 NB 1Volume Total 226 226 226 26 13 254 254 254 75Volume Left 0 0 0 0 13 0 0 0 0Volume Right 0 0 0 26 0 0 0 0 75cSH 1700 1700 1700 1700 890 1700 1700 1700 777Volume to Capacity 0.13 0.13 0.13 0.02 0.01 0.15 0.15 0.15 0.10Queue Length 95th (ft) 0 0 0 0 1 0 0 0 8Control Delay (s) 0.0 0.0 0.0 0.0 9.1 0.0 0.0 0.0 10.1Lane LOS A BApproach Delay (s) 0.0 0.2 10.1Approach LOS B
Intersection SummaryAverage Delay 0.6Intersection Capacity Utilization 23.0% ICU Level of Service AAnalysis Period (min) 15
Appendix C - Capacity Worksheets - Page 46

Timings Total Traffic Volumes7: Access C & 152nd Avenue Year 2036 AM Peak Hour
September 2016 Synchro ReportSM ROCHA, LLC
Lane Group EBL EBT EBR WBL WBT WBR NBL NBT NBR SBL SBT SBRLane ConfigurationsTraffic Volume (vph) 94 574 24 18 535 118 90 70 68 77 58 96Future Volume (vph) 94 574 24 18 535 118 90 70 68 77 58 96Satd. Flow (prot) 1770 5085 1583 1770 5085 1583 1770 1725 0 1770 1690 0Flt Permitted 0.393 0.404 0.430 0.544Satd. Flow (perm) 732 5085 1583 753 5085 1583 801 1725 0 1013 1690 0Satd. Flow (RTOR) 95 136 41 67Lane Group Flow (vph) 102 624 26 20 582 128 98 150 0 84 167 0Turn Type pm+pt NA Perm pm+pt NA Perm pm+pt NA pm+pt NAProtected Phases 5 2 1 6 3 8 7 4Permitted Phases 2 2 6 6 8 4Total Split (s) 22.0 49.0 49.0 14.0 41.0 41.0 21.0 40.0 17.0 36.0Total Lost Time (s) 4.5 4.5 4.5 4.5 4.5 4.5 4.5 4.5 4.5 4.5Act Effct Green (s) 52.8 45.1 45.1 49.3 43.3 43.3 18.9 11.3 18.0 10.8Actuated g/C Ratio 0.61 0.52 0.52 0.57 0.50 0.50 0.22 0.13 0.21 0.12v/c Ratio 0.19 0.24 0.03 0.04 0.23 0.15 0.35 0.58 0.29 0.62Control Delay 8.9 13.1 0.1 8.6 14.3 3.3 27.8 35.7 26.6 33.1Queue Delay 0.0 0.0 0.0 0.0 0.0 0.0 0.0 0.0 0.0 0.0Total Delay 8.9 13.1 0.1 8.6 14.3 3.3 27.8 35.7 26.6 33.1LOS A B A A B A C D C CApproach Delay 12.1 12.2 32.6 30.9Approach LOS B B C CQueue Length 50th (ft) 21 68 0 4 65 0 42 57 35 53Queue Length 95th (ft) 52 112 0 15 112 30 80 121 71 120Internal Link Dist (ft) 1036 1461 523 370Turn Bay Length (ft) 150 150 150 150Base Capacity (vph) 682 2646 869 573 2544 859 412 740 366 665Starvation Cap Reductn 0 0 0 0 0 0 0 0 0 0Spillback Cap Reductn 0 0 0 0 0 0 0 0 0 0Storage Cap Reductn 0 0 0 0 0 0 0 0 0 0Reduced v/c Ratio 0.15 0.24 0.03 0.03 0.23 0.15 0.24 0.20 0.23 0.25
Intersection SummaryCycle Length: 120Actuated Cycle Length: 86.6Control Type: Actuated-UncoordinatedMaximum v/c Ratio: 0.62Intersection Signal Delay: 17.1 Intersection LOS: BIntersection Capacity Utilization 44.5% ICU Level of Service AAnalysis Period (min) 15
Splits and Phases: 7: Access C & 152nd Avenue
Appendix C - Capacity Worksheets - Page 47

Timings Total Traffic Volumes8: Access D & 152nd Avenue Year 2036 AM Peak Hour
September 2016 Synchro ReportSM ROCHA, LLC
Lane Group EBL EBT EBR WBL WBT WBR NBL NBT NBR SBL SBT SBRLane ConfigurationsTraffic Volume (vph) 312 424 2 1 625 312 3 0 1 55 0 55Future Volume (vph) 312 424 2 1 625 312 3 0 1 55 0 55Satd. Flow (prot) 1770 5085 1583 1770 5085 1583 1770 1583 0 1770 1583 0Flt Permitted 0.352 0.477 0.727Satd. Flow (perm) 656 5085 1583 889 5085 1583 1863 1583 0 1354 1583 0Satd. Flow (RTOR) 95 339 484 558Lane Group Flow (vph) 339 461 2 1 679 339 3 1 0 60 60 0Turn Type pm+pt NA Perm pm+pt NA Perm pm+pt NA pm+pt NAProtected Phases 5 2 1 6 3 8 7 4Permitted Phases 2 2 6 6 8 4Total Split (s) 39.0 73.0 73.0 12.0 46.0 46.0 12.0 22.0 13.0 23.0Total Lost Time (s) 4.5 4.5 4.5 4.5 4.5 4.5 4.5 4.5 4.5 4.5Act Effct Green (s) 77.7 68.9 68.9 70.2 64.6 64.6 6.7 5.5 9.1 7.5Actuated g/C Ratio 0.82 0.72 0.72 0.74 0.68 0.68 0.07 0.06 0.10 0.08v/c Ratio 0.52 0.13 0.00 0.00 0.20 0.29 0.02 0.00 0.37 0.09Control Delay 5.6 4.9 0.0 4.0 7.2 1.8 39.7 0.0 46.8 0.3Queue Delay 0.0 0.0 0.0 0.0 0.0 0.0 0.0 0.0 0.0 0.0Total Delay 5.6 4.9 0.0 4.0 7.2 1.8 39.7 0.0 46.8 0.3LOS A A A A A A D A D AApproach Delay 5.1 5.4 29.8 23.5Approach LOS A A C CQueue Length 50th (ft) 34 27 0 0 50 0 2 0 35 0Queue Length 95th (ft) 94 54 0 2 105 39 10 0 74 0Internal Link Dist (ft) 1461 2106 445 418Turn Bay Length (ft) 150 150 150 150 150 150Base Capacity (vph) 950 3681 1172 743 3452 1183 159 687 178 758Starvation Cap Reductn 0 0 0 0 0 0 0 0 0 0Spillback Cap Reductn 0 0 0 0 0 0 0 0 0 0Storage Cap Reductn 0 0 0 0 0 0 0 0 0 0Reduced v/c Ratio 0.36 0.13 0.00 0.00 0.20 0.29 0.02 0.00 0.34 0.08
Intersection SummaryCycle Length: 120Actuated Cycle Length: 95.2Control Type: Actuated-UncoordinatedMaximum v/c Ratio: 0.52Intersection Signal Delay: 6.5 Intersection LOS: AIntersection Capacity Utilization 52.0% ICU Level of Service AAnalysis Period (min) 15
Splits and Phases: 8: Access D & 152nd Avenue
Appendix C - Capacity Worksheets - Page 48

HCM Unsignalized Intersection Capacity Analysis Total Traffic Volumes9: Access E & Washington Street Year 2036 AM Peak Hour
September 2016 Synchro ReportSM ROCHA, LLC
Movement WBL WBR NBT NBR SBL SBTLane ConfigurationsTraffic Volume (veh/h) 77 77 781 94 94 296Future Volume (Veh/h) 77 77 781 94 94 296Sign Control Stop Free FreeGrade 0% 0% 0%Peak Hour Factor 0.92 0.92 0.92 0.92 0.92 0.92Hourly flow rate (vph) 84 84 849 102 102 322PedestriansLane Width (ft)Walking Speed (ft/s)Percent BlockageRight turn flare (veh)Median type None NoneMedian storage veh)Upstream signal (ft) 1054 1103pX, platoon unblocked 0.94 0.94 0.94vC, conflicting volume 1160 283 951vC1, stage 1 conf volvC2, stage 2 conf volvCu, unblocked vol 937 1 714tC, single (s) 6.8 6.9 4.1tC, 2 stage (s)tF (s) 3.5 3.3 2.2p0 queue free % 61 92 88cM capacity (veh/h) 216 1015 827
Direction, Lane # WB 1 WB 2 NB 1 NB 2 NB 3 NB 4 SB 1 SB 2 SB 3 SB 4Volume Total 84 84 283 283 283 102 102 107 107 107Volume Left 84 0 0 0 0 0 102 0 0 0Volume Right 0 84 0 0 0 102 0 0 0 0cSH 216 1015 1700 1700 1700 1700 827 1700 1700 1700Volume to Capacity 0.39 0.08 0.17 0.17 0.17 0.06 0.12 0.06 0.06 0.06Queue Length 95th (ft) 43 7 0 0 0 0 11 0 0 0Control Delay (s) 31.8 8.9 0.0 0.0 0.0 0.0 10.0 0.0 0.0 0.0Lane LOS D A AApproach Delay (s) 20.3 0.0 2.4Approach LOS C
Intersection SummaryAverage Delay 2.9Intersection Capacity Utilization 34.6% ICU Level of Service AAnalysis Period (min) 15
Appendix C - Capacity Worksheets - Page 49

Timings Total Traffic Volumes10: Washington Street & Access F Year 2036 AM Peak Hour
September 2016 Synchro ReportSM ROCHA, LLC
Lane Group WBL WBR NBT NBR SBL SBTLane ConfigurationsTraffic Volume (vph) 66 45 405 376 250 229Future Volume (vph) 66 45 405 376 250 229Satd. Flow (prot) 1770 1583 5085 1583 1770 5085Flt Permitted 0.950 0.464Satd. Flow (perm) 1770 1583 5085 1583 864 5085Satd. Flow (RTOR) 49 409Lane Group Flow (vph) 72 49 440 409 272 249Turn Type Perm Perm NA Perm pm+pt NAProtected Phases 2 1 6Permitted Phases 8 8 2 6Total Split (s) 27.0 27.0 61.0 61.0 32.0 93.0Total Lost Time (s) 4.5 4.5 4.5 4.5 4.5 4.5Act Effct Green (s) 10.2 10.2 89.5 89.5 102.9 103.8Actuated g/C Ratio 0.08 0.08 0.75 0.75 0.86 0.86v/c Ratio 0.48 0.27 0.12 0.32 0.34 0.06Control Delay 62.2 17.4 1.0 1.3 3.1 1.7Queue Delay 0.0 0.0 0.0 0.0 0.0 0.0Total Delay 62.2 17.4 1.0 1.3 3.1 1.7LOS E B A A A AApproach Delay 44.1 1.1 2.4Approach LOS D A AQueue Length 50th (ft) 54 0 5 12 29 8Queue Length 95th (ft) 100 37 9 38 58 16Internal Link Dist (ft) 796 1023 596Turn Bay Length (ft) 150 150 150Base Capacity (vph) 331 336 3791 1284 948 4400Starvation Cap Reductn 0 0 0 0 0 0Spillback Cap Reductn 0 0 0 0 0 0Storage Cap Reductn 0 0 0 0 0 0Reduced v/c Ratio 0.22 0.15 0.12 0.32 0.29 0.06
Intersection SummaryCycle Length: 120Actuated Cycle Length: 120Offset: 32 (27%), Referenced to phase 2:NBT and 6:SBTL, Start of GreenControl Type: Actuated-CoordinatedMaximum v/c Ratio: 0.48Intersection Signal Delay: 5.1 Intersection LOS: AIntersection Capacity Utilization 44.6% ICU Level of Service AAnalysis Period (min) 15
Splits and Phases: 10: Washington Street & Access F
Appendix C - Capacity Worksheets - Page 50
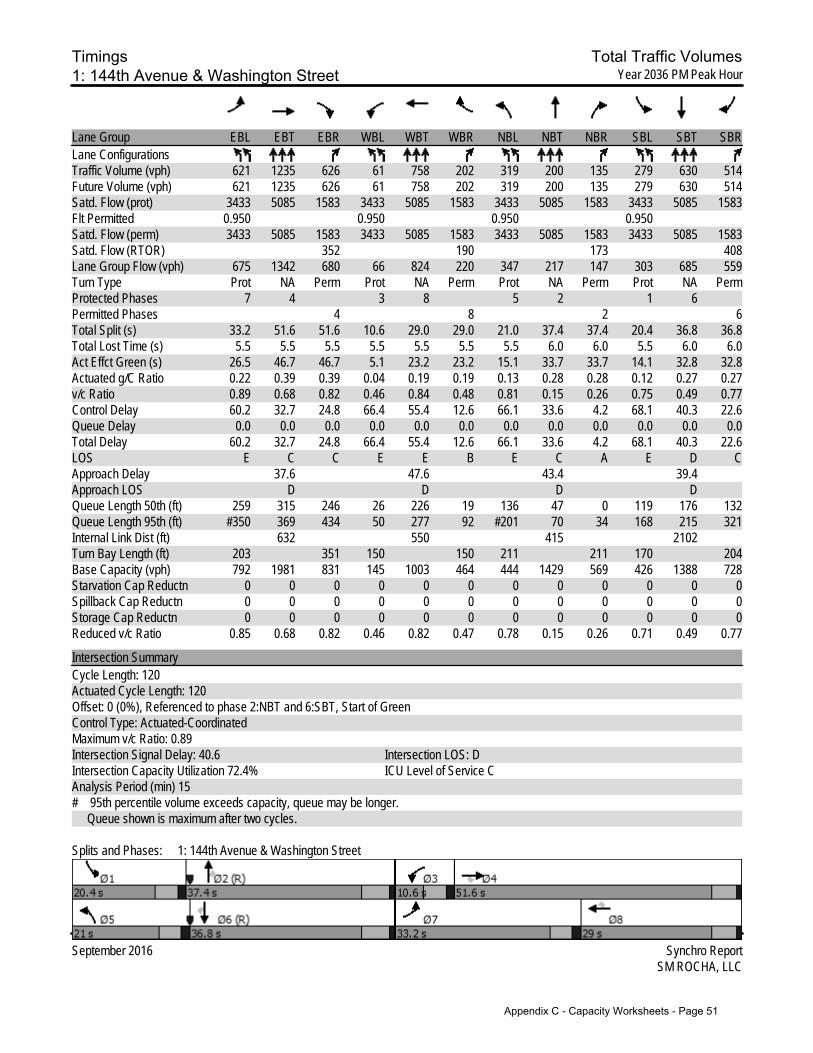
Timings Total Traffic Volumes1: 144th Avenue & Washington Street Year 2036 PM Peak Hour
September 2016 Synchro ReportSM ROCHA, LLC
Lane Group EBL EBT EBR WBL WBT WBR NBL NBT NBR SBL SBT SBRLane ConfigurationsTraffic Volume (vph) 621 1235 626 61 758 202 319 200 135 279 630 514Future Volume (vph) 621 1235 626 61 758 202 319 200 135 279 630 514Satd. Flow (prot) 3433 5085 1583 3433 5085 1583 3433 5085 1583 3433 5085 1583Flt Permitted 0.950 0.950 0.950 0.950Satd. Flow (perm) 3433 5085 1583 3433 5085 1583 3433 5085 1583 3433 5085 1583Satd. Flow (RTOR) 352 190 173 408Lane Group Flow (vph) 675 1342 680 66 824 220 347 217 147 303 685 559Turn Type Prot NA Perm Prot NA Perm Prot NA Perm Prot NA PermProtected Phases 7 4 3 8 5 2 1 6Permitted Phases 4 8 2 6Total Split (s) 33.2 51.6 51.6 10.6 29.0 29.0 21.0 37.4 37.4 20.4 36.8 36.8Total Lost Time (s) 5.5 5.5 5.5 5.5 5.5 5.5 5.5 6.0 6.0 5.5 6.0 6.0Act Effct Green (s) 26.5 46.7 46.7 5.1 23.2 23.2 15.1 33.7 33.7 14.1 32.8 32.8Actuated g/C Ratio 0.22 0.39 0.39 0.04 0.19 0.19 0.13 0.28 0.28 0.12 0.27 0.27v/c Ratio 0.89 0.68 0.82 0.46 0.84 0.48 0.81 0.15 0.26 0.75 0.49 0.77Control Delay 60.2 32.7 24.8 66.4 55.4 12.6 66.1 33.6 4.2 68.1 40.3 22.6Queue Delay 0.0 0.0 0.0 0.0 0.0 0.0 0.0 0.0 0.0 0.0 0.0 0.0Total Delay 60.2 32.7 24.8 66.4 55.4 12.6 66.1 33.6 4.2 68.1 40.3 22.6LOS E C C E E B E C A E D CApproach Delay 37.6 47.6 43.4 39.4Approach LOS D D D DQueue Length 50th (ft) 259 315 246 26 226 19 136 47 0 119 176 132Queue Length 95th (ft) #350 369 434 50 277 92 #201 70 34 168 215 321Internal Link Dist (ft) 632 550 415 2102Turn Bay Length (ft) 203 351 150 150 211 211 170 204Base Capacity (vph) 792 1981 831 145 1003 464 444 1429 569 426 1388 728Starvation Cap Reductn 0 0 0 0 0 0 0 0 0 0 0 0Spillback Cap Reductn 0 0 0 0 0 0 0 0 0 0 0 0Storage Cap Reductn 0 0 0 0 0 0 0 0 0 0 0 0Reduced v/c Ratio 0.85 0.68 0.82 0.46 0.82 0.47 0.78 0.15 0.26 0.71 0.49 0.77
Intersection SummaryCycle Length: 120Actuated Cycle Length: 120Offset: 0 (0%), Referenced to phase 2:NBT and 6:SBT, Start of GreenControl Type: Actuated-CoordinatedMaximum v/c Ratio: 0.89Intersection Signal Delay: 40.6 Intersection LOS: DIntersection Capacity Utilization 72.4% ICU Level of Service CAnalysis Period (min) 15# 95th percentile volume exceeds capacity, queue may be longer. Queue shown is maximum after two cycles.
Splits and Phases: 1: 144th Avenue & Washington Street
Appendix C - Capacity Worksheets - Page 51

Timings Total Traffic Volumes2: Washington Street & 152nd Avenue Year 2036 PM Peak Hour
September 2016 Synchro ReportSM ROCHA, LLC
Lane Group WBL WBR NBT NBR SBL SBTLane ConfigurationsTraffic Volume (vph) 716 123 1394 795 141 1282Future Volume (vph) 716 123 1394 795 141 1282Satd. Flow (prot) 3090 1425 4577 1425 3090 4577Flt Permitted 0.950 0.950Satd. Flow (perm) 3090 1425 4577 1425 3090 4577Satd. Flow (RTOR) 134 514Lane Group Flow (vph) 778 134 1515 864 153 1393Turn Type Perm Perm NA Free Prot NAProtected Phases 2 1 6Permitted Phases 8 8 FreeTotal Split (s) 47.0 47.0 57.0 16.0 73.0Total Lost Time (s) 4.5 4.5 4.5 4.5 4.5Act Effct Green (s) 36.1 36.1 59.7 120.0 10.6 74.9Actuated g/C Ratio 0.30 0.30 0.50 1.00 0.09 0.62v/c Ratio 0.84 0.26 0.67 0.61 0.56 0.49Control Delay 47.6 5.8 20.9 3.3 60.3 16.2Queue Delay 0.0 0.0 0.0 0.0 0.0 0.0Total Delay 47.6 5.8 20.9 3.3 60.3 16.2LOS D A C A E BApproach Delay 41.5 14.5 20.6Approach LOS D B CQueue Length 50th (ft) 289 0 316 41 60 160Queue Length 95th (ft) 338 42 440 m78 96 348Internal Link Dist (ft) 590 827 974Turn Bay Length (ft) 200Base Capacity (vph) 1094 591 2278 1425 302 2855Starvation Cap Reductn 0 0 0 0 0 0Spillback Cap Reductn 0 0 0 0 0 0Storage Cap Reductn 0 0 0 0 0 0Reduced v/c Ratio 0.71 0.23 0.67 0.61 0.51 0.49
Intersection SummaryCycle Length: 120Actuated Cycle Length: 120Offset: 0 (0%), Referenced to phase 2:NBT and 6:SBT, Start of GreenControl Type: Actuated-CoordinatedMaximum v/c Ratio: 0.84Intersection Signal Delay: 21.5 Intersection LOS: CIntersection Capacity Utilization 68.3% ICU Level of Service CAnalysis Period (min) 15m Volume for 95th percentile queue is metered by upstream signal.
Splits and Phases: 2: Washington Street & 152nd Avenue
Appendix C - Capacity Worksheets - Page 52

Timings Total Traffic Volumes3: York Street & 152nd Avenue Year 2036 PM Peak Hour
September 2016 Synchro ReportSM ROCHA, LLC
Lane Group EBT EBR WBL WBT NBL NBRLane ConfigurationsTraffic Volume (vph) 805 237 653 569 175 317Future Volume (vph) 805 237 653 569 175 317Satd. Flow (prot) 5085 1583 3433 5085 3433 1583Flt Permitted 0.950 0.950Satd. Flow (perm) 5085 1583 3433 5085 3433 1583Satd. Flow (RTOR) 258 345Lane Group Flow (vph) 875 258 710 618 190 345Turn Type NA Perm Prot NA Perm PermProtected Phases 2 1 6Permitted Phases 2 8 8Total Split (s) 40.0 40.0 45.0 85.0 35.0 35.0Total Lost Time (s) 4.5 4.5 4.5 4.5 4.5 4.5Act Effct Green (s) 50.4 50.4 25.7 80.6 11.5 11.5Actuated g/C Ratio 0.50 0.50 0.25 0.80 0.11 0.11v/c Ratio 0.35 0.28 0.81 0.15 0.49 0.71Control Delay 17.0 3.3 43.5 2.7 46.2 13.4Queue Delay 0.0 0.0 0.0 0.0 0.0 0.0Total Delay 17.0 3.3 43.5 2.7 46.2 13.4LOS B A D A D BApproach Delay 13.9 24.5 25.0Approach LOS B C CQueue Length 50th (ft) 117 0 221 24 60 0Queue Length 95th (ft) 190 48 284 46 94 83Internal Link Dist (ft) 2106 2537 1753Turn Bay Length (ft) 200 200Base Capacity (vph) 2535 918 1377 4054 1036 718Starvation Cap Reductn 0 0 0 0 0 0Spillback Cap Reductn 0 0 0 0 0 0Storage Cap Reductn 0 0 0 0 0 0Reduced v/c Ratio 0.35 0.28 0.52 0.15 0.18 0.48
Intersection SummaryCycle Length: 120Actuated Cycle Length: 101.1Control Type: Actuated-UncoordinatedMaximum v/c Ratio: 0.81Intersection Signal Delay: 20.6 Intersection LOS: CIntersection Capacity Utilization 50.4% ICU Level of Service AAnalysis Period (min) 15
Splits and Phases: 3: York Street & 152nd Avenue
Appendix C - Capacity Worksheets - Page 53

HCM Unsignalized Intersection Capacity Analysis Total Traffic Volumes4: Washington Street & 148th Avenue Year 2036 PM Peak Hour
September 2016 Synchro ReportSM ROCHA, LLC
Movement WBL WBR NBT NBR SBL SBTLane ConfigurationsTraffic Volume (veh/h) 37 27 1989 92 14 1978Future Volume (Veh/h) 37 27 1989 92 14 1978Sign Control Stop Free FreeGrade 0% 0% 0%Peak Hour Factor 0.92 0.92 0.92 0.92 0.92 0.92Hourly flow rate (vph) 40 29 2162 100 15 2150PedestriansLane Width (ft)Walking Speed (ft/s)Percent BlockageRight turn flare (veh)Median type None NoneMedian storage veh)Upstream signal (ft)pX, platoon unblockedvC, conflicting volume 2909 721 2262vC1, stage 1 conf volvC2, stage 2 conf volvCu, unblocked vol 2909 721 2262tC, single (s) 6.8 6.9 4.1tC, 2 stage (s)tF (s) 3.5 3.3 2.2p0 queue free % 0 92 93cM capacity (veh/h) 11 370 223
Direction, Lane # WB 1 WB 2 NB 1 NB 2 NB 3 NB 4 SB 1 SB 2 SB 3 SB 4Volume Total 40 29 721 721 721 100 15 717 717 717Volume Left 40 0 0 0 0 0 15 0 0 0Volume Right 0 29 0 0 0 100 0 0 0 0cSH 11 370 1700 1700 1700 1700 223 1700 1700 1700Volume to Capacity 3.49 0.08 0.42 0.42 0.42 0.06 0.07 0.42 0.42 0.42Queue Length 95th (ft) Err 6 0 0 0 0 5 0 0 0Control Delay (s) Err 15.6 0.0 0.0 0.0 0.0 22.3 0.0 0.0 0.0Lane LOS F C CApproach Delay (s) 5803.1 0.0 0.2Approach LOS F
Intersection SummaryAverage Delay 89.1Intersection Capacity Utilization 48.4% ICU Level of Service AAnalysis Period (min) 15
Appendix C - Capacity Worksheets - Page 54

HCM Unsignalized Intersection Capacity Analysis Total Traffic Volumes5: Access A & Washington Street Year 2036 PM Peak Hour
September 2016 Synchro ReportSM ROCHA, LLC
Movement WBL WBR NBT NBR SBL SBTLane ConfigurationsTraffic Volume (veh/h) 51 78 2016 69 60 1904Future Volume (Veh/h) 51 78 2016 69 60 1904Sign Control Stop Free FreeGrade 0% 0% 0%Peak Hour Factor 0.92 0.92 0.92 0.92 0.92 0.92Hourly flow rate (vph) 55 85 2191 75 65 2070PedestriansLane Width (ft)Walking Speed (ft/s)Percent BlockageRight turn flare (veh)Median type None NoneMedian storage veh)Upstream signal (ft) 907pX, platoon unblocked 0.85vC, conflicting volume 3011 730 2266vC1, stage 1 conf volvC2, stage 2 conf volvCu, unblocked vol 2752 730 2266tC, single (s) 6.8 6.9 4.1tC, 2 stage (s)tF (s) 3.5 3.3 2.2p0 queue free % 0 77 71cM capacity (veh/h) 10 365 222
Direction, Lane # WB 1 WB 2 NB 1 NB 2 NB 3 NB 4 SB 1 SB 2 SB 3 SB 4Volume Total 55 85 730 730 730 75 65 690 690 690Volume Left 55 0 0 0 0 0 65 0 0 0Volume Right 0 85 0 0 0 75 0 0 0 0cSH 10 365 1700 1700 1700 1700 222 1700 1700 1700Volume to Capacity 5.76 0.23 0.43 0.43 0.43 0.04 0.29 0.41 0.41 0.41Queue Length 95th (ft) Err 22 0 0 0 0 29 0 0 0Control Delay (s) Err 17.9 0.0 0.0 0.0 0.0 27.8 0.0 0.0 0.0Lane LOS F C DApproach Delay (s) 3939.0 0.0 0.8Approach LOS F
Intersection SummaryAverage Delay 121.8Intersection Capacity Utilization 55.6% ICU Level of Service BAnalysis Period (min) 15
Appendix C - Capacity Worksheets - Page 55
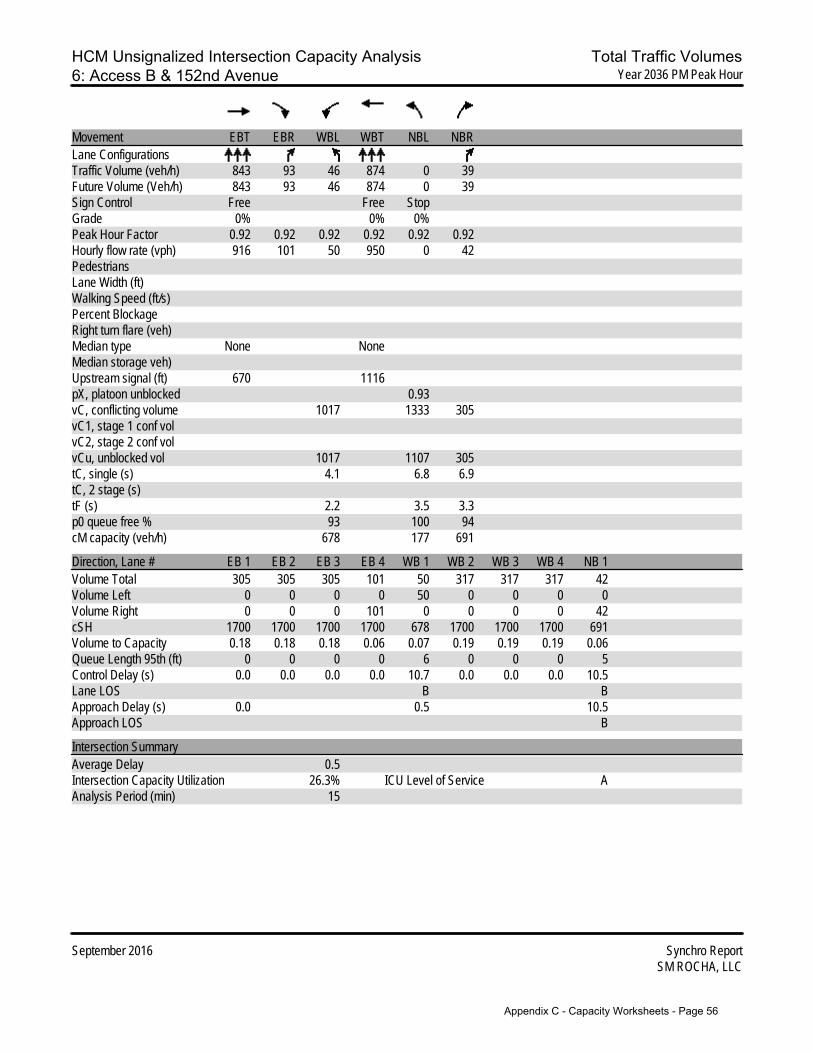
HCM Unsignalized Intersection Capacity Analysis Total Traffic Volumes6: Access B & 152nd Avenue Year 2036 PM Peak Hour
September 2016 Synchro ReportSM ROCHA, LLC
Movement EBT EBR WBL WBT NBL NBRLane ConfigurationsTraffic Volume (veh/h) 843 93 46 874 0 39Future Volume (Veh/h) 843 93 46 874 0 39Sign Control Free Free StopGrade 0% 0% 0%Peak Hour Factor 0.92 0.92 0.92 0.92 0.92 0.92Hourly flow rate (vph) 916 101 50 950 0 42PedestriansLane Width (ft)Walking Speed (ft/s)Percent BlockageRight turn flare (veh)Median type None NoneMedian storage veh)Upstream signal (ft) 670 1116pX, platoon unblocked 0.93vC, conflicting volume 1017 1333 305vC1, stage 1 conf volvC2, stage 2 conf volvCu, unblocked vol 1017 1107 305tC, single (s) 4.1 6.8 6.9tC, 2 stage (s)tF (s) 2.2 3.5 3.3p0 queue free % 93 100 94cM capacity (veh/h) 678 177 691
Direction, Lane # EB 1 EB 2 EB 3 EB 4 WB 1 WB 2 WB 3 WB 4 NB 1Volume Total 305 305 305 101 50 317 317 317 42Volume Left 0 0 0 0 50 0 0 0 0Volume Right 0 0 0 101 0 0 0 0 42cSH 1700 1700 1700 1700 678 1700 1700 1700 691Volume to Capacity 0.18 0.18 0.18 0.06 0.07 0.19 0.19 0.19 0.06Queue Length 95th (ft) 0 0 0 0 6 0 0 0 5Control Delay (s) 0.0 0.0 0.0 0.0 10.7 0.0 0.0 0.0 10.5Lane LOS B BApproach Delay (s) 0.0 0.5 10.5Approach LOS B
Intersection SummaryAverage Delay 0.5Intersection Capacity Utilization 26.3% ICU Level of Service AAnalysis Period (min) 15
Appendix C - Capacity Worksheets - Page 56
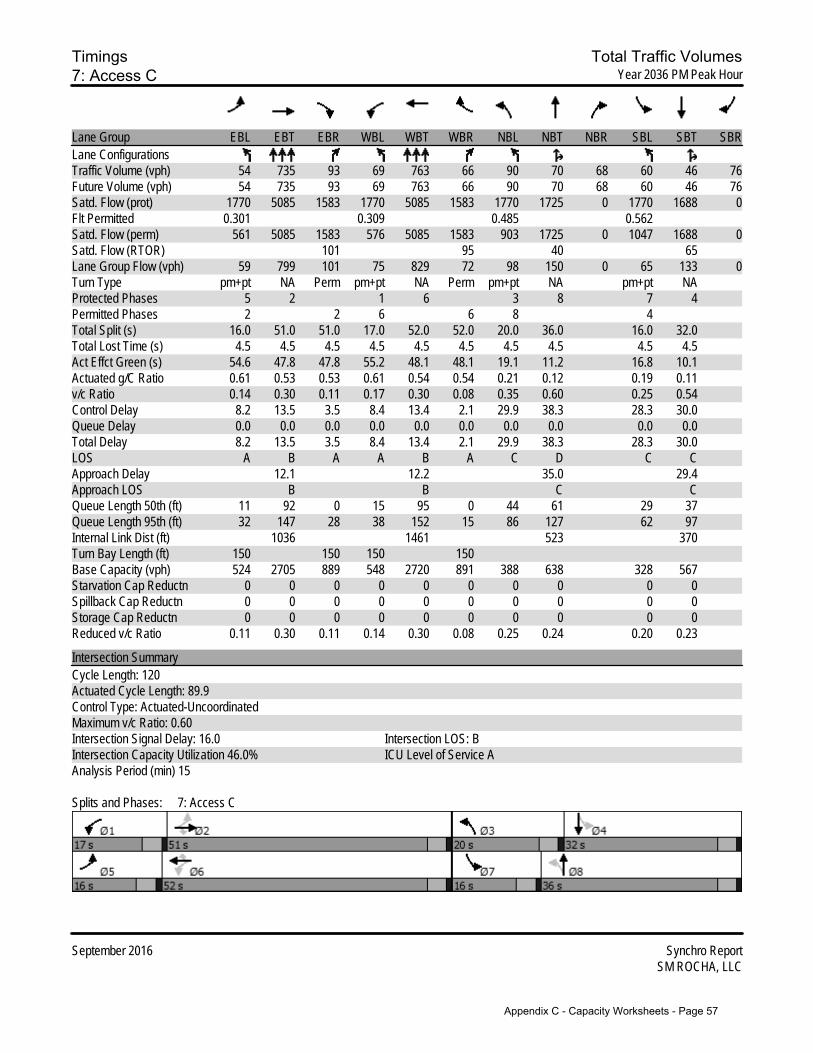
Timings Total Traffic Volumes7: Access C Year 2036 PM Peak Hour
September 2016 Synchro ReportSM ROCHA, LLC
Lane Group EBL EBT EBR WBL WBT WBR NBL NBT NBR SBL SBT SBRLane ConfigurationsTraffic Volume (vph) 54 735 93 69 763 66 90 70 68 60 46 76Future Volume (vph) 54 735 93 69 763 66 90 70 68 60 46 76Satd. Flow (prot) 1770 5085 1583 1770 5085 1583 1770 1725 0 1770 1688 0Flt Permitted 0.301 0.309 0.485 0.562Satd. Flow (perm) 561 5085 1583 576 5085 1583 903 1725 0 1047 1688 0Satd. Flow (RTOR) 101 95 40 65Lane Group Flow (vph) 59 799 101 75 829 72 98 150 0 65 133 0Turn Type pm+pt NA Perm pm+pt NA Perm pm+pt NA pm+pt NAProtected Phases 5 2 1 6 3 8 7 4Permitted Phases 2 2 6 6 8 4Total Split (s) 16.0 51.0 51.0 17.0 52.0 52.0 20.0 36.0 16.0 32.0Total Lost Time (s) 4.5 4.5 4.5 4.5 4.5 4.5 4.5 4.5 4.5 4.5Act Effct Green (s) 54.6 47.8 47.8 55.2 48.1 48.1 19.1 11.2 16.8 10.1Actuated g/C Ratio 0.61 0.53 0.53 0.61 0.54 0.54 0.21 0.12 0.19 0.11v/c Ratio 0.14 0.30 0.11 0.17 0.30 0.08 0.35 0.60 0.25 0.54Control Delay 8.2 13.5 3.5 8.4 13.4 2.1 29.9 38.3 28.3 30.0Queue Delay 0.0 0.0 0.0 0.0 0.0 0.0 0.0 0.0 0.0 0.0Total Delay 8.2 13.5 3.5 8.4 13.4 2.1 29.9 38.3 28.3 30.0LOS A B A A B A C D C CApproach Delay 12.1 12.2 35.0 29.4Approach LOS B B C CQueue Length 50th (ft) 11 92 0 15 95 0 44 61 29 37Queue Length 95th (ft) 32 147 28 38 152 15 86 127 62 97Internal Link Dist (ft) 1036 1461 523 370Turn Bay Length (ft) 150 150 150 150Base Capacity (vph) 524 2705 889 548 2720 891 388 638 328 567Starvation Cap Reductn 0 0 0 0 0 0 0 0 0 0Spillback Cap Reductn 0 0 0 0 0 0 0 0 0 0Storage Cap Reductn 0 0 0 0 0 0 0 0 0 0Reduced v/c Ratio 0.11 0.30 0.11 0.14 0.30 0.08 0.25 0.24 0.20 0.23
Intersection SummaryCycle Length: 120Actuated Cycle Length: 89.9Control Type: Actuated-UncoordinatedMaximum v/c Ratio: 0.60Intersection Signal Delay: 16.0 Intersection LOS: BIntersection Capacity Utilization 46.0% ICU Level of Service AAnalysis Period (min) 15
Splits and Phases: 7: Access C
Appendix C - Capacity Worksheets - Page 57
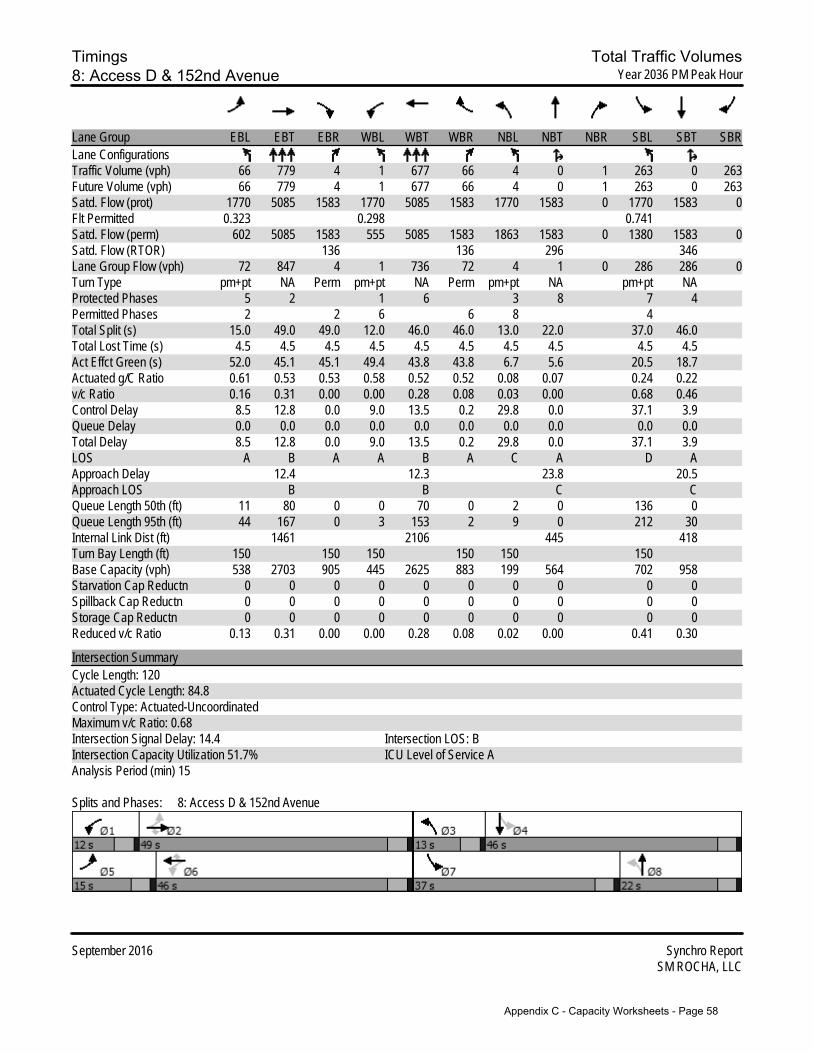
Timings Total Traffic Volumes8: Access D & 152nd Avenue Year 2036 PM Peak Hour
September 2016 Synchro ReportSM ROCHA, LLC
Lane Group EBL EBT EBR WBL WBT WBR NBL NBT NBR SBL SBT SBRLane ConfigurationsTraffic Volume (vph) 66 779 4 1 677 66 4 0 1 263 0 263Future Volume (vph) 66 779 4 1 677 66 4 0 1 263 0 263Satd. Flow (prot) 1770 5085 1583 1770 5085 1583 1770 1583 0 1770 1583 0Flt Permitted 0.323 0.298 0.741Satd. Flow (perm) 602 5085 1583 555 5085 1583 1863 1583 0 1380 1583 0Satd. Flow (RTOR) 136 136 296 346Lane Group Flow (vph) 72 847 4 1 736 72 4 1 0 286 286 0Turn Type pm+pt NA Perm pm+pt NA Perm pm+pt NA pm+pt NAProtected Phases 5 2 1 6 3 8 7 4Permitted Phases 2 2 6 6 8 4Total Split (s) 15.0 49.0 49.0 12.0 46.0 46.0 13.0 22.0 37.0 46.0Total Lost Time (s) 4.5 4.5 4.5 4.5 4.5 4.5 4.5 4.5 4.5 4.5Act Effct Green (s) 52.0 45.1 45.1 49.4 43.8 43.8 6.7 5.6 20.5 18.7Actuated g/C Ratio 0.61 0.53 0.53 0.58 0.52 0.52 0.08 0.07 0.24 0.22v/c Ratio 0.16 0.31 0.00 0.00 0.28 0.08 0.03 0.00 0.68 0.46Control Delay 8.5 12.8 0.0 9.0 13.5 0.2 29.8 0.0 37.1 3.9Queue Delay 0.0 0.0 0.0 0.0 0.0 0.0 0.0 0.0 0.0 0.0Total Delay 8.5 12.8 0.0 9.0 13.5 0.2 29.8 0.0 37.1 3.9LOS A B A A B A C A D AApproach Delay 12.4 12.3 23.8 20.5Approach LOS B B C CQueue Length 50th (ft) 11 80 0 0 70 0 2 0 136 0Queue Length 95th (ft) 44 167 0 3 153 2 9 0 212 30Internal Link Dist (ft) 1461 2106 445 418Turn Bay Length (ft) 150 150 150 150 150 150Base Capacity (vph) 538 2703 905 445 2625 883 199 564 702 958Starvation Cap Reductn 0 0 0 0 0 0 0 0 0 0Spillback Cap Reductn 0 0 0 0 0 0 0 0 0 0Storage Cap Reductn 0 0 0 0 0 0 0 0 0 0Reduced v/c Ratio 0.13 0.31 0.00 0.00 0.28 0.08 0.02 0.00 0.41 0.30
Intersection SummaryCycle Length: 120Actuated Cycle Length: 84.8Control Type: Actuated-UncoordinatedMaximum v/c Ratio: 0.68Intersection Signal Delay: 14.4 Intersection LOS: BIntersection Capacity Utilization 51.7% ICU Level of Service AAnalysis Period (min) 15
Splits and Phases: 8: Access D & 152nd Avenue
Appendix C - Capacity Worksheets - Page 58

HCM Unsignalized Intersection Capacity Analysis Total Traffic Volumes9: Access E & Washington Street Year 2036 PM Peak Hour
September 2016 Synchro ReportSM ROCHA, LLC
Movement WBL WBR NBT NBR SBL SBTLane ConfigurationsTraffic Volume (veh/h) 60 60 1466 54 54 1268Future Volume (Veh/h) 60 60 1466 54 54 1268Sign Control Stop Free FreeGrade 0% 0% 0%Peak Hour Factor 0.92 0.92 0.92 0.92 0.92 0.92Hourly flow rate (vph) 65 65 1593 59 59 1378PedestriansLane Width (ft)Walking Speed (ft/s)Percent BlockageRight turn flare (veh)Median type None NoneMedian storage veh)Upstream signal (ft) 1054 1103pX, platoon unblocked 0.80 0.77 0.77vC, conflicting volume 2170 531 1652vC1, stage 1 conf volvC2, stage 2 conf volvCu, unblocked vol 1028 0 789tC, single (s) 6.8 6.9 4.1tC, 2 stage (s)tF (s) 3.5 3.3 2.2p0 queue free % 61 92 91cM capacity (veh/h) 167 832 634
Direction, Lane # WB 1 WB 2 NB 1 NB 2 NB 3 NB 4 SB 1 SB 2 SB 3 SB 4Volume Total 65 65 531 531 531 59 59 459 459 459Volume Left 65 0 0 0 0 0 59 0 0 0Volume Right 0 65 0 0 0 59 0 0 0 0cSH 167 832 1700 1700 1700 1700 634 1700 1700 1700Volume to Capacity 0.39 0.08 0.31 0.31 0.31 0.03 0.09 0.27 0.27 0.27Queue Length 95th (ft) 42 6 0 0 0 0 8 0 0 0Control Delay (s) 39.7 9.7 0.0 0.0 0.0 0.0 11.3 0.0 0.0 0.0Lane LOS E A BApproach Delay (s) 24.7 0.0 0.5Approach LOS C
Intersection SummaryAverage Delay 1.2Intersection Capacity Utilization 45.0% ICU Level of Service AAnalysis Period (min) 15
Appendix C - Capacity Worksheets - Page 59

Timings Total Traffic Volumes10: Washington Street & Access F Year 2036 PM Peak Hour
September 2016 Synchro ReportSM ROCHA, LLC
Lane Group WBL WBR NBT NBR SBL SBTLane ConfigurationsTraffic Volume (vph) 315 210 1384 79 52 953Future Volume (vph) 315 210 1384 79 52 953Satd. Flow (prot) 1770 1583 5085 1583 1770 5085Flt Permitted 0.950 0.115Satd. Flow (perm) 1770 1583 5085 1583 214 5085Satd. Flow (RTOR) 140 62Lane Group Flow (vph) 342 228 1504 86 57 1036Turn Type Perm Perm NA Perm pm+pt NAProtected Phases 2 1 6Permitted Phases 8 8 2 6Total Split (s) 47.0 47.0 61.0 61.0 12.0 73.0Total Lost Time (s) 4.5 4.5 4.5 4.5 4.5 4.5Act Effct Green (s) 28.9 28.9 70.7 70.7 82.1 82.1Actuated g/C Ratio 0.24 0.24 0.59 0.59 0.68 0.68v/c Ratio 0.80 0.47 0.50 0.09 0.24 0.30Control Delay 56.8 17.1 2.0 0.2 10.2 8.5Queue Delay 0.0 0.0 0.0 0.0 0.0 0.0Total Delay 56.8 17.1 2.0 0.2 10.2 8.5LOS E B A A B AApproach Delay 40.9 1.9 8.5Approach LOS D A AQueue Length 50th (ft) 251 55 20 0 13 105Queue Length 95th (ft) 326 118 27 m0 35 163Internal Link Dist (ft) 796 1023 596Turn Bay Length (ft) 150 150 150Base Capacity (vph) 626 651 2996 958 246 3478Starvation Cap Reductn 0 0 0 0 0 0Spillback Cap Reductn 0 0 0 0 0 0Storage Cap Reductn 0 0 0 0 0 0Reduced v/c Ratio 0.55 0.35 0.50 0.09 0.23 0.30
Intersection SummaryCycle Length: 120Actuated Cycle Length: 120Offset: 32 (27%), Referenced to phase 2:NBT and 6:SBTL, Start of GreenControl Type: Actuated-CoordinatedMaximum v/c Ratio: 0.80Intersection Signal Delay: 11.0 Intersection LOS: BIntersection Capacity Utilization 59.6% ICU Level of Service BAnalysis Period (min) 15m Volume for 95th percentile queue is metered by upstream signal.
Splits and Phases: 10: Washington Street & Access F
Appendix C - Capacity Worksheets - Page 60