Embed Size (px)
Citation preview
MODELING/TRAFFIC IMPACT ANALYSIS of
UNIVERSITY OF FLORIDA CAMPUS MASTER PLAN
Technical Memorandum
Prepared for
The University of Florida
Prepared by
THE CORRADINO GROUP
5200 NW 33rd Ave Suite 203
Fort Lauderdale, FL 33309
2 The Corradino Group 5200 NW 33 AVE, Suite 203, Fort Lauderdale, FL 33309
1.0 Introduction This technical memorandum provides summary of the travel demand modeling/forecasting results and traffic impact analyses conducted as part of the University of Florida (UF) 2030 Campus Master Plan update. The Gainesville Metropolitan Planning Organization (MTPO) is updating Gainesville Urbanized Area Transportation Study Model (GUATS) to 2015 base year, as part of the 2045 Long Range Transportation Plan (LRTP) update. The Campus Master Plan Modeling scenarios development uses 2015 base year validation and 2045 Existing-plus-committed scenarios approved by the MTPO and the Project Working Group (WG).
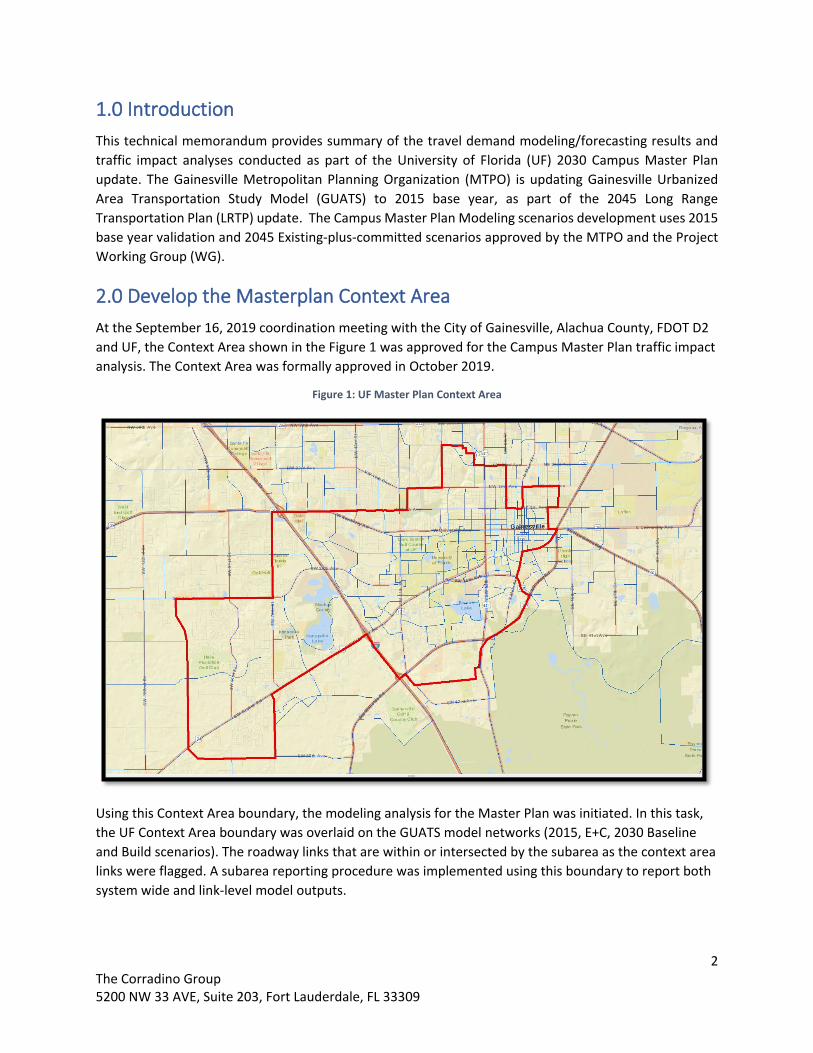
2.0 Develop the Masterplan Context Area At the September 16, 2019 coordination meeting with the City of Gainesville, Alachua County, FDOT D2 and UF, the Context Area shown in the Figure 1 was approved for the Campus Master Plan traffic impact analysis. The Context Area was formally approved in October 2019.
Figure 1: UF Master Plan Context Area
Using this Context Area boundary, the modeling analysis for the Master Plan was initiated. In this task, the UF Context Area boundary was overlaid on the GUATS model networks (2015, E+C, 2030 Baseline and Build scenarios). The roadway links that are within or intersected by the subarea as the context area links were flagged. A subarea reporting procedure was implemented using this boundary to report both system wide and link-level model outputs.
3 The Corradino Group 5200 NW 33 AVE, Suite 203, Fort Lauderdale, FL 33309
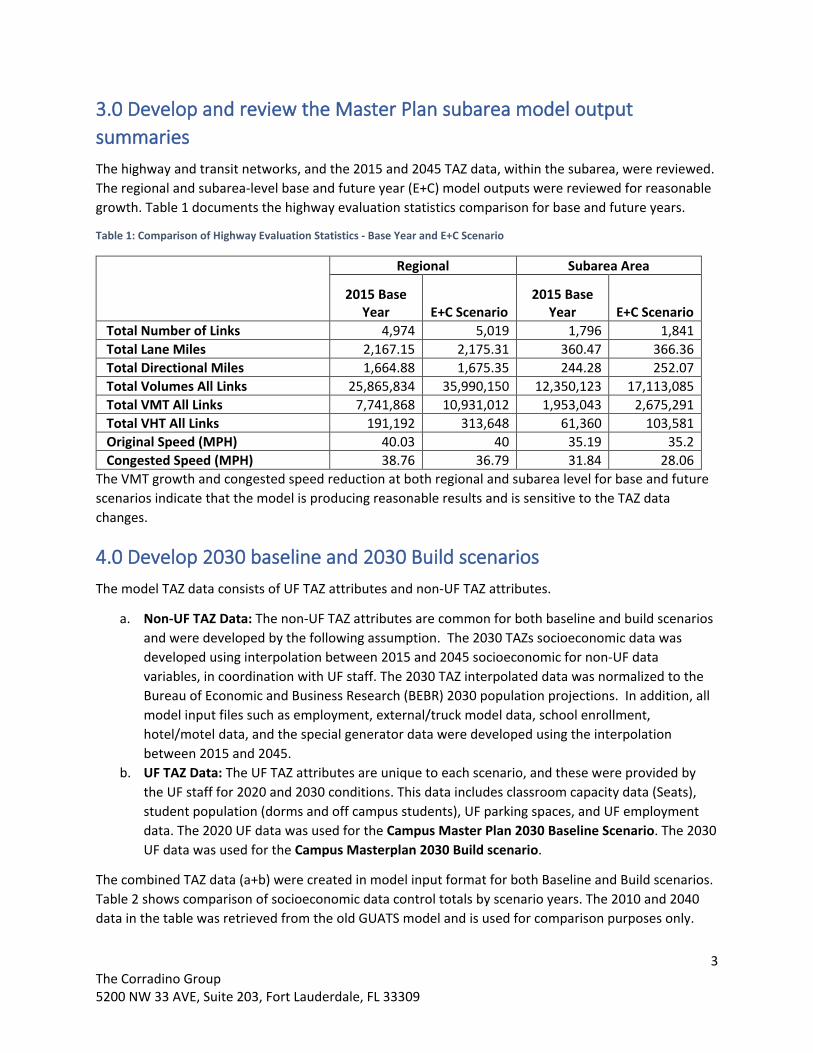
3.0 Develop and review the Master Plan subarea model output summaries The highway and transit networks, and the 2015 and 2045 TAZ data, within the subarea, were reviewed. The regional and subarea-level base and future year (E+C) model outputs were reviewed for reasonable growth. Table 1 documents the highway evaluation statistics comparison for base and future years.
Table 1: Comparison of Highway Evaluation Statistics - Base Year and E+C Scenario
Regional Subarea Area
2015 Base Year E+C Scenario
2015 Base Year E+C Scenario
Total Number of Links 4,974 5,019 1,796 1,841 Total Lane Miles 2,167.15 2,175.31 360.47 366.36 Total Directional Miles 1,664.88 1,675.35 244.28 252.07 Total Volumes All Links 25,865,834 35,990,150 12,350,123 17,113,085 Total VMT All Links 7,741,868 10,931,012 1,953,043 2,675,291 Total VHT All Links 191,192 313,648 61,360 103,581 Original Speed (MPH) 40.03 40 35.19 35.2 Congested Speed (MPH) 38.76 36.79 31.84 28.06
The VMT growth and congested speed reduction at both regional and subarea level for base and future scenarios indicate that the model is producing reasonable results and is sensitive to the TAZ data changes.
4.0 Develop 2030 baseline and 2030 Build scenarios The model TAZ data consists of UF TAZ attributes and non-UF TAZ attributes.
a. Non-UF TAZ Data: The non-UF TAZ attributes are common for both baseline and build scenarios and were developed by the following assumption. The 2030 TAZs socioeconomic data was developed using interpolation between 2015 and 2045 socioeconomic for non-UF data variables, in coordination with UF staff. The 2030 TAZ interpolated data was normalized to the Bureau of Economic and Business Research (BEBR) 2030 population projections. In addition, all model input files such as employment, external/truck model data, school enrollment, hotel/motel data, and the special generator data were developed using the interpolation between 2015 and 2045.
b. UF TAZ Data: The UF TAZ attributes are unique to each scenario, and these were provided by the UF staff for 2020 and 2030 conditions. This data includes classroom capacity data (Seats), student population (dorms and off campus students), UF parking spaces, and UF employment data. The 2020 UF data was used for the Campus Master Plan 2030 Baseline Scenario. The 2030 UF data was used for the Campus Masterplan 2030 Build scenario.
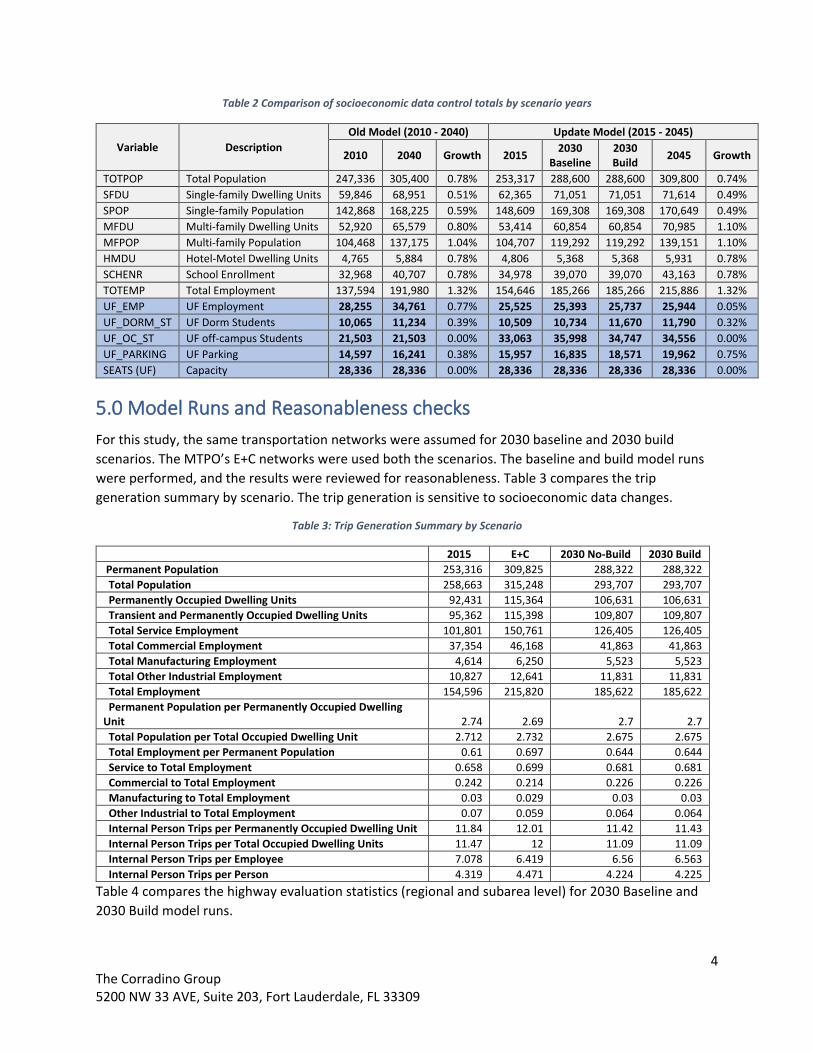
The combined TAZ data (a+b) were created in model input format for both Baseline and Build scenarios. Table 2 shows comparison of socioeconomic data control totals by scenario years. The 2010 and 2040 data in the table was retrieved from the old GUATS model and is used for comparison purposes only.
4 The Corradino Group 5200 NW 33 AVE, Suite 203, Fort Lauderdale, FL 33309
Table 2 Comparison of socioeconomic data control totals by scenario years
Variable Description Old Model (2010 - 2040) Update Model (2015 - 2045)
2010 2040 Growth 2015 2030 Baseline
2030 Build 2045 Growth
TOTPOP Total Population 247,336 305,400 0.78% 253,317 288,600 288,600 309,800 0.74% SFDU Single-family Dwelling Units 59,846 68,951 0.51% 62,365 71,051 71,051 71,614 0.49% SPOP Single-family Population 142,868 168,225 0.59% 148,609 169,308 169,308 170,649 0.49% MFDU Multi-family Dwelling Units 52,920 65,579 0.80% 53,414 60,854 60,854 70,985 1.10% MFPOP Multi-family Population 104,468 137,175 1.04% 104,707 119,292 119,292 139,151 1.10% HMDU Hotel-Motel Dwelling Units 4,765 5,884 0.78% 4,806 5,368 5,368 5,931 0.78% SCHENR School Enrollment 32,968 40,707 0.78% 34,978 39,070 39,070 43,163 0.78% TOTEMP Total Employment 137,594 191,980 1.32% 154,646 185,266 185,266 215,886 1.32% UF_EMP UF Employment 28,255 34,761 0.77% 25,525 25,393 25,737 25,944 0.05% UF_DORM_ST UF Dorm Students 10,065 11,234 0.39% 10,509 10,734 11,670 11,790 0.32% UF_OC_ST UF off-campus Students 21,503 21,503 0.00% 33,063 35,998 34,747 34,556 0.00% UF_PARKING UF Parking 14,597 16,241 0.38% 15,957 16,835 18,571 19,962 0.75% SEATS (UF) Capacity 28,336 28,336 0.00% 28,336 28,336 28,336 28,336 0.00%
5.0 Model Runs and Reasonableness checks For this study, the same transportation networks were assumed for 2030 baseline and 2030 build scenarios. The MTPO’s E+C networks were used both the scenarios. The baseline and build model runs were performed, and the results were reviewed for reasonableness. Table 3 compares the trip generation summary by scenario. The trip generation is sensitive to socioeconomic data changes.
Table 3: Trip Generation Summary by Scenario
2015 E+C 2030 No-Build 2030 Build Permanent Population 253,316 309,825 288,322 288,322 Total Population 258,663 315,248 293,707 293,707 Permanently Occupied Dwelling Units 92,431 115,364 106,631 106,631 Transient and Permanently Occupied Dwelling Units 95,362 115,398 109,807 109,807 Total Service Employment 101,801 150,761 126,405 126,405 Total Commercial Employment 37,354 46,168 41,863 41,863 Total Manufacturing Employment 4,614 6,250 5,523 5,523 Total Other Industrial Employment 10,827 12,641 11,831 11,831 Total Employment 154,596 215,820 185,622 185,622 Permanent Population per Permanently Occupied Dwelling Unit 2.74 2.69 2.7 2.7 Total Population per Total Occupied Dwelling Unit 2.712 2.732 2.675 2.675 Total Employment per Permanent Population 0.61 0.697 0.644 0.644 Service to Total Employment 0.658 0.699 0.681 0.681 Commercial to Total Employment 0.242 0.214 0.226 0.226 Manufacturing to Total Employment 0.03 0.029 0.03 0.03 Other Industrial to Total Employment 0.07 0.059 0.064 0.064 Internal Person Trips per Permanently Occupied Dwelling Unit 11.84 12.01 11.42 11.43 Internal Person Trips per Total Occupied Dwelling Units 11.47 12 11.09 11.09 Internal Person Trips per Employee 7.078 6.419 6.56 6.563 Internal Person Trips per Person 4.319 4.471 4.224 4.225
Table 4 compares the highway evaluation statistics (regional and subarea level) for 2030 Baseline and 2030 Build model runs.
5 The Corradino Group 5200 NW 33 AVE, Suite 203, Fort Lauderdale, FL 33309
Table 4: Comparison of Highway Evaluation Statistics by Scenario
Regional Subarea Area Growth
UF 2030 Baseline
UF 2030 Build
Scenario UF 2030 Baseline
UF 2030 Build
Scenario Regional Context
Area Total Number of Links 5,019 5,019 1841 1841 0.00% 0.00% Total Lane Miles 2,175.31 2175.31 366.36 366.36 0.00% 0.00% Total Directional Miles 1,675.35 1675.35 252.07 252.07 0.00% 0.00%
Total Volumes All Links 30,596,77
8 30,597,84
7 13,233,97
7 13,236,64
2 0.00% 0.02% Total VMT All Links 9,421,281 9,422,072 2,011,023 2,011,896 0.01% 0.04% Total VHT All Links 236,974 237,038 62,713 62,773 0.03% 0.10% Original Speed (MPH) 40 40 35.2 35.2 0.00% 0.00% Congested Speed (MPH) 38.03 38.03 31.47 31.46 0.00% -0.03%
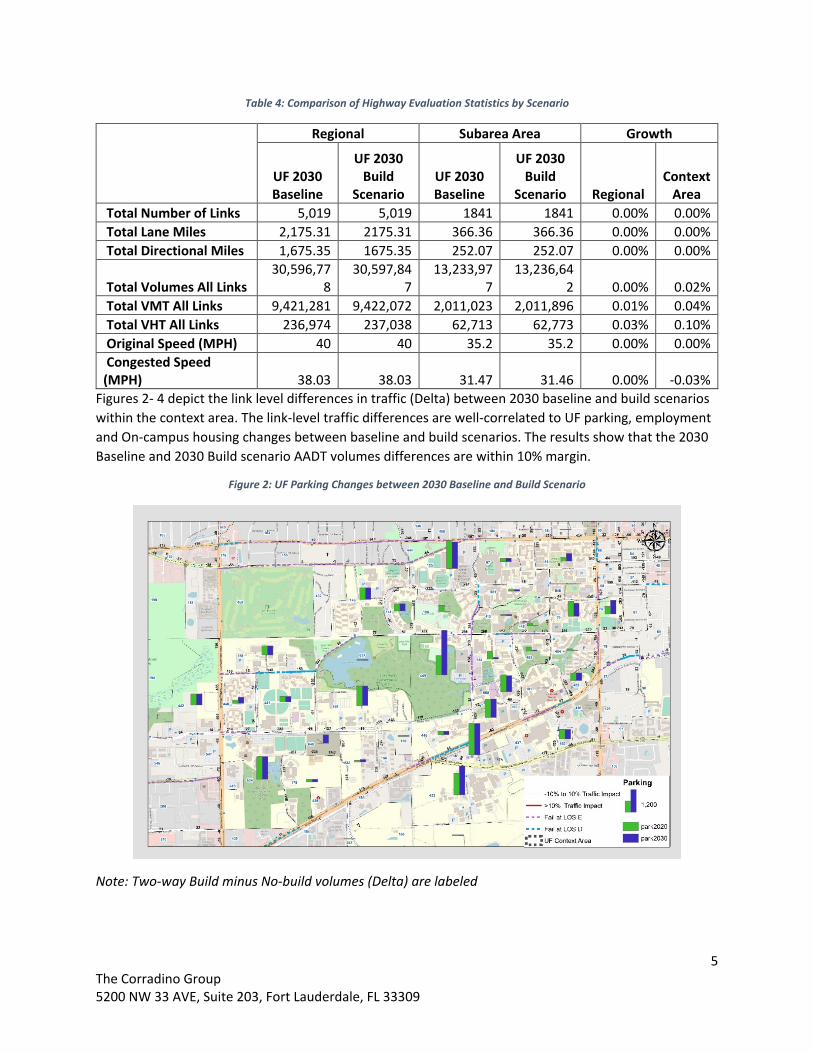
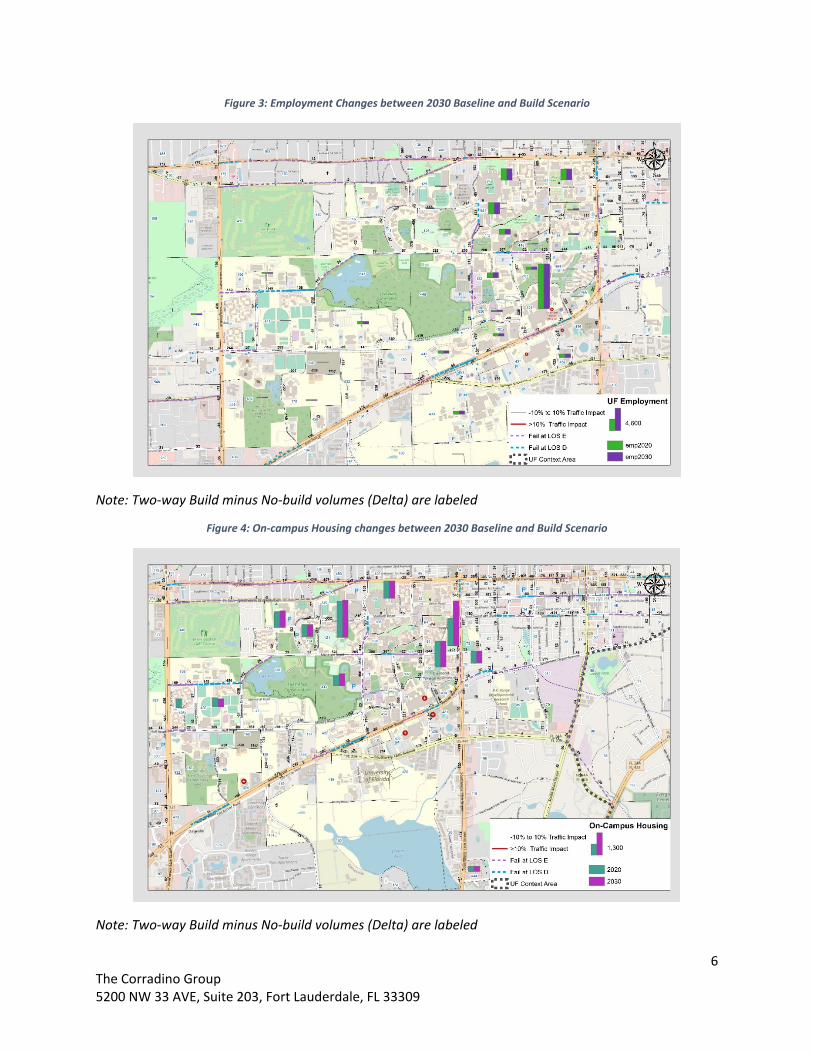
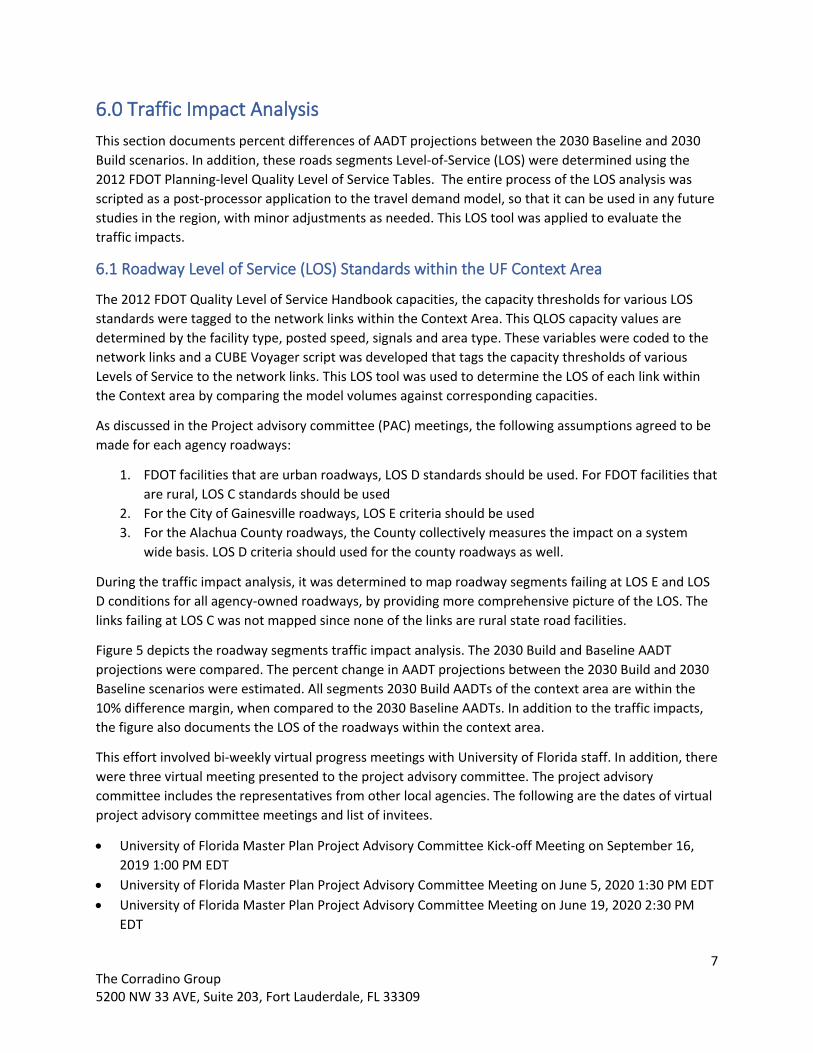
Figures 2- 4 depict the link level differences in traffic (Delta) between 2030 baseline and build scenarios within the context area. The link-level traffic differences are well-correlated to UF parking, employment and On-campus housing changes between baseline and build scenarios. The results show that the 2030 Baseline and 2030 Build scenario AADT volumes differences are within 10% margin.
Figure 2: UF Parking Changes between 2030 Baseline and Build Scenario
Note: Two-way Build minus No-build volumes (Delta) are labeled
6 The Corradino Group 5200 NW 33 AVE, Suite 203, Fort Lauderdale, FL 33309
Figure 3: Employment Changes between 2030 Baseline and Build Scenario
Note: Two-way Build minus No-build volumes (Delta) are labeled
Figure 4: On-campus Housing changes between 2030 Baseline and Build Scenario
Note: Two-way Build minus No-build volumes (Delta) are labeled
7 The Corradino Group 5200 NW 33 AVE, Suite 203, Fort Lauderdale, FL 33309
6.0 Traffic Impact Analysis This section documents percent differences of AADT projections between the 2030 Baseline and 2030 Build scenarios. In addition, these roads segments Level-of-Service (LOS) were determined using the 2012 FDOT Planning-level Quality Level of Service Tables. The entire process of the LOS analysis was scripted as a post-processor application to the travel demand model, so that it can be used in any future studies in the region, with minor adjustments as needed. This LOS tool was applied to evaluate the traffic impacts.
6.1 Roadway Level of Service (LOS) Standards within the UF Context Area
The 2012 FDOT Quality Level of Service Handbook capacities, the capacity thresholds for various LOS standards were tagged to the network links within the Context Area. This QLOS capacity values are determined by the facility type, posted speed, signals and area type. These variables were coded to the network links and a CUBE Voyager script was developed that tags the capacity thresholds of various Levels of Service to the network links. This LOS tool was used to determine the LOS of each link within the Context area by comparing the model volumes against corresponding capacities.
As discussed in the Project advisory committee (PAC) meetings, the following assumptions agreed to be made for each agency roadways:
1. FDOT facilities that are urban roadways, LOS D standards should be used. For FDOT facilities thatare rural, LOS C standards should be used
2. For the City of Gainesville roadways, LOS E criteria should be used3. For the Alachua County roadways, the County collectively measures the impact on a system
wide basis. LOS D criteria should used for the county roadways as well.
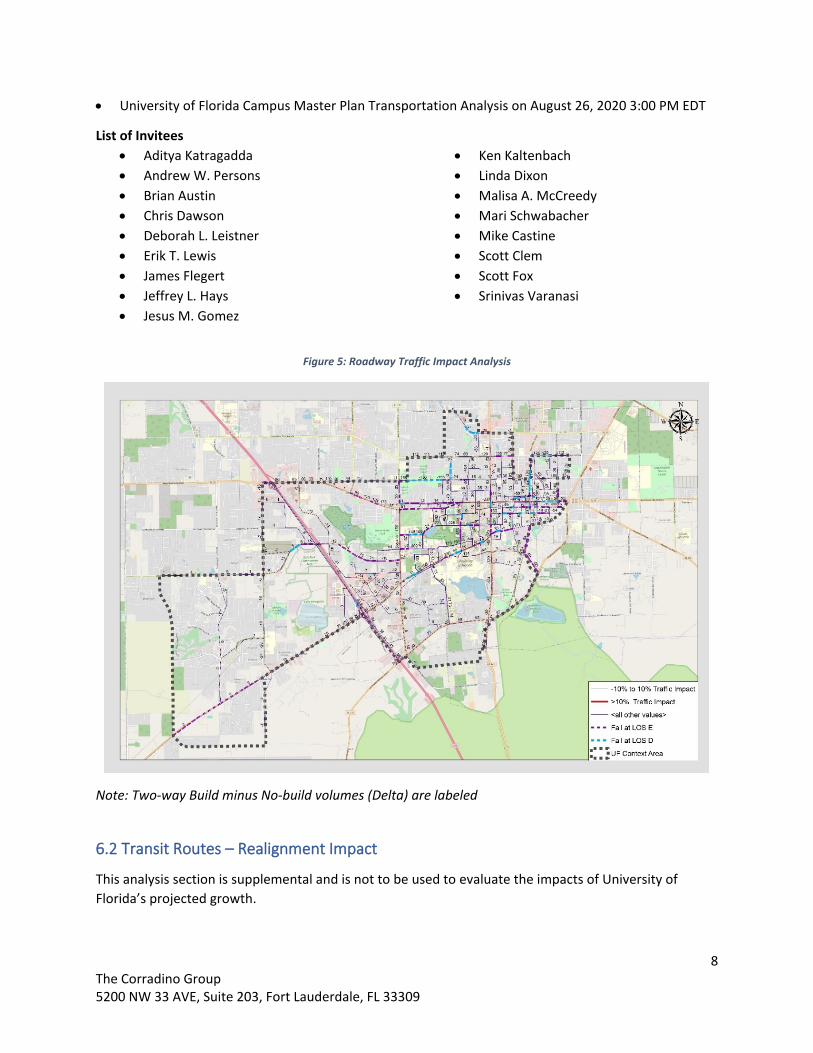
During the traffic impact analysis, it was determined to map roadway segments failing at LOS E and LOS D conditions for all agency-owned roadways, by providing more comprehensive picture of the LOS. The links failing at LOS C was not mapped since none of the links are rural state road facilities.
Figure 5 depicts the roadway segments traffic impact analysis. The 2030 Build and Baseline AADT projections were compared. The percent change in AADT projections between the 2030 Build and 2030 Baseline scenarios were estimated. All segments 2030 Build AADTs of the context area are within the 10% difference margin, when compared to the 2030 Baseline AADTs. In addition to the traffic impacts, the figure also documents the LOS of the roadways within the context area.
This effort involved bi-weekly virtual progress meetings with University of Florida staff. In addition, there were three virtual meeting presented to the project advisory committee. The project advisory committee includes the representatives from other local agencies. The following are the dates of virtual project advisory committee meetings and list of invitees.
• University of Florida Master Plan Project Advisory Committee Kick-off Meeting on September 16, 2019 1:00 PM EDT
• University of Florida Master Plan Project Advisory Committee Meeting on June 5, 2020 1:30 PM EDT• University of Florida Master Plan Project Advisory Committee Meeting on June 19, 2020 2:30 PM
EDT
8 The Corradino Group 5200 NW 33 AVE, Suite 203, Fort Lauderdale, FL 33309
• University of Florida Campus Master Plan Transportation Analysis on August 26, 2020 3:00 PM EDT
List of Invitees • Aditya Katragadda• Andrew W. Persons• Brian Austin• Chris Dawson• Deborah L. Leistner• Erik T. Lewis• James Flegert• Jeffrey L. Hays• Jesus M. Gomez
• Ken Kaltenbach• Linda Dixon• Malisa A. McCreedy• Mari Schwabacher• Mike Castine• Scott Clem• Scott Fox• Srinivas Varanasi
Figure 5: Roadway Traffic Impact Analysis
Note: Two-way Build minus No-build volumes (Delta) are labeled
6.2 Transit Routes – Realignment Impact
This analysis section is supplemental and is not to be used to evaluate the impacts of University of Florida’s projected growth.
9 The Corradino Group 5200 NW 33 AVE, Suite 203, Fort Lauderdale, FL 33309
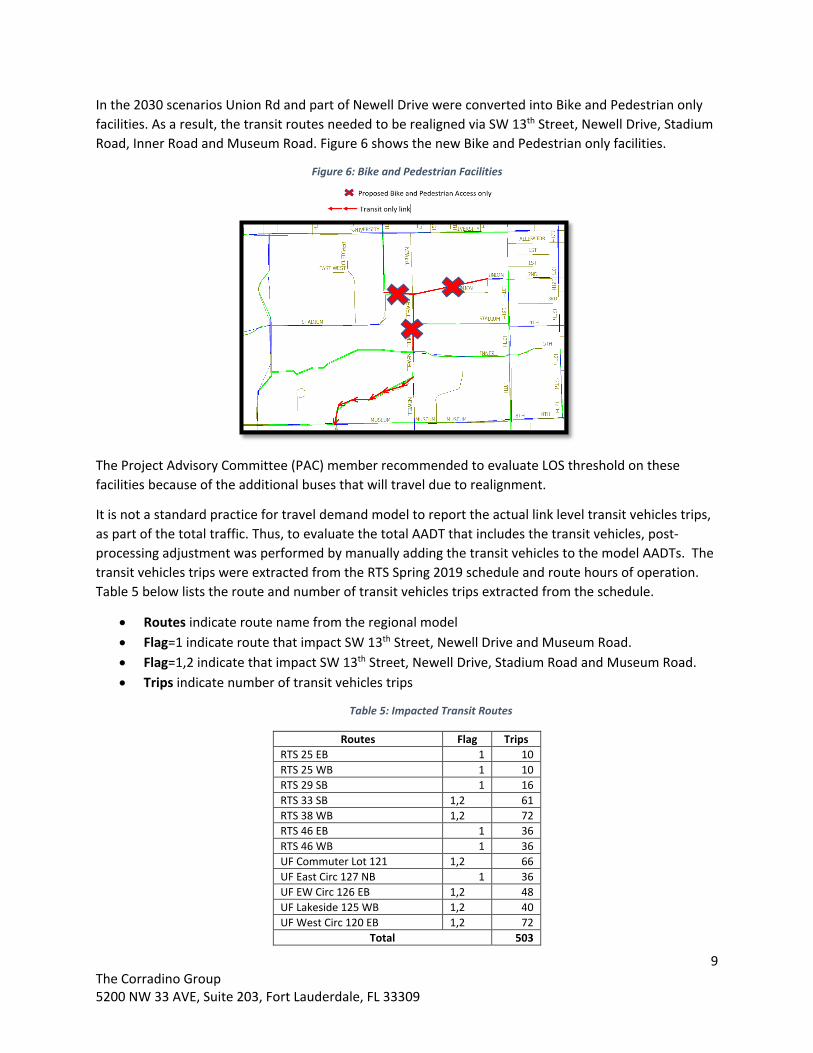
In the 2030 scenarios Union Rd and part of Newell Drive were converted into Bike and Pedestrian only facilities. As a result, the transit routes needed to be realigned via SW 13th Street, Newell Drive, Stadium Road, Inner Road and Museum Road. Figure 6 shows the new Bike and Pedestrian only facilities.
Figure 6: Bike and Pedestrian Facilities
The Project Advisory Committee (PAC) member recommended to evaluate LOS threshold on these facilities because of the additional buses that will travel due to realignment.
It is not a standard practice for travel demand model to report the actual link level transit vehicles trips, as part of the total traffic. Thus, to evaluate the total AADT that includes the transit vehicles, post-processing adjustment was performed by manually adding the transit vehicles to the model AADTs. The transit vehicles trips were extracted from the RTS Spring 2019 schedule and route hours of operation. Table 5 below lists the route and number of transit vehicles trips extracted from the schedule.
• Routes indicate route name from the regional model • Flag=1 indicate route that impact SW 13th Street, Newell Drive and Museum Road. • Flag=1,2 indicate that impact SW 13th Street, Newell Drive, Stadium Road and Museum Road. • Trips indicate number of transit vehicles trips
Table 5: Impacted Transit Routes
Routes Flag Trips RTS 25 EB 1 10 RTS 25 WB 1 10 RTS 29 SB 1 16 RTS 33 SB 1,2 61 RTS 38 WB 1,2 72 RTS 46 EB 1 36 RTS 46 WB 1 36 UF Commuter Lot 121 1,2 66 UF East Circ 127 NB 1 36 UF EW Circ 126 EB 1,2 48 UF Lakeside 125 WB 1,2 40 UF West Circ 120 EB 1,2 72
Total 503
10 The Corradino Group 5200 NW 33 AVE, Suite 203, Fort Lauderdale, FL 33309
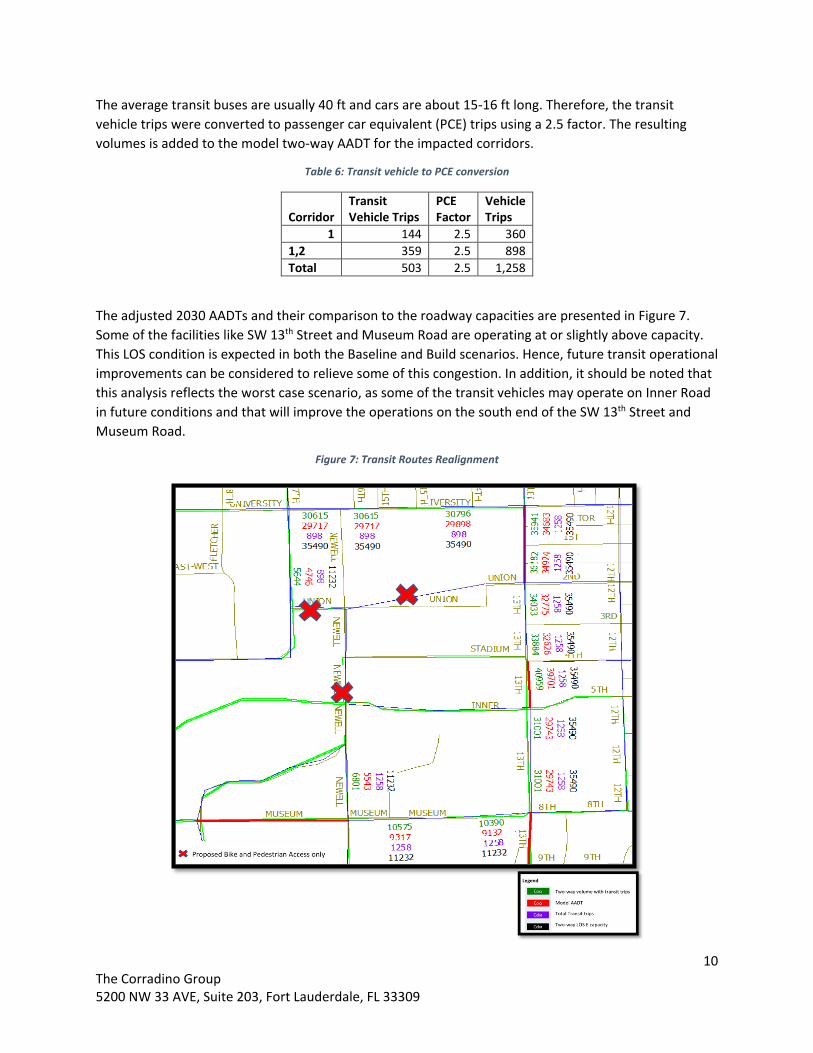
The average transit buses are usually 40 ft and cars are about 15-16 ft long. Therefore, the transit vehicle trips were converted to passenger car equivalent (PCE) trips using a 2.5 factor. The resulting volumes is added to the model two-way AADT for the impacted corridors.
Table 6: Transit vehicle to PCE conversion
Corridor Transit Vehicle Trips
PCE Factor
Vehicle Trips
1 144 2.5 360 1,2 359 2.5 898 Total 503 2.5 1,258
The adjusted 2030 AADTs and their comparison to the roadway capacities are presented in Figure 7. Some of the facilities like SW 13th Street and Museum Road are operating at or slightly above capacity. This LOS condition is expected in both the Baseline and Build scenarios. Hence, future transit operational improvements can be considered to relieve some of this congestion. In addition, it should be noted that this analysis reflects the worst case scenario, as some of the transit vehicles may operate on Inner Road in future conditions and that will improve the operations on the south end of the SW 13th Street and Museum Road.
Figure 7: Transit Routes Realignment
11 The Corradino Group 5200 NW 33 AVE, Suite 203, Fort Lauderdale, FL 33309
7.0 Conclusions and Recommendations: The University of Florida Campus TAZ data between the 2030 Baseline and Build scenarios has relatively less significant growth. This is shown in the socioeconomic data comparison (table 2). Consequently, the 2030 model volume results comparison between the Baseline and Build scenario AADT volumes did not show significant differences. The differences in volumes (delta) between the 2030 Baseline and Build alternatives results are presented in various figures (Figures 2-4), by overlaying the campus socioeconomic data.
The traffic impact analysis was conducted to identify any roadway segments that have more than 10% AADT difference between the 2030 Build and Baseline scenarios. This analysis resulted in a conclusion that all roadway links within the study Context Area are within the 10% AADT difference margin.
Furthermore, the roadway level of service (LOS) analysis was conducted on the 2030 AADT projections. This analysis indicated that there are several roadway segments operating at failing conditions using the LOS D and LOS E conditions. These facilities are graphically depicted in Figure 5. These roadway congestion issues were identified commonly in both the model scenarios.
Per Project Advisory committee recommendations, additional diversion analysis was conducted on Union Road and Newell road roadway pedestrian only conversion. While the automobile traffic diversion is captured by the travel demand model outputs, the transit buses diversion was not resulted from the original model outputs. Additional post-processing adjustment were performed for this effect, and it was determined that a maximum of 1258 passenger car equivalent transit trips will be diverted to major roadways such as SW 13th Street. Nonetheless, this diversion happens regardless of the Campus growth and was considered part of both Baseline and Build scenarios.
Notwithstanding the insignificant traffic impact caused by the campus growth, even in 2030 Baseline conditions, there are several roadway segments that can merit future roadway congestion mitigation measures (identified in Figure 5). The study team recommends additional transit operational improvements along SW 13th Street, University Avenue and Museum Road.