Embed Size (px)
Citation preview

JMB T R A N S p a R T A T i D N E N G I N E E R I N G , I N C T R A F F I C / T R A N S P O R T A T I O N E N G I N E E R I N G & P L A N N I N G S E R V I C E S
T R A F F I C IMPACT STATEMENT
For
Hamilton Place
(Livingston Road, Collier County, Florida)
June 29,2016
County TIS Review Fees TIS Methodology Review Fee = $500.00 TIS (Small-Scale Study) Review Fee = $0.00
Prepared by: JMB T R A N S P D R T A T I O N E N G I N E E R I N G , I N C .
4 7 1 1 V T H A V E N U E S W
N A P L E S , F L O R I D A 3 4 1 1 9
( 2 3 9 ) 9 1 9 - Z V 6 7
C E R T I F I C A T E O F A U T H O R I Z A T I O N N O . 2 7 8 3 0
( P R O J E C T N O . 1 6 0 6 1 1 )
^°^386o \
T A B L E OF CONTENTS
Conclusion 2
Purpose of Report 2
Study Methodology 2
Scope of Project 2
Figure 1 - Project Location & Roadway Classification 2.1
Site Plan 2.2
Project Generated Traffic 3
Table A - Net New Trips Generated 3
Table 1 - Trip Generation Computations 3.1
Existing + Committed Road Network 4
Project Generated Traffic Distribution 4
Figure 2 - Project Traffic Distribution 4.1
Table 2A - Area of Impact/Road Classification 4.2
Area of Significant Impact 5
2015 thru 2020 Project Build-out Traffic Conditions 5
Table 2A - Area of Impact/Road Classification 5.1
Table 2B - 2015 & 2020 Link Volumes 5.1
Table 2C - 2020 Link Volumes/Capacity Analysis 5.2
Appendix 6
1

Conclusions Based upon the findings of this report, it was determined that Hamilton Place RPUD will not have a negative impact upon the surrounding road network. It was verified that all roadways, within the project's area of influence, currently have a surplus of capacity and can accommodate the traffic associated with the proposed 66 multi-family dwelling units. As determined, the road network will continue to operate at acceptable levels of service for the foreseeable future and the project will not create any off-site transportation deficiencies that need to be mitigated.
Purpose of Report This report was prepared pursuant to the criteria set forth by the Traffic Impact Statement Guidelines set forth by the Collier County Government. More specifically, the study examines the potential transportation related impacts that may occur as a result of developing a proposed multi-family development known as Hamilton Place RPUD, which will be located on the east side of Livingston Road and approximately one-mile south of Pine Ridge Road within Collier County, Florida.
Methodology The study's methodology was reviewed by Mr. Michael Sawyer with Collier County's Transportation Planning Division. The accepted methodology is attached (refer to pages M l t h r u M l l ) .
Scope of Project Hamilton Place RPUD is a proposed multi-family development that will consist of 66 dwelling units at project completion. The site is located on the east side of Livingston Road and approximately one-mile south of Pine Ridge Road. Teh project wil l have a right-in/out access on Livingston Road.
2

Pine Ridge Rood
Lonqboot Drive
Clipper Woy Outrigger Lone
I 1
1
Mercanttle Avenue
Progress A|4 lue
I
Bottlebruth Ln
Livingston Woods Ln
— n —
NORTH H.T.S.
Pine Ridge Road
Golden Gate ParVwt
LEGEND 6-LANE ARTERIAL 4-LANE ARTERIAL/COLLECTOR 2-LANE ARTERIAL 2-LANE COLi£CTORAOCAL RAN. RQAO
JMB T R A N B P a R T A T I O N E N G I N E E R I N B , I N C .
Hamilton Place June 24. 2016
2.\
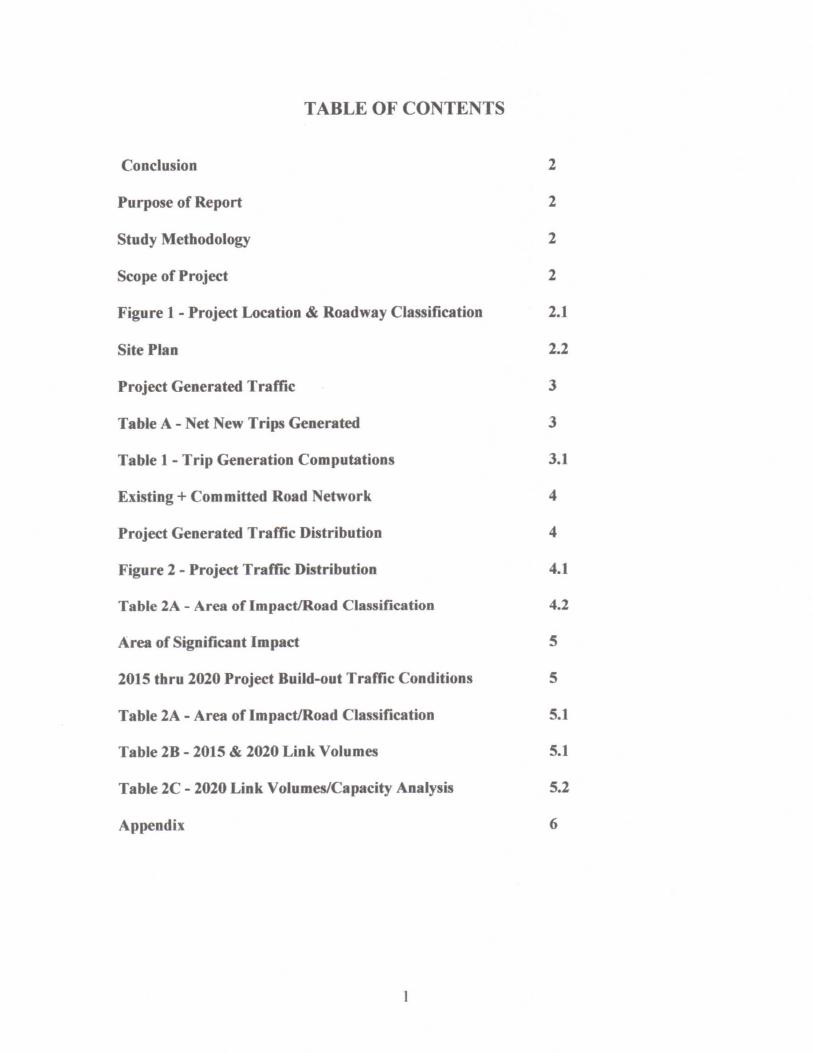
Project Location & Roadway Classification FIGURE 1

NOTES
SCALE; 1" -100*
ZONED: BRYNWOOD PRESERVE PUD USE: RESIDENTIAL
1£WIDE TYPE 'ffLANDSCAPE BUFFER^
WATER MANAGEMENT
y - P R O PERTY BOUNDARY
10* WIDE TYPE 'A' LANDSCAPE BUFFER
4 5 R 0 P E R T Y BOUNDARY
ZONED: ARLINGTON LAKES PUD USE: RESIDENTIAL
SfTEDATA
TOTAL SITE AREA:
MAXIMUM DWELLING UNITS: MAXIMUM DENSITY:
9.75* AC
66 0.67 DU/AC
THIS PLAN IS CONCEPTUAL IN NATURE AND IS SUBJECT TO MINOR MODIFICATION DUE TO AGENCY PERMITTING REQUIREMENTS-
PRESERVE: REQUIRED - 0.48± ACRES {3.2t ACRES NATIVE
VEGETATION X 15%) PROVIDED-0.4at ACRES
1̂ 1̂ •MB >I
1̂ •MB >I
1̂ •MB >I
1̂ •MB >I
1̂
^
GradyMinor HAMILTON PLACE RPUD
EXHIBIT C MASTER PLAN

Project Generated Traffic Traffic that can be expected to be generated by the project was estimated based upon the guidelines established by the Institute of Transportation Engineers, Trip Generation Manual, 9**" Edition. That is, historical traffic data collected at similar land uses was relied upon in estimating the project's traffic. It was concluded that Land Use Code "Residential Condominium/Townhomes" (LUC 230) was most appropriate in estimating the project traffic.
Table 1 provides a detail of the estimated total trips. Table A provides a summary of the results.
TABLE A NET NEW TRIPS GENERATED
Daily AM Peak Hour PM Peak Hour (ADT) (vph) (vph)
Multi-Family 448 37 43 (66 Dwelling Units)
The report concludes that the project will generate less than 50 net new trip ends during the weekday highest peak hour. As such, the report investigates the traffic impacts associated with the project based upon the criteria set forth by the Collier County Government's Traffic Impact Statement Guidelines for developments generating "less than 50 trips", which is defined as a small-scale study.
3

TABLE 1 TRIP GENERATION COMPUTATIONS
Hamilton Place
Land Use Code 230
Land Use Description Residential Condo/Townhouse
Build Schedule 66 Units
Land Use Code Trip Period
LUC 230 Daily Traffic (ADT) =
Trip Generation Equation (Based upon S.F.) Ln(T)=0.87Ln(X)+2.46 =
Total Trips Trips Enter/Exit 448 ADT
AM Peak Hour (vph) =
PM Peak Hour (vph) =
Ln(T) = 0.80Ln(X)+0.26 = 17% Enter/83% Exit = Ln(T) = 0.82Ln(X)+O.32 = 67% Enter/ 33% Exit =
37 vph 6 / 31 vph
43 vph 29 / 14 vph
3 . 1

Existing + Committed Road Network Table 2A and Figure 1 describe the E + C road network. As shown, there are no significant 5-year committed roadway improvements within the project's area of impact.
The principal arterial that will provide immediate access to the site is Livingston Road.
Livingston Road is classified as a six-lane divided arterial. The road functions as a primary north/south corridor that extends from its southern terminus at its intersection with Radio Road to the Collier/Lee County boundary where it continues north/south and is known as Imperial Parkway. Within proximity of the site, the posted speed limit of Livingston Road is 45 MPH.
Table 2A provides a detail of the surrounding E + C road network and their respective minimum level of service performance standards and capacity.
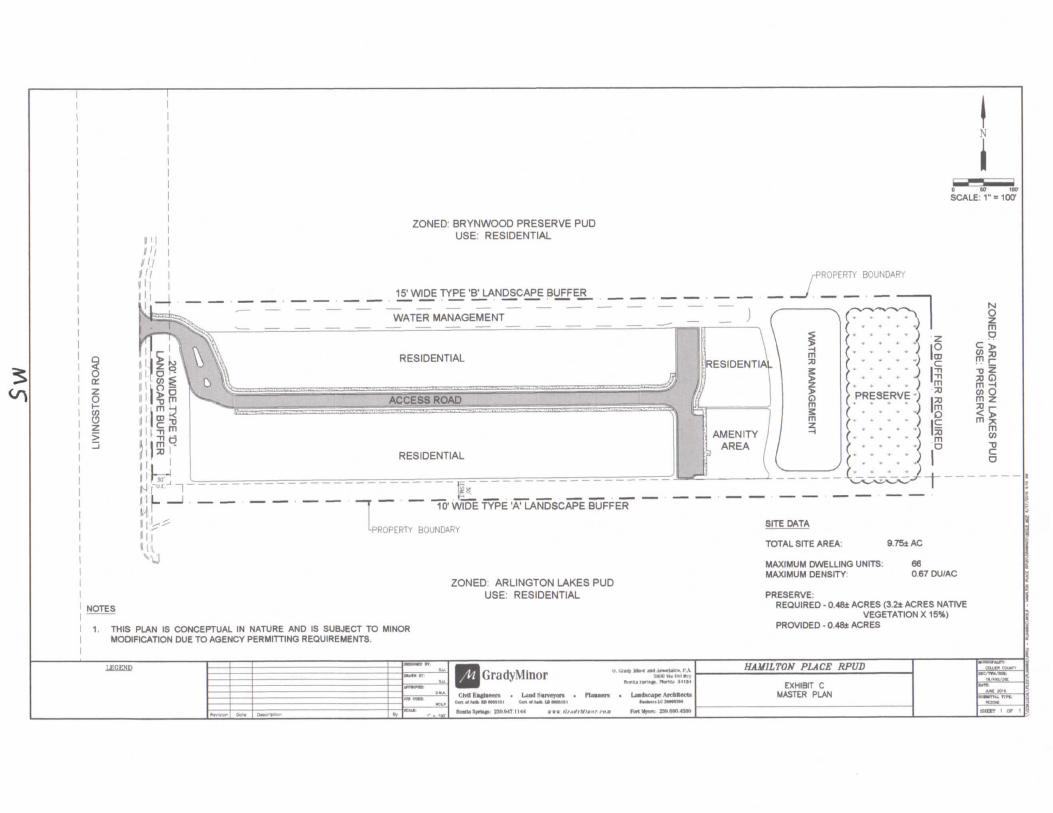
Project Generated Traffic Distribution The project's net new traffic was distributed to the surrounding road network based upon logical means of ingress/egress, current and future traffic patterns in the area and business opportunities, as well as growth trends for the surrounding areas. Figure 2 provides a detail of the traffic distributions based on a percentage basis and Table 2A depicts the expected net new A M and PM traffic distributions for peak hour peak direction and non-peak direction.
4

Prnc Ridge Rood
h -
I
20%
Bottlebrush U\
Livingston Woods Ln
NORTH M.T.S.
Pine Ridge Rood
Golden Gate Porkwc
LEGEND
PROJECT TRAFnC DISTRIBUTION BY PERCENT
JMB T R A N S P O R T A T t a N E N B I N E E R I N Q , I N C .
Hamilton Place June 24, 2016
41
PROJECT-GENERATED TRAFFIC DISTRIBUTION FIGURE 2

Project Traffic Peak Direction (vphpd) * Project Traffic Non-Peak Direction (vph)
29 Entering 14 Exiting
Road gass
Lhringston Road 53.0 Vanderbitt to Pine Ridge Rd 6 D 54.0 Pine Ridge Rd to Site 6D 54.0 Site to Pine Ridge Rd 6D 55.0 Golden Gate Pkwy to Radio Rd 6D
Pine Ridge Road 67.1 Airport Rd to Livingston 6D 67.2 Livingston to 1-75 6D
: ^
TABLE 2A PROJECT'S AREA OF IMPACT
L O S Service Project PK Dir. PK Direction Project Pk Hr Project
Serv. Vol. Volunne Traffic PK Dir Pk Hr L O S (vphpd) %Pi8t. (vphpd) Pk Dir
E 3100 15% A N E 3100 60% 17 N E 3100 40% 12 N E 3100 5% 1 N
E 3000 30% 9 E E 3000 15% 4 E
Project Pk Hr Project
Non-PK Dir Non-Pk Impact Percent Significant
(vphi DIE Standard Impact Impact 2 s 2% 0.14% NO 8 s 2% 0.56% NO 6 s 2% 0.37% NO 1 s 2% 0.05% NO
4 E 2% 0.29% NO 2 E 2% 0.15% NO

Area of Significant Impact The area of significant impact was determined based upon Collier County's 2%, 2% and 3% criteria (i.e., i f the project's traffic is 2% or more of a roadway's adopted level of service capacity, then the project has a significant impact upon that link). Table 2A describes the project traffic distributions and the level of impact on the surrounding roadways. As shown, Livingston Road was considered the only road that will be impacted by the project.
2015 thru 2020 Project Build-out Traffic Conditions In order to establish 2015 thru 2020 project build-out traffic conditions, two forecasting methods were used.
The first traffic forecasting method was the County's traffic count data was adjusted for peak season conditions, peak hour conditions, peak direction, and an annual growth rate was then applied. The peak season/peak hour/peak direction factor and annual growth rate were derived from the 2015 Collier County AUIR Report. Using the annual growth rate, the 2020 background traffic conditions were determined, which are depicted in Table 2B.
The second traffic forecasting method was to add the vested trips (trip bank) identified in the 2015 AUIR report to the adjusted peak season, peak hour and peak direction traffic counts. The 2020 vested trips background traffic volumes are depicted in Table 2B.
The greater of the two values produced by the two forecasting procedures was then considered to reflect the 2020 background traffic. The net new project generated traffic was then added to the background traffic. Table 2C provides a summary of the 2015 thru 2020 traffic conditions and the roadways' level of service and remaining available capacity. As shovm, all project impacted roadways will continue to operate at the County's adopted minimum level of service thresholds at project build-out.
5

TABLE 2A PROJECT'S AREA OF IMPACT
Project Traffic Peak Direction (vphpd) • 29 Entering Project Traffic Non-Peal( Direction (vph) = 14 Exiting
L O S Service Project Project PK Dir. PK Direction Project Pk Hr Project Pk Hr Project
Road Sorv. Vol. Volume Traffic PK Dir Pk Hr Non-PK Dir Non-Pk Impact Percent Signlflcar C lass L Q S (vphpd) % pist. (vphpd) PkDi r DIR Standard Impact Impact
Livingston Road 53.0 \/andert)irt to Pine Ridge Rd 6D E 3100 15% 4 N 2 S 2% 0.14% NO 54.0 Pine Ridge Rd to Site 6D E 3100 60% 17 N 8 s 2% 0.56% NO 54.0 Site to Pine Ridge Rd 6D E 3100 40% 12 N 6 S 2% 0.37% NO 55.0 Golden Gate PImy to Radio Rd 6D E 3100 5% 1 N 1 S 2% 0.05% NO
Pine RkJge Road 67.1 Airport Rd to Livingston 6D E 3000 30% 9 E 4 E 2% 0.29% NO 67.2 Livingston to 1-75 6D E 3000 15% 4 E 2 E 2% 0.15% NO

TABLE 2B 2015 & 2020 ROADWAY LINK VOLUMES
Livingston Road 54.0 Pine Ridge Rd to Site 54.0 Site to Pine Ridge Rd
Per Vsted Trips Mstho Per Orowtfi «afe Mettwd 2020
2020 Peak Hour 2016 Growth Peak Hour PK Directk>n AUIR AUIR Rate PK DirectkMi Trip Backgrour>d
Traffic Pk per Background Bank Per Vested Trips fvDhpd) m <VDhpd> (Vphpd) fvohodt
1440 N 0.92% 1607 36 1476 1440 N 0.92% 1607 36 1476

TABLE 2C 2020 ROADWAY LINK VOLUME/CAPACITY ANALYSIS
Livingston Road 54.0 Pine Ridge Rd to Site 54.0 Site to Pine Ridge Rd
2020 2020 2020 2020 2020
2015 Peak Hour 2020 Peak Hour Project Project BuiM-Out Serv. Vol. Buiki-Out BuiM-Out Peak Hour PK Direction Bkgd PK Direction PkHr Pijct Pk Hr Prjct Peak Hour Pk Hr Peak Hour Peak Hour
PK Direction Background Pk Background PK Dir Pk Non-PK Dir Non-Pk PK Dir PK Dir PK OirectkMi PK Directkm
lYPhpdl LOS fvphpdl file k S S (vphpd) DLr fvph) Qk (vphpdl y/cpatk? L0§ 1440 B 1507 N B 17 S 8 S 1516 3100 0.49 B 1440 B 1507 N B 12 N 6 S 1519 3100 0.49 B


JMB T R A N S pa RTATIDN E N G I N E E R I N G , I N C . T R A F F I C / T R A N S P a R T A T I O N E N G I N E E R I N G & P L A N N I N G S E R V I C E S
T R A F F I C IMPACT STATEMENT M E T H O D O L O G Y R E P O R T
For
Hamilton Place
(Livingston Road, Collier County, Florida)
June 27,2016
County TIS Review Fees TIS Methodology Review Fee = $500.00 TIS (Small-Scale Study) Review Fee = $0.00
Prepared by: JMB T R A N S P O R T A T I O N E N G I N E E R I N G . I N C .
4 7 1 1 7 T H A V E N U E S V ^
N A P L E S , F L O R I D A 3 4 1 1 9
( 2 3 9 ) 9 1 9 - 2 7 6 7
C E R T I F I C A T E O F A U T H O R I Z A T I O N N O . 2 7 B 3 D
( P R O J E C T N o . 1 6 0 6 1 1 )
D A T E
M l

APPENDIX A
INITIAL M E E T I N G C H E C K L I S T
Suggestion: Use this Appendix as a worksheet to ensure that no important elements are overlooked. Cross out the items that do not apply.
Date.6-27-2Q16 Time: A M
Location: Collier County Government Offices (North Horseshoe Drive)
People Attending: Name, Organization, and Telephone Numbers 1) James M. Banks, JMB Transportation Engineering, Inc., 239-227-2355 2) Michael Sawyer, Collier County Government 3) 4)
Study Preparer: Preparer's Name and Title: James M . Banks. P.E.. President Organization: JMB Transportation Engineering. Inc. Address & Telephone Number: 4711 7th Avenue SW Naples. Florida 34119 (239)-227-2355
RevieweWs): Reviewer's Name & Title: Michael Sawyer, Collier County Transportation Planning Division
Applicant: Applicant's Name: Address: Telephone Number
Proposed Development; Name: Hamilton Place Location: East side of Livingston Road and approx. 1/2 mile south of Pine Ridge Road Land Use Type: Multi-Family ITE Code #: LUC 230 Proposed number of development units: 66 multi-family dwelling units Other: Description: Zoning: Existing: Vacant Comprehensive plan recommendation: Requested; Findings of the Preliminary Study: See the attached
M2

Study Type; Small-scale TIS
Study Area: Boundaries: Based upon the County's 2%, 2% & 3% impact rule. See attached Additional intersections to be analyzed: None Horizon Year(s): 2020 Analysis Time Period(s): PM Peak
Future Ofif-Site Developments: None
Source of Trip Generation Rates: ITE Trip Generation Manual. 9th Edition (See Table 1)
Reductions in Trip Generation Rates: Pass-by trips: None Internal trips (PUD): Transmit use: Other:
Horizon Year Roadway Network Improvements: 2020 per Collier County's 5-year CIE.
Methodology & Assumptions: Non-site traffic estimates: See Attached Site-trip generation: See Table 1 Trip distribution method: Based upon manual assignment (See Table 2A & Figure 2) Traffic assignment method: Based upon manual assignment (See Table 2A & Figure 2) Traffic growth rate: Per Collier County Historical & Current AUIR Reports, but not less than 2% or background or vested trips method, whichever is greater.

Special Features: (from preliminary study or prior experience) Accidents locations: Sight distance: Queuing: Access location & configuration: Traffic control: Signal system location & progression needs: On-site parking needs: Data Sources: Base maps: Prior study reports: Access policy and jurisdiction: Review process: Requirements: Miscellaneous:
Small Scale Study - No Fee _ X _
Minor Study - $750.00
Major Study - $1500.00 Includes 2 intersections
Additional Intersections - $500.00 each None
All fees win be agreed to Airing the Methodology^ meeting and must be paid to Transportation prior to our sign-off on the application.
SIGNATURES
Study Preparer
Reviewers
Applicant
SCALE: r " 100"
ZONED: BRYNWOOD PRESERVE PUD USE: RESIDENTIAL
R O P E R T Y BOUNDARY
ZONED: ARLINGTON LAKES PUD USE: RESIDENTIAL
TOTAL SITE AREA:
MAXIMUM DWELLING UNITS: MAXIMUM DENSITY
9.75±AC
66 0 67 DU/AC
NOTES
1. -miS PLAN IS CONCEPTUAL IN NATURE AND IS SUBJECT TO MINOR MODIFICATION DUE TO AGENCY PERMITTING REQUIREMENTS.
PRESERVE: REQUIRED - 0.48t ACRES (3.2± ACRES NATIVE
VEGETATION X 15%) PROVIDED-0.46* ACRES
LEGEND
GradyMinor •wurprw* mm* m i l
I14>n 2M«*0«SW
HAMILTON PUCE RPUD
EXHIBIT C MASTER PLAN
—

Pine Rid^e Rood
h - -
Longboat Drive
>er Woy Outrigger Lone
1 1
c O 5
Mercontile Avenue
Progress
3 O CD
Bottiebrush In
Livingston Woods Ln
NORTH M.TA
Pine Ridge Rood
LEGEND 6-LANE AfiTEWAL 4-LANE ARTERIAL/COLLECTOR 2-lANE ARTERIAL 2-LANE COtlECTORAOCAL RAIL ROAD
Golden Gote PorkwJ
JMB T R A N a P O R T A T m N E N G I N E E R I N Q , I N C .
Hamilton Place June 24. 2016
Project Location & Roadway Classification FIGURE 1

TABLE 1 TRIP GENERATION COMPUTATIONS
Hamilton Place
Land Use Code Land Use DescriptJon 230 Residential Condo/Townhouse
Build Schedule 66 Units
Land Use Code Trip Period
LUC 230 Daily Traffic (ADT) =
Trip Generation Equation (Based upon S.F.) Ln(T) = 0.87Ln(X)+2.46 =
Total Trips Trips Enter/Exit 448 ADT
AM Peak Hour (vph) =
PM Peak Hour (vph) =
Ln(T) = 0.80Ln(X)+0.26 = 17% Enter/83% Exit = Ln(T)=0.82Ln(X)+0.32 = 67% Enter/33% Exit =
37 vph 6 / 31 vph
43 vph 29 / 14 vph
M1

Pine Ridge Road
Bottlebrush Ln
Livingston Woods Ln
I -
NORTH H.T.S.
Pine Ridge Rood
I
20%
Longtwot
Clipper Woy Outrigger Lane_
Progress A M i u e
Golden Gote Portcwci
\ LEGEND
PROJECT TRAFRC DISTRIBUTION BY PERCENT
JMB T R A N S P O R T A T I O N E N B I N E E R I N Q , I N C .
Hamilton Place June 24, 2016
M6
PROJECT-GENERATED TRAFFIC DISTRIBUTION FIGURE 2

Project Traffic Peak Direction (vphpd)« Project Traffic Non-Peak Direction (vph)
29 Entering 14 Exiting
Road C l a s s
Livingston Road 53.0 Vanderbilt to Pine Ridge Rd 6D 54.0 Pine Ridge Rd to Site 6D 54.0 Site to Pine Ridge Rd 6D 55.0 Golden Gate Pkwy to Radio Rd 6D
Pine Ridge Road 67.1 Airport Rd to Uvingston 6D 67.2 Livingston to 1-75 6D
TABLE 2A PROJECT'S AREA OF IMPACT
L O S Service Project PK Dir. PK Direction Project Pk Hr Project
S«rv. VOL Volume Traffic PK Dir Pk Hr L O S (vDhDd) %Di8t. (VDhDd) Pk Dir
E 3100 15% 4 N E 3100 60% 17 N E 3100 40% 12 N E 3100 5% 1 N
E 3000 30% 9 E
E 3000 15% 4 E
Project Pk Hr Project
Non-PK Dir Non-Pk Impact Percent Significant (vph) DiR Standard Impact Impact
2 s 2% 0.14% NO 8 s 2% 0.56% NO 6 s 2% 0.37% NO 1 s 2% 0.05% NO
4 E 2% 0.29% NO 2 E 2% 0.15% NO

TABLE 2B 2015 & 2020 ROADWAY LINK VOLUMES
Livingston Road 54.0 Pine Ridge Rd to Site 54.0 Site to Pine Ridge Rd
Pv Vested Trips Metho Per Growth Rate Method 2020
2020 Peak Hour 2015 Growth Peak Hour PK Direction A U I R AUIR Rate PK Direction Trip Background
Traffic Pk par Background Bank Per Vested Trips (vDhpdl m A U I R fvphodi (vDhpd) (vphpdt
1440 N 0.92% 1507 36 1476 1440 N 0.92% 1507 36 1476

TABLE 2C 2020 ROADWAY LINK VOLUMBCAPACITY ANALYSIS
Livingston Road 54.0 Pine Ridge Rd to Site 54.0 Site to Pine Ridge Rd
2015 Peak Hour
PK Direction (vphpd)
1440 1440
2020 2020 2020 2020 2020 Peak Hour 2020 Peak Hour Pro|ect Project BuiM-Out Serv. Vol. BuiM-Out Buikf-Out
PK Direction Bkgd PK Direction Pk Hr Prjct Pk Hr Pfjct Peak Hour Pk Hr Peak Hour Peak Hour Background Pk Background PK Dir Pk Non-PK Dir Non-Pk PK Dir PK Dir PK Direction PK Directkm
LQS (vphpd) Qif LOS (YPhpdl Dir (vp»l) Oi£ (Yphpdl (YPhpd) v/p flano ^0S B 1507 N B 17 S 8 S 1516 3100 0.49 B B 1507 N B 12 N 6 s 1519 3100 0.49 B