Embed Size (px)
Citation preview

Alexandria, Virginia April 24, 2012
TRAFFIC FORECAST AND FARE SAVINGS FROM
HOUSTON HOBBY – LATIN AMERICA/CARIBBEAN LOW-FARE SERVICE
Prepared for:
Prepared by:

Table of Contents
Section Title Page
i
HIGHLIGHTS ........................................................................................................... 1
INTRODUCTION...................................................................................................... 2
FINDINGS AND CONCLUSIONS .......................................................................... 3
Framework of Competition ........................................................................................ 3
Forecast Results and Fare Savings ............................................................................. 7
Diversion from IAH ................................................................................................. 10
APPENDIX A: Forecast Passengers and Fare Savings in the Relevant Southwest
Latin America/Caribbean Markets
APPENDIX B: Analytical Methodology

1
HIGHLIGHTS
United’s monopoly position at IAH in most of its international and domestic
markets has caused airfares to be significantly higher than in markets where it
competes with Southwest at Hobby.
Southwest’s projected Latin America/Caribbean service will generate 2.0 million
more Houston passengers in 2020 - 1.95 million at Hobby and 50,000 at
Intercontinental. Local Houston residents and visitors will account for 1.17 million
of Hobby’s new passengers and 780,000 will be connecting at Houston to or from
other cities.
Campbell-Hill’s forecast, using conservative assumptions, of 2.0 million additional
Houston passengers due to Southwest’s new service and competition at HOU is 27%
higher than the HAS forecast of 1.57 million passengers. Campbell-Hill’s analysis
was conducted completely independent of the HAS study.
IAH will gain approximately 50,000 additional passengers in 2020 over and above
expected growth, due to the increased traffic that will be stimulated by lower
international airfares at both Houston airports.
Travelers in Houston international markets will receive approximately $255 million
per year in fare savings as a direct result of Southwest’s new service - $84 million
for Hobby passengers and $171 million for IAH passengers.
Passengers travelling to and from points outside Houston but connecting at Hobby
and IAH will obtain an additional $54 million in annual fare savings.
Lower fares inspired by Southwest will divert traffic from other U.S. connecting
gateways to both Hobby and IAH, thereby making Houston more competitive for
flow traffic to Latin America and the Caribbean.
2
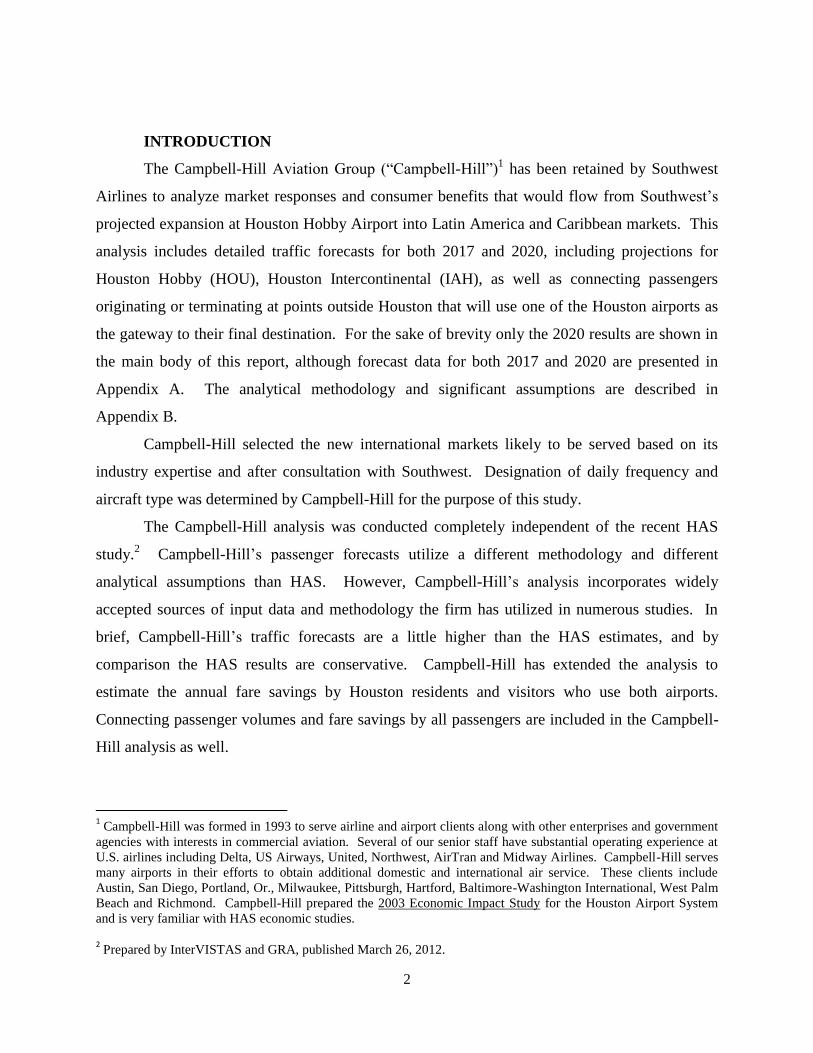
INTRODUCTION
The Campbell-Hill Aviation Group (“Campbell-Hill”)1 has been retained by Southwest
Airlines to analyze market responses and consumer benefits that would flow from Southwest’s
projected expansion at Houston Hobby Airport into Latin America and Caribbean markets. This
analysis includes detailed traffic forecasts for both 2017 and 2020, including projections for
Houston Hobby (HOU), Houston Intercontinental (IAH), as well as connecting passengers
originating or terminating at points outside Houston that will use one of the Houston airports as
the gateway to their final destination. For the sake of brevity only the 2020 results are shown in
the main body of this report, although forecast data for both 2017 and 2020 are presented in
Appendix A. The analytical methodology and significant assumptions are described in
Appendix B.
Campbell-Hill selected the new international markets likely to be served based on its
industry expertise and after consultation with Southwest. Designation of daily frequency and
aircraft type was determined by Campbell-Hill for the purpose of this study.
The Campbell-Hill analysis was conducted completely independent of the recent HAS
study.2 Campbell-Hill’s passenger forecasts utilize a different methodology and different
analytical assumptions than HAS. However, Campbell-Hill’s analysis incorporates widely
accepted sources of input data and methodology the firm has utilized in numerous studies. In
brief, Campbell-Hill’s traffic forecasts are a little higher than the HAS estimates, and by
comparison the HAS results are conservative. Campbell-Hill has extended the analysis to
estimate the annual fare savings by Houston residents and visitors who use both airports.
Connecting passenger volumes and fare savings by all passengers are included in the Campbell-
Hill analysis as well.
1 Campbell-Hill was formed in 1993 to serve airline and airport clients along with other enterprises and government
agencies with interests in commercial aviation. Several of our senior staff have substantial operating experience at
U.S. airlines including Delta, US Airways, United, Northwest, AirTran and Midway Airlines. Campbell-Hill serves
many airports in their efforts to obtain additional domestic and international air service. These clients include
Austin, San Diego, Portland, Or., Milwaukee, Pittsburgh, Hartford, Baltimore-Washington International, West Palm
Beach and Richmond. Campbell-Hill prepared the 2003 Economic Impact Study for the Houston Airport System
and is very familiar with HAS economic studies.
2 Prepared by InterVISTAS and GRA, published March 26, 2012.

3
FINDINGS AND CONCLUSIONS
Framework of Competition
United heavily dominates domestic air service at IAH. Currently it provides 90% of all
domestic flights and 88% of the seat capacity3. At Hobby, Southwest serves 34 domestic
nonstop markets in competition with United at IAH. The disciplining effect Southwest has on
United’s pricing is clear and obvious. Chart 1 shows that United’s Houston fares in markets
where it does not compete with Southwest are significantly higher than in markets where it does
compete with Southwest. The presence of Southwest in head-to-head competition with United
drives down United’s fares significantly.
Chart 1
Southwest’s Presence Reduces One-Way Domestic Fares By Over $50
In Domestic Markets with Distances Comparable to Houston-Mexico Markets
Note: Fared passengers only. Excludes all taxes and government charges.
Includes all Houston domestic markets with 600 or more one-way flights for 12 months ended September, 2011.
Source: U.S. DOT, O&D Survey and Schedule data, 12 months ended September, 2011, via Diio, LLC.
It is also important to note that United’s fares in domestic monopoly routes at IAH are
significantly higher than the fares it charges in the rest of the U.S. The fare disparity is
3 Based on June, 2012 published schedules.
$0
$20
$40
$60
$80
$100
$120
$140
$160
$180
$200
$220
$240
$260
$280
$300
0 100 200 300 400 500 600 700 800 900 1000 1100 1200 1300 1400 1500 1600 1700 1800 1900 2000
One-Way Miles
One-Way
Domestic Fare
Range of Distance for Houston-Mexico Routes
United Monopoly
Houston Routes
Houston
Markets
With Southwest
Competition
+43%
+21%

4
particularly acute for markets under 1,000 miles (Chart 2) – for example charging an average of
25% more in markets of 400 miles distance.
Chart 2
United Charges Higher Domestic Fares in Houston Monopoly
Markets Than Its Typical Fares from Other U.S. Airports
Note: Fared passengers only. Excludes all taxes and government charges.
Includes all Houston domestic markets with 600 or more one-way flights for 12 months ended September, 2011.
Source: U.S. DOT, O&D Survey and Schedule data, 12 months ended September, 2011, via Diio, LLC.
United serves 54 Houston – Latin America/Caribbean markets and 51 of them are United
monopolies (Chart 3). United’s average fares in these markets are typically very high, given the
lack of any nonstop competition by either US or foreign airlines.
One-Way Miles
United Houston
Monopoly Routes
United Other
Continental U.S.
Routes
(Excludes IAH)
One-Way
Domestic Fare
$0
$20
$40
$60
$80
$100
$120
$140
$160
$180
$200
$220
$240
$260
$280
$300
0 100 200 300 400 500 600 700 800 900 1000 1100 1200 1300 1400 1500 1600 1700 1800 1900 2000
+25%
+10%

5
Chart 3
51 of 54 Latin America and Caribbean Markets
Served by United from Houston Are Monopolies
Source: OAG Schedule Data, June 2012, via Diio, LLC.
Southwest plans to begin service from Houston Hobby to Latin America/Caribbean
destinations in 2015. Campbell-Hill understands that to support this expansion at Hobby
Southwest will make its own investment in the required infrastructure (gates and related
facilities). The Southwest pattern of service will build toward a developed profile by 2020 at
which time it is expected that Southwest will serve approximately 22 nonstop markets with 25
round trips per day (Chart 4).
United Monopoly Market
United Market with Nonstop Competition To EZETo EZETo EZETo EZETo EZETo EZETo EZETo EZETo EZE
AUAAUAAUAAUAAUAAUAAUAAUAAUA
CUNCUNCUNCUNCUNCUNCUNCUNCUN
MEXMEXMEXMEXMEXMEXMEXMEXMEX
PBCPBCPBCPBCPBCPBCPBCPBCPBCTLCTLCTLCTLCTLCTLCTLCTLCTLC
ZIHZIHZIHZIHZIHZIHZIHZIHZIH
MLMMLMMLMMLMMLMMLMMLMMLMMLM
AGUAGUAGUAGUAGUAGUAGUAGUAGU
GDLGDLGDLGDLGDLGDLGDLGDLGDLPVRPVRPVRPVRPVRPVRPVRPVRPVR
SLWSLWSLWSLWSLWSLWSLWSLWSLW
MZTMZTMZTMZTMZTMZTMZTMZTMZT
TRCTRCTRCTRCTRCTRCTRCTRCTRC
SJDSJDSJDSJDSJDSJDSJDSJDSJD
CUUCUUCUUCUUCUUCUUCUUCUUCUU
IAHIAHIAHIAHIAHIAHIAHIAHIAH
To GIGTo GIGTo GIGTo GIGTo GIGTo GIGTo GIGTo GIGTo GIG
To GRUTo GRUTo GRUTo GRUTo GRUTo GRUTo GRUTo GRUTo GRU
To LIMTo LIMTo LIMTo LIMTo LIMTo LIMTo LIMTo LIMTo LIM
MTYMTYMTYMTYMTYMTYMTYMTYMTY
BJXBJXBJXBJXBJXBJXBJXBJXBJX
SJOSJOSJOSJOSJOSJOSJOSJOSJO
SALSALSALSALSALSALSALSALSALGUAGUAGUAGUAGUAGUAGUAGUAGUA
QROQROQROQROQROQROQROQROQRO
LIRLIRLIRLIRLIRLIRLIRLIRLIR
BZEBZEBZEBZEBZEBZEBZEBZEBZE
MGAMGAMGAMGAMGAMGAMGAMGAMGA
BOGBOGBOGBOGBOGBOGBOGBOGBOG
PTYPTYPTYPTYPTYPTYPTYPTYPTY
SAPSAPSAPSAPSAPSAPSAPSAPSAP
SLPSLPSLPSLPSLPSLPSLPSLPSLP
VERVERVERVERVERVERVERVERVER
CZMCZMCZMCZMCZMCZMCZMCZMCZM
TAMTAMTAMTAMTAMTAMTAMTAMTAM
VSAVSAVSAVSAVSAVSAVSAVSAVSASJUSJUSJUSJUSJUSJUSJUSJUSJU
TGUTGUTGUTGUTGUTGUTGUTGUTGU
MBJMBJMBJMBJMBJMBJMBJMBJMBJ
CCSCCSCCSCCSCCSCCSCCSCCSCCS
CMECMECMECMECMECMECMECMECMEGCMGCMGCMGCMGCMGCMGCMGCMGCM
MIDMIDMIDMIDMIDMIDMIDMIDMID
NASNASNASNASNASNASNASNASNAS
OAXOAXOAXOAXOAXOAXOAXOAXOAX
POSPOSPOSPOSPOSPOSPOSPOSPOS
UIOUIOUIOUIOUIOUIOUIOUIOUIO
RTBRTBRTBRTBRTBRTBRTBRTBRTBACAACAACAACAACAACAACAACAACA
DGODGODGODGODGODGODGODGODGO
BONBONBONBONBONBONBONBONBON
TGZTGZTGZTGZTGZTGZTGZTGZTGZHUXHUXHUXHUXHUXHUXHUXHUXHUX
ZLOZLOZLOZLOZLOZLOZLOZLOZLO

6
Chart 4
Projected Southwest Airlines New Hobby –
Latin America/Caribbean Markets
1/ 19 peak day departures.
2/ 25 peak day departures.
Southwest’s low-fare high-quality service will cause United’s and other competitors’
fares to decline significantly, thereby stimulating new passenger travel to/from Houston. It will
also divert connecting passengers (e.g. Kansas City-Cancun) to Houston from other U.S.
gateways like Dallas, Los Angeles and Miami.
The fundamental issue to be decided by the City of Houston is whether or not it wants to
allow competition to United’s international service. To help enlighten this issue Campbell-Hill
(1) forecast traffic at both Houston airports in all the relevant Southwest Latin
America/Caribbean markets,4 (2) derived the impacts on IAH and, (3) estimated the annual fare
savings for passengers at both airports.
4 All traffic forecasts were prepared by Campbell-Hill at the individual city-pair level and then aggregated for
purposes of this written report.
HOUHOUHOUHOUHOUHOUHOUHOUHOUCRPCRPCRPCRPCRPCRPCRPCRPCRP
PTYPTYPTYPTYPTYPTYPTYPTYPTY
TPATPATPATPATPATPATPATPATPAMCOMCOMCOMCOMCOMCOMCOMCOMCO
FLLFLLFLLFLLFLLFLLFLLFLLFLL
BHMBHMBHMBHMBHMBHMBHMBHMBHM
BNABNABNABNABNABNABNABNABNA
SATSATSATSATSATSATSATSATSATAUSAUSAUSAUSAUSAUSAUSAUSAUS
VERVERVERVERVERVERVERVERVERMEXMEXMEXMEXMEXMEXMEXMEXMEX GCMGCMGCMGCMGCMGCMGCMGCMGCM
BWIBWIBWIBWIBWIBWIBWIBWIBWI
EWREWREWREWREWREWREWREWREWR
HRLHRLHRLHRLHRLHRLHRLHRLHRLMTYMTYMTYMTYMTYMTYMTYMTYMTY
CZMCZMCZMCZMCZMCZMCZMCZMCZM
DALDALDALDALDALDALDALDALDAL
SEASEASEASEASEASEASEASEASEA
SANSANSANSANSANSANSANSANSANLAXLAXLAXLAXLAXLAXLAXLAXLAX
OAKOAKOAKOAKOAKOAKOAKOAKOAKLASLASLASLASLASLASLASLASLAS
PHXPHXPHXPHXPHXPHXPHXPHXPHX
STLSTLSTLSTLSTLSTLSTLSTLSTLMCIMCIMCIMCIMCIMCIMCIMCIMCI
TULTULTULTULTULTULTULTULTUL
OKCOKCOKCOKCOKCOKCOKCOKCOKC
DENDENDENDENDENDENDENDENDEN
ABQABQABQABQABQABQABQABQABQ
MAFMAFMAFMAFMAFMAFMAFMAFMAFELPELPELPELPELPELPELPELPELP
LIRLIRLIRLIRLIRLIRLIRLIRLIR
SALSALSALSALSALSALSALSALSAL
GUAGUAGUAGUAGUAGUAGUAGUAGUA
GDLGDLGDLGDLGDLGDLGDLGDLGDL
PVRPVRPVRPVRPVRPVRPVRPVRPVR
SJDSJDSJDSJDSJDSJDSJDSJDSJD
MBJMBJMBJMBJMBJMBJMBJMBJMBJ
SJOSJOSJOSJOSJOSJOSJOSJOSJO
CUNCUNCUNCUNCUNCUNCUNCUNCUN
SAPSAPSAPSAPSAPSAPSAPSAPSAP
LIMLIMLIMLIMLIMLIMLIMLIMLIM
BOGBOGBOGBOGBOGBOGBOGBOGBOG
NASNASNASNASNASNASNASNASNAS
BJXBJXBJXBJXBJXBJXBJXBJXBJX
BZEBZEBZEBZEBZEBZEBZEBZEBZE
MGAMGAMGAMGAMGAMGAMGAMGAMGA
SJUSJUSJUSJUSJUSJUSJUSJUSJU
ATLATLATLATLATLATLATLATLATLCHSCHSCHSCHSCHSCHSCHSCHSCHS
ECPECPECPECPECPECPECPECPECP
GSPGSPGSPGSPGSPGSPGSPGSPGSP
JANJANJANJANJANJANJANJANJAN
JAXJAXJAXJAXJAXJAXJAXJAXJAX
LITLITLITLITLITLITLITLITLIT
MDWMDWMDWMDWMDWMDWMDWMDWMDW
MSYMSYMSYMSYMSYMSYMSYMSYMSY
PHLPHLPHLPHLPHLPHLPHLPHLPHL
RDURDURDURDURDURDURDURDURDU
Current Domestic Routes
New Latin America/Caribbean Routes
New SJU Domestic Route
Montego Bay (MBJ)
San Jose (SJO)
Cancun (CUN)
Mexico City (MEX)
Monterrey (MTY)
Guadalajara (GDL)
San Jose Del Cabo (SJD)
Liberia (LIR)
San Salvador (SAL)
Panama City (PTY)
Cozumel (CZM)
Puerto Vallarta (PVR)
Guatemala (GUA)
San Pedro Sula (SAP)
Lima (LIM)
Bogota (BOG)
Nassau (NAS)
Grand Cayman (GCM)
Leon-Guanajuato (BJX)
Veracruz (VER)
Belize City (BZE)
Managua (MGA)
Total
1
1
2
2
2
1
1
1
1
1
0.4
0.6
1
1
1
1
0
0
0
0
0
0
18
1
1
2
2
2
1
1
1
1
1
0.6
0.6
1
1
1
1
1
1
0.7
1
1
1
24
New HOU Market 2017 2020
Projected
Weekly Roundtrip
Frequencies
1/ 2/

7
Forecast Results and Fare Savings
For the year 2020 (full schedule development) Southwest’s international service at
Hobby will generate 1.4 million additional local passengers5 in the 22 new Southwest markets.
HOU will handle 1.2 million and IAH will experience a net increase in local traffic of 0.2 million
passengers. This incremental traffic is over and above the volume of passengers that Houston
could expect with normal growth, and without Southwest in the markets (Chart 5).
Chart 5
Increased Local Houston Passenger Traffic and Fare Savings in 2020
Due to Southwest’s HOU – Latin America/Caribbean Service
Southwest’s low fares6 will cause United and other IAH carriers to reduce their fares in
response. For purposes of this analysis, Campbell-Hill has conservatively assumed that
5 Houston residents plus visitors to Houston from one of the Latin America/Caribbean cities to be served by
Southwest. Visitors spend time in Houston and then return home. They are not passengers who merely “connect” at
a Houston airport.
6 Campbell-Hill estimated Southwest fares by constructing Southwest’s HOU fare curve and adding an assumed $15
per passenger to account for higher expected costs in these international markets.
0.0
0.2
0.4
0.6
0.8
1.0
1.2
1.4
1.6
Annual One-Way
Local Passengers
(millions)
INCREASE in Local Resident and Visitor Travel
Annual Fare Savings by
ALL Local Residents and Visitors to Houston(In Constant 2011 Dollars)
$0
$50
$100
$150
$200
$250
$300
Annual Fare Savings
(millions)
$255 million
Increase in local passengers using IAH
Increase in local passengers using HOU
1.4 million
Savings to all local passengers using IAH
Savings to all local passengers using HOU
$84 million
$171 million
1.2 million
0.2 million

8
competitors will not reduce all their fares to Southwest’s level, but only partially match
Southwest.7 Under that assumption Campbell-Hill estimates that local Houston passengers using
IAH in 2020 will save $171 million and those using HOU will save $84 million. The total
savings for all Houston passengers will be $255 million (Chart 5).8
In addition to generating more local passengers at Houston’s airports,
Southwest’s international service will produce over 600,000 net additional connecting
passengers at the two airports.9 Consequently, the total increase in 2020 passengers at the
Houston airports will be 2.0 million – 1.95 million at Hobby and 50,000 at IAH (Chart 6).
Chart 6
The Houston Airports Will Gain 2.0 Million Additional Passengers in
2020 as a Result of Southwest’s Latin America/Caribbean Service
7 Campbell-Hill determined the relationship between Houston domestic fares where other carriers compete with
Southwest, and the fares in markets where they do not compete with Southwest. This relationship allows Campbell-
Hill to construct the “market” fare after Southwest’s entry in the relevant new markets.
8 All dollar amounts for future fare savings are expressed in 2011 constant dollars throughout this study.
9 781,000 additional connecting passengers at HOU, less 164,000 shifted from IAH.
-0.5
0.0
0.5
1.0
1.5
2.0
2.5
One-Way Passengers
(Millions)
Local passengers (residents plus visitors to Houston)
Connecting passengers
2.00 Million1.95 Million
0.05 Million
IAHHOU HOU + IAH
0.78 Million
1.17 Million
0.21 Million
-0.16 Million
0.62 Million
1.38 Million

9
Southwest’s service and fares will also make Houston more competitive with other U.S.
gateways to Latin America and the Caribbean. Because of Southwest’s new service and the fare
reductions it will spawn, Campbell-Hill forecasts that Hobby will gain approximately 781,000
new connecting passengers traveling to and from other cities (Chart 7).
Chart 7
Southwest’s New Service Will Make Houston More Competitive With Other U.S. Gateways
and Generate Nearly 800,000 Connecting Passengers at Hobby by 2020
1/ 12 months ended September 2011
0.3 million
0
0.3 million
0.2 million
0.0
0.1
0.2
0.3
0.4
0.5
0.6
0.7
0.8
0.9
1.0
Base Year 2020
Annual One-Way
Connecting Passengers
(millions)
Connecting traffic stimulation within the Southwest system
Passengers shifting from a non-Houston connecting gateway (e.g. DFW, LAX, MIA) to HOU
Passengers shifting from IAH to HOU, net of passengers shifting from other U.S. gateways to IAH
0.8 million
1/

10
In addition, connecting passengers using the Houston airports will obtain $54 million in
fare savings in 2020 (Chart 8).
Chart 8
Fare Savings by All Passengers Using the Houston Airports Will
Exceed $300 Million From the Projected Southwest Latin America/Caribbean Service
(In Constant 2011 Dollars)
1/ It is conservatively assumed that other airlines do not reduce their fares in connecting markets in response to Southwest. Consequently, we do not forecast fare savings for passengers connecting at IAH.
Diversion From IAH
In the base year10
IAH handled 2.4 million passengers to/from the 22 Latin
America/Caribbean cities that Southwest is expected to serve. Campbell-Hill projects this
volume of traffic to increase to 4.8 million passengers in 2020 under status quo conditions,
without new service by Southwest. However, Southwest’s new service and lower fares will
cause competing carriers to reduce their fares, and both HOU and IAH will experience an
increase in passengers as a result. The vast majority of the new passengers will use Hobby, but
10
12 months ended September, 2011.
$0
$50
$100
$150
$200
$250
$300
$350
Annual Fare Savings
(millions)Fare Savings for
Hobby Passengers - 2020
Fare Savings for
Intercontinental Passengers - 2020
$138 million
Fare Savings for
Total Houston Passengers - 2020
$171 million
$309 million
Savings to connecting passengers
Savings to local Houston passengers Savings to local Houston passengers
Savings to connecting passengers
Savings to local Houston passengers
$54 million
$84 million
$54 million
$255 million
1/
11
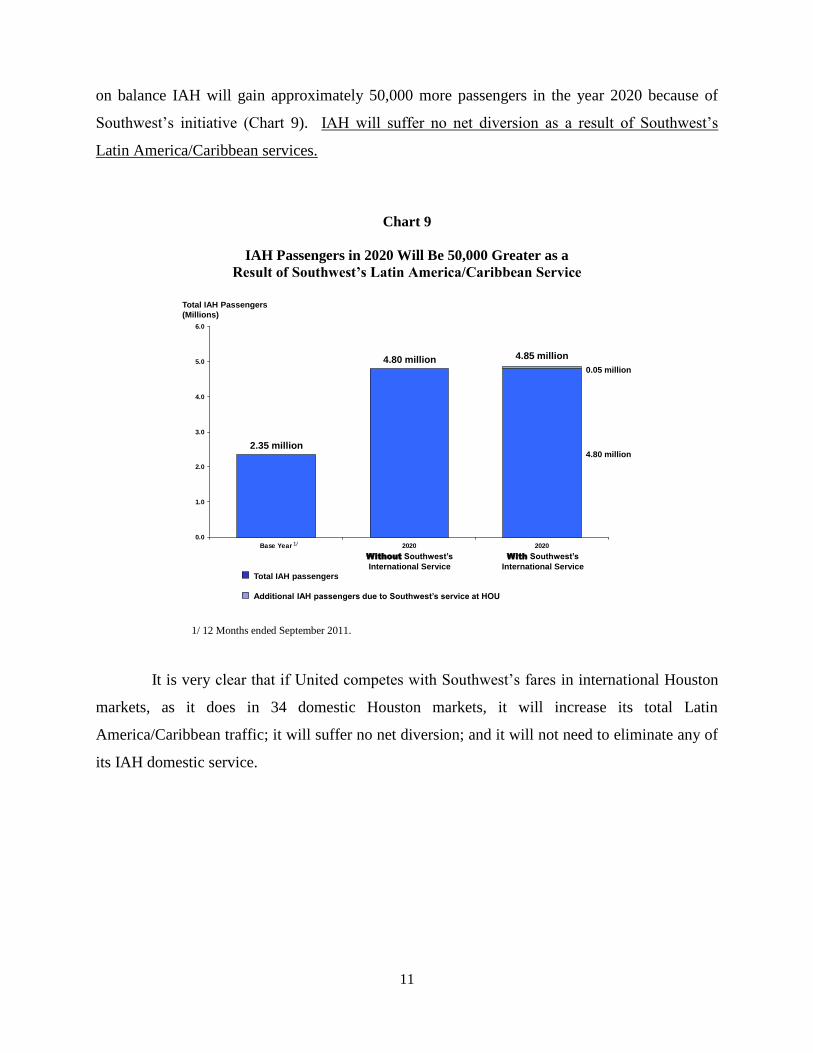
on balance IAH will gain approximately 50,000 more passengers in the year 2020 because of
Southwest’s initiative (Chart 9). IAH will suffer no net diversion as a result of Southwest’s
Latin America/Caribbean services.
Chart 9
IAH Passengers in 2020 Will Be 50,000 Greater as a
Result of Southwest’s Latin America/Caribbean Service
1/ 12 Months ended September 2011.
It is very clear that if United competes with Southwest’s fares in international Houston
markets, as it does in 34 domestic Houston markets, it will increase its total Latin
America/Caribbean traffic; it will suffer no net diversion; and it will not need to eliminate any of
its IAH domestic service.
0.0
1.0
2.0
3.0
4.0
5.0
6.0
Base Year 2020 2020
Total IAH Passengers
(Millions)
Total IAH passengers
Additional IAH passengers due to Southwest’s service at HOU
4.85 million
2.35 million
4.80 million
1/
Without Southwest’s
International Service
With Southwest’s
International Service
0.05 million
4.80 million

Appendix A
Forecast Passengers and Fare Savings In the Relevant
Southwest Latin America/Caribbean Markets
HOU
IAH
Total Houston
Base
Year1
2017
2020
Base
Year1
2017
2020
Base
Year1
2017
2020
1. Total Passengers
Local
0
902,862
1,168,588
1,166,403
1,893,580
2,591,930
1,166,403
2,796,442
3,760,518
Connecting
0
597,805
780,999
1,186,207
1,772,958
2,256,973
1,186,207
2,370,763
3,037,972
Total
0
1,500,667
1,949,587
2,352,610
3,666,538
4,848,903
2,352,610
5,167,205
6,798,490
2. Fare Savings (Millions of Constant 2011 Dollars)
Local Current and Growth Passengers $34
$51
$82
$118
$116
$169
Newly Generated Passengers
$24
$33
$35
$53
$59
$86
Total Local
$58
$84
$117
$171
$175
$255
Connecting Current and Growth Passengers $28
$38
$0
$0
$28
$38
Newly Generated Passengers
$12
$16
$0
$0
$12
$16
Total Connecting
$40
$54
$0
$0
$40
$54
Total Current and Growth Passengers $62
$89
$82
$118
$144
$207
Newly Generated Passengers
$36
$49
$35
$53
$71
$102
Total
$98
$138
$117
$171
$215
$309
3. HOU Connecting Passenger Sources
Passengers within Southwest's System
215,462
291,301
Passengers Shifting
from Non-Houston Gateways
257,701
325,674
Passengers Shifting from IAH to HOU
124,642
164,024
597,805
780,999
4. IAH Stimulation, Growth and Diversion
2017
2020
Local Growth
699,115
1,211,301 Stimulation
28,062
214,226
Total
727,177
1,425,527
Connecting Without Southwest
711,393
1,234,790 Less: Diversion to Southwest
124,642
164,024
Total
586,751
1,070,766
Total
1,313,928
2,496,293
1/ 12 Months ended September 2011.

Appendix B
Page 1 of 5
Analytical Methodology
The traffic forecasts and fare savings estimates associated with Southwest’s projected
new international services at Hobby are based on publicly available government statistics and
standard forecasting techniques for aviation analysis. The Campbell-Hill forecasting model
combines current year passenger and fare data, historical traffic growth trends, and projected fare
changes derived from patterns in domestic Houston markets with competitive Southwest
services. The following sections describe the methodology and significant assumptions.
1. Selection of New International Markets
Campbell-Hill selected 22 Latin American and Caribbean markets as most likely for
Southwest entry based on the Firm’s knowledge of the airline industry as well as discussion with
Southwest Airlines. Campbell-Hill assumed that Southwest’s service in most of the markets
would be one roundtrip per day. Exceptions are CUN, MEX, and MTY with two roundtrips per
day, and CZM, PVR, and BJX with less than daily service.11
Campbell-Hill assumed that
Southwest would utilize the 175-seat B737-800 for both daily services in the HOU-CUN and
HOU-MEX markets. All other schedules were assumed to use the 137-seat B737-700.
2. Local Market Traffic Forecasts
2a. Base Year12
Local Houston Traffic and Fares
The number of passengers13
traveling between Houston (IAH and HOU combined) and
the 22 Latin America/Caribbean markets14
was determined by aggregating the most recent U.S.
Department of Transportation O&D Survey data (YE 2011 Q315
) with U.S. DOT T-100 data to
arrive at total market sizes including both U.S. and foreign flag carriers.
Forecast traffic for CY 2017 and CY 2020 was based on CY 2003 to YE 2011 Q3
compound annual growth rates (CAGR) for each of the 22 markets. The annual growth rate was
11
The markets selected for less than daily departures were those with low projected overall load factors after an
initial model run using one daily departure. 12
12 months ending September, 2011. 13
For purposes of this study, Campbell-Hill has excluded wherever possible frequent flier redemptions and pass
riders in order to reflect only revenue passengers. 14
TLC was combined with MEX as part of the Mexico City market. 15
Unless otherwise specified, “current,” or “base year” market statistics are based on the 12 months ending
September 30, 2011. The passenger data used in this report has been compiled by Diio, LLC in its Diio Mi product.

Appendix B
Page 2 of 5
constrained to 10% per year for large markets and 20% per year for small markets (those without
nonstop service in 2003). On average, the constrained historical growth rate used to prepare the
forecast was approximately 9% per year.
Current average fare levels were estimated from the DOT O&D Survey data for U.S.-flag
passengers16
. It was assumed for purposes of the forecast that the average fares of foreign flag
carriers were the same as those for U.S. carriers.
2b. Service Stimulation for Local Traffic
The addition of new non-stop service in the 22 markets will stimulate new local traffic
quite apart from fare changes. The new service levels (with Southwest flights) were compared to
existing service levels using a standard DOT “quality of service index” (QSI) formula:
Stimulation = ((With WN QSI/Current QSI)/(0.3741 + 0.5561(With WN QSI/Current QSI)))/1.075
The service stimulation model was applied to the forecast Houston local traffic. On
average, traffic was stimulated from 8% to 27%, depending on the individual market. The
average service stimulation was 13%.
2c. Price Stimulation and Forecast Fare Savings
The introduction of lower Southwest fares into these international markets will influence
other carriers’ fare decisions, cause a reduction in overall fares, and stimulate new passenger
traffic. The projected average market fare for each of the 22 new local markets, giving effect to
Southwest’s lower fares, was based on a yield curve derived for UA/CO non-stop domestic
Houston routes with significant Southwest competition.17
The fare amount was derived from the
yield curve which relates yield to nonstop distance. Campbell-Hill added $15 to each one-way
fare to account for potential higher costs in foreign countries in which Southwest would initially
have a small operational footprint.
16
The fares examined for this study have been adjusted by Diio, LLC to exclude government taxes and fees. U.S.
DOT does not permit the disclosure of international fares on a market-level. 17
Competitive markets were defined as UA/CO non-stop markets in which Southwest also had over 300 roundtrip
departures for YE 2011 Q3 at Hobby.

Appendix B
Page 3 of 5
The Campbell-Hill analysis estimates that the entry of Southwest will reduce the average
one-way Houston fare to the combined 22 international markets from $273 to $202 – an average
decline of 26%. The calculation of fare stimulation, as a result of lower fares, assumed an
elasticity of -1.218
, constraining the fare-stimulated traffic growth to a maximum of 150% for any
market.19
Fare stimulation averaged 58% for the combined Houston markets.
The distribution of traffic impacts between HOU and IAH was based on assumptions for
Southwest traffic levels and the expected response of competing carriers. Southwest’s traffic
levels were initially assumed using an 80% load factor, with 60.9% of the onboard traffic
expected to be local passengers (based on Southwest’s current mix at HOU). Southwest’s local
traffic for each market was capped at a maximum of 67% of the total market after stimulation
(with residual traffic remaining at IAH).
Fare savings were calculated using the FAA’s “consumer benefit” methodology. Fare
savings for projected existing passengers (i.e., passengers that would travel even without the new
Southwest service) are calculated based on the difference between the current fare and the
projected market fare with Southwest service. Fare savings for new or stimulated traffic were
calculated using half of the fare differences, consistent with FAA’s methodology.20
3. Connecting Market Forecasts
3a. Baseline Flow Traffic and Fares
An initial set of connecting markets included all airports21
served non-stop by Southwest
to/from HOU, combined with each of the 22 markets. Circuitous markets for which Houston
airports account for less than 1% of all current traffic were eliminated from this initial list. The
flow traffic available for diversion to HOU was limited to connecting passengers which totaled
18
This is the composite elasticity for business and leisure travel recommended by the FAA. See “FAA Airport
Benefit-Cost Analysis Guidance”, Office of Aviation Policy and Planning, Federal Aviation Administration,
December 15, 1999. 19
Fare simulation was calculated using the arc elasticity formula:
Ep (-1.2) = [(Q2-Q1)/((Q1+Q2)/2)] / [(P2-P1)/((P1+P2)/2)] ,
where Q1 = passengers before WN service, Q2 = Passengers after WN service,
P1=Fare Before WN service, P2 = Fare After WN service 20
The FAA’s “consumer surplus” methodology assumes all existing passengers would benefit by the full amount of
average fare savings, while stimulated passengers would benefit in a range between 0% and 100% of the net change
in fares, or an average of 50%. See, “FAA Airport Benefit-Cost Analysis Guidance”, Office of Aviation Policy and
Planning, Federal Aviation Administration, December 15, 1999. 21
Markets were limited to the Southwest airport markets and excluded traffic via other airports in multi-airport
metropolitan areas (e.g., ORD in Chicago).

Appendix B
Page 4 of 5
3.7 million in the base period. This includes 1.2 million passengers currently connecting at
IAH.22
Average fares for the connecting passengers in each market were used as the baseline
market fares.
Forecast traffic for CY 2017 and CY 2020 was based on the CY 2003 to YE 2011 Q3
compound annual growth rates for each of the connecting markets, assuming a maximum annual
growth rate of 20% per year. Growth averaged 9% per year for all of the markets combined.
While new connecting options via HOU would have some traffic impacts, no service stimulation
was incorporated for flow traffic.
3b. Price Stimulation and Forecast Fare Savings
Campbell-Hill’s predicted one-way fares for the new Southwest services were based on
the current yield curve for Southwest’s domestic connecting markets, plus $15 to allow for
potentially higher foreign operating costs. The predicted one-way average fare for connecting
traffic available for diversion to HOU is $203, which is 27% less than the current $277 average
fare for the same passengers. Campbell-Hill conservatively assumed that other carriers would not
reduce their connecting fare levels in response to Southwest.
After fare stimulation is applied, (using the price elasticity coefficient of -1.2), the
growth in connecting market traffic over HOU was 291,000 new passengers.
Southwest’s total flow traffic for each market combines all of the stimulated traffic
(which is assumed to move via the new Southwest flights) with traffic diverted from current
gateways. Any diversion traffic was subtracted from the IAH flow traffic in proportion to IAH’s
current share of flow traffic for each market (164,000 passengers were diverted from IAH).
However, as explained in our report, IAH will not suffer a net diversion of traffic because
stimulation from low fare service from Southwest will outweigh the diversion of connecting
passengers. In fact, on balance IAH will have 50,000 more passengers in the year 2020 because
of Southwest’s effect of lowering Houston fares.
Fare savings for projected existing passengers are calculated based on the difference
between the current average fare and the projected Southwest fare, as applied to all of
22
Nonstop traffic (including foreign flag) was assumed to be unaffected by the new Southwest service and was
excluded from the (1) traffic levels available for diversion, and (2) average fare calculations.

Appendix B
Page 5 of 5
Southwest’s diversion traffic. Fare savings for all new or stimulated traffic via both Houston
airports was calculated using half of the derived fare differences, as explained earlier.